Embed Size (px)
Citation preview
MANAGEMENT’S DISCUSSION AND ANALYSIS
For the year ended December 31, 2006 Dated: February 28, 2007
The following review and analysis of Torstar Corporation’s (“Torstar”) operations and financial position is supplementary to, and should be read in conjunction with the audited consolidated financial statements of Torstar Corporation for the year ended December 31, 2006. Torstar reports its financial results under Canadian generally accepted accounting principles (“GAAP”) in Canadian dollars. Per share amounts are calculated using the weighted average number of shares outstanding for the applicable period. Non-GAAP Measures Management uses both operating profit, as presented in the consolidated statements of income, and EBITDA as measures to assess the performance of the reporting units and business segments. EBITDA is a measure that is also used by many of Torstar’s shareholders, creditors, other stakeholders and analysts as a proxy for the amount of cash generated by the reporting unit or segment. EBITDA is not the actual cash provided by operating activities and is not a recognized measure of financial performance under GAAP. Torstar calculates EBITDA as the reporting unit or segment’s operating profit before restructuring provisions, interest, gains on sale of properties, taxes, depreciation and amortization of intangible assets. Torstar’s method of calculating EBITDA may differ from other companies and accordingly, may not be comparable to measures used by other companies. Forward-looking statements Certain statements in this report may constitute forward-looking statements that reflect management’s expectations regarding the Company’s future growth, results of operations, performance and business prospects and opportunities as of the date of this report. Generally, these forward-looking statements can be identified by the use of forward-looking terminology such as “anticipate”, “believe”, “plan”, “forecast”, “expect”, “intend”, “would”, “could”, “if”, “may” and similar expressions. All such statements are made pursuant to the “safe harbour” provisions of applicable Canadian securities legislation. These statements reflect current expectations of management regarding future events and operating performance, and speak only as of the date of this report. The Company does not intend, and disclaims any obligation to, update any forward-looking statements whether as a result of new information or otherwise. By their very nature, forward-looking statements require management to make assumptions and are subject to inherent risks and uncertainties. There is a significant risk that predictions, forecasts, conclusions or projections will not prove to be accurate, that management’s assumptions may not be accurate and that actual results, performance or achievements may differ significantly from such predictions, forecasts, conclusions or projections expressed or implied by such forward-looking statements. We caution readers to not place undue reliance on the forward-looking statements in this MD&A as a number of factors could cause actual future results, conditions, actions or events to differ materially from the targets, outlooks, expectations, goals, estimates or intentions expressed in the forward-looking statements. These factors include, but are not limited to: general economic conditions in the principal markets in which the Company operates, the Company’s ability to operate in highly competitive industries, the Company’s ability to compete with other forms of media, the Company’s ability to attract advertisers, cyclical and seasonal variations in the Company’s revenues, newsprint costs, labour disruptions, foreign exchange fluctuations, restrictions imposed on existing credit facilities, litigation, and uncertainties associated with critical accounting estimates.
1
We caution that the foregoing list is not exhaustive of all possible factors, as other factors could adversely affect our results. For more information, please see the discussion starting on page 5 concerning the effect certain risk factors could have on actual results, as well as the discussion in the Company’s current Annual Information Form, which is incorporated herein by reference. In addition, a number of assumptions, including those assumptions specifically identified throughout this MD&A, were applied in making the forward-looking statements set forth in this MD&A, some or all of which may prove to be incorrect. OVERVIEW Torstar Corporation is a broadly based media company listed on the Toronto Stock Exchange (TS.B). Torstar reports its operations in two segments: Newspapers and Digital; and Book Publishing. Its Newspapers and Digital Segment includes the Star Media Group led by the Toronto Star, Canada’s largest daily newspaper and digital properties including thestar.com, toronto.com, LiveDeal.ca, Workopolis, and Olive Canada Network; and Metroland Media Group, publishers of community and daily newspapers in Ontario. Its Book Publishing Segment represents Harlequin Enterprises, a leading global publisher of women’s fiction. Torstar also has investments in CTVglobemedia Inc. (“CTVgm”) and Black Press Limited which are accounted for as Associated Businesses, using the equity method. In 2006, Torstar had revenues of $1.5 billion and net income of $79.1 million. NEWSPAPERS AND DIGITAL SEGMENT The Newspapers and Digital Segment includes the Star Media Group; Metroland Media Group (“Metroland”); and Transit Television Network (“Transit TV”). The Star Media Group and Metroland Media Group reporting units have been aggregated into one segment due to their similar economic factors, geography, customers, distribution channels and the level of interaction between the reporting units. Transit TV has been included in the Newspapers and Digital Segment as it, like the other businesses in this segment, is a platform providing news content and generates advertising revenue. However, this reporting unit is small relative to the other reporting units in the segment. Each of the reporting units is discussed separately in the MD&A in order to provide more specific information about their operations. During the fall of 2006 and early 2007, Torstar announced restructurings of its newspaper and digital operations. These restructurings resulted in the realignment of Torstar’s various newspaper and digital businesses into the Star Media Group and Metroland Media Group reporting units. The financial results presented in this report have been restated to reflect this change in the reporting units. Star Media Group includes the Toronto Star, with the largest circulation and readership of any daily newspaper in Canada; Torstar’s interests in Sing Tao Daily and the Toronto, Ottawa and Vancouver editions of Metro; thestar.com; Toronto.com; LiveDeal.ca; and Torstar Media Group Television (“TMG TV”).
2
Recognizing the level of interaction between the Star Media Group digital businesses and Torstar Digital, including common systems and strategic planning, Star Media Group also includes the Torstar Digital corporate group, Workopolis and Olive Canada Network. Torstar owns 100% of Toronto.com, a local search site offering business, event and entertainment listings and information. LiveDeal.ca is a web classified site with a broad selection of free listings that is ideal for trading hard-to-ship items such as automobiles, furniture, appliances, real estate and other "try before you buy" items. Torstar owns 40% of LiveDeal.ca in partnership with Gesca Ltd. and LiveDeal, Inc. Torstar owns 50% of Workopolis, Canada’s leading provider of Internet recruitment and job search solutions, in partnership with Gesca Ltd. Olive Canada Network is a premium content network that reaches over 13 million unique Canadian visitors monthly on its network of top-tier sites including CNET.com, ArtistDirect.com, thestar.com, LiveDeal.ca, toronto.com, cyberpresse.ca and tetesaclaques.tv. Torstar owns 75%1 of Olive Canada Network in partnership with Gesca Ltd. The Toronto Star’s Vaughan Press Centre primarily supports the Toronto Star’s printing needs but is also engaged in commercial printing, including printing the National Post. TMG TV is a 24-hour direct response television business operating the SHOP TV Canada channel and TMG TV Productions. Metroland Media Group (the combination of the former Metroland and CityMedia Group Inc.) publishes in print and on-line more than 100 community newspapers and three daily newspapers – The Hamilton Spectator, The Record (Kitchener, Cambridge and Waterloo) and the Guelph Mercury. It is also the publisher of Goldbook Directories, a number of specialty publications, and operates several consumer shows throughout Ontario through its Premier Consumer Shows division. Metroland Media Group has nine web press facilities which print the Metroland newspapers but also engage in commercial printing. Transit TV is a U.S. based operation that delivers full motion, broadcast-quality information and entertainment to passengers on buses, rail and other modes of mass transit on screens mounted in the vehicle. Torstar is currently reviewing its strategic options for Transit TV. BOOK PUBLISHING SEGMENT The Book Publishing Segment reports the results of Harlequin Enterprises Limited, a leading global publisher of women’s fiction. Harlequin publishes women’s fiction around the world, selling books through the retail channel and directly to the consumer by mail and the Internet. Harlequin’s women’s fiction publishing operations are comprised of three divisions: North America Retail, North America Direct-To-Consumer and Overseas. In 2006 Harlequin published
1 Effective January 1, 2007.
3
books in 26 languages in 109 international markets. Harlequin reported a total of 131 million books sold in 2006, consistent with 2005. Harlequin sells books under several imprints including Harlequin, Silhouette, MIRA, Red Dress Ink, Steeple Hill, LUNA, HQN and Kimani Press. Different genres of women’s fiction are published under the various imprints. Harlequin publishes books in both series and single title formats. Harlequin publishes series titles primarily under the Harlequin and Silhouette brands. Series titles are published monthly in mass-market paperback format under an imprint that identifies the type of story to the reader. Each series typically has a preset number of titles that will be published each month. The single title publishing program provides a broader spectrum of content in a variety of formats (mass-market paperback, trade paperback, hardcover) and generally a longer book. New single title books are published each month and the individual titles have a longer shelf life. ASSOCIATED BUSINESSES On August 30, 2006, Torstar acquired a 20% equity interest in Bell Globemedia Inc. for $283 million. In January, 2007, Bell Globemedia changed its name to CTVglobemedia Inc. (“CTVgm”). CTVgm is a Canadian multi-media company with ownership interests in Canada’s leading media properties including: CTV Inc., the number-one private broadcaster, and The Globe and Mail, the leading national daily newspaper. CTV operates 21 conventional television stations across Canada and offers a wide-range of quality news, sports, information and entertainment programming. Additionally, CTV has interests in 17 specialty channels. The Globe and Mail also publishes Report on Business magazine and also owns many interactive properties including globeandmail.com. Other CTVgm investments include: an approximate 15 percent interest in Maple Leaf Sports and Entertainment Ltd., which owns the Toronto Maple Leafs, Toronto Raptors and the Air Canada Centre; and a 50 percent interest in Dome Productions, a North American leader in the provision of mobile high definition production facilities. During September and October 2006 CTVgm acquired the issued and outstanding shares of CHUM. The common shares of CHUM have been placed in trust pending regulatory approval of the transaction. CHUM owns and operates 33 radio stations, 12 local television stations and 21 specialty channels. Torstar made an additional investment of $94 million in CTVgm in September 2006 in order to provide its pro-rata share of the equity contribution in respect of the CHUM purchase price, maintaining its 20% interest. Torstar has a 19.35% equity investment in Black Press Ltd. and a 30% equity interest in Q-ponz Inc. Black Press Ltd. is a privately held company that publishes more than 150 newspapers (both dailies and weeklies) and has 17 press centres in Western Canada, Washington State, Ohio and Hawaii. In 2006, Black Press acquired the Akron Beacon Journal, the daily newspaper in Akron, Ohio. Torstar may make additional investments in Black Press under certain
4
circumstances. Black Press faces many of the same risks as Torstar’s community newspapers, but in a different geography which may have a different impact on revenues and operating income. Qponz Inc. is a coupon envelope business based in Toronto. KEY FACTORS AND RELATED RISKS AFFECTING REVENUES AND OPERATING INCOME Torstar is subject to a number of risks and uncertainties, including those set forth below. A risk is the possibility that an event might happen in the future that could have a negative effect on the financial condition, results of operations or business of Torstar. The actual effect of any event on Torstar’s business could be materially different from what is anticipated. A further discussion of risks affecting Torstar and its businesses is set forth in Torstar’s current Annual Information Form, which is incorporated herein by reference. Revenues Torstar’s newspapers generate revenue primarily from advertising and from paid circulation for the daily newspapers. Advertising revenue includes in-paper advertising, inserts/flyers, specialty publications as well as on-line ads. Competition for advertising revenue comes from local and regional newspapers, radio, broadcast and cable television, direct mail, Internet and other communications and advertising media that operate in Torstar’s markets. The extent and nature of such competition is, in large part, determined by the location and demographics of each market and the number of media alternatives available. For example, just considering the competition from other daily newspapers, the Toronto Star is part of an intense battle with five other daily newspapers in the Greater Toronto Area (“GTA”), including two free daily papers. Advertising revenue is sensitive to prevailing economic conditions, including changes in local and regional economic conditions, and the level of consumer confidence. A large portion of Torstar’s advertising revenue is derived from the automotive, technology, retail, telecommunications, travel and entertainment sectors. These sectors have historically been sensitive to changes in economic conditions. Advertising revenue tends to be cyclical with the second and fourth quarters being stronger than the first and third. Advertising revenues are sensitive to changes in linage and rate. A 1% shift in either advertising linage or the average line rate at the combined daily newspapers impacts Torstar’s revenues by approximately $3.6 million over a full year. A 1% shift at the community newspapers impacts revenues by approximately $2.4 million over a full year. Readership levels are an important factor in the ability of a newspaper to generate advertising revenues. Changes in everyday lifestyle may mean that people choose not to devote as much time to reading newspapers as often as they used to. In addition, increased usage of the Internet over the past decade
5
has changed how people receive news and other information which may also reduce their newspaper reading and purchasing habits. In response to this trend, Torstar’s newspapers have established electronic versions which are updated regularly during the day for breaking news and which have various interactive features. These sites complement the printed product and provide both readership and advertising opportunities. In addition, Torstar has made investments in digital operations including classified websites where revenues have migrated over the past few years. In 2006, digital revenues represented 3.2% of Torstar’s Newspaper and Digital Segment revenues. However, digital revenues tend to be lower than traditional media, due in part to the lower cost structure and, in some cases, low barriers to entry. Generating a significant level of digital revenues may require a large volume of transactions at relatively low rates. To get the volume of transactions, a critical mass of relevant content and brand recognition and effective technology are key requirements. A challenge for Torstar in the digital space is that the playing field continues to change at a rapid pace, there are lower barriers to entry and the competitors include global players with access to greater financial and other resources than Torstar. TMG TV generates revenues primarily by selling time for direct response advertising on the SHOP TV Canada channel. The direct response television business in Canada has been challenging for several years. Federal regulations on products and a shift to digital tuning (reducing channel surfing) have negatively affected the Canadian direct response television business. Channel placement with the cable networks is an important selling feature for this business. TMG TV’s contract with Rogers for access to their cable network in the Toronto area expired on December 31, 2006. A new contract has not been negotiated but the current access arrangements have continued. The Transit TV model is to generate revenues by selling advertising space on programming broadcast on buses. The medium enjoys the advantage of a relatively “captive” audience, is less expensive for advertisers than television and may provide better access to key demographics. However, as a new product, there is no guarantee of commercial success and Torstar’s experience to date is that advertisers have been slow to embrace it. A key risk for book publishing revenue is to be able to publish books that consumers want to read and to have them available where and when consumers are making their purchasing decision. Given the large percentage of its sales in the U.S., Harlequin has considerable exposure to trends occurring in the U.S. book market. Harlequin regularly introduces new product lines in order to attract new readers and discontinues products where consumer interest has declined. Harlequin also continues to expand its distribution network through retail stores, by direct mail and through the Internet.
6
Books sold through the retail channel are sold to wholesalers and retailers with a right of return leaving the ultimate sales risk with Harlequin. In order to reflect the ability of the retailers to return books that they don’t sell, a provision for returns is made when revenue is recognized. (See additional information in the Critical Accounting Policies and Estimates section of this MD&A.) The provision is then adjusted as actual returns are received over time. Series books are on sale for approximately one month. Returns for these books are normally received within one year, with more than 95% received within the first six months. Single title books are on sale for several months and, as a result, experience a longer return period. The difference between the initial estimate of returns and the actual returns realized has an impact on Harlequin’s results during subsequent periods as the returns are received. Single title books tend to have a higher variability in return rates than series books, increasing the related risk in the provision for returns estimate. A key revenue risk for Harlequin’s direct-to-consumer business is maintaining the customer base. This is done through a combination of acquiring new customers and keeping the existing ones. A significant source of new customers has historically been through promotional direct mailings. The direct marketing industry continues to face considerable challenges from a lack of available mailing lists, regulation and competitive pressure from alternate channels. This makes the acquisition of new customers through promotional mailings difficult. Harlequin has responded to these challenges in a number of ways including the use of its Internet site, eharlequin.com, to attract new customers. Employees Torstar has a number of collective agreements at its newspaper operations that have historically tied annual wage increases to cost of living. The newspapers face the risk of future labour negotiations and the potential for business interruption should a strike, lockout or other labour disruption occur. Such an interruption could materially adversely affect Torstar’s revenue. The level of unionization at the newspapers also impacts the ability of Torstar to respond quickly to downturns in the economy that negatively impact revenue. Five of the Toronto Star’s collective agreements covering approximately 770 employees at One Yonge Street and 80 employees at the Vaughan Press Centre will expire at the end of 2007. Three additional agreements covering approximately 400 employees at the Vaughan Press Centre will expire at the end of 2011. Sing Tao’s two collective agreements covering 125 employees expired at the end of 2006. A tentative settlement of both contracts was reached subsequent to year end and both are scheduled for a ratification vote the first week of March. In February 2007, approximately 50 employees at Metro Toronto voted in favour of unionization. Negotiations for a first contract are expected to be scheduled during 2007.
7
Metroland Media Group has a number of collective agreements throughout their operations covering approximately 900 employees. Five agreements were settled at the end of 2006 and negotiations are being scheduled for six agreements covering approximately 400 employees that expired at the end of 2006. Five other agreements covering approximately 175 employees will expire during 2007. During the second quarter of 2006, a settlement was reached for the 18-month strike at the Hamilton Web facility. Newsprint Costs Newsprint costs are the single largest raw material expense for Torstar’s newspapers and are one of the Newspapers and Digital Segment’s most significant operating costs. Newsprint is priced as a commodity with price increases or decreases implemented at regular intervals. In 2006, Torstar’s newsprint price was on average 3.5% higher than in 2005. Based on pricing trends, the average newsprint price is expected to decline in 2007. Torstar’s newspapers consume approximately 150,000 tonnes of newsprint each year. A $10 change in the price per tonne affects operating profits by $1.5 million. Distribution Distribution of newspapers is made through independent contractors with adults primarily used for the daily newspapers and local youth used for many of the community newspapers. For the community newspapers, the ability to attract and retain a youth carrier force is a key business concern. For all of the newspapers, distribution costs are negatively impacted by higher fuel prices. Technology The media industry is experiencing rapid and significant technological changes. This requires Torstar to be able to attract and retain appropriately skilled staff to manage the changes and may require capital investments in the future. Foreign Exchange As an international publisher, approximately 95% of Harlequin’s revenues are earned in currencies other than the Canadian dollar. As a result, Harlequin’s reported revenues and operating profits are affected by changes in foreign exchange rates relative to the Canadian dollar. The most significant risk is from changes in the U.S.$/Cdn.$ exchange rate. Harlequin also has exposure to many other currencies, the most significant of which are the Euro, Yen and British Pound. From 2005 to 2006, the Canadian dollar strengthened by 6% relative to the U.S. dollar, Euro and the British Pound and by 12% to the Yen. The total impact of Harlequin’s exposure to foreign currencies in 2006 as compared to 2005 was a decrease of $7.9 million in Harlequin’s reported operating income. To offset some of this exposure, Torstar enters into forward foreign exchange and option contracts, primarily for U.S. dollars. (See additional information on foreign exchange risks in the Financial Instruments section of this MD&A.) In
8
2006, Torstar realized gains of $0.8 million related to $30.0 million of U.S. dollar contracts at an average exchange rate of $1.16. (In 2005, gains of $29.5 million related to U.S. $76.0 million of U.S. dollar contracts at an average rate of $1.59.) These gains were included in Harlequin’s reported revenue and operating income. The U.S. dollar contracts that matured in 2005 were entered into in 2002 when the Canadian dollar was much weaker. The level of gains realized in 2005 on U.S. dollar contracts is not expected to recur in the future. Interest Expense Torstar may be exposed to fluctuations in interest rates under its borrowing arrangements. With the increased levels of long-term debt arising from Torstar’s investment in CTVgm in 2006, Torstar has entered into interest rate swap agreements to fix the rate of interest on $250 million of Canadian dollar borrowings at 4.3% (plus the interest rate spread based on Torstar’s long-term credit rating, currently 0.6%) for the next five years. Torstar also has a U.S. interest rate swap arrangement that fixes the interest rate on U.S. $80 million of borrowings at approximately 3.5% (plus the interest rate spread based on Torstar’s long-term credit rating, currently 0.6%) through December 2007. OPERATING RESULTS – YEAR ENDED DECEMBER 31, 2006 Overall Performance Total revenue was $1,528.3 million in 2006, down $28.6 million from $1,556.9 million in 2005. Newspaper and Digital revenue grew $20.7 million to $1,056.5 million including $14.3 million from acquisitions. Reported Book Publishing revenue was $471.8 million in 2006, down $49.3 million from $521.1 million in 2005. Underlying revenue growth of $9.4 million was more than offset by a $30.0 million decline from the strengthening of the Canadian dollar during the year and $28.7 million from lower gains on U.S. dollar hedges year over year. Operating profit was $123.3 million in 2006, down $71.2 million from $194.5 million in 2005. The decrease included $20.2 million of higher restructuring provisions in 2006. Newspaper and Digital Segment operating profit was $107.8 million in 2006, down $12.5 million from $120.3 million in 2005 as lower revenue at the Toronto Star and the investment in Torstar Digital more than offset improved results at Metroland Media Group’s community newspapers. Book Publishing reported operating profit was $56.3 million in 2006, down $39.1 million from $95.4 million in 2005. Underlying operating profit was down only $2.5 million in the year while the strengthening Canadian dollar decreased profits by $7.9 million and lower gains on the U.S. dollar hedges decreased profits by $28.7 million year over year. Underlying results were up for North America Retail and Overseas but were more than offset by lower North America Direct-To-Consumer results. Corporate costs were $18.5 million in 2006, down $0.5 million from $19.0 million in 2005. EBITDA, excluding restructuring provisions was $202.1 million in 2006, down $51.4 million from $253.5 million in 2005. Excluding the impact of foreign
9
exchange and restructuring provisions, EBITDA was down $14.8 million in the year. Restructuring provisions of $22.3 million were incurred in 2006. Star Media Group undertook several initiatives, including the renegotiation of its labour contracts at the Vaughan Press Centre which resulted in a workforce reduction, the outsourcing of its circulation call centre and a fourth quarter targeted separation program for a total cost of $13.6 million. Restructuring provisions of $6.0 million were recorded by Metroland Media Group from restructuring of operations triggered by the combination of the CityMedia and Metroland operations. Harlequin reduced its global workforce by 4% in the third quarter of 2006 at a cost of $2.7 million. In 2005, the Toronto Star recorded a restructuring provision of $2.1 million for a voluntary severance program at the Vaughan Press Centre. Interest expense was $20.8 million in 2006, up $10.3 million from $10.5 million in 2005. This almost doubling of the expense was from the higher level of debt outstanding during 2006, primarily from the investment in CTVgm, and higher interest rates. The average net debt (long-term debt and bank overdraft net of cash and cash equivalents) was $446.2 million in 2006, up from $290.2 million in 2005. Torstar’s effective interest rate was 4.7% in 2006 and 3.6% in 2005. Torstar has U.S. dollar denominated debt which provides a hedge against its U.S. dollar assets. However the offset is not exact as the U.S. dollar assets are primarily working capital with amounts fluctuating daily. As a result of the inexact offset and changes in the relative strength of the Canadian dollar, Torstar reports a non-cash foreign exchange gain or loss each year on the translation of its net U.S. dollar asset position. The Canadian dollar strengthened relative to the U.S. dollar by approximately 6% in 2006 and 7% in 2005. In 2006, there was a non-cash translation gain of $0.1 million on the translation of Torstar’s net U.S. dollar asset position compared with a loss of $2.7 million reported in 2005. Income from associated businesses was $16.0 million in 2006 compared with $0.6 million in 2005. The income in 2006 includes $14.0 million from CTVgm’s results for the quarter ended November 30, 2006 (its first quarter of fiscal 2007) adjusted for the impact of the allocation of Torstar’s purchase price to CTVgm’s underlying assets and liabilities. (As Torstar and CTVgm do not have coterminous quarter-ends, Torstar reflects CTVgm’s operations with a one-month lag.) CTVgm had a strong first quarter with revenues and EBITDA up in both its broadcast and print operations. During the quarter CTVgm acquired 100% of CHUM, completed a refinancing and sold its 40% interest in Workopolis. CTVgm is equity accounting for CHUM while the common shares are being held in a trust pending regulatory approval of the transaction. Torstar’s income from Black Press was $1.8 million in 2006 compared with $0.6 million in 2005. Black Press had a strong 2006, with EBITDA up from acquisitions and improved operations.
10
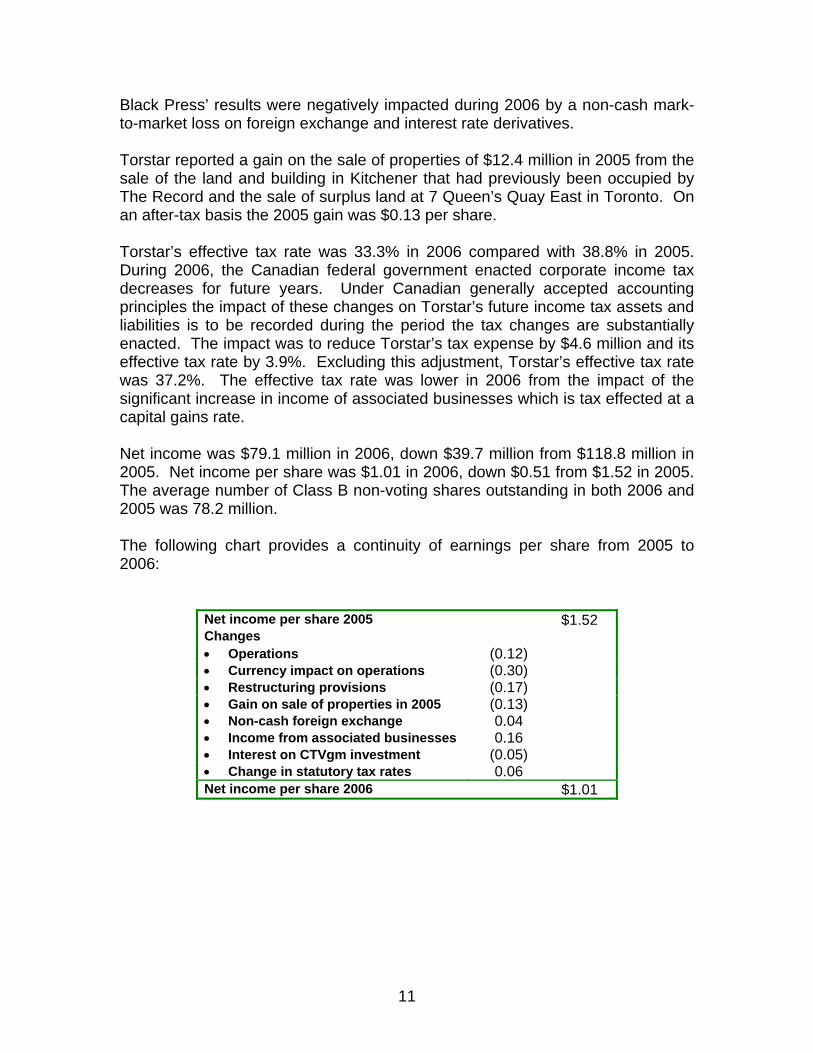
Black Press’ results were negatively impacted during 2006 by a non-cash mark-to-market loss on foreign exchange and interest rate derivatives. Torstar reported a gain on the sale of properties of $12.4 million in 2005 from the sale of the land and building in Kitchener that had previously been occupied by The Record and the sale of surplus land at 7 Queen’s Quay East in Toronto. On an after-tax basis the 2005 gain was $0.13 per share. Torstar’s effective tax rate was 33.3% in 2006 compared with 38.8% in 2005. During 2006, the Canadian federal government enacted corporate income tax decreases for future years. Under Canadian generally accepted accounting principles the impact of these changes on Torstar’s future income tax assets and liabilities is to be recorded during the period the tax changes are substantially enacted. The impact was to reduce Torstar’s tax expense by $4.6 million and its effective tax rate by 3.9%. Excluding this adjustment, Torstar’s effective tax rate was 37.2%. The effective tax rate was lower in 2006 from the impact of the significant increase in income of associated businesses which is tax effected at a capital gains rate. Net income was $79.1 million in 2006, down $39.7 million from $118.8 million in 2005. Net income per share was $1.01 in 2006, down $0.51 from $1.52 in 2005. The average number of Class B non-voting shares outstanding in both 2006 and 2005 was 78.2 million. The following chart provides a continuity of earnings per share from 2005 to 2006:
Net income per share 2005 $1.52 Changes • Operations (0.12) • Currency impact on operations (0.30) • Restructuring provisions (0.17) • Gain on sale of properties in 2005 (0.13) • Non-cash foreign exchange 0.04 • Income from associated businesses 0.16 • Interest on CTVgm investment (0.05) • Change in statutory tax rates 0.06 Net income per share 2006 $1.01
11
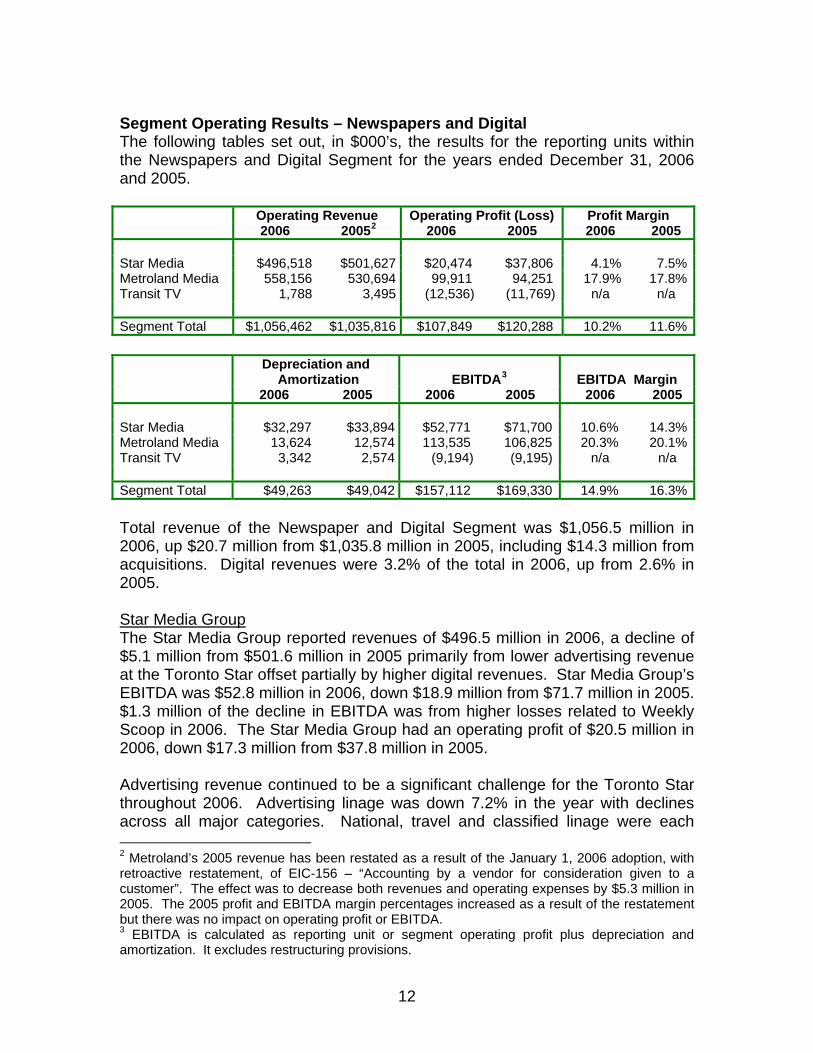
Segment Operating Results – Newspapers and Digital The following tables set out, in $000’s, the results for the reporting units within the Newspapers and Digital Segment for the years ended December 31, 2006 and 2005. Operating Revenue Operating Profit (Loss) Profit Margin 2006 20052 2006 2005 2006 2005 Star Media $496,518 $501,627 $20,474 $37,806 4.1% 7.5%Metroland Media 558,156 530,694 99,911 94,251 17.9% 17.8%Transit TV 1,788 3,495 (12,536) (11,769) n/a n/a Segment Total $1,056,462 $1,035,816 $107,849 $120,288 10.2% 11.6% Depreciation and
Amortization
EBITDA3
EBITDA Margin 2006 2005 2006 2005 2006 2005 Star Media $32,297 $33,894 $52,771 $71,700 10.6% 14.3%Metroland Media 13,624 12,574 113,535 106,825 20.3% 20.1%Transit TV 3,342 2,574 (9,194) (9,195) n/a n/a Segment Total $49,263 $49,042 $157,112 $169,330 14.9% 16.3% Total revenue of the Newspaper and Digital Segment was $1,056.5 million in 2006, up $20.7 million from $1,035.8 million in 2005, including $14.3 million from acquisitions. Digital revenues were 3.2% of the total in 2006, up from 2.6% in 2005. Star Media Group The Star Media Group reported revenues of $496.5 million in 2006, a decline of $5.1 million from $501.6 million in 2005 primarily from lower advertising revenue at the Toronto Star offset partially by higher digital revenues. Star Media Group’s EBITDA was $52.8 million in 2006, down $18.9 million from $71.7 million in 2005. $1.3 million of the decline in EBITDA was from higher losses related to Weekly Scoop in 2006. The Star Media Group had an operating profit of $20.5 million in 2006, down $17.3 million from $37.8 million in 2005. Advertising revenue continued to be a significant challenge for the Toronto Star throughout 2006. Advertising linage was down 7.2% in the year with declines across all major categories. National, travel and classified linage were each 2 Metroland’s 2005 revenue has been restated as a result of the January 1, 2006 adoption, with retroactive restatement, of EIC-156 – “Accounting by a vendor for consideration given to a customer”. The effect was to decrease both revenues and operating expenses by $5.3 million in 2005. The 2005 profit and EBITDA margin percentages increased as a result of the restatement but there was no impact on operating profit or EBITDA. 3 EBITDA is calculated as reporting unit or segment operating profit plus depreciation and amortization. It excludes restructuring provisions.
12
down approximately 10%. Retail linage was relatively stable as this category benefited from the new zoned advertising sections. The effective average line rate was up 2.4% in 2006. The jointly-owned Sing Tao Daily and Metro newspapers grew revenues by $4.6 million in 2006 from a combination of market expansion, increased advertising volumes and higher effective average rates. Workopolis continued its trend of increasing revenues and Olive Canada Network contributed to the Torstar Digital revenue growth in its first year of operations. Higher newsprint pricing and promotional costs were mitigated by savings in labour and pension expenses for the Toronto Star in 2006. During 2006, the Toronto Star undertook several initiatives to reduce costs, including the renegotiation of its labour contracts at the Vaughan Press Centre, the outsourcing of its circulation call centre and a targeted separation program. The cost savings from these programs will be realized in 2007. Torstar Digital payroll and operating costs were higher in 2006 from the investment in building the LiveDeal.ca and Olive Canada Network businesses as well as developing TOPS (an online publishing system that will power all of Torstar’s newspaper web sites and Toronto.com). Promotional costs were higher as Workopolis undertook a significant marketing program. Weekly Scoop incurred operating losses of $4.5 million in the first six months of 2006, prior to ceasing publication in June. Operating losses were $3.2 million in 2005. TMG TV’s revenue and operating profit were down year over year as the direct response advertising market continued to be challenging. Metroland Media Group Revenues were up $27.5 million in 2006 at Metroland Media Group including $14.3 million from the impact of acquisitions. Advertising and distribution revenues were up at the community newspapers while the daily newspapers had a decline in advertising revenues. EBITDA was $113.5 million in 2006, up $6.7 million from $106.8 million in 2005. Operating profit was $99.9 million in the year, up $5.6 million from $94.3 million in 2005. During 2006, Metroland made several smaller acquisitions of community newspapers and magazines as well as realizing the full-year benefits of the acquisitions made during 2005. Metroland continued its trend of new publications and market expansion during 2006 including expansion of the Gold Book Directories. Advertising linage was up 3.1% at the community newspapers, excluding acquisitions, and down 1.1% at the daily newspapers. Distribution volumes grew 6.0% in 2006 with just over 3.2 billion pieces distributed by the community and daily newspapers. Excluding the impact of acquisitions, distribution volumes grew by 4.5% in the year.
13
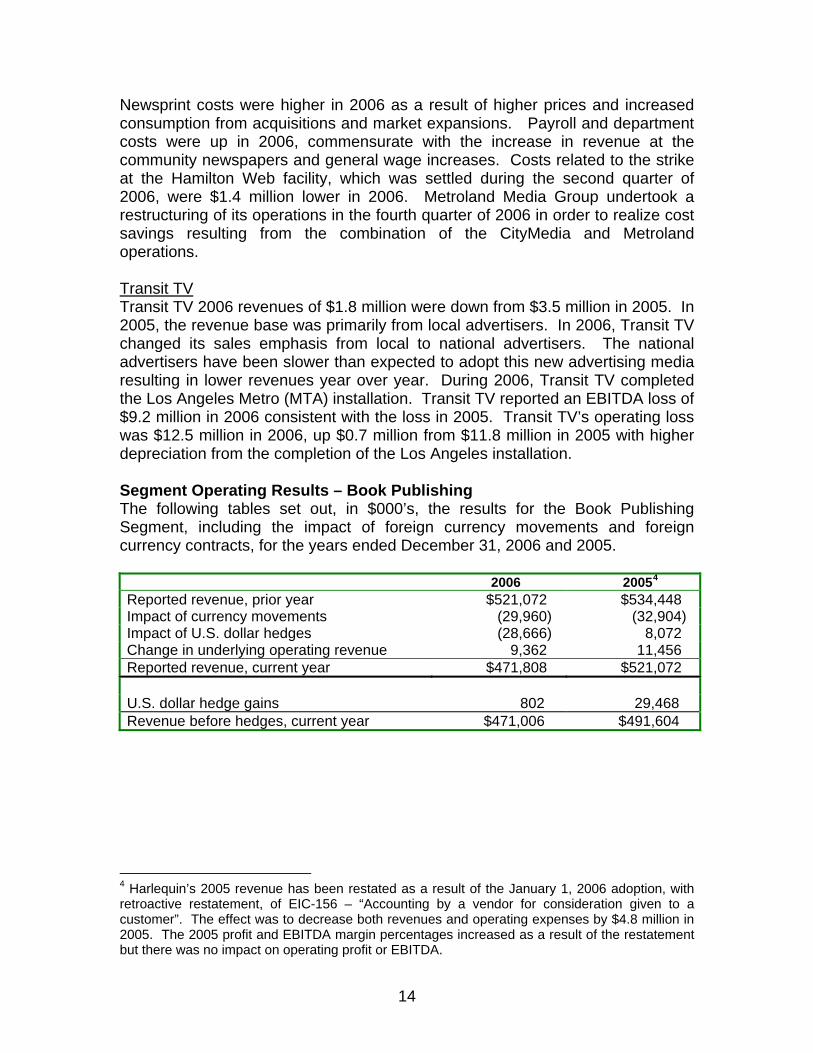
Newsprint costs were higher in 2006 as a result of higher prices and increased consumption from acquisitions and market expansions. Payroll and department costs were up in 2006, commensurate with the increase in revenue at the community newspapers and general wage increases. Costs related to the strike at the Hamilton Web facility, which was settled during the second quarter of 2006, were $1.4 million lower in 2006. Metroland Media Group undertook a restructuring of its operations in the fourth quarter of 2006 in order to realize cost savings resulting from the combination of the CityMedia and Metroland operations. Transit TV Transit TV 2006 revenues of $1.8 million were down from $3.5 million in 2005. In 2005, the revenue base was primarily from local advertisers. In 2006, Transit TV changed its sales emphasis from local to national advertisers. The national advertisers have been slower than expected to adopt this new advertising media resulting in lower revenues year over year. During 2006, Transit TV completed the Los Angeles Metro (MTA) installation. Transit TV reported an EBITDA loss of $9.2 million in 2006 consistent with the loss in 2005. Transit TV’s operating loss was $12.5 million in 2006, up $0.7 million from $11.8 million in 2005 with higher depreciation from the completion of the Los Angeles installation. Segment Operating Results – Book Publishing The following tables set out, in $000’s, the results for the Book Publishing Segment, including the impact of foreign currency movements and foreign currency contracts, for the years ended December 31, 2006 and 2005. 2006 20054
Reported revenue, prior year $521,072 $534,448 Impact of currency movements (29,960) (32,904) Impact of U.S. dollar hedges (28,666) 8,072 Change in underlying operating revenue 9,362 11,456 Reported revenue, current year $471,808 $521,072 U.S. dollar hedge gains 802 29,468 Revenue before hedges, current year $471,006 $491,604
4 Harlequin’s 2005 revenue has been restated as a result of the January 1, 2006 adoption, with retroactive restatement, of EIC-156 – “Accounting by a vendor for consideration given to a customer”. The effect was to decrease both revenues and operating expenses by $4.8 million in 2005. The 2005 profit and EBITDA margin percentages increased as a result of the restatement but there was no impact on operating profit or EBITDA.
14
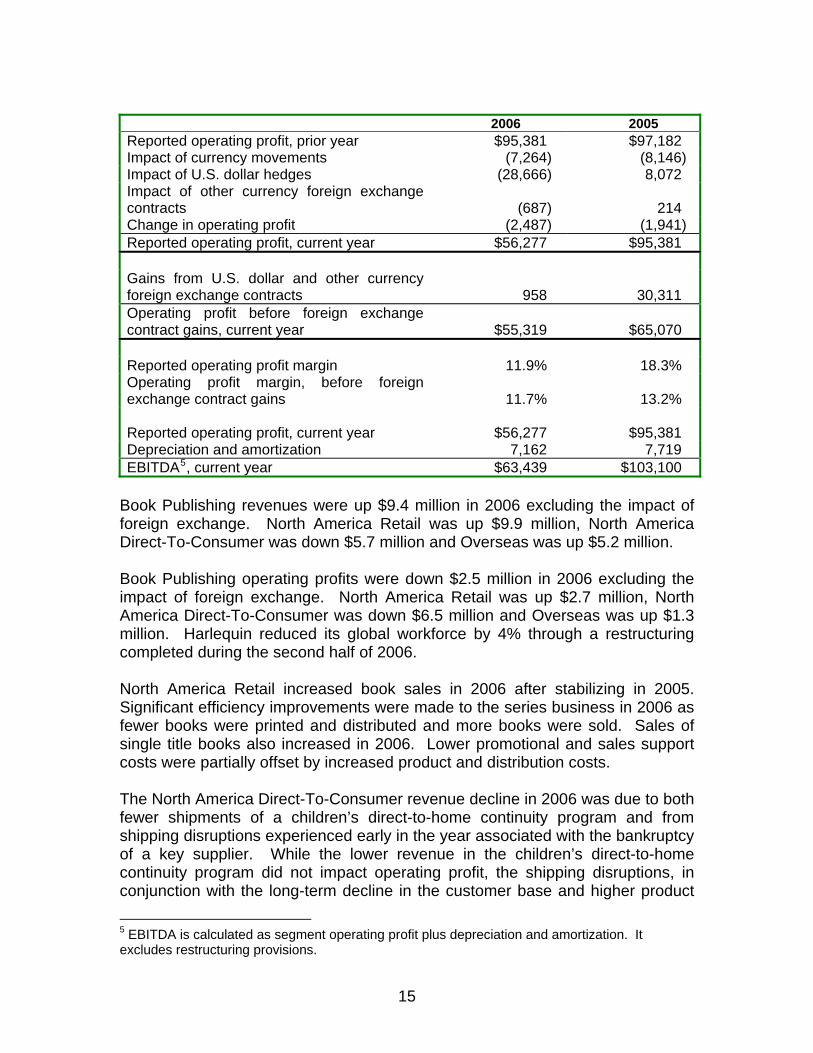
2006 2005 Reported operating profit, prior year $95,381 $97,182 Impact of currency movements (7,264) (8,146) Impact of U.S. dollar hedges (28,666) 8,072 Impact of other currency foreign exchange contracts
(687)
214
Change in operating profit (2,487) (1,941) Reported operating profit, current year $56,277 $95,381 Gains from U.S. dollar and other currency foreign exchange contracts
958
30,311
Operating profit before foreign exchange contract gains, current year
$55,319
$65,070
Reported operating profit margin 11.9% 18.3% Operating profit margin, before foreign exchange contract gains
11.7%
13.2%
Reported operating profit, current year $56,277 $95,381 Depreciation and amortization 7,162 7,719 EBITDA5, current year $63,439 $103,100
Book Publishing revenues were up $9.4 million in 2006 excluding the impact of foreign exchange. North America Retail was up $9.9 million, North America Direct-To-Consumer was down $5.7 million and Overseas was up $5.2 million. Book Publishing operating profits were down $2.5 million in 2006 excluding the impact of foreign exchange. North America Retail was up $2.7 million, North America Direct-To-Consumer was down $6.5 million and Overseas was up $1.3 million. Harlequin reduced its global workforce by 4% through a restructuring completed during the second half of 2006. North America Retail increased book sales in 2006 after stabilizing in 2005. Significant efficiency improvements were made to the series business in 2006 as fewer books were printed and distributed and more books were sold. Sales of single title books also increased in 2006. Lower promotional and sales support costs were partially offset by increased product and distribution costs. The North America Direct-To-Consumer revenue decline in 2006 was due to both fewer shipments of a children’s direct-to-home continuity program and from shipping disruptions experienced early in the year associated with the bankruptcy of a key supplier. While the lower revenue in the children’s direct-to-home continuity program did not impact operating profit, the shipping disruptions, in conjunction with the long-term decline in the customer base and higher product
5 EBITDA is calculated as segment operating profit plus depreciation and amortization. It excludes restructuring provisions.
15
costs contributed to the year over year decline in earnings. Improved sales through the Internet channel partially offset this decline. The Overseas markets had mixed results in 2006 with improvements in the United Kingdom and the Nordic Group offset by lower results in Germany. In the United Kingdom improved retail results, primarily from adjustments to prior period returns provisions, more than offset lower direct-to-consumer volumes. The Nordic Group was up significantly with growth in both the single title and series lines. Germany’s results were lower in 2006 with lower sales in its single title business primarily from the level of success in 2005 from a unique publishing program that did not continue in 2006. Brazil, a joint venture launched in 2005, showed improvement in 2006 selling more books and making progress towards break-even. LIQUIDITY AND CAPITAL RESOURCES Overview Funds are generally used for capital expenditures, debt repayment and distributions to shareholders. Long-term debt is used to supplement funds from operations and as required for acquisitions. It is expected that future cash flows from operating activities, combined with the credit facilities available will be adequate to cover forecasted financing requirements. In 2006, $111.6 million of cash was generated by operations, $449.4 million was used for investing activities and $338.0 million was generated by financing activities. Cash and cash equivalents net of bank overdraft increased by $2.9 million in the year from $41.0 million to $43.9 million. Operating activities Operating activities provided cash of $111.6 million in 2006, down $12.5 million from $124.1 million in 2005. The lower level of cash provided in 2006 reflected the lower operating profits offset partially by lower pension funding and a smaller increase in non-cash working capital. Other adjustments to operating cash flows were $2.4 million in 2006 and $17.6 million in 2005. In 2006, the adjustments included pension contributions in excess of pension expense partially offset by the non-cash stock-based compensation expense. In 2005, pension contributions in excess of pension expense and the gain from the sale of land were partially offset by the non-cash foreign exchange loss and the non-cash stock-based compensation expense. Non-cash working capital investments increased $8.4 million in 2006. Receivables increased $16.3 million in 2006 primarily from improved fourth quarter revenues in Book Publishing as the Newspaper and Digital receivables were flat year over year. Prepaid and recoverable income taxes increased $13.5 million year over year primarily due to the timing of installments in 2006. Accounts payable and accrued liabilities increased $22.3 million in 2006 from a
16
combination of higher restructuring provisions and the timing of payments for trade payables. In 2005, non-cash working capital increased $42.7 million from increases in receivable and prepaid balances and reductions in payables. Investing activities During 2006, $449.4 million was used for investments, up from $74.6 million in 2005. In 2006, $378.0 million was used for the initial purchase of 20% of CTVgm and the additional investment related to CTVgm’s acquisition of CHUM. In the fourth quarter of 2006, Torstar acquired an additional 10% of Workopolis for $28.8 million. Torstar also completed a number of other acquisitions during 2006 primarily of community newspapers and magazines for a total purchase price of $4.7 million and made an additional investment in Vocel, Inc. for $1.1 million. During 2005, $59.4 million was used for acquisitions and investments, including community newspapers in the Muskoka, Huntsville, Parry Sound and Ottawa areas. Metroland Media Group also acquired the Toronto Wine and Cheese Show and Paton Publishing (a contract publisher and producer of focused marketing campaigns aimed principally at youth audiences). The Metroland Media Group 2005 acquisitions had a total purchase price of $48.4 million. Harlequin completed the $5.0 million acquisition of BET Books from Black Entertainment Television during 2005 and Torstar made $6.0 million of portfolio investments in Vocel, Inc. and LiveDeal, Inc. Additions to property plant and equipment were $38.3 million in 2006, up slightly from $35.3 million in 2005. The 2006 additions included general capital replacement across all the operations, $8.5 million for inserting machines at Metroland Media Group’s community newspapers and $4.1 million for the completion of Transit TV’s Los Angeles installation. During 2005, total proceeds of $17.7 million were received from the sale of the property in Kitchener that had previously been occupied by The Record and the surplus land at 7 Queen’s Quay East in Toronto. There were no comparable transactions in 2006. 2007 Capital expenditures Capital expenditures in 2007 are expected to be approximately $45.0 million, $6.7 million higher than the $38.3 million spent in 2006. The 2007 capital expenditures are anticipated to include the purchase of additional inserting equipment at Metroland Media Group’s community newspapers and continuing investment in technology to improve the utilization of information across the Newspaper and Digital Segment both in print and on the Internet.
17
Financing activities Cash of $338.0 million was generated by financing activities during 2006, compared with a use of $45.3 million in 2005. Torstar increased its long-term debt by $390.2 million in 2006 primarily to fund its investment in CTVgm. During 2006, Torstar issued $618.8 million of bankers’ acceptances under a new banking facility and repaid $228.6 million of commercial paper. No medium term notes were issued or matured during 2006. Cash dividends paid to shareholders were $57.2 million in 2006, up $0.3 million from $56.9 million in 2005. $3.1 million of cash was received from the exercise of stock options in 2006, down from $8.4 million received in 2005. Torstar had two normal course issuer bids outstanding during the period May 7, 2004 to May 5, 2006. In 2005, 904,100 Class B shares were repurchased for a total price of $20.9 million. There were no shares purchased in 2006. Long-term debt At December 31, 2006, Torstar had long-term debt of $724.2 million outstanding. The debt consisted of U.S. dollar bankers’ acceptance of $132.3 million, Canadian dollar bankers’ acceptance of $491.9 million and Canadian dollar medium term notes of $100.0 million. During the third quarter of 2006, Torstar renegotiated its long-term bank credit facilities as part of the funding for its equity investment in CTVgm. The new facilities consist of a $425 million revolving loan that will mature on January 4, 2012 and a $425 million revolving operating loan. The operating loan matures on January 11, 2008 and can be extended with the consent of all parties for up to four additional 364-day periods or can be converted to a 364-day term loan at Torstar’s option. Amounts may be drawn under the facility in either Canadian or U.S. dollars. With the change in the long-term bank credit facilities and the new borrowings for the CTVgm investment, Torstar has changed from borrowing through the commercial paper program supported by the long-term credit facility to bank borrowings primarily in the form of bankers’ acceptances. The bankers’ acceptances normally mature over periods of 30 to 180 days but are classified as long-term as they are issued under the long-term credit facility. Bankers’ acceptances (and prior to mid 2006, commercial paper) are generally issued for a term of less than one year in order to provide for flexibility in borrowing. However, the bankers’ acceptance and commercial paper program has been and is intended to continue to be an ongoing source of financing for Torstar. Recognizing this intent, to the extent that the long-term credit facility has sufficient credit available that it could be used to replace the outstanding bankers’ acceptance and commercial paper, the bankers’ acceptance and commercial paper is classified as long-term debt on Torstar’s balance sheet.
18
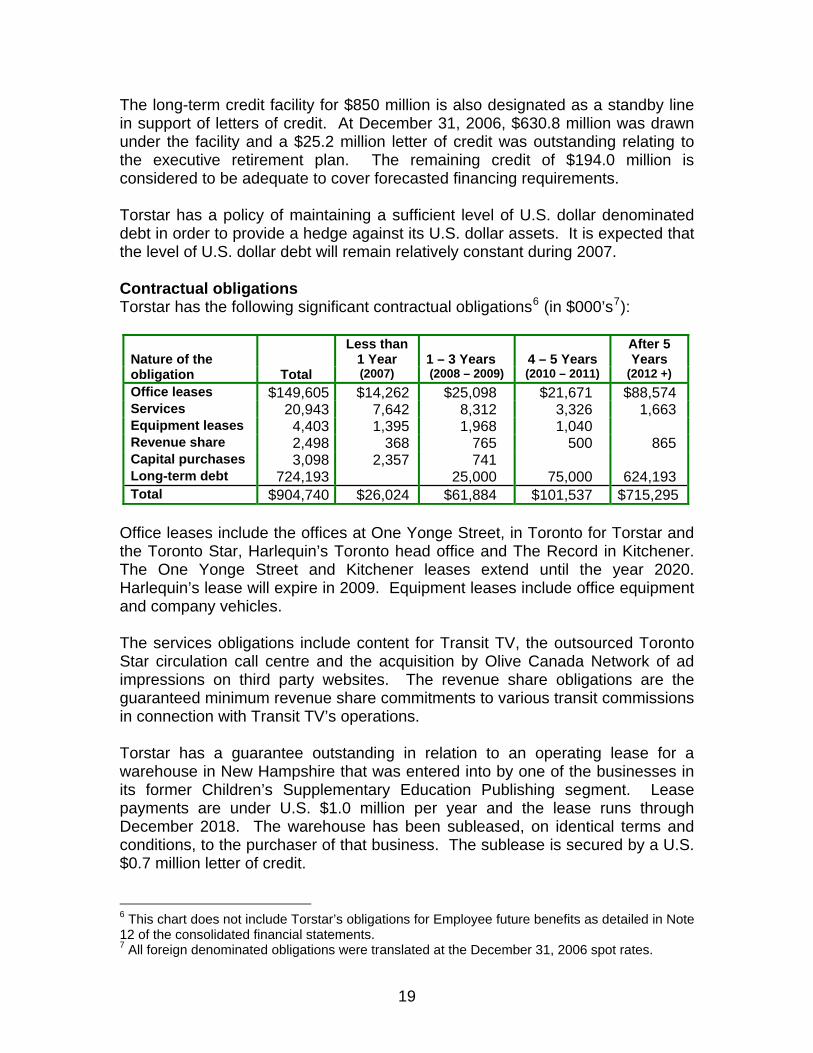
The long-term credit facility for $850 million is also designated as a standby line in support of letters of credit. At December 31, 2006, $630.8 million was drawn under the facility and a $25.2 million letter of credit was outstanding relating to the executive retirement plan. The remaining credit of $194.0 million is considered to be adequate to cover forecasted financing requirements. Torstar has a policy of maintaining a sufficient level of U.S. dollar denominated debt in order to provide a hedge against its U.S. dollar assets. It is expected that the level of U.S. dollar debt will remain relatively constant during 2007. Contractual obligations Torstar has the following significant contractual obligations6 (in $000’s7):
Nature of the
Less than 1 Year
1 – 3 Years
4 – 5 Years
After 5 Years
obligation Total (2007) (2008 – 2009) (2010 – 2011) (2012 +) Office leases $149,605 $14,262 $25,098 $21,671 $88,574 Services 20,943 7,642 8,312 3,326 1,663 Equipment leases 4,403 1,395 1,968 1,040 Revenue share 2,498 368 765 500 865 Capital purchases 3,098 2,357 741 Long-term debt 724,193 25,000 75,000 624,193 Total $904,740 $26,024 $61,884 $101,537 $715,295
Office leases include the offices at One Yonge Street, in Toronto for Torstar and the Toronto Star, Harlequin’s Toronto head office and The Record in Kitchener. The One Yonge Street and Kitchener leases extend until the year 2020. Harlequin’s lease will expire in 2009. Equipment leases include office equipment and company vehicles. The services obligations include content for Transit TV, the outsourced Toronto Star circulation call centre and the acquisition by Olive Canada Network of ad impressions on third party websites. The revenue share obligations are the guaranteed minimum revenue share commitments to various transit commissions in connection with Transit TV’s operations. Torstar has a guarantee outstanding in relation to an operating lease for a warehouse in New Hampshire that was entered into by one of the businesses in its former Children’s Supplementary Education Publishing segment. Lease payments are under U.S. $1.0 million per year and the lease runs through December 2018. The warehouse has been subleased, on identical terms and conditions, to the purchaser of that business. The sublease is secured by a U.S. $0.7 million letter of credit. 6 This chart does not include Torstar’s obligations for Employee future benefits as detailed in Note 12 of the consolidated financial statements. 7 All foreign denominated obligations were translated at the December 31, 2006 spot rates.
19
2007 OUTLOOK The outlook for the Newspapers and Digital Segment is mixed. The community newspapers have been able to maintain linage and revenue growth over the past few years and continue to perform well. However, the daily newspaper businesses continue to face significant revenue challenges. The Toronto Star has realized linage declines of 7% and 8% for 2006 and 2005 respectively, with higher effective average line rates unable to offset the revenue loss. The level of competition for advertising dollars in Toronto, both in print and from other forms of media, remains high. New products and pricing strategies will continue to be introduced by the newspapers to meet the changing needs of advertisers. In addition, provision of services to our readers and advertisers leveraging the Internet will remain a priority. Cost savings of approximately $6.5 million are expected to be realized in 2007 from the various restructuring provisions undertaken in 2006. The focus in 2007 for Torstar Digital, led by Workopolis, is to grow revenue after building audience and market share in 2006. While some of the individual properties are expected to improve EBITDA results in 2007, overall costs for Torstar Digital, including marketing spending, are expected to offset most of the growth resulting in stable EBITDA in 2007 for Torstar Digital. For Book Publishing, following the modest decline in profit experienced in 2006, the outlook for 2007 is for stability. Harlequin has stabilized the total number of books sold over the past three years despite difficult trends in its direct-to-consumer operations. Investment will continue in innovation and new products including digital initiatives in 2007. Cost savings of approximately $3.0 million are expected from the restructuring undertaken in late 2006. Harlequin will continue to be subject to the impact of changes in the value of the Canadian dollar relative to the U.S. dollar and other currencies. Torstar has reduced a portion of this exposure by entering into forward foreign exchange contracts to sell $27.5 million U.S. dollars during 2007 at a rate of $1.14. Torstar’s investment in CTVgm will have an uncertain impact on Torstar’s earnings in 2007. The results reported by Torstar for CTVgm in the fourth quarter of 2006 are not indicative of what is expected to be reported in the next three quarters. This is due to the seasonal nature of CTVgm’s businesses with the fall being the strongest quarter. Torstar will have increased interest expense in 2007 from the higher levels of debt and higher interest rates. This interest expense will be funded by Torstar’s other operations as there currently is no expectation of cash distributions from CTVgm. OPERATING RESULTS – THREE MONTHS ENDED DECEMBER 31, 2006 Overall Performance Total revenue was $414.6 million in the fourth quarter, down $2.6 million from $417.2 million in the fourth quarter of 2005. Newspaper and Digital revenue was up $2.0 million to $294.6 million including $1.5 million from acquisitions. Reported Book Publishing revenues were $120.0 million in the fourth quarter of 2006, down $4.6 million from $124.6 million in the same period last year.
20
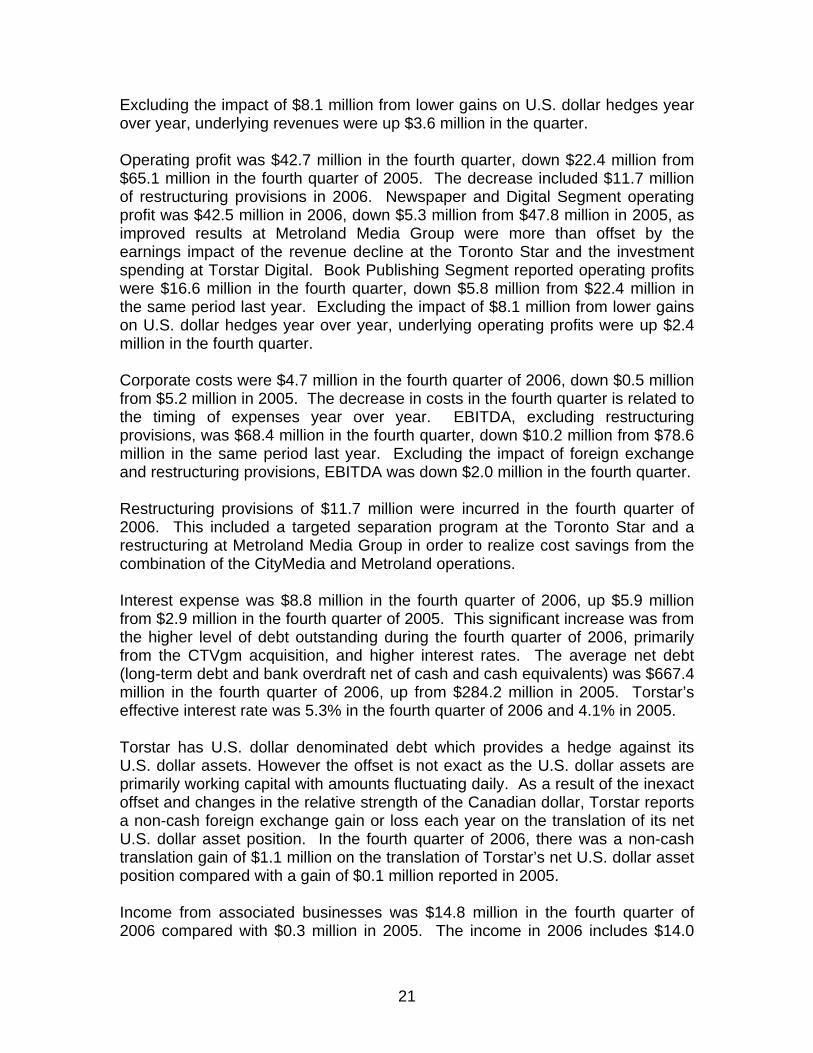
Excluding the impact of $8.1 million from lower gains on U.S. dollar hedges year over year, underlying revenues were up $3.6 million in the quarter. Operating profit was $42.7 million in the fourth quarter, down $22.4 million from $65.1 million in the fourth quarter of 2005. The decrease included $11.7 million of restructuring provisions in 2006. Newspaper and Digital Segment operating profit was $42.5 million in 2006, down $5.3 million from $47.8 million in 2005, as improved results at Metroland Media Group were more than offset by the earnings impact of the revenue decline at the Toronto Star and the investment spending at Torstar Digital. Book Publishing Segment reported operating profits were $16.6 million in the fourth quarter, down $5.8 million from $22.4 million in the same period last year. Excluding the impact of $8.1 million from lower gains on U.S. dollar hedges year over year, underlying operating profits were up $2.4 million in the fourth quarter. Corporate costs were $4.7 million in the fourth quarter of 2006, down $0.5 million from $5.2 million in 2005. The decrease in costs in the fourth quarter is related to the timing of expenses year over year. EBITDA, excluding restructuring provisions, was $68.4 million in the fourth quarter, down $10.2 million from $78.6 million in the same period last year. Excluding the impact of foreign exchange and restructuring provisions, EBITDA was down $2.0 million in the fourth quarter. Restructuring provisions of $11.7 million were incurred in the fourth quarter of 2006. This included a targeted separation program at the Toronto Star and a restructuring at Metroland Media Group in order to realize cost savings from the combination of the CityMedia and Metroland operations. Interest expense was $8.8 million in the fourth quarter of 2006, up $5.9 million from $2.9 million in the fourth quarter of 2005. This significant increase was from the higher level of debt outstanding during the fourth quarter of 2006, primarily from the CTVgm acquisition, and higher interest rates. The average net debt (long-term debt and bank overdraft net of cash and cash equivalents) was $667.4 million in the fourth quarter of 2006, up from $284.2 million in 2005. Torstar’s effective interest rate was 5.3% in the fourth quarter of 2006 and 4.1% in 2005. Torstar has U.S. dollar denominated debt which provides a hedge against its U.S. dollar assets. However the offset is not exact as the U.S. dollar assets are primarily working capital with amounts fluctuating daily. As a result of the inexact offset and changes in the relative strength of the Canadian dollar, Torstar reports a non-cash foreign exchange gain or loss each year on the translation of its net U.S. dollar asset position. In the fourth quarter of 2006, there was a non-cash translation gain of $1.1 million on the translation of Torstar’s net U.S. dollar asset position compared with a gain of $0.1 million reported in 2005. Income from associated businesses was $14.8 million in the fourth quarter of 2006 compared with $0.3 million in 2005. The income in 2006 includes $14.0
21
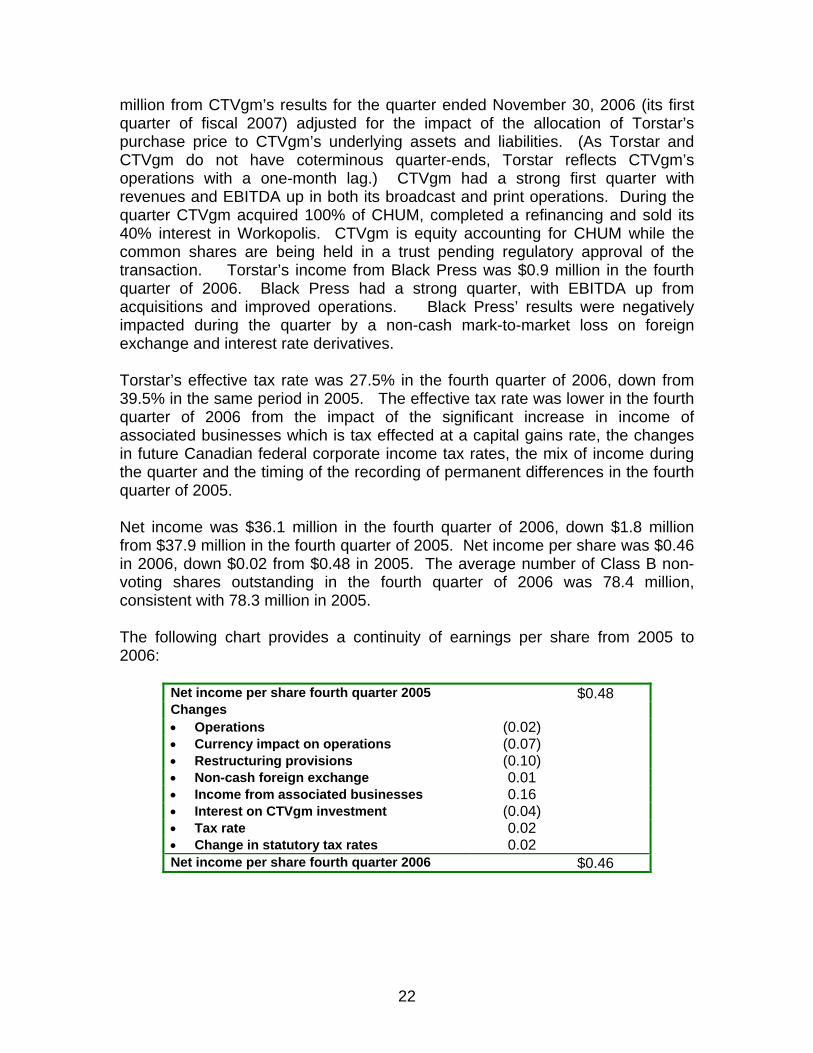
million from CTVgm’s results for the quarter ended November 30, 2006 (its first quarter of fiscal 2007) adjusted for the impact of the allocation of Torstar’s purchase price to CTVgm’s underlying assets and liabilities. (As Torstar and CTVgm do not have coterminous quarter-ends, Torstar reflects CTVgm’s operations with a one-month lag.) CTVgm had a strong first quarter with revenues and EBITDA up in both its broadcast and print operations. During the quarter CTVgm acquired 100% of CHUM, completed a refinancing and sold its 40% interest in Workopolis. CTVgm is equity accounting for CHUM while the common shares are being held in a trust pending regulatory approval of the transaction. Torstar’s income from Black Press was $0.9 million in the fourth quarter of 2006. Black Press had a strong quarter, with EBITDA up from acquisitions and improved operations. Black Press’ results were negatively impacted during the quarter by a non-cash mark-to-market loss on foreign exchange and interest rate derivatives. Torstar’s effective tax rate was 27.5% in the fourth quarter of 2006, down from 39.5% in the same period in 2005. The effective tax rate was lower in the fourth quarter of 2006 from the impact of the significant increase in income of associated businesses which is tax effected at a capital gains rate, the changes in future Canadian federal corporate income tax rates, the mix of income during the quarter and the timing of the recording of permanent differences in the fourth quarter of 2005. Net income was $36.1 million in the fourth quarter of 2006, down $1.8 million from $37.9 million in the fourth quarter of 2005. Net income per share was $0.46 in 2006, down $0.02 from $0.48 in 2005. The average number of Class B non-voting shares outstanding in the fourth quarter of 2006 was 78.4 million, consistent with 78.3 million in 2005. The following chart provides a continuity of earnings per share from 2005 to 2006:
Net income per share fourth quarter 2005 $0.48 Changes • Operations (0.02) • Currency impact on operations (0.07) • Restructuring provisions (0.10) • Non-cash foreign exchange 0.01 • Income from associated businesses 0.16 • Interest on CTVgm investment (0.04) • Tax rate 0.02 • Change in statutory tax rates 0.02 Net income per share fourth quarter 2006 $0.46
22
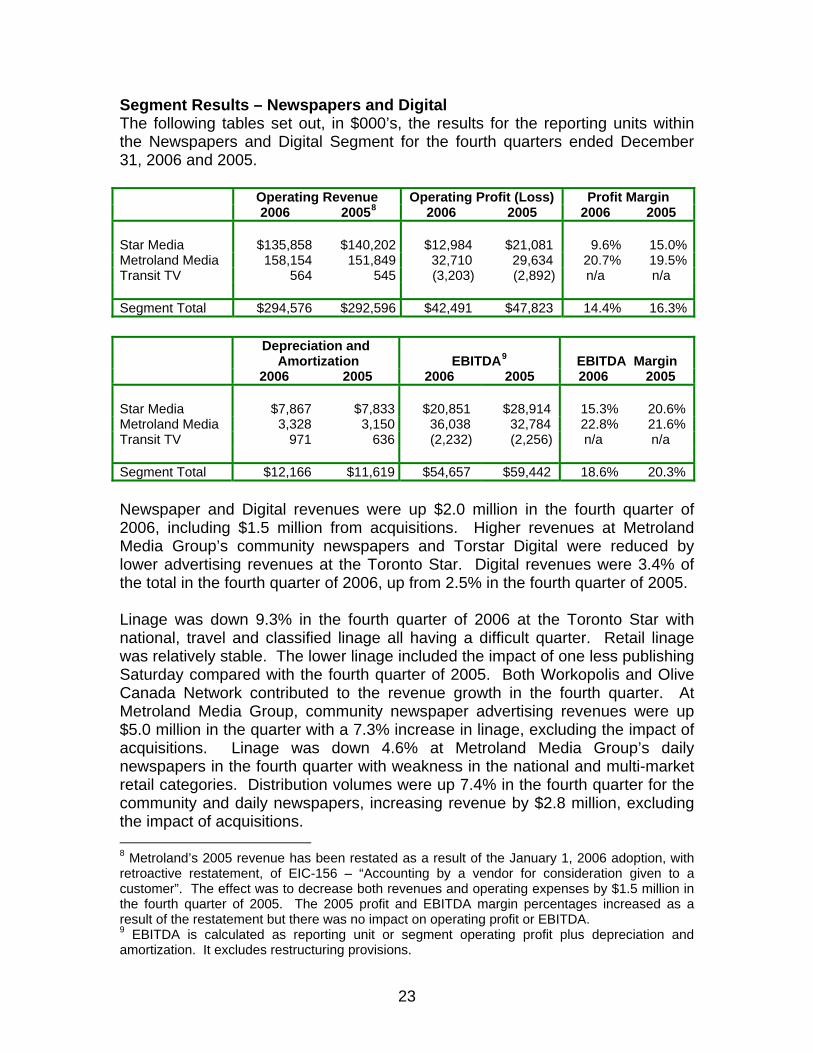
Segment Results – Newspapers and Digital The following tables set out, in $000’s, the results for the reporting units within the Newspapers and Digital Segment for the fourth quarters ended December 31, 2006 and 2005. Operating Revenue Operating Profit (Loss) Profit Margin 2006 20058 2006 2005 2006 2005 Star Media $135,858 $140,202 $12,984 $21,081 9.6% 15.0%Metroland Media 158,154 151,849 32,710 29,634 20.7% 19.5%Transit TV 564 545 (3,203) (2,892) n/a n/a Segment Total $294,576 $292,596 $42,491 $47,823 14.4% 16.3% Depreciation and
Amortization
EBITDA9
EBITDA Margin 2006 2005 2006 2005 2006 2005 Star Media $7,867 $7,833 $20,851 $28,914 15.3% 20.6% Metroland Media 3,328 3,150 36,038 32,784 22.8% 21.6% Transit TV 971 636 (2,232) (2,256) n/a n/a Segment Total $12,166 $11,619 $54,657 $59,442 18.6% 20.3% Newspaper and Digital revenues were up $2.0 million in the fourth quarter of 2006, including $1.5 million from acquisitions. Higher revenues at Metroland Media Group’s community newspapers and Torstar Digital were reduced by lower advertising revenues at the Toronto Star. Digital revenues were 3.4% of the total in the fourth quarter of 2006, up from 2.5% in the fourth quarter of 2005. Linage was down 9.3% in the fourth quarter of 2006 at the Toronto Star with national, travel and classified linage all having a difficult quarter. Retail linage was relatively stable. The lower linage included the impact of one less publishing Saturday compared with the fourth quarter of 2005. Both Workopolis and Olive Canada Network contributed to the revenue growth in the fourth quarter. At Metroland Media Group, community newspaper advertising revenues were up $5.0 million in the quarter with a 7.3% increase in linage, excluding the impact of acquisitions. Linage was down 4.6% at Metroland Media Group’s daily newspapers in the fourth quarter with weakness in the national and multi-market retail categories. Distribution volumes were up 7.4% in the fourth quarter for the community and daily newspapers, increasing revenue by $2.8 million, excluding the impact of acquisitions. 8 Metroland’s 2005 revenue has been restated as a result of the January 1, 2006 adoption, with retroactive restatement, of EIC-156 – “Accounting by a vendor for consideration given to a customer”. The effect was to decrease both revenues and operating expenses by $1.5 million in the fourth quarter of 2005. The 2005 profit and EBITDA margin percentages increased as a result of the restatement but there was no impact on operating profit or EBITDA. 9 EBITDA is calculated as reporting unit or segment operating profit plus depreciation and amortization. It excludes restructuring provisions.
23
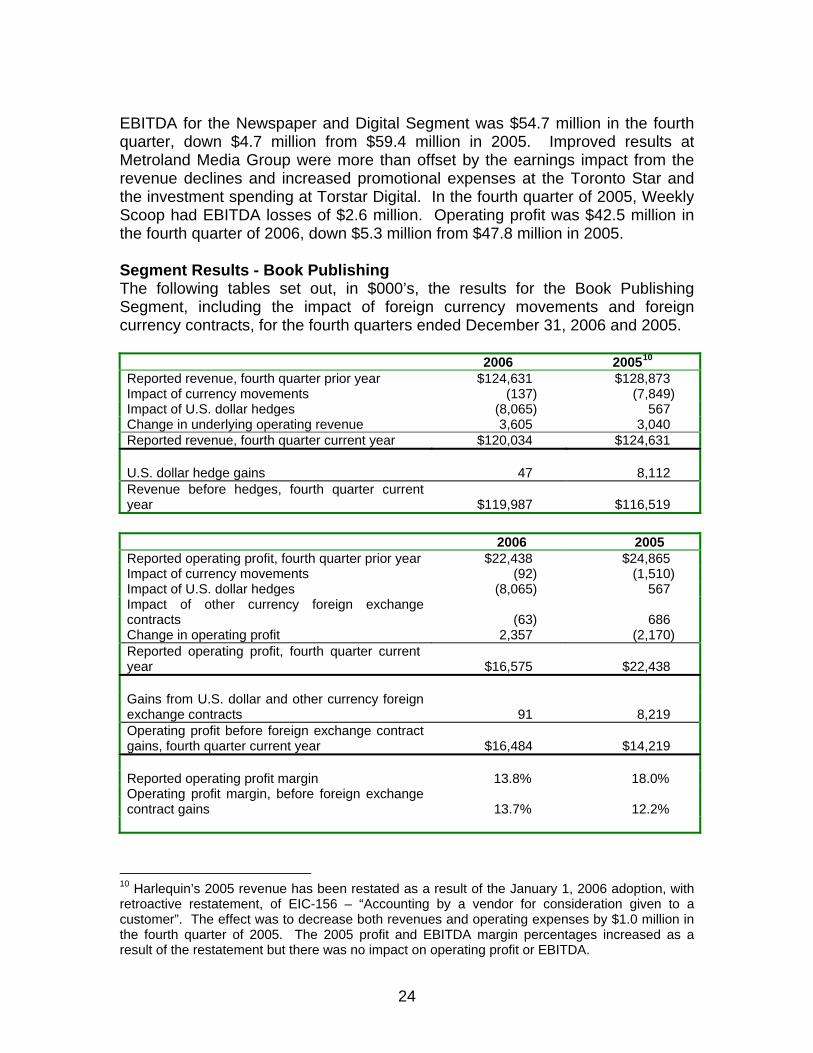
EBITDA for the Newspaper and Digital Segment was $54.7 million in the fourth quarter, down $4.7 million from $59.4 million in 2005. Improved results at Metroland Media Group were more than offset by the earnings impact from the revenue declines and increased promotional expenses at the Toronto Star and the investment spending at Torstar Digital. In the fourth quarter of 2005, Weekly Scoop had EBITDA losses of $2.6 million. Operating profit was $42.5 million in the fourth quarter of 2006, down $5.3 million from $47.8 million in 2005. Segment Results - Book Publishing The following tables set out, in $000’s, the results for the Book Publishing Segment, including the impact of foreign currency movements and foreign currency contracts, for the fourth quarters ended December 31, 2006 and 2005. 2006 200510
Reported revenue, fourth quarter prior year $124,631 $128,873 Impact of currency movements (137) (7,849) Impact of U.S. dollar hedges (8,065) 567 Change in underlying operating revenue 3,605 3,040 Reported revenue, fourth quarter current year $120,034 $124,631 U.S. dollar hedge gains 47 8,112 Revenue before hedges, fourth quarter current year
$119,987
$116,519
2006 2005 Reported operating profit, fourth quarter prior year $22,438 $24,865 Impact of currency movements (92) (1,510) Impact of U.S. dollar hedges (8,065) 567 Impact of other currency foreign exchange contracts
(63)
686
Change in operating profit 2,357 (2,170) Reported operating profit, fourth quarter current year
$16,575
$22,438
Gains from U.S. dollar and other currency foreign exchange contracts
91
8,219
Operating profit before foreign exchange contract gains, fourth quarter current year
$16,484
$14,219
Reported operating profit margin 13.8% 18.0% Operating profit margin, before foreign exchange contract gains
13.7%
12.2%
10 Harlequin’s 2005 revenue has been restated as a result of the January 1, 2006 adoption, with retroactive restatement, of EIC-156 – “Accounting by a vendor for consideration given to a customer”. The effect was to decrease both revenues and operating expenses by $1.0 million in the fourth quarter of 2005. The 2005 profit and EBITDA margin percentages increased as a result of the restatement but there was no impact on operating profit or EBITDA.
24
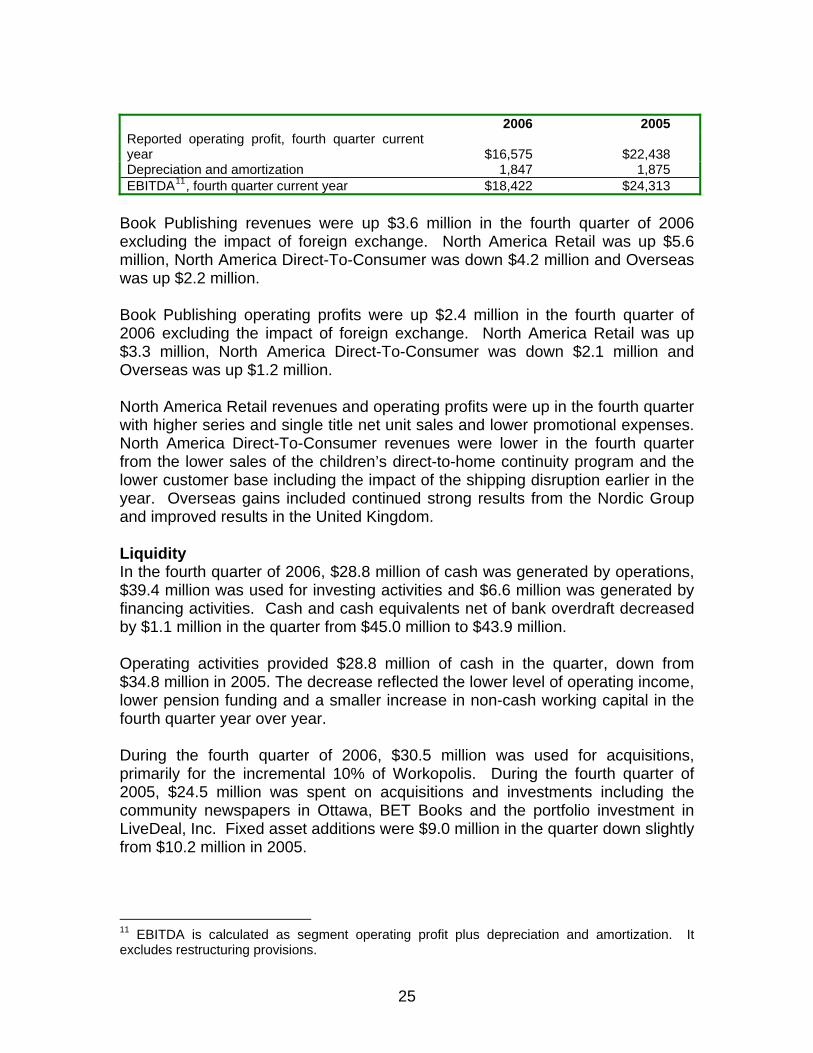
2006 2005 Reported operating profit, fourth quarter current year
$16,575
$22,438
Depreciation and amortization 1,847 1,875 EBITDA11, fourth quarter current year $18,422 $24,313
Book Publishing revenues were up $3.6 million in the fourth quarter of 2006 excluding the impact of foreign exchange. North America Retail was up $5.6 million, North America Direct-To-Consumer was down $4.2 million and Overseas was up $2.2 million. Book Publishing operating profits were up $2.4 million in the fourth quarter of 2006 excluding the impact of foreign exchange. North America Retail was up $3.3 million, North America Direct-To-Consumer was down $2.1 million and Overseas was up $1.2 million. North America Retail revenues and operating profits were up in the fourth quarter with higher series and single title net unit sales and lower promotional expenses. North America Direct-To-Consumer revenues were lower in the fourth quarter from the lower sales of the children’s direct-to-home continuity program and the lower customer base including the impact of the shipping disruption earlier in the year. Overseas gains included continued strong results from the Nordic Group and improved results in the United Kingdom. Liquidity In the fourth quarter of 2006, $28.8 million of cash was generated by operations, $39.4 million was used for investing activities and $6.6 million was generated by financing activities. Cash and cash equivalents net of bank overdraft decreased by $1.1 million in the quarter from $45.0 million to $43.9 million. Operating activities provided $28.8 million of cash in the quarter, down from $34.8 million in 2005. The decrease reflected the lower level of operating income, lower pension funding and a smaller increase in non-cash working capital in the fourth quarter year over year. During the fourth quarter of 2006, $30.5 million was used for acquisitions, primarily for the incremental 10% of Workopolis. During the fourth quarter of 2005, $24.5 million was spent on acquisitions and investments including the community newspapers in Ottawa, BET Books and the portfolio investment in LiveDeal, Inc. Fixed asset additions were $9.0 million in the quarter down slightly from $10.2 million in 2005.
11 EBITDA is calculated as segment operating profit plus depreciation and amortization. It excludes restructuring provisions.
25
Torstar issued $19.2 million of bankers’ acceptances during the fourth quarter of 2006 and paid dividends of $14.1 million. Torstar issued $13.2 million of commercial paper during the fourth quarter of 2005 and paid dividends of $14.3 million. During the fourth quarter of 2005, Torstar purchased 314,900 shares for a total price of $7.0 million under the normal course issuer bid that opened on May 6, 2005. FINANCIAL INSTRUMENTS Foreign Exchange Harlequin’s international operations provide Torstar with approximately 30% of its operating revenues. As a result, fluctuations in exchange rates can have a significant impact on Torstar’s reported profitability. To manage the exchange risk in its operating results, Torstar enters into forward foreign exchange and currency option contracts. Torstar’s most significant exposure is to the movements in the U.S.$/Cdn.$ exchange rate. Torstar’s current practice is to hedge, one year in advance on a quarterly basis, U.S. dollar revenues equivalent to approximately 50% of its expected U.S. dollar operating profit. Torstar has entered into forward foreign exchange contracts to sell $27.5 million U.S. dollars during 2007 at a rate of $1.14 and $3.0 million in 2008 at a rate of $1.17. These contracts are designated as revenue hedges for accounting purposes and any resulting gains or losses are recognized in Book Publishing revenues as realized. The counterparties to the foreign currency contracts are all major financial institutions with high credit ratings. Further details are contained in Note 13 of the consolidated financial statements. In order to offset the exchange risk on its balance sheet from net U.S. dollar denominated assets, Torstar maintains a certain level of U.S. dollar denominated debt. These net assets are primarily current in nature, and to the extent that the amount of net U.S. dollar assets differs from the amount of the U.S. dollar debt, a foreign exchange gain or loss is recognized in earnings. Interest rates Torstar has long-term debt in the form of medium-term notes and bankers’ acceptances issued under a bank loan facility. Torstar issues debt in both Canadian and U.S. dollars with the U.S. dollar debt used as a hedge against the U.S. dollar denominated assets in the Book Publishing Segment. Torstar issues bankers’ acceptances at floating rates and medium term notes with either fixed or floating interest rates. Torstar is party to a U.S. interest rate swap arrangement that fixes the interest rate on U.S. $80 million of borrowings at approximately 3.5% (plus the interest rate spread based on Torstar’s long-term credit rating, currently 0.6%) through December 2007. The U.S. $80 million was based on the expectation that
26
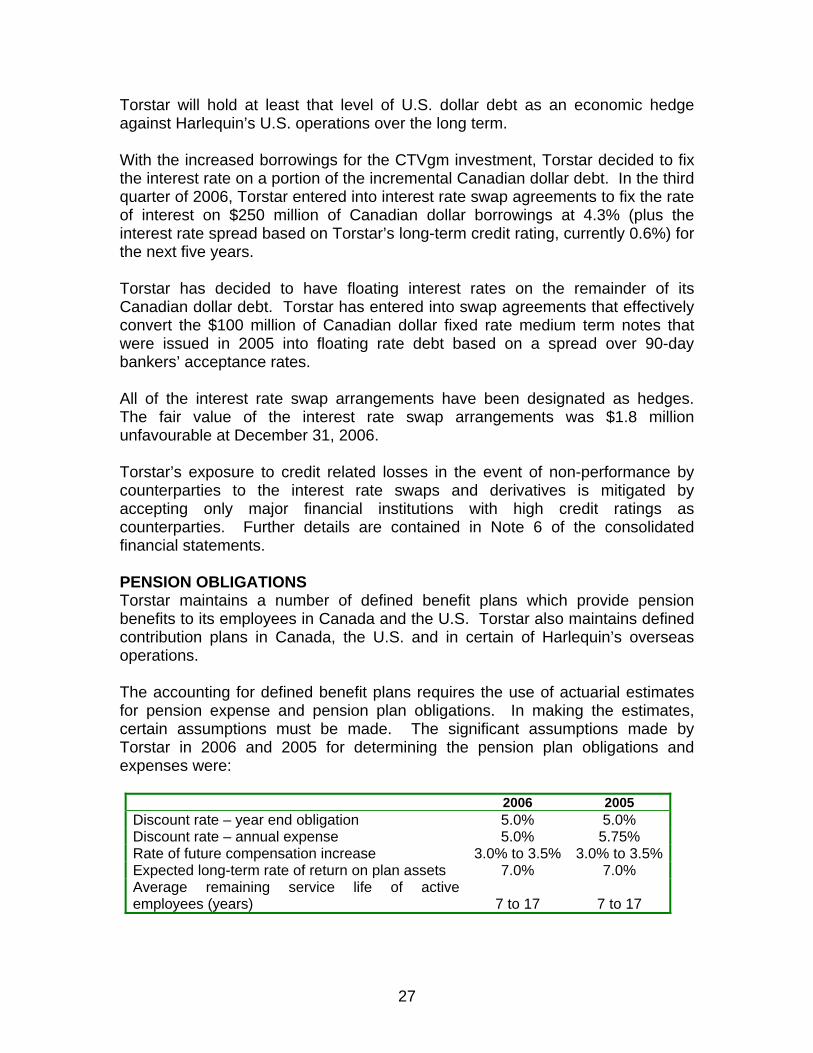
Torstar will hold at least that level of U.S. dollar debt as an economic hedge against Harlequin’s U.S. operations over the long term. With the increased borrowings for the CTVgm investment, Torstar decided to fix the interest rate on a portion of the incremental Canadian dollar debt. In the third quarter of 2006, Torstar entered into interest rate swap agreements to fix the rate of interest on $250 million of Canadian dollar borrowings at 4.3% (plus the interest rate spread based on Torstar’s long-term credit rating, currently 0.6%) for the next five years. Torstar has decided to have floating interest rates on the remainder of its Canadian dollar debt. Torstar has entered into swap agreements that effectively convert the $100 million of Canadian dollar fixed rate medium term notes that were issued in 2005 into floating rate debt based on a spread over 90-day bankers’ acceptance rates. All of the interest rate swap arrangements have been designated as hedges. The fair value of the interest rate swap arrangements was $1.8 million unfavourable at December 31, 2006. Torstar’s exposure to credit related losses in the event of non-performance by counterparties to the interest rate swaps and derivatives is mitigated by accepting only major financial institutions with high credit ratings as counterparties. Further details are contained in Note 6 of the consolidated financial statements. PENSION OBLIGATIONS Torstar maintains a number of defined benefit plans which provide pension benefits to its employees in Canada and the U.S. Torstar also maintains defined contribution plans in Canada, the U.S. and in certain of Harlequin’s overseas operations. The accounting for defined benefit plans requires the use of actuarial estimates for pension expense and pension plan obligations. In making the estimates, certain assumptions must be made. The significant assumptions made by Torstar in 2006 and 2005 for determining the pension plan obligations and expenses were:
2006 2005 Discount rate – year end obligation 5.0% 5.0% Discount rate – annual expense 5.0% 5.75% Rate of future compensation increase 3.0% to 3.5% 3.0% to 3.5%Expected long-term rate of return on plan assets 7.0% 7.0% Average remaining service life of active employees (years)
7 to 17
7 to 17
27
The discount rate of 5.0% is the yield at December 31, 2006 on high quality fixed income investments with maturities that match the expected maturity of the pension obligations (as prescribed by the Canadian Institute of Chartered Accountants (“CICA”)). A one percent increase in the discount rate would result in a decrease in the total pension plan obligation of $92.9 million and a decrease in the current year expense of $6.8 million. A one percent decrease in the discount rate would increase the total pension plan obligation by $106.8 million and increase current year expense by $11.0 million. The rate of future compensation increases has been assumed to be between 3.0% and 3.5%. This rate is consistent with the level of increases over the past few years and is management’s best estimate of future compensation increases. Torstar has maintained its expected long-term rate of return on plan assets at 7%, as management believes it to be a reasonable estimate. The return on plan assets has exceeded this rate for the past three years. A one percent increase (decrease) in the expected return on plan assets would decrease (increase) the current year expense by $6.8 million. The average remaining service life of active employees is used to amortize past service costs from plan improvements and net actuarial gains or losses. Torstar’s estimate of this time period is 7-17 years. This range reflects the current composition of Torstar’s workforce and expectations for staff turnover. The estimate of the average remaining service life is generally reviewed every three years. Torstar’s total pension expense was $14.9 million in 2006, down from $16.4 million in 2005. Total pension funding was $19.5 million in 2006, down from $36.7 million in 2005. Torstar’s pension plans are in a net funded position of $0.3 million at December 31, 2006 compared with a net unfunded position of $42.6 million at the end of 2005. This balance includes $26.1 million ($25.6 million in 2005) for an executive retirement plan, which is not funded until payments are made to the executives upon retirement, but is supported by a letter of credit. Excluding the executive retirement plan, Torstar’s pension plans are in a net funded position of $26.4 million compared with a net unfunded position of $17.0 million in 2005. Torstar also provides post-employment benefits including health and life insurance benefits for certain grandfathered employees, primarily in the Canadian newspaper operations. This obligation is being funded as payments are made to retirees. Torstar has recorded a liability of $54.6 million on its December 31, 2006 balance sheet and an annual expense of $5.0 million ($52.0 million and $3.9 million respectively in 2005). At December 31, 2006 the unfunded obligation for these benefits was $60.0 million, down from $67.8 million at December 31, 2005. The key assumptions for this obligation are the discount
28
rate and the health care cost trends. The discount rate is the same as the prescribed rate for the pension obligation. For health care costs, the estimated trend was for a 9.5% increase for the 2006 expense. For 2007, health care costs are estimated to increase by 10.0% with a 0.5% decrease each year until 2017. A 1% increase in the estimated increase in health care costs would increase the obligation by $3.3 million. The increase in the annual expense would be less than $0.5 million. DISCLOSURE CONTROLS AND PROCEDURES AND INTERNAL CONTROLS OVER FINANCIAL REPORTING As required by Multilateral Instrument 52-109 issued by the Canadian Securities Administrators, Torstar’s Chief Executive Officer (“CEO”) and Chief Financial Officer (“CFO”) will be making certifications related to the information in Torstar’s annual filings (as defined in Multilateral Instrument 52-109) with the securities regulatory authorities. As part of the certification, the CEO and CFO must certify that they are responsible for establishing and maintaining disclosure controls and procedures and have designed such disclosure controls and procedures (or caused such disclosure controls and procedures to be designed under their supervision) to ensure that the material information with respect to Torstar, including its consolidated subsidiaries, is made known to them and that they have evaluated the effectiveness of Torstar’s disclosure controls and procedures as of the end of the period covered by these annual filings. The CEO and CFO must also certify that they have designed a system of internal control over financial reporting to provide reasonable assurance regarding the reliability of financial reporting and the preparation of financial statements for external purposes in accordance with Canadian GAAP. Disclosure controls and procedures are designed to ensure that information required to be disclosed by Torstar in reports filed with securities regulatory authorities is recorded, processed, summarized and reported on a timely basis, and is accumulated and communicated to Torstar’s management, including the CEO and CFO, as appropriate, to allow timely decisions regarding required disclosure. Torstar’s management, including the CEO and CFO, does not expect that Torstar’s disclosure controls will prevent or detect all misstatements due to error or fraud. Because of the inherent limitations in all control systems, an evaluation of control can provide only reasonable, not absolute assurance, that all control issues and instances of fraud or error, if any, within Torstar have been detected. Torstar has adopted or formalized such controls and procedures as it believes are necessary and consistent with its business and internal management and supervisory practices. Torstar is continually improving its systems of controls and procedures. Evaluation of disclosure controls and procedures As of December 31, 2006, under the supervision of, and with the participation of the CEO and CFO, Torstar’s management evaluated the effectiveness of the design and operation of its disclosure controls and procedures. Based on this
29
evaluation, Torstar’s CEO and CFO have concluded that, as at December 31, 2006, the Company’s disclosure controls and procedures were effective. Evaluation of internal controls over financial reporting As of December 31, 2006, under the supervision of, and with the participation of the CEO and CFO, Torstar’s management also evaluated the effectiveness of the design of its internal controls over financial reporting. Based on this evaluation, Torstar’s CEO and CFO have concluded that, as at December 31, 2006, the Company’s internal controls over financial reporting were designed effectively. There have been no changes in Torstar’s internal controls over financial reporting that occurred during the fourth quarter of 2006, the most recent interim period, that have materially affected, or are reasonably likely to materially affect, Torstar’s internal controls over financial reporting. CRITICAL ACCOUNTING POLICIES AND ESTIMATES Torstar prepares its consolidated financial statements in Canadian dollars and in accordance with Canadian GAAP. A summary of Torstar’s significant accounting policies is presented in Note 1 of the consolidated financial statements. Some of Torstar’s accounting policies require subjective, complex judgments and estimates as they relate to matters that are inherently uncertain. Changes in these judgments or estimates could have a significant impact on Torstar’s financial statements. Critical accounting estimates that require management’s judgments include the provision for book returns, valuation of goodwill, accounting for employee future benefits and accounting for income taxes. Provision for book returns Revenue from the sale of books, net of provisions for estimated returns, is recognized for retail sales based on the publication date and for sales made directly to the consumer when the books are shipped and title has transferred. The provision for estimated returns is significant for retail sales where books are sold with a right of return. As revenue is recognized, a provision is recorded for returns. This provision is estimated by management, based primarily on historic sales performance of that type of book and the author. Books are returned over time and are adjusted against the returns provision. On a quarterly basis the actual returns experience is used to assess the adequacy of the provision. The impact of the variance between the original estimate for returns and the actual experience is reported in a period subsequent to the original sale. This can have either a positive (if the actual experience is better than estimated) or negative (if the actual experience is worse) impact on reported results. A change in market conditions can therefore have a compounded effect on the book publishing results. If the market sales are declining, the estimate being made for returns on current period sales will generally be higher and the adjustment to the
30
returns provision for prior period sales is likely to be negative (i.e. the market has softened since the original estimate was made). Series books are on sale for approximately one month and returns are normally received within one year, with more than 95% received within the first six months. Harlequin has been publishing series books for more than 20 years and has significant experience in projecting returns for this business. Single title books are on sale for several months and, as a result, experience a longer return period. The single title publishing program has grown over the past decade. Harlequin’s experience with the returns patterns and methodology used by management to project returns for single title books has also evolved over that time period. For these books, there is more variation in net sale rates between titles, even for the same author. As a result, the estimate for returns on these titles has more variability than that for the series titles. At December 31, 2006, the returns provision deducted from accounts receivable on the consolidated balance sheets was $104 million ($109 million in 2005). A one percent change in the average net sale rate used in calculating the global retail returns provision on sales from July to December 2006 would have resulted in a $4.0 million change in reported 2006 revenue. Valuation of goodwill Under Canadian GAAP, goodwill is not amortized but is assessed for impairment at the reporting unit level at least on an annual basis. Goodwill is assessed for impairment using a two-step approach. The first step is to assess whether the fair value of the reporting unit to which the goodwill is associated is less than its carrying value. If the fair value of the reporting unit is less than the carrying value, the second step is required. The second step is a comparison of the fair value of goodwill to its carrying amount. If the fair value of goodwill is less than its carrying value, goodwill is considered impaired and a charge for impairment must be recognized immediately. Reporting units are identified based on the nature of the business and the level of integration between operations. Torstar uses a market approach to determine the fair value of its reporting units. This approach uses several factors including normalized or projected earnings and price earnings multiples. Comparable transactions are reviewed for appropriate price earnings multiples. The fair value of an asset is defined as the amount at which it could be bought or sold in a current transaction between willing parties. Torstar has completed its annual impairment test and no adjustment for impairment was required. Accounting for employee future benefits The cost of defined benefit pension and other retirement benefits earned by employees is actuarially determined each year based on management’s
31
estimates of the long-term rate of investment return on plan assets and future compensation and health care costs. Management applies judgment in the selection of these estimates, based on regular reviews of historical investment returns, salary increases and health care costs. Expectations regarding future economic trends and business conditions, including inflation rates are also considered. The discount rate used in measuring the liability and expected healthcare costs is prescribed to be equal to the current yield on long-term, high-quality corporate bonds with a duration similar to the duration of the benefit obligation. Management’s estimates, along with a sensitivity analysis of changes in these estimates on both the benefit obligation and the benefit expense are further discussed under “Pension Obligations” in the MD&A and are disclosed in Note 12 of the consolidated financial statements. Accounting for income taxes Future income taxes are recorded to account for the effects of future taxes on transactions occurring in the current period. Management uses judgment and estimates in determining the appropriate rates and amounts to record for future taxes, giving consideration to timing and probability. Previously recorded tax assets and liabilities are adjusted if the expected tax rate is revised based on current information. The recording of future tax assets also requires an assessment of recoverability. A valuation allowance is recorded when Torstar does not believe, based on all available evidence, that it is more likely than not that all of the future tax assets recognized will be realized prior to their expiration. This assessment includes a projection of future year earnings based on historical results and known changes in operations. More information on Torstar’s income taxes is provided in Note 10 of the consolidated financial statements. CHANGES IN ACCOUNTING POLICIES Accounting by a Vendor for Consideration Given to a Customer (EIC-156) This EIC was effective for Torstar’s 2006 fiscal year with retroactive restatement. EIC-156 provides guidance on the classification in the vendor’s financial statements of consideration given to its customers. The guidance determines whether a consideration is to be treated as an adjustment of the selling price or as a cost incurred by the vendor to sell goods or services and the timing of when such amounts should be recorded. The impact of the change for the year ended 2005 was to decrease revenue and operating expenses by $10.1 million for advertiser volume rebates and trade incentives. There was no impact on operating profit or net income.
32
Financial Instruments (Sections 3855, 3861, 3865 and 1530) The CICA has issued four new standards which will be effective prospectively for the company beginning January 1, 2007. Section 3855, “Financial Instruments – Recognition and Measurement”, determines when and at what value a financial instrument is to be recognized on the balance sheet and how gains or losses are to be recorded. Section 3861, “Financial Instruments – Disclosures and Presentation”, provides standards for disclosures and presentation of financial instruments. Section 3865, “Hedges”, specifies how hedge accounting is applied and related disclosure. Section 1530, “Comprehensive Income”, introduces new standards for the presentation and disclosure of comprehensive income and its components. Certain unrealized gains or losses which would otherwise be excluded from the calculation of net income and unrealized foreign currency translation amounts arising from self-sustaining foreign operations will be recorded in a Statement of Other Comprehensive Income. Other comprehensive income will form part of shareholders’ equity. Torstar has interest rate swaps and foreign exchange forward contracts which are accounted for as hedges. Under these new sections, Torstar will be required to recognize changes in their fair values to the extent of hedge effectiveness, as defined by accounting standards, in comprehensive income. Any ineffective portion, as defined by accounting standards, will be recognized in net income. For certain other financial instruments, Torstar will be required to recognize the asset or liability on the balance sheet at its fair values on January 1, 2007 with subsequent changes in fair value recorded in net income for held-for-trading items and in comprehensive income for available-for-sale items. Changes in unrealized foreign exchange gains or losses which arise from the translation of self-sustaining operations subsequent to January 1, 2007 will also be recorded in comprehensive income. Net income is not expected to change significantly as a result of the new accounting standards. However, there may be significant fluctuations in comprehensive income from period to period as financial instruments are adjusted to market value.
33
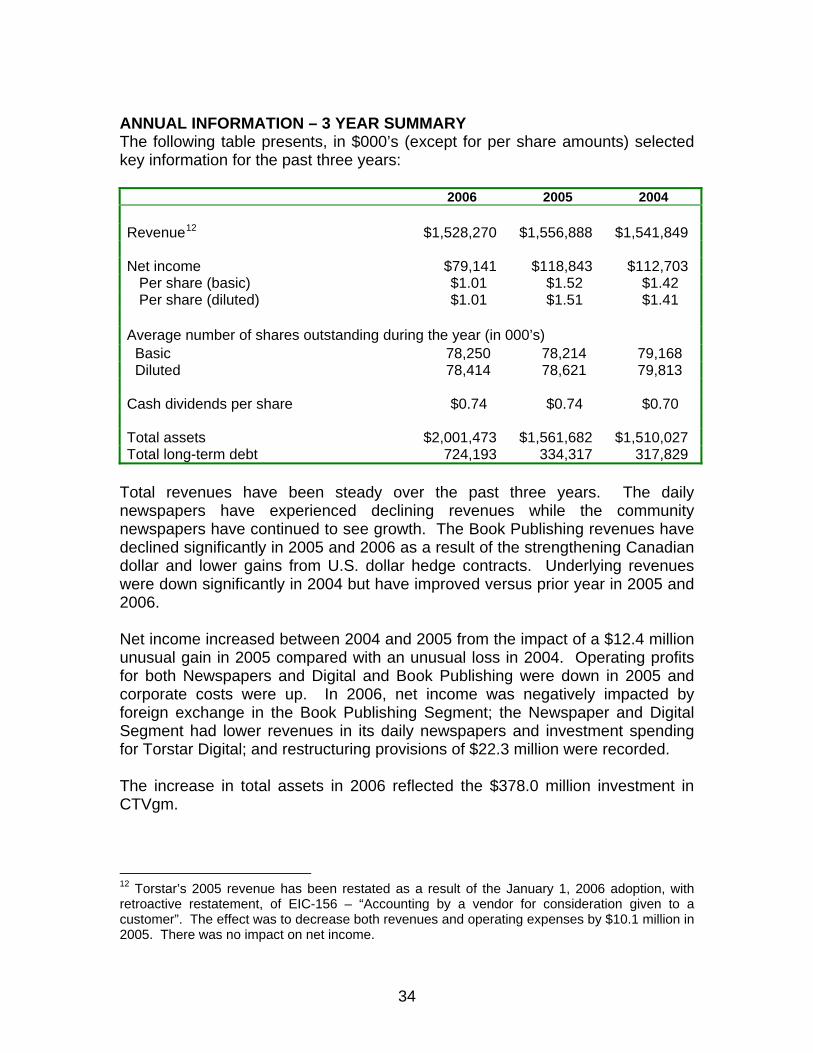
ANNUAL INFORMATION – 3 YEAR SUMMARY The following table presents, in $000’s (except for per share amounts) selected key information for the past three years: 2006 2005 2004 Revenue12 $1,528,270 $1,556,888 $1,541,849
Net income $79,141 $118,843 $112,703 Per share (basic) $1.01 $1.52 $1.42 Per share (diluted) $1.01 $1.51 $1.41
Average number of shares outstanding during the year (in 000’s) Basic 78,250 78,214 79,168 Diluted 78,414 78,621 79,813 Cash dividends per share $0.74 $0.74 $0.70 Total assets $2,001,473 $1,561,682 $1,510,027 Total long-term debt 724,193 334,317 317,829
Total revenues have been steady over the past three years. The daily newspapers have experienced declining revenues while the community newspapers have continued to see growth. The Book Publishing revenues have declined significantly in 2005 and 2006 as a result of the strengthening Canadian dollar and lower gains from U.S. dollar hedge contracts. Underlying revenues were down significantly in 2004 but have improved versus prior year in 2005 and 2006. Net income increased between 2004 and 2005 from the impact of a $12.4 million unusual gain in 2005 compared with an unusual loss in 2004. Operating profits for both Newspapers and Digital and Book Publishing were down in 2005 and corporate costs were up. In 2006, net income was negatively impacted by foreign exchange in the Book Publishing Segment; the Newspaper and Digital Segment had lower revenues in its daily newspapers and investment spending for Torstar Digital; and restructuring provisions of $22.3 million were recorded. The increase in total assets in 2006 reflected the $378.0 million investment in CTVgm.
12 Torstar’s 2005 revenue has been restated as a result of the January 1, 2006 adoption, with retroactive restatement, of EIC-156 – “Accounting by a vendor for consideration given to a customer”. The effect was to decrease both revenues and operating expenses by $10.1 million in 2005. There was no impact on net income.
34
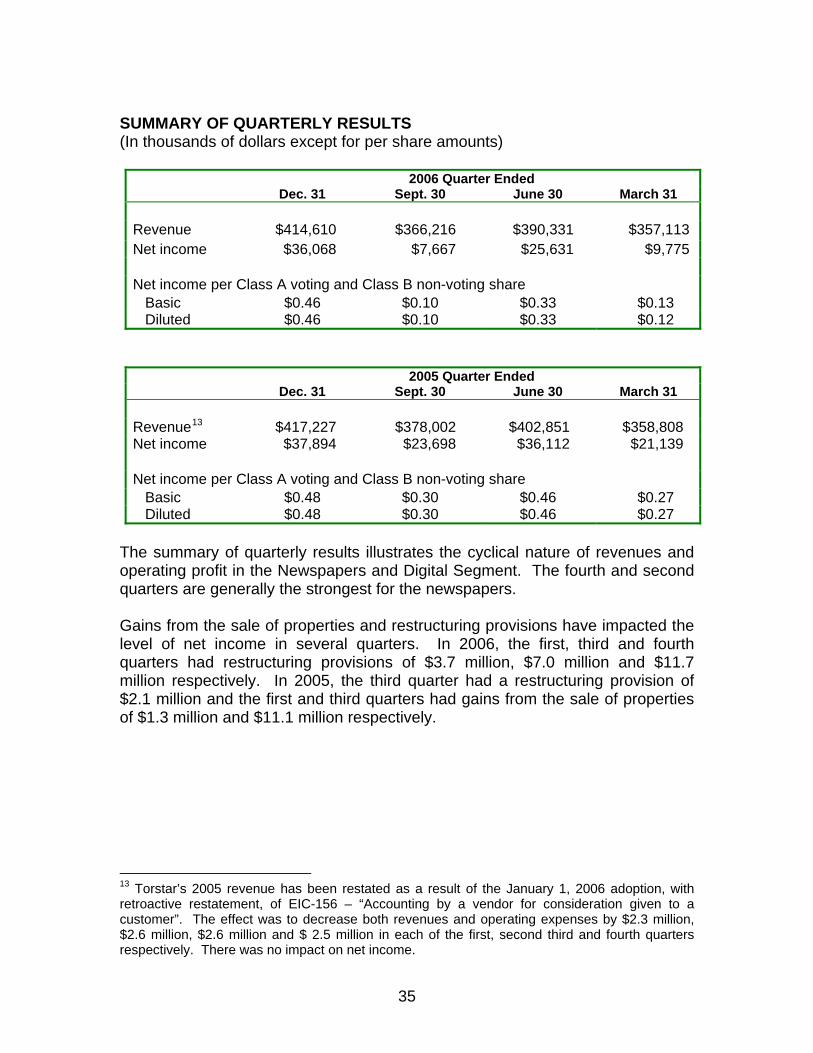
SUMMARY OF QUARTERLY RESULTS (In thousands of dollars except for per share amounts)
2006 Quarter Ended Dec. 31 Sept. 30 June 30 March 31 Revenue $414,610 $366,216 $390,331 $357,113 Net income $36,068 $7,667 $25,631 $9,775 Net income per Class A voting and Class B non-voting share Basic $0.46 $0.10 $0.33 $0.13 Diluted $0.46 $0.10 $0.33 $0.12
2005 Quarter Ended Dec. 31 Sept. 30 June 30 March 31 Revenue13 $417,227 $378,002 $402,851 $358,808 Net income $37,894 $23,698 $36,112 $21,139 Net income per Class A voting and Class B non-voting share Basic $0.48 $0.30 $0.46 $0.27 Diluted $0.48 $0.30 $0.46 $0.27
The summary of quarterly results illustrates the cyclical nature of revenues and operating profit in the Newspapers and Digital Segment. The fourth and second quarters are generally the strongest for the newspapers. Gains from the sale of properties and restructuring provisions have impacted the level of net income in several quarters. In 2006, the first, third and fourth quarters had restructuring provisions of $3.7 million, $7.0 million and $11.7 million respectively. In 2005, the third quarter had a restructuring provision of $2.1 million and the first and third quarters had gains from the sale of properties of $1.3 million and $11.1 million respectively.
13 Torstar’s 2005 revenue has been restated as a result of the January 1, 2006 adoption, with retroactive restatement, of EIC-156 – “Accounting by a vendor for consideration given to a customer”. The effect was to decrease both revenues and operating expenses by $2.3 million, $2.6 million, $2.6 million and $ 2.5 million in each of the first, second third and fourth quarters respectively. There was no impact on net income.
35
RECENT DEVELOPMENTS In February 2007, Torstar and Metro International announced the launch of Metro Calgary on March 5th and Metro Edmonton on April 2nd. The new editions will be distributed through a combination of promoters, street boxes and strategic locations ramping up to a total daily circulation of 60,000 copies per city. OTHER At January 31, 2007, Torstar had 9,909,402 Class A voting shares and 68,564,397 Class B non-voting shares outstanding. More information on Torstar share capital is provided in Note 8 of the consolidated financial statements. At January 31, 2007, Torstar had 5,841,942 options to purchase Class B non-voting shares outstanding to executives and non-executive directors. More information on Torstar’s stock option plan is provided in Note 9 of the consolidated financial statements. Additional information relating to Torstar including the Annual Information Form is available on SEDAR at www.sedar.com.
36