Embed Size (px)
Citation preview
Volume I Final Report
ISSN 0119 - 5336
222000000333 FFFaaammmiiilllyyy IIInnncccooommmeee
aaannnddd EEExxxpppeeennndddiiitttuuurrreee
SSSuuurrrvvveeeyyy
REPUBLIC OF THE PHILIPPINES National Statistics Office
Manila
ISSN 0119 - 5336
2
Volume I Final Report
REPUBLIC OF THE PHILIPPINES National Statistics Office
Manila
22000000333 FFFaaammmiiilllyyy IIInnncccooommmeee
aaannnddd EEExxxpppeeennndddiiitttuuurrreee
SSSuuurrrvvveeeyyy
REPUBLIC OF THE PHILIPPINES
HER EXCELLENCY PRESIDENT GLORIA MACAPAGAL-ARROYO
NATIONAL STATISTICS OFFICE
CARMELITA N. ERICTA
Administrator
PAULA MONINA G. COLLADO Deputy Administrator
ISSN 0119 – 5336
ii 2003 Family Income and Expenditure Survey
FOREWORD The 2003 Family Income and Expenditure Survey (FIES) is a nationwide sample survey conducted by the National Statistics Office (NSO) every three years. The 2003 FIES is the thirteenth in a series of family income and expenditure surveys that have been conducted since March 1957. The Final Report of the 2003 FIES contains statistical tables with information on family income, specifically the total and average income of Filipino families, their sources of income and the degree of income inequality among families. The report also presents levels and patterns of family expenditures. These information are useful inputs to policy makers, planners, researchers, individuals and organizations in their works to improve the socio-economic conditions of the Filipino people. Our profound gratitude goes to the respondents of this survey for without their cooperation to provide us with the information we needed, the production of this report would not have been possible. We also extend our sincerest appreciation to the enumerators for showing dedication to their work. Without their determination to get completed interviews, this survey would not have been a success. Finally, the NSO Central Office and Field Office personnel must be commended for showing their dedication, commitment and untiring support from start to completion of the survey. CARMELITA N. ERICTA Administrator Manila, Philippines October 2007
2003 Family Income and Expenditure Survey iii
TABLE OF CONTENTS Page
FOREWORD . . . . . . . . . . . . . . . . . . . . . . . . . . . . . . . . . . . . . . . . . . . . . . . . . . . . . iii LIST OF TEXTUAL TABLES . . . . . . . . . . . . . . . . . . . . . . . . . . . . . . . . . . . . . . . . vii LIST OF STATISTICAL TABLES . . . . . . . . . . . . . . . . . . . . . . . . . . . . . . . . . . . . . ix EXPLANATORY TEXT . . . . . . . . . . . . . . . . . . . . . . . . . . . . . . . . . . . . . . . . . . . . . xi
I. Introduction . . . . . . . . . . . . . . . . . . . . . . . . . . . . . . . . . . . . . . . . . . . . . . . . xi
A. Objectives of the Survey . . . . . . . . . . . . . . . . . . . . . . . . . . . . . . . . . . . . xi
B. Authority for the Survey and Confidentiality of Data . . . . . . . . . . . . . . . xi
C. Scope and Coverage . . . . . . . . . . . . . . . . . . . . . . . . . . . . . . . . . . . . . . xii
II. Survey Design . . . . . . . . . . . . . . . . . . . . . . . . . . . . . . . . . . . . . . . . . . . . . . xii
A. Population Coverage . . . . . . . . . . . . . . . . . . . . . . . . . . . . . . . . . . . . . . xii
B. Sampling Design . . . . . . . . . . . . . . . . . . . . . . . . . . . . . . . . . . . . . . . . . . xii 1. Domain. . . . . . . . . . . . . . . . . . . . . . . . . . . . . . . . . . . . . . . . . . . . . . . xiii 2. Sampling Frame . . . . . . . . . . . . . . . . . . . . . . . . . . . . . . . . . . . . . . . xiii 3. Stratification . . . . . . . . . . . . . . . . . . . . . . . . . . . . . . . . . . . . . . . . . . xiii 4. Sample Selection . . . . . . . . . . . . . . . . . . . . . . . . . . . . . . . . . . . . . . xiv 5. Sample Size . . . . . . . . . . . . . . . . . . . . . . . . . . . . . . . . . . . . . . . . . . xv
C. Estimation Procedure . . . . . . . . . . . . . . . . . . . . . . . . . . . . . . . . . . . . . xv
1. Base Weights . . . . . . . . . . . . . . . . . . . . . . . . . . . . . . . . . . . . . . . . . xv 2. Non-response Adjustments . . . . . . . . . . . . . . . . . . . . . . . . . . . . . . . xvi 3. Population Weighting Adjustments . . . . . . . . . . . . . . . . . . . . . . . . . xvii 4. Final Survey Weight . . . . . . . . . . . . . . . . . . . . . . . . . . . . . . . . . . . . xvii
D. Questionnaire Design . . . . . . . . . . . . . . . . . . . . . . . . . . . . . . . . . . . . . . xviii
E. Method of Data Collection . . . . . . . . . . . . . . . . . . . . . . . . . . . . . . . . . . xviii
F. Data Processing System . . . . . . . . . . . . . . . . . . . . . . . . . . . . . . . . . . . xix
G. Survey Non-response . . . . . . . . . . . . . . . . . . . . . . . . . . . . . . . . . . . . . . xix
III. Limitations of the Data . . . . . . . . . . . . . . . . . . . . . . . . . . . . . . . . . . . . . . . xx HIGHLIGHTS OF THE 2003 FIES RESULTS . . . . . . . . . . . . . . . . . . . . . . . . . . . . xxiii TEXTUAL TABLES . . . . . . . . . . . . . . . . . . . . . . . . . . . . . . . . . . . . . . . . . . . . . . . . xxix
2003 Family Income and Expenditure Survey v
STATISTICAL TABLES . . . . . . . . . . . . . . . . . . . . . . . . . . . . . . . . . . . . . . . . . . . . . 1
APPENDICES
Appendix A. Definitions and Explanations . . . . . . . . . . . . . . . . . . . . . . . . . . 61
Appendix B. List of 2003 FIES Additional Tables . . . . . . . . . . . . . . . . . . . . . 67
Appendix C. List of Previous FIES Publication . . . . . . . . . . . . . . . . . . . . . . . 69
Appendix D. The 2003 FIES Questionnaire . . . . . . . . . . . . . . . . . . . . . . . . . . 70
vi 2003 Family Income and Expenditure Survey
LIST OF TEXTUAL TABLES Table No. Title Page No.
1A Number of Families and Total Family Income at Current Prices, by Region: 2000 and 2003 . . . . . . . . . . . . . . . . . . . . . . . . . . . . . . .
xxxi
1B Number of Families and Total Family Income at 2000 Prices, by Region: 2000 and 2003 . . . . . . . . . . . . . . . . . . . . . . . . . . . . . . .
xxxi
1C Total Family Expenditure at Current Prices, by Region: 2000 and 2003 . . . . . . . . . . . . . . . . . . . . . . . . . . . . . . . . . . . . . . . . .
xxxii
1D Total Family Expenditure at 2000 Prices, by Region: 2000 and 2003 . . . . . . . . . . . . . . . . . . . . . . . . . . . . . . . . . . . . . . . . .
xxxii
2A Total Family Income and Growth Rate at Current Prices, by Region: 2000 and 2003 . . . . . . . . . . . . . . . . . . . . . . . . . . . . . . .
xxxiii
2B Total Family Income and Growth Rate at 2000 Prices, by Region: 2000 and 2003 . . . . . . . . . . . . . . . . . . . . . . . . . . . . . . .
xxxiii
2C Total Family Expenditure and Growth Rate at Current Prices, by Region: 2000 and 2003 . . . . . . . . . . . . . . . . . . . . . . . . . . . . . . .
xxxiv
2D Total Family Expenditure and Growth Rate at 2000 Prices, by Region: 2000 and 2003 . . . . . . . . . . . . . . . . . . . . . . . . . . . . . . .
xxxiv
3A Average Income, Average Expenditure and Average Savings of Families at Current Prices, by Region: 2000 and 2003. . . . . . . .
xxxv
3B Average Income, Average Expenditure and Average Savings of Families at 2000 Prices, by Region: 2000 and 2003 . . . . . . . . .
xxxv
3C Average Family Income and Growth Rate at Current Prices, by Region: 2000 and 2003 . . . . . . . . . . . . . . . . . . . . . . . . . . . . . . .
xxxvi
3D Average Family Income and Growth Rate at 2000 Prices, by Region: 2000 and 2003 . . . . . . . . . . . . . . . . . . . . . . . . . . . . . . .
xxxvi
4A Total Income, Total Expenditure and Total Savings of Families at Current Prices, by Income Decile: 2000 and 2003. . . . . . . . . . . .
xxxvii
4B Total Income, Total Expenditure and Total Savings of Families at 2000 Prices, by Income Decile: 2000 and 2003. . . . . . . . . . . . . .
xxxvii
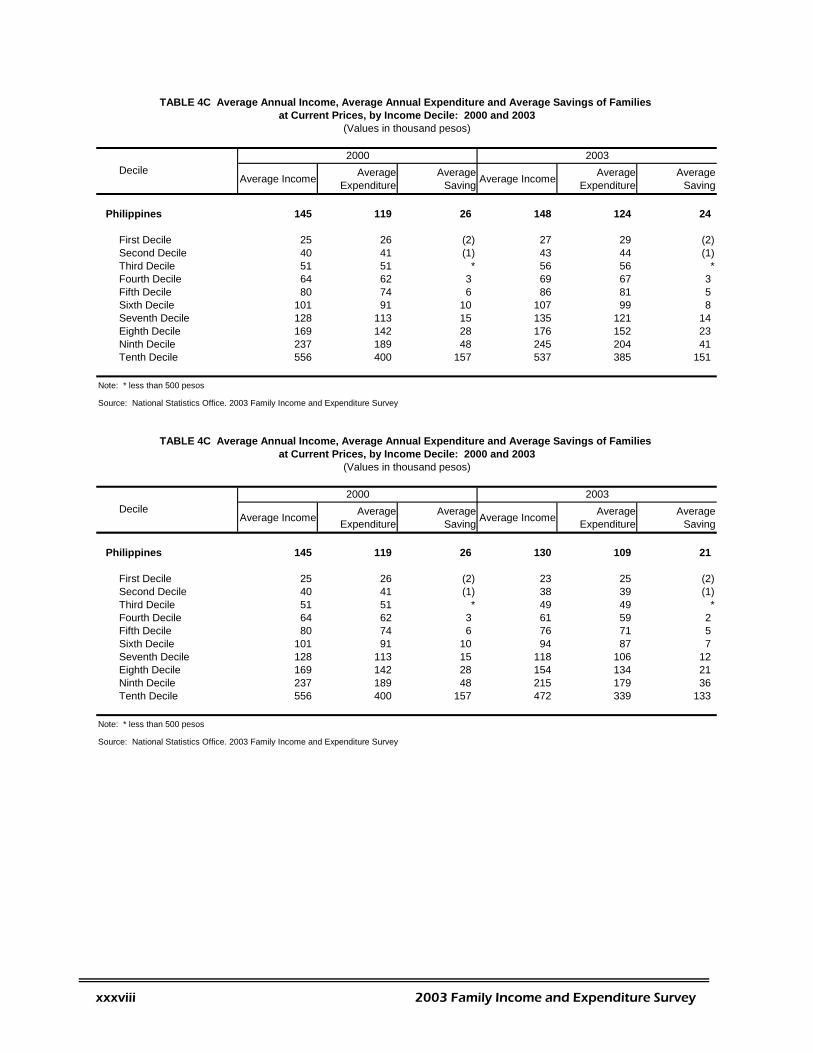
4C Average Annual Income, Average Annual Expenditure and Average Savings of Families at Current Prices, by Income Decile: 2000 and 2003 . . . . . . . . . . . . . . . . . . . . . . . . . . . . . . . . .
xxxviii
2003 Family Income and Expenditure Survey vii
4D Average Annual Income, Average Annual Expenditure and Average Savings of Families at 2000 Prices, by Income Decile: 2000 and 2003 . . . . . . . . . . . . . . . . . . . . . . . . . . . . . . . . .
xxxviii
5 Gini Concentration Ratio, by Region: 2000 and 2003 . . . . . . . . . . xxxix
6 Consumer Price Index by Region: 2000 and 2003 . . . . . . . . . . . . . xxxix
7 Total Family Expenditure by Major Expenditure Group, Philippines: 2000 and 2003 . . . . . . . . . . . . . . . . . . . . . . . . . . . . . .
xl
viii 2003 Family Income and Expenditure Survey
LIST OF STATISTICAL TABLES
Table No. Title Page No.
1 Number of Families, Total and Average Annual Family Income and Expenditure by Region: 2003. . . . . . . . . . . . . . . . . . . . . . . . . . . . . . .
1
2 Total and Average Annual Family Income and Expenditure by Income Class and by Region: 2003 . . . . . . . . . . . . . . . . . . . . . . . . . .
2
3 Total and Average Annual Family Income and Expenditure by Expenditure Class and by Region: 2003 . . . . . . . . . . . . . . . . . . . . . . .
6
4 Total and Average Family Income and Expenditure by Family Size and by Region: 2003. . . . . . . . . . . . . . . . . . . . . . . . . . . . . . . . . . . . . . . . .
10
5 Average Annual Family Income and Expenditure by Family Size, by Income Class and by Region: 2003 . . . . . . . . . . . . . . . . . . . . . . . . . . .
15
6 Total Annual Family Income and Expenditure and Percent Distribution by Income Decile: 2003 . . . . . . . . . . . . . . . . . . . . . . . . . . . . . . . . . . . . . .
20
7 Mean and Median Family Income and Expenditure by Income Decile: 2003 . . . . . . . . . . . . . . . . . . . . . . . . . . . . . . . . . . . . . .
26
8 Distribution of Families by Main Source of Income by Income Class and by Region: 2003. . . . . . . . . . . . . . . . . . . . . . . . . . . . . . . . . . . . . . . . .
32
9 Total Annual Family Expenditure by Expenditure Group by Income Class and by Region: 2003 . . . . . . . . . . . . . . . . . . . . . . . . . . . . . . . . . . . . . . . .
36
10 Total Annual Receipts and Disbursements by Income Class and by Region: 2003 . . . . . . . . . . . . . . . . . . . . . . . . . . . . . . . . . . . . . . . .
48
11 Standard Error and Confidence Interval of Selected Estimates by Region: 2003 . . . . . . . . . . . . . . . . . . . . . . . . . . . . . . . . . . . . . . . . . . . .
52
2003 Family Income and Expenditure Survey ix

EXPLANATORY TEXT
I. INTRODUCTION
A. Objectives of the Survey
The 2003 Family Income and Expenditure Survey (FIES) had the following primary objectives:
1) to gather data on family income and family expenditure and related information
affecting income and expenditure levels and patterns in the Philippines; 2) to determine the sources of income and income distribution, levels of living and
spending patterns, and the degree of inequality among families; 3) to provide benchmark information to update weights for the estimation of
consumer price index; and 4) to provide information for the estimation of the country’s poverty threshold and
incidence. B. Authority for the Survey and Confidentiality of Data
The authority for the survey emanates from Commonwealth Act (CA) No. 591, which authorized the National Statistics Office (NSO), under Section 2(d), “to conduct by enumeration, sampling or other methods, for statistical purposes, studies of social and economic problems of the country”. More recently, Executive Order No. 121 otherwise known as the Reorganization Act of the Philippine Statistical System, which was passed on January 30, 1987, declared that the NSO shall be the major statistical agency responsible for generating general purpose statistics and for undertaking such censuses and surveys as may be designated by the National Statistical Coordination Board (NSCB). Like all other surveys undertaken by the NSO, the data gathered in the 2003 FIES are held STRICTLY CONFIDENTIAL. Data are used for statistical purposes only and published in summary forms. As provided for in Section 4 of CA 591, the data will not be used for taxation, investigation or enforcement purposes.
2003 Family Income and Expenditure Survey xi
C. Scope and Coverage
Data gathered in the survey include sources of income in cash and in kind and the level of consumption by item of expenditure. Related information such as family size, number of family members employed for pay or profit (wage/salary or own-account workers), occupation, age and educational attainment of household head, and housing characteristics were also included. The survey involved the interview of a national sample of about 51,000 sample households deemed sufficient to provide reliable estimates of income and expenditure at the national and regional level. The sample households covered in the survey were the same households interviewed in the July 2003 and January 2004 rounds of the Labor Force Survey (LFS). The reporting unit was the household which implied that the statistics emanating from this survey referred to the characteristics of the population residing in private households. Institutional population is not within the scope of the survey.
For FIES, the concept of family was used. A family consists of the household head, spouse, unmarried children, ever-married children, son-in-law/daughter-in-law, parents of the head/spouse and other relatives who are members of the household. In addition, two or more persons not related to each other by blood, marriage or adoption are also considered in this survey. However, only the income and expenditure of the member who is considered as the household head are included.
II. SURVEY DESIGN A. Population Coverage
The 2003 FIES has as its target population, all households and members of households nationwide. A household is defined as an aggregate of persons, generally but not necessarily bound by ties of kinship, who live together under the same roof and eat together or share in common the household food. Household membership comprises the head of the household, relatives living with him such as his/her spouse, children, parent, brother/sister, son-in-law/daughter-in-law, grandson/granddaughter and other relatives. Household membership likewise includes boarders, domestic helpers and non-relatives. A person who lives alone is considered a separate household. Excluded in the target population are households in the least accessible barangays (LABs). A barangay is classified as LAB if: (a) it requires more than eight hours walk from the last vehicle station; and/or, (b) the frequency of transportation is less than three times a week and the cost of a one-way trip is more than five hundred pesos. A total of 350 barangays were classified as LABs. This number accounts for only 0.83% of the total number of barangays in the country. The total number of households in these areas account for only 0.38% of the total number of households.
xii 2003 Family Income and Expenditure Survey
B. Sampling Design The 2003 FIES used the sampling design of the 2003 Master Sample (MS) for household surveys starting in July 2003. 1. Domain
The 2003 MS considers the country’s 17 administrative regions as defined in Executive Orders (EO) 36 and 131 as the sampling domains. A domain is referred to as a subdivision of the country for which estimates with adequate level of precision are generated. It must be noted that while there is demand for data at the provincial level (and to some extent municipal and barangay levels), the provinces were not treated as sampling domains because there are more than 80 provinces which would entail a large resource requirement. Below are the 17 administrative regions of the country:
National Capital Region Region VII – Central Visayas Cordillera Administrative Region Region VIII – Eastern Visayas Region I - Ilocos Region IX – Zamboanga Peninsula Region II – Cagayan Valley Region X – Northern Mindanao Region III – Central Luzon Region XI – Davao Region IVA – CALABARZON Region XII – SOCCSKSARGEN Region IVB – MIMAROPA Region XIII – Caraga Region V – Bicol Autonomous Region in Muslim Mindanao Region VI – Western Visayas
2. Sampling Frame
As in most household surveys, the 2003 MS made use of an area sample design. For this purpose, the Enumeration Area Reference File (EARF) of the 2000 Census of Population and Housing (CPH) was utilized as sampling frame. The EARF contains the number of households by enumeration area (EA) in each barangay. This frame was used to form the primary sampling units (PSUs). With consideration of the period for which the 2003 MS will be in use, the PSUs were formed/defined as a barangay or a combination of barangays with at least 500 households.
3. Stratification
The 2003 MS considers the 17 regions of the country as the primary strata. Within each region, further stratification was performed using geographic groupings such as provinces, highly urbanized cities (HUCs), and independent component cities (ICCs). Within each of these substrata formed within regions, the PSUs were further stratified, to the extent possible, using the proportion of strong houses (PSTRONG), indicator of engagement in agriculture of the area (AGRI), and a measure of per capita income (PERCAPITA) as stratification factors. PSTRONG is defined to be the percentage of occupied housing units that are classified as made of strong materials for both the roof and outer walls, based on the data from the 2000 CPH. A roof is considered made of strong materials if it is made
2003 Family Income and Expenditure Survey xiii
of either galvanized iron, aluminum, concrete/clay tile, half galvanized-half concrete, or asbestos. The outer wall is considered made of strong materials if it is made of concrete, brick, stone, wood, half concrete-half wood, galvanized iron, asbestos or glass. AGRI was determined in the following way: initially, an indicator variable was computed at the barangay level. That variable has the value 1 if more than 50 percent of the households in the barangay were engaged in agriculture or fisheries and 0 otherwise, based on the 2000 CPH Barangay Schedule. To obtain a measure at the PSU level, a weighted average of the barangay indicator variable was computed for all the barangays within the PSU, weighted by the total number of households in the barangay. Thus, the value of AGRI at the PSU level lies between 0 and 1. PERCAPITA is defined as the total income of the municipality divided by the total population in that municipality. Note that the PERCAPITA value of the PSUs is the same if the PSUs belong to the same municipality. The data on municipal income refer to year 2000 and were taken from the Department of Finance. However, if the 2000 municipal income was not reported to the Bureau of Local Government Finance (BLGF), 2001 income was used. If no 2000 or 2001 municipal income was reported, the income classification from the BLGF for this municipality was obtained. Using the data on municipal income, which are presented in income intervals, the average of the lower and the upper values of the income interval for the municipal class to which this municipality belongs were determined.
4. Sample Selection
The 2003 MS consists of a sample of 2,835 PSUs. The entire MS was divided into four sub-samples or independent replicates, such as a quarter sample contains one fourth of the total PSUs; a half sample contains one-half of the four sub-samples or equivalent to all PSUs in two replicates. The final number of sample PSUs for each domain was determined by first classifying PSUs as either self-representing (SR) or non-self-representing (NSR). In addition, to facilitate the selection of sub-samples, the total number of NSR PSUs in each region was adjusted to make it a multiple of 4. SR PSUs refers to a very large PSU in the region/domain with a selection probability of approximately 1 or higher and is outright included in the MS; it is properly treated as a stratum; also known as certainty PSU. NSR PSUs refers to a regular too small sized PSU in a region/domain; also known as non certainty PSU. The 2003 MS consists of 330 certainty PSUs and 2,505 non-certainty PSUs. To have some control over the sub-sample size, the PSUs were selected with probability proportional to some estimated measure of size. The size measure refers to the total number of households from the 2000 CPH. Because of the wide variation in PSU sizes, PSUs with selection probabilities greater than 1 were identified and were included in the sample as certainty selections. At the second stage, enumeration areas (EAs) were selected within sampled PSUs, and at the third stage, housing units were selected within sampled EAs.
xiv 2003 Family Income and Expenditure Survey
Generally, all households in sampled housing units were enumerated, except for few cases when the number of households in a housing unit exceeds three. In which case, a sample of three households in a sampled housing unit was selected at random with equal probability. An EA is defined as an area with discernable boundaries within barangays consisting of about 150 contiguous households. These EAs were identified during the 2000 CPH. A housing unit, on the other hand, is a structurally separate and independent place of abode which, by the way it has been constructed, converted, or arranged, is intended for habitation by a household.
5. Sample Size The 2003 FIES involved the interview of a national sample of about 51,000 sample households deemed sufficient to gather data on family income and family expenditure and related information affecting income and expenditure levels and patterns in the Philippines at the national and regional level. The sample households covered in the survey were the same households interviewed in the July 2003 and January 2004 round of the LFS.
C. Estimation Procedure
In the 2003 Master Sample Design, the probability that a household is included in the sample varies across domains/regions. However, the sampling design is epsem within domain (i.e. equal selection probabilities within region). The initial step in the construction of weights is to determine the unit’s base weight. This is defined as the inverse of its selection probabilities. The base weight is further adjusted to take into account possible non-response and possibly to make the estimates conform to some known population totals.
1. Base Weights
In general, the base weight assigned to a sampled unit is the inverse of its selection probability. In particular, the base weight is computed as the inverse of equations 1 Non Self Representing (NSR) and 2 Self Representing (SR) below:
d
dd
h
h
h
h
h
h
hh
hh
Nn
fKk
MMM
MMa
hP c ==Σ
=αβγ
αβγ
αβ
α
α
αβ
αα
αααβγ ...)(
(1)
d
dd
h
h
h
h
h
hh
Nn
fKk
MMMb
hP c ===αβγ
αβγ
αβ
α
α
αβααβγ ..)( (2)
where: h stratum index α index denoting the PSU β index denoting the EA
2003 Family Income and Expenditure Survey xv
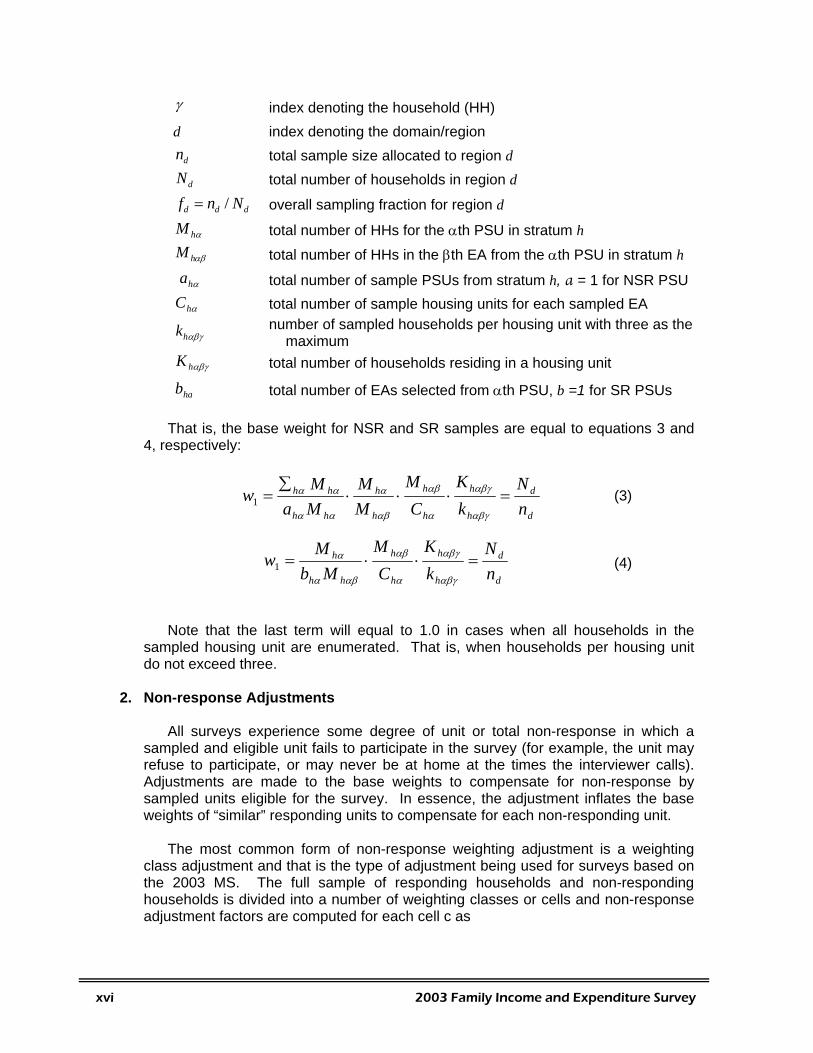
γ index denoting the household (HH) d index denoting the domain/region
dn total sample size allocated to region d
dN total number of households in region d /d d df n N= overall sampling fraction for region d
αhM total number of HHs for the αth PSU in stratum h
hM αβ total number of HHs in the βth EA from the αth PSU in stratum h αha total number of sample PSUs from stratum h, a = 1 for NSR PSU total number of sample housing units for each sampled EA
αβγhk number of sampled households per housing unit with three as the maximum
αβγhK total number of households residing in a housing unit
hab total number of EAs selected from αth PSU, b =1 for SR PSUs
C αh
That is, the base weight for NSR and SR samples are equal to equations 3 and
4, respectively:
d
d
h
h
h
h KMMM∑ αβγαβ
h
h
hh
hh
nN
kCMMaw =⋅⋅⋅=
αβγααβ
α
αα
αα1 (3)
d
d
h
h
h
h
hh
h
nN
kK
CM
MbM
w =⋅⋅=αβγ
αβγ
α
αβ
αβα
α1 (4)
Note that the last term will equal to 1.0 in cases when all households in the sampled housing unit are enumerated. That is, when households per housing unit do not exceed three.
2. Non-response Adjustments
All surveys experience some degree of unit or total non-response in which a sampled and eligible unit fails to participate in the survey (for example, the unit may refuse to participate, or may never be at home at the times the interviewer calls). Adjustments are made to the base weights to compensate for non-response by sampled units eligible for the survey. In essence, the adjustment inflates the base weights of “similar” responding units to compensate for each non-responding unit. The most common form of non-response weighting adjustment is a weighting class adjustment and that is the type of adjustment being used for surveys based on the 2003 MS. The full sample of responding households and non-responding households is divided into a number of weighting classes or cells and non-response adjustment factors are computed for each cell c as
xvi 2003 Family Income and Expenditure Survey
∑∑
∑∑ ∑
∈
∈
∈
∈ ∈ =+
=
rcidi
scidi
rcidi
rci mcjdjdi
c w
w
w
www '
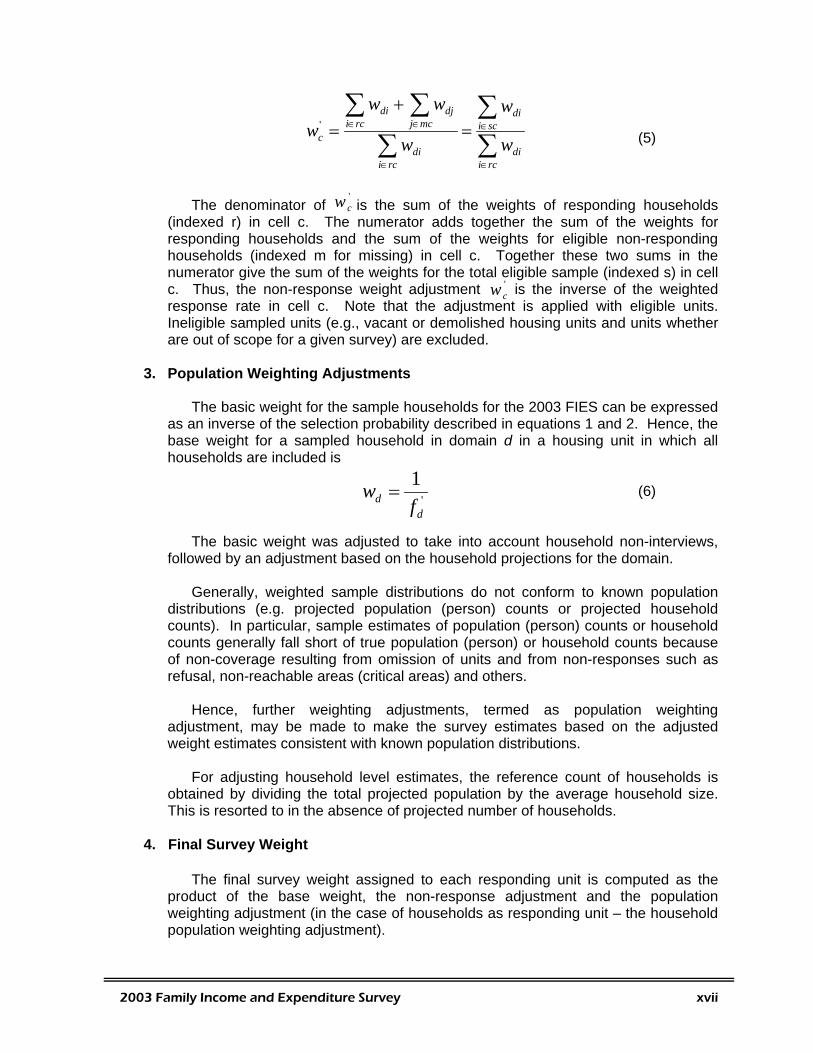
(5) The denominator of is the sum of the weights of responding households (indexed r) in cell c. The numerator adds together the sum of the weights for responding households and the sum of the weights for eligible non-responding households (indexed m for missing) in cell c. Together these two sums in the numerator give the sum of the weights for the total eligible sample (indexed s) in cell c. Thus, the non-response weight adjustment is the inverse of the weighted response rate in cell c. Note that the adjustment is applied with eligible units. Ineligible sampled units (e.g., vacant or demolished housing units and units whether are out of scope for a given survey) are excluded.
'cw
'cw
3. Population Weighting Adjustments
The basic weight for the sample households for the 2003 FIES can be expressed as an inverse of the selection probability described in equations 1 and 2. Hence, the base weight for a sampled household in domain d in a housing unit in which all households are included is
'1
dd f
w = (6)
The basic weight was adjusted to take into account household non-interviews, followed by an adjustment based on the household projections for the domain. Generally, weighted sample distributions do not conform to known population distributions (e.g. projected population (person) counts or projected household counts). In particular, sample estimates of population (person) counts or household counts generally fall short of true population (person) or household counts because of non-coverage resulting from omission of units and from non-responses such as refusal, non-reachable areas (critical areas) and others. Hence, further weighting adjustments, termed as population weighting adjustment, may be made to make the survey estimates based on the adjusted weight estimates consistent with known population distributions. For adjusting household level estimates, the reference count of households is obtained by dividing the total projected population by the average household size. This is resorted to in the absence of projected number of households.
4. Final Survey Weight The final survey weight assigned to each responding unit is computed as the product of the base weight, the non-response adjustment and the population weighting adjustment (in the case of households as responding unit – the household population weighting adjustment).
2003 Family Income and Expenditure Survey xvii
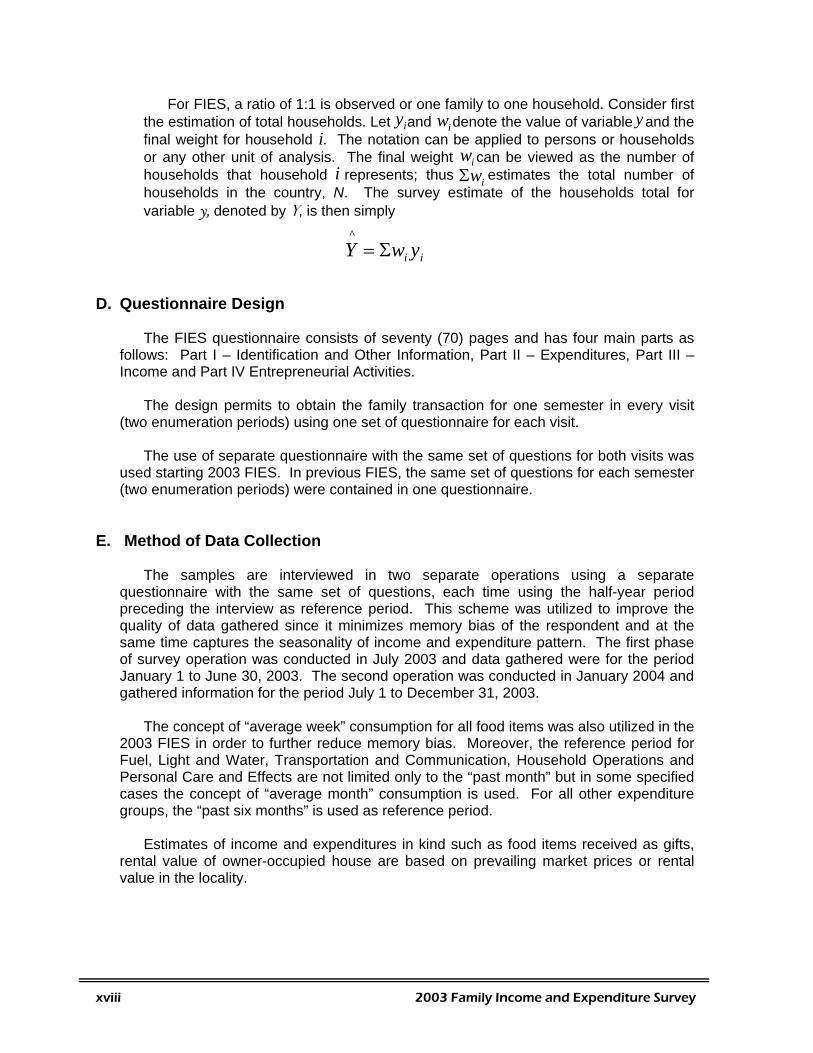
For FIES, a ratio of 1:1 is observed or one family to one household. Consider first the estimation of total households. Let and denote the value of variable and the final weight for household . The notation can be applied to persons or households or any other unit of analysis. The final weight can be viewed as the number of households that household represents; thus estimates the total number of households in the country, N. The survey estimate of the households total for variable y, denoted by Y, is then simply
iy w yi
iwi
i
iwΣ
ii ywY Σ=^
D. Questionnaire Design
The FIES questionnaire consists of seventy (70) pages and has four main parts as follows: Part I – Identification and Other Information, Part II – Expenditures, Part III – Income and Part IV Entrepreneurial Activities. The design permits to obtain the family transaction for one semester in every visit (two enumeration periods) using one set of questionnaire for each visit. The use of separate questionnaire with the same set of questions for both visits was used starting 2003 FIES. In previous FIES, the same set of questions for each semester (two enumeration periods) were contained in one questionnaire.
E. Method of Data Collection
The samples are interviewed in two separate operations using a separate questionnaire with the same set of questions, each time using the half-year period preceding the interview as reference period. This scheme was utilized to improve the quality of data gathered since it minimizes memory bias of the respondent and at the same time captures the seasonality of income and expenditure pattern. The first phase of survey operation was conducted in July 2003 and data gathered were for the period January 1 to June 30, 2003. The second operation was conducted in January 2004 and gathered information for the period July 1 to December 31, 2003. The concept of “average week” consumption for all food items was also utilized in the 2003 FIES in order to further reduce memory bias. Moreover, the reference period for Fuel, Light and Water, Transportation and Communication, Household Operations and Personal Care and Effects are not limited only to the “past month” but in some specified cases the concept of “average month” consumption is used. For all other expenditure groups, the “past six months” is used as reference period. Estimates of income and expenditures in kind such as food items received as gifts, rental value of owner-occupied house are based on prevailing market prices or rental value in the locality.
xviii 2003 Family Income and Expenditure Survey
F. Data Processing System
The 2003 FIES questionnaire contains about 800 data items and a summary for comparing income and expenditures. The questionnaires were subjected to a rigorous manual and machine edit checks for completeness, arithmetic accuracy, range validity and internal consistency. The major steps in the machine processing are as follows:
1. Data Entry 2. Completeness Check 3. Matching of visit records
4. Consistency and Macro Edit (Big Edit) 5. Generation of the Public Use File 6. Tabulation
Steps 1 to 2 were done right after each visit. The remaining steps were carried out only after the second visit had been completed. Steps 1 to 4 were done at the Regional Office while Steps 5 and 6 were completed in the Central Office. After completing Steps 1 to 4, data files were transmitted to the Central Office where a summary file was generated. The summary file was used to produce the consistency tables as well as the preliminary and textual tables. When the generated tables showed inconsistencies, selected data items were subjected to further scrutiny and validation. The cycle of generation of consistency tables and data validation were done until questionable data items were verified. The FAME (FIES computer-Aided Consistency and Macro Editing), an interactive Windows-based application system was used in data processing. This system was used starting with the 2000 FIES round. The interactive module of FAME enabled the following activities to be done simultaneously.
a) Matching of visit records b) Consistency and macro edit (big edit) c) Range check
The improved system minimized processing time as well as minimized, if not eliminated, the need for paper to generate the reject listing.
G. Survey Non-response As in all surveys, two types of non-response were encountered in the 2003 FIES: interview non-response and item non-response. Interview non-response refers to a sample household that could not be interviewed. Since the survey requires that the sample households be interviewed in both visits, households that transferred to another dwelling unit, temporarily away, on vacation, not at home, household unit demolished, destroyed by fire/typhoon and refusal to be interviewed in the second visit contributed to the number of interview non-response cases.
2003 Family Income and Expenditure Survey xix
Total Sample Households Visit 1 Visit 2
Total Eligible Households
Total Responding Households
Response Rate
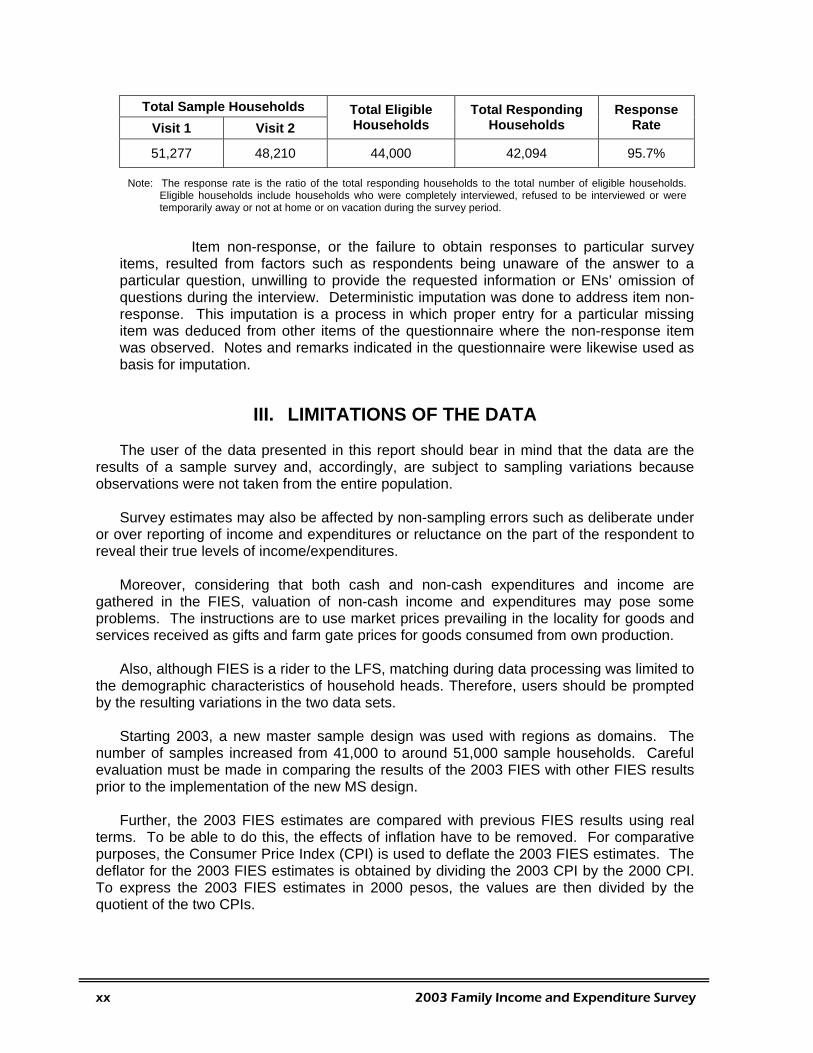
51,277 48,210 44,000 42,094 95.7% Note: The response rate is the ratio of the total responding households to the total number of eligible households.
Eligible households include households who were completely interviewed, refused to be interviewed or were temporarily away or not at home or on vacation during the survey period.
Item non-response, or the failure to obtain responses to particular survey items, resulted from factors such as respondents being unaware of the answer to a particular question, unwilling to provide the requested information or ENs’ omission of questions during the interview. Deterministic imputation was done to address item non-response. This imputation is a process in which proper entry for a particular missing item was deduced from other items of the questionnaire where the non-response item was observed. Notes and remarks indicated in the questionnaire were likewise used as basis for imputation.
III. LIMITATIONS OF THE DATA The user of the data presented in this report should bear in mind that the data are the results of a sample survey and, accordingly, are subject to sampling variations because observations were not taken from the entire population. Survey estimates may also be affected by non-sampling errors such as deliberate under or over reporting of income and expenditures or reluctance on the part of the respondent to reveal their true levels of income/expenditures. Moreover, considering that both cash and non-cash expenditures and income are gathered in the FIES, valuation of non-cash income and expenditures may pose some problems. The instructions are to use market prices prevailing in the locality for goods and services received as gifts and farm gate prices for goods consumed from own production. Also, although FIES is a rider to the LFS, matching during data processing was limited to the demographic characteristics of household heads. Therefore, users should be prompted by the resulting variations in the two data sets. Starting 2003, a new master sample design was used with regions as domains. The number of samples increased from 41,000 to around 51,000 sample households. Careful evaluation must be made in comparing the results of the 2003 FIES with other FIES results prior to the implementation of the new MS design. Further, the 2003 FIES estimates are compared with previous FIES results using real terms. To be able to do this, the effects of inflation have to be removed. For comparative purposes, the Consumer Price Index (CPI) is used to deflate the 2003 FIES estimates. The deflator for the 2003 FIES estimates is obtained by dividing the 2003 CPI by the 2000 CPI. To express the 2003 FIES estimates in 2000 pesos, the values are then divided by the quotient of the two CPIs.
xx 2003 Family Income and Expenditure Survey
Careful evaluation must also be done in comparing the detailed items of expenditure of the 2003 FIES results with previous FIES results. Some food items which were previously included in major groups were separately asked in 2003 FIES. These include biscuits, jam/jelly, crabs/lobsters, shrimps/prawns, tomato sauce, meals at place of work, meals at restaurant. For non-food items, detailed items were included for pedicab, telefax, pants, school bags, VCD/DVD, microcomputer, cell phone, jeep/jeepney, year the building built, alteration or addition or other major renovation of the housing unit, major repair of the house and construction of new house.
2003 Family Income and Expenditure Survey xxi

HIGHLIGHTS OF THE 2003 FIES RESULTS
Family income and expenditure increased from 2000 to 2003
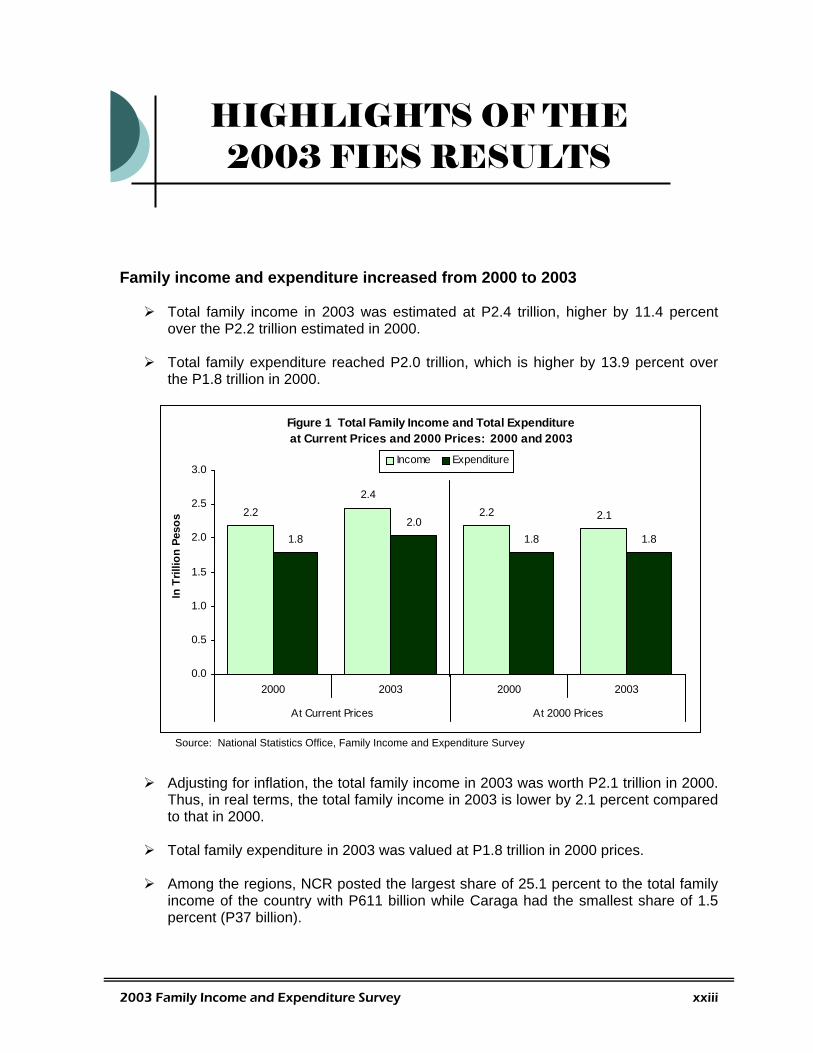
Total family income in 2003 was estimated at P2.4 trillion, higher by 11.4 percent
over the P2.2 trillion estimated in 2000.
Total family expenditure reached P2.0 trillion, which is higher by 13.9 percent over the P1.8 trillion in 2000.
Figure 1 Total Family Income and Total Expenditure at Current Prices and 2000 Prices: 2000 and 2003
2.22.4
2.2 2.1
1.82.0
1.8 1.8
0.0
0.5
1.0
1.5
2.0
2.5
3.0
2000 2003 2000 2003
At Current Prices At 2000 Prices
In T
rillio
n Pe
sos
Income Expenditure
Source: National Statistics Office, Family Income and Expenditure Survey
Adjusting for inflation, the total family income in 2003 was worth P2.1 trillion in 2000. Thus, in real terms, the total family income in 2003 is lower by 2.1 percent compared to that in 2000.
Total family expenditure in 2003 was valued at P1.8 trillion in 2000 prices.
Among the regions, NCR posted the largest share of 25.1 percent to the total family
income of the country with P611 billion while Caraga had the smallest share of 1.5 percent (P37 billion).
2003 Family Income and Expenditure Survey xxiii
Similarly, NCR had the biggest share of 24.5 percent to the total family expenditures of the country with P500 billion while Caraga posted the least share of 1.6 percent (P33 billion).
Annual average income is higher than average expenditure
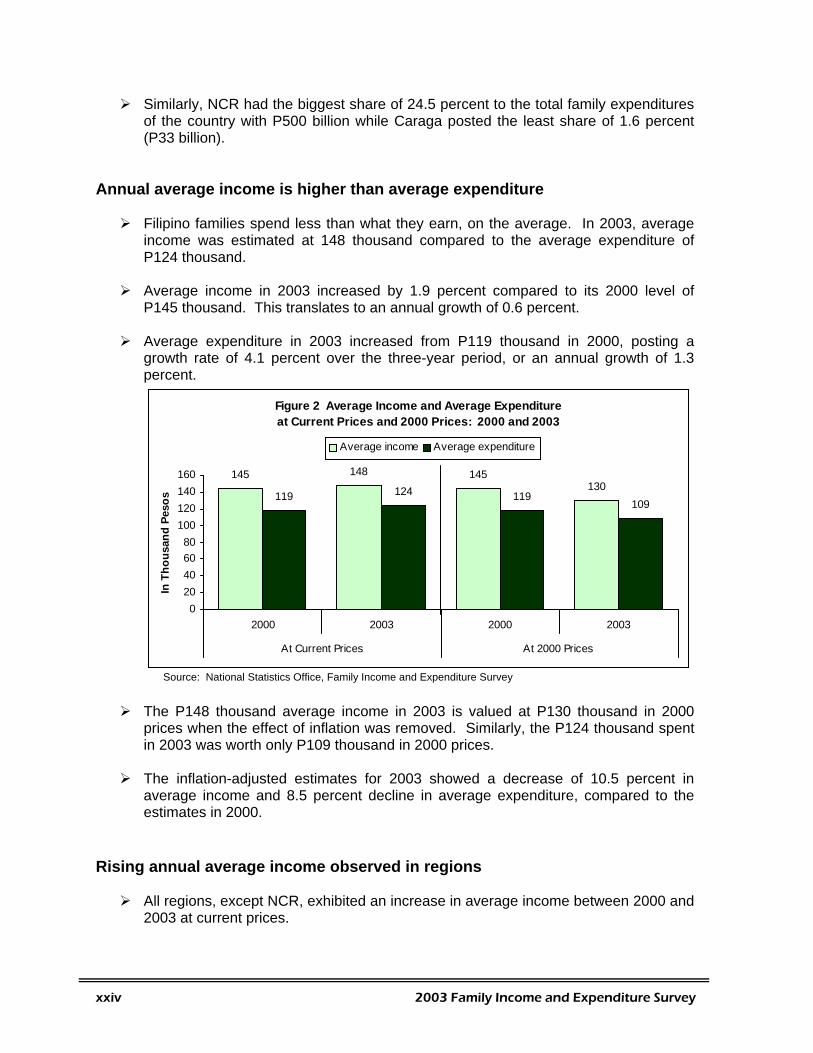
Filipino families spend less than what they earn, on the average. In 2003, average income was estimated at 148 thousand compared to the average expenditure of P124 thousand.
Average income in 2003 increased by 1.9 percent compared to its 2000 level of
P145 thousand. This translates to an annual growth of 0.6 percent.
Average expenditure in 2003 increased from P119 thousand in 2000, posting a growth rate of 4.1 percent over the three-year period, or an annual growth of 1.3 percent.
Figure 2 Average Income and Average Expenditure at Current Prices and 2000 Prices: 2000 and 2003
145 148 145130
119 124 119109
020406080
100120140160
2000 2003 2000 2003
At Current Prices At 2000 Prices
In T
hous
and
Peso
s
Average income Average expenditure
Source: National Statistics Office, Family Income and Expenditure Survey
The P148 thousand average income in 2003 is valued at P130 thousand in 2000
prices when the effect of inflation was removed. Similarly, the P124 thousand spent in 2003 was worth only P109 thousand in 2000 prices.
The inflation-adjusted estimates for 2003 showed a decrease of 10.5 percent in
average income and 8.5 percent decline in average expenditure, compared to the estimates in 2000.
Rising annual average income observed in regions
All regions, except NCR, exhibited an increase in average income between 2000 and 2003 at current prices.
xxiv 2003 Family Income and Expenditure Survey
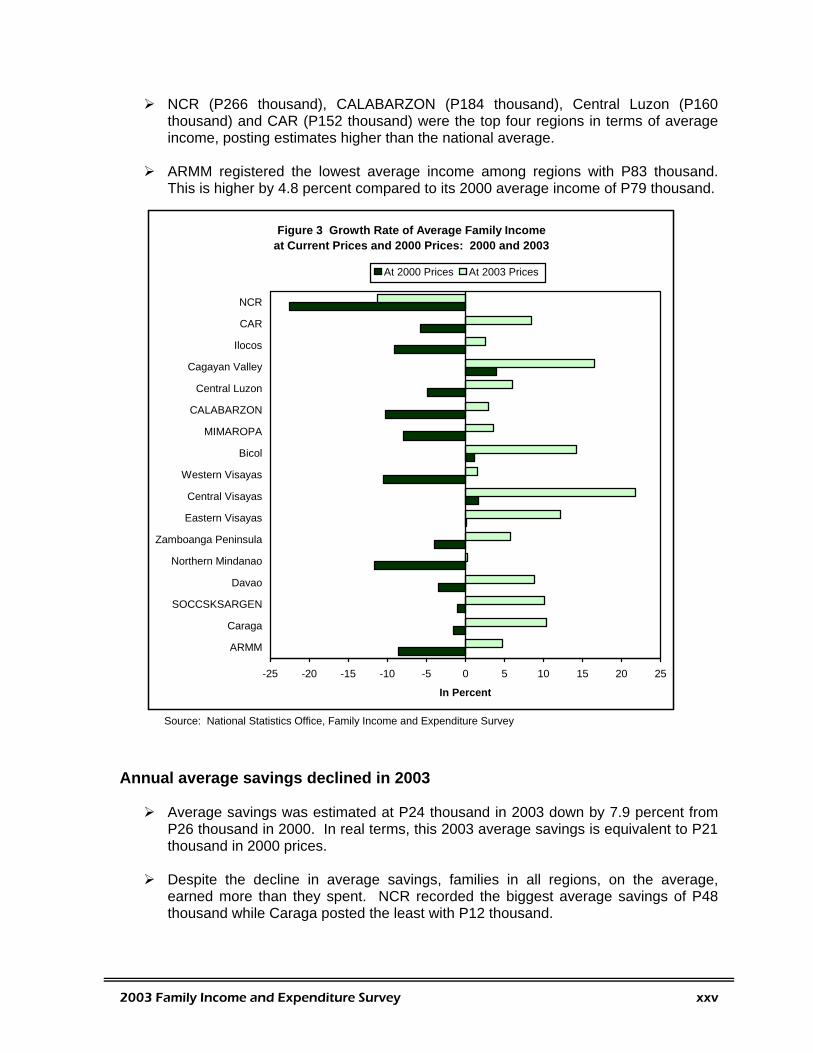
NCR (P266 thousand), CALABARZON (P184 thousand), Central Luzon (P160 thousand) and CAR (P152 thousand) were the top four regions in terms of average income, posting estimates higher than the national average.
ARMM registered the lowest average income among regions with P83 thousand.
This is higher by 4.8 percent compared to its 2000 average income of P79 thousand.
Figure 3 Growth Rate of Average Family Income at Current Prices and 2000 Prices: 2000 and 2003
-25 -20 -15 -10 -5 0 5 10 15 20 25
ARMM
Caraga
SOCCSKSARGEN
Davao
Northern Mindanao
Zamboanga Peninsula
Eastern Visayas
Central Visayas
Western Visayas
Bicol
MIMAROPA
CALABARZON
Central Luzon
Cagayan Valley
Ilocos
CAR
NCR
In Percent
At 2000 Prices At 2003 Prices
Source: National Statistics Office, Family Income and Expenditure Survey Annual average savings declined in 2003
Average savings was estimated at P24 thousand in 2003 down by 7.9 percent from P26 thousand in 2000. In real terms, this 2003 average savings is equivalent to P21 thousand in 2000 prices.
Despite the decline in average savings, families in all regions, on the average,
earned more than they spent. NCR recorded the biggest average savings of P48 thousand while Caraga posted the least with P12 thousand.
2003 Family Income and Expenditure Survey xxv
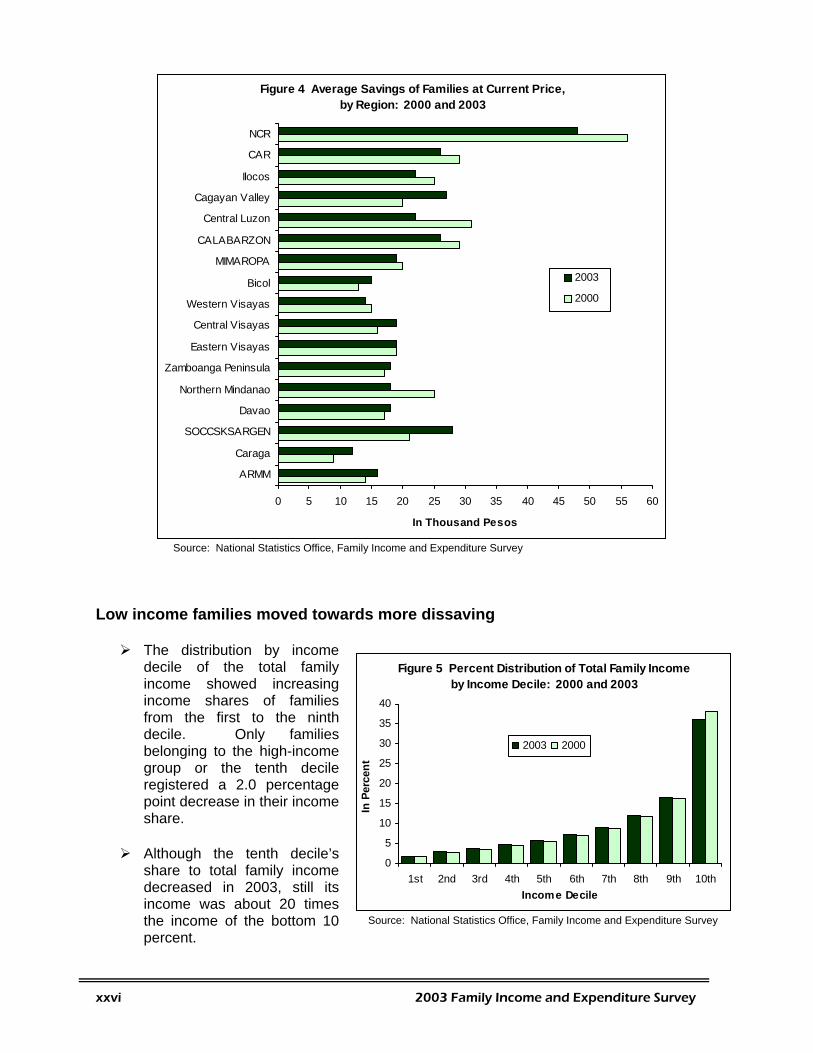
Figure 4 Average Savings of Families at Current Price, by Region: 2000 and 2003
0 5 10 15 20 25 30 35 40 45 50 55 60
ARMM
Caraga
SOCCSKSARGEN
Davao
Northern Mindanao
Zamboanga Peninsula
Eastern Visayas
Central Visayas
Western Visayas
Bicol
MIMAROPA
CALABARZON
Central Luzon
Cagayan Valley
Ilocos
CAR
NCR
In Thousand Pesos
2003
2000
Source: National Statistics Office, Family Income and Expenditure Survey Low income families moved towards more dissaving
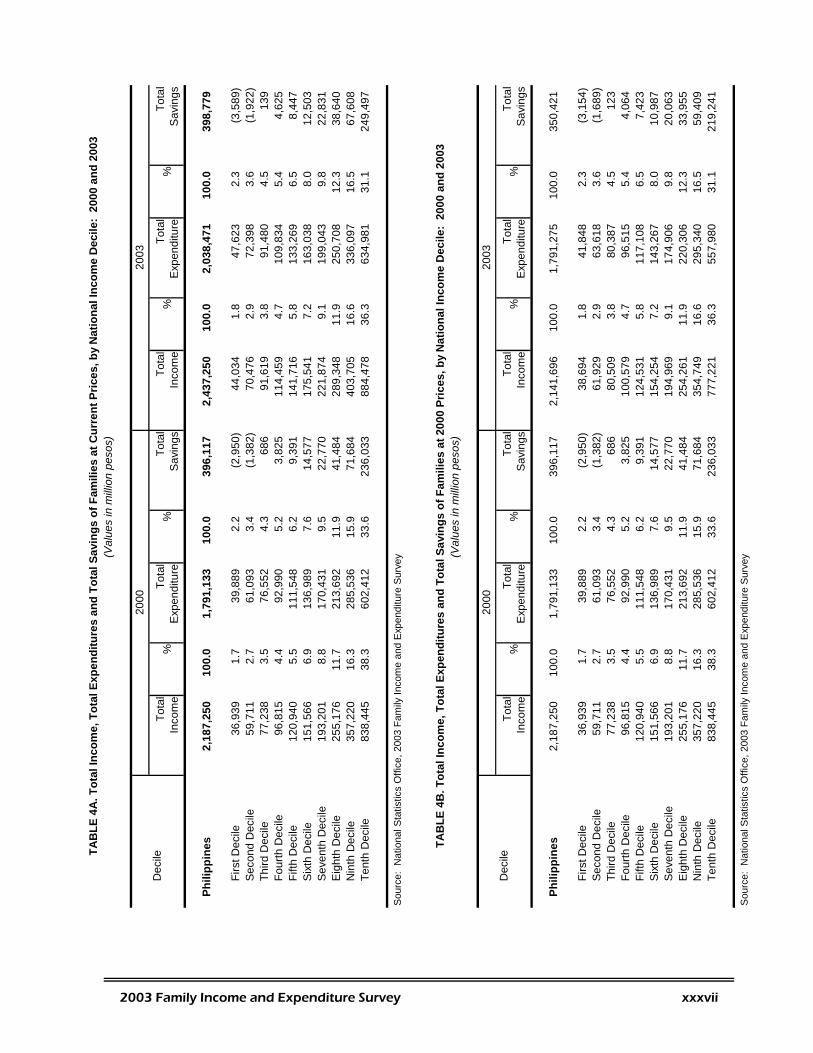
The distribution by income decile of the total family income showed increasing income shares of families from the first to the ninth decile. Only families belonging to the high-income group or the tenth decile registered a 2.0 percentage point decrease in their income share.
Figure 5 Percent Distribution of Total Family Income by Income Decile: 2000 and 2003
0
5
10
15
20
25
30
35
40
1st 2nd 3rd 4th 5th 6th 7th 8th 9th 10thIncome Decile
2003 2000
In P
erce
nt
Although the tenth decile’s
share to total family income decreased in 2003, still its income was about 20 times the income of the bottom 10 percent.
Source: National Statistics Office, Family Income and Expenditure Survey
xxvi 2003 Family Income and Expenditure Survey
Average expenditure of families from the first to the ninth decile increased between 2000 and 2003.
While families earned more than they spent in 2003 in general, dissaving was
observed in the lowest two income deciles. The positive income trend was not enough to cover the expenditure of low-income families in the lowest two income deciles as seen in their average dissaving (income net of expenditure) of P2 thousand for the first decile and P1 thousand for the second decile (Table 4A).
Less income disparity in 2003
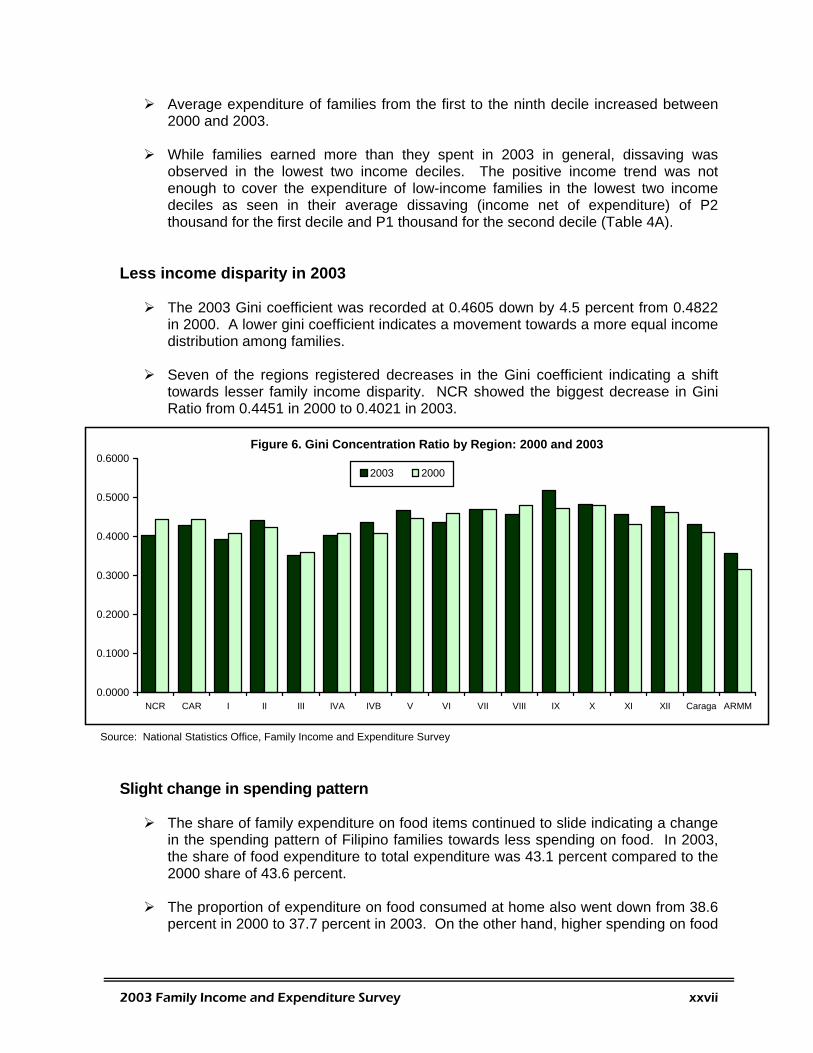
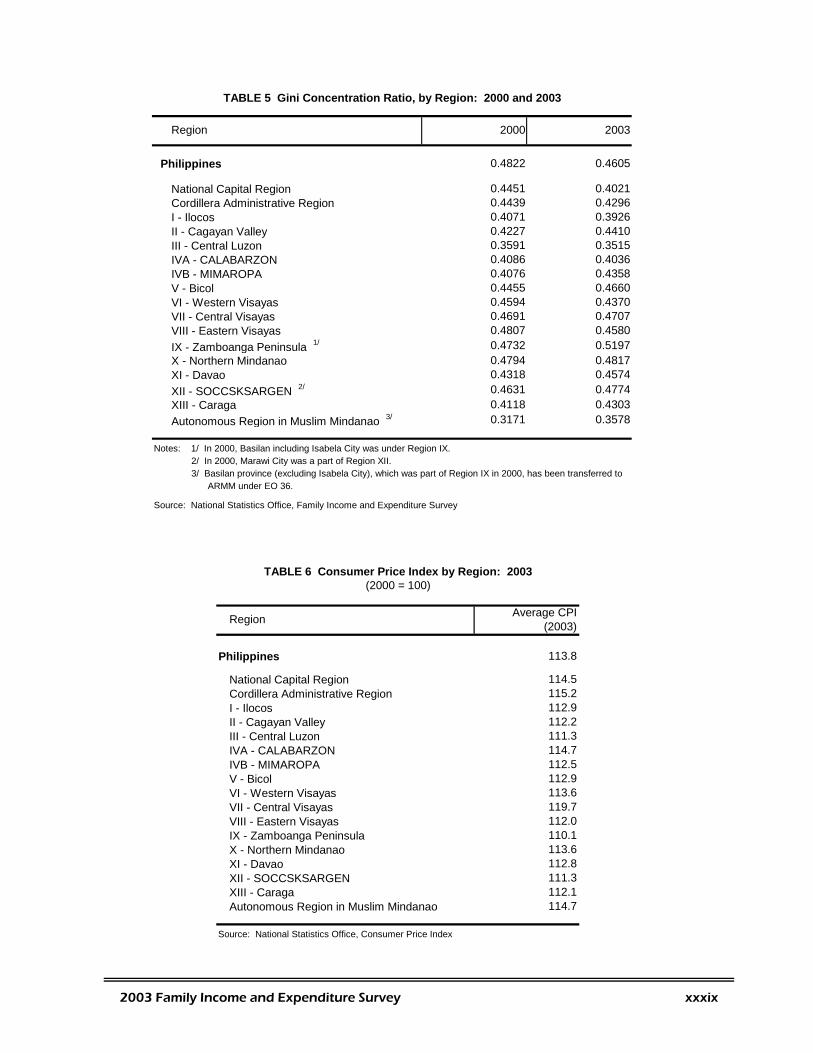
The 2003 Gini coefficient was recorded at 0.4605 down by 4.5 percent from 0.4822 in 2000. A lower gini coefficient indicates a movement towards a more equal income distribution among families.
Seven of the regions registered decreases in the Gini coefficient indicating a shift
towards lesser family income disparity. NCR showed the biggest decrease in Gini Ratio from 0.4451 in 2000 to 0.4021 in 2003.
Figure 6. Gini Concentration Ratio by Region: 2000 and 2003
0.0000
0.1000
0.2000
0.3000
0.4000
0.5000
0.6000
NCR CAR I II III IVA IVB V VI VII VIII IX X XI XII Caraga ARMM
2003 2000
Source: National Statistics Office, Family Income and Expenditure Survey
Slight change in spending pattern
The share of family expenditure on food items continued to slide indicating a change in the spending pattern of Filipino families towards less spending on food. In 2003, the share of food expenditure to total expenditure was 43.1 percent compared to the 2000 share of 43.6 percent.
The proportion of expenditure on food consumed at home also went down from 38.6
percent in 2000 to 37.7 percent in 2003. On the other hand, higher spending on food
2003 Family Income and Expenditure Survey xxvii
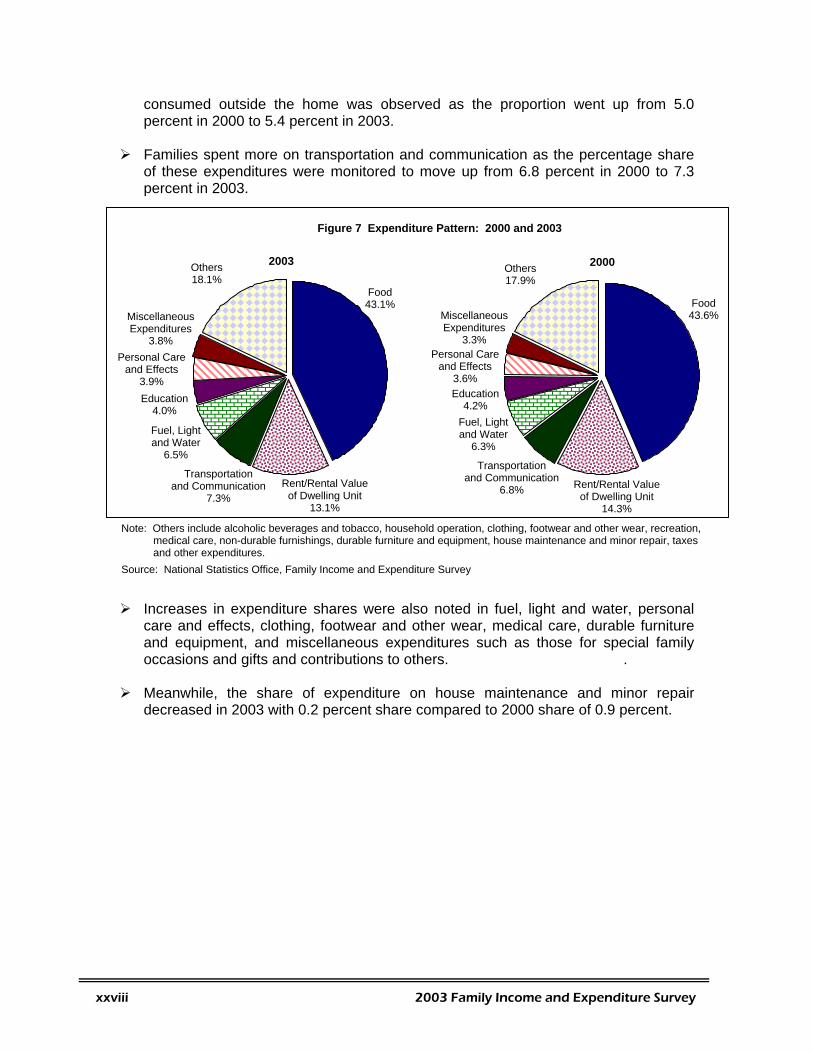
consumed outside the home was observed as the proportion went up from 5.0 percent in 2000 to 5.4 percent in 2003.
Families spent more on transportation and communication as the percentage share
of these expenditures were monitored to move up from 6.8 percent in 2000 to 7.3 percent in 2003.
Food 43.1%
Fuel, Light and Water
6.5%
Transportation and Communication
7.3%
Personal Care and Effects
3.9% Education
4.0%
Rent/Rental Value of Dwelling Unit
13.1%
Miscellaneous Expenditures
3.8%
Others 18.1%
Food 43.6%
2003 2000
Figure 7 Expenditure Pattern: 2000 and 2003
Fuel, Light and Water
6.3%
Transportation and Communication
6.8%
Personal Care and Effects
3.6% Education
4.2%
Rent/Rental Value of Dwelling Unit
14.3%
Miscellaneous Expenditures
3.3%
Others 17.9%
Note: Others include alcoholic beverages and tobacco, household operation, clothing, footwear and other wear, recreation,
medical care, non-durable furnishings, durable furniture and equipment, house maintenance and minor repair, taxes and other expenditures.
Source: National Statistics Office, Family Income and Expenditure Survey
Increases in expenditure shares were also noted in fuel, light and water, personal care and effects, clothing, footwear and other wear, medical care, durable furniture and equipment, and miscellaneous expenditures such as those for special family occasions and gifts and contributions to others. .
Meanwhile, the share of expenditure on house maintenance and minor repair
decreased in 2003 with 0.2 percent share compared to 2000 share of 0.9 percent.
xxviii 2003 Family Income and Expenditure Survey
TEXTUAL TABLES
2003 Family Income and Expenditure Survey xxix

Total Families (in thousands)
Total Income (In million pesos)
% to total Total Families (in thousands)
Total Income (In million pesos)
% to total
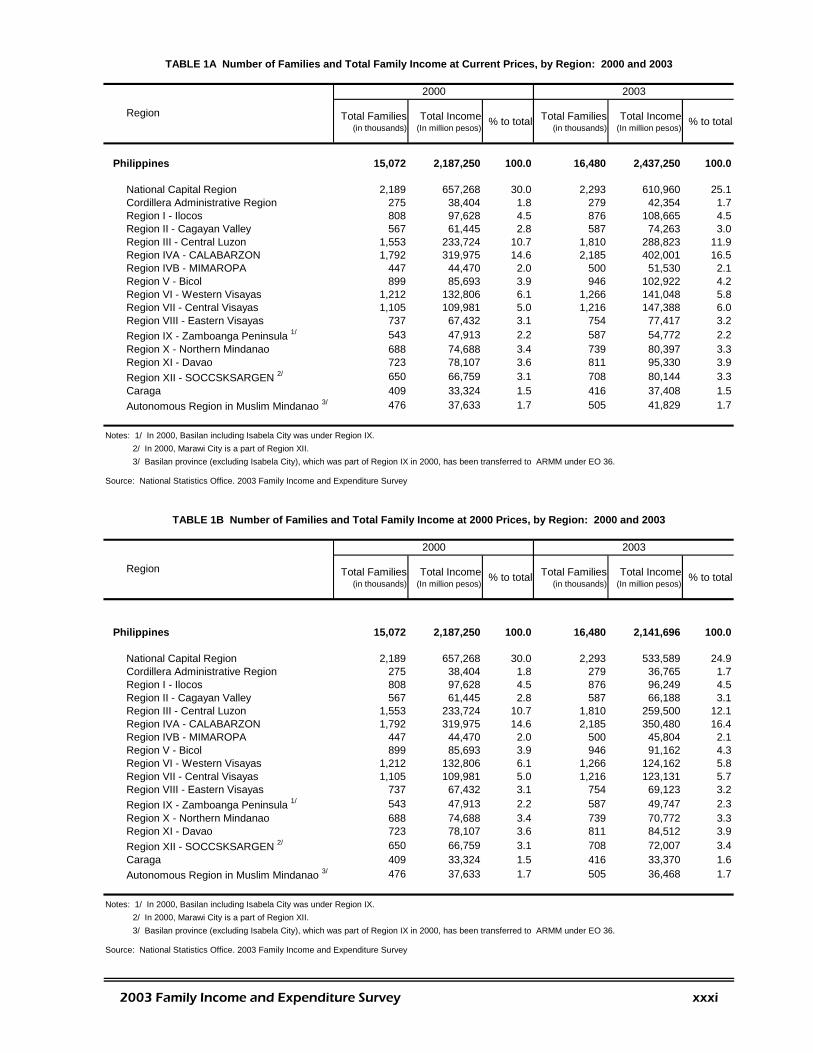
Philippines 15,072 2,187,250 100.0 16,480 2,437,250 100.0
National Capital Region 2,189 657,268 30.0 2,293 610,960 25.1Cordillera Administrative Region 275 38,404 1.8 279 42,354 1.7Region I - Ilocos 808 97,628 4.5 876 108,665 4.5Region II - Cagayan Valley 567 61,445 2.8 587 74,263 3.0Region III - Central Luzon 1,553 233,724 10.7 1,810 288,823 11.9Region IVA - CALABARZON 1,792 319,975 14.6 2,185 402,001 16.5Region IVB - MIMAROPA 447 44,470 2.0 500 51,530 2.1Region V - Bicol 899 85,693 3.9 946 102,922 4.2Region VI - Western Visayas 1,212 132,806 6.1 1,266 141,048 5.8Region VII - Central Visayas 1,105 109,981 5.0 1,216 147,388 6.0Region VIII - Eastern Visayas 737 67,432 3.1 754 77,417 3.2Region IX - Zamboanga Peninsula 1/ 543 47,913 2.2 587 54,772 2.2Region X - Northern Mindanao 688 74,688 3.4 739 80,397 3.3Region XI - Davao 723 78,107 3.6 811 95,330 3.9Region XII - SOCCSKSARGEN 2/ 650 66,759 3.1 708 80,144 3.3Caraga 409 33,324 1.5 416 37,408 1.5Autonomous Region in Muslim Mindanao 3/ 476 37,633 1.7 505 41,829 1.7
Notes: 1/ In 2000, Basilan including Isabela City was under Region IX. 2/ In 2000, Marawi City is a part of Region XII. 3/ Basilan province (excluding Isabela City), which was part of Region IX in 2000, has been transferred to ARMM under EO 36.
Source: National Statistics Office. 2003 Family Income and Expenditure Survey
Total Families (in thousands)
Total Income (In million pesos)
% to total Total Families (in thousands)
Total Income (In million pesos)
% to total
Philippines 15,072 2,187,250 100.0 16,480 2,141,696 100.0
National Capital Region 2,189 657,268 30.0 2,293 533,589 24.9Cordillera Administrative Region 275 38,404 1.8 279 36,765 1.7Region I - Ilocos 808 97,628 4.5 876 96,249 4.5Region II - Cagayan Valley 567 61,445 2.8 587 66,188 3.1Region III - Central Luzon 1,553 233,724 10.7 1,810 259,500 12.1Region IVA - CALABARZON 1,792 319,975 14.6 2,185 350,480 16.4Region IVB - MIMAROPA 447 44,470 2.0 500 45,804 2.1Region V - Bicol 899 85,693 3.9 946 91,162 4.3Region VI - Western Visayas 1,212 132,806 6.1 1,266 124,162 5.8Region VII - Central Visayas 1,105 109,981 5.0 1,216 123,131 5.7Region VIII - Eastern Visayas 737 67,432 3.1 754 69,123 3.2Region IX - Zamboanga Peninsula 1/ 543 47,913 2.2 587 49,747 2.3Region X - Northern Mindanao 688 74,688 3.4 739 70,772 3.3Region XI - Davao 723 78,107 3.6 811 84,512 3.9Region XII - SOCCSKSARGEN 2/ 650 66,759 3.1 708 72,007 3.4Caraga 409 33,324 1.5 416 33,370 1.6Autonomous Region in Muslim Mindanao 3/ 476 37,633 1.7 505 36,468 1.7
Notes: 1/ In 2000, Basilan including Isabela City was under Region IX. 2/ In 2000, Marawi City is a part of Region XII. 3/ Basilan province (excluding Isabela City), which was part of Region IX in 2000, has been transferred to ARMM under EO 36.
Source: National Statistics Office. 2003 Family Income and Expenditure Survey
TABLE 1B Number of Families and Total Family Income at 2000 Prices, by Region: 2000 and 2003
Region
2000 2003
2003
Region
2000
TABLE 1A Number of Families and Total Family Income at Current Prices, by Region: 2000 and 2003
2003 Family Income and Expenditure Survey xxxi
Total (In million pesos)
% to total Total (In million pesos)
% to total
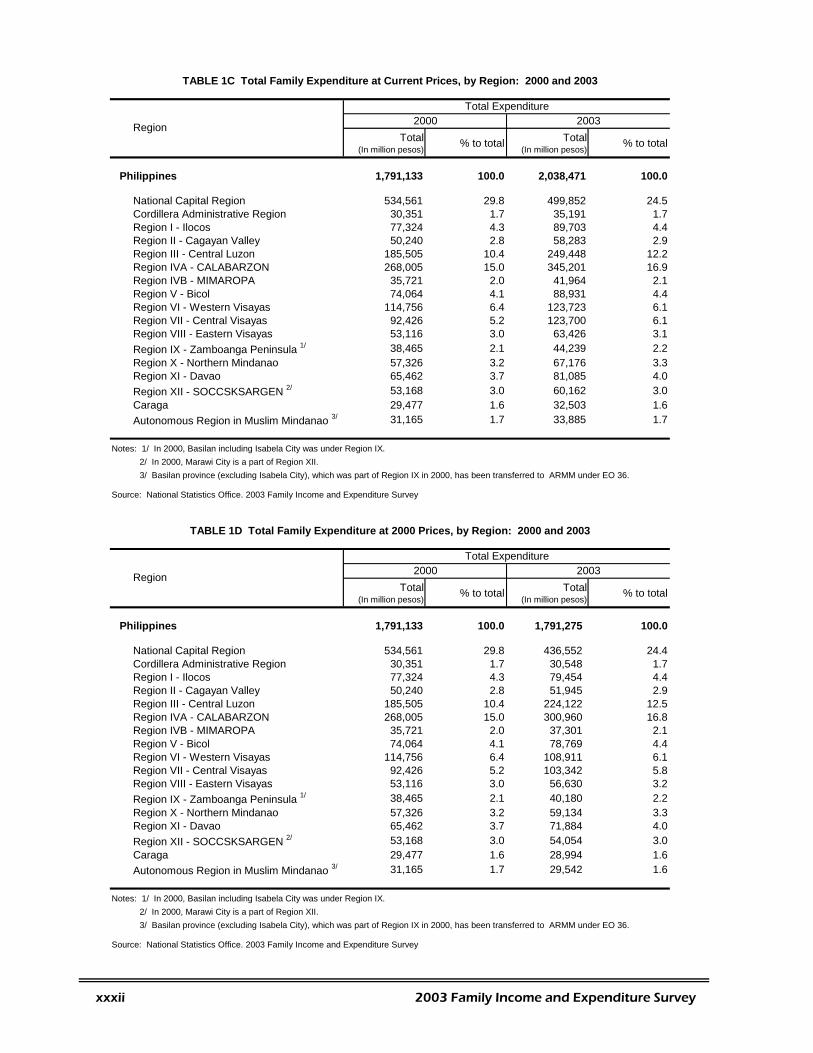
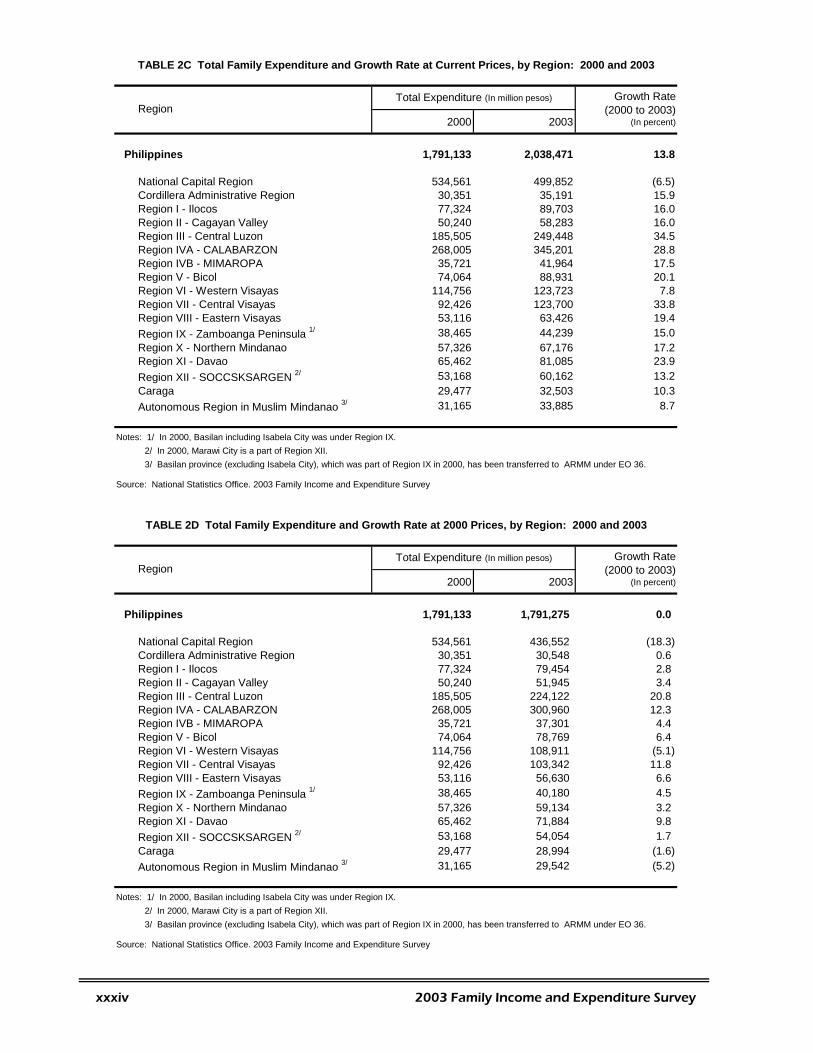
Philippines 1,791,133 100.0 2,038,471 100.0
National Capital Region 534,561 29.8 499,852 24.5Cordillera Administrative Region 30,351 1.7 35,191 1.7Region I - Ilocos 77,324 4.3 89,703 4.4Region II - Cagayan Valley 50,240 2.8 58,283 2.9Region III - Central Luzon 185,505 10.4 249,448 12.2Region IVA - CALABARZON 268,005 15.0 345,201 16.9Region IVB - MIMAROPA 35,721 2.0 41,964 2.1Region V - Bicol 74,064 4.1 88,931 4.4Region VI - Western Visayas 114,756 6.4 123,723 6.1Region VII - Central Visayas 92,426 5.2 123,700 6.1Region VIII - Eastern Visayas 53,116 3.0 63,426 3.1Region IX - Zamboanga Peninsula 1/ 38,465 2.1 44,239 2.2Region X - Northern Mindanao 57,326 3.2 67,176 3.3Region XI - Davao 65,462 3.7 81,085 4.0Region XII - SOCCSKSARGEN 2/ 53,168 3.0 60,162 3.0Caraga 29,477 1.6 32,503 1.6Autonomous Region in Muslim Mindanao 3/ 31,165 1.7 33,885 1.7
Notes: 1/ In 2000, Basilan including Isabela City was under Region IX. 2/ In 2000, Marawi City is a part of Region XII. 3/ Basilan province (excluding Isabela City), which was part of Region IX in 2000, has been transferred to ARMM under EO 36.
Source: National Statistics Office. 2003 Family Income and Expenditure Survey
Total (In million pesos)
% to total Total (In million pesos)
% to total
Philippines 1,791,133 100.0 1,791,275 100.0
National Capital Region 534,561 29.8 436,552 24.4Cordillera Administrative Region 30,351 1.7 30,548 1.7Region I - Ilocos 77,324 4.3 79,454 4.4Region II - Cagayan Valley 50,240 2.8 51,945 2.9Region III - Central Luzon 185,505 10.4 224,122 12.5Region IVA - CALABARZON 268,005 15.0 300,960 16.8Region IVB - MIMAROPA 35,721 2.0 37,301 2.1Region V - Bicol 74,064 4.1 78,769 4.4Region VI - Western Visayas 114,756 6.4 108,911 6.1Region VII - Central Visayas 92,426 5.2 103,342 5.8Region VIII - Eastern Visayas 53,116 3.0 56,630 3.2Region IX - Zamboanga Peninsula 1/ 38,465 2.1 40,180 2.2Region X - Northern Mindanao 57,326 3.2 59,134 3.3Region XI - Davao 65,462 3.7 71,884 4.0Region XII - SOCCSKSARGEN 2/ 53,168 3.0 54,054 3.0Caraga 29,477 1.6 28,994 1.6Autonomous Region in Muslim Mindanao 3/ 31,165 1.7 29,542 1.6
Notes: 1/ In 2000, Basilan including Isabela City was under Region IX. 2/ In 2000, Marawi City is a part of Region XII. 3/ Basilan province (excluding Isabela City), which was part of Region IX in 2000, has been transferred to ARMM under EO 36.
Source: National Statistics Office. 2003 Family Income and Expenditure Survey
TABLE 1D Total Family Expenditure at 2000 Prices, by Region: 2000 and 2003
Total Expenditure2000 2003
Total Expenditure2000 2003Region
Region
TABLE 1C Total Family Expenditure at Current Prices, by Region: 2000 and 2003
xxxii 2003 Family Income and Expenditure Survey
2000 2003
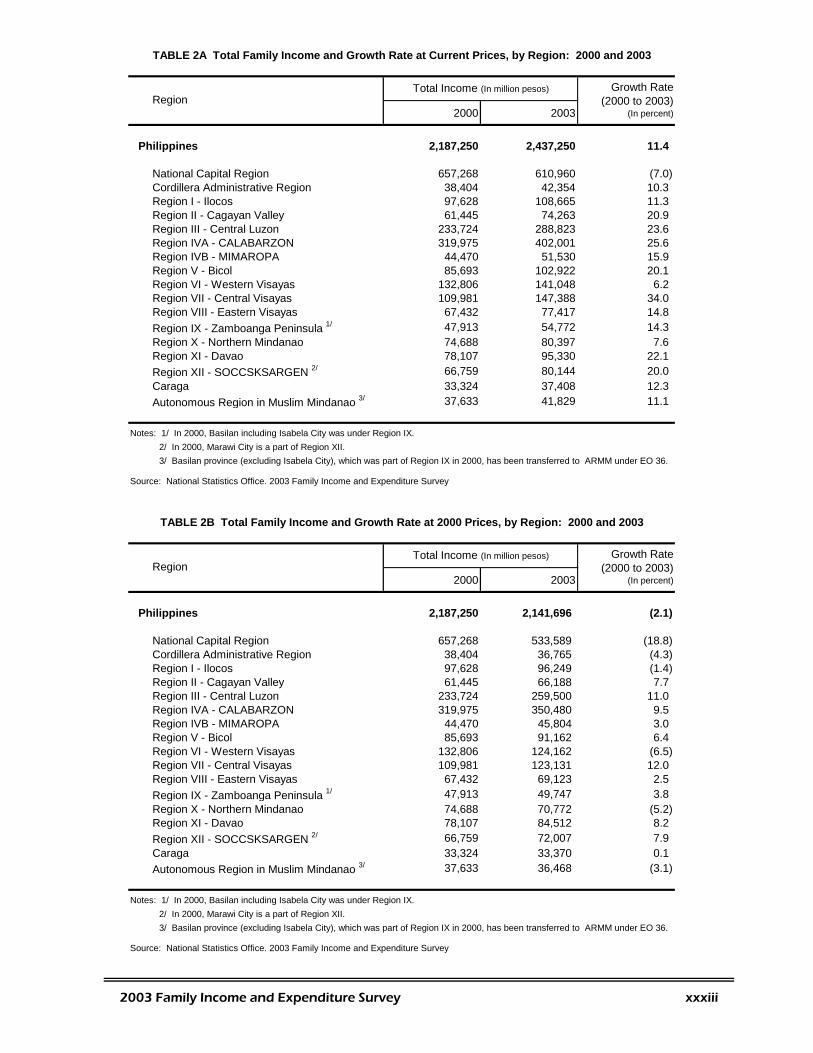
Philippines 2,187,250 2,437,250 11.4
National Capital Region 657,268 610,960 (7.0)Cordillera Administrative Region 38,404 42,354 10.3Region I - Ilocos 97,628 108,665 11.3Region II - Cagayan Valley 61,445 74,263 20.9Region III - Central Luzon 233,724 288,823 23.6Region IVA - CALABARZON 319,975 402,001 25.6Region IVB - MIMAROPA 44,470 51,530 15.9Region V - Bicol 85,693 102,922 20.1Region VI - Western Visayas 132,806 141,048 6.2Region VII - Central Visayas 109,981 147,388 34.0Region VIII - Eastern Visayas 67,432 77,417 14.8Region IX - Zamboanga Peninsula 1/ 47,913 54,772 14.3Region X - Northern Mindanao 74,688 80,397 7.6Region XI - Davao 78,107 95,330 22.1Region XII - SOCCSKSARGEN 2/ 66,759 80,144 20.0Caraga 33,324 37,408 12.3Autonomous Region in Muslim Mindanao 3/ 37,633 41,829 11.1
Notes: 1/ In 2000, Basilan including Isabela City was under Region IX. 2/ In 2000, Marawi City is a part of Region XII. 3/ Basilan province (excluding Isabela City), which was part of Region IX in 2000, has been transferred to ARMM under EO 36.
Source: National Statistics Office. 2003 Family Income and Expenditure Survey
2000 2003
Philippines 2,187,250 2,141,696 (2.1)
National Capital Region 657,268 533,589 (18.8)Cordillera Administrative Region 38,404 36,765 (4.3)Region I - Ilocos 97,628 96,249 (1.4)Region II - Cagayan Valley 61,445 66,188 7.7Region III - Central Luzon 233,724 259,500 11.0Region IVA - CALABARZON 319,975 350,480 9.5Region IVB - MIMAROPA 44,470 45,804 3.0Region V - Bicol 85,693 91,162 6.4Region VI - Western Visayas 132,806 124,162 (6.5)Region VII - Central Visayas 109,981 123,131 12.0Region VIII - Eastern Visayas 67,432 69,123 2.5Region IX - Zamboanga Peninsula 1/ 47,913 49,747 3.8Region X - Northern Mindanao 74,688 70,772 (5.2)Region XI - Davao 78,107 84,512 8.2Region XII - SOCCSKSARGEN 2/ 66,759 72,007 7.9Caraga 33,324 33,370 0.1Autonomous Region in Muslim Mindanao 3/ 37,633 36,468 (3.1)
Notes: 1/ In 2000, Basilan including Isabela City was under Region IX. 2/ In 2000, Marawi City is a part of Region XII. 3/ Basilan province (excluding Isabela City), which was part of Region IX in 2000, has been transferred to ARMM under EO 36.
Source: National Statistics Office. 2003 Family Income and Expenditure Survey
RegionTotal Income (In million pesos) Growth Rate
(2000 to 2003) (In percent)
Growth Rate (2000 to 2003)
(In percent)Region
TABLE 2B Total Family Income and Growth Rate at 2000 Prices, by Region: 2000 and 2003
Total Income (In million pesos)
TABLE 2A Total Family Income and Growth Rate at Current Prices, by Region: 2000 and 2003
2003 Family Income and Expenditure Survey xxxiii
2000 2003
Philippines 1,791,133 2,038,471 13.8
National Capital Region 534,561 499,852 (6.5)Cordillera Administrative Region 30,351 35,191 15.9Region I - Ilocos 77,324 89,703 16.0Region II - Cagayan Valley 50,240 58,283 16.0Region III - Central Luzon 185,505 249,448 34.5Region IVA - CALABARZON 268,005 345,201 28.8Region IVB - MIMAROPA 35,721 41,964 17.5Region V - Bicol 74,064 88,931 20.1Region VI - Western Visayas 114,756 123,723 7.8Region VII - Central Visayas 92,426 123,700 33.8Region VIII - Eastern Visayas 53,116 63,426 19.4Region IX - Zamboanga Peninsula 1/ 38,465 44,239 15.0Region X - Northern Mindanao 57,326 67,176 17.2Region XI - Davao 65,462 81,085 23.9Region XII - SOCCSKSARGEN 2/ 53,168 60,162 13.2Caraga 29,477 32,503 10.3Autonomous Region in Muslim Mindanao 3/ 31,165 33,885 8.7
Notes: 1/ In 2000, Basilan including Isabela City was under Region IX. 2/ In 2000, Marawi City is a part of Region XII. 3/ Basilan province (excluding Isabela City), which was part of Region IX in 2000, has been transferred to ARMM under EO 36.
Source: National Statistics Office. 2003 Family Income and Expenditure Survey
2000 2003
Philippines 1,791,133 1,791,275 0.0
National Capital Region 534,561 436,552 (18.3)Cordillera Administrative Region 30,351 30,548 0.6Region I - Ilocos 77,324 79,454 2.8Region II - Cagayan Valley 50,240 51,945 3.4Region III - Central Luzon 185,505 224,122 20.8Region IVA - CALABARZON 268,005 300,960 12.3Region IVB - MIMAROPA 35,721 37,301 4.4Region V - Bicol 74,064 78,769 6.4Region VI - Western Visayas 114,756 108,911 (5.1)Region VII - Central Visayas 92,426 103,342 11.8Region VIII - Eastern Visayas 53,116 56,630 6.6Region IX - Zamboanga Peninsula 1/ 38,465 40,180 4.5Region X - Northern Mindanao 57,326 59,134 3.2Region XI - Davao 65,462 71,884 9.8Region XII - SOCCSKSARGEN 2/ 53,168 54,054 1.7Caraga 29,477 28,994 (1.6)Autonomous Region in Muslim Mindanao 3/ 31,165 29,542 (5.2)
Notes: 1/ In 2000, Basilan including Isabela City was under Region IX. 2/ In 2000, Marawi City is a part of Region XII. 3/ Basilan province (excluding Isabela City), which was part of Region IX in 2000, has been transferred to ARMM under EO 36.
Source: National Statistics Office. 2003 Family Income and Expenditure Survey
Growth Rate (2000 to 2003)
(In percent)
RegionTotal Expenditure (In million pesos) Growth Rate
(2000 to 2003) (In percent)
TABLE 2D Total Family Expenditure and Growth Rate at 2000 Prices, by Region: 2000 and 2003
RegionTotal Expenditure (In million pesos)
TABLE 2C Total Family Expenditure and Growth Rate at Current Prices, by Region: 2000 and 2003
xxxiv 2003 Family Income and Expenditure Survey
Average Income
Average Expenditure
Average Savings
Average Income
Average Expenditure
Average Savings
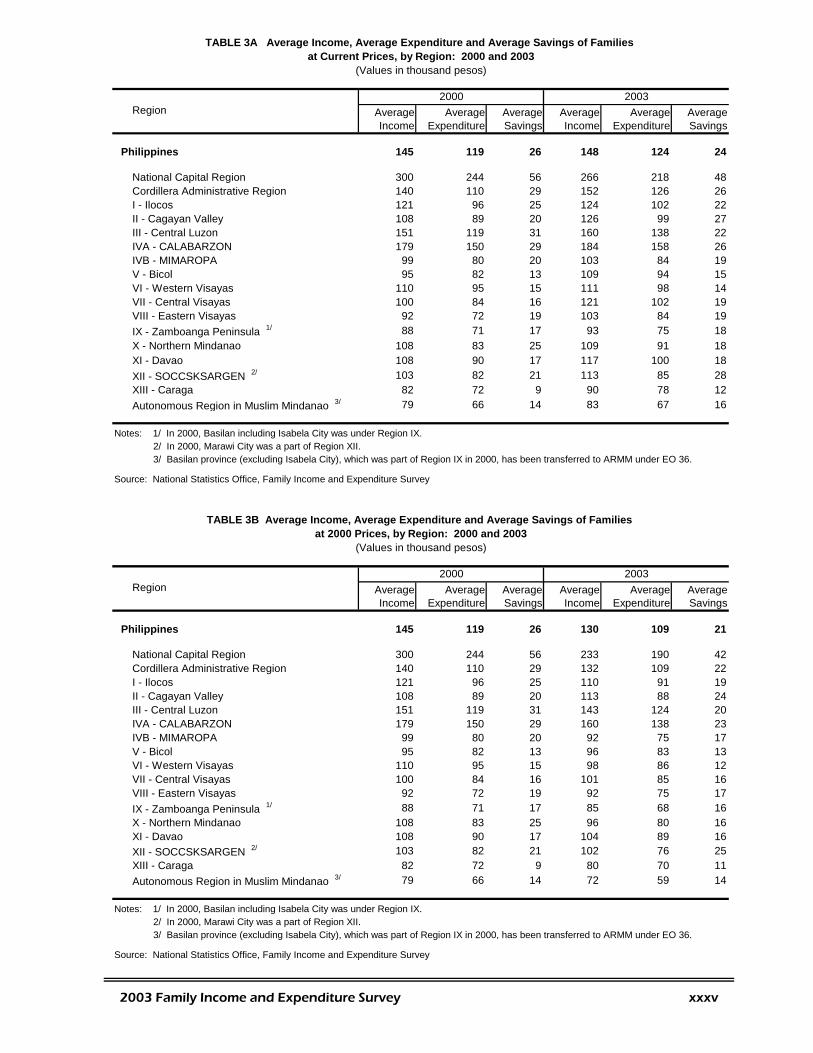
Philippines 145 119 26 148 124 24
National Capital Region 300 244 56 266 218 48Cordillera Administrative Region 140 110 29 152 126 26I - Ilocos 121 96 25 124 102 22II - Cagayan Valley 108 89 20 126 99 27III - Central Luzon 151 119 31 160 138 22IVA - CALABARZON 179 150 29 184 158 26IVB - MIMAROPA 99 80 20 103 84 19V - Bicol 95 82 13 109 94 15VI - Western Visayas 110 95 15 111 98 14VII - Central Visayas 100 84 16 121 102 19VIII - Eastern Visayas 92 72 19 103 84 19IX - Zamboanga Peninsula 1/ 88 71 17 93 75 18X - Northern Mindanao 108 83 25 109 91 18XI - Davao 108 90 17 117 100 18XII - SOCCSKSARGEN 2/ 103 82 21 113 85 28XIII - Caraga 82 72 9 90 78 12Autonomous Region in Muslim Mindanao 3/ 79 66 14 83 67 16
Notes: 1/ In 2000, Basilan including Isabela City was under Region IX. 2/ In 2000, Marawi City was a part of Region XII. 3/ Basilan province (excluding Isabela City), which was part of Region IX in 2000, has been transferred to ARMM under EO 36.
Source: National Statistics Office, Family Income and Expenditure Survey
Average Income
Average Expenditure
Average Savings
Average Income
Average Expenditure
Average Savings
Philippines 145 119 26 130 109 21
National Capital Region 300 244 56 233 190 42Cordillera Administrative Region 140 110 29 132 109 22I - Ilocos 121 96 25 110 91 19II - Cagayan Valley 108 89 20 113 88 24III - Central Luzon 151 119 31 143 124 20IVA - CALABARZON 179 150 29 160 138 23IVB - MIMAROPA 99 80 20 92 75 17V - Bicol 95 82 13 96 83 1VI - Western Visayas 110 95 15 98 86 12VII - Central Visayas 100 84 16 101 85 16VIII - Eastern Visayas 92 72 19 92 75 1IX - Zamboan
3
7ga Peninsula 1/ 88 71 17 85 68 16
X - Northern Mindanao 108 83 25 96 80 16XI - Davao 108 90 17 104 89 16XII - SOCCSKSARGEN 2/ 103 82 21 102 76 25XIII - Caraga 82 72 9 80 70 11Autonomous Region in Muslim Mindanao 3/ 79 66 14 72 59 14
Notes: 1/ In 2000, Basilan including Isabela City was under Region IX. 2/ In 2000, Marawi City was a part of Region XII. 3/ Basilan province (excluding Isabela City), which was part of Region IX in 2000, has been transferred to ARMM under EO 36.
Source: National Statistics Office, Family Income and Expenditure Survey
TABLE 3B Average Income, Average Expenditure and Average Savings of Families at 2000 Prices, by Region: 2000 and 2003
2000 2003Region
(Values in thousand pesos)
Region2000 2003
TABLE 3A Average Income, Average Expenditure and Average Savings of Families at Current Prices, by Region: 2000 and 2003
(Values in thousand pesos)
2003 Family Income and Expenditure Survey xxxv
Region2000 2003
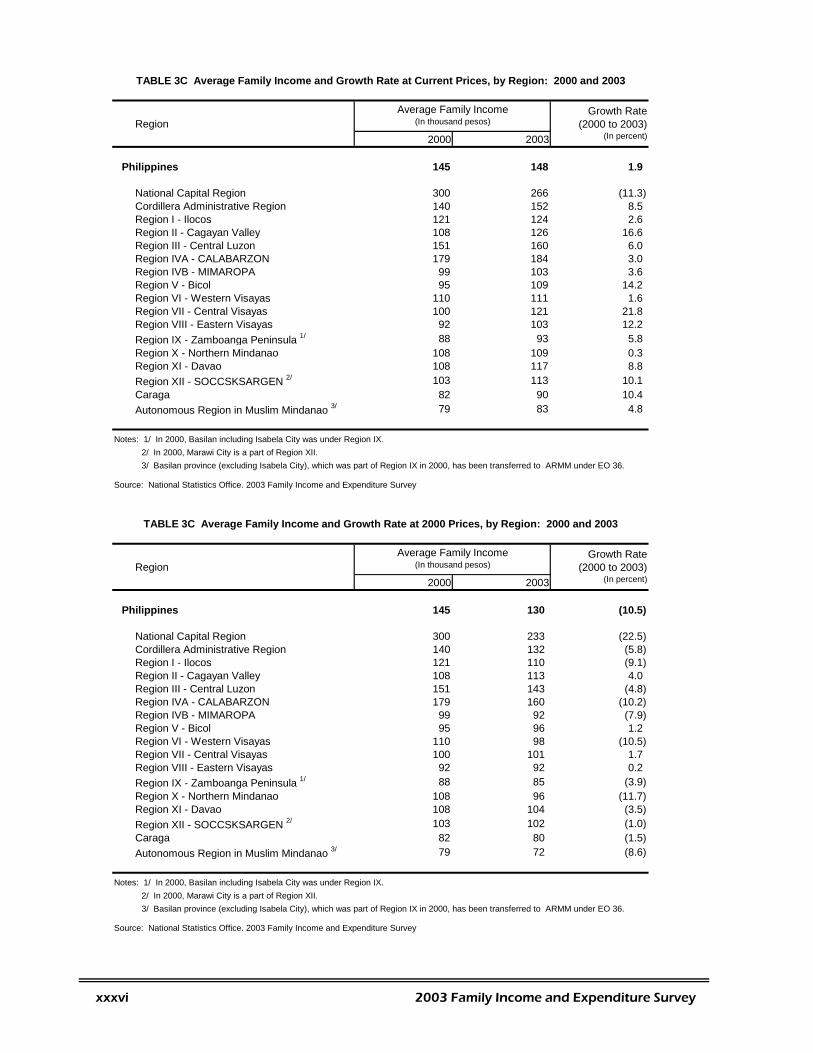
Philippines 145 148 1.9
National Capital Region 300 266 (11.3)Cordillera Administrative Region 140 152 8.5Region I - Ilocos 121 124 2.6Region II - Cagayan Valley 108 126 16.6Region III - Central Luzon 151 160 6.0Region IVA - CALABARZON 179 184 3.0Region IVB - MIMAROPA 99 103 3.6Region V - Bicol 95 109 14.2Region VI - Western Visayas 110 111 1.6Region VII - Central Visayas 100 121 21.8Region VIII - Eastern Visayas 92 103 12.2Region IX - Zamboanga Peninsula 1/ 88 93 5.8Region X - Northern Mindanao 108 109 0.3Region XI - Davao 108 117 8.8Region XII - SOCCSKSARGEN 2/ 103 113 10.1Caraga 82 90 10.4Autonomous Region in Muslim Mindanao 3/ 79 83 4.8
Notes: 1/ In 2000, Basilan including Isabela City was under Region IX. 2/ In 2000, Marawi City is a part of Region XII. 3/ Basilan province (excluding Isabela City), which was part of Region IX in 2000, has been transferred to ARMM under EO 36.
Source: National Statistics Office. 2003 Family Income and Expenditure Survey
Region2000 2003
Philippines 145 130 (10.5)
National Capital Region 300 233 (22.5)Cordillera Administrative Region 140 132 (5.8)Region I - Ilocos 121 110 (9.1)Region II - Cagayan Valley 108 113 4.0Region III - Central Luzon 151 143 (4.8)Region IVA - CALABARZON 179 160 (10.2)Region IVB - MIMAROPA 99 92 (7.9)Region V - Bicol 95 96 1.2Region VI - Western Visayas 110 98 (10.5)Region VII - Central Visayas 100 101 1.7Region VIII - Eastern Visayas 92 92 0.2Region IX - Zamboanga Peninsula 1/ 88 85 (3.9)Region X - Northern Mindanao 108 96 (11.7)Region XI - Davao 108 104 (3.5)Region XII - SOCCSKSARGEN 2/ 103 102 (1.0)Caraga 82 80 (1.5)Autonomous Region in Muslim Mindanao 3/ 79 72 (8.6)
Notes: 1/ In 2000, Basilan including Isabela City was under Region IX. 2/ In 2000, Marawi City is a part of Region XII. 3/ Basilan province (excluding Isabela City), which was part of Region IX in 2000, has been transferred to ARMM under EO 36.
Source: National Statistics Office. 2003 Family Income and Expenditure Survey
Average Family Income(In thousand pesos)
Growth Rate (2000 to 2003)
(In percent)
TABLE 3C Average Family Income and Growth Rate at 2000 Prices, by Region: 2000 and 2003
Average Family Income Growth Rate (2000 to 2003)
(In percent)
(In thousand pesos)
TABLE 3C Average Family Income and Growth Rate at Current Prices, by Region: 2000 and 2003
xxxvi 2003 Family Income and Expenditure Survey
2003 Family Income and Expenditure Survey xxxvii
Tota
l In
com
e%
Tota
l E
xpen
ditu
re%
Tota
l S
avin
gsTo
tal
Inco
me
%To
tal
Exp
endi
ture
%To
tal
Sav
ings
Phili
ppin
es2,
187,
250
100.
01,
791,
133
100.
039
6,11
72,
437,
250
100.
02,
038,
471
100.
039
8,77
9
Firs
t Dec
ile36
,939
1.7
39,8
892.
2(2
,950
)44
,034
1.8
47,6
232.
3(3
,589
)S
econ
d D
ecile
59,7
112.
761
,093
3.4
(1,3
82)
70,4
762.
972
,398
3.6
(1,9
22)
Third
Dec
ile77
,238
3.5
76,5
524.
368
691
,619
3.8
91,4
804.
513
9Fo
urth
Dec
ile96
,815
4.4
92,9
905.
23,
825
114,
459
4.7
109,
834
5.4
4,62
5Fi
fth D
ecile
120,
940
5.5
111,
548
6.2
9,39
114
1,71
65.
813
3,26
96.
58,
447
Six
th D
ecile
151,
566
6.9
136,
989
7.6
14,5
7717
5,54
17.
216
3,03
88.
012
,503
Sev
enth
Dec
ile19
3,20
18.
817
0,43
19.
522
,770
221,
874
9.1
199,
043
9.8
22,8
31E
ight
h D
ecile
255,
176
11.7
213,
692
11.9
41,4
8428
9,34
811
.925
0,70
812
.338
,640
Nin
th D
ecile
357,
220
16.3
285,
536
15.9
71,6
8440
3,70
516
.633
6,09
716
.567
,608
Tent
h D
ecile
838,
445
38.3
602,
412
33.6
236,
033
884,
478
36.3
634,
981
31.1
249,
497
Sou
rce:
Nat
iona
l Sta
tistic
s O
ffice
, 200
3 Fa
mily
Inco
me
and
Exp
endi
ture
Sur
vey
Tota
l In
com
e%
Tota
l E
xpen
ditu
re%
Tota
l S
avin
gsTo
tal
Inco
me
%To
tal
Exp
endi
ture
%To
tal
Sav
ings
Phili
ppin
es2,
187,
250
100.
01,
791,
133
100.
039
6,11
72,
141,
696
100.
01,
791,
275
100.
035
0,42
1
Firs
t Dec
ile36
,939
1.7
39,8
892.
2(2
,950
)38
,694
1.8
41,8
482.
3(3
,154
)S
econ
d D
ecile
59,7
112.
761
,093
3.4
(1,3
82)
61,9
292.
963
,618
3.6
(1,6
89)
Third
Dec
ile77
,238
3.5
76,5
524.
368
680
,509
3.8
80,3
874.
512
3Fo
urth
Dec
ile96
,815
4.4
92,9
905.
23,
825
100,
579
4.7
96,5
155.
44,
064
Fifth
Dec
ile12
0,94
05.
511
1,54
86.
29,
391
124,
531
5.8
117,
108
6.5
7,42
3S
ixth
Dec
ile15
1,56
66.
913
6,98
97.
614
,577
154,
254
7.2
143,
267
8.0
10,9
87S
even
th D
ecile
193,
201
8.8
170,
431
9.5
22,7
7019
4,96
99.
117
4,90
69.
820
,063
Eig
hth
Dec
ile25
5,17
611
.721
3,69
211
.941
,484
254,
261
11.9
220,
306
12.3
33,9
55N
inth
Dec
ile35
7,22
016
.328
5,53
615
.971
,684
354,
749
16.6
295,
340
16.5
59,4
09Te
nth
Dec
ile83
8,44
538
.360
2,41
233
.623
6,03
377
7,22
136
.355
7,98
031
.121
9,24
1
Sou
rce:
Nat
iona
l Sta
tistic
s O
ffice
, 200
3 Fa
mily
Inco
me
and
Exp
endi
ture
Sur
vey
TAB
LE 4
B. T
otal
Inco
me,
Tot
al E
xpen
ditu
res
and
Tota
l Sav
ings
of F
amili
es a
t 200
0 Pr
ices
, by
Nat
iona
l Inc
ome
Dec
ile:
2000
and
200
3(V
alue
s in
mill
ion
peso
s)
Dec
ile20
0020
03
TAB
LE 4
A. T
otal
Inco
me,
Tot
al E
xpen
ditu
res
and
Tota
l Sav
ings
of F
amili
es a
t Cur
rent
Pric
es, b
y N
atio
nal I
ncom
e D
ecile
: 20
00 a
nd 2
003
(Val
ues
in m
illio
n pe
sos)
Dec
ile20
0020
03
Average Income Average Expenditure
Average Saving Average Income Average
ExpenditureAverage
Saving
Philippines 145 119 26 148 124 24
First Decile 25 26 (2) 27 29 (2)Second Decile 40 41 (1) 43 44 (1)Third Decile 51 51 * 56 56 *Fourth Decile 64 62 3 69 67 3Fifth Decile 80 74 6 86 81 5Sixth Decile 101 91 10 107 99 8Seventh Decile 128 113 15 135 121 14Eighth Decile 169 142 28 176 152 23Ninth Decile 237 189 48 245 204 41Tenth Decile 556 400 157 537 385 151
Note: * less than 500 pesos
Source: National Statistics Office. 2003 Family Income and Expenditure Survey
Average Income Average Expenditure
Average Saving Average Income Average
ExpenditureAverage
Saving
Philippines 145 119 26 130 109 21
First Decile 25 26 (2) 23 25 (2)Second Decile 40 41 (1) 38 39 (1)Third Decile 51 51 * 49 49 *Fourth Decile 64 62 3 61 59 2Fifth Decile 80 74 6 76 71 5Sixth Decile 101 91 10 94 87 7Seventh Decile 128 113 15 118 106 12Eighth Decile 169 142 28 154 134 21Ninth Decile 237 189 48 215 179 36Tenth Decile 556 400 157 472 339 133
Note: * less than 500 pesos
Source: National Statistics Office. 2003 Family Income and Expenditure Survey
at Current Prices, by Income Decile: 2000 and 2003(Values in thousand pesos)
Decile2000 2003
TABLE 4C Average Annual Income, Average Annual Expenditure and Average Savings of Families
TABLE 4C Average Annual Income, Average Annual Expenditure and Average Savings of Families at Current Prices, by Income Decile: 2000 and 2003
(Values in thousand pesos)
2000 2003Decile
xxxviii 2003 Family Income and Expenditure Survey
Philippines
National Capital RegionCordillera Administrative Region I - IlocosII - Cagayan ValleyIII - Central Luzon IVA - CALABARZONIVB - MIMAROPAV - BicolVI - Western VisayasVII - Central Visayas VIII - Eastern VisayasIX - Zamboanga Peninsula 1/
X - Northern MindanaoXI - Davao XII - SOCCSKSARGEN 2/
XIII - CaragaAutonomous Region in Muslim Mindanao 3/
Notes: 1/ In 2000, Basilan including Isabela City was under Region IX. 2/ In 2000, Marawi City was a part of Region XII. 3/ Basilan province (excluding Isabela City), which was part of Region IX in 2000, has been transferred to
ARMM under EO 36.
Source: National Statistics Office, Family Income and Expenditure Survey
Philippines
National Capital RegionCordillera Administrative Region I - IlocosII - Cagayan ValleyIII - Central Luzon IVA - CALABARZONIVB - MIMAROPAV - BicolVI - Western VisayasVII - Central Visayas VIII - Eastern VisayasIX - Zamboanga PeninsulaX - Northern MindanaoXI - Davao XII - SOCCSKSARGENXIII - CaragaAutonomous Region in Muslim Mindanao
Source: National Statistics Office, Consumer Price Index
112.1114.7
Region
TABLE 6 Consumer Price Index by Region: 2003(2000 = 100)
110.1113.6112.8111.3
112.9113.6119.7112.0
112.2111.3114.7112.5
113.8
114.5115.2112.9
0.4605
Average CPI(2003)
0.35150.44100.39260.4296
0.43700.46600.43580.4036
0.48170.51970.45800.4707
0.35780.43030.47740.45740.4318
0.46310.41180.3171
0.46910.48070.47320.4794
0.44390.40710.4227
TABLE 5 Gini Concentration Ratio, by Region: 2000 and 2003
2003Region 2000
0.4822
0.4451 0.4021
0.4594
0.35910.40860.40760.4455
2003 Family Income and Expenditure Survey xxxix
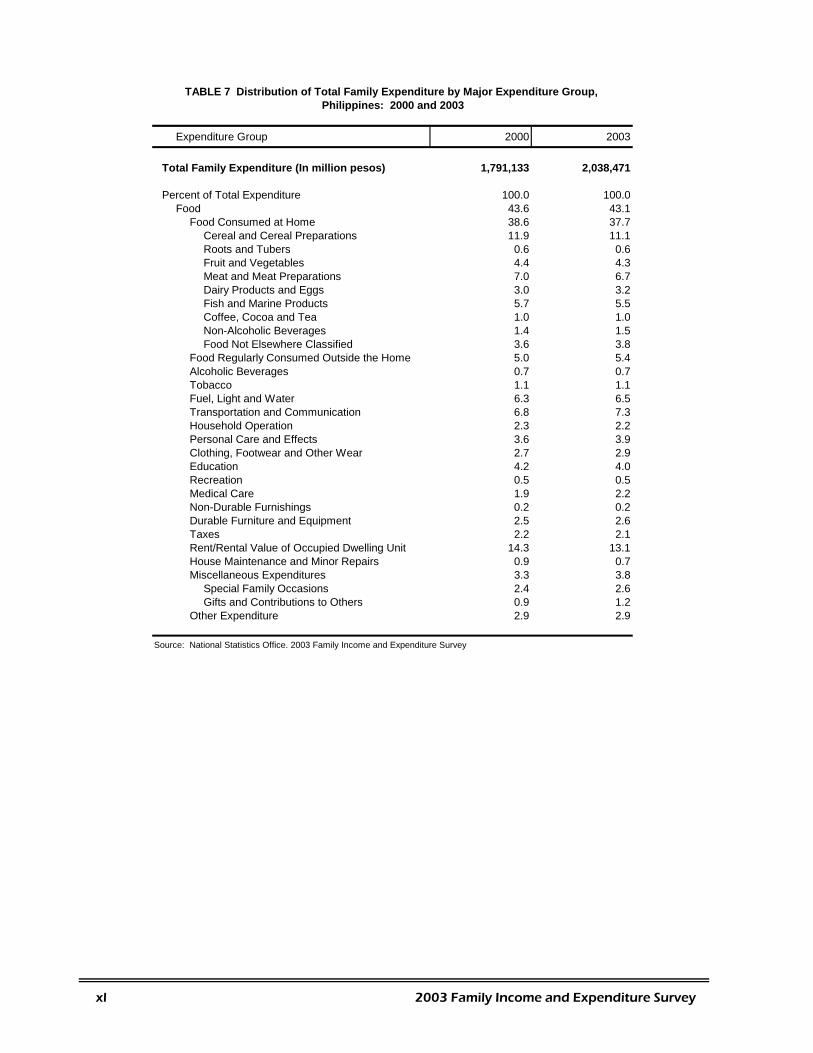
Expenditure Group 2000 2003
Total Family Expenditure (In million pesos) 1,791,133 2,038,471
Percent of Total Expenditure 100.0 100.0Food 43.6 43.1
Food Consumed at Home 38.6 37.7Cereal and Cereal Preparations 11.9 11.1Roots and Tubers 0.6 0.6Fruit and Vegetables 4.4 4.3Meat and Meat Preparations 7.0 6.7Dairy Products and Eggs 3.0 3.2Fish and Marine Products 5.7 5.5Coffee, Cocoa and Tea 1.0 1.0Non-Alcoholic Beverages 1.4 1.5Food Not Elsewhere Classified 3.6 3.8
Food Regularly Consumed Outside the Home 5.0 5.4Alcoholic Beverages 0.7 0.7Tobacco 1.1 1.1Fuel, Light and Water 6.3 6.5Transportation and Communication 6.8 7.3Household Operation 2.3 2.2Personal Care and Effects 3.6 3.9Clothing, Footwear and Other Wear 2.7 2.9Education 4.2 4.0Recreation 0.5 0.5Medical Care 1.9 2.2Non-Durable Furnishings 0.2 0.2Durable Furniture and Equipment 2.5 2.6Taxes 2.2 2.1Rent/Rental Value of Occupied Dwelling Unit 14.3 13.1House Maintenance and Minor Repairs 0.9 0.7Miscellaneous Expenditures 3.3 3.8
Special Family Occasions 2.4 2.6Gifts and Contributions to Others 0.9 1.2
Other Expenditure 2.9 2.9
Source: National Statistics Office. 2003 Family Income and Expenditure Survey
TABLE 7 Distribution of Total Family Expenditure by Major Expenditure Group, Philippines: 2000 and 2003
xl 2003 Family Income and Expenditure Survey
STATISTICAL TABLES
Region Total Average Total Average(In thousands) (In millions) (In thousands) (In millions) (In thousands)
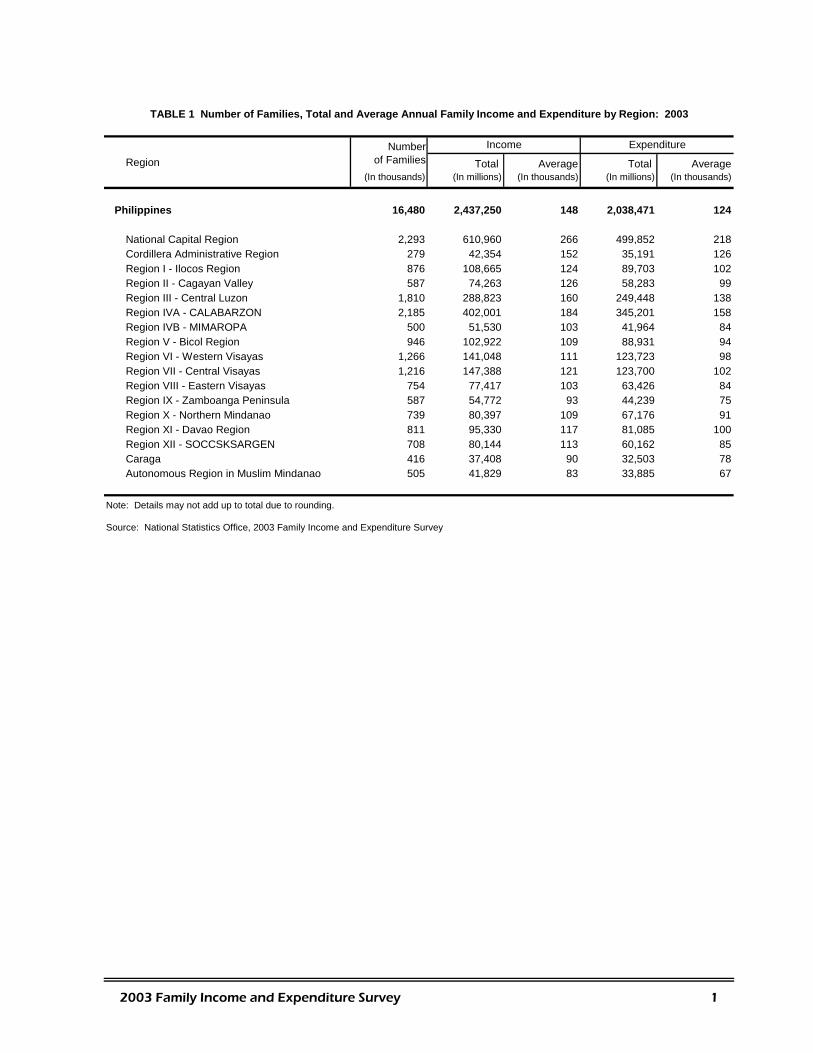
Philippines 16,480 2,437,250 148 2,038,471 124
National Capital Region 2,293 610,960 266 499,852 218Cordillera Administrative Region 279 42,354 152 35,191 126Region I - Ilocos Region 876 108,665 124 89,703 102Region II - Cagayan Valley 587 74,263 126 58,283 99Region III - Central Luzon 1,810 288,823 160 249,448 138Region IVA - CALABARZON 2,185 402,001 184 345,201 158Region IVB - MIMAROPA 500 51,530 103 41,964 84Region V - Bicol Region 946 102,922 109 88,931 94Region VI - Western Visayas 1,266 141,048 111 123,723 98Region VII - Central Visayas 1,216 147,388 121 123,700 102Region VIII - Eastern Visayas 754 77,417 103 63,426 84Region IX - Zamboanga Peninsula 587 54,772 93 44,239 75Region X - Northern Mindanao 739 80,397 109 67,176 91Region XI - Davao Region 811 95,330 117 81,085 100Region XII - SOCCSKSARGEN 708 80,144 113 60,162 85Caraga 416 37,408 90 32,503 78Autonomous Region in Muslim Mindanao 505 41,829 83 33,885 67
Note: Details may not add up to total due to rounding.
Source: National Statistics Office, 2003 Family Income and Expenditure Survey
Income ExpenditureNumber of Families
TABLE 1 Number of Families, Total and Average Annual Family Income and Expenditure by Region: 2003
2003 Family Income and Expenditure Survey 1
(In millions) (In thousands) (In millions) (In thousands)
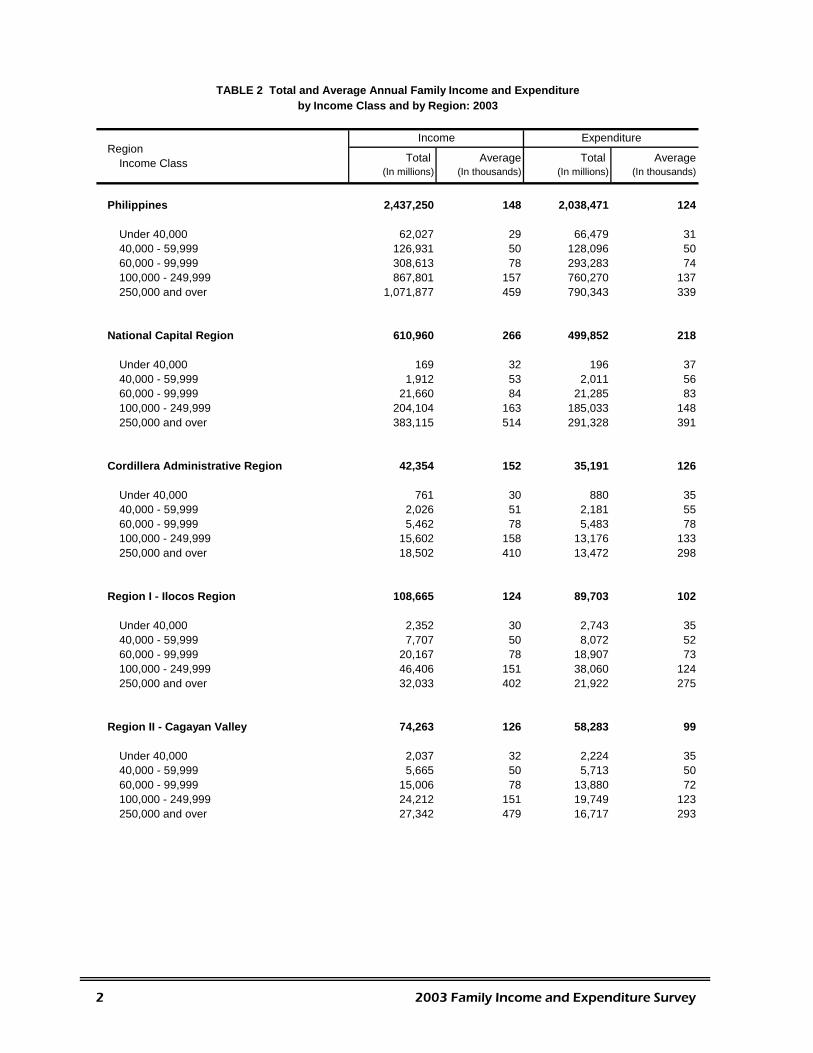
Philippines 2,437,250 148 2,038,471 124
Under 40,000 62,027 29 66,479 3140,000 - 59,999 126,931 50 128,096 5060,000 - 99,999 308,613 78 293,283 74100,000 - 249,999 867,801 157 760,270 137250,000 and over 1,071,877 459 790,343 339
National Capital Region 610,960 266 499,852 218
Under 40,000 169 32 196 3740,000 - 59,999 1,912 53 2,011 5660,000 - 99,999 21,660 84 21,285 83100,000 - 249,999 204,104 163 185,033 148250,000 and over 383,115 514 291,328 391
Cordillera Administrative Region 42,354 152 35,191 126
Under 40,000 761 30 880 3540,000 - 59,999 2,026 51 2,181 5560,000 - 99,999 5,462 78 5,483 78100,000 - 249,999 15,602 158 13,176 133250,000 and over 18,502 410 13,472 298
Region I - Ilocos Region 108,665 124 89,703 102
Under 40,000 2,352 30 2,743 3540,000 - 59,999 7,707 50 8,072 5260,000 - 99,999 20,167 78 18,907 73100,000 - 249,999 46,406 151 38,060 124250,000 and over 32,033 402 21,922 275
Region II - Cagayan Valley 74,263 126 58,283 99
Under 40,000 2,037 32 2,224 3540,000 - 59,999 5,665 50 5,713 5060,000 - 99,999 15,006 78 13,880 72100,000 - 249,999 24,212 151 19,749 123250,000 and over 27,342 479 16,717 293
Average
TABLE 2 Total and Average Annual Family Income and Expenditure by Income Class and by Region: 2003
RegionIncome Class
Income Expenditure
Total Average Total
2 2003 Family Income and Expenditure Survey
(In millions) (In thousands) (In millions) (In thousands)
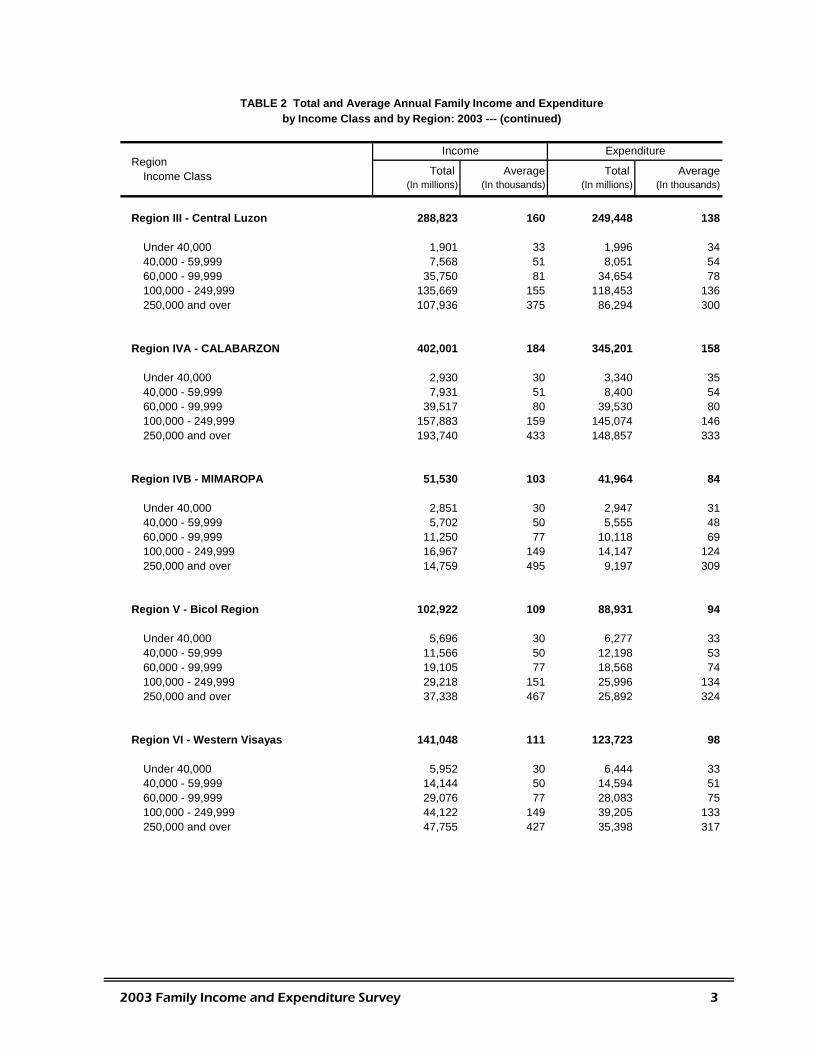
Region III - Central Luzon 288,823 160 249,448 138
Under 40,000 1,901 33 1,996 3440,000 - 59,999 7,568 51 8,051 5460,000 - 99,999 35,750 81 34,654 78100,000 - 249,999 135,669 155 118,453 136250,000 and over 107,936 375 86,294 300
Region IVA - CALABARZON 402,001 184 345,201 158
Under 40,000 2,930 30 3,340 3540,000 - 59,999 7,931 51 8,400 5460,000 - 99,999 39,517 80 39,530 80100,000 - 249,999 157,883 159 145,074 146250,000 and over 193,740 433 148,857 333
Region IVB - MIMAROPA 51,530 103 41,964 84
Under 40,000 2,851 30 2,947 3140,000 - 59,999 5,702 50 5,555 4860,000 - 99,999 11,250 77 10,118 69100,000 - 249,999 16,967 149 14,147 124250,000 and over 14,759 495 9,197 309
Region V - Bicol Region 102,922 109 88,931 94
Under 40,000 5,696 30 6,277 3340,000 - 59,999 11,566 50 12,198 5360,000 - 99,999 19,105 77 18,568 74100,000 - 249,999 29,218 151 25,996 134250,000 and over 37,338 467 25,892 324
Region VI - Western Visayas 141,048 111 123,723 98
Under 40,000 5,952 30 6,444 3340,000 - 59,999 14,144 50 14,594 5160,000 - 99,999 29,076 77 28,083 75100,000 - 249,999 44,122 149 39,205 133250,000 and over 47,755 427 35,398 317
RegionIncome Expenditure
Total Average Total AverageIncome Class
TABLE 2 Total and Average Annual Family Income and Expenditure by Income Class and by Region: 2003 --- (continued)
2003 Family Income and Expenditure Survey 3
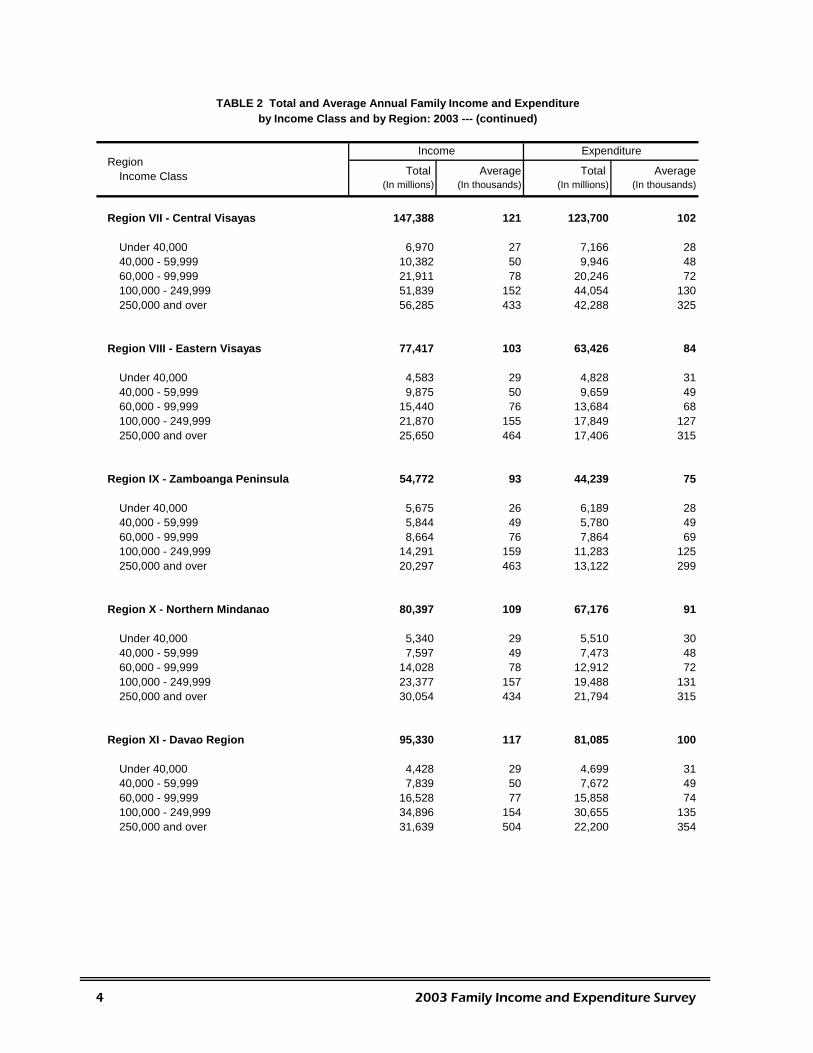
(In millions) (In thousands) (In millions) (In thousands)
Region VII - Central Visayas 147,388 121 123,700 102
Under 40,000 6,970 27 7,166 2840,000 - 59,999 10,382 50 9,946 4860,000 - 99,999 21,911 78 20,246 72100,000 - 249,999 51,839 152 44,054 130250,000 and over 56,285 433 42,288 325
Region VIII - Eastern Visayas 77,417 103 63,426 84
Under 40,000 4,583 29 4,828 3140,000 - 59,999 9,875 50 9,659 4960,000 - 99,999 15,440 76 13,684 68100,000 - 249,999 21,870 155 17,849 127250,000 and over 25,650 464 17,406 315
Region IX - Zamboanga Peninsula 54,772 93 44,239 75
Under 40,000 5,675 26 6,189 2840,000 - 59,999 5,844 49 5,780 4960,000 - 99,999 8,664 76 7,864 69100,000 - 249,999 14,291 159 11,283 125250,000 and over 20,297 463 13,122 299
Region X - Northern Mindanao 80,397 109 67,176 91
Under 40,000 5,340 29 5,510 3040,000 - 59,999 7,597 49 7,473 4860,000 - 99,999 14,028 78 12,912 72100,000 - 249,999 23,377 157 19,488 131250,000 and over 30,054 434 21,794 315
Region XI - Davao Region 95,330 117 81,085 100
Under 40,000 4,428 29 4,699 3140,000 - 59,999 7,839 50 7,672 4960,000 - 99,999 16,528 77 15,858 74100,000 - 249,999 34,896 154 30,655 135250,000 and over 31,639 504 22,200 354
by Income Class and by Region: 2003 --- (continued)TABLE 2 Total and Average Annual Family Income and Expenditure
RegionIncome Expenditure
Total Average Total AverageIncome Class
4 2003 Family Income and Expenditure Survey
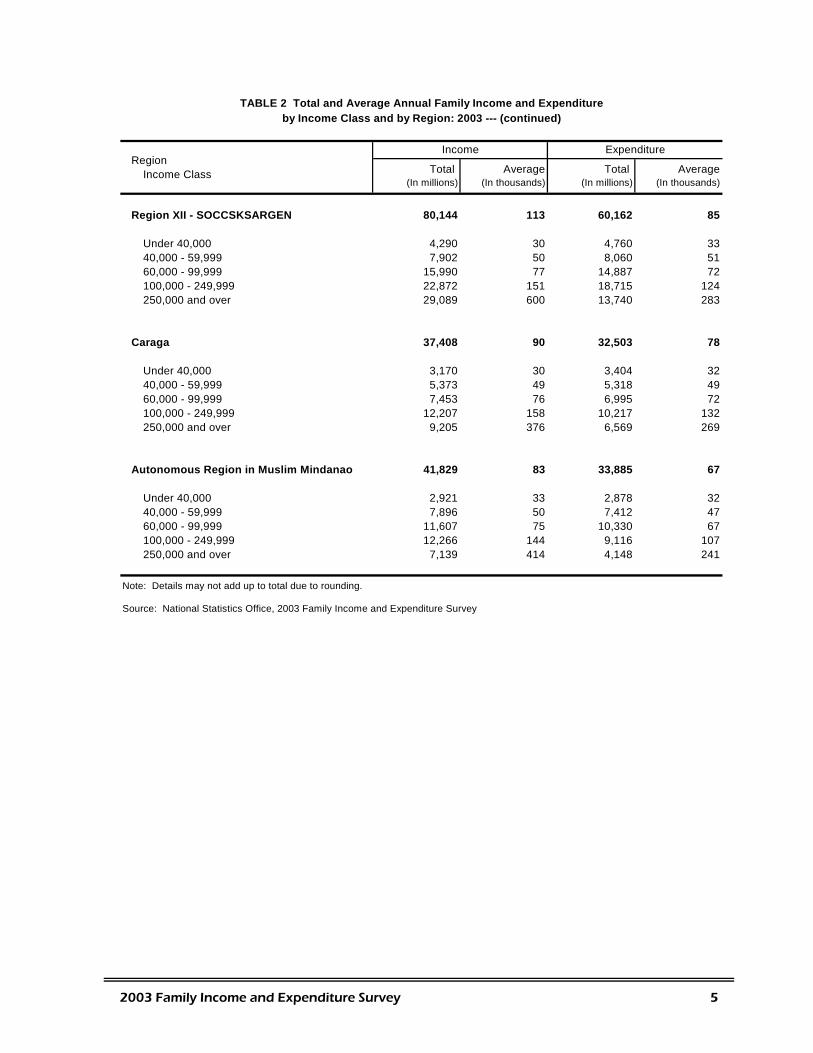
(In millions) (In thousands) (In millions) (In thousands)
Region XII - SOCCSKSARGEN 80,144 113 60,162 85
Under 40,000 4,290 30 4,760 3340,000 - 59,999 7,902 50 8,060 5160,000 - 99,999 15,990 77 14,887 72100,000 - 249,999 22,872 151 18,715 124250,000 and over 29,089 600 13,740 283
Caraga 37,408 90 32,503 78
Under 40,000 3,170 30 3,404 3240,000 - 59,999 5,373 49 5,318 4960,000 - 99,999 7,453 76 6,995 72100,000 - 249,999 12,207 158 10,217 132250,000 and over 9,205 376 6,569 269
Autonomous Region in Muslim Mindanao 41,829 83 33,885 67
Under 40,000 2,921 33 2,878 3240,000 - 59,999 7,896 50 7,412 4760,000 - 99,999 11,607 75 10,330 67100,000 - 249,999 12,266 144 9,116 107250,000 and over 7,139 414 4,148 241
Note: Details may not add up to total due to rounding.
Source: National Statistics Office, 2003 Family Income and Expenditure Survey
TABLE 2 Total and Average Annual Family Income and Expenditure by Income Class and by Region: 2003 --- (continued)
RegionIncome Expenditure
Total Average Total AverageIncome Class
2003 Family Income and Expenditure Survey 5
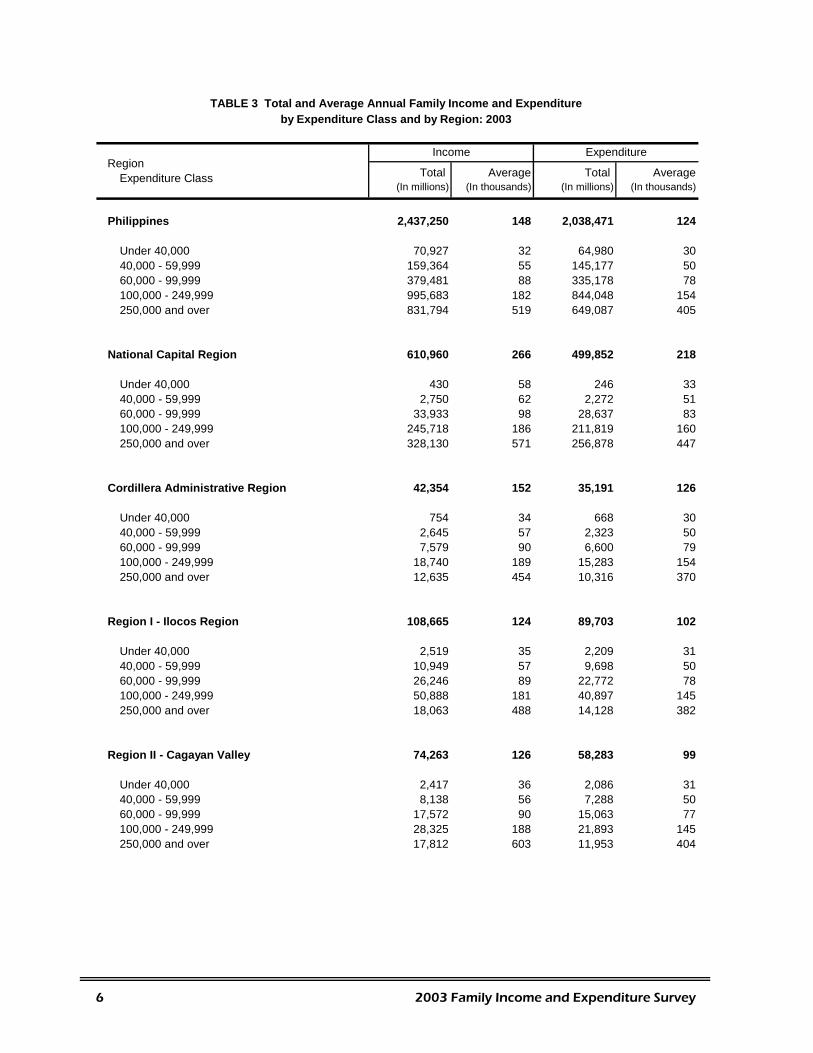
(In millions) (In thousands) (In millions) (In thousands)
Philippines 2,437,250 148 2,038,471 124
Under 40,000 70,927 32 64,980 3040,000 - 59,999 159,364 55 145,177 5060,000 - 99,999 379,481 88 335,178 78100,000 - 249,999 995,683 182 844,048 154250,000 and over 831,794 519 649,087 405
National Capital Region 610,960 266 499,852 218
Under 40,000 430 58 246 3340,000 - 59,999 2,750 62 2,272 5160,000 - 99,999 33,933 98 28,637 83100,000 - 249,999 245,718 186 211,819 160250,000 and over 328,130 571 256,878 447
Cordillera Administrative Region 42,354 152 35,191 126
Under 40,000 754 34 668 3040,000 - 59,999 2,645 57 2,323 5060,000 - 99,999 7,579 90 6,600 79100,000 - 249,999 18,740 189 15,283 154250,000 and over 12,635 454 10,316 370
Region I - Ilocos Region 108,665 124 89,703 102
Under 40,000 2,519 35 2,209 3140,000 - 59,999 10,949 57 9,698 5060,000 - 99,999 26,246 89 22,772 78100,000 - 249,999 50,888 181 40,897 145250,000 and over 18,063 488 14,128 382
Region II - Cagayan Valley 74,263 126 58,283 99
Under 40,000 2,417 36 2,086 3140,000 - 59,999 8,138 56 7,288 5060,000 - 99,999 17,572 90 15,063 77100,000 - 249,999 28,325 188 21,893 145250,000 and over 17,812 603 11,953 404
RegionAverageExpenditure Class
TABLE 3 Total and Average Annual Family Income and Expenditure by Expenditure Class and by Region: 2003
Income Expenditure
Total Average Total
6 2003 Family Income and Expenditure Survey
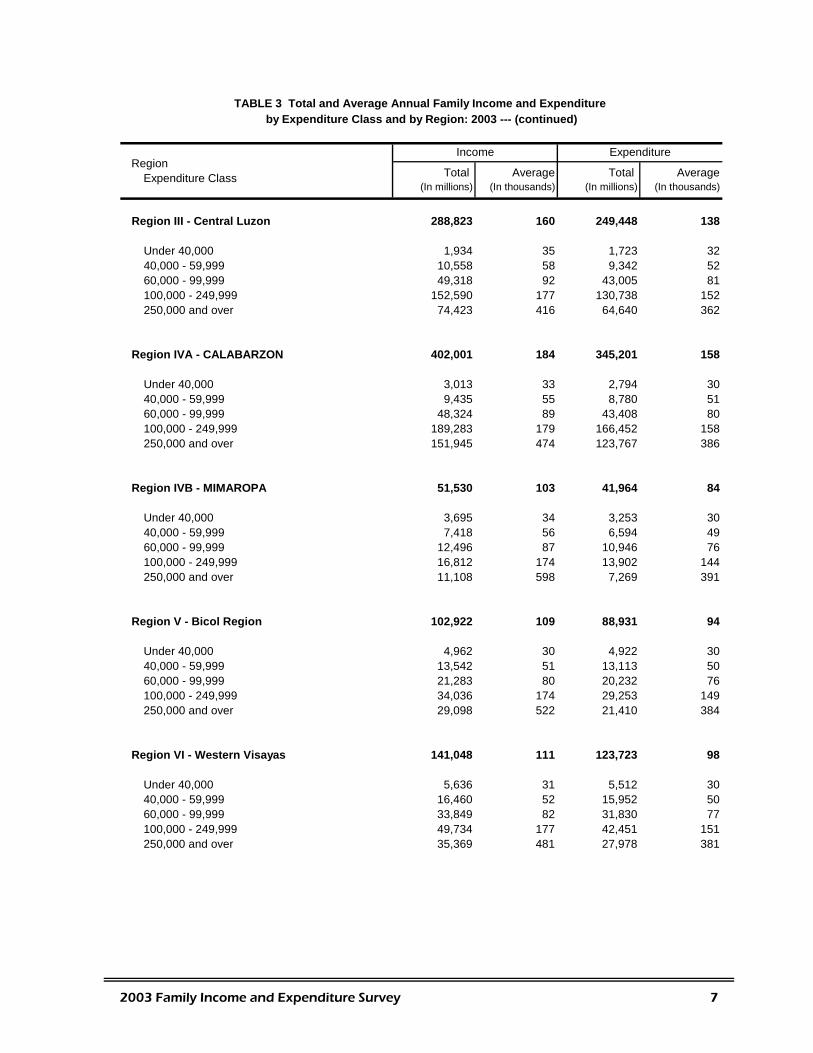
(In millions) (In thousands) (In millions) (In thousands)
Region III - Central Luzon 288,823 160 249,448 138
Under 40,000 1,934 35 1,723 3240,000 - 59,999 10,558 58 9,342 5260,000 - 99,999 49,318 92 43,005 81100,000 - 249,999 152,590 177 130,738 152250,000 and over 74,423 416 64,640 362
Region IVA - CALABARZON 402,001 184 345,201 158
Under 40,000 3,013 33 2,794 3040,000 - 59,999 9,435 55 8,780 5160,000 - 99,999 48,324 89 43,408 80100,000 - 249,999 189,283 179 166,452 158250,000 and over 151,945 474 123,767 386
Region IVB - MIMAROPA 51,530 103 41,964 84
Under 40,000 3,695 34 3,253 3040,000 - 59,999 7,418 56 6,594 4960,000 - 99,999 12,496 87 10,946 76100,000 - 249,999 16,812 174 13,902 144250,000 and over 11,108 598 7,269 391
Region V - Bicol Region 102,922 109 88,931 94
Under 40,000 4,962 30 4,922 3040,000 - 59,999 13,542 51 13,113 5060,000 - 99,999 21,283 80 20,232 76100,000 - 249,999 34,036 174 29,253 149250,000 and over 29,098 522 21,410 384
Region VI - Western Visayas 141,048 111 123,723 98
Under 40,000 5,636 31 5,512 3040,000 - 59,999 16,460 52 15,952 5060,000 - 99,999 33,849 82 31,830 77100,000 - 249,999 49,734 177 42,451 151250,000 and over 35,369 481 27,978 381
TABLE 3 Total and Average Annual Family Income and Expenditure by Expenditure Class and by Region: 2003 --- (continued)
RegionExpenditure Class
Income Expenditure
Total Average Total Average
2003 Family Income and Expenditure Survey 7
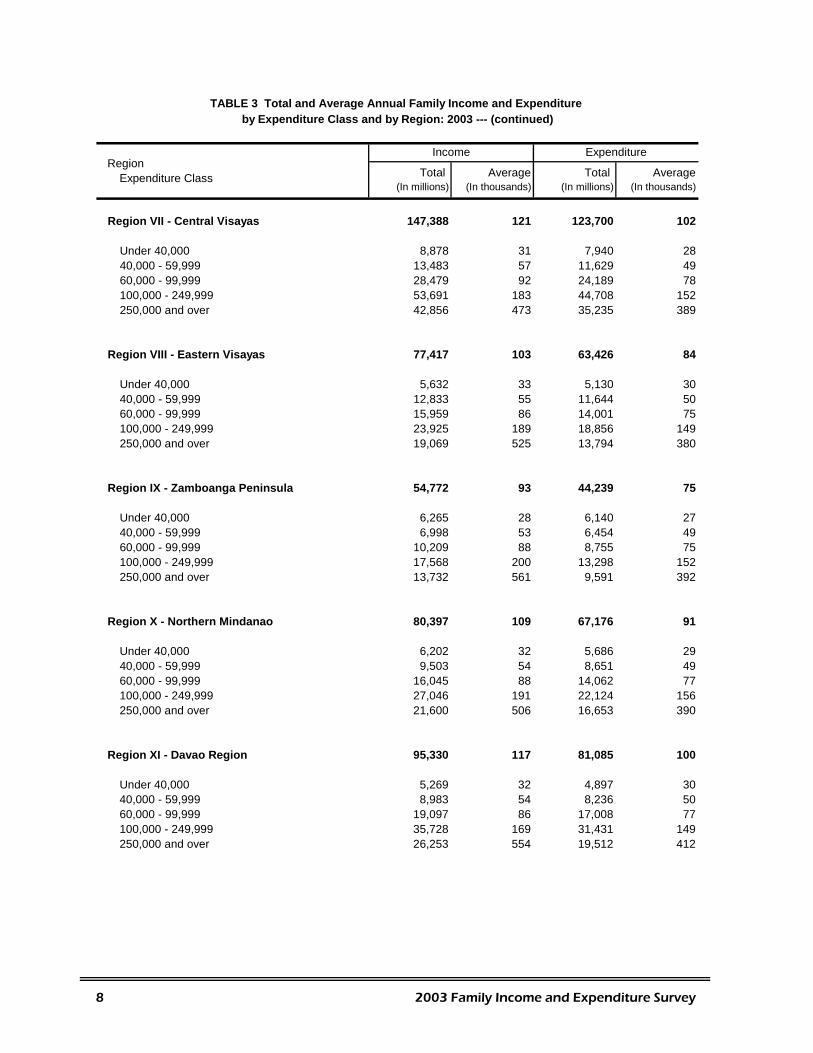
(In millions) (In thousands) (In millions) (In thousands)
Region VII - Central Visayas 147,388 121 123,700 102
Under 40,000 8,878 31 7,940 2840,000 - 59,999 13,483 57 11,629 4960,000 - 99,999 28,479 92 24,189 78100,000 - 249,999 53,691 183 44,708 152250,000 and over 42,856 473 35,235 389
Region VIII - Eastern Visayas 77,417 103 63,426 84
Under 40,000 5,632 33 5,130 3040,000 - 59,999 12,833 55 11,644 5060,000 - 99,999 15,959 86 14,001 75100,000 - 249,999 23,925 189 18,856 149250,000 and over 19,069 525 13,794 380
Region IX - Zamboanga Peninsula 54,772 93 44,239 75
Under 40,000 6,265 28 6,140 2740,000 - 59,999 6,998 53 6,454 4960,000 - 99,999 10,209 88 8,755 75100,000 - 249,999 17,568 200 13,298 152250,000 and over 13,732 561 9,591 392
Region X - Northern Mindanao 80,397 109 67,176 91
Under 40,000 6,202 32 5,686 2940,000 - 59,999 9,503 54 8,651 4960,000 - 99,999 16,045 88 14,062 77100,000 - 249,999 27,046 191 22,124 156250,000 and over 21,600 506 16,653 390
Region XI - Davao Region 95,330 117 81,085 100
Under 40,000 5,269 32 4,897 3040,000 - 59,999 8,983 54 8,236 5060,000 - 99,999 19,097 86 17,008 77100,000 - 249,999 35,728 169 31,431 149250,000 and over 26,253 554 19,512 412
RegionExpenditure Class
Income Expenditure
TABLE 3 Total and Average Annual Family Income and Expenditure by Expenditure Class and by Region: 2003 --- (continued)
Total Average Total Average
8 2003 Family Income and Expenditure Survey
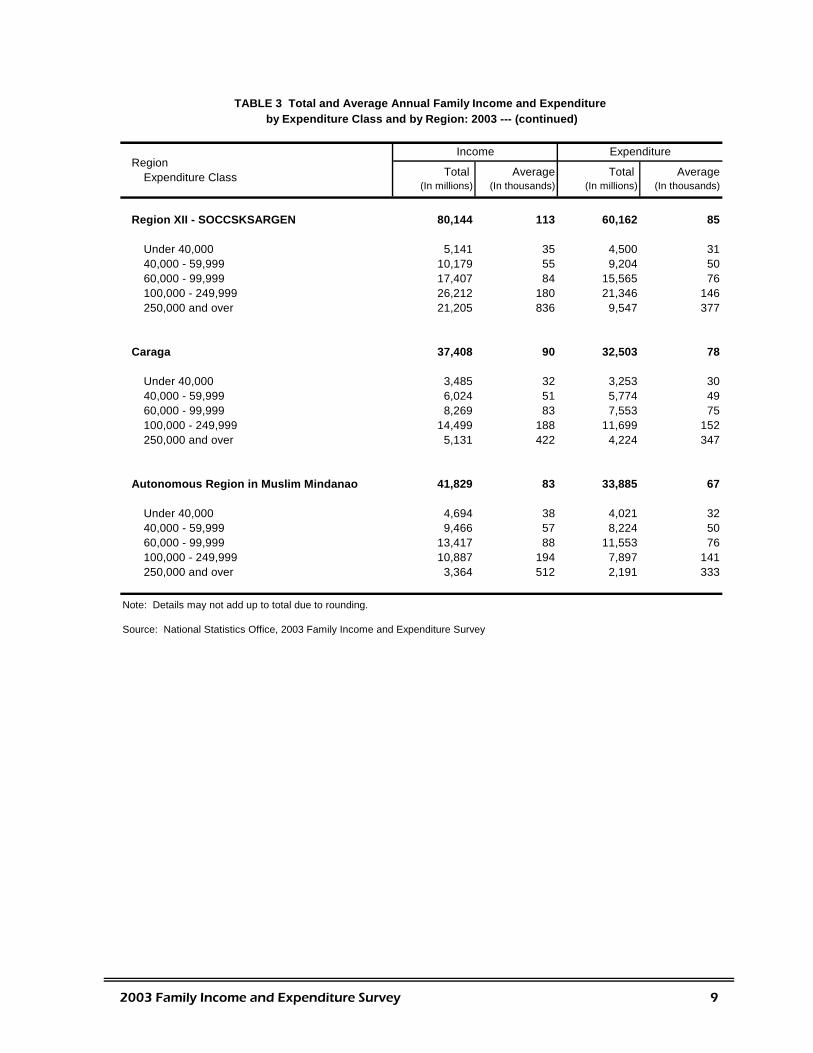
(In millions) (In thousands) (In millions) (In thousands)
Region XII - SOCCSKSARGEN 80,144 113 60,162 85
Under 40,000 5,141 35 4,500 3140,000 - 59,999 10,179 55 9,204 5060,000 - 99,999 17,407 84 15,565 76100,000 - 249,999 26,212 180 21,346 146250,000 and over 21,205 836 9,547 377
Caraga 37,408 90 32,503 78
Under 40,000 3,485 32 3,253 3040,000 - 59,999 6,024 51 5,774 4960,000 - 99,999 8,269 83 7,553 75100,000 - 249,999 14,499 188 11,699 152250,000 and over 5,131 422 4,224 347
Autonomous Region in Muslim Mindanao 41,829 83 33,885 67
Under 40,000 4,694 38 4,021 3240,000 - 59,999 9,466 57 8,224 5060,000 - 99,999 13,417 88 11,553 76100,000 - 249,999 10,887 194 7,897 141250,000 and over 3,364 512 2,191 333
Note: Details may not add up to total due to rounding.
Source: National Statistics Office, 2003 Family Income and Expenditure Survey
TABLE 3 Total and Average Annual Family Income and Expenditure by Expenditure Class and by Region: 2003 --- (continued)
RegionExpenditure Class
Income Expenditure
Total Average Total Average
2003 Family Income and Expenditure Survey 9
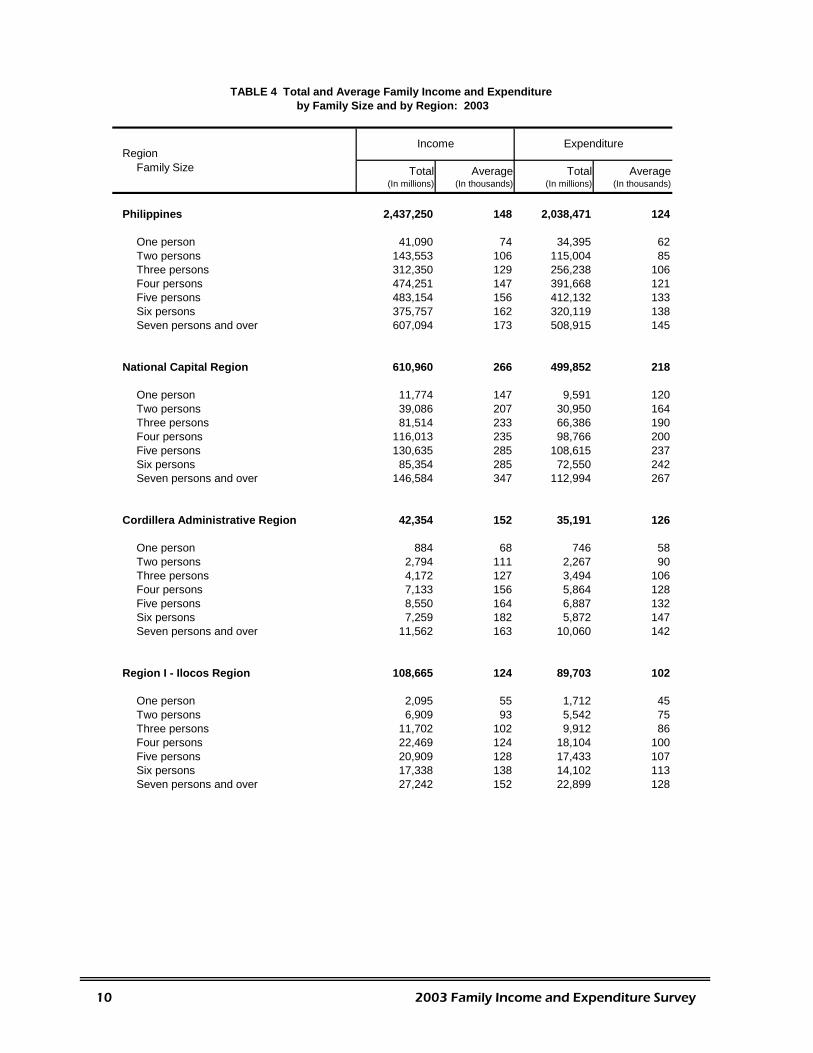
RegionFamily Size Total
(In millions)Average
(In thousands)Total
(In millions)Average
(In thousands)
Philippines 2,437,250 148 2,038,471 124
One person 41,090 74 34,395 62Two persons 143,553 106 115,004 85Three persons 312,350 129 256,238 106Four persons 474,251 147 391,668 121Five persons 483,154 156 412,132 133Six persons 375,757 162 320,119 138Seven persons and over 607,094 173 508,915 145
National Capital Region 610,960 266 499,852 218
One person 11,774 147 9,591 120Two persons 39,086 207 30,950 164Three persons 81,514 233 66,386 190Four persons 116,013 235 98,766 200Five persons 130,635 285 108,615 237Six persons 85,354 285 72,550 242Seven persons and over 146,584 347 112,994 267
Cordillera Administrative Region 42,354 152 35,191 126
One person 884 68 746 58Two persons 2,794 111 2,267 90Three persons 4,172 127 3,494 106Four persons 7,133 156 5,864 128Five persons 8,550 164 6,887 132Six persons 7,259 182 5,872 147Seven persons and over 11,562 163 10,060 142
Region I - Ilocos Region 108,665 124 89,703 102
One person 2,095 55 1,712 45Two persons 6,909 93 5,542 75Three persons 11,702 102 9,912 86Four persons 22,469 124 18,104 100Five persons 20,909 128 17,433 107Six persons 17,338 138 14,102 113Seven persons and over 27,242 152 22,899 128
TABLE 4 Total and Average Family Income and Expenditure by Family Size and by Region: 2003
Income Expenditure
10 2003 Family Income and Expenditure Survey
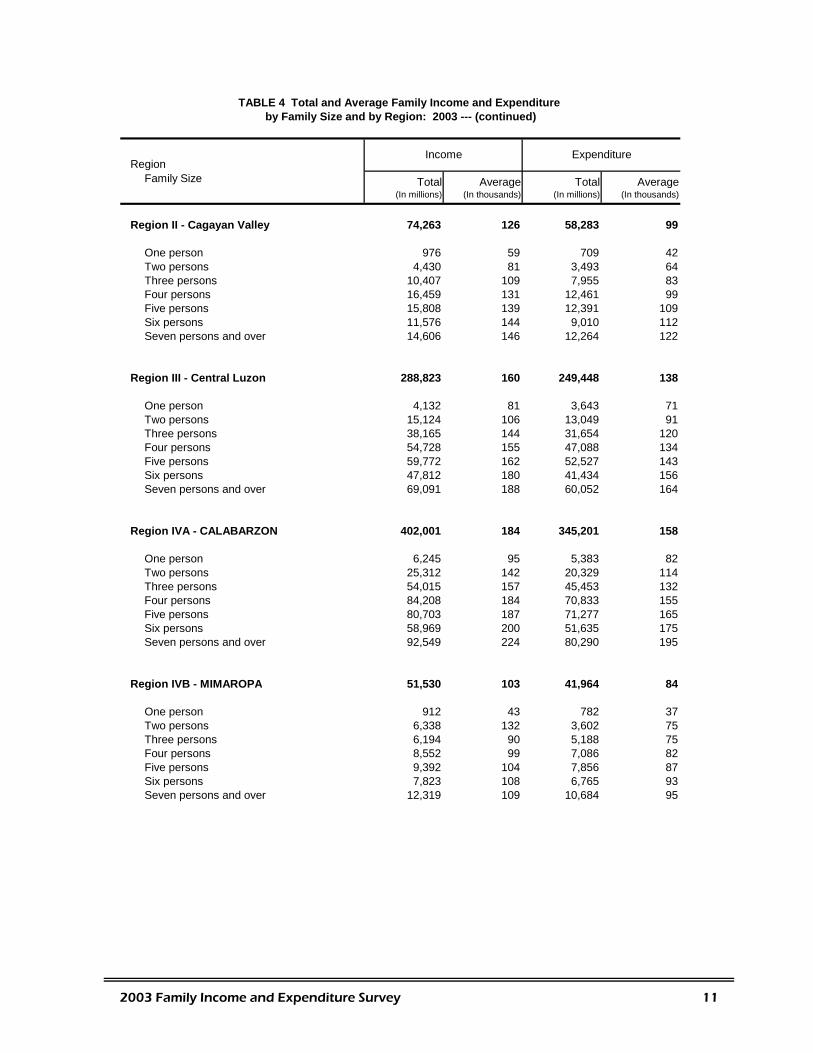
RegionFamily Size Total
(In millions)Average
(In thousands)Total
(In millions)Average
(In thousands)
Region II - Cagayan Valley 74,263 126 58,283 99
One person 976 59 709 42Two persons 4,430 81 3,493 64Three persons 10,407 109 7,955 83Four persons 16,459 131 12,461 99Five persons 15,808 139 12,391 109Six persons 11,576 144 9,010 112Seven persons and over 14,606 146 12,264 122
Region III - Central Luzon 288,823 160 249,448 138
One person 4,132 81 3,643 71Two persons 15,124 106 13,049 91Three persons 38,165 144 31,654 120Four persons 54,728 155 47,088 134Five persons 59,772 162 52,527 143Six persons 47,812 180 41,434 156Seven persons and over 69,091 188 60,052 164
Region IVA - CALABARZON 402,001 184 345,201 158
One person 6,245 95 5,383 82Two persons 25,312 142 20,329 114Three persons 54,015 157 45,453 132Four persons 84,208 184 70,833 155Five persons 80,703 187 71,277 165Six persons 58,969 200 51,635 175Seven persons and over 92,549 224 80,290 195
Region IVB - MIMAROPA 51,530 103 41,964 84
One person 912 43 782 37Two persons 6,338 132 3,602 75Three persons 6,194 90 5,188 75Four persons 8,552 99 7,086 82Five persons 9,392 104 7,856 87Six persons 7,823 108 6,765 93Seven persons and over 12,319 109 10,684 95
TABLE 4 Total and Average Family Income and Expenditure by Family Size and by Region: 2003 --- (continued)
Income Expenditure
2003 Family Income and Expenditure Survey 11
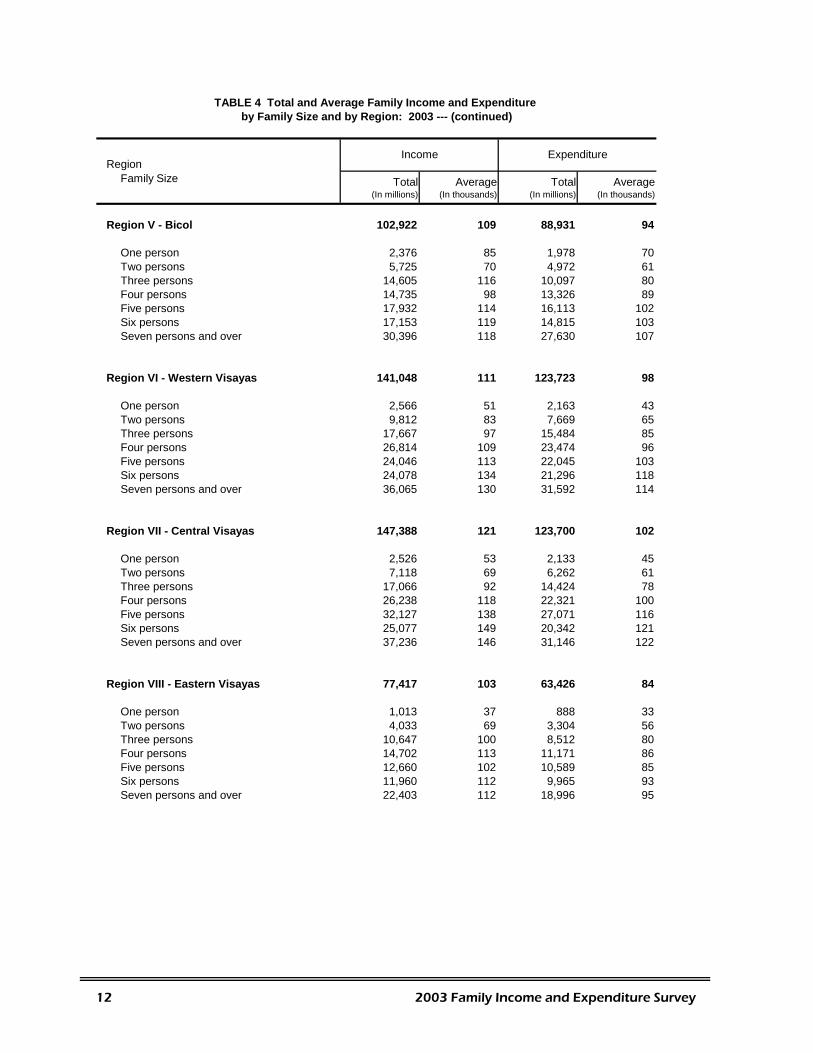
RegionFamily Size Total
(In millions)Average
(In thousands)Total
(In millions)Average
(In thousands)
Region V - Bicol 102,922 109 88,931 94
One person 2,376 85 1,978 70Two persons 5,725 70 4,972 61Three persons 14,605 116 10,097 80Four persons 14,735 98 13,326 89Five persons 17,932 114 16,113 102Six persons 17,153 119 14,815 103Seven persons and over 30,396 118 27,630 107
Region VI - Western Visayas 141,048 111 123,723 98
One person 2,566 51 2,163 43Two persons 9,812 83 7,669 65Three persons 17,667 97 15,484 85Four persons 26,814 109 23,474 96Five persons 24,046 113 22,045 103Six persons 24,078 134 21,296 118Seven persons and over 36,065 130 31,592 114
Region VII - Central Visayas 147,388 121 123,700 102
One person 2,526 53 2,133 45Two persons 7,118 69 6,262 61Three persons 17,066 92 14,424 78Four persons 26,238 118 22,321 100Five persons 32,127 138 27,071 116Six persons 25,077 149 20,342 121Seven persons and over 37,236 146 31,146 122
Region VIII - Eastern Visayas 77,417 103 63,426 84
One person 1,013 37 888 33Two persons 4,033 69 3,304 56Three persons 10,647 100 8,512 80Four persons 14,702 113 11,171 86Five persons 12,660 102 10,589 85Six persons 11,960 112 9,965 93Seven persons and over 22,403 112 18,996 95
TABLE 4 Total and Average Family Income and Expenditure by Family Size and by Region: 2003 --- (continued)
Income Expenditure
12 2003 Family Income and Expenditure Survey
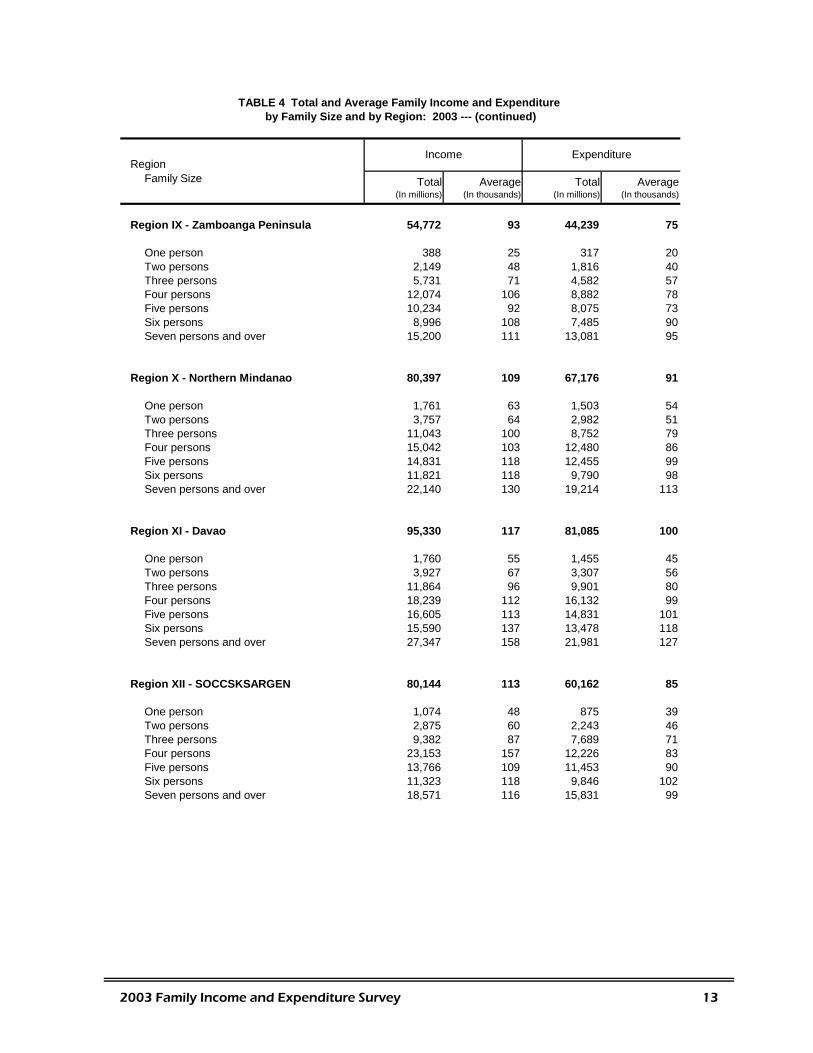
RegionFamily Size Total
(In millions)Average
(In thousands)Total
(In millions)Average
(In thousands)
Region IX - Zamboanga Peninsula 54,772 93 44,239 75
One person 388 25 317 20Two persons 2,149 48 1,816 40Three persons 5,731 71 4,582 57Four persons 12,074 106 8,882 78Five persons 10,234 92 8,075 73Six persons 8,996 108 7,485 90Seven persons and over 15,200 111 13,081 95
Region X - Northern Mindanao 80,397 109 67,176 91
One person 1,761 63 1,503 54Two persons 3,757 64 2,982 51Three persons 11,043 100 8,752 79Four persons 15,042 103 12,480 86Five persons 14,831 118 12,455 99Six persons 11,821 118 9,790 98Seven persons and over 22,140 130 19,214 113
Region XI - Davao 95,330 117 81,085 100
One person 1,760 55 1,455 45Two persons 3,927 67 3,307 56Three persons 11,864 96 9,901 80Four persons 18,239 112 16,132 99Five persons 16,605 113 14,831 101Six persons 15,590 137 13,478 118Seven persons and over 27,347 158 21,981 127
Region XII - SOCCSKSARGEN 80,144 113 60,162 85
One person 1,074 48 875 39Two persons 2,875 60 2,243 46Three persons 9,382 87 7,689 71Four persons 23,153 157 12,226 83Five persons 13,766 109 11,453 90Six persons 11,323 118 9,846 102Seven persons and over 18,571 116 15,831 99
TABLE 4 Total and Average Family Income and Expenditure by Family Size and by Region: 2003 --- (continued)
Income Expenditure
2003 Family Income and Expenditure Survey 13
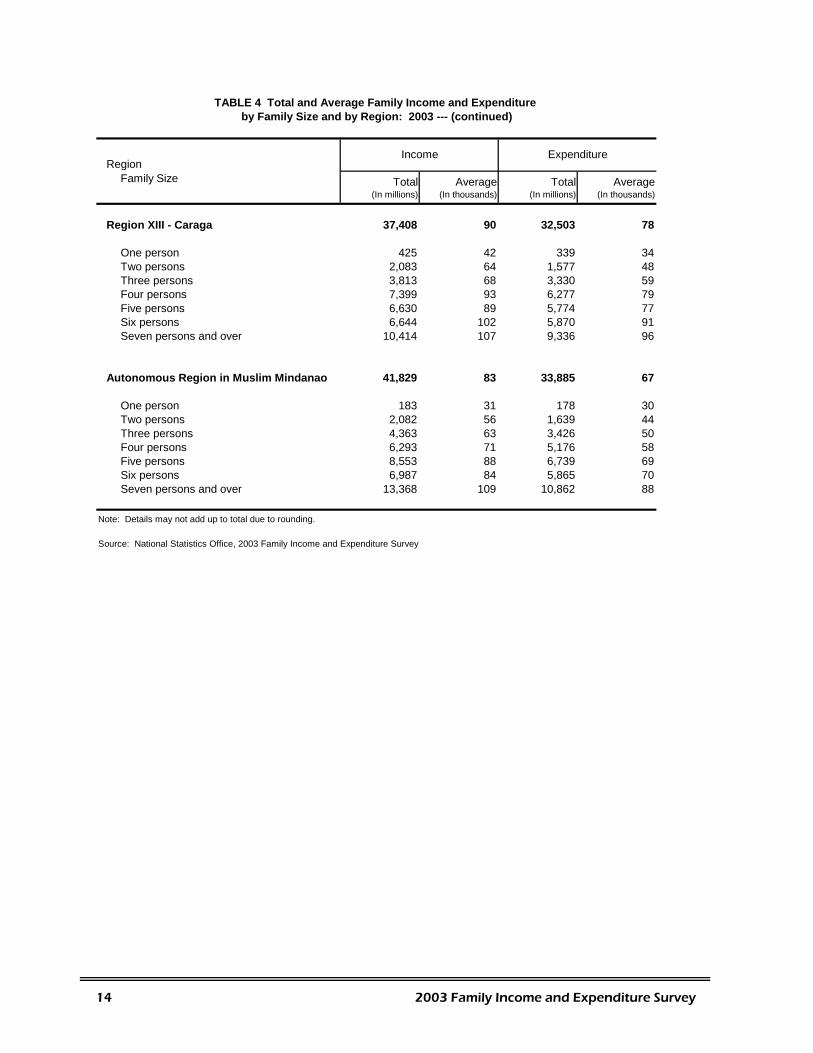
RegionFamily Size Total
(In millions)Average
(In thousands)Total
(In millions)Average
(In thousands)
Region XIII - Caraga 37,408 90 32,503 78
One person 425 42 339 34Two persons 2,083 64 1,577 48Three persons 3,813 68 3,330 59Four persons 7,399 93 6,277 79Five persons 6,630 89 5,774 77Six persons 6,644 102 5,870 91Seven persons and over 10,414 107 9,336 96
Autonomous Region in Muslim Mindanao 41,829 83 33,885 67
One person 183 31 178 30Two persons 2,082 56 1,639 44Three persons 4,363 63 3,426 50Four persons 6,293 71 5,176 58Five persons 8,553 88 6,739 69Six persons 6,987 84 5,865 70Seven persons and over 13,368 109 10,862 88
Note: Details may not add up to total due to rounding.
Source: National Statistics Office, 2003 Family Income and Expenditure Survey
TABLE 4 Total and Average Family Income and Expenditure by Family Size and by Region: 2003 --- (continued)
Income Expenditure
14 2003 Family Income and Expenditure Survey
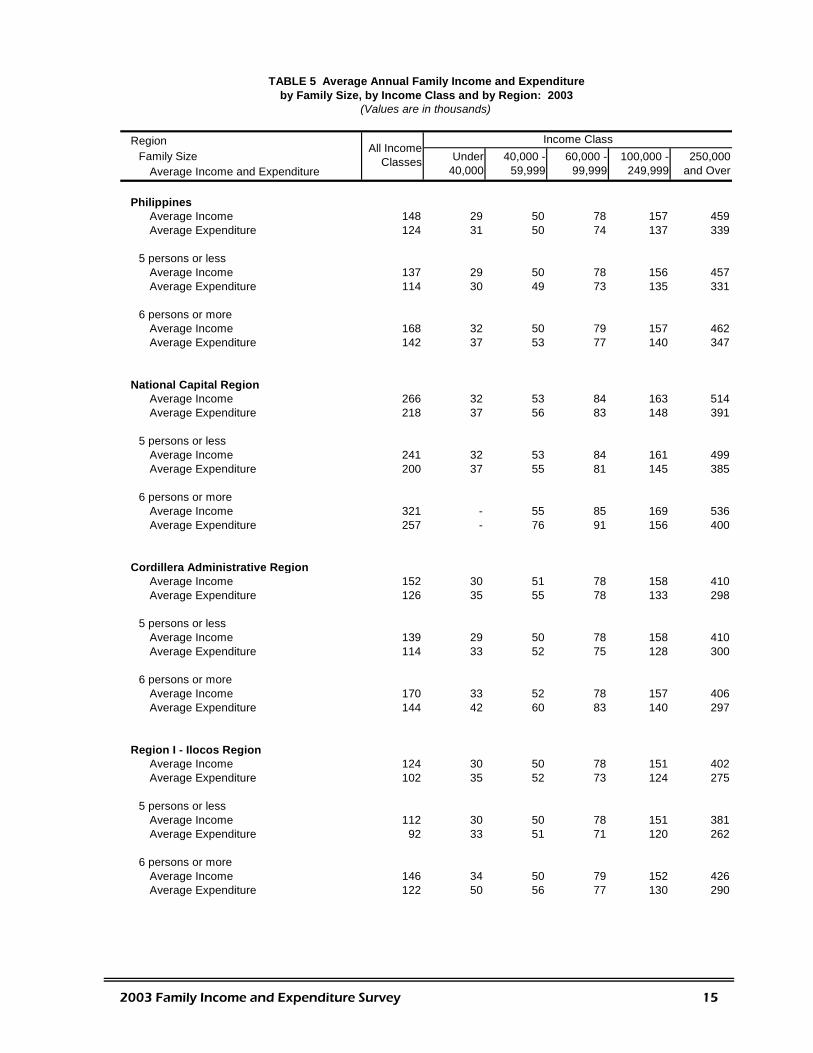
RegionFamily Size
Average Income and Expenditure
PhilippinesAverage Income 148 29 50 78 157 459Average Expenditure 124 31 50 74 137 339
5 persons or lessAverage Income 137 29 50 78 156 457Average Expenditure 114 30 49 73 135 331
6 persons or moreAverage Income 168 32 50 79 157 462Average Expenditure 142 37 53 77 140 347
National Capital RegionAverage Income 266 32 53 84 163 514Average Expenditure 218 37 56 83 148 391
5 persons or lessAverage Income 241 32 53 84 161 499Average Expenditure 200 37 55 81 145 385
6 persons or moreAverage Income 321 - 55 85 169 536Average Expenditure 257 - 76 91 156 400
Cordillera Administrative RegionAverage Income 152 30 51 78 158 410Average Expenditure 126 35 55 78 133 298
5 persons or lessAverage Income 139 29 50 78 158 410Average Expenditure 114 33 52 75 128 300
6 persons or moreAverage Income 170 33 52 78 157 406Average Expenditure 144 42 60 83 140 297
Region I - Ilocos RegionAverage Income 124 30 50 78 151 402Average Expenditure 102 35 52 73 124 275
5 persons or lessAverage Income 112 30 50 78 151 381Average Expenditure 92 33 51 71 120 262
6 persons or moreAverage Income 146 34 50 79 152 426Average Expenditure 122 50 56 77 130 290
by Family Size, by Income Class and by Region: 2003(Values are in thousands)
All Income Classes Under
40,00040,000 -
59,99960,000 -
99,999100,000 -
249,999250,000
and Over
Income Class
TABLE 5 Average Annual Family Income and Expenditure
2003 Family Income and Expenditure Survey 15
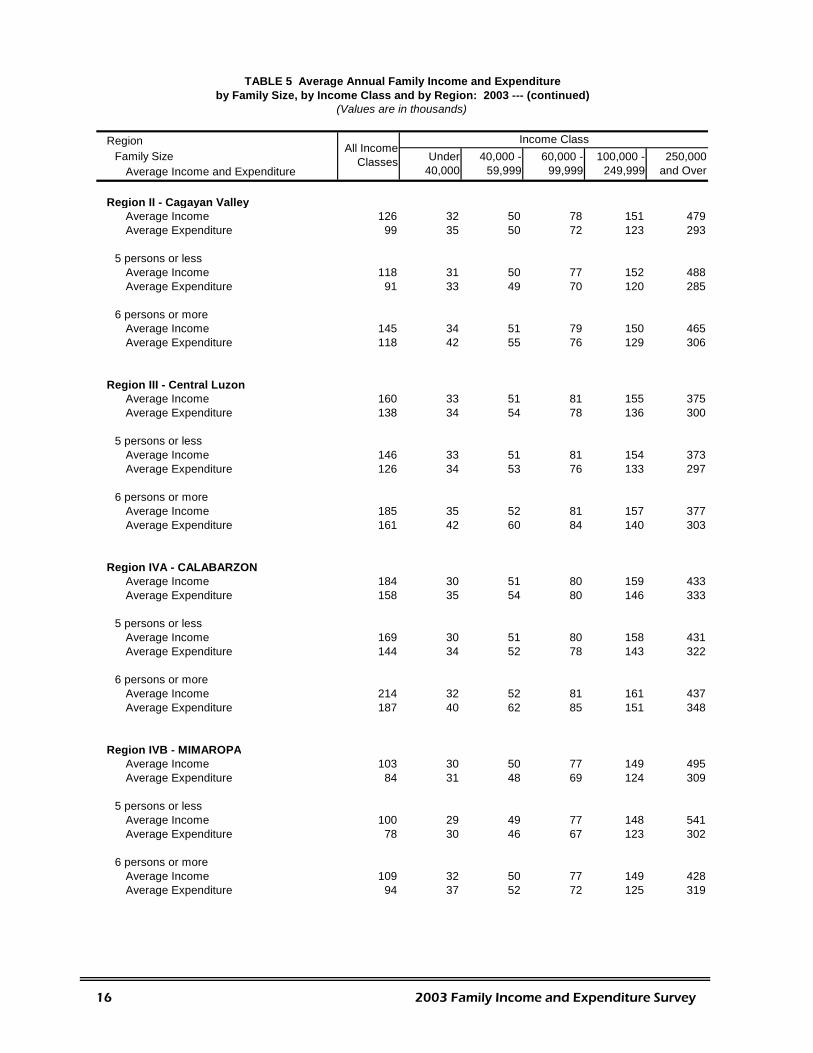
RegionFamily Size
Average Income and Expenditure
Region II - Cagayan ValleyAverage Income 126 32 50 78 151 479Average Expenditure 99 35 50 72 123 293
5 persons or lessAverage Income 118 31 50 77 152 488Average Expenditure 91 33 49 70 120 285
6 persons or moreAverage Income 145 34 51 79 150 465Average Expenditure 118 42 55 76 129 306
Region III - Central LuzonAverage Income 160 33 51 81 155 375Average Expenditure 138 34 54 78 136 300
5 persons or lessAverage Income 146 33 51 81 154 373Average Expenditure 126 34 53 76 133 297
6 persons or moreAverage Income 185 35 52 81 157 377Average Expenditure 161 42 60 84 140 303
Region IVA - CALABARZONAverage Income 184 30 51 80 159 433Average Expenditure 158 35 54 80 146 333
5 persons or lessAverage Income 169 30 51 80 158 431Average Expenditure 144 34 52 78 143 322
6 persons or moreAverage Income 214 32 52 81 161 437Average Expenditure 187 40 62 85 151 348
Region IVB - MIMAROPAAverage Income 103 30 50 77 149 495Average Expenditure 84 31 48 69 124 309
5 persons or lessAverage Income 100 29 49 77 148 541Average Expenditure 78 30 46 67 123 302
6 persons or moreAverage Income 109 32 50 77 149 428Average Expenditure 94 37 52 72 125 319
by Family Size, by Income Class and by Region: 2003 --- (continued)(Values are in thousands)
All Income Classes
Income ClassUnder
40,00040,000 -
59,99960,000 -
99,999100,000 -
249,999250,000
and Over
TABLE 5 Average Annual Family Income and Expenditure
16 2003 Family Income and Expenditure Survey
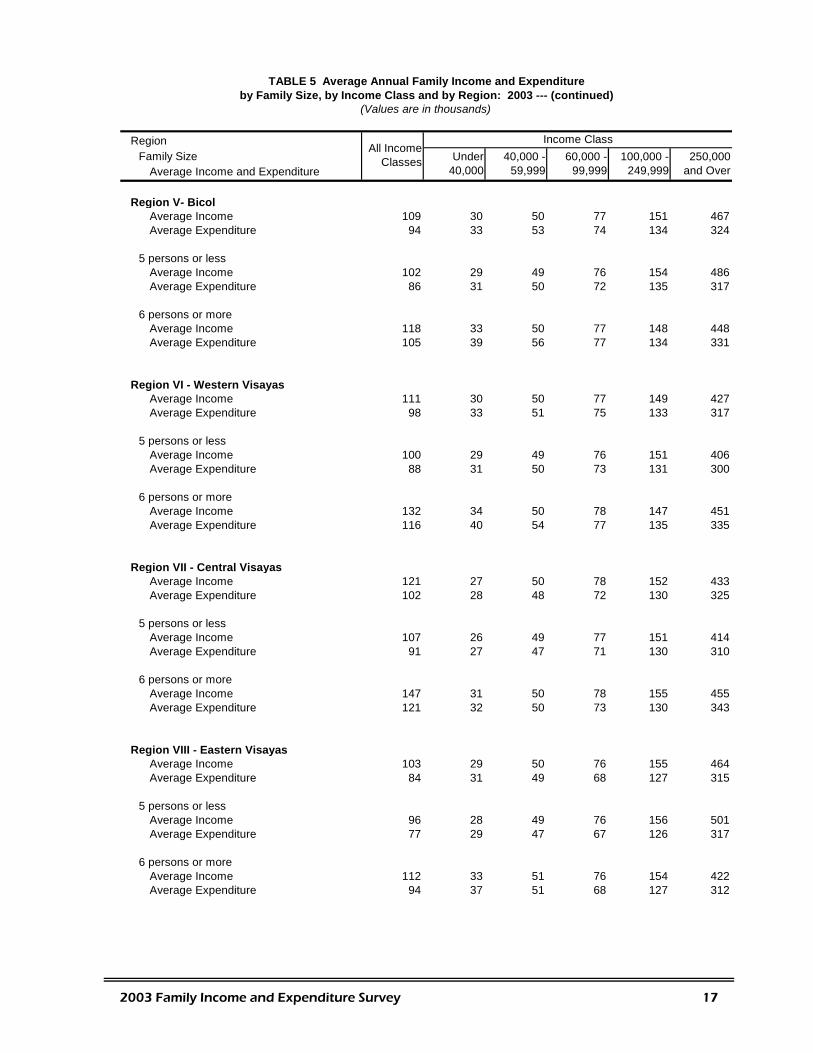
RegionFamily Size
Average Income and Expenditure
Region V- BicolAverage Income 109 30 50 77 151 467Average Expenditure 94 33 53 74 134 324
5 persons or lessAverage Income 102 29 49 76 154 486Average Expenditure 86 31 50 72 135 317
6 persons or moreAverage Income 118 33 50 77 148 448Average Expenditure 105 39 56 77 134 331
Region VI - Western VisayasAverage Income 111 30 50 77 149 427Average Expenditure 98 33 51 75 133 317
5 persons or lessAverage Income 100 29 49 76 151 406Average Expenditure 88 31 50 73 131 300
6 persons or moreAverage Income 132 34 50 78 147 451Average Expenditure 116 40 54 77 135 335
Region VII - Central VisayasAverage Income 121 27 50 78 152 433Average Expenditure 102 28 48 72 130 325
5 persons or lessAverage Income 107 26 49 77 151 414Average Expenditure 91 27 47 71 130 310
6 persons or moreAverage Income 147 31 50 78 155 455Average Expenditure 121 32 50 73 130 343
Region VIII - Eastern VisayasAverage Income 103 29 50 76 155 464Average Expenditure 84 31 49 68 127 315
5 persons or lessAverage Income 96 28 49 76 156 501Average Expenditure 77 29 47 67 126 317
6 persons or moreAverage Income 112 33 51 76 154 422Average Expenditure 94 37 51 68 127 312
by Family Size, by Income Class and by Region: 2003 --- (continued)(Values are in thousands)
All Income Classes
Income ClassUnder
40,00040,000 -
59,99960,000 -
99,999100,000 -
249,999250,000
and Over
TABLE 5 Average Annual Family Income and Expenditure
2003 Family Income and Expenditure Survey 17
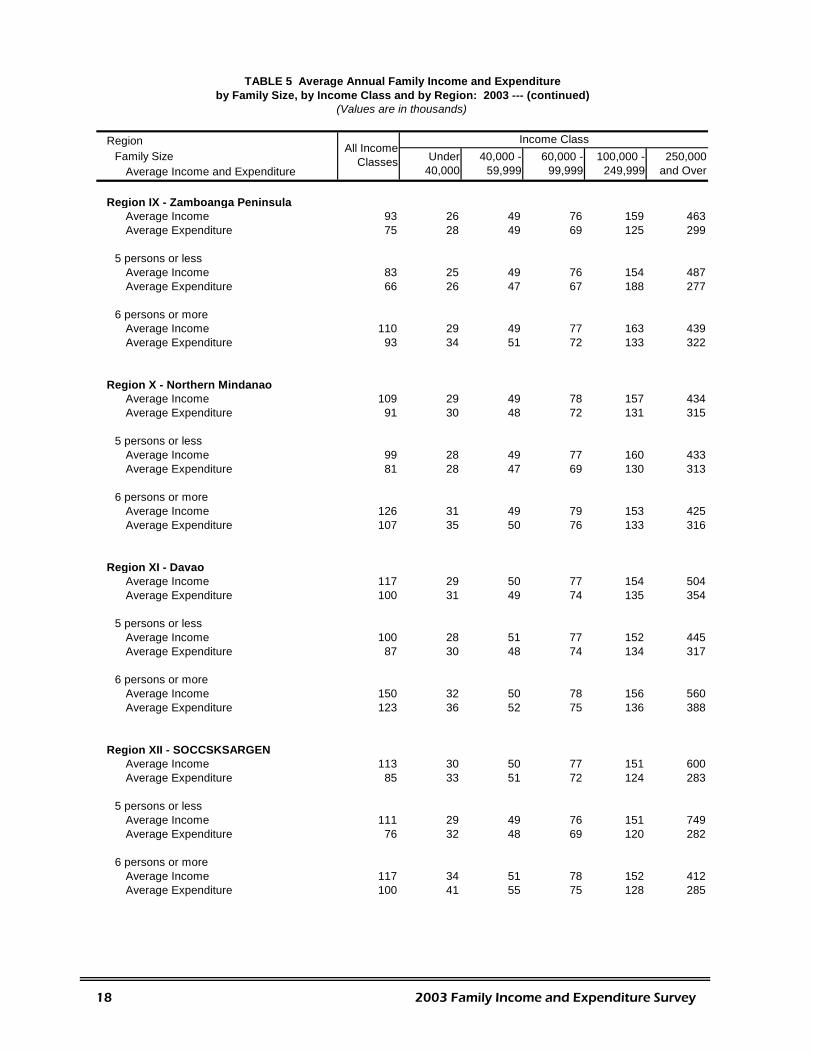
RegionFamily Size
Average Income and Expenditure
Region IX - Zamboanga PeninsulaAverage Income 93 26 49 76 159 463Average Expenditure 75 28 49 69 125 299
5 persons or lessAverage Income 83 25 49 76 154 487Average Expenditure 66 26 47 67 188 277
6 persons or moreAverage Income 110 29 49 77 163 439Average Expenditure 93 34 51 72 133 322
Region X - Northern MindanaoAverage Income 109 29 49 78 157 434Average Expenditure 91 30 48 72 131 315
5 persons or lessAverage Income 99 28 49 77 160 433Average Expenditure 81 28 47 69 130 313
6 persons or moreAverage Income 126 31 49 79 153 425Average Expenditure 107 35 50 76 133 316
Region XI - DavaoAverage Income 117 29 50 77 154 504Average Expenditure 100 31 49 74 135 354
5 persons or lessAverage Income 100 28 51 77 152 445Average Expenditure 87 30 48 74 134 317
6 persons or moreAverage Income 150 32 50 78 156 560Average Expenditure 123 36 52 75 136 388
Region XII - SOCCSKSARGENAverage Income 113 30 50 77 151 600Average Expenditure 85 33 51 72 124 283
5 persons or lessAverage Income 111 29 49 76 151 749Average Expenditure 76 32 48 69 120 282
6 persons or moreAverage Income 117 34 51 78 152 412Average Expenditure 100 41 55 75 128 285
by Family Size, by Income Class and by Region: 2003 --- (continued)(Values are in thousands)
All Income Classes
Income ClassUnder
40,00040,000 -
59,99960,000 -
99,999100,000 -
249,999250,000
and Over
TABLE 5 Average Annual Family Income and Expenditure
18 2003 Family Income and Expenditure Survey
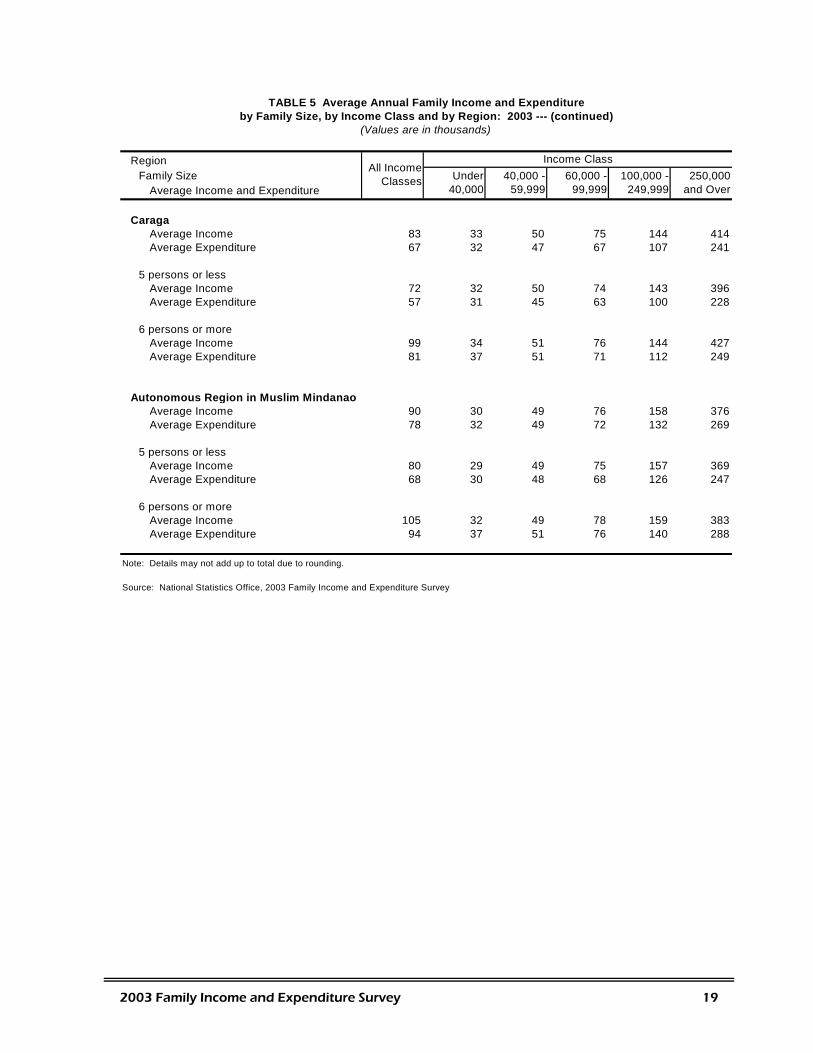
RegionFamily Size
Average Income and Expenditure
CaragaAverage Income 83 33 50 75 144 414Average Expenditure 67 32 47 67 107 241
5 persons or lessAverage Income 72 32 50 74 143 396Average Expenditure 57 31 45 63 100 228
6 persons or moreAverage Income 99 34 51 76 144 427Average Expenditure 81 37 51 71 112 249
Autonomous Region in Muslim MindanaoAverage Income 90 30 49 76 158 376Average Expenditure 78 32 49 72 132 269
5 persons or lessAverage Income 80 29 49 75 157 369Average Expenditure 68 30 48 68 126 247
6 persons or moreAverage Income 105 32 49 78 159 383Average Expenditure 94 37 51 76 140 288
Note: Details may not add up to total due to rounding.
Source: National Statistics Office, 2003 Family Income and Expenditure Survey
TABLE 5 Average Annual Family Income and Expenditureby Family Size, by Income Class and by Region: 2003 --- (continued)
(Values are in thousands)
All Income Classes
Income ClassUnder
40,00040,000 -
59,99960,000 -
99,999100,000 -
249,999250,000
and Over
2003 Family Income and Expenditure Survey 19
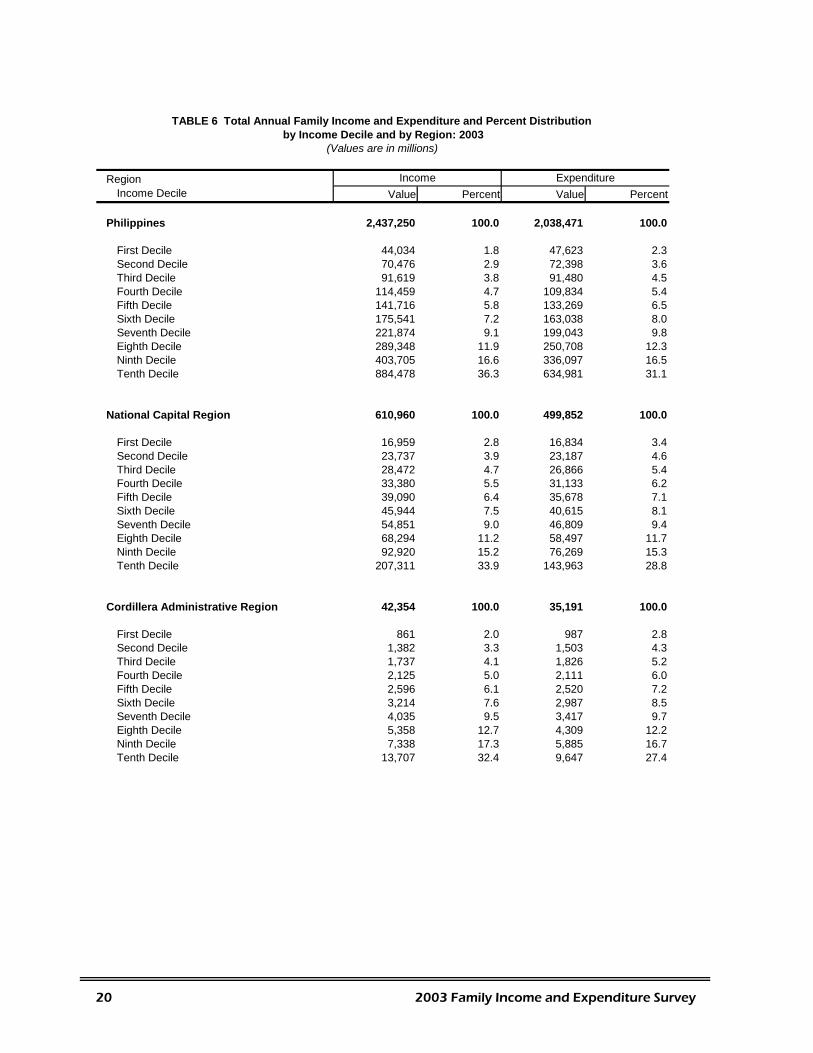
RegionIncome Decile Value Percent Value Percent
Philippines 2,437,250 100.0 2,038,471 100.0
First Decile 44,034 1.8 47,623 2.3Second Decile 70,476 2.9 72,398 3.6Third Decile 91,619 3.8 91,480 4.5Fourth Decile 114,459 4.7 109,834 5.4Fifth Decile 141,716 5.8 133,269 6.5Sixth Decile 175,541 7.2 163,038 8.0Seventh Decile 221,874 9.1 199,043 9.8Eighth Decile 289,348 11.9 250,708 12.3Ninth Decile 403,705 16.6 336,097 16.5Tenth Decile 884,478 36.3 634,981 31.1
National Capital Region 610,960 100.0 499,852 100.0
First Decile 16,959 2.8 16,834 3.4Second Decile 23,737 3.9 23,187 4.6Third Decile 28,472 4.7 26,866 5.4Fourth Decile 33,380 5.5 31,133 6.2Fifth Decile 39,090 6.4 35,678 7.1Sixth Decile 45,944 7.5 40,615 8.1Seventh Decile 54,851 9.0 46,809 9.4Eighth Decile 68,294 11.2 58,497 11.7Ninth Decile 92,920 15.2 76,269 15.3Tenth Decile 207,311 33.9 143,963 28.8
Cordillera Administrative Region 42,354 100.0 35,191 100.0
First Decile 861 2.0 987 2.8Second Decile 1,382 3.3 1,503 4.3Third Decile 1,737 4.1 1,826 5.2Fourth Decile 2,125 5.0 2,111 6.0Fifth Decile 2,596 6.1 2,520 7.2Sixth Decile 3,214 7.6 2,987 8.5Seventh Decile 4,035 9.5 3,417 9.7Eighth Decile 5,358 12.7 4,309 12.2Ninth Decile 7,338 17.3 5,885 16.7Tenth Decile 13,707 32.4 9,647 27.4
TABLE 6 Total Annual Family Income and Expenditure and Percent Distribution by Income Decile and by Region: 2003
(Values are in millions)
Income Expenditure
20 2003 Family Income and Expenditure Survey
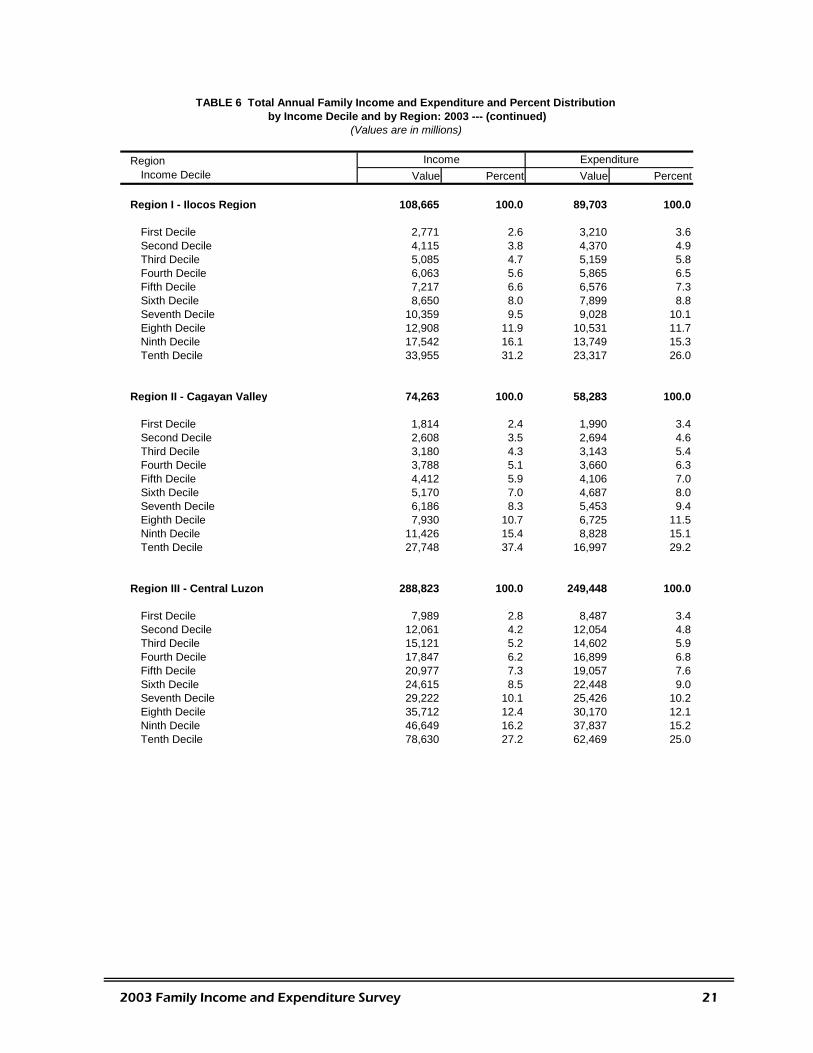
RegionIncome Decile Value Percent Value Percent
Region I - Ilocos Region 108,665 100.0 89,703 100.0
First Decile 2,771 2.6 3,210 3.6Second Decile 4,115 3.8 4,370 4.9Third Decile 5,085 4.7 5,159 5.8Fourth Decile 6,063 5.6 5,865 6.5Fifth Decile 7,217 6.6 6,576 7.3Sixth Decile 8,650 8.0 7,899 8.8Seventh Decile 10,359 9.5 9,028 10.1Eighth Decile 12,908 11.9 10,531 11.7Ninth Decile 17,542 16.1 13,749 15.3Tenth Decile 33,955 31.2 23,317 26.0
Region II - Cagayan Valley 74,263 100.0 58,283 100.0
First Decile 1,814 2.4 1,990 3.4Second Decile 2,608 3.5 2,694 4.6Third Decile 3,180 4.3 3,143 5.4Fourth Decile 3,788 5.1 3,660 6.3Fifth Decile 4,412 5.9 4,106 7.0Sixth Decile 5,170 7.0 4,687 8.0Seventh Decile 6,186 8.3 5,453 9.4Eighth Decile 7,930 10.7 6,725 11.5Ninth Decile 11,426 15.4 8,828 15.1Tenth Decile 27,748 37.4 16,997 29.2
Region III - Central Luzon 288,823 100.0 249,448 100.0
First Decile 7,989 2.8 8,487 3.4Second Decile 12,061 4.2 12,054 4.8Third Decile 15,121 5.2 14,602 5.9Fourth Decile 17,847 6.2 16,899 6.8Fifth Decile 20,977 7.3 19,057 7.6Sixth Decile 24,615 8.5 22,448 9.0Seventh Decile 29,222 10.1 25,426 10.2Eighth Decile 35,712 12.4 30,170 12.1Ninth Decile 46,649 16.2 37,837 15.2Tenth Decile 78,630 27.2 62,469 25.0
(Values are in millions)
TABLE 6 Total Annual Family Income and Expenditure and Percent Distribution by Income Decile and by Region: 2003 --- (continued)
Income Expenditure
2003 Family Income and Expenditure Survey 21
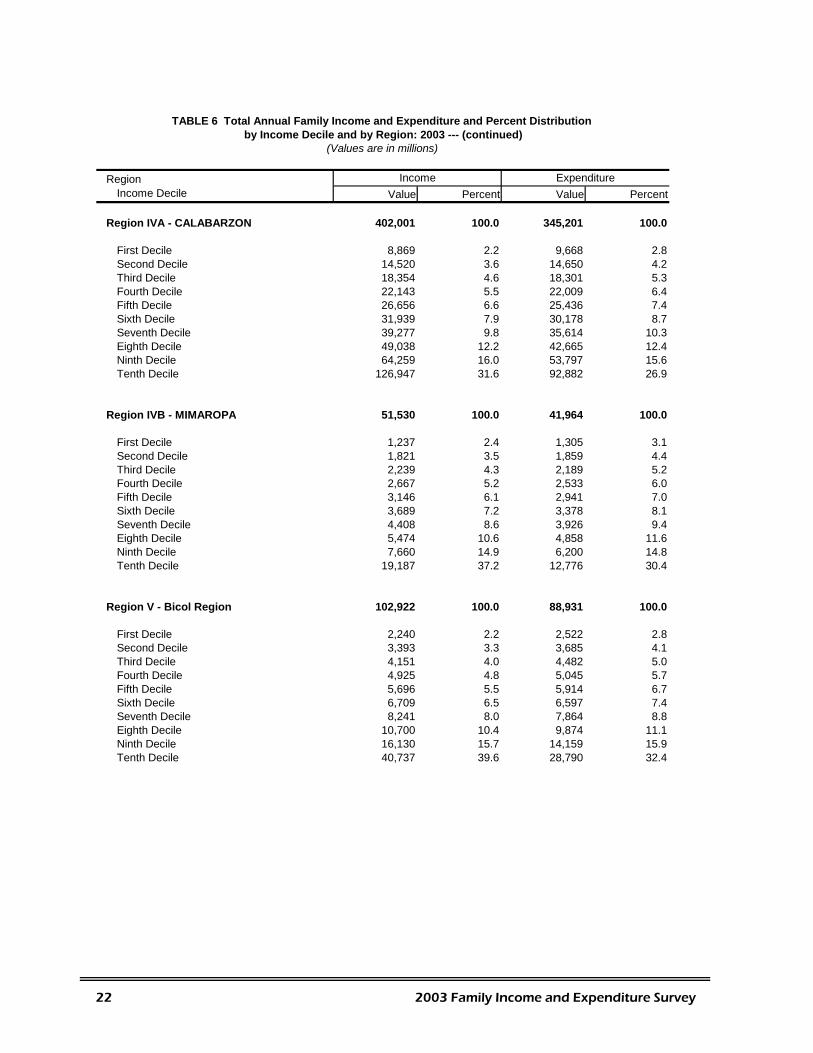
RegionIncome Decile Value Percent Value Percent
Region IVA - CALABARZON 402,001 100.0 345,201 100.0
First Decile 8,869 2.2 9,668 2.8Second Decile 14,520 3.6 14,650 4.2Third Decile 18,354 4.6 18,301 5.3Fourth Decile 22,143 5.5 22,009 6.4Fifth Decile 26,656 6.6 25,436 7.4Sixth Decile 31,939 7.9 30,178 8.7Seventh Decile 39,277 9.8 35,614 10.3Eighth Decile 49,038 12.2 42,665 12.4Ninth Decile 64,259 16.0 53,797 15.6Tenth Decile 126,947 31.6 92,882 26.9
Region IVB - MIMAROPA 51,530 100.0 41,964 100.0
First Decile 1,237 2.4 1,305 3.1Second Decile 1,821 3.5 1,859 4.4Third Decile 2,239 4.3 2,189 5.2Fourth Decile 2,667 5.2 2,533 6.0Fifth Decile 3,146 6.1 2,941 7.0Sixth Decile 3,689 7.2 3,378 8.1Seventh Decile 4,408 8.6 3,926 9.4Eighth Decile 5,474 10.6 4,858 11.6Ninth Decile 7,660 14.9 6,200 14.8Tenth Decile 19,187 37.2 12,776 30.4
Region V - Bicol Region 102,922 100.0 88,931 100.0
First Decile 2,240 2.2 2,522 2.8Second Decile 3,393 3.3 3,685 4.1Third Decile 4,151 4.0 4,482 5.0Fourth Decile 4,925 4.8 5,045 5.7Fifth Decile 5,696 5.5 5,914 6.7Sixth Decile 6,709 6.5 6,597 7.4Seventh Decile 8,241 8.0 7,864 8.8Eighth Decile 10,700 10.4 9,874 11.1Ninth Decile 16,130 15.7 14,159 15.9Tenth Decile 40,737 39.6 28,790 32.4
TABLE 6 Total Annual Family Income and Expenditure and Percent Distribution by Income Decile and by Region: 2003 --- (continued)
(Values are in millions)
Income Expenditure
22 2003 Family Income and Expenditure Survey
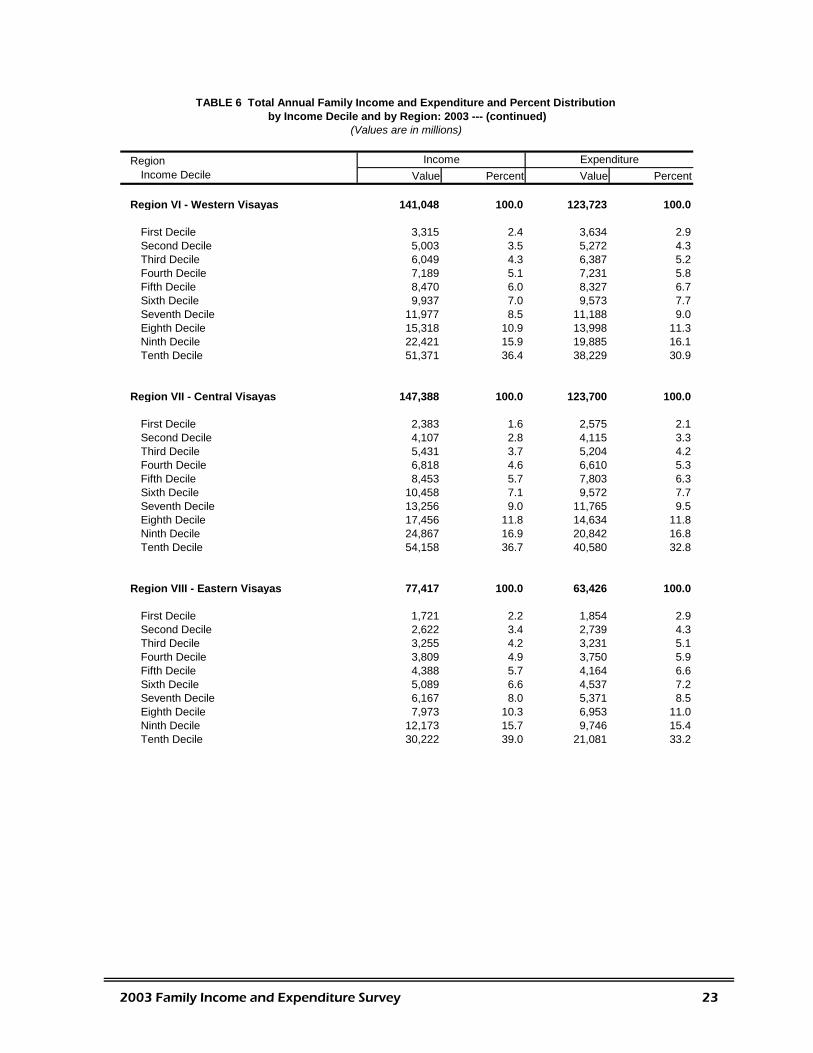
RegionIncome Decile Value Percent Value Percent
Region VI - Western Visayas 141,048 100.0 123,723 100.0
First Decile 3,315 2.4 3,634 2.9Second Decile 5,003 3.5 5,272 4.3Third Decile 6,049 4.3 6,387 5.2Fourth Decile 7,189 5.1 7,231 5.8Fifth Decile 8,470 6.0 8,327 6.7Sixth Decile 9,937 7.0 9,573 7.7Seventh Decile 11,977 8.5 11,188 9.0Eighth Decile 15,318 10.9 13,998 11.3Ninth Decile 22,421 15.9 19,885 16.1Tenth Decile 51,371 36.4 38,229 30.9
Region VII - Central Visayas 147,388 100.0 123,700 100.0
First Decile 2,383 1.6 2,575 2.1Second Decile 4,107 2.8 4,115 3.3Third Decile 5,431 3.7 5,204 4.2Fourth Decile 6,818 4.6 6,610 5.3Fifth Decile 8,453 5.7 7,803 6.3Sixth Decile 10,458 7.1 9,572 7.7Seventh Decile 13,256 9.0 11,765 9.5Eighth Decile 17,456 11.8 14,634 11.8Ninth Decile 24,867 16.9 20,842 16.8Tenth Decile 54,158 36.7 40,580 32.8
Region VIII - Eastern Visayas 77,417 100.0 63,426 100.0
First Decile 1,721 2.2 1,854 2.9Second Decile 2,622 3.4 2,739 4.3Third Decile 3,255 4.2 3,231 5.1Fourth Decile 3,809 4.9 3,750 5.9Fifth Decile 4,388 5.7 4,164 6.6Sixth Decile 5,089 6.6 4,537 7.2Seventh Decile 6,167 8.0 5,371 8.5Eighth Decile 7,973 10.3 6,953 11.0Ninth Decile 12,173 15.7 9,746 15.4Tenth Decile 30,222 39.0 21,081 33.2
TABLE 6 Total Annual Family Income and Expenditure and Percent Distribution by Income Decile and by Region: 2003 --- (continued)
(Values are in millions)
Income Expenditure
2003 Family Income and Expenditure Survey 23
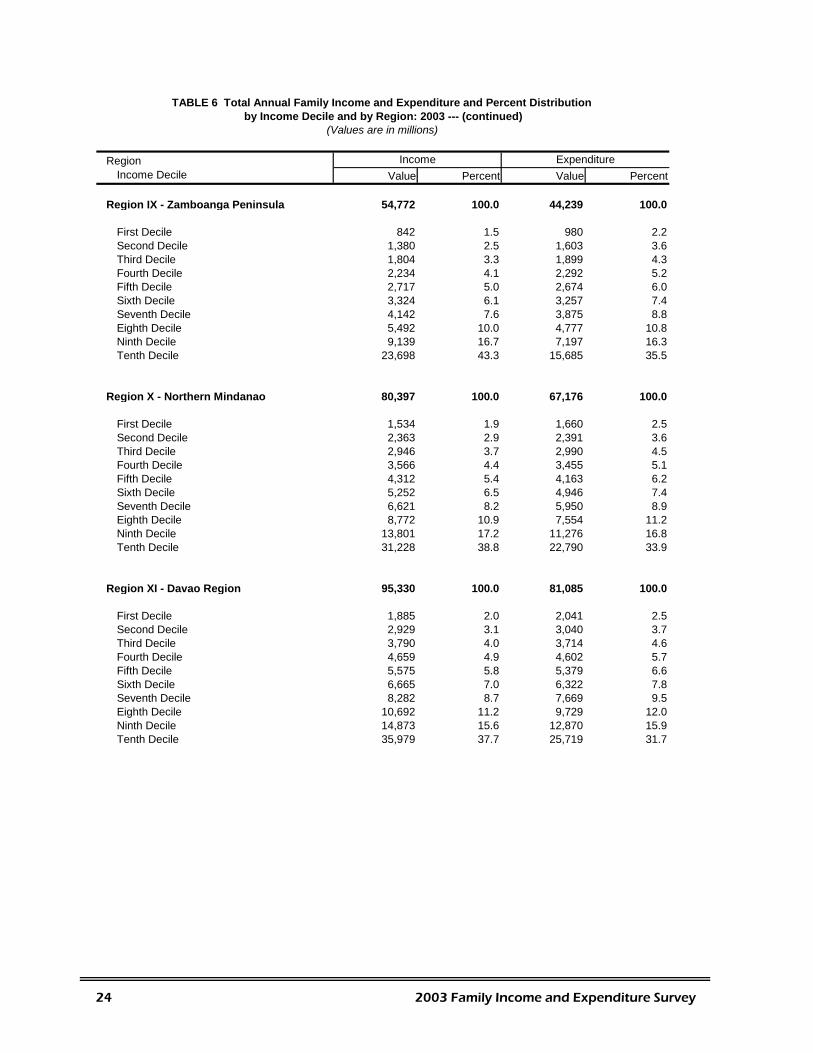
RegionIncome Decile Value Percent Value Percent
Region IX - Zamboanga Peninsula 54,772 100.0 44,239 100.0
First Decile 842 1.5 980 2.2Second Decile 1,380 2.5 1,603 3.6Third Decile 1,804 3.3 1,899 4.3Fourth Decile 2,234 4.1 2,292 5.2Fifth Decile 2,717 5.0 2,674 6.0Sixth Decile 3,324 6.1 3,257 7.4Seventh Decile 4,142 7.6 3,875 8.8Eighth Decile 5,492 10.0 4,777 10.8Ninth Decile 9,139 16.7 7,197 16.3Tenth Decile 23,698 43.3 15,685 35.5
Region X - Northern Mindanao 80,397 100.0 67,176 100.0
First Decile 1,534 1.9 1,660 2.5Second Decile 2,363 2.9 2,391 3.6Third Decile 2,946 3.7 2,990 4.5Fourth Decile 3,566 4.4 3,455 5.1Fifth Decile 4,312 5.4 4,163 6.2Sixth Decile 5,252 6.5 4,946 7.4Seventh Decile 6,621 8.2 5,950 8.9Eighth Decile 8,772 10.9 7,554 11.2Ninth Decile 13,801 17.2 11,276 16.8Tenth Decile 31,228 38.8 22,790 33.9
Region XI - Davao Region 95,330 100.0 81,085 100.0
First Decile 1,885 2.0 2,041 2.5Second Decile 2,929 3.1 3,040 3.7Third Decile 3,790 4.0 3,714 4.6Fourth Decile 4,659 4.9 4,602 5.7Fifth Decile 5,575 5.8 5,379 6.6Sixth Decile 6,665 7.0 6,322 7.8Seventh Decile 8,282 8.7 7,669 9.5Eighth Decile 10,692 11.2 9,729 12.0Ninth Decile 14,873 15.6 12,870 15.9Tenth Decile 35,979 37.7 25,719 31.7
TABLE 6 Total Annual Family Income and Expenditure and Percent Distribution by Income Decile and by Region: 2003 --- (continued)
(Values are in millions)
Income Expenditure
24 2003 Family Income and Expenditure Survey
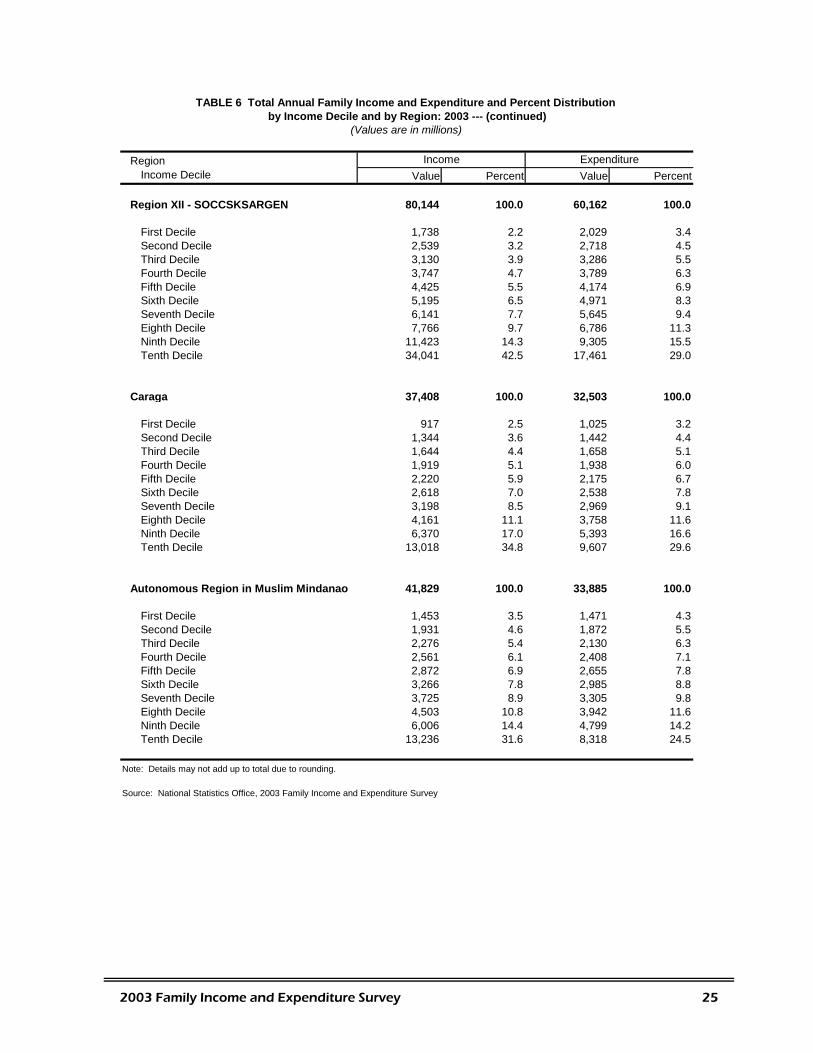
Region
Income Decile Value Percent Value Percent
Region XII - SOCCSKSARGEN 80,144 100.0 60,162 100.0
First Decile 1,738 2.2 2,029 3.4Second Decile 2,539 3.2 2,718 4.5Third Decile 3,130 3.9 3,286 5.5Fourth Decile 3,747 4.7 3,789 6.3Fifth Decile 4,425 5.5 4,174 6.9Sixth Decile 5,195 6.5 4,971 8.3Seventh Decile 6,141 7.7 5,645 9.4Eighth Decile 7,766 9.7 6,786 11.3Ninth Decile 11,423 14.3 9,305 15.5Tenth Decile 34,041 42.5 17,461 29.0
Caraga 37,408 100.0 32,503 100.0
First Decile 917 2.5 1,025 3.2Second Decile 1,344 3.6 1,442 4.4Third Decile 1,644 4.4 1,658 5.1Fourth Decile 1,919 5.1 1,938 6.0Fifth Decile 2,220 5.9 2,175 6.7Sixth Decile 2,618 7.0 2,538 7.8Seventh Decile 3,198 8.5 2,969 9.1Eighth Decile 4,161 11.1 3,758 11.6Ninth Decile 6,370 17.0 5,393 16.6Tenth Decile 13,018 34.8 9,607 29.6
Autonomous Region in Muslim Mindanao 41,829 100.0 33,885 100.0
First Decile 1,453 3.5 1,471 4.3Second Decile 1,931 4.6 1,872 5.5Third Decile 2,276 5.4 2,130 6.3Fourth Decile 2,561 6.1 2,408 7.1Fifth Decile 2,872 6.9 2,655 7.8Sixth Decile 3,266 7.8 2,985 8.8Seventh Decile 3,725 8.9 3,305 9.8Eighth Decile 4,503 10.8 3,942 11.6Ninth Decile 6,006 14.4 4,799 14.2Tenth Decile 13,236 31.6 8,318 24.5
Note: Details may not add up to total due to rounding.
Source: National Statistics Office, 2003 Family Income and Expenditure Survey
TABLE 6 Total Annual Family Income and Expenditure and Percent Distribution by Income Decile and by Region: 2003 --- (continued)
(Values are in millions)
Income Expenditure
2003 Family Income and Expenditure Survey 25
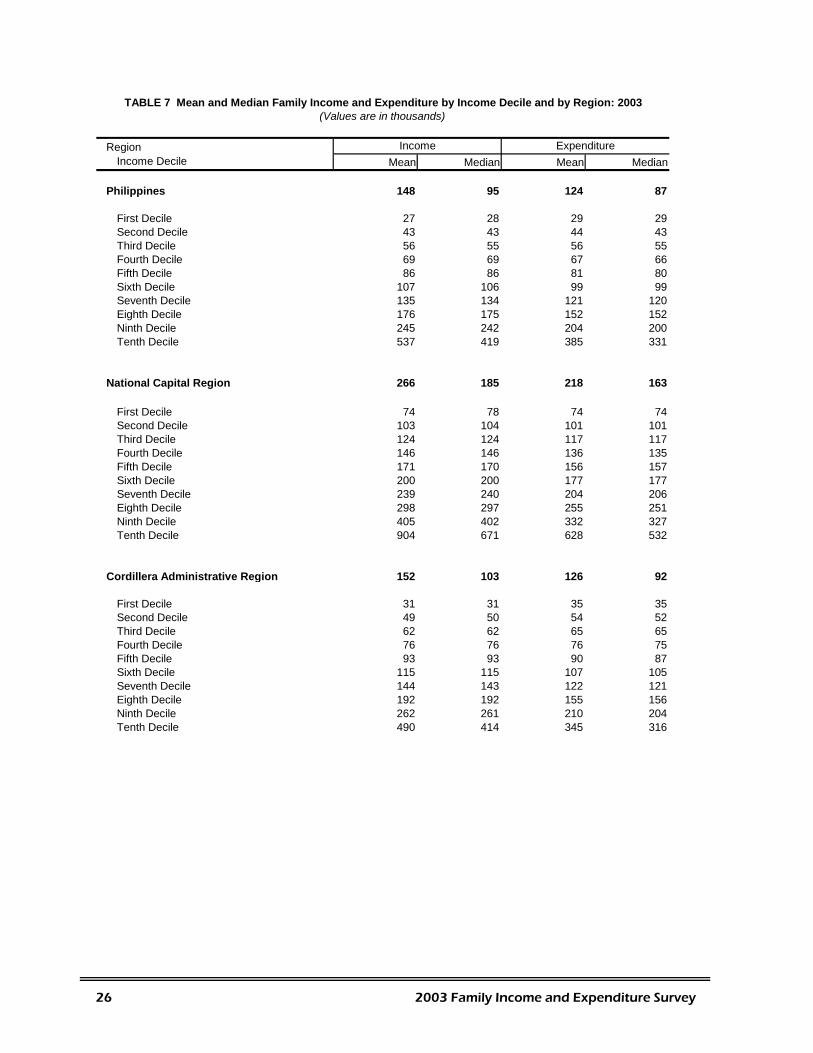
RegionIncome Decile Mean Median Mean Median
Philippines 148 95 124 87
First Decile 27 28 29 29Second Decile 43 43 44 43Third Decile 56 55 56 55Fourth Decile 69 69 67 66Fifth Decile 86 86 81 80Sixth Decile 107 106 99 99Seventh Decile 135 134 121 120Eighth Decile 176 175 152 152Ninth Decile 245 242 204 200Tenth Decile 537 419 385 331
National Capital Region 266 185 218 163
First Decile 74 78 74 74Second Decile 103 104 101 101Third Decile 124 124 117 117Fourth Decile 146 146 136 135Fifth Decile 171 170 156 157Sixth Decile 200 200 177 177Seventh Decile 239 240 204 206Eighth Decile 298 297 255 251Ninth Decile 405 402 332 327Tenth Decile 904 671 628 532
Cordillera Administrative Region 152 103 126 92
First Decile 31 31 35 35Second Decile 49 50 54 52Third Decile 62 62 65 65Fourth Decile 76 76 76 75Fifth Decile 93 93 90 87Sixth Decile 115 115 107 105Seventh Decile 144 143 122 121Eighth Decile 192 192 155 156Ninth Decile 262 261 210 204Tenth Decile 490 414 345 316
TABLE 7 Mean and Median Family Income and Expenditure by Income Decile and by Region: 2003(Values are in thousands)
Income Expenditure
26 2003 Family Income and Expenditure Survey
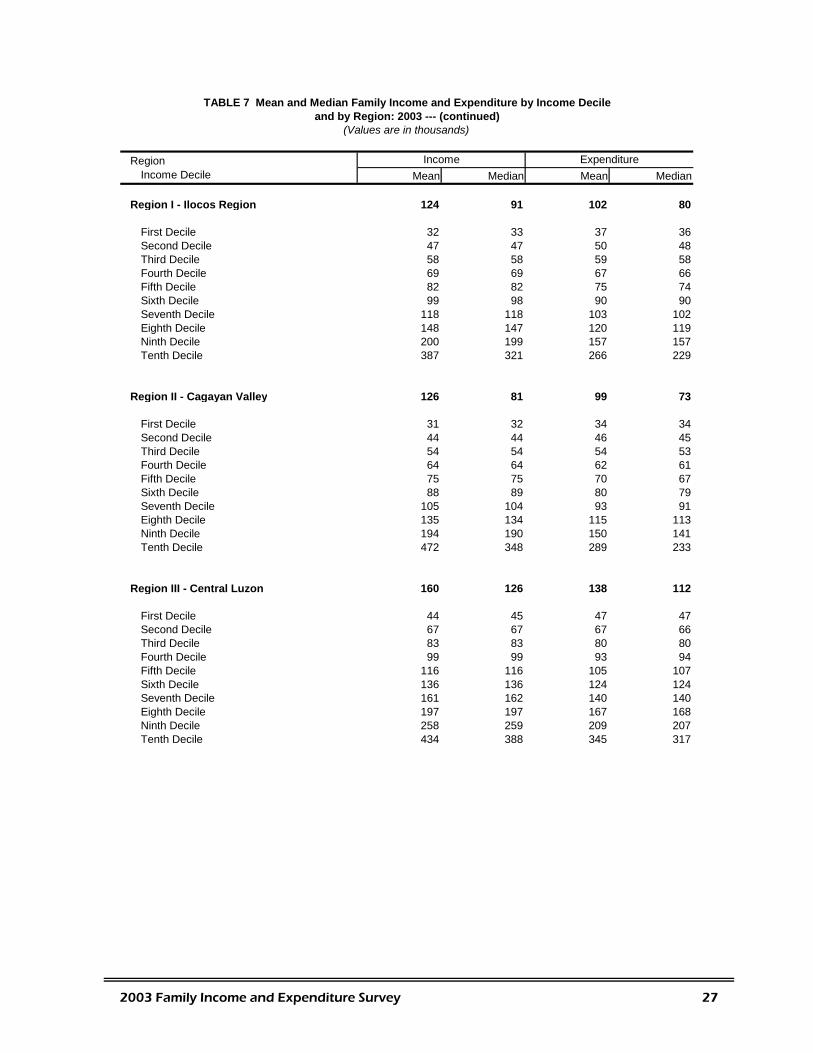
RegionIncome Decile Mean Median Mean Median
Region I - Ilocos Region 124 91 102 80
First Decile 32 33 37 36Second Decile 47 47 50 48Third Decile 58 58 59 58Fourth Decile 69 69 67 66Fifth Decile 82 82 75 74Sixth Decile 99 98 90 90Seventh Decile 118 118 103 102Eighth Decile 148 147 120 119Ninth Decile 200 199 157 157Tenth Decile 387 321 266 229
Region II - Cagayan Valley 126 81 99 73
First Decile 31 32 34 34Second Decile 44 44 46 45Third Decile 54 54 54 53Fourth Decile 64 64 62 61Fifth Decile 75 75 70 67Sixth Decile 88 89 80 79Seventh Decile 105 104 93 91Eighth Decile 135 134 115 113Ninth Decile 194 190 150 141Tenth Decile 472 348 289 233
Region III - Central Luzon 160 126 138 112
First Decile 44 45 47 47Second Decile 67 67 67 66Third Decile 83 83 80 80Fourth Decile 99 99 93 94Fifth Decile 116 116 105 107Sixth Decile 136 136 124 124Seventh Decile 161 162 140 140Eighth Decile 197 197 167 168Ninth Decile 258 259 209 207Tenth Decile 434 388 345 317
TABLE 7 Mean and Median Family Income and Expenditure by Income Decile
(Values are in thousands)
Income Expenditure
and by Region: 2003 --- (continued)
2003 Family Income and Expenditure Survey 27
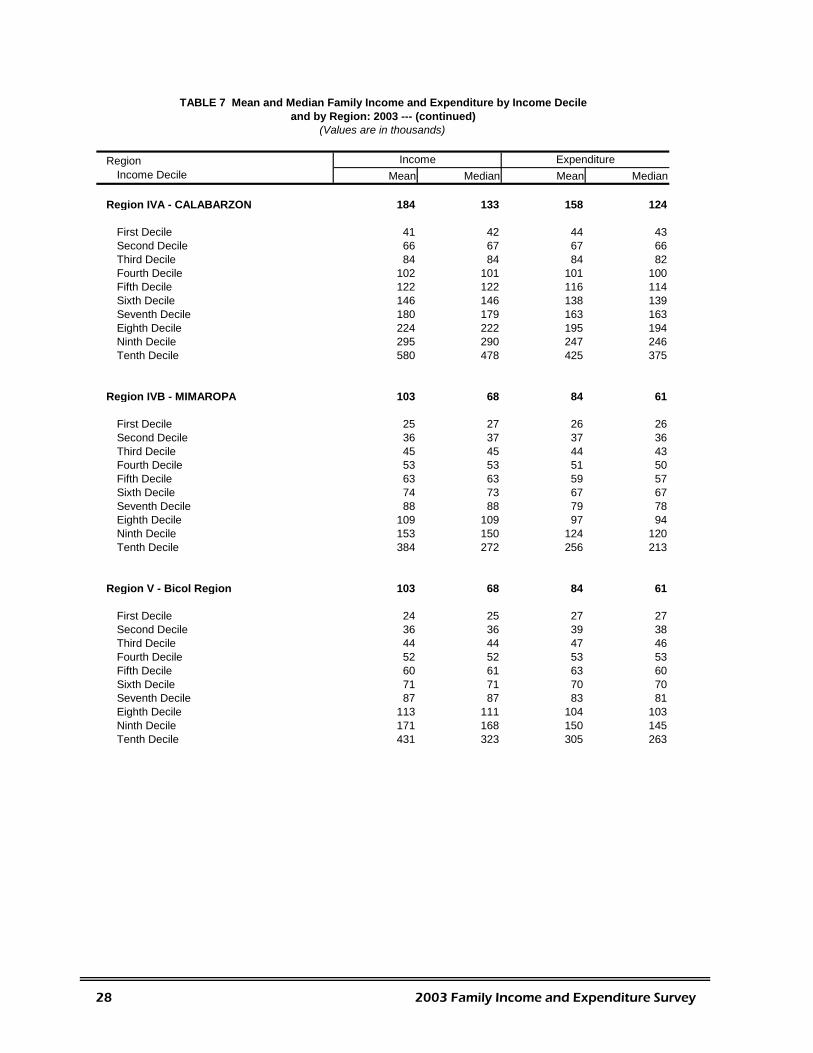
RegionIncome Decile Mean Median Mean Median
Region IVA - CALABARZON 184 133 158 124
First Decile 41 42 44 43Second Decile 66 67 67 66Third Decile 84 84 84 82Fourth Decile 102 101 101 100Fifth Decile 122 122 116 114Sixth Decile 146 146 138 139Seventh Decile 180 179 163 163Eighth Decile 224 222 195 194Ninth Decile 295 290 247 246Tenth Decile 580 478 425 375
Region IVB - MIMAROPA 103 68 84 61
First Decile 25 27 26 26Second Decile 36 37 37 36Third Decile 45 45 44 43Fourth Decile 53 53 51 50Fifth Decile 63 63 59 57Sixth Decile 74 73 67 67Seventh Decile 88 88 79 78Eighth Decile 109 109 97 94Ninth Decile 153 150 124 120Tenth Decile 384 272 256 213
Region V - Bicol Region 103 68 84 61
First Decile 24 25 27 27Second Decile 36 36 39 38Third Decile 44 44 47 46Fourth Decile 52 52 53 53Fifth Decile 60 61 63 60Sixth Decile 71 71 70 70Seventh Decile 87 87 83 81Eighth Decile 113 111 104 103Ninth Decile 171 168 150 145Tenth Decile 431 323 305 263
TABLE 7 Mean and Median Family Income and Expenditure by Income Decileand by Region: 2003 --- (continued)
(Values are in thousands)
Income Expenditure
28 2003 Family Income and Expenditure Survey
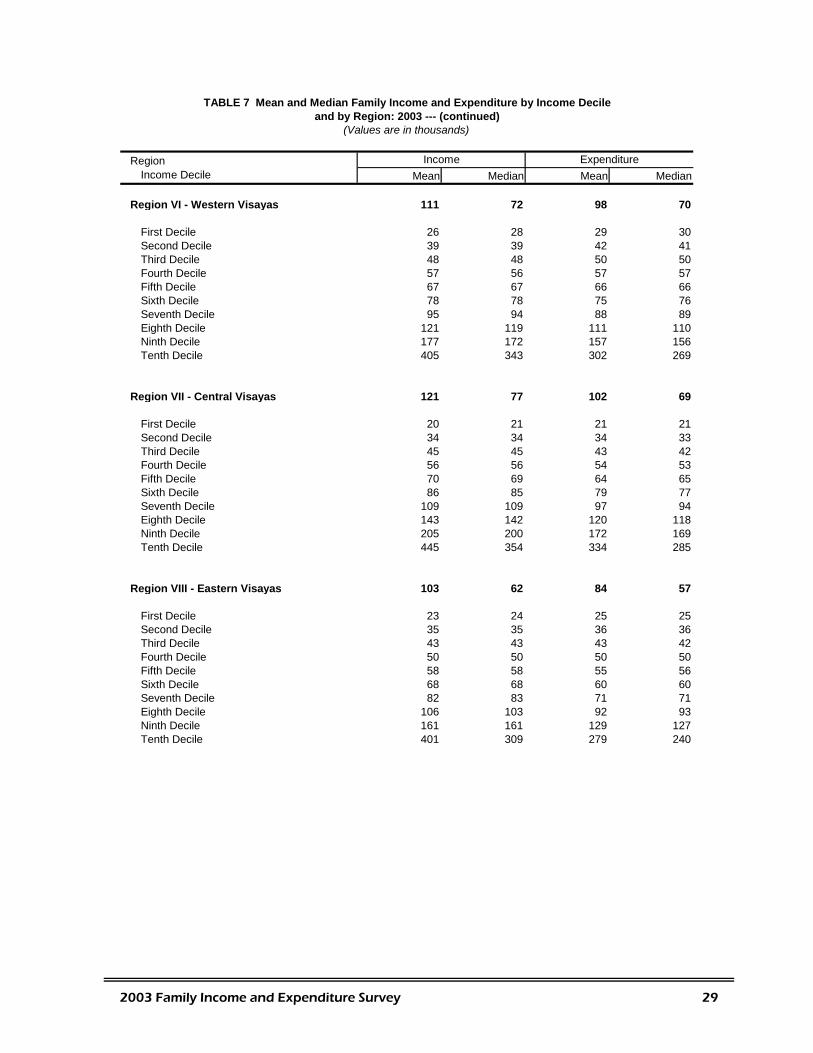
RegionIncome Decile Mean Median Mean Median
Region VI - Western Visayas 111 72 98 70
First Decile 26 28 29 30Second Decile 39 39 42 41Third Decile 48 48 50 50Fourth Decile 57 56 57 57Fifth Decile 67 67 66 66Sixth Decile 78 78 75 76Seventh Decile 95 94 88 89Eighth Decile 121 119 111 110Ninth Decile 177 172 157 156Tenth Decile 405 343 302 269
Region VII - Central Visayas 121 77 102 69
First Decile 20 21 21 21Second Decile 34 34 34 33Third Decile 45 45 43 42Fourth Decile 56 56 54 53Fifth Decile 70 69 64 65Sixth Decile 86 85 79 77Seventh Decile 109 109 97 94Eighth Decile 143 142 120 118Ninth Decile 205 200 172 169Tenth Decile 445 354 334 285
Region VIII - Eastern Visayas 103 62 84 57
First Decile 23 24 25 25Second Decile 35 35 36 36Third Decile 43 43 43 42Fourth Decile 50 50 50 50Fifth Decile 58 58 55 56Sixth Decile 68 68 60 60Seventh Decile 82 83 71 71Eighth Decile 106 103 92 93Ninth Decile 161 161 129 127Tenth Decile 401 309 279 240
TABLE 7 Mean and Median Family Income and Expenditure by Income Decileand by Region: 2003 --- (continued)
(Values are in thousands)
Income Expenditure
2003 Family Income and Expenditure Survey 29
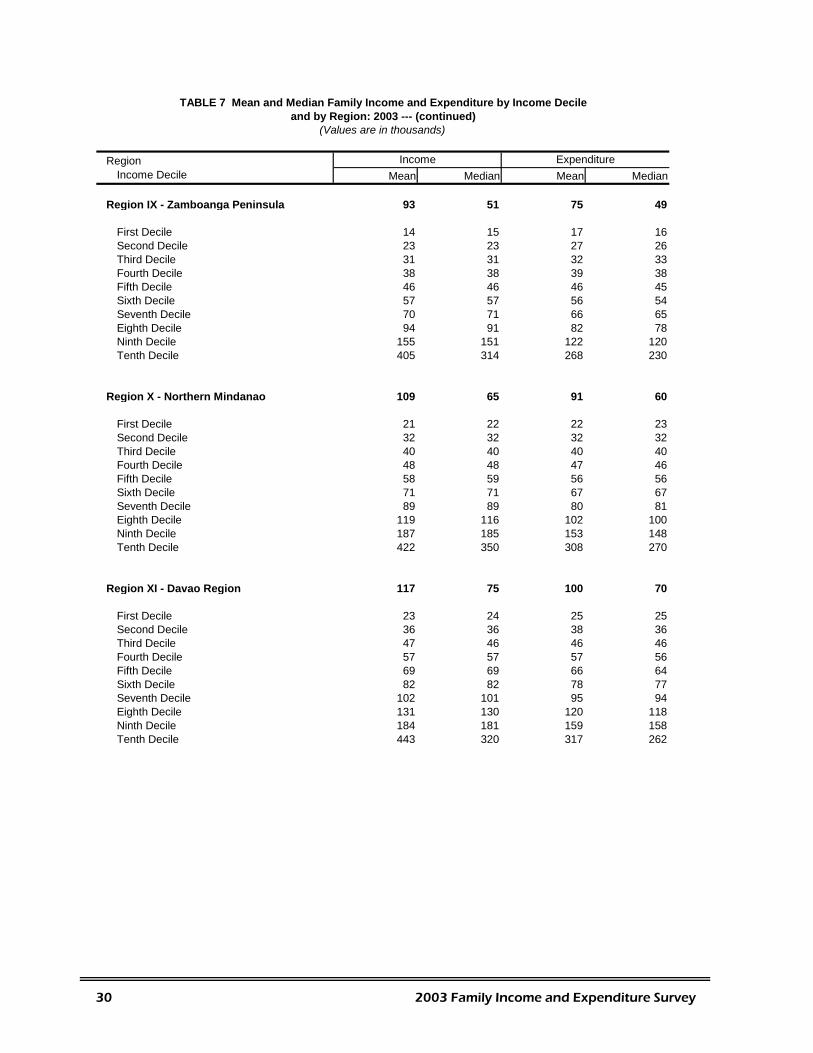
RegionIncome Decile Mean Median Mean Median
Region IX - Zamboanga Peninsula 93 51 75 49
First Decile 14 15 17 16Second Decile 23 23 27 26Third Decile 31 31 32 33Fourth Decile 38 38 39 38Fifth Decile 46 46 46 45Sixth Decile 57 57 56 54Seventh Decile 70 71 66 65Eighth Decile 94 91 82 78Ninth Decile 155 151 122 120Tenth Decile 405 314 268 230
Region X - Northern Mindanao 109 65 91 60
First Decile 21 22 22 23Second Decile 32 32 32 32Third Decile 40 40 40 40Fourth Decile 48 48 47 46Fifth Decile 58 59 56 56Sixth Decile 71 71 67 67Seventh Decile 89 89 80 81Eighth Decile 119 116 102 100Ninth Decile 187 185 153 148Tenth Decile 422 350 308 270
Region XI - Davao Region 117 75 100 70
First Decile 23 24 25 25Second Decile 36 36 38 36Third Decile 47 46 46 46Fourth Decile 57 57 57 56Fifth Decile 69 69 66 64Sixth Decile 82 82 78 77Seventh Decile 102 101 95 94Eighth Decile 131 130 120 118Ninth Decile 184 181 159 158Tenth Decile 443 320 317 262
TABLE 7 Mean and Median Family Income and Expenditure by Income Decileand by Region: 2003 --- (continued)
(Values are in thousands)
Income Expenditure
30 2003 Family Income and Expenditure Survey
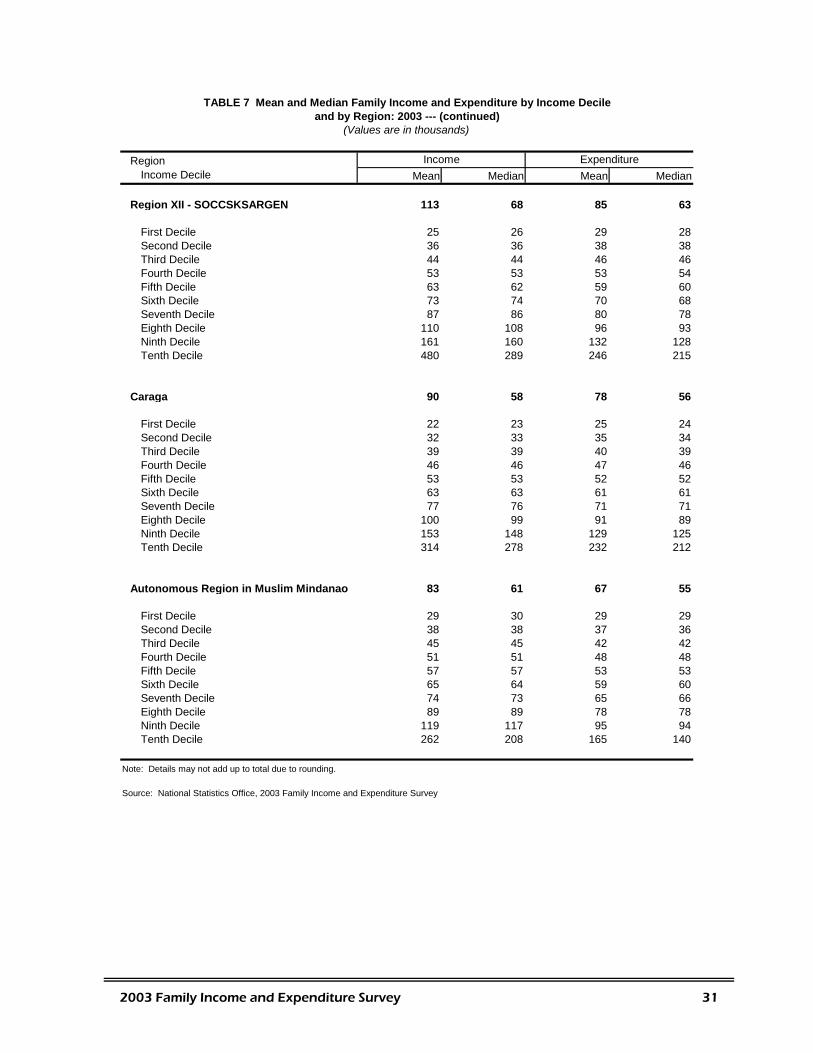
RegionIncome Decile Mean Median Mean Median
Region XII - SOCCSKSARGEN 113 68 85 63
First Decile 25 26 29 28Second Decile 36 36 38 38Third Decile 44 44 46 46Fourth Decile 53 53 53 54Fifth Decile 63 62 59 60Sixth Decile 73 74 70 68Seventh Decile 87 86 80 78Eighth Decile 110 108 96 93Ninth Decile 161 160 132 128Tenth Decile 480 289 246 215
Caraga 90 58 78
First Decile 22 23 25 24Second Decile 32 33 35 34Third Decile 39 39 40 39Fourth Decile 46 46 47 46Fifth Decile 53 53 52 52Sixth Decile 63 63 61 61Seventh Decile 77 76 71 71Eighth Decile 100 99 91 89Ninth Decile 153 148 129 125Tenth Decile 314 278 232 212
Autonomous Re
56
gion in Muslim Mindanao 83 61 67 55
First Decile 29 30 29 29Second Decile 38 38 37 36Third Decile 45 45 42 42Fourth Decile 51 51 48 48Fifth Decile 57 57 53 53Sixth Decile 65 64 59 60Seventh Decile 74 73 65 66Eighth Decile 89 89 78 78Ninth Decile 119 117 95 94Tenth Decile 262 208 165 140
Note: Details may not add up to total due to rounding.
Source: National Statistics Office, 2003 Family Income and Expenditure Survey
TABLE 7 Mean and Median Family Income and Expenditure by Income Decileand by Region: 2003 --- (continued)
(Values are in thousands)
Income Expenditure
2003 Family Income and Expenditure Survey 31
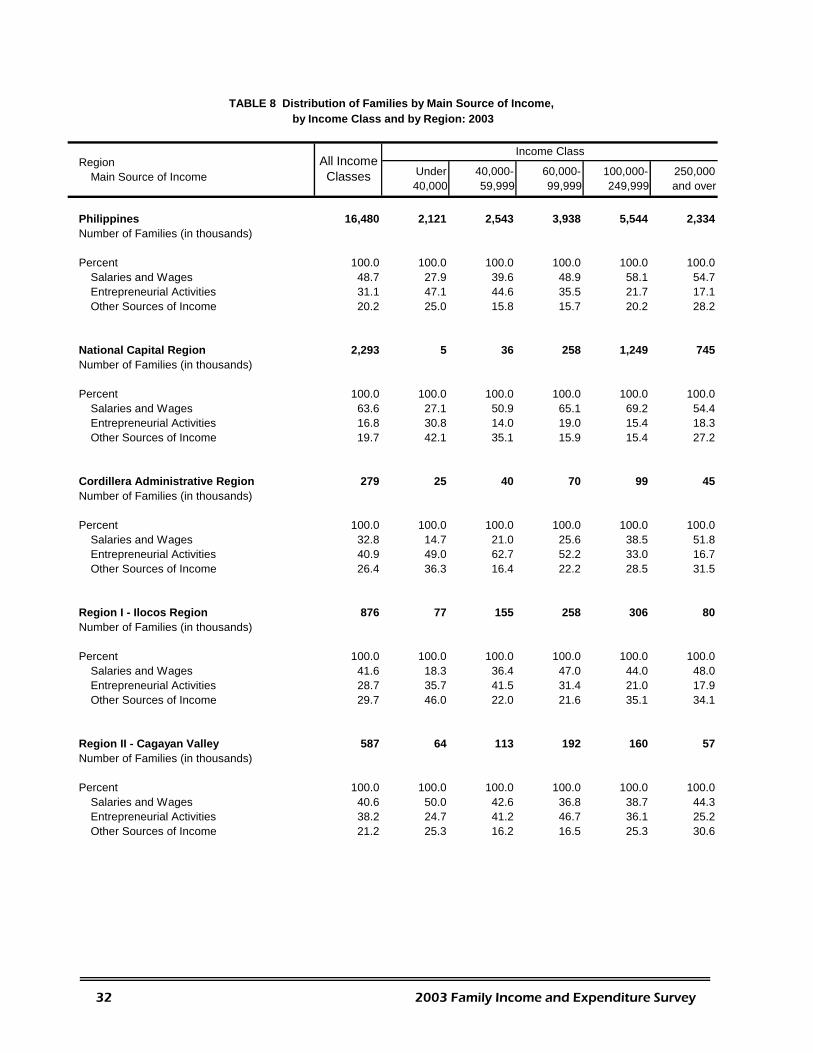
40,000 59,999 99,999 249,999 and over
Philippines 16,480 2,121 2,543 3,938 5,544 2,334Number of Families (in thousands)
Percent 100.0 100.0 100.0 100.0 100.0 100.0Salaries and Wages 48.7 27.9 39.6 48.9 58.1 54.7Entrepreneurial Activities 31.1 47.1 44.6 35.5 21.7 17.1Other Sources of Income 20.2 25.0 15.8 15.7 20.2 28.2
National Capital Region 2,293 5 36 258 1,249 745Number of Families (in thousands)
Percent 100.0 100.0 100.0 100.0 100.0 100.0Salaries and Wages 63.6 27.1 50.9 65.1 69.2 54.4Entrepreneurial Activities 16.8 30.8 14.0 19.0 15.4 18.3Other Sources of Income 19.7 42.1 35.1 15.9 15.4 27.2
Cordillera Administrative Region 279 25 40 70 99 45Number of Families (in thousands)
Percent 100.0 100.0 100.0 100.0 100.0 100.0Salaries and Wages 32.8 14.7 21.0 25.6 38.5 51.8Entrepreneurial Activities 40.9 49.0 62.7 52.2 33.0 16.7Other Sources of Income 26.4 36.3 16.4 22.2 28.5 31.5
Region I - Ilocos Region 876 77 155 258 306 80Number of Families (in thousands)
Percent 100.0 100.0 100.0 100.0 100.0 100.0Salaries and Wages 41.6 18.3 36.4 47.0 44.0 48.0Entrepreneurial Activities 28.7 35.7 41.5 31.4 21.0 17.9Other Sources of Income 29.7 46.0 22.0 21.6 35.1 34.1
Region II - Cagayan Valley 587 64 113 192 160 57Number of Families (in thousands)
Percent 100.0 100.0 100.0 100.0 100.0 100.0Salaries and Wages 40.6 50.0 42.6 36.8 38.7 44.3Entrepreneurial Activities 38.2 24.7 41.2 46.7 36.1 25.2Other Sources of Income 21.2 25.3 16.2 16.5 25.3 30.6
100,000- 250,000Region
Main Source of Income Under
TABLE 8 Distribution of Families by Main Source of Income, by Income Class and by Region: 2003
Income ClassAll Income
Classes 40,000- 60,000-
32 2003 Family Income and Expenditure Survey
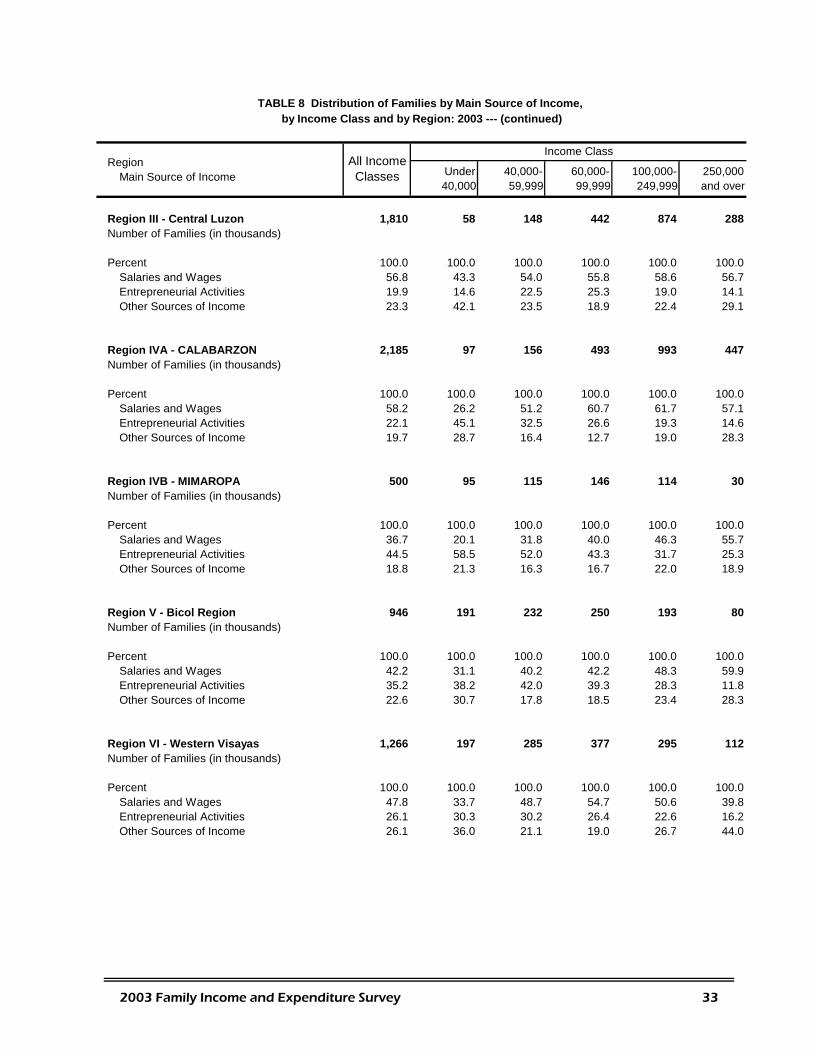
40,000 59,999 99,999 249,999 and over
Region III - Central Luzon 1,810 58 148 442 874 288Number of Families (in thousands)
Percent 100.0 100.0 100.0 100.0 100.0 100.0Salaries and Wages 56.8 43.3 54.0 55.8 58.6 56.7Entrepreneurial Activities 19.9 14.6 22.5 25.3 19.0 14.1Other Sources of Income 23.3 42.1 23.5 18.9 22.4 29.1
Region IVA - CALABARZON 2,185 97 156 493 993 447Number of Families (in thousands)
Percent 100.0 100.0 100.0 100.0 100.0 100.0Salaries and Wages 58.2 26.2 51.2 60.7 61.7 57.1Entrepreneurial Activities 22.1 45.1 32.5 26.6 19.3 14.6Other Sources of Income 19.7 28.7 16.4 12.7 19.0 28.3
Region IVB - MIMAROPA 500 95 115 146 114 30Number of Families (in thousands)
Percent 100.0 100.0 100.0 100.0 100.0 100.0Salaries and Wages 36.7 20.1 31.8 40.0 46.3 55.7Entrepreneurial Activities 44.5 58.5 52.0 43.3 31.7 25.3Other Sources of Income 18.8 21.3 16.3 16.7 22.0 18.9
Region V - Bicol Region 946 191 232 250 193 80Number of Families (in thousands)
Percent 100.0 100.0 100.0 100.0 100.0 100.0Salaries and Wages 42.2 31.1 40.2 42.2 48.3 59.9Entrepreneurial Activities 35.2 38.2 42.0 39.3 28.3 11.8Other Sources of Income 22.6 30.7 17.8 18.5 23.4 28.3
Region VI - Western Visayas 1,266 197 285 377 295 112Number of Families (in thousands)
Percent 100.0 100.0 100.0 100.0 100.0 100.0Salaries and Wages 47.8 33.7 48.7 54.7 50.6 39.8Entrepreneurial Activities 26.1 30.3 30.2 26.4 22.6 16.2Other Sources of Income 26.1 36.0 21.1 19.0 26.7 44.0
RegionIncome Class
Under 40,000- 60,000- 100,000- 250,000Main Source of IncomeAll Income
Classes
TABLE 8 Distribution of Families by Main Source of Income, by Income Class and by Region: 2003 --- (continued)
2003 Family Income and Expenditure Survey 33
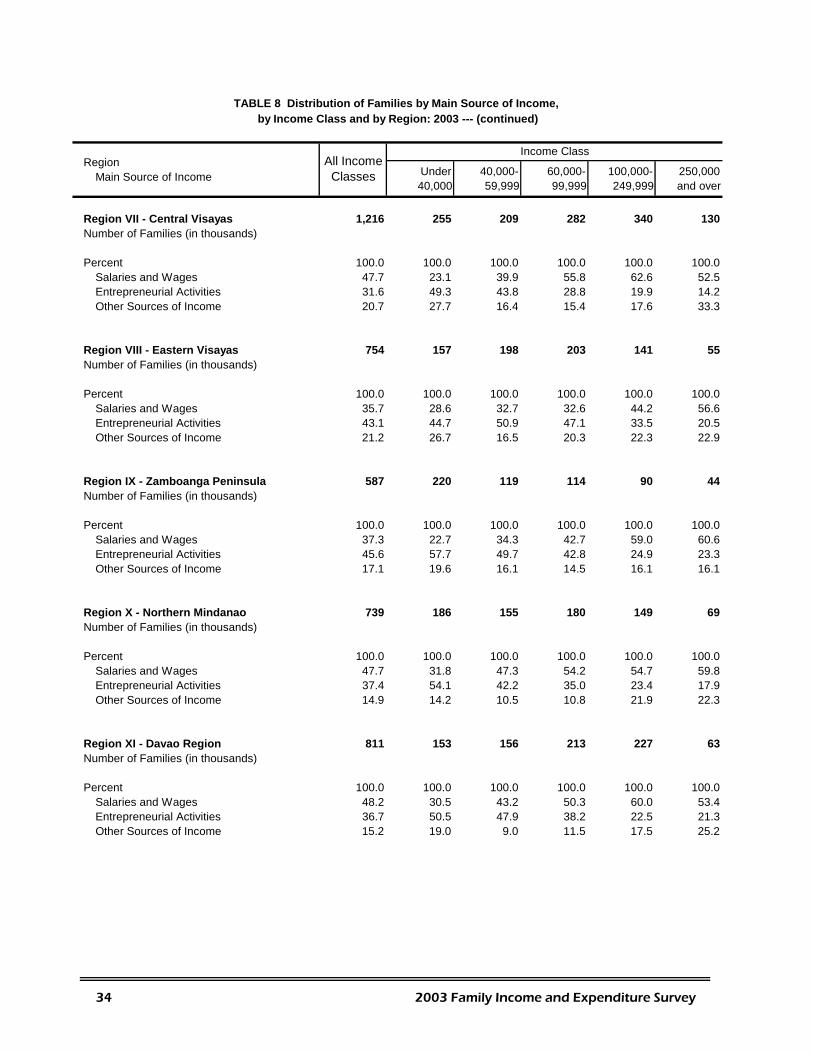
40,000 59,999 99,999 249,999 and over
Region VII - Central Visayas 1,216 255 209 282 340 130Number of Families (in thousands)
Percent 100.0 100.0 100.0 100.0 100.0 100.0Salaries and Wages 47.7 23.1 39.9 55.8 62.6 52.5Entrepreneurial Activities 31.6 49.3 43.8 28.8 19.9 14.2Other Sources of Income 20.7 27.7 16.4 15.4 17.6 33.3
Region VIII - Eastern Visayas 754 157 198 203 141 55Number of Families (in thousands)
Percent 100.0 100.0 100.0 100.0 100.0 100.0Salaries and Wages 35.7 28.6 32.7 32.6 44.2 56.6Entrepreneurial Activities 43.1 44.7 50.9 47.1 33.5 20.5Other Sources of Income 21.2 26.7 16.5 20.3 22.3 22.9
Region IX - Zamboanga Peninsula 587 220 119 114 90 44Number of Families (in thousands)
Percent 100.0 100.0 100.0 100.0 100.0 100.0Salaries and Wages 37.3 22.7 34.3 42.7 59.0 60.6Entrepreneurial Activities 45.6 57.7 49.7 42.8 24.9 23.3Other Sources of Income 17.1 19.6 16.1 14.5 16.1 16.1
Region X - Northern Mindanao 739 186 155 180 149 69Number of Families (in thousands)
Percent 100.0 100.0 100.0 100.0 100.0 100.0Salaries and Wages 47.7 31.8 47.3 54.2 54.7 59.8Entrepreneurial Activities 37.4 54.1 42.2 35.0 23.4 17.9Other Sources of Income 14.9 14.2 10.5 10.8 21.9 22.3
Region XI - Davao Region 811 153 156 213 227 63Number of Families (in thousands)
Percent 100.0 100.0 100.0 100.0 100.0 100.0Salaries and Wages 48.2 30.5 43.2 50.3 60.0 53.4Entrepreneurial Activities 36.7 50.5 47.9 38.2 22.5 21.3Other Sources of Income 15.2 19.0 9.0 11.5 17.5 25.2
TABLE 8 Distribution of Families by Main Source of Income, by Income Class and by Region: 2003 --- (continued)
RegionIncome Class
Under 40,000- 60,000- 100,000- 250,000Main Source of IncomeAll Income
Classes
34 2003 Family Income and Expenditure Survey
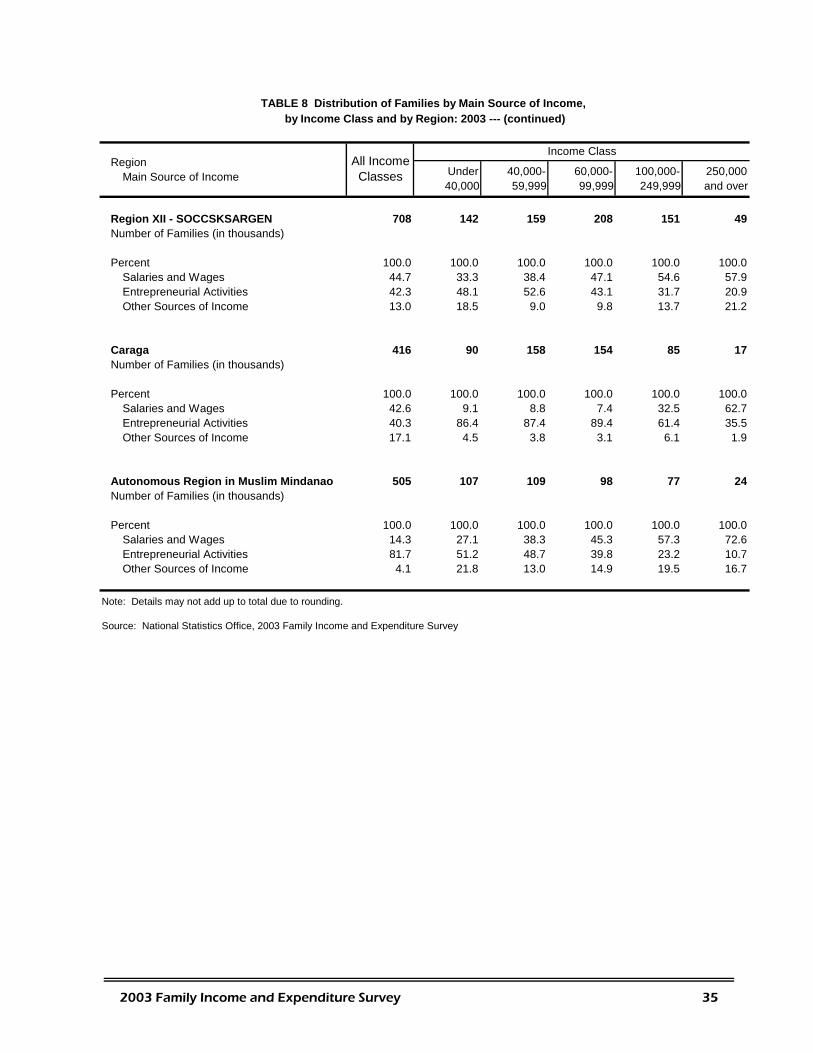
40,000 59,999 99,999 249,999 and over
Region XII - SOCCSKSARGEN 708 142 159 208 151 49Number of Families (in thousands)
Percent 100.0 100.0 100.0 100.0 100.0 100.0Salaries and Wages 44.7 33.3 38.4 47.1 54.6 57.9Entrepreneurial Activities 42.3 48.1 52.6 43.1 31.7 20.9Other Sources of Income 13.0 18.5 9.0 9.8 13.7 21.2
Caraga 416 90 158 154 85 17Number of Families (in thousands)
Percent 100.0 100.0 100.0 100.0 100.0 100.0Salaries and Wages 42.6 9.1 8.8 7.4 32.5 62.7Entrepreneurial Activities 40.3 86.4 87.4 89.4 61.4 35.5Other Sources of Income 17.1 4.5 3.8 3.1 6.1 1.9
Autonomous Region in Muslim Mindanao 505 107 109 98 77 24Number of Families (in thousands)
Percent 100.0 100.0 100.0 100.0 100.0 100.0Salaries and Wages 14.3 27.1 38.3 45.3 57.3 72.6Entrepreneurial Activities 81.7 51.2 48.7 39.8 23.2 10.7Other Sources of Income 4.1 21.8 13.0 14.9 19.5 16.7
Note: Details may not add up to total due to rounding.
Source: National Statistics Office, 2003 Family Income and Expenditure Survey
TABLE 8 Distribution of Families by Main Source of Income, by Income Class and by Region: 2003 --- (continued)
RegionIncome Class
Under 40,000- 60,000- 100,000- 250,000Main Source of IncomeAll Income
Classes
2003 Family Income and Expenditure Survey 35

40,000 59,999 99,999 249,999 and over
Philippines 2,038,471 66,479 128,096 293,283 760,270 790,343Total Family Expenditure (in millions)
Percent of Total Expenditure 100.0 100.0 100.0 100.0 100.0 100.0Food 43.1 62.0 59.7 55.0 45.8 31.7
Food Consumed at Home 37.7 61.0 57.5 51.1 39.6 25.6Cereal and Cereal Preparations 11.1 26.8 23.3 17.7 10.9 5.5Roots and Tubers 0.6 1.5 1.1 0.8 0.5 0.3Fruit and Vegetables 4.3 6.9 6.3 5.6 4.4 3.1Meat and Meat Preparations 6.7 4.6 5.5 6.9 7.8 6.0Dairy Products and Eggs 3.2 2.7 3.2 3.6 3.6 2.8Fish and Marine Products 5.5 10.3 9.6 8.1 5.6 3.4Coffee, Cocoa and Tea 1.0 1.7 1.7 1.5 1.1 0.6Non-Alcoholic Beverages 1.5 0.9 1.3 1.5 1.6 1.3Food Not Elsewhere Classified 3.8 5.7 5.5 5.3 4.2 2.5
Food Regularly Consumed Outside the Home 5.4 1.0 2.2 3.9 6.2 6.1Alcoholic Beverages 0.7 1.2 1.3 1.1 0.8 0.4Tobacco 1.1 2.0 2.1 1.8 1.2 0.5Fuel, Light and Water 6.5 6.9 6.5 6.7 7.0 6.0Transportation and Communication 7.3 2.8 3.3 4.4 6.7 10.0Household Operation 2.2 1.8 1.6 1.6 1.7 3.1Personal Care and Effects 3.9 3.3 3.8 4.2 4.2 3.6Clothing, Footwear and Other Wear 2.9 2.2 2.6 2.8 2.9 3.0Education 4.0 0.9 1.4 2.1 3.3 6.1Recreation 0.5 0.1 0.2 0.2 0.4 0.7Medical Care 2.2 1.2 1.4 1.7 2.1 2.7Non-Durable Furnishings 0.2 0.2 0.3 0.2 0.2 0.2Durable Furniture and Equipment 2.6 0.4 0.9 1.7 2.5 3.6Taxes 2.1 0.1 0.2 0.3 1.4 4.0Rent/Rental Value of Occupied Dwelling Unit 13.1 8.6 8.8 10.2 12.9 15.4House Maintenance and Minor Repairs 0.7 0.4 0.6 0.6 0.7 0.8Special Family Occasions 2.6 1.2 1.7 2.3 2.6 2.8Gifts and Contributions to Others 1.2 0.5 0.7 0.8 1.1 1.6Other Expenditure 2.9 4.0 3.0 2.1 2.5 3.6
National Capital Region 499,852 196 2,011 21,285 185,033 291,328Total Family Expenditure (in millions)
Percent of Total Expenditure 100.0 100.0 100.0 100.0 100.0 100.0Food 37.9 50.5 52.9 53.5 45.8 31.6
Food Consumed at Home 30.1 46.9 47.7 46.2 37.5 24.1Cereal and Cereal Preparations 6.7 10.7 13.8 11.7 9.0 4.8Roots and Tubers 0.4 0.5 0.5 0.6 0.5 0.4Fruit and Vegetables 3.7 3.6 5.2 5.3 4.5 3.1Meat and Meat Preparations 6.6 4.6 6.5 7.8 7.8 5.7Dairy Products and Eggs 3.0 4.6 3.8 4.5 3.6 2.5Fish and Marine Products 3.8 5.1 6.5 5.9 4.7 3.0Coffee, Cocoa and Tea 0.7 2.0 1.2 1.3 1.0 0.6Non-Alcoholic Beverages 1.5 1.0 1.6 1.8 1.7 1.4Food Not Elsewhere Classified 3.7 15.3 8.7 7.4 4.7 2.7
Food Regularly Consumed Outside the Home 7.8 3.6 5.2 7.2 8.4 7.5
TABLE 9 Total Annual Family Expenditure by Expenditure Group, by Income Class and by Region: 2003
250,000Region
Expenditure Group Under 40,000- 60,000- 100,000-Total Family Expenditure
Income Class
36 2003 Family Income and Expenditure Survey
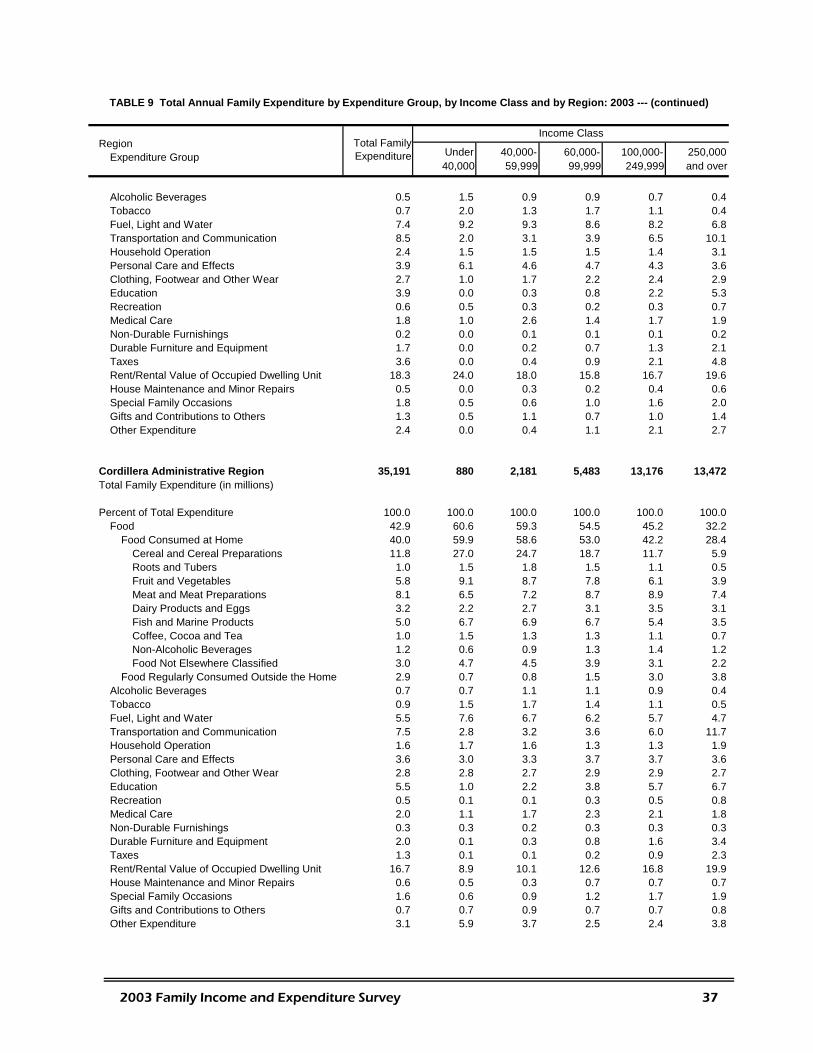
40,000 59,999 99,999 249,999 and over
Alcoholic Beverages 0.5 1.5 0.9 0.9 0.7 0.4Tobacco 0.7 2.0 1.3 1.7 1.1 0.4Fuel, Light and Water 7.4 9.2 9.3 8.6 8.2 6.8Transportation and Communication 8.5 2.0 3.1 3.9 6.5 10.1Household Operation 2.4 1.5 1.5 1.5 1.4 3.1Personal Care and Effects 3.9 6.1 4.6 4.7 4.3 3.6Clothing, Footwear and Other Wear 2.7 1.0 1.7 2.2 2.4 2.9Education 3.9 0.0 0.3 0.8 2.2 5.3Recreation 0.6 0.5 0.3 0.2 0.3 0.7Medical Care 1.8 1.0 2.6 1.4 1.7 1.9Non-Durable Furnishings 0.2 0.0 0.1 0.1 0.1 0.2Durable Furniture and Equipment 1.7 0.0 0.2 0.7 1.3 2.1Taxes 3.6 0.0 0.4 0.9 2.1 4.8Rent/Rental Value of Occupied Dwelling Unit 18.3 24.0 18.0 15.8 16.7 19.6House Maintenance and Minor Repairs 0.5 0.0 0.3 0.2 0.4 0.6Special Family Occasions 1.8 0.5 0.6 1.0 1.6 2.0Gifts and Contributions to Others 1.3 0.5 1.1 0.7 1.0 1.4Other Expenditure 2.4 0.0 0.4 1.1 2.1 2.7
Cordillera Administrative Region 35,191 880 2,181 5,483 13,176 13,472Total Family Expenditure (in millions)
Percent of Total Expenditure 100.0 100.0 100.0 100.0 100.0 100.0Food 42.9 60.6 59.3 54.5 45.2 32.2
Food Consumed at Home 40.0 59.9 58.6 53.0 42.2 28.4Cereal and Cereal Preparations 11.8 27.0 24.7 18.7 11.7 5.9Roots and Tubers 1.0 1.5 1.8 1.5 1.1 0.5Fruit and Vegetables 5.8 9.1 8.7 7.8 6.1 3.9Meat and Meat Preparations 8.1 6.5 7.2 8.7 8.9 7.4Dairy Products and Eggs 3.2 2.2 2.7 3.1 3.5 3.1Fish and Marine Products 5.0 6.7 6.9 6.7 5.4 3.5Coffee, Cocoa and Tea 1.0 1.5 1.3 1.3 1.1 0.7Non-Alcoholic Beverages 1.2 0.6 0.9 1.3 1.4 1.2Food Not Elsewhere Classified 3.0 4.7 4.5 3.9 3.1 2.2
Food Regularly Consumed Outside the Home 2.9 0.7 0.8 1.5 3.0 3.8Alcoholic Beverages 0.7 0.7 1.1 1.1 0.9 0.4Tobacco 0.9 1.5 1.7 1.4 1.1 0.5Fuel, Light and Water 5.5 7.6 6.7 6.2 5.7 4.7Transportation and Communication 7.5 2.8 3.2 3.6 6.0 11.7Household Operation 1.6 1.7 1.6 1.3 1.3 1.9Personal Care and Effects 3.6 3.0 3.3 3.7 3.7 3.6Clothing, Footwear and Other Wear 2.8 2.8 2.7 2.9 2.9 2.7Education 5.5 1.0 2.2 3.8 5.7 6.7Recreation 0.5 0.1 0.1 0.3 0.5 0.8Medical Care 2.0 1.1 1.7 2.3 2.1 1.8Non-Durable Furnishings 0.3 0.3 0.2 0.3 0.3 0.3Durable Furniture and Equipment 2.0 0.1 0.3 0.8 1.6 3.4Taxes 1.3 0.1 0.1 0.2 0.9 2.3Rent/Rental Value of Occupied Dwelling Unit 16.7 8.9 10.1 12.6 16.8 19.9House Maintenance and Minor Repairs 0.6 0.5 0.3 0.7 0.7 0.7Special Family Occasions 1.6 0.6 0.9 1.2 1.7 1.9Gifts and Contributions to Others 0.7 0.7 0.9 0.7 0.7 0.8Other Expenditure 3.1 5.9 3.7 2.5 2.4 3.8
TABLE 9 Total Annual Family Expenditure by Expenditure Group, by Income Class and by Region: 2003 --- (continued)
Region Total Family Expenditure
Income Class
Under 40,000- 60,000- 100,000- 250,000Expenditure Group
2003 Family Income and Expenditure Survey 37
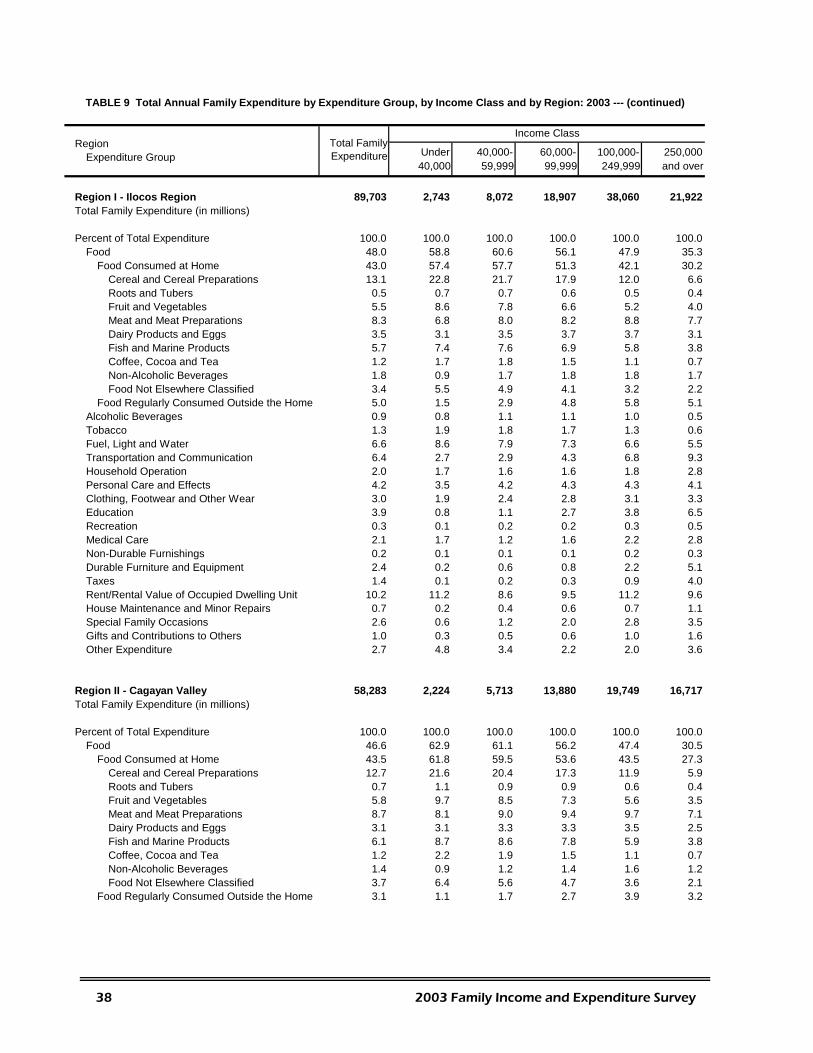
40,000 59,999 99,999 249,999 and over
Region I - Ilocos Region 89,703 2,743 8,072 18,907 38,060 21,922Total Family Expenditure (in millions)
Percent of Total Expenditure 100.0 100.0 100.0 100.0 100.0 100.0Food 48.0 58.8 60.6 56.1 47.9 35.3
Food Consumed at Home 43.0 57.4 57.7 51.3 42.1 30.2Cereal and Cereal Preparations 13.1 22.8 21.7 17.9 12.0 6.6Roots and Tubers 0.5 0.7 0.7 0.6 0.5 0.4Fruit and Vegetables 5.5 8.6 7.8 6.6 5.2 4.0Meat and Meat Preparations 8.3 6.8 8.0 8.2 8.8 7.7Dairy Products and Eggs 3.5 3.1 3.5 3.7 3.7 3.1Fish and Marine Products 5.7 7.4 7.6 6.9 5.8 3.8Coffee, Cocoa and Tea 1.2 1.7 1.8 1.5 1.1 0.7Non-Alcoholic Beverages 1.8 0.9 1.7 1.8 1.8 1.7Food Not Elsewhere Classified 3.4 5.5 4.9 4.1 3.2 2.2
Food Regularly Consumed Outside the Home 5.0 1.5 2.9 4.8 5.8 5.1Alcoholic Beverages 0.9 0.8 1.1 1.1 1.0 0.5Tobacco 1.3 1.9 1.8 1.7 1.3 0.6Fuel, Light and Water 6.6 8.6 7.9 7.3 6.6 5.5Transportation and Communication 6.4 2.7 2.9 4.3 6.8 9.3Household Operation 2.0 1.7 1.6 1.6 1.8 2.8Personal Care and Effects 4.2 3.5 4.2 4.3 4.3 4.1Clothing, Footwear and Other Wear 3.0 1.9 2.4 2.8 3.1 3.3Education 3.9 0.8 1.1 2.7 3.8 6.5Recreation 0.3 0.1 0.2 0.2 0.3 0.5Medical Care 2.1 1.7 1.2 1.6 2.2 2.8Non-Durable Furnishings 0.2 0.1 0.1 0.1 0.2 0.3Durable Furniture and Equipment 2.4 0.2 0.6 0.8 2.2 5.1Taxes 1.4 0.1 0.2 0.3 0.9 4.0Rent/Rental Value of Occupied Dwelling Unit 10.2 11.2 8.6 9.5 11.2 9.6House Maintenance and Minor Repairs 0.7 0.2 0.4 0.6 0.7 1.1Special Family Occasions 2.6 0.6 1.2 2.0 2.8 3.5Gifts and Contributions to Others 1.0 0.3 0.5 0.6 1.0 1.6Other Expenditure 2.7 4.8 3.4 2.2 2.0 3.6
Region II - Cagayan Valley 58,283 2,224 5,713 13,880 19,749 16,717Total Family Expenditure (in millions)
Percent of Total Expenditure 100.0 100.0 100.0 100.0 100.0 100.0Food 46.6 62.9 61.1 56.2 47.4 30.5
Food Consumed at Home 43.5 61.8 59.5 53.6 43.5 27.3Cereal and Cereal Preparations 12.7 21.6 20.4 17.3 11.9 5.9Roots and Tubers 0.7 1.1 0.9 0.9 0.6 0.4Fruit and Vegetables 5.8 9.7 8.5 7.3 5.6 3.5Meat and Meat Preparations 8.7 8.1 9.0 9.4 9.7 7.1Dairy Products and Eggs 3.1 3.1 3.3 3.3 3.5 2.5Fish and Marine Products 6.1 8.7 8.6 7.8 5.9 3.8Coffee, Cocoa and Tea 1.2 2.2 1.9 1.5 1.1 0.7Non-Alcoholic Beverages 1.4 0.9 1.2 1.4 1.6 1.2Food Not Elsewhere Classified 3.7 6.4 5.6 4.7 3.6 2.1
Food Regularly Consumed Outside the Home 3.1 1.1 1.7 2.7 3.9 3.2
TABLE 9 Total Annual Family Expenditure by Expenditure Group, by Income Class and by Region: 2003 --- (continued)
Region Total Family Expenditure
Income Class
Under 40,000- 60,000- 100,000- 250,000Expenditure Group
38 2003 Family Income and Expenditure Survey
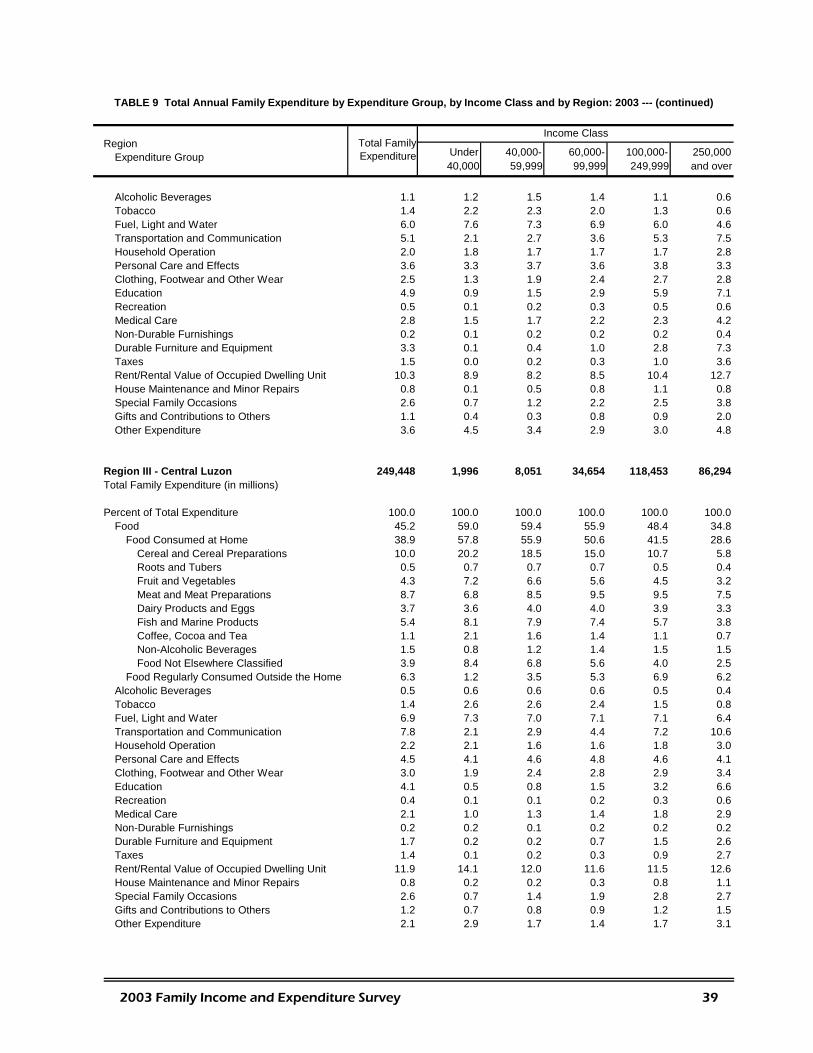
40,000 59,999 99,999 249,999 and over
Alcoholic Beverages 1.1 1.2 1.5 1.4 1.1 0.6Tobacco 1.4 2.2 2.3 2.0 1.3 0.6Fuel, Light and Water 6.0 7.6 7.3 6.9 6.0 4.6Transportation and Communication 5.1 2.1 2.7 3.6 5.3 7.5Household Operation 2.0 1.8 1.7 1.7 1.7 2.8Personal Care and Effects 3.6 3.3 3.7 3.6 3.8 3.3Clothing, Footwear and Other Wear 2.5 1.3 1.9 2.4 2.7 2.8Education 4.9 0.9 1.5 2.9 5.9 7.1Recreation 0.5 0.1 0.2 0.3 0.5 0.6Medical Care 2.8 1.5 1.7 2.2 2.3 4.2Non-Durable Furnishings 0.2 0.1 0.2 0.2 0.2 0.4Durable Furniture and Equipment 3.3 0.1 0.4 1.0 2.8 7.3Taxes 1.5 0.0 0.2 0.3 1.0 3.6Rent/Rental Value of Occupied Dwelling Unit 10.3 8.9 8.2 8.5 10.4 12.7House Maintenance and Minor Repairs 0.8 0.1 0.5 0.8 1.1 0.8Special Family Occasions 2.6 0.7 1.2 2.2 2.5 3.8Gifts and Contributions to Others 1.1 0.4 0.3 0.8 0.9 2.0Other Expenditure 3.6 4.5 3.4 2.9 3.0 4.8
Region III - Central Luzon 249,448 1,996 8,051 34,654 118,453 86,294Total Family Expenditure (in millions)
Percent of Total Expenditure 100.0 100.0 100.0 100.0 100.0 100.0Food 45.2 59.0 59.4 55.9 48.4 34.8
Food Consumed at Home 38.9 57.8 55.9 50.6 41.5 28.6Cereal and Cereal Preparations 10.0 20.2 18.5 15.0 10.7 5.8Roots and Tubers 0.5 0.7 0.7 0.7 0.5 0.4Fruit and Vegetables 4.3 7.2 6.6 5.6 4.5 3.2Meat and Meat Preparations 8.7 6.8 8.5 9.5 9.5 7.5Dairy Products and Eggs 3.7 3.6 4.0 4.0 3.9 3.3Fish and Marine Products 5.4 8.1 7.9 7.4 5.7 3.8Coffee, Cocoa and Tea 1.1 2.1 1.6 1.4 1.1 0.7Non-Alcoholic Beverages 1.5 0.8 1.2 1.4 1.5 1.5Food Not Elsewhere Classified 3.9 8.4 6.8 5.6 4.0 2.5
Food Regularly Consumed Outside the Home 6.3 1.2 3.5 5.3 6.9 6.2Alcoholic Beverages 0.5 0.6 0.6 0.6 0.5 0.4Tobacco 1.4 2.6 2.6 2.4 1.5 0.8Fuel, Light and Water 6.9 7.3 7.0 7.1 7.1 6.4Transportation and Communication 7.8 2.1 2.9 4.4 7.2 10.6Household Operation 2.2 2.1 1.6 1.6 1.8 3.0Personal Care and Effects 4.5 4.1 4.6 4.8 4.6 4.1Clothing, Footwear and Other Wear 3.0 1.9 2.4 2.8 2.9 3.4Education 4.1 0.5 0.8 1.5 3.2 6.6Recreation 0.4 0.1 0.1 0.2 0.3 0.6Medical Care 2.1 1.0 1.3 1.4 1.8 2.9Non-Durable Furnishings 0.2 0.2 0.1 0.2 0.2 0.2Durable Furniture and Equipment 1.7 0.2 0.2 0.7 1.5 2.6Taxes 1.4 0.1 0.2 0.3 0.9 2.7Rent/Rental Value of Occupied Dwelling Unit 11.9 14.1 12.0 11.6 11.5 12.6House Maintenance and Minor Repairs 0.8 0.2 0.2 0.3 0.8 1.1Special Family Occasions 2.6 0.7 1.4 1.9 2.8 2.7Gifts and Contributions to Others 1.2 0.7 0.8 0.9 1.2 1.5Other Expenditure 2.1 2.9 1.7 1.4 1.7 3.1
TABLE 9 Total Annual Family Expenditure by Expenditure Group, by Income Class and by Region: 2003 --- (continued)
Region Total Family Expenditure
Income Class
Under 40,000- 60,000- 100,000- 250,000Expenditure Group
2003 Family Income and Expenditure Survey 39

40,000 59,999 99,999 249,999 and over
Region IVA - CALABARZON 345,201 3,340 8,400 39,530 145,074 148,857Total Family Expenditure (in millions)
Percent of Total Expenditure 100.0 100.0 100.0 100.0 100.0 100.0Food 41.2 54.9 54.4 53.6 46.0 32.2
Food Consumed at Home 33.7 51.9 49.3 47.5 37.8 24.7Cereal and Cereal Preparations 8.8 20.9 17.6 14.9 9.9 5.2Roots and Tubers 0.4 0.7 0.6 0.6 0.4 0.3Fruit and Vegetables 3.7 5.5 5.3 5.0 4.0 2.9Meat and Meat Preparations 7.0 5.7 6.0 7.5 7.9 6.0Dairy Products and Eggs 3.2 2.4 2.9 3.4 3.4 2.9Fish and Marine Products 4.7 7.9 7.9 7.4 5.3 3.2Coffee, Cocoa and Tea 0.9 1.8 1.7 1.4 1.0 0.6Non-Alcoholic Beverages 1.3 0.6 1.0 1.2 1.5 1.2Food Not Elsewhere Classified 3.8 6.6 6.5 6.2 4.4 2.4
Food Regularly Consumed Outside the Home 7.5 2.9 5.1 6.0 8.2 7.5Alcoholic Beverages 0.4 0.6 0.9 0.6 0.5 0.3Tobacco 1.1 2.7 2.3 1.9 1.3 0.5Fuel, Light and Water 6.7 7.8 7.2 7.4 7.2 6.1Transportation and Communication 8.1 3.4 3.4 4.5 7.1 10.4Household Operation 2.3 2.1 1.7 1.6 1.7 3.0Personal Care and Effects 3.9 4.1 4.6 4.6 4.3 3.4Clothing, Footwear and Other Wear 2.7 2.5 2.9 2.6 2.7 2.8Education 4.1 0.8 1.3 1.5 2.8 6.3Recreation 0.4 0.2 0.3 0.3 0.3 0.5Medical Care 2.3 2.0 1.7 1.8 2.3 2.6Non-Durable Furnishings 0.2 0.1 0.2 0.2 0.1 0.2Durable Furniture and Equipment 2.8 0.4 0.5 1.3 1.9 4.2Taxes 2.2 0.3 0.3 0.3 1.3 3.8Rent/Rental Value of Occupied Dwelling Unit 13.8 12.0 12.5 12.2 13.6 14.4House Maintenance and Minor Repairs 0.5 0.4 0.4 0.4 0.5 0.6Special Family Occasions 2.9 2.3 2.4 2.8 2.7 3.2Gifts and Contributions to Others 1.6 0.8 1.3 0.8 1.4 2.0Other Expenditure 2.8 2.6 1.6 1.6 2.3 3.6
Region IVB - MIMAROPA 41,964 2,947 5,555 10,118 14,147 9,197Total Family Expenditure (in millions)
Percent of Total Expenditure 100.0 100.0 100.0 100.0 100.0 100.0Food 44.8 60.9 57.9 54.3 41.2 26.8
Food Consumed at Home 42.2 59.9 56.1 52.0 38.1 23.4Cereal and Cereal Preparations 15.9 26.5 24.7 21.1 12.9 5.9Roots and Tubers 0.7 2.4 1.0 0.8 0.5 0.3Fruit and Vegetables 4.9 7.5 6.1 5.8 4.4 2.8Meat and Meat Preparations 5.2 3.8 4.2 5.6 5.7 5.2Dairy Products and Eggs 2.8 2.7 3.0 3.2 3.0 2.2Fish and Marine Products 6.0 8.4 8.5 7.5 5.3 2.9Coffee, Cocoa and Tea 1.3 1.9 1.9 1.6 1.1 0.6Non-Alcoholic Beverages 1.1 0.6 0.9 1.1 1.2 1.0Food Not Elsewhere Classified 4.3 6.0 5.8 5.3 4.0 2.3
Food Regularly Consumed Outside the Home 2.6 1.0 1.7 2.2 3.1 3.4
TABLE 9 Total Annual Family Expenditure by Expenditure Group, by Income Class and by Region: 2003 --- (continued)
Region Total Family Expenditure
Income Class
Under 40,000- 60,000- 100,000- 250,000Expenditure Group
40 2003 Family Income and Expenditure Survey

40,000 59,999 99,999 249,999 and over
Alcoholic Beverages 1.1 1.3 1.3 1.4 1.0 0.8Tobacco 1.3 2.4 2.0 1.6 1.0 0.7Fuel, Light and Water 6.1 7.3 6.6 6.3 6.3 5.0Transportation and Communication 5.9 2.7 3.5 4.8 6.7 8.4Household Operation 2.1 2.0 1.8 1.7 1.7 3.3Personal Care and Effects 4.1 3.3 4.4 4.6 4.3 3.3Clothing, Footwear and Other Wear 3.4 2.5 3.0 3.2 3.8 3.4Education 4.4 0.8 1.4 2.4 4.6 9.5Recreation 0.6 0.1 0.2 0.3 0.6 1.2Medical Care 2.4 1.2 1.3 1.6 2.1 4.7Non-Durable Furnishings 0.3 0.2 0.3 0.3 0.3 0.3Durable Furniture and Equipment 3.0 0.4 1.0 1.4 4.4 4.5Taxes 1.5 0.1 0.2 0.4 1.3 4.3Rent/Rental Value of Occupied Dwelling Unit 10.2 8.3 9.3 9.5 11.4 10.0House Maintenance and Minor Repairs 0.8 0.3 0.5 0.8 1.2 0.6Special Family Occasions 2.4 0.8 1.4 2.1 2.7 3.4Gifts and Contributions to Others 1.4 0.8 0.7 0.8 1.1 3.3Other Expenditure 4.2 4.5 3.2 2.4 4.3 6.5
Region V - Bicol Region 88,931 6,277 12,198 18,568 25,996 25,892Total Family Expenditure (in millions)
Percent of Total Expenditure 100.0 100.0 100.0 100.0 100.0 100.0Food 45.4 61.5 60.0 55.5 43.5 29.2
Food Consumed at Home 42.3 60.5 58.1 52.1 39.6 26.0Cereal and Cereal Preparations 14.3 26.3 23.2 19.0 12.0 6.1Roots and Tubers 0.8 1.3 1.3 0.9 0.6 0.4Fruit and Vegetables 5.1 7.4 6.7 6.1 4.7 3.3Meat and Meat Preparations 5.5 3.9 4.7 5.5 6.3 5.5Dairy Products and Eggs 3.3 2.8 3.4 3.6 3.6 2.9Fish and Marine Products 7.2 11.0 10.8 9.6 6.3 3.8Coffee, Cocoa and Tea 1.2 1.7 1.7 1.5 1.1 0.7Non-Alcoholic Beverages 0.9 0.5 0.7 0.9 1.1 0.9Food Not Elsewhere Classified 4.0 5.6 5.5 5.0 3.9 2.3
Food Regularly Consumed Outside the Home 3.1 1.0 2.0 3.3 3.9 3.2Alcoholic Beverages 0.7 1.0 1.0 0.9 0.7 0.4Tobacco 1.2 2.4 2.0 1.7 1.0 0.4Fuel, Light and Water 6.1 7.2 6.4 6.6 6.3 5.2Transportation and Communication 5.6 2.6 2.8 4.4 6.2 8.1Household Operation 2.3 2.0 1.8 1.7 2.0 3.4Personal Care and Effects 3.7 3.5 3.8 4.1 3.8 3.1Clothing, Footwear and Other Wear 2.6 2.2 2.4 2.6 2.7 2.5Education 4.6 1.1 1.7 2.5 5.1 7.8Recreation 0.5 0.1 0.2 0.3 0.5 0.9Medical Care 2.8 1.4 1.9 1.9 2.9 4.1Non-Durable Furnishings 0.3 0.2 0.2 0.3 0.3 0.2Durable Furniture and Equipment 3.5 0.2 1.0 1.6 4.4 5.9Taxes 1.7 0.1 0.1 0.2 1.1 4.6Rent/Rental Value of Occupied Dwelling Unit 10.5 8.2 8.3 9.4 10.6 12.7House Maintenance and Minor Repairs 0.9 0.6 0.5 1.0 1.0 1.2Special Family Occasions 2.9 1.3 2.0 2.6 3.6 3.2Gifts and Contributions to Others 0.9 0.6 0.6 0.6 1.0 1.3Other Expenditure 3.7 3.7 3.1 1.9 3.2 5.8
TABLE 9 Total Annual Family Expenditure by Expenditure Group, by Income Class and by Region: 2003 --- (continued)
Region Total Family Expenditure
Income Class
Under 40,000- 60,000- 100,000- 250,000Expenditure Group
2003 Family Income and Expenditure Survey 41
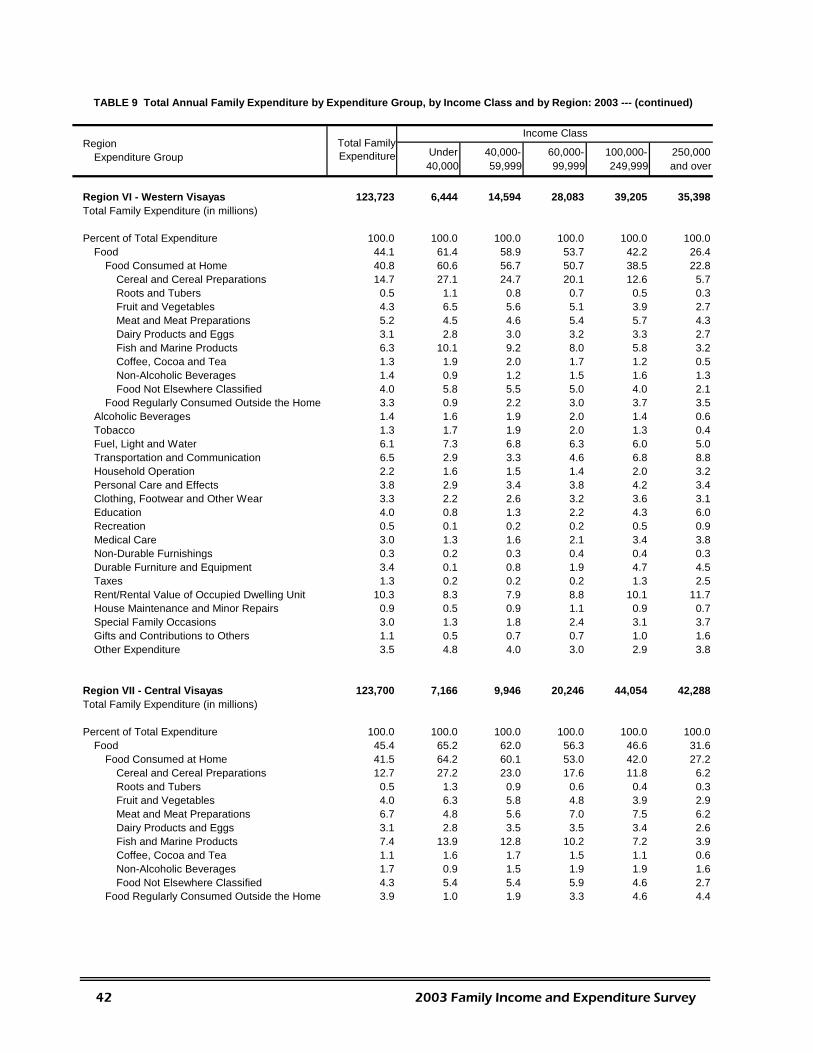
40,000 59,999 99,999 249,999 and over
Region VI - Western Visayas 123,723 6,444 14,594 28,083 39,205 35,398Total Family Expenditure (in millions)
Percent of Total Expenditure 100.0 100.0 100.0 100.0 100.0 100.0Food 44.1 61.4 58.9 53.7 42.2 26.4
Food Consumed at Home 40.8 60.6 56.7 50.7 38.5 22.8Cereal and Cereal Preparations 14.7 27.1 24.7 20.1 12.6 5.7Roots and Tubers 0.5 1.1 0.8 0.7 0.5 0.3Fruit and Vegetables 4.3 6.5 5.6 5.1 3.9 2.7Meat and Meat Preparations 5.2 4.5 4.6 5.4 5.7 4.3Dairy Products and Eggs 3.1 2.8 3.0 3.2 3.3 2.7Fish and Marine Products 6.3 10.1 9.2 8.0 5.8 3.2Coffee, Cocoa and Tea 1.3 1.9 2.0 1.7 1.2 0.5Non-Alcoholic Beverages 1.4 0.9 1.2 1.5 1.6 1.3Food Not Elsewhere Classified 4.0 5.8 5.5 5.0 4.0 2.1
Food Regularly Consumed Outside the Home 3.3 0.9 2.2 3.0 3.7 3.5Alcoholic Beverages 1.4 1.6 1.9 2.0 1.4 0.6Tobacco 1.3 1.7 1.9 2.0 1.3 0.4Fuel, Light and Water 6.1 7.3 6.8 6.3 6.0 5.0Transportation and Communication 6.5 2.9 3.3 4.6 6.8 8.8Household Operation 2.2 1.6 1.5 1.4 2.0 3.2Personal Care and Effects 3.8 2.9 3.4 3.8 4.2 3.4Clothing, Footwear and Other Wear 3.3 2.2 2.6 3.2 3.6 3.1Education 4.0 0.8 1.3 2.2 4.3 6.0Recreation 0.5 0.1 0.2 0.2 0.5 0.9Medical Care 3.0 1.3 1.6 2.1 3.4 3.8Non-Durable Furnishings 0.3 0.2 0.3 0.4 0.4 0.3Durable Furniture and Equipment 3.4 0.1 0.8 1.9 4.7 4.5Taxes 1.3 0.2 0.2 0.2 1.3 2.5Rent/Rental Value of Occupied Dwelling Unit 10.3 8.3 7.9 8.8 10.1 11.7House Maintenance and Minor Repairs 0.9 0.5 0.9 1.1 0.9 0.7Special Family Occasions 3.0 1.3 1.8 2.4 3.1 3.7Gifts and Contributions to Others 1.1 0.5 0.7 0.7 1.0 1.6Other Expenditure 3.5 4.8 4.0 3.0 2.9 3.8
Region VII - Central Visayas 123,700 7,166 9,946 20,246 44,054 42,288Total Family Expenditure (in millions)
Percent of Total Expenditure 100.0 100.0 100.0 100.0 100.0 100.0Food 45.4 65.2 62.0 56.3 46.6 31.6
Food Consumed at Home 41.5 64.2 60.1 53.0 42.0 27.2Cereal and Cereal Preparations 12.7 27.2 23.0 17.6 11.8 6.2Roots and Tubers 0.5 1.3 0.9 0.6 0.4 0.3Fruit and Vegetables 4.0 6.3 5.8 4.8 3.9 2.9Meat and Meat Preparations 6.7 4.8 5.6 7.0 7.5 6.2Dairy Products and Eggs 3.1 2.8 3.5 3.5 3.4 2.6Fish and Marine Products 7.4 13.9 12.8 10.2 7.2 3.9Coffee, Cocoa and Tea 1.1 1.6 1.7 1.5 1.1 0.6Non-Alcoholic Beverages 1.7 0.9 1.5 1.9 1.9 1.6Food Not Elsewhere Classified 4.3 5.4 5.4 5.9 4.6 2.7
Food Regularly Consumed Outside the Home 3.9 1.0 1.9 3.3 4.6 4.4
TABLE 9 Total Annual Family Expenditure by Expenditure Group, by Income Class and by Region: 2003 --- (continued)
Region Total Family Expenditure
Income Class
Under 40,000- 60,000- 100,000- 250,000Expenditure Group
42 2003 Family Income and Expenditure Survey
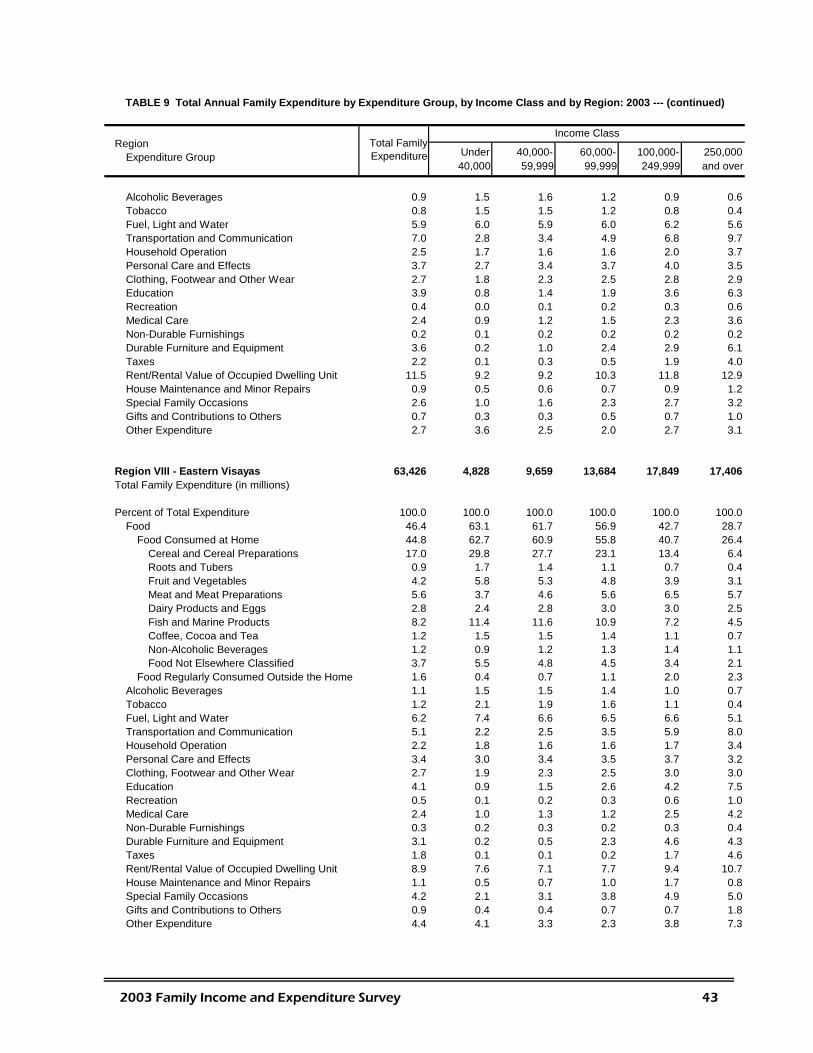
40,000 59,999 99,999 249,999 and over
Alcoholic Beverages 0.9 1.5 1.6 1.2 0.9 0.6Tobacco 0.8 1.5 1.5 1.2 0.8 0.4Fuel, Light and Water 5.9 6.0 5.9 6.0 6.2 5.6Transportation and Communication 7.0 2.8 3.4 4.9 6.8 9.7Household Operation 2.5 1.7 1.6 1.6 2.0 3.7Personal Care and Effects 3.7 2.7 3.4 3.7 4.0 3.5Clothing, Footwear and Other Wear 2.7 1.8 2.3 2.5 2.8 2.9Education 3.9 0.8 1.4 1.9 3.6 6.3Recreation 0.4 0.0 0.1 0.2 0.3 0.6Medical Care 2.4 0.9 1.2 1.5 2.3 3.6Non-Durable Furnishings 0.2 0.1 0.2 0.2 0.2 0.2Durable Furniture and Equipment 3.6 0.2 1.0 2.4 2.9 6.1Taxes 2.2 0.1 0.3 0.5 1.9 4.0Rent/Rental Value of Occupied Dwelling Unit 11.5 9.2 9.2 10.3 11.8 12.9House Maintenance and Minor Repairs 0.9 0.5 0.6 0.7 0.9 1.2Special Family Occasions 2.6 1.0 1.6 2.3 2.7 3.2Gifts and Contributions to Others 0.7 0.3 0.3 0.5 0.7 1.0Other Expenditure 2.7 3.6 2.5 2.0 2.7 3.1
Region VIII - Eastern Visayas 63,426 4,828 9,659 13,684 17,849 17,406Total Family Expenditure (in millions)
Percent of Total Expenditure 100.0 100.0 100.0 100.0 100.0 100.0Food 46.4 63.1 61.7 56.9 42.7 28.7
Food Consumed at Home 44.8 62.7 60.9 55.8 40.7 26.4Cereal and Cereal Preparations 17.0 29.8 27.7 23.1 13.4 6.4Roots and Tubers 0.9 1.7 1.4 1.1 0.7 0.4Fruit and Vegetables 4.2 5.8 5.3 4.8 3.9 3.1Meat and Meat Preparations 5.6 3.7 4.6 5.6 6.5 5.7Dairy Products and Eggs 2.8 2.4 2.8 3.0 3.0 2.5Fish and Marine Products 8.2 11.4 11.6 10.9 7.2 4.5Coffee, Cocoa and Tea 1.2 1.5 1.5 1.4 1.1 0.7Non-Alcoholic Beverages 1.2 0.9 1.2 1.3 1.4 1.1Food Not Elsewhere Classified 3.7 5.5 4.8 4.5 3.4 2.1
Food Regularly Consumed Outside the Home 1.6 0.4 0.7 1.1 2.0 2.3Alcoholic Beverages 1.1 1.5 1.5 1.4 1.0 0.7Tobacco 1.2 2.1 1.9 1.6 1.1 0.4Fuel, Light and Water 6.2 7.4 6.6 6.5 6.6 5.1Transportation and Communication 5.1 2.2 2.5 3.5 5.9 8.0Household Operation 2.2 1.8 1.6 1.6 1.7 3.4Personal Care and Effects 3.4 3.0 3.4 3.5 3.7 3.2Clothing, Footwear and Other Wear 2.7 1.9 2.3 2.5 3.0 3.0Education 4.1 0.9 1.5 2.6 4.2 7.5Recreation 0.5 0.1 0.2 0.3 0.6 1.0Medical Care 2.4 1.0 1.3 1.2 2.5 4.2Non-Durable Furnishings 0.3 0.2 0.3 0.2 0.3 0.4Durable Furniture and Equipment 3.1 0.2 0.5 2.3 4.6 4.3Taxes 1.8 0.1 0.1 0.2 1.7 4.6Rent/Rental Value of Occupied Dwelling Unit 8.9 7.6 7.1 7.7 9.4 10.7House Maintenance and Minor Repairs 1.1 0.5 0.7 1.0 1.7 0.8Special Family Occasions 4.2 2.1 3.1 3.8 4.9 5.0Gifts and Contributions to Others 0.9 0.4 0.4 0.7 0.7 1.8Other Expenditure 4.4 4.1 3.3 2.3 3.8 7.3
TABLE 9 Total Annual Family Expenditure by Expenditure Group, by Income Class and by Region: 2003 --- (continued)
Region Total Family Expenditure
Income Class
Under 40,000- 60,000- 100,000- 250,000Expenditure Group
2003 Family Income and Expenditure Survey 43
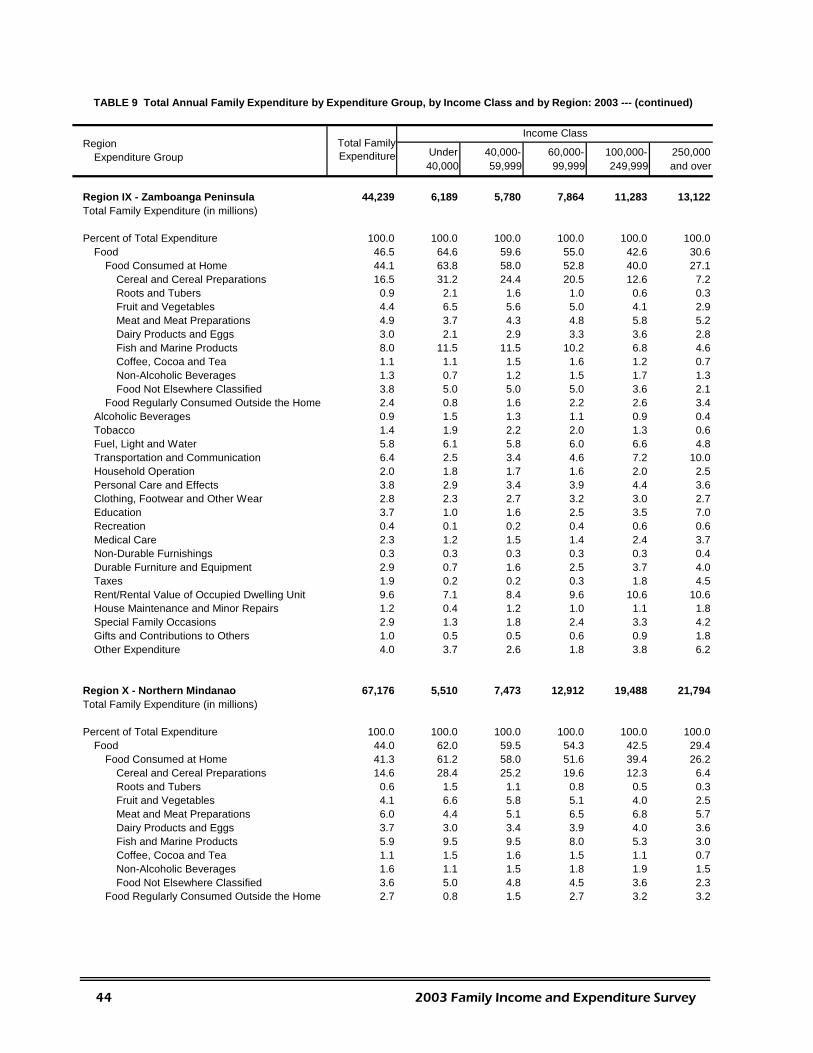
40,000 59,999 99,999 249,999 and over
Region IX - Zamboanga Peninsula 44,239 6,189 5,780 7,864 11,283 13,122Total Family Expenditure (in millions)
Percent of Total Expenditure 100.0 100.0 100.0 100.0 100.0 100.0Food 46.5 64.6 59.6 55.0 42.6 30.6
Food Consumed at Home 44.1 63.8 58.0 52.8 40.0 27.1Cereal and Cereal Preparations 16.5 31.2 24.4 20.5 12.6 7.2Roots and Tubers 0.9 2.1 1.6 1.0 0.6 0.3Fruit and Vegetables 4.4 6.5 5.6 5.0 4.1 2.9Meat and Meat Preparations 4.9 3.7 4.3 4.8 5.8 5.2Dairy Products and Eggs 3.0 2.1 2.9 3.3 3.6 2.8Fish and Marine Products 8.0 11.5 11.5 10.2 6.8 4.6Coffee, Cocoa and Tea 1.1 1.1 1.5 1.6 1.2 0.7Non-Alcoholic Beverages 1.3 0.7 1.2 1.5 1.7 1.3Food Not Elsewhere Classified 3.8 5.0 5.0 5.0 3.6 2.1
Food Regularly Consumed Outside the Home 2.4 0.8 1.6 2.2 2.6 3.4Alcoholic Beverages 0.9 1.5 1.3 1.1 0.9 0.4Tobacco 1.4 1.9 2.2 2.0 1.3 0.6Fuel, Light and Water 5.8 6.1 5.8 6.0 6.6 4.8Transportation and Communication 6.4 2.5 3.4 4.6 7.2 10.0Household Operation 2.0 1.8 1.7 1.6 2.0 2.5Personal Care and Effects 3.8 2.9 3.4 3.9 4.4 3.6Clothing, Footwear and Other Wear 2.8 2.3 2.7 3.2 3.0 2.7Education 3.7 1.0 1.6 2.5 3.5 7.0Recreation 0.4 0.1 0.2 0.4 0.6 0.6Medical Care 2.3 1.2 1.5 1.4 2.4 3.7Non-Durable Furnishings 0.3 0.3 0.3 0.3 0.3 0.4Durable Furniture and Equipment 2.9 0.7 1.6 2.5 3.7 4.0Taxes 1.9 0.2 0.2 0.3 1.8 4.5Rent/Rental Value of Occupied Dwelling Unit 9.6 7.1 8.4 9.6 10.6 10.6House Maintenance and Minor Repairs 1.2 0.4 1.2 1.0 1.1 1.8Special Family Occasions 2.9 1.3 1.8 2.4 3.3 4.2Gifts and Contributions to Others 1.0 0.5 0.5 0.6 0.9 1.8Other Expenditure 4.0 3.7 2.6 1.8 3.8 6.2
Region X - Northern Mindanao 67,176 5,510 7,473 12,912 19,488 21,794Total Family Expenditure (in millions)
Percent of Total Expenditure 100.0 100.0 100.0 100.0 100.0 100.0Food 44.0 62.0 59.5 54.3 42.5 29.4
Food Consumed at Home 41.3 61.2 58.0 51.6 39.4 26.2Cereal and Cereal Preparations 14.6 28.4 25.2 19.6 12.3 6.4Roots and Tubers 0.6 1.5 1.1 0.8 0.5 0.3Fruit and Vegetables 4.1 6.6 5.8 5.1 4.0 2.5Meat and Meat Preparations 6.0 4.4 5.1 6.5 6.8 5.7Dairy Products and Eggs 3.7 3.0 3.4 3.9 4.0 3.6Fish and Marine Products 5.9 9.5 9.5 8.0 5.3 3.0Coffee, Cocoa and Tea 1.1 1.5 1.6 1.5 1.1 0.7Non-Alcoholic Beverages 1.6 1.1 1.5 1.8 1.9 1.5Food Not Elsewhere Classified 3.6 5.0 4.8 4.5 3.6 2.3
Food Regularly Consumed Outside the Home 2.7 0.8 1.5 2.7 3.2 3.2
TABLE 9 Total Annual Family Expenditure by Expenditure Group, by Income Class and by Region: 2003 --- (continued)
Region Total Family Expenditure
Income Class
Under 40,000- 60,000- 100,000- 250,000Expenditure Group
44 2003 Family Income and Expenditure Survey
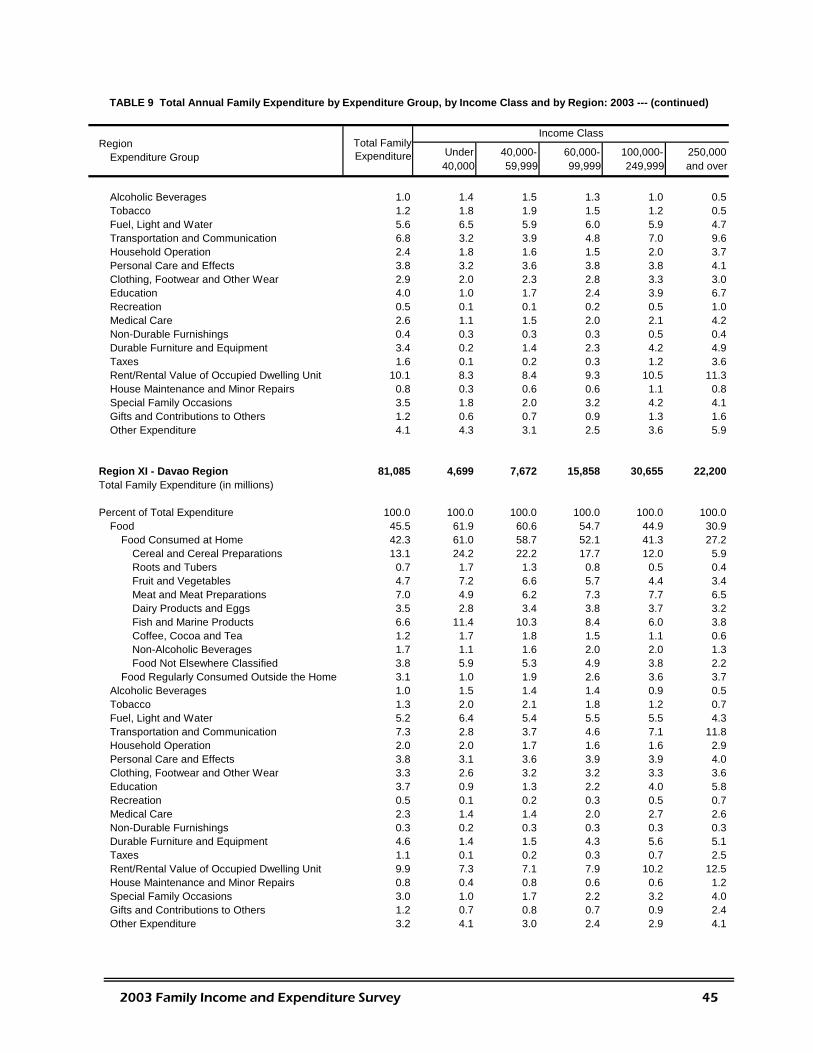
40,000 59,999 99,999 249,999 and over
Alcoholic Beverages 1.0 1.4 1.5 1.3 1.0 0.5Tobacco 1.2 1.8 1.9 1.5 1.2 0.5Fuel, Light and Water 5.6 6.5 5.9 6.0 5.9 4.7Transportation and Communication 6.8 3.2 3.9 4.8 7.0 9.6Household Operation 2.4 1.8 1.6 1.5 2.0 3.7Personal Care and Effects 3.8 3.2 3.6 3.8 3.8 4.1Clothing, Footwear and Other Wear 2.9 2.0 2.3 2.8 3.3 3.0Education 4.0 1.0 1.7 2.4 3.9 6.7Recreation 0.5 0.1 0.1 0.2 0.5 1.0Medical Care 2.6 1.1 1.5 2.0 2.1 4.2Non-Durable Furnishings 0.4 0.3 0.3 0.3 0.5 0.4Durable Furniture and Equipment 3.4 0.2 1.4 2.3 4.2 4.9Taxes 1.6 0.1 0.2 0.3 1.2 3.6Rent/Rental Value of Occupied Dwelling Unit 10.1 8.3 8.4 9.3 10.5 11.3House Maintenance and Minor Repairs 0.8 0.3 0.6 0.6 1.1 0.8Special Family Occasions 3.5 1.8 2.0 3.2 4.2 4.1Gifts and Contributions to Others 1.2 0.6 0.7 0.9 1.3 1.6Other Expenditure 4.1 4.3 3.1 2.5 3.6 5.9
Region XI - Davao Region 81,085 4,699 7,672 15,858 30,655 22,200Total Family Expenditure (in millions)
Percent of Total Expenditure 100.0 100.0 100.0 100.0 100.0 100.0Food 45.5 61.9 60.6 54.7 44.9 30.9
Food Consumed at Home 42.3 61.0 58.7 52.1 41.3 27.2Cereal and Cereal Preparations 13.1 24.2 22.2 17.7 12.0 5.9Roots and Tubers 0.7 1.7 1.3 0.8 0.5 0.4Fruit and Vegetables 4.7 7.2 6.6 5.7 4.4 3.4Meat and Meat Preparations 7.0 4.9 6.2 7.3 7.7 6.5Dairy Products and Eggs 3.5 2.8 3.4 3.8 3.7 3.2Fish and Marine Products 6.6 11.4 10.3 8.4 6.0 3.8Coffee, Cocoa and Tea 1.2 1.7 1.8 1.5 1.1 0.6Non-Alcoholic Beverages 1.7 1.1 1.6 2.0 2.0 1.3Food Not Elsewhere Classified 3.8 5.9 5.3 4.9 3.8 2.2
Food Regularly Consumed Outside the Home 3.1 1.0 1.9 2.6 3.6 3.7Alcoholic Beverages 1.0 1.5 1.4 1.4 0.9 0.5Tobacco 1.3 2.0 2.1 1.8 1.2 0.7Fuel, Light and Water 5.2 6.4 5.4 5.5 5.5 4.3Transportation and Communication 7.3 2.8 3.7 4.6 7.1 11.8Household Operation 2.0 2.0 1.7 1.6 1.6 2.9Personal Care and Effects 3.8 3.1 3.6 3.9 3.9 4.0Clothing, Footwear and Other Wear 3.3 2.6 3.2 3.2 3.3 3.6Education 3.7 0.9 1.3 2.2 4.0 5.8Recreation 0.5 0.1 0.2 0.3 0.5 0.7Medical Care 2.3 1.4 1.4 2.0 2.7 2.6Non-Durable Furnishings 0.3 0.2 0.3 0.3 0.3 0.3Durable Furniture and Equipment 4.6 1.4 1.5 4.3 5.6 5.1Taxes 1.1 0.1 0.2 0.3 0.7 2.5Rent/Rental Value of Occupied Dwelling Unit 9.9 7.3 7.1 7.9 10.2 12.5House Maintenance and Minor Repairs 0.8 0.4 0.8 0.6 0.6 1.2Special Family Occasions 3.0 1.0 1.7 2.2 3.2 4.0Gifts and Contributions to Others 1.2 0.7 0.8 0.7 0.9 2.4Other Expenditure 3.2 4.1 3.0 2.4 2.9 4.1
TABLE 9 Total Annual Family Expenditure by Expenditure Group, by Income Class and by Region: 2003 --- (continued)
Region Total Family Expenditure
Income Class
Under 40,000- 60,000- 100,000- 250,000Expenditure Group
2003 Family Income and Expenditure Survey 45
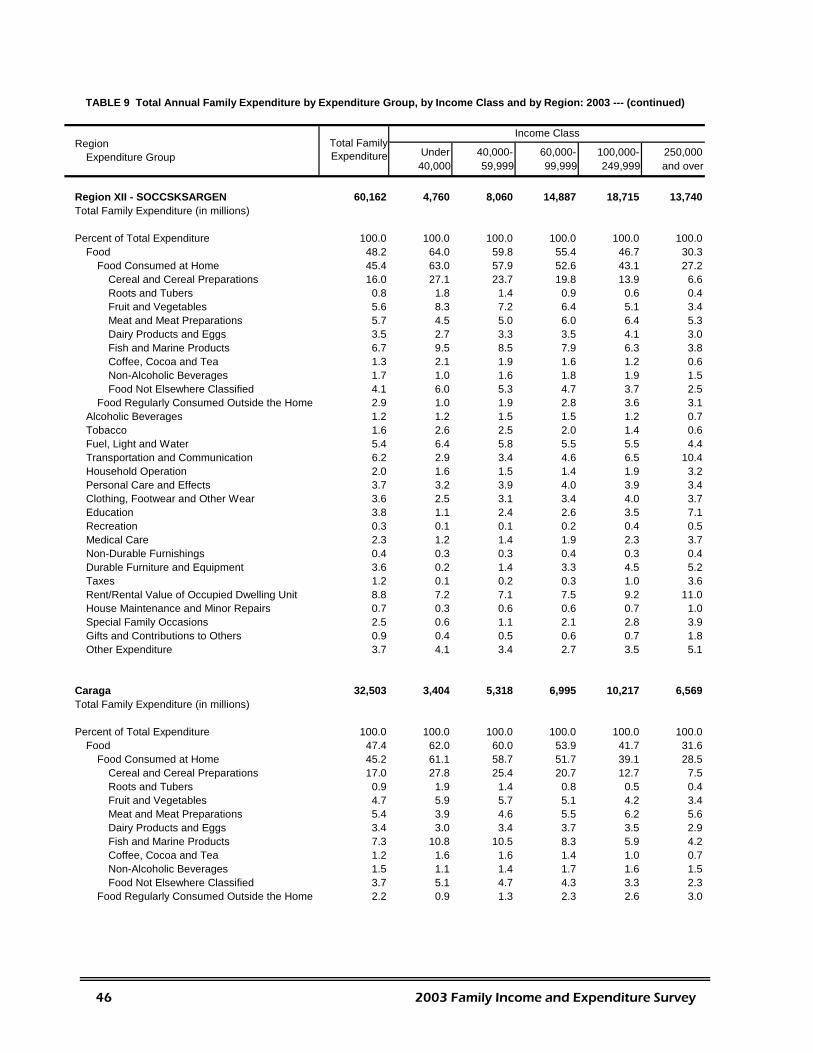
40,000 59,999 99,999 249,999 and over
Region XII - SOCCSKSARGEN 60,162 4,760 8,060 14,887 18,715 13,740Total Family Expenditure (in millions)
Percent of Total Expenditure 100.0 100.0 100.0 100.0 100.0 100.0Food 48.2 64.0 59.8 55.4 46.7 30.3
Food Consumed at Home 45.4 63.0 57.9 52.6 43.1 27.2Cereal and Cereal Preparations 16.0 27.1 23.7 19.8 13.9 6.6Roots and Tubers 0.8 1.8 1.4 0.9 0.6 0.4Fruit and Vegetables 5.6 8.3 7.2 6.4 5.1 3.4Meat and Meat Preparations 5.7 4.5 5.0 6.0 6.4 5.3Dairy Products and Eggs 3.5 2.7 3.3 3.5 4.1 3.0Fish and Marine Products 6.7 9.5 8.5 7.9 6.3 3.8Coffee, Cocoa and Tea 1.3 2.1 1.9 1.6 1.2 0.6Non-Alcoholic Beverages 1.7 1.0 1.6 1.8 1.9 1.5Food Not Elsewhere Classified 4.1 6.0 5.3 4.7 3.7 2.5
Food Regularly Consumed Outside the Home 2.9 1.0 1.9 2.8 3.6 3.1Alcoholic Beverages 1.2 1.2 1.5 1.5 1.2 0.7Tobacco 1.6 2.6 2.5 2.0 1.4 0.6Fuel, Light and Water 5.4 6.4 5.8 5.5 5.5 4.4Transportation and Communication 6.2 2.9 3.4 4.6 6.5 10.4Household Operation 2.0 1.6 1.5 1.4 1.9 3.2Personal Care and Effects 3.7 3.2 3.9 4.0 3.9 3.4Clothing, Footwear and Other Wear 3.6 2.5 3.1 3.4 4.0 3.7Education 3.8 1.1 2.4 2.6 3.5 7.1Recreation 0.3 0.1 0.1 0.2 0.4 0.5Medical Care 2.3 1.2 1.4 1.9 2.3 3.7Non-Durable Furnishings 0.4 0.3 0.3 0.4 0.3 0.4Durable Furniture and Equipment 3.6 0.2 1.4 3.3 4.5 5.2Taxes 1.2 0.1 0.2 0.3 1.0 3.6Rent/Rental Value of Occupied Dwelling Unit 8.8 7.2 7.1 7.5 9.2 11.0House Maintenance and Minor Repairs 0.7 0.3 0.6 0.6 0.7 1.0Special Family Occasions 2.5 0.6 1.1 2.1 2.8 3.9Gifts and Contributions to Others 0.9 0.4 0.5 0.6 0.7 1.8Other Expenditure 3.7 4.1 3.4 2.7 3.5 5.1
Caraga 32,503 3,404 5,318 6,995 10,217 6,569Total Family Expenditure (in millions)
Percent of Total Expenditure 100.0 100.0 100.0 100.0 100.0 100.0Food 47.4 62.0 60.0 53.9 41.7 31.6
Food Consumed at Home 45.2 61.1 58.7 51.7 39.1 28.5Cereal and Cereal Preparations 17.0 27.8 25.4 20.7 12.7 7.5Roots and Tubers 0.9 1.9 1.4 0.8 0.5 0.4Fruit and Vegetables 4.7 5.9 5.7 5.1 4.2 3.4Meat and Meat Preparations 5.4 3.9 4.6 5.5 6.2 5.6Dairy Products and Eggs 3.4 3.0 3.4 3.7 3.5 2.9Fish and Marine Products 7.3 10.8 10.5 8.3 5.9 4.2Coffee, Cocoa and Tea 1.2 1.6 1.6 1.4 1.0 0.7Non-Alcoholic Beverages 1.5 1.1 1.4 1.7 1.6 1.5Food Not Elsewhere Classified 3.7 5.1 4.7 4.3 3.3 2.3
Food Regularly Consumed Outside the Home 2.2 0.9 1.3 2.3 2.6 3.0
TABLE 9 Total Annual Family Expenditure by Expenditure Group, by Income Class and by Region: 2003 --- (continued)
Region Total Family Expenditure
Income Class
Under 40,000- 60,000- 100,000- 250,000Expenditure Group
46 2003 Family Income and Expenditure Survey
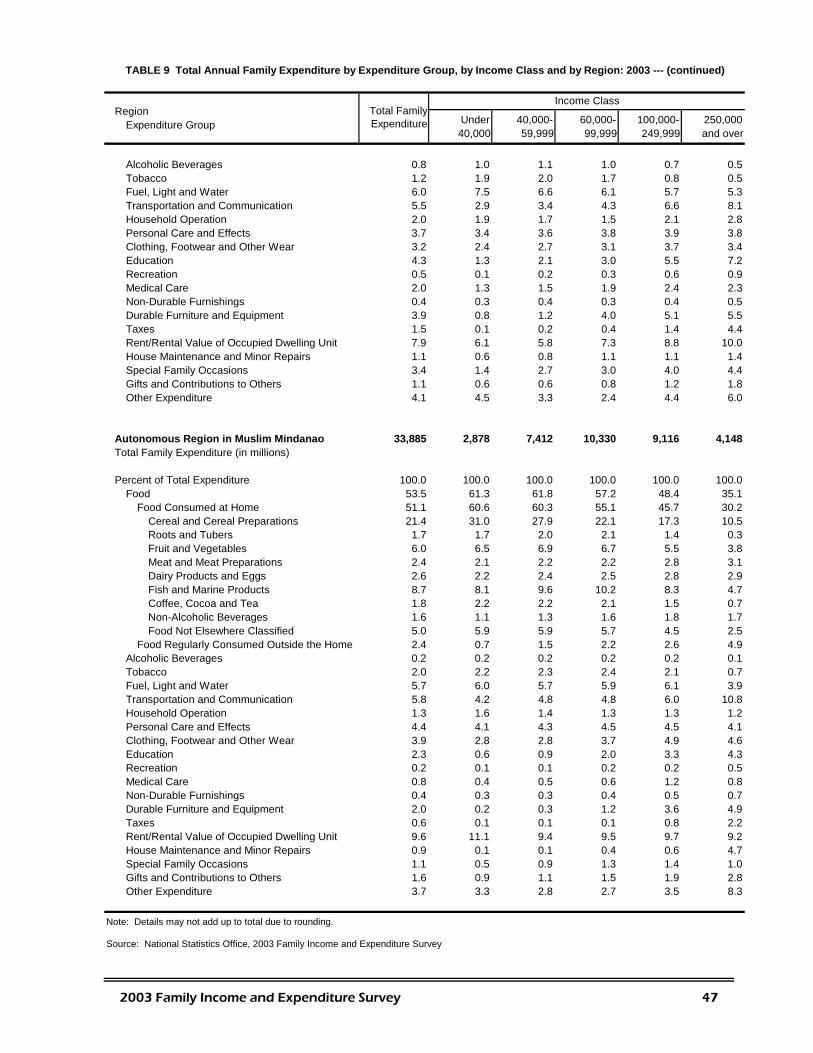
40,000 59,999 99,999 249,999 and over
Alcoholic Beverages 0.8 1.0 1.1 1.0 0.7 0.5Tobacco 1.2 1.9 2.0 1.7 0.8 0.5Fuel, Light and Water 6.0 7.5 6.6 6.1 5.7 5.3Transportation and Communication 5.5 2.9 3.4 4.3 6.6 8.1Household Operation 2.0 1.9 1.7 1.5 2.1 2.8Personal Care and Effects 3.7 3.4 3.6 3.8 3.9 3.8Clothing, Footwear and Other Wear 3.2 2.4 2.7 3.1 3.7 3.4Education 4.3 1.3 2.1 3.0 5.5 7.2Recreation 0.5 0.1 0.2 0.3 0.6 0.9Medical Care 2.0 1.3 1.5 1.9 2.4 2.3Non-Durable Furnishings 0.4 0.3 0.4 0.3 0.4 0.5Durable Furniture and Equipment 3.9 0.8 1.2 4.0 5.1 5.5Taxes 1.5 0.1 0.2 0.4 1.4 4.4Rent/Rental Value of Occupied Dwelling Unit 7.9 6.1 5.8 7.3 8.8 10.0House Maintenance and Minor Repairs 1.1 0.6 0.8 1.1 1.1 1.4Special Family Occasions 3.4 1.4 2.7 3.0 4.0 4.4Gifts and Contributions to Others 1.1 0.6 0.6 0.8 1.2 1.8Other Expenditure 4.1 4.5 3.3 2.4 4.4 6.0
Autonomous Region in Muslim Mindanao 33,885 2,878 7,412 10,330 9,116 4,148Total Family Expenditure (in millions)
Percent of Total Expenditure 100.0 100.0 100.0 100.0 100.0 100.0Food 53.5 61.3 61.8 57.2 48.4 35.1
Food Consumed at Home 51.1 60.6 60.3 55.1 45.7 30.2Cereal and Cereal Preparations 21.4 31.0 27.9 22.1 17.3 10.5Roots and Tubers 1.7 1.7 2.0 2.1 1.4 0.3Fruit and Vegetables 6.0 6.5 6.9 6.7 5.5 3.8Meat and Meat Preparations 2.4 2.1 2.2 2.2 2.8 3.1Dairy Products and Eggs 2.6 2.2 2.4 2.5 2.8 2.9Fish and Marine Products 8.7 8.1 9.6 10.2 8.3 4.7Coffee, Cocoa and Tea 1.8 2.2 2.2 2.1 1.5 0.7Non-Alcoholic Beverages 1.6 1.1 1.3 1.6 1.8 1.7Food Not Elsewhere Classified 5.0 5.9 5.9 5.7 4.5 2.5
Food Regularly Consumed Outside the Home 2.4 0.7 1.5 2.2 2.6 4.9Alcoholic Beverages 0.2 0.2 0.2 0.2 0.2 0.1Tobacco 2.0 2.2 2.3 2.4 2.1 0.7Fuel, Light and Water 5.7 6.0 5.7 5.9 6.1 3.9Transportation and Communication 5.8 4.2 4.8 4.8 6.0 10.8Household Operation 1.3 1.6 1.4 1.3 1.3 1.2Personal Care and Effects 4.4 4.1 4.3 4.5 4.5 4.1Clothing, Footwear and Other Wear 3.9 2.8 2.8 3.7 4.9 4.6Education 2.3 0.6 0.9 2.0 3.3 4.3Recreation 0.2 0.1 0.1 0.2 0.2 0.5Medical Care 0.8 0.4 0.5 0.6 1.2 0.8Non-Durable Furnishings 0.4 0.3 0.3 0.4 0.5 0.7Durable Furniture and Equipment 2.0 0.2 0.3 1.2 3.6 4.9Taxes 0.6 0.1 0.1 0.1 0.8 2.2Rent/Rental Value of Occupied Dwelling Unit 9.6 11.1 9.4 9.5 9.7 9.2House Maintenance and Minor Repairs 0.9 0.1 0.1 0.4 0.6 4.7Special Family Occasions 1.1 0.5 0.9 1.3 1.4 1.0Gifts and Contributions to Others 1.6 0.9 1.1 1.5 1.9 2.8Other Expenditure 3.7 3.3 2.8 2.7 3.5 8.3
Note: Details may not add up to total due to rounding.
Source: National Statistics Office, 2003 Family Income and Expenditure Survey
250,000Expenditure Group Region Total Family
Expenditure
Income Class
Under 40,000- 60,000- 100,000-
TABLE 9 Total Annual Family Expenditure by Expenditure Group, by Income Class and by Region: 2003 --- (continued)
2003 Family Income and Expenditure Survey 47
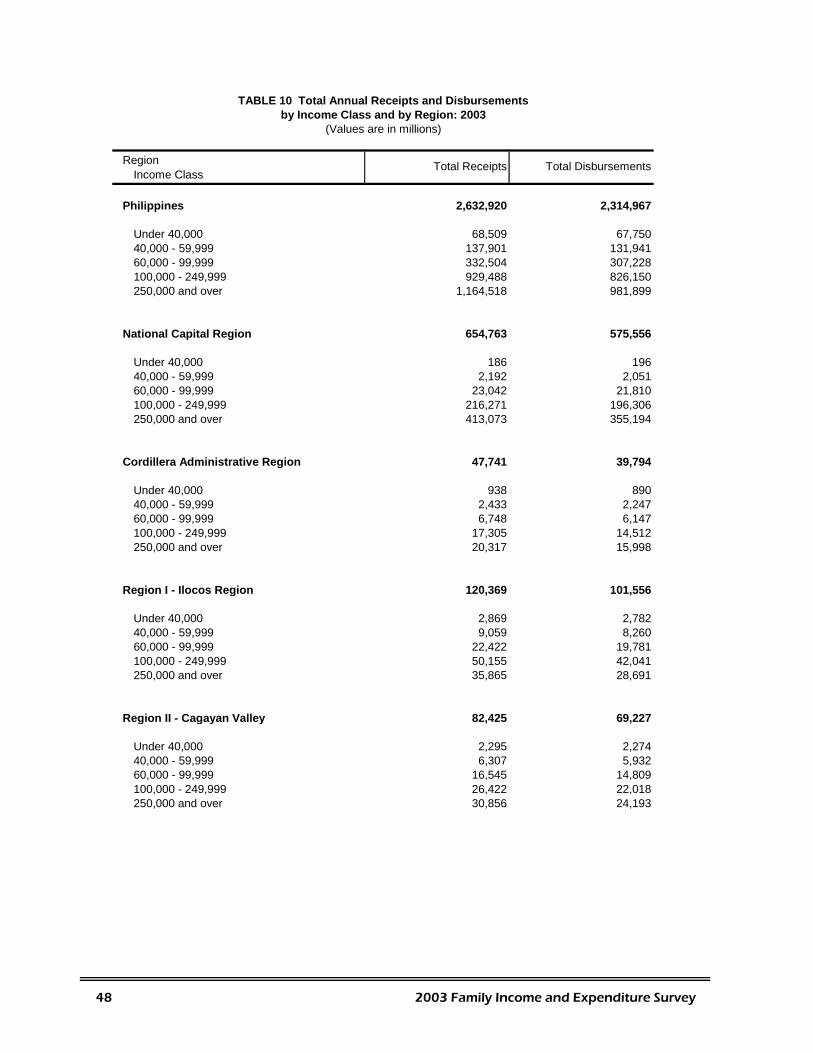
RegionIncome Class
Philippines 2,632,920 2,314,967
Under 40,000 68,509 67,75040,000 - 59,999 137,901 131,94160,000 - 99,999 332,504 307,228100,000 - 249,999 929,488 826,150250,000 and over 1,164,518 981,899
National Capital Region 654,763 575,556
Under 40,000 186 19640,000 - 59,999 2,192 2,05160,000 - 99,999 23,042 21,810100,000 - 249,999 216,271 196,306250,000 and over 413,073 355,194
Cordillera Administrative Region 47,741 39,794
Under 40,000 938 89040,000 - 59,999 2,433 2,24760,000 - 99,999 6,748 6,147100,000 - 249,999 17,305 14,512250,000 and over 20,317 15,998
Region I - Ilocos Region 120,369 101,556
Under 40,000 2,869 2,78240,000 - 59,999 9,059 8,26060,000 - 99,999 22,422 19,781100,000 - 249,999 50,155 42,041250,000 and over 35,865 28,691
Region II - Cagayan Valley 82,425 69,227
Under 40,000 2,295 2,27440,000 - 59,999 6,307 5,93260,000 - 99,999 16,545 14,809100,000 - 249,999 26,422 22,018250,000 and over 30,856 24,193
Total Receipts Total Disbursements
TABLE 10 Total Annual Receipts and Disbursements
(Values are in millions)by Income Class and by Region: 2003
48 2003 Family Income and Expenditure Survey

RegionIncome Class
Region III - Central Luzon 300,498 273,580
Under 40,000 2,028 2,04040,000 - 59,999 8,130 8,23560,000 - 99,999 37,394 35,792100,000 - 249,999 140,248 126,791250,000 and over 112,697 100,722
Region IVA - CALABARZON 437,689 391,478
Under 40,000 3,454 3,37640,000 - 59,999 8,626 8,58860,000 - 99,999 43,422 41,547100,000 - 249,999 170,168 156,708250,000 and over 212,019 181,260
Region IVB - MIMAROPA 57,864 49,326
Under 40,000 3,218 3,02040,000 - 59,999 6,342 5,75060,000 - 99,999 12,258 10,720100,000 - 249,999 18,996 16,019250,000 and over 17,050 13,817
Region V - Bicol 112,971 102,550
Under 40,000 6,278 6,43540,000 - 59,999 12,683 12,71160,000 - 99,999 20,474 19,316100,000 - 249,999 32,973 29,295250,000 and over 40,563 34,793
Region VI - Western Visayas 150,373 143,331
Under 40,000 6,529 6,60440,000 - 59,999 15,117 15,09460,000 - 99,999 30,585 29,819100,000 - 249,999 46,972 44,425250,000 and over 51,170 47,388
TABLE 10 Total Annual Receipts and Disbursements by Income Class and by Region: 2003 --- (continued)
(Values are in millions)
Total Receipts Total Disbursements
2003 Family Income and Expenditure Survey 49
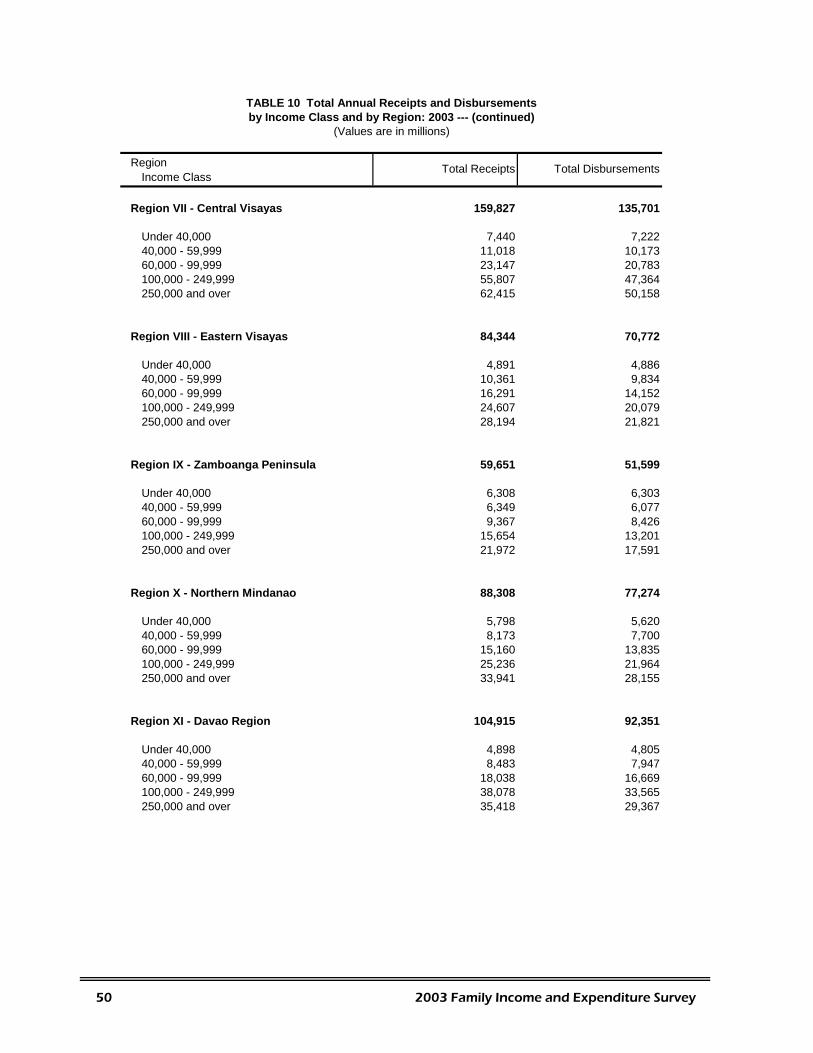
RegionIncome Class
Region VII - Central Visayas 159,827 135,701
Under 40,000 7,440 7,22240,000 - 59,999 11,018 10,17360,000 - 99,999 23,147 20,783100,000 - 249,999 55,807 47,364250,000 and over 62,415 50,158
Region VIII - Eastern Visayas 84,344 70,772
Under 40,000 4,891 4,88640,000 - 59,999 10,361 9,83460,000 - 99,999 16,291 14,152100,000 - 249,999 24,607 20,079250,000 and over 28,194 21,821
Region IX - Zamboanga Peninsula 59,651 51,599
Under 40,000 6,308 6,30340,000 - 59,999 6,349 6,07760,000 - 99,999 9,367 8,426100,000 - 249,999 15,654 13,201250,000 and over 21,972 17,591
Region X - Northern Mindanao 88,308 77,274
Under 40,000 5,798 5,62040,000 - 59,999 8,173 7,70060,000 - 99,999 15,160 13,835100,000 - 249,999 25,236 21,964250,000 and over 33,941 28,155
Region XI - Davao Region 104,915 92,351
Under 40,000 4,898 4,80540,000 - 59,999 8,483 7,94760,000 - 99,999 18,038 16,669100,000 - 249,999 38,078 33,565250,000 and over 35,418 29,367
TABLE 10 Total Annual Receipts and Disbursements by Income Class and by Region: 2003 --- (continued)
(Values are in millions)
Total Receipts Total Disbursements
50 2003 Family Income and Expenditure Survey
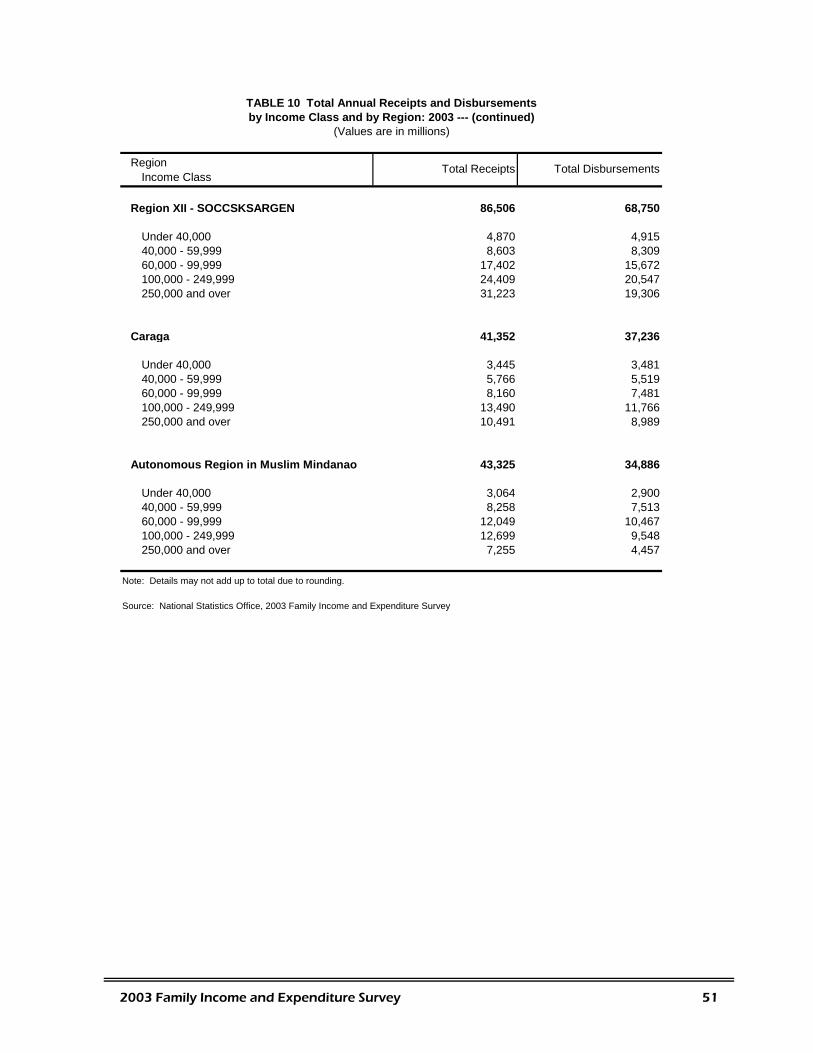
RegionIncome Class
Region XII - SOCCSKSARGEN 86,506 68,750
Under 40,000 4,870 4,91540,000 - 59,999 8,603 8,30960,000 - 99,999 17,402 15,672100,000 - 249,999 24,409 20,547250,000 and over 31,223 19,306
Caraga 41,352 37,236
Under 40,000 3,445 3,48140,000 - 59,999 5,766 5,51960,000 - 99,999 8,160 7,481100,000 - 249,999 13,490 11,766250,000 and over 10,491 8,989
Autonomous Region in Muslim Mindanao 43,325 34,886
Under 40,000 3,064 2,90040,000 - 59,999 8,258 7,51360,000 - 99,999 12,049 10,467100,000 - 249,999 12,699 9,548250,000 and over 7,255 4,457
Note: Details may not add up to total due to rounding.
Source: National Statistics Office, 2003 Family Income and Expenditure Survey
TABLE 10 Total Annual Receipts and Disbursements by Income Class and by Region: 2003 --- (continued)
(Values are in millions)
Total Receipts Total Disbursements
2003 Family Income and Expenditure Survey 51
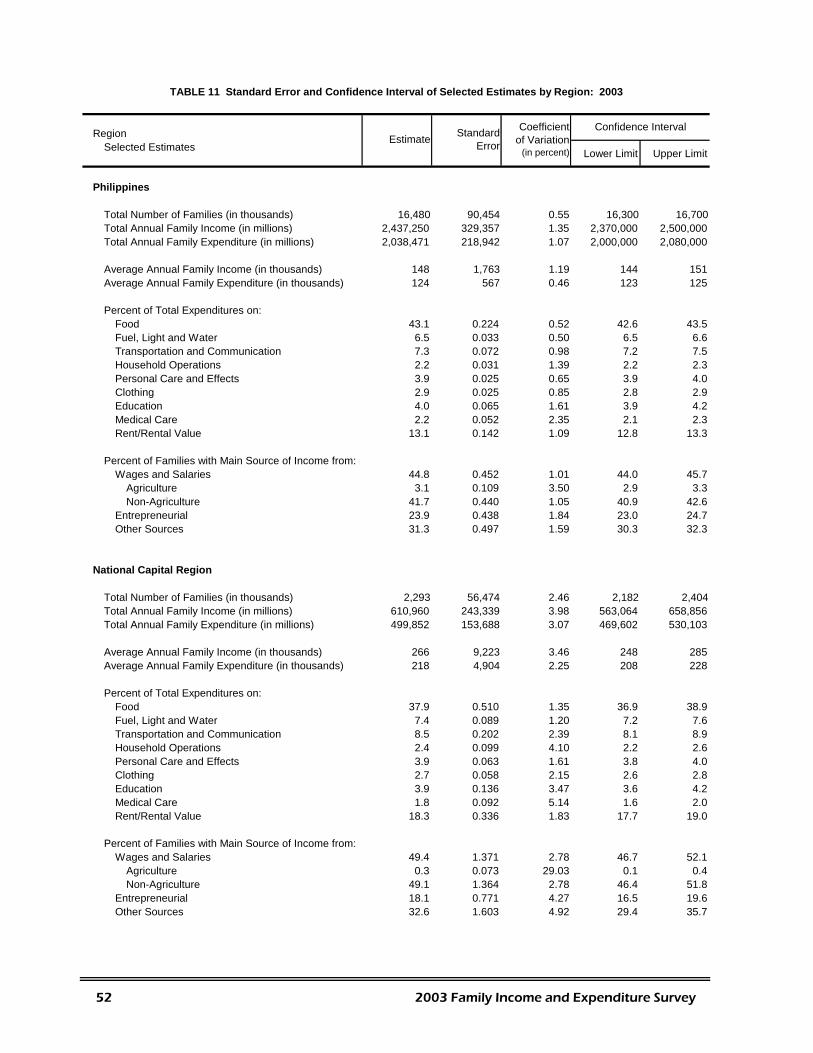
RegionSelected Estimates Lower Limit Upper Limit
Philippines
Total Number of Families (in thousands) 16,480 90,454 0.55 16,300 16,700Total Annual Family Income (in millions) 2,437,250 329,357 1.35 2,370,000 2,500,000Total Annual Family Expenditure (in millions) 2,038,471 218,942 1.07 2,000,000 2,080,000
Average Annual Family Income (in thousands) 148 1,763 1.19 144 151Average Annual Family Expenditure (in thousands) 124 567 0.46 123 125
Percent of Total Expenditures on:Food 43.1 0.224 0.52 42.6 43.5Fuel, Light and Water 6.5 0.033 0.50 6.5 6.6Transportation and Communication 7.3 0.072 0.98 7.2 7.5Household Operations 2.2 0.031 1.39 2.2 2.3Personal Care and Effects 3.9 0.025 0.65 3.9 4.0Clothing 2.9 0.025 0.85 2.8 2.9Education 4.0 0.065 1.61 3.9 4.2Medical Care 2.2 0.052 2.35 2.1 2.3Rent/Rental Value 13.1 0.142 1.09 12.8 13.3
Percent of Families with Main Source of Income from:Wages and Salaries 44.8 0.452 1.01 44.0 45.7
Agriculture 3.1 0.109 3.50 2.9 3.3Non-Agriculture 41.7 0.440 1.05 40.9 42.6
Entrepreneurial 23.9 0.438 1.84 23.0 24.7Other Sources 31.3 0.497 1.59 30.3 32.3
National Capital Region
Total Number of Families (in thousands) 2,293 56,474 2.46 2,182 2,404Total Annual Family Income (in millions) 610,960 243,339 3.98 563,064 658,856Total Annual Family Expenditure (in millions) 499,852 153,688 3.07 469,602 530,103
Average Annual Family Income (in thousands) 266 9,223 3.46 248 285Average Annual Family Expenditure (in thousands) 218 4,904 2.25 208 228
Percent of Total Expenditures on:Food 37.9 0.510 1.35 36.9 38.9Fuel, Light and Water 7.4 0.089 1.20 7.2 7.6Transportation and Communication 8.5 0.202 2.39 8.1 8.9Household Operations 2.4 0.099 4.10 2.2 2.6Personal Care and Effects 3.9 0.063 1.61 3.8 4.0Clothing 2.7 0.058 2.15 2.6 2.8Education 3.9 0.136 3.47 3.6 4.2Medical Care 1.8 0.092 5.14 1.6 2.0Rent/Rental Value 18.3 0.336 1.83 17.7 19.0
Percent of Families with Main Source of Income from:Wages and Salaries 49.4 1.371 2.78 46.7 52.1
Agriculture 0.3 0.073 29.03 0.1 0.4Non-Agriculture 49.1 1.364 2.78 46.4 51.8
Entrepreneurial 18.1 0.771 4.27 16.5 19.6Other Sources 32.6 1.603 4.92 29.4 35.7
TABLE 11 Standard Error and Confidence Interval of Selected Estimates by Region: 2003
Confidence IntervalStandard ErrorEstimate
Coefficient of Variation
(in percent)
52 2003 Family Income and Expenditure Survey
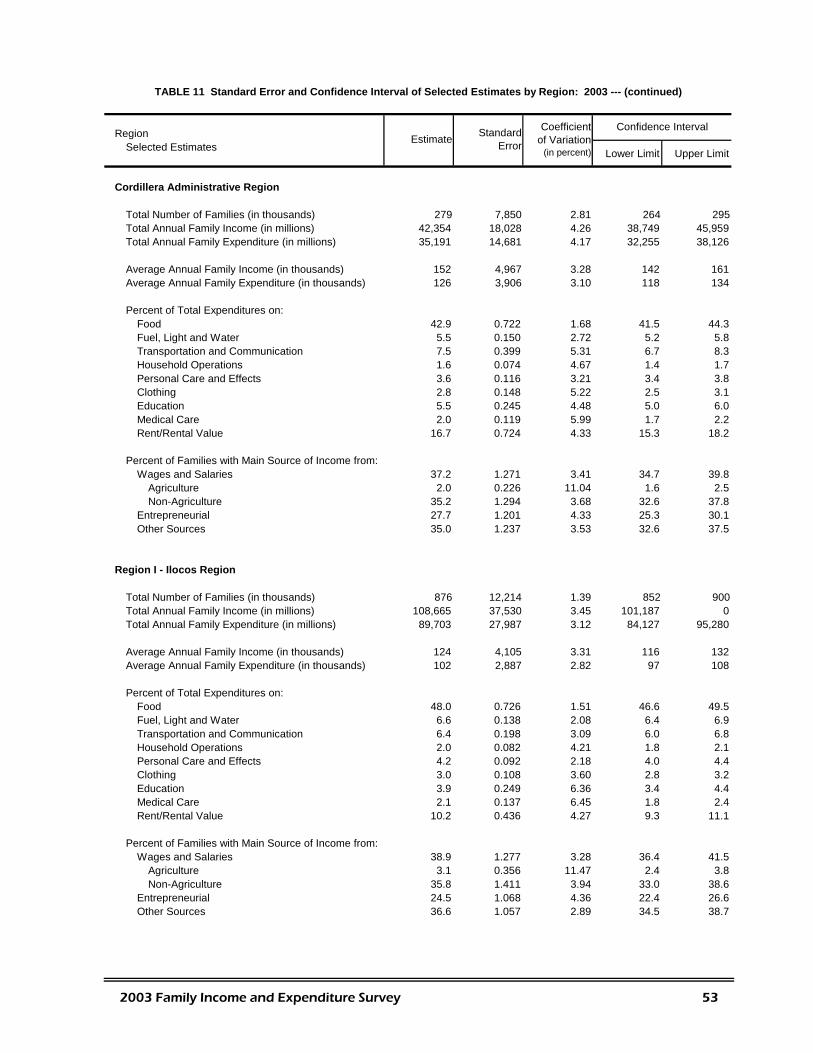
RegionSelected Estimates Lower Limit Upper Limit
Cordillera Administrative Region
Total Number of Families (in thousands) 279 7,850 2.81 264 295Total Annual Family Income (in millions) 42,354 18,028 4.26 38,749 45,959Total Annual Family Expenditure (in millions) 35,191 14,681 4.17 32,255 38,126
Average Annual Family Income (in thousands) 152 4,967 3.28 142 161Average Annual Family Expenditure (in thousands) 126 3,906 3.10 118 134
Percent of Total Expenditures on:Food 42.9 0.722 1.68 41.5 44.3Fuel, Light and Water 5.5 0.150 2.72 5.2 5.8Transportation and Communication 7.5 0.399 5.31 6.7 8.3Household Operations 1.6 0.074 4.67 1.4 1.7Personal Care and Effects 3.6 0.116 3.21 3.4 3.8Clothing 2.8 0.148 5.22 2.5 3.1Education 5.5 0.245 4.48 5.0 6.0Medical Care 2.0 0.119 5.99 1.7 2.2Rent/Rental Value 16.7 0.724 4.33 15.3 18.2
Percent of Families with Main Source of Income from:Wages and Salaries 37.2 1.271 3.41 34.7 39.8
Agriculture 2.0 0.226 11.04 1.6 2.5Non-Agriculture 35.2 1.294 3.68 32.6 37.8
Entrepreneurial 27.7 1.201 4.33 25.3 30.1Other Sources 35.0 1.237 3.53 32.6 37.5
Region I - Ilocos Region
Total Number of Families (in thousands) 876 12,214 1.39 852 900Total Annual Family Income (in millions) 108,665 37,530 3.45 101,187 0Total Annual Family Expenditure (in millions) 89,703 27,987 3.12 84,127 95,280
Average Annual Family Income (in thousands) 124 4,105 3.31 116 132Average Annual Family Expenditure (in thousands) 102 2,887 2.82 97 108
Percent of Total Expenditures on:Food 48.0 0.726 1.51 46.6 49.5Fuel, Light and Water 6.6 0.138 2.08 6.4 6.9Transportation and Communication 6.4 0.198 3.09 6.0 6.8Household Operations 2.0 0.082 4.21 1.8 2.1Personal Care and Effects 4.2 0.092 2.18 4.0 4.4Clothing 3.0 0.108 3.60 2.8 3.2Education 3.9 0.249 6.36 3.4 4.4Medical Care 2.1 0.137 6.45 1.8 2.4Rent/Rental Value 10.2 0.436 4.27 9.3 11.1
Percent of Families with Main Source of Income from:Wages and Salaries 38.9 1.277 3.28 36.4 41.5
Agriculture 3.1 0.356 11.47 2.4 3.8Non-Agriculture 35.8 1.411 3.94 33.0 38.6
Entrepreneurial 24.5 1.068 4.36 22.4 26.6Other Sources 36.6 1.057 2.89 34.5 38.7
TABLE 11 Standard Error and Confidence Interval of Selected Estimates by Region: 2003 --- (continued)
Estimate Standard Error
Confidence IntervalCoefficient of Variation
(in percent)
2003 Family Income and Expenditure Survey 53

RegionSelected Estimates Lower Limit Upper Limit
Region II - Cagayan Valley
Total Number of Families (in thousands) 587 7,518 1.28 572 602Total Annual Family Income (in millions) 74,263 39,455 5.31 66,385 82,140Total Annual Family Expenditure (in millions) 58,283 22,274 3.82 53,836 62,730
Average Annual Family Income (in thousands) 126 6,788 5.37 113 140Average Annual Family Expenditure (in thousands) 99 3,818 3.85 92 107
Percent of Total Expenditures on:Food 46.6 1.073 2.30 44.5 48.8Fuel, Light and Water 6.0 0.139 2.32 5.7 6.3Transportation and Communication 5.1 0.259 5.05 4.6 5.6Household Operations 2.0 0.089 4.42 1.8 2.2Personal Care and Effects 3.6 0.100 2.81 3.4 3.8Clothing 2.5 0.162 6.40 2.2 2.9Education 4.9 0.334 6.80 4.2 5.6Medical Care 2.8 0.469 17.05 1.8 3.7Rent/Rental Value 10.3 0.559 5.40 9.2 11.5
Percent of Families with Main Source of Income from:Wages and Salaries 34.9 1.301 3.73 32.3 37.5
Agriculture 6.1 0.501 8.21 5.1 7.1Non-Agriculture 28.7 1.249 4.34 26.3 31.2
Entrepreneurial 34.7 1.831 5.28 31.0 38.4Other Sources 30.4 1.290 4.24 27.9 33.0
Region III - Central Luzon
Total Number of Families (in thousands) 1,810 27,271 1.51 1,756 1,864Total Annual Family Income (in millions) 288,823 80,516 2.79 272,881 304,766Total Annual Family Expenditure (in millions) 249,448 70,869 2.84 235,415 263,481
Average Annual Family Income (in thousands) 160 3,797 2.38 152 167Average Annual Family Expenditure (in thousands) 138 3,295 2.39 131 144
Percent of Total Expenditures on:Food 45.2 0.607 1.34 44.0 46.4Fuel, Light and Water 6.9 0.088 1.28 6.7 7.1Transportation and Communication 7.8 0.202 2.58 7.4 8.2Household Operations 2.2 0.068 3.12 2.0 2.3Personal Care and Effects 4.5 0.078 1.75 4.3 4.6Clothing 3.0 0.071 2.33 2.9 3.2Education 4.1 0.189 4.64 3.7 4.4Medical Care 2.1 0.142 6.77 1.8 2.4Rent/Rental Value 11.9 0.288 2.42 11.3 12.5
Percent of Families with Main Source of Income from:Wages and Salaries 49.5 0.882 1.78 47.7 51.2
Agriculture 3.2 0.285 8.91 2.6 3.8Non-Agriculture 46.3 0.906 1.96 44.5 48.1
Entrepreneurial 19.3 0.680 3.53 17.9 20.6Other Sources 31.2 0.729 2.33 29.8 32.7
TABLE 11 Standard Error and Confidence Interval of Selected Estimates by Region: 2003 --- (continued)
Estimate Standard Error
Confidence IntervalCoefficient of Variation
(in percent)
54 2003 Family Income and Expenditure Survey
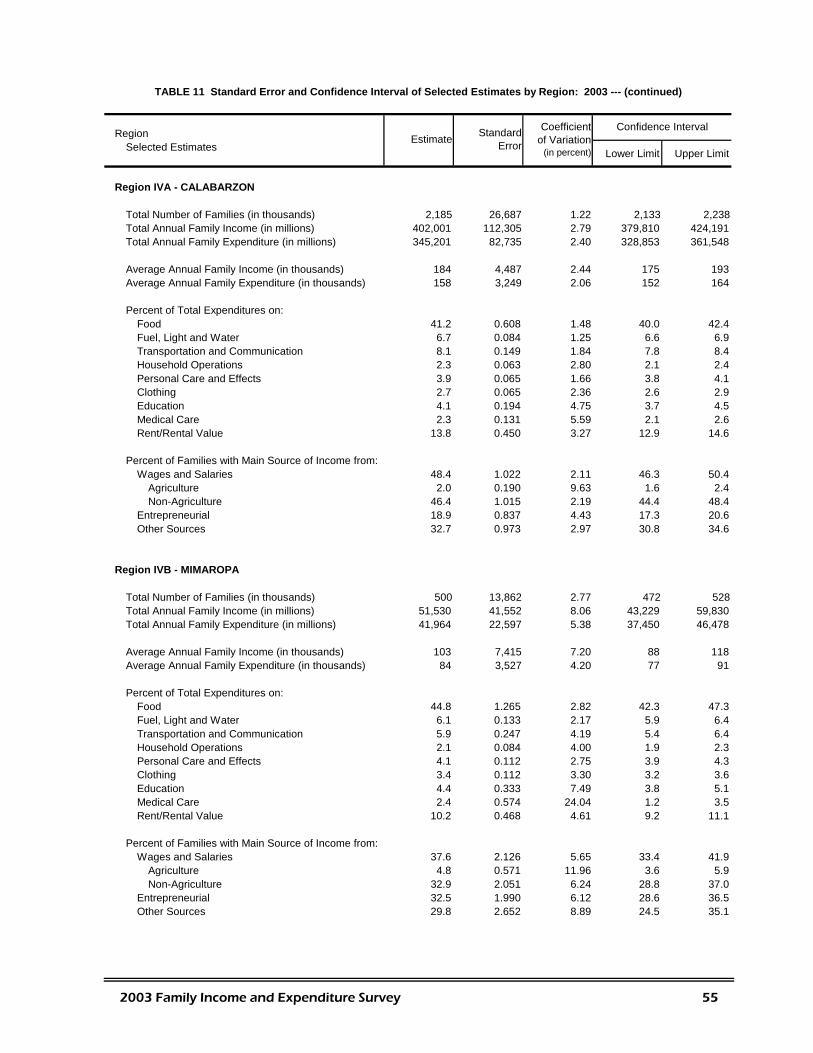
RegionSelected Estimates Lower Limit Upper Limit
Region IVA - CALABARZON
Total Number of Families (in thousands) 2,185 26,687 1.22 2,133 2,238Total Annual Family Income (in millions) 402,001 112,305 2.79 379,810 424,191Total Annual Family Expenditure (in millions) 345,201 82,735 2.40 328,853 361,548
Average Annual Family Income (in thousands) 184 4,487 2.44 175 193Average Annual Family Expenditure (in thousands) 158 3,249 2.06 152 164
Percent of Total Expenditures on:Food 41.2 0.608 1.48 40.0 42.4Fuel, Light and Water 6.7 0.084 1.25 6.6 6.9Transportation and Communication 8.1 0.149 1.84 7.8 8.4Household Operations 2.3 0.063 2.80 2.1 2.4Personal Care and Effects 3.9 0.065 1.66 3.8 4.1Clothing 2.7 0.065 2.36 2.6 2.9Education 4.1 0.194 4.75 3.7 4.5Medical Care 2.3 0.131 5.59 2.1 2.6Rent/Rental Value 13.8 0.450 3.27 12.9 14.6
Percent of Families with Main Source of Income from:Wages and Salaries 48.4 1.022 2.11 46.3 50.4
Agriculture 2.0 0.190 9.63 1.6 2.4Non-Agriculture 46.4 1.015 2.19 44.4 48.4
Entrepreneurial 18.9 0.837 4.43 17.3 20.6Other Sources 32.7 0.973 2.97 30.8 34.6
Region IVB - MIMAROPA
Total Number of Families (in thousands) 500 13,862 2.77 472 528Total Annual Family Income (in millions) 51,530 41,552 8.06 43,229 59,830Total Annual Family Expenditure (in millions) 41,964 22,597 5.38 37,450 46,478
Average Annual Family Income (in thousands) 103 7,415 7.20 88 118Average Annual Family Expenditure (in thousands) 84 3,527 4.20 77 91
Percent of Total Expenditures on:Food 44.8 1.265 2.82 42.3 47.3Fuel, Light and Water 6.1 0.133 2.17 5.9 6.4Transportation and Communication 5.9 0.247 4.19 5.4 6.4Household Operations 2.1 0.084 4.00 1.9 2.3Personal Care and Effects 4.1 0.112 2.75 3.9 4.3Clothing 3.4 0.112 3.30 3.2 3.6Education 4.4 0.333 7.49 3.8 5.1Medical Care 2.4 0.574 24.04 1.2 3.5Rent/Rental Value 10.2 0.468 4.61 9.2 11.1
Percent of Families with Main Source of Income from:Wages and Salaries 37.6 2.126 5.65 33.4 41.9
Agriculture 4.8 0.571 11.96 3.6 5.9Non-Agriculture 32.9 2.051 6.24 28.8 37.0
Entrepreneurial 32.5 1.990 6.12 28.6 36.5Other Sources 29.8 2.652 8.89 24.5 35.1
TABLE 11 Standard Error and Confidence Interval of Selected Estimates by Region: 2003 --- (continued)
Estimate Standard Error
Confidence IntervalCoefficient of Variation
(in percent)
2003 Family Income and Expenditure Survey 55
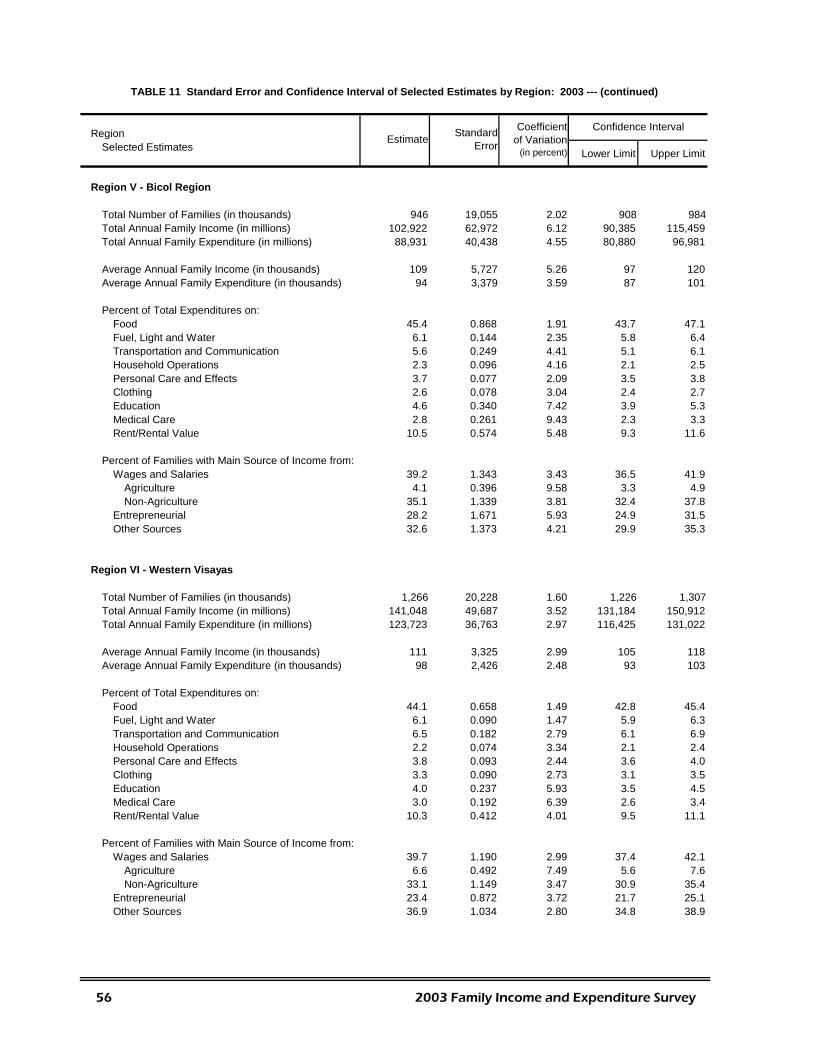
RegionSelected Estimates Lower Limit Upper Limit
Region V - Bicol Region
Total Number of Families (in thousands) 946 19,055 2.02 908 984Total Annual Family Income (in millions) 102,922 62,972 6.12 90,385 115,459Total Annual Family Expenditure (in millions) 88,931 40,438 4.55 80,880 96,981
Average Annual Family Income (in thousands) 109 5,727 5.26 97 120Average Annual Family Expenditure (in thousands) 94 3,379 3.59 87 101
Percent of Total Expenditures on:Food 45.4 0.868 1.91 43.7 47.1Fuel, Light and Water 6.1 0.144 2.35 5.8 6.4Transportation and Communication 5.6 0.249 4.41 5.1 6.1Household Operations 2.3 0.096 4.16 2.1 2.5Personal Care and Effects 3.7 0.077 2.09 3.5 3.8Clothing 2.6 0.078 3.04 2.4 2.7Education 4.6 0.340 7.42 3.9 5.3Medical Care 2.8 0.261 9.43 2.3 3.3Rent/Rental Value 10.5 0.574 5.48 9.3 11.6
Percent of Families with Main Source of Income from:Wages and Salaries 39.2 1.343 3.43 36.5 41.9
Agriculture 4.1 0.396 9.58 3.3 4.9Non-Agriculture 35.1 1.339 3.81 32.4 37.8
Entrepreneurial 28.2 1.671 5.93 24.9 31.5Other Sources 32.6 1.373 4.21 29.9 35.3
Region VI - Western Visayas
Total Number of Families (in thousands) 1,266 20,228 1.60 1,226 1,307Total Annual Family Income (in millions) 141,048 49,687 3.52 131,184 150,912Total Annual Family Expenditure (in millions) 123,723 36,763 2.97 116,425 131,022
Average Annual Family Income (in thousands) 111 3,325 2.99 105 118Average Annual Family Expenditure (in thousands) 98 2,426 2.48 93 103
Percent of Total Expenditures on:Food 44.1 0.658 1.49 42.8 45.4Fuel, Light and Water 6.1 0.090 1.47 5.9 6.3Transportation and Communication 6.5 0.182 2.79 6.1 6.9Household Operations 2.2 0.074 3.34 2.1 2.4Personal Care and Effects 3.8 0.093 2.44 3.6 4.0Clothing 3.3 0.090 2.73 3.1 3.5Education 4.0 0.237 5.93 3.5 4.5Medical Care 3.0 0.192 6.39 2.6 3.4Rent/Rental Value 10.3 0.412 4.01 9.5 11.1
Percent of Families with Main Source of Income from:Wages and Salaries 39.7 1.190 2.99 37.4 42.1
Agriculture 6.6 0.492 7.49 5.6 7.6Non-Agriculture 33.1 1.149 3.47 30.9 35.4
Entrepreneurial 23.4 0.872 3.72 21.7 25.1Other Sources 36.9 1.034 2.80 34.8 38.9
TABLE 11 Standard Error and Confidence Interval of Selected Estimates by Region: 2003 --- (continued)
Estimate Standard Error
Confidence IntervalCoefficient of Variation
(in percent)
56 2003 Family Income and Expenditure Survey
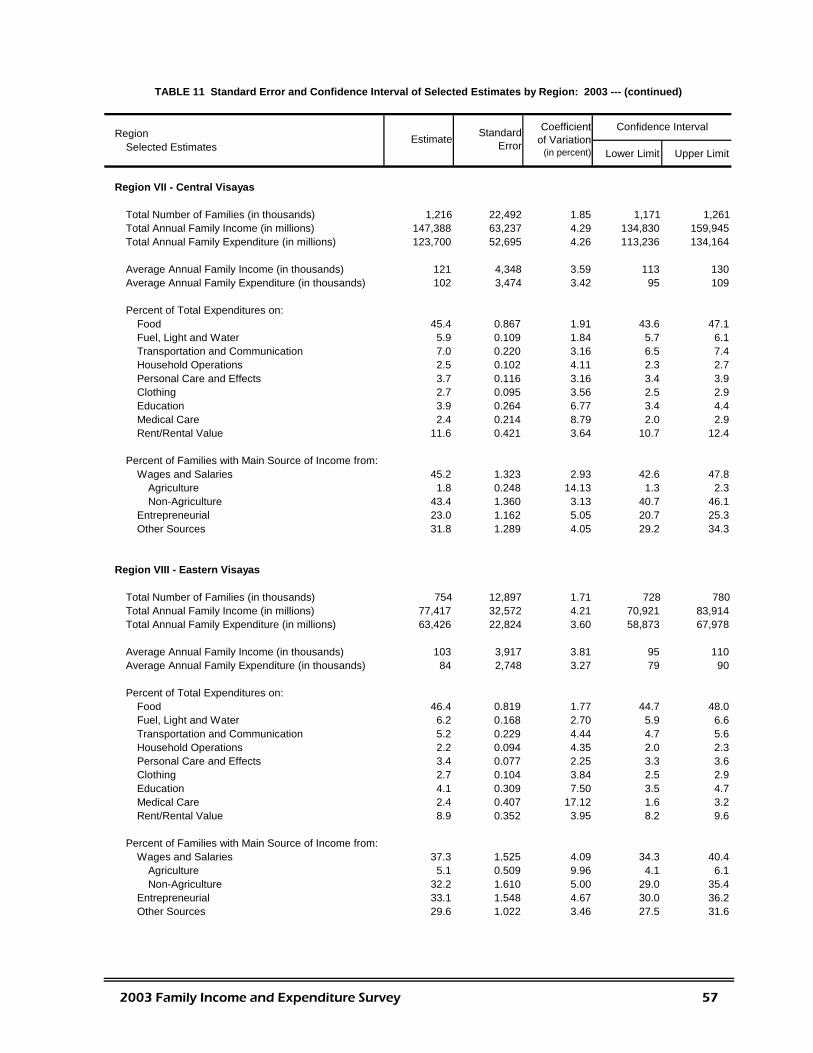
RegionSelected Estimates Lower Limit Upper Limit
Region VII - Central Visayas
Total Number of Families (in thousands) 1,216 22,492 1.85 1,171 1,261Total Annual Family Income (in millions) 147,388 63,237 4.29 134,830 159,945Total Annual Family Expenditure (in millions) 123,700 52,695 4.26 113,236 134,164
Average Annual Family Income (in thousands) 121 4,348 3.59 113 130Average Annual Family Expenditure (in thousands) 102 3,474 3.42 95 109
Percent of Total Expenditures on:Food 45.4 0.867 1.91 43.6 47.1Fuel, Light and Water 5.9 0.109 1.84 5.7 6.1Transportation and Communication 7.0 0.220 3.16 6.5 7.4Household Operations 2.5 0.102 4.11 2.3 2.7Personal Care and Effects 3.7 0.116 3.16 3.4 3.9Clothing 2.7 0.095 3.56 2.5 2.9Education 3.9 0.264 6.77 3.4 4.4Medical Care 2.4 0.214 8.79 2.0 2.9Rent/Rental Value 11.6 0.421 3.64 10.7 12.4
Percent of Families with Main Source of Income from:Wages and Salaries 45.2 1.323 2.93 42.6 47.8
Agriculture 1.8 0.248 14.13 1.3 2.3Non-Agriculture 43.4 1.360 3.13 40.7 46.1
Entrepreneurial 23.0 1.162 5.05 20.7 25.3Other Sources 31.8 1.289 4.05 29.2 34.3
Region VIII - Eastern Visayas
Total Number of Families (in thousands) 754 12,897 1.71 728 780Total Annual Family Income (in millions) 77,417 32,572 4.21 70,921 83,914Total Annual Family Expenditure (in millions) 63,426 22,824 3.60 58,873 67,978
Average Annual Family Income (in thousands) 103 3,917 3.81 95 110Average Annual Family Expenditure (in thousands) 84 2,748 3.27 79 90
Percent of Total Expenditures on:Food 46.4 0.819 1.77 44.7 48.0Fuel, Light and Water 6.2 0.168 2.70 5.9 6.6Transportation and Communication 5.2 0.229 4.44 4.7 5.6Household Operations 2.2 0.094 4.35 2.0 2.3Personal Care and Effects 3.4 0.077 2.25 3.3 3.6Clothing 2.7 0.104 3.84 2.5 2.9Education 4.1 0.309 7.50 3.5 4.7Medical Care 2.4 0.407 17.12 1.6 3.2Rent/Rental Value 8.9 0.352 3.95 8.2 9.6
Percent of Families with Main Source of Income from:Wages and Salaries 37.3 1.525 4.09 34.3 40.4
Agriculture 5.1 0.509 9.96 4.1 6.1Non-Agriculture 32.2 1.610 5.00 29.0 35.4
Entrepreneurial 33.1 1.548 4.67 30.0 36.2Other Sources 29.6 1.022 3.46 27.5 31.6
TABLE 11 Standard Error and Confidence Interval of Selected Estimates by Region: 2003 --- (continued)
Estimate Standard Error
Confidence IntervalCoefficient of Variation
(in percent)
2003 Family Income and Expenditure Survey 57

RegionSelected Estimates Lower Limit Upper Limit
Region IX - Zamboanga Peninsula
Total Number of Families (in thousands) 587 11,801 2.01 563 610Total Annual Family Income (in millions) 54,772 27,336 4.99 49,321 60,222Total Annual Family Expenditure (in millions) 44,239 20,048 4.53 40,241 48,236
Average Annual Family Income (in thousands) 93 4,632 4.96 84 103Average Annual Family Expenditure (in thousands) 75 3,338 4.43 69 82
Percent of Total Expenditures on:Food 46.5 1.265 2.72 44.0 49.1Fuel, Light and Water 5.8 0.178 3.08 5.4 6.1Transportation and Communication 6.4 0.330 5.16 5.7 7.1Household Operations 2.0 0.106 5.26 1.8 2.2Personal Care and Effects 3.8 0.100 2.66 3.6 4.0Clothing 2.8 0.124 4.46 2.5 3.0Education 3.7 0.553 14.74 2.6 4.9Medical Care 2.3 0.385 16.68 1.5 3.1Rent/Rental Value 9.6 0.589 6.11 8.5 10.8
Percent of Families with Main Source of Income from:Wages and Salaries 42.4 2.039 4.81 38.4 46.5
Agriculture 3.6 0.445 12.54 2.7 4.4Non-Agriculture 38.9 2.156 5.55 34.6 43.2
Entrepreneurial 32.8 2.205 6.72 28.4 37.2Other Sources 24.8 1.568 6.33 21.6 27.9
Region X - Northern Mindanao
Total Number of Families (in thousands) 739 18,696 2.53 702 776Total Annual Family Income (in millions) 80,397 39,801 4.95 72,470 88,324Total Annual Family Expenditure (in millions) 67,176 33,853 5.04 60,434 73,918
Average Annual Family Income (in thousands) 109 4,409 4.05 100 118Average Annual Family Expenditure (in thousands) 91 3,596 3.96 84 98
Percent of Total Expenditures on:Food 44.0 0.979 2.22 42.1 46.0Fuel, Light and Water 5.6 0.107 1.91 5.4 5.8Transportation and Communication 6.8 0.204 3.02 6.4 7.2Household Operations 2.4 0.122 5.05 2.2 2.7Personal Care and Effects 3.8 0.133 3.47 3.6 4.1Clothing 2.9 0.124 4.32 2.6 3.1Education 4.0 0.267 6.60 3.5 4.6Medical Care 2.6 0.486 18.69 1.6 3.6Rent/Rental Value 10.1 0.319 3.15 9.5 10.7
Percent of Families with Main Source of Income from:Wages and Salaries 46.1 1.546 3.35 43.1 49.2
Agriculture 5.2 0.618 11.95 3.9 6.4Non-Agriculture 41.0 1.655 4.04 37.7 44.3
Entrepreneurial 26.9 1.542 5.74 23.8 29.9Other Sources 27.0 1.217 4.51 24.6 29.4
TABLE 11 Standard Error and Confidence Interval of Selected Estimates by Region: 2003 --- (continued)
Estimate Standard Error
Confidence IntervalCoefficient of Variation
(in percent)
58 2003 Family Income and Expenditure Survey
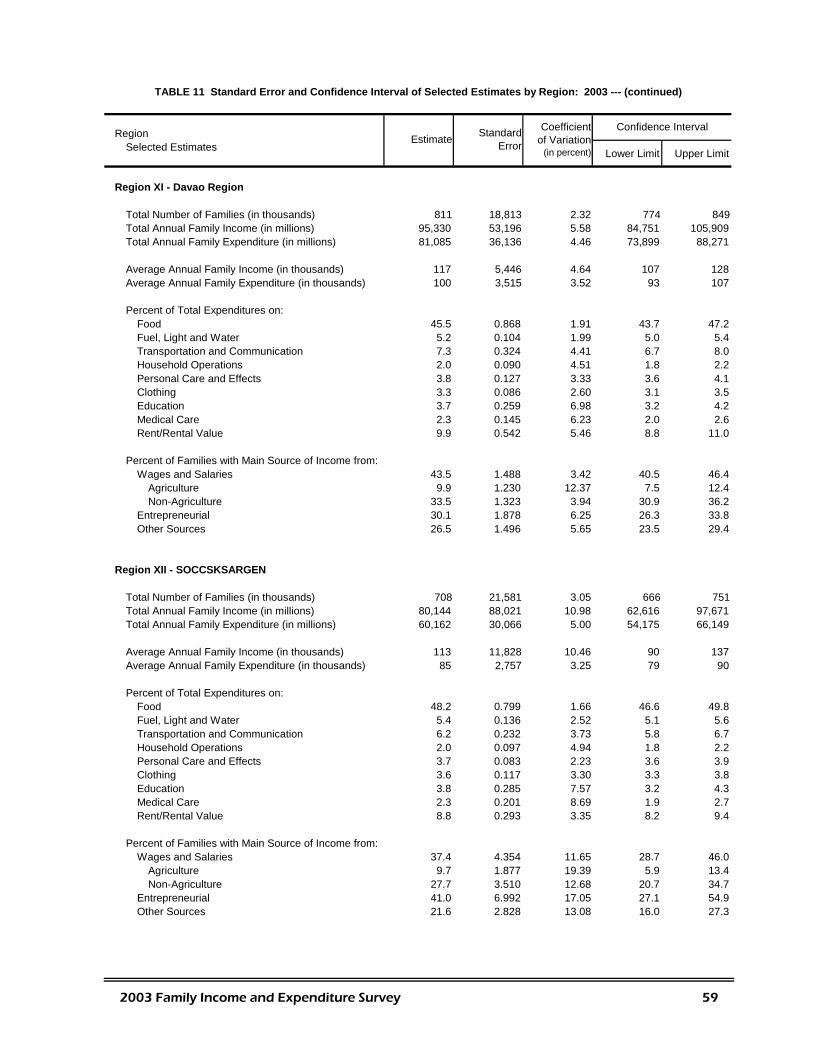
RegionSelected Estimates Lower Limit Upper Limit
Region XI - Davao Region
Total Number of Families (in thousands) 811 18,813 2.32 774 849Total Annual Family Income (in millions) 95,330 53,196 5.58 84,751 105,909Total Annual Family Expenditure (in millions) 81,085 36,136 4.46 73,899 88,271
Average Annual Family Income (in thousands) 117 5,446 4.64 107 128Average Annual Family Expenditure (in thousands) 100 3,515 3.52 93 107
Percent of Total Expenditures on:Food 45.5 0.868 1.91 43.7 47.2Fuel, Light and Water 5.2 0.104 1.99 5.0 5.4Transportation and Communication 7.3 0.324 4.41 6.7 8.0Household Operations 2.0 0.090 4.51 1.8 2.2Personal Care and Effects 3.8 0.127 3.33 3.6 4.1Clothing 3.3 0.086 2.60 3.1 3.5Education 3.7 0.259 6.98 3.2 4.2Medical Care 2.3 0.145 6.23 2.0 2.6Rent/Rental Value 9.9 0.542 5.46 8.8 11.0
Percent of Families with Main Source of Income from:Wages and Salaries 43.5 1.488 3.42 40.5 46.4
Agriculture 9.9 1.230 12.37 7.5 12.4Non-Agriculture 33.5 1.323 3.94 30.9 36.2
Entrepreneurial 30.1 1.878 6.25 26.3 33.8Other Sources 26.5 1.496 5.65 23.5 29.4
Region XII - SOCCSKSARGEN
Total Number of Families (in thousands) 708 21,581 3.05 666 751Total Annual Family Income (in millions) 80,144 88,021 10.98 62,616 97,671Total Annual Family Expenditure (in millions) 60,162 30,066 5.00 54,175 66,149
Average Annual Family Income (in thousands) 113 11,828 10.46 90 137Average Annual Family Expenditure (in thousands) 85 2,757 3.25 79 90
Percent of Total Expenditures on:Food 48.2 0.799 1.66 46.6 49.8Fuel, Light and Water 5.4 0.136 2.52 5.1 5.6Transportation and Communication 6.2 0.232 3.73 5.8 6.7Household Operations 2.0 0.097 4.94 1.8 2.2Personal Care and Effects 3.7 0.083 2.23 3.6 3.9Clothing 3.6 0.117 3.30 3.3 3.8Education 3.8 0.285 7.57 3.2 4.3Medical Care 2.3 0.201 8.69 1.9 2.7Rent/Rental Value 8.8 0.293 3.35 8.2 9.4
Percent of Families with Main Source of Income from:Wages and Salaries 37.4 4.354 11.65 28.7 46.0
Agriculture 9.7 1.877 19.39 5.9 13.4Non-Agriculture 27.7 3.510 12.68 20.7 34.7
Entrepreneurial 41.0 6.992 17.05 27.1 54.9Other Sources 21.6 2.828 13.08 16.0 27.3
TABLE 11 Standard Error and Confidence Interval of Selected Estimates by Region: 2003 --- (continued)
Estimate Standard Error
Confidence IntervalCoefficient of Variation
(in percent)
2003 Family Income and Expenditure Survey 59
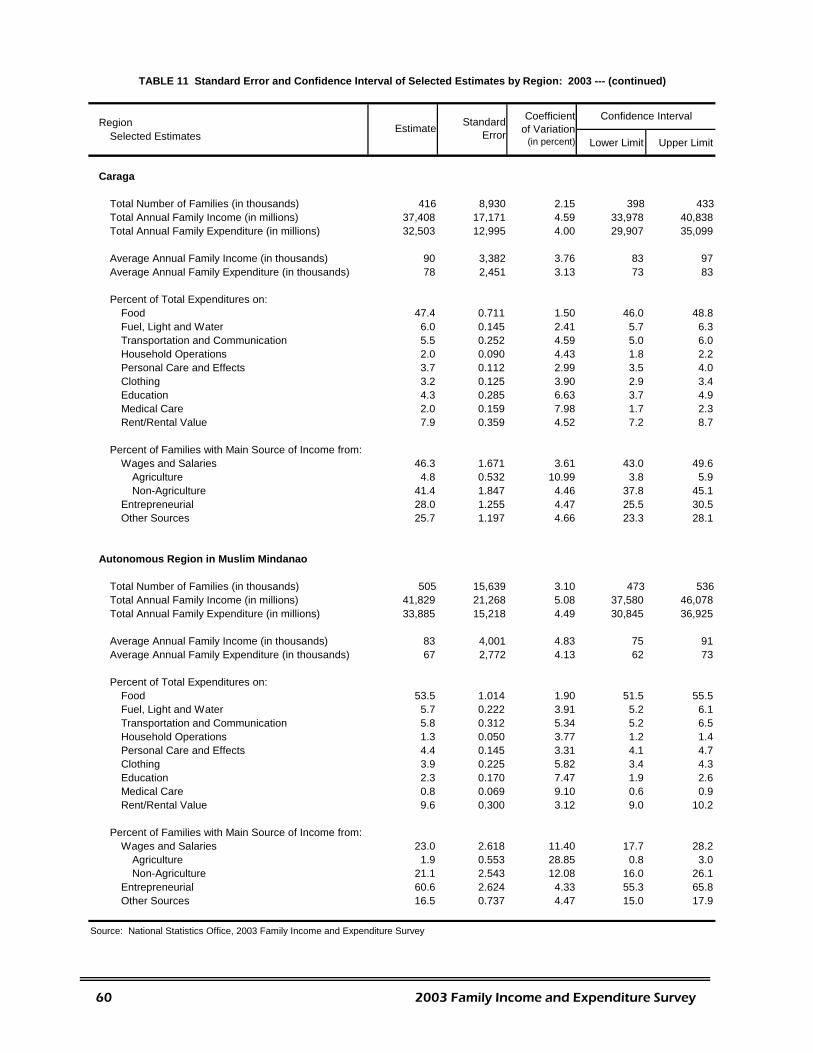
Region
Selected Estimates Lower Limit Upper Limit
Caraga
Total Number of Families (in thousands) 416 8,930 2.15 398 433Total Annual Family Income (in millions) 37,408 17,171 4.59 33,978 40,838Total Annual Family Expenditure (in millions) 32,503 12,995 4.00 29,907 35,099
Average Annual Family Income (in thousands) 90 3,382 3.76 83 97Average Annual Family Expenditure (in thousands) 78 2,451 3.13 73 83
Percent of Total Expenditures on:Food 47.4 0.711 1.50 46.0 48.8Fuel, Light and Water 6.0 0.145 2.41 5.7 6.3Transportation and Communication 5.5 0.252 4.59 5.0 6.0Household Operations 2.0 0.090 4.43 1.8 2.2Personal Care and Effects 3.7 0.112 2.99 3.5 4.0Clothing 3.2 0.125 3.90 2.9 3.4Education 4.3 0.285 6.63 3.7 4.9Medical Care 2.0 0.159 7.98 1.7 2.3Rent/Rental Value 7.9 0.359 4.52 7.2 8.7
Percent of Families with Main Source of Income from:Wages and Salaries 46.3 1.671 3.61 43.0 49.6
Agriculture 4.8 0.532 10.99 3.8 5.9Non-Agriculture 41.4 1.847 4.46 37.8 45.1
Entrepreneurial 28.0 1.255 4.47 25.5 30.5Other Sources 25.7 1.197 4.66 23.3 28.1
Autonomous Region in Muslim Mindanao
Total Number of Families (in thousands) 505 15,639 3.10 473 536Total Annual Family Income (in millions) 41,829 21,268 5.08 37,580 46,078Total Annual Family Expenditure (in millions) 33,885 15,218 4.49 30,845 36,925
Average Annual Family Income (in thousands) 83 4,001 4.83 75 91Average Annual Family Expenditure (in thousands) 67 2,772 4.13 62 73
Percent of Total Expenditures on:Food 53.5 1.014 1.90 51.5 55.5Fuel, Light and Water 5.7 0.222 3.91 5.2 6.1Transportation and Communication 5.8 0.312 5.34 5.2 6.5Household Operations 1.3 0.050 3.77 1.2 1.4Personal Care and Effects 4.4 0.145 3.31 4.1 4.7Clothing 3.9 0.225 5.82 3.4 4.3Education 2.3 0.170 7.47 1.9 2.6Medical Care 0.8 0.069 9.10 0.6 0.9Rent/Rental Value 9.6 0.300 3.12 9.0 10.2
Percent of Families with Main Source of Income from:Wages and Salaries 23.0 2.618 11.40 17.7 28.2
Agriculture 1.9 0.553 28.85 0.8 3.0Non-Agriculture 21.1 2.543 12.08 16.0 26.1
Entrepreneurial 60.6 2.624 4.33 55.3 65.8Other Sources 16.5 0.737 4.47 15.0 17.9
Source: National Statistics Office, 2003 Family Income and Expenditure Survey
Estimate Standard Error
Confidence IntervalCoefficient of Variation
(in percent)
TABLE 11 Standard Error and Confidence Interval of Selected Estimates by Region: 2003 --- (continued)
60 2003 Family Income and Expenditure Survey
APPENDICES
A. DEFINITIONS AND EXPLANATIONS Respondent The respondent interviewed in this survey is the household head or person who manages the finances of the family or any member of the family who can give reliable information or answers to the questionnaire. Family A family is defined as a group of persons usually living together and composed of the head and other persons related to the head by blood, marriage or adoption. For purposes of this survey, the "extended" family concept is followed. A single person living alone is considered as a separate family. The following are the different types of household used in the survey:
1. Single family – refers to the household composed of a single nuclear family. A nuclear family is composed of a father and mother with unmarried children or a parent with children. For purpose of the survey, a single person household is considered as a single family. Also considered are unmarried sisters and brothers who are living together as one household. The presence of a boarder and domestic helper will not change the household type.
2. Extended family – refers to the household composed of a nuclear family as defined
above together with relatives like son-in-law, daughter-in-law, grandson, granddaughter, father, mother and other relatives.
3. Two or more non-related members – refers to a household with two or more non-
related families or two or more persons not related to each other by blood, marriage or adoption.
Family Size This refers to the total number of family members enumerated. Included as family members are those whose relationship to the household head is spouse, son, daughter, father, mother, son-in-law, daughter-in-law, sister, brother, granddaughter and grandson or other relative. Family Income Total family income includes primary income and receipts from other sources received by all family members during the calendar year 1997 as participants in any economic activity or as recipients of transfers, pensions, grants, etc.
2003 Family Income and Expenditure Survey 61
Primary income includes salaries and wages, commissions, tips, bonuses, family and clothing allowance, transportation and representation allowances, honoraria, and other forms of compensation and net receipts derived from the operation of family-operated enterprises/activities and the practice of a profession or trade. Income from other sources include imputed rental values of owner-occupied dwelling units, interests, rentals including landowner's share of agricultural products, pensions, support and the value of food and non-food items received as gifts by the family (as well as the imputed value of services rendered free of charge to the family). Also included as part of family income are receipts from family sustenance activities which are not considered as family-operated enterprise. Following the International Labor Organization concept of income, the 1997 FIES excludes profits from sale of stocks and bonds, backpay and proceeds from insurance, net winnings from gambling, sweepstakes and lotteries and inheritance as part of family income. However, these are included as part of other receipts. Income Decile Two levels of income deciles were utilized in this survey – national and regional. The national income decile is obtained by ranking the weighted total family income of all sample families in the country from lowest to highest. Then these are compiled into ten groups. The first tenth, meaning those with the lowest income, is called the first decile; the second tenth, second decile and so on. A similar procedure is implemented for the regional decile, except that what is arrayed is the weighted total family income of sample families in a given region. Main Source of Income This refers to the source from which most of the income of the family is obtained. If the family has more than one source of income, the main source that would be considered is the source where the bulk of income is derived. Salaries and Wages from Employment It includes all forms of compensation whether in cash or in kind received by family members who are regular or occasional/seasonal workers in agricultural and non- agricultural industries. Imputed Rent of Owner-Occupied Dwelling Unit Imputed rent is the estimated amount that the owner of a dwelling unit would charge if he/she were to rent his/her entire dwelling unit monthly, unfurnished and excluding the costs for utilities. The rental value is based on the prevailing rate in the locality.
62 2003 Family Income and Expenditure Survey
Imputed rent differs from amortization payments. Imputed rent refers to the value of the house/lot based on its utility while amortization payments refer to the periodic payments made by the family on real property they acquired on installment basis. Imputed rent of free housing enjoyed by employees is also included. Net Share of Crops, Fruits and Vegetables Produced or Livestock and Poultry Raised by Other Households This refers to the family's share of harvested crops, fruits, vegetables, etc., from the tenant or from a fixed rent or any amount out of the produce during the reference period. It also includes the share of the family from the proceeds of the sale of pig, cow, etc. which the family owned but raised by others and disposed of during the reference period although there was no landlord-tenant relationship between the sample family and the one who raised it. Received as Gifts Received as gifts include all food and non-food items received in kind by the family during the reference period. For food items, alcoholic beverages and tobacco received in kind by the family, only those consumed by the family during the reference period are included. Foodstuffs received in the form of support, assistance or relief is likewise considered as gifts. However, food items, alcoholic beverages and tobacco consumed by a family member at parties attended, or food items offered to him by friends are not included. Food and non-food items received as gifts include those received from other households, charitable institutions, the government or from persons abroad, free of charge. Entrepreneurial Activity An entrepreneurial activity or a family-operated activity is any economic activity, business or enterprise whether in agriculture or in non-agricultural enterprises, engaged in by any member of the family as an operator or as self-employed. Included as family-operated activities are those which are operated as single proprietorship or loose partnership, without formal organization. Thus partnerships, corporations, associations, etc. which are formally organized are excluded. Family Sustenance Activity A family sustenance activity is also a family activity but unlike an entrepreneurial activity, the produce from the former is mainly for home consumption. Occasionally, sales are made when the harvest/produce is more than enough for family consumption.
2003 Family Income and Expenditure Survey 63
Family Expenditures Family expenditures refer to the expenses or disbursements made by the family purely for personal consumption during the calendar year 1997. They exclude all expenses in relation to farm or business operations, investment ventures, purchase of real property and other disbursements which do not involve personal consumption. Gifts, support, assistance or relief in goods and services received by the family from friends, relatives, etc., are also included as part of family expenditures. Value consumed from net share of crops, fruits and vegetables produced or livestock raised by other households, family sustenance and entrepreneurial activities are also considered as family expenditures. Food Consumed at Home The items included in this portion cover the actual consumption (not expenditure) of the family during the past week. This category includes the food prepared at home and eaten in place of work, school, etc., and those home-cooked foods bought outside the home but eaten at home. Food consumption covers only the actual consumption of the family, as well as domestic helpers and other persons employed by the family to do odd jobs around the house, and family guests (relatives or non-relatives who are not members of the household but had stayed with or visited the family for less than a week within the past week). The consumption of boarders and other persons in the same household not related to the family is excluded from this category. Food Regularly Consumed Outside the Home This includes food regularly bought and eaten by the family members outside the home like snacks, merienda, lunch, etc. The daily allowance of school children for their sandwiches, soft drinks, etc. at school is also covered in this category. Fuel, Light and Water This refers to the total family consumption of fuel, light and water consumed during the reference period. For a family who shares facilities with other households or whose total consumption includes both personal and business expenses, only an estimate of the family's personal consumption is reported. Non-Durable Furnishings This includes the value of all non-durable furnishings such as utensils and accessories (dinnerware, silverware, kitchen utensils, etc.) for family use acquired within the reference period including those bought/received by the family for use during special occasions.
64 2003 Family Income and Expenditure Survey
If the non-durables are made at home for family use, the total value of the materials and the cost of labor paid are reported as the value of the finished products. However, the value of labor rendered by a household member free of charge is not included. Durable Furniture and Equipment This includes all durable furnishings or equipment such as pieces of furniture, garden tools, appliances, cars, etc. acquired on a cash basis during the reference period and intended for family use during ordinary days or during special occasions. Those durable furniture and equipment purchased on installment basis during the reference period are also included. The reported total value is the total installments paid plus initial down payment made on the item during the reference period. Durable furniture made at home for family use are also reported in this part, hence, the value included is the value of the materials used and the cost of labor paid. Value of labor rendered by any member of the household free of charge is not included. Taxes The following forms of taxes were included in the survey:
1. Income Tax – refers to the tax levied on the income of a working person in pursuit of his occupation.
2. Real Estate Tax – refers to the tax imposed on real property of the family (e.g.
house and lot for family use) in proportion to its value. This includes real estate tax levied on real property of the family used for personal purposes. Therefore, taxes levied on private properties of the family used solely for business purposes are excluded.
3. Car Registration, Toll Fees and Driver's License – this includes registration fees
for motor vehicles used for private transport of the family, toll fees, etc. 4. Other Direct Taxes – direct taxes refer to taxes which are demanded from a
taxpayer, who shoulders the burden of the tax; or tax which the taxpayer cannot shift to another. Specific examples are inheritance tax, alien certificate of registration (ACR), donor's tax, etc. Other taxes paid by the family such as custom's duties paid for personal effects bought from abroad, amusement tax and taxes paid as a consumer are also included.
Other Receipts These are non-income receipts comprising of value at cost of real and personal property sold, loans from other households, business firms and government institutions, payments for loans granted to others and withdrawals from savings or business equity. Profits from sale
2003 Family Income and Expenditure Survey 65
of stocks and bonds, back pay and proceeds from insurance, net winnings from gambling, sweepstakes and lotteries and inheritance are also included as other receipts. Other Disbursements Other disbursements refer to non-family expenditures, which may give an indication of savings on the part of the family. These include purchase or amortization of real property, payments of cash loan (principal), installments of appliances bought before 1997, installments for personal transport bought before 1997, loans granted to persons outside the household, amount deposited in banks or investments and major repair or construction of a house. Medians and Averages; Rounding of Estimates Medians and averages are computed from unrounded figures. All absolute figures are independently rounded to the nearest thousand; hence, the group total may not always be equal to the sum of the individual figures. Percentages are computed from unrounded absolute figures and may not always add up to exactly 100.0 percent because of rounding. The total percent, however, is always shown as 100.0.
66 2003 Family Income and Expenditure Survey
B. LIST OF ADDITIONALTABLES Table 1. Number of Families and Family Receipts by Source of Receipt and Income
Class and by Region: 2003
Table 2. Number of Families and Family Receipts by Source of Receipt and Family Size and by Region: 2003
Table 3. Number of Families and Family Receipts by Sources of Receipt and Income Decile and by Region: 2003
Table 4. Number of Families and Family Disbursements by Income Class and Type of Disbursement and by Region: 2003
Table 5. Number of Families and Family Disbursements by Family Size and Type of Disbursement and by Region: 2003
Table 6. Number of Families and Family Disbursements by Income Decile and Type of Disbursement and by Region: 2003
Table 7. Number of Families and Total Family Income and Expenditure by Family Size and Income Class and by Region: 2003
Table 8A. Reporting Families and Reported Family Income by Income Class, by Major Occupation Group of Family Head and by Region: 2003
Table 8B. Reporting Families and Reported Family Income by Income Class, by Major Industry Group of Family Head: 2003
Table8C. Reporting Families and Reported Family Income by Income Class, by Broad Industry Group and by Region: 2003
Table 9. Reporting Families and Reported Family Income by Class of Worker of Family Head and Income Class and by Region: 2003
Table 10. Number of Families and Family Income by Income Class, by Sex and Age of Family Head and by Region: 2003
Table 11. Number of Families and Family Income by Income Class and Highest Grade Completed of Family Head and by Region: 2003
Table 12. Number of Families and Family Income and Whether or Not Spouse of Family Head was Employed for Pay or Profit, by Income Class and by Region: 2003
Table 13. Number of Families and Family Income by Income Class and Number of Members Employed for Pay or Profit and by Region: 2003
Table 14. Number of Families by Percent of Total Income Derived from Agriculture by
2003 Family Income and Expenditure Survey 67
Income Class and by Region: 2003
Table 15. Number of Families Having Earned Wages and Salaries in Agricultural and Non-agricultural Industries, by Income Class and by Region: 2003
Table 16. Number of Families by Number of Members Having Earned Wages and Salaries, by Income Class and by Region: 2003
Table 17. Reporting Families and Family Expenditure in Cash and in Kind by Expenditure Group and Income Class and by Region: 2003
Table 18. Total Family Disbursements in Cash and in Kind by Expenditure Group and Item of Expenditure and by Region: 2003
68 2003 Family Income and Expenditure Survey
C. LIST OF PREVIOUS FIES PUBLICATIONS ISH Bulletin Series No. 109 - Family Income and Expenditures Survey, 2000 Volume I - National Summary Final Report Volume II - Provincial/Key City Final Report Volume III - Special Report on Housing ISH Bulletin Series No. 98 - Family Income and Expenditures Survey, 1997 Volume I - National Summary Final Report Volume II - Provincial/Key City Final Report Volume III - Special Report on Housing ISH Bulletin Series No. 80 - Family Income and Expenditures Survey, 1994 Volume I - National Summary Final Report Volume II - Provincial/Key City Final Report Volume V - Special Report on Housing, 1991 and 1994 FIES ISH Bulletin Series No. 72 - Family Income and Expenditures Survey, 1991 Volume I - National Summary Final Report Volume II - Provincial/Key City Final Report ISH Bulletin Series No. 61 - Family Income and Expenditures Survey, 1988 Volume I - National Summary Final Report Volume II - Provincial/Key City Final Report Volume III - Analytical Report Volume IV - Special Report on Housing ISH Bulletin Series No. 56 - Family Income and Expenditures Survey, 1985 Volume I - National Summary Final Report Volume II - Provincial/Key City Final Report Volume III - Sampling Error of Selected Estimates Volume IV - Analytical Report Volume V - Special Report on Housing Series No. 34 - Family Income and Expenditures Survey, 1971 Series No. 22 - Family Income and Expenditures Survey, 1965 Series No. 14 - Family Income and Expenditures Survey, 1961 Series No. 4 - Family Income and Expenditures Survey, 1957
2003 Family Income and Expenditure Survey 69
D. THE 2003 FIES QUESTIONNAIRE
70 2003 Family Income and Expenditure Survey