Embed Size (px)
Citation preview
Montréal Juillet 2002
© 2002 Paul André, M. Martin Boyer, Robert Gagné. Tous droits réservés. All rights reserved. Reproduction partielle permise avec citation du document source, incluant la notice ©. Short sections may be quoted without explicit permission, if full credit, including © notice, is given to the source.
Série Scientifique Scientific Series
2002s-71
Do CEOs Exercise Their Stock Options Earlier than
Other Executives?
Paul André, M. Martin Boyer, Robert Gagné
CIRANO
Le CIRANO est un organisme sans but lucratif constitué en vertu de la Loi des compagnies du Québec. Le financement de son infrastructure et de ses activités de recherche provient des cotisations de ses organisations-membres, d’une subvention d’infrastructure du ministère de la Recherche, de la Science et de la Technologie, de même que des subventions et mandats obtenus par ses équipes de recherche.
CIRANO is a private non-profit organization incorporated under the Québec Companies Act. Its infrastructure and research activities are funded through fees paid by member organizations, an infrastructure grant from the Ministère de la Recherche, de la Science et de la Technologie, and grants and research mandates obtained by its research teams.
Les organisations-partenaires / The Partner Organizations
•École des Hautes Études Commerciales •École Polytechnique de Montréal •Université Concordia •Université de Montréal •Université du Québec à Montréal •Université Laval •Université McGill •Ministère des Finances du Québec •MRST •Alcan inc. •AXA Canada •Banque du Canada •Banque Laurentienne du Canada •Banque Nationale du Canada •Banque Royale du Canada •Bell Canada •Bombardier •Bourse de Montréal •Développement des ressources humaines Canada (DRHC) •Fédération des caisses Desjardins du Québec •Hydro-Québec •Industrie Canada •Pratt & Whitney Canada Inc. •Raymond Chabot Grant Thornton •Ville de Montréal
ISSN 1198-8177
Les cahiers de la série scientifique (CS) visent à rendre accessibles des résultats de recherche effectuée au CIRANO afin de susciter échanges et commentaires. Ces cahiers sont écrits dans le style des publications scientifiques. Les idées et les opinions émises sont sous l’unique responsabilité des auteurs et ne représentent pas nécessairement les positions du CIRANO ou de ses partenaires. This paper presents research carried out at CIRANO and aims at encouraging discussion and comment. The observations and viewpoints expressed are the sole responsibility of the authors. They do not necessarily represent positions of CIRANO or its partners.
Do CEOs Exercise Their Stock Options Earlier than Other Executives?*
Paul André†, M. Martin Boyer†, Robert Gagné‡
Résumé / Abstract
Nous étudions dans cet article le moment choisi par le PDG d'une compagnie pour lever ses options ou vendre ses actions dans la compagnie comparativement au moment choisi par les autres hauts dirigeants de la compagnie. Nous présentons premièrement un modèle théorique de tournoi qui fait des prédictions quant au moment opportun pour le PDG et les autres dirigeants de lever leurs options et/ou de vendre leurs actions dans la compagnie. Nous montrons théoriquement dans un tel modèle de tournoi que les hauts dirigeants devraient lever leurs options après le PDG. Nous testons ce modèle en utilisant une base de données unique de compagnies canadiennes de 1993 à 1999. Nos résultats empiriques semblent supporter notre modèle théorique puisque les hauts dirigeants semblent lever leurs options un an plus tard que le PDG. De plus, les hauts dirigeants semblent plus enclins à lever leurs options lorsqu'un nouveau PDG vient d'être nommé, confirmant ainsi notre modèle de tournoi.
This paper looks at the timing chosen by CEOs to exercise their stock options and to sell their shares of stock compared to the timing chosen by other top executives in the firm. We first present a model that predicts when CEOs should exercise their options and/or sell their shares, and when other top managers should. Using a tournament approach we find that other top executives should exercise their stock options later than the CEO. We test this model using an unique data set of Canadian companies from 1993 onward. Our results seem to support the theoretical model as non-CEO executives seem to exercise their stock options about a calendar year later than the CEO. Moreover, non-CEO executive a more likely to exercise when a new CEO has been appointed, confirming our tournament model results.
Mots clés : Contributions volontaires , pertes publiques, risque, ambiguïté, données expérimentales.
Keywords: CEO and Executive Compensation, Options, Timing of Exercised Options. Codes JEL : G3
* We wish to thank participants in the First École Polytechnique (Paris) Workshop and in the 2001 Corporate Finance Day at CIRANO for their comments, as well as Anup Agrawal, John Core, Chris Ittner and Randall Morck. This research is financially supported by the Social Science and Humanities Research Council of Canada and by la Direction de la Recherche (HEC). The continuing financial support of CIRANO is also gratefully acknowledged. † Associate Professor of Accounting, École des Hautes Études Commerciales, Université de Montréal, 3000 Côte Sainte-Catherine, Montréal, QC, H3T 2A7 Canada. [email protected]. † Associate Professor of Finance, École des Hautes Études Commerciales, Université de Montréal, 3000 Côte-Sainte-Catherine, Montréal, QC, H3T 2A7 Canada; and Cirano, 2020 University Ave., 25th floor, Montréal, QC. [email protected]. ‡ Professor of Economics, École des Hautes Études Commerciales, Université de Montréal, 3000 Côte-Sainte-Catherine, Montréal, QC, H3T 2A7 Canada; and Cirano, 2020 University Ave., 25th floor, Montréal, QC. [email protected].
1 Introduction
1.1 Motivation
The growing popularity of performance based compensation has produced a huge literature on how
and when should stock options and other long-term incentive plans be given to CEOs and other top
executives. This has been true in both finance (Jensen and Meckling, 1976, and Smith and Watts,
1992) and accounting (Healy, 1985). Rappaport (1999) reports that stock options now account
for more than half of total CEO compensation and about a third of top executive pay. Klassen
and Mawani (2000) report that more than 67 percent of the largest Canadian public corporations
granted stock options to their executives in 1995 (compared with 33 percent in 1991). Our data
confirms this increasing trend. The recent study of Kole (1998) proposes, however, that the full
complexity and richness of executive compensation has not been studied thoroughly yet.
Our paper fills a small gap in this literature. Our paper first attempts to develop a theory
framework for understanding the differential timing of exercise by top executives based on signalling
arguments and a tournament setting (see Lazear and Rosen, 1981, Chan, 1996, Tsoulouhas et al.
(2000) and Agrawal et al., 2001). Second, using annual proxies and information circular of large
Canadian corporations (excluding mining, prospecting and financial), we study empirically the
timing of CEOs and other top executives in exercising their stock options. We find that CEOs
appear to exercise their stock options a calendar year earlier than other top executives, consistent
with our model.
The database we use is unique in its breath of information regarding executive compensation
in Canada. The reason is that Canadian corporations listed on the Toronto Stock Exchange were
not required to provide this information related to top-executive compensation until 1993. This
information is published in the company’s Management Proxy (or Information Circular) every year.
Even if the average total pay of executives varies across countries (see Murphy, 1999), the difference
between Canada and the U.S. is less so (see Helik, 1999).
The point of using Canadian data is not solely a question of testing existing managerial com-
pensation theories with a different data base than previous studies that used U.S. data. The entire
corporate governance of Canadian companies is very much different from that in the U.S., especially
from a point of view of voting rights. In the U.S., very few stocks have multiple voting rights. And
more often than not, those multiple voting rights are triggered only if a corporate raider launches
a hostile takeover. These anti-takeover amendments are known as poison pills in the literature.
In Canada, shares with multiple voting rights are much more frequent. They allow a company’s
founder to sell a huge portion of his future cash flows rights (dividends) while retaining control of
1
the corporation.
This brings us to the second important difference in corporate governance between the U.S. and
Canada. The Berle and Means (1932) paradigm of diverse ownership of U.S. corporation does not
apply in Canada. Many large Canadian companies are still owned in large part by its founder or
by the founder’s family. For example, Seagram’s is owned by the Bronfmans, and Québécor by the
Péladeau. Given that compensation policies and managerial share ownership are two important
corporate governance mechanisms, it is not straightforward to expect U.S. corporate governance
results to apply to Canada since the ownership and legal structure is not the same.
This paper does not address these issues directly. It is, however, important to keep those in
mind when trying to compare results using American data and results using Canadian data. Our
study focuses on the timing used by executives to exercise their stock options. More to the point,
we want to compare when CEOs exercise their options compared to other top executives in the
firm.
1.2 Relevant literature
The literature pertaining to CEO compensation packages is important (see Murphy, 1999). The
compensation of other top executives has also been studied. What has not been studied in the
literature is the timing of the total compensation of all executives. While research on CEO Stock-
Based Compensation continues to debate the merits of such a compensation scheme (e.g., Bryan,
Hwang and Lilien 2000) and its optimal structure (Hall and Murphy 2000), research on the motives
for early exercise of employee stock options (ESO) is relatively sparse and fairly recent. In fact,
research on the subject is almost non existent prior to the ninety nineties since only few employees
were compensated using options. The rise in the use of options but also issues related to the
valuation of ESOs which have the particularity of not being traded has generated attention to this
area.
A number of papers have examined the impact of agency, financial reporting and tax incentives of
option grants (Matsunaga 1995, Yermack 1995 and Klassen and Mawani 2000). Recent, attempts by
accounting standard setting bodies (e.g., FASB in the United States) to have companies recognize
a compensation expense in their financial statement at the grant of the options has created an
interesting controversy with respect to appropriate valuation techniques. A number of articles,
even some in the financial press (e.g., Fox 1997) have shown that the restriction related to the sale
of ESOs may create optimal conditions for early exercise. Optimal premature exercise of options
modifies the concept of the term of the options and therefore their evaluation (Huddart 1994,
Hemmer, Matsunaga and Shevlin 1994 and 1998).
2
In fact, motives for early exercise of ESOs can be structured in three groups: Macroeconomic-
wide factors, Microeconomic-wide or firm related factors and Employee related or psychological
factors. Among macro economic factors likely to have an impact on exercise, the most often cited
are changes in interest rates and changes in tax laws. However, lack of longitudinal data in the area
has not allowed significant testing of these hypotheses. Huddart (1998) does find that the frequency
of exercise is greater for employees affected by a proposed tax rate increase. However, despite the
greater frequency, less than one-third of the option holders who would benefit most from exercise
for tax reasons chose to exercise earlier.
Firms play a role in the exercise decision of their employees. The characteristics they set on the
stock option contracts (vesting schedule, expiration dates, share ownership targets) impose a first
level of constraints and opportunities. The stock price movements and the predictability of prices
(i.e, the volatility of the stock). Most studies show that employees exercise when the market to
price ratios is high and when they is large uncertainty with respect to prices. Changes in dividend
yield should have an impact on the value of the options but has not been captured empirically.
Also, while their exist security laws with respect to insider trading, it is often suggested without
empirical support that employees will exercise based on their private information. Firms can also
buy back in-the-money options to be exercised with a tax deductible cash payment. Mawani (1998)
examines the trade-offs between the opportunity cost of allowing options to be exercised and the
cash cost of buying them back which trigger different financial reporting and tax consequences.
Mawani finds evidence consistent with firms responding to financial reporting costs.
Employees are likely to exercise for risk diversification reasons and for liquidity reasons . Em-
ployees face a number of constraints such as firm-specific human capital, wealth limitations, security
regulations regarding insider trading and non transferability provisions that do not apply to market
participants in general. Hemmer, Matsunaga and Shevlin (1996) show that the decision of execu-
tives to exercise is positively related to the volatility of the stock but negatively related to the level
of other compensation that serves to hedge against fluctuations and limits liquidity needs.
Other human factors also play a role. Heath, Huddart and Lang (1999) examined 50,000 exercise
decisions at seven corporations and show, after controlling for economic factors, that psychological
factors influence early exercise. More precisely, they show that employees exercise in response
to stock price trends, i.e., exercise are positively related to stock returns during the preceding
month and negatively related to returns over longer horizons. Their results are consistent with
psychological models of values that include reference points, exercise being much greater in periods
when stock prices exceed their maximum attained during the previous year. Cuny and Jorion
(1995) argument that employees are more likely to stay with their employer if stock prices increases
3
and hence not exercise has not been validated in any study. Huddart and Lang (1996), using a
similar database, find that the employee’s level within the firm is a significant factors explaining
early exercise by non executives (they do not examine the exercise behavior of CEO versus other
executives). Beyond the effects of other compensation on risk and liquidity needs discussed above,
top executives must publicly reveal the exercise of their ESOs, thus, creating a fir bit of attention
on themselves.
Our paper explores another view of the choice to exercise based on the concept that maintaining
ones options is a signaling mechanisms used by some executives under the setting of tournament
theory (see the initial works by Lazear and Rosen 1981 and Rosen 1986 and a recent test of the
theory in Scott and Thiessen 1999). Under tournament theory, the firm’s hierarchical structure
constitutes a tournament whereby incentives and signals by managers are generated through their
desire to climb the organizational hierarchy.
1.3 Approach
We know that CEOs would be inclined to exercise their stock options when they believe the stock
to be over-valued, just as CEOs who own stocks will want to sell them when their price is high.
Security bodies require the disclosure of these activities, thus this selling of call options and of
stocks should send a message to the markets that the stock price is too high. We should therefore
expect a reduction in the price of the stock following the public announcement that the CEO has
sold the stock, or has exercised his call option. The same theory should apply to non-CEO top
executives.
The intuition behind this hypothesis is that a company’s top executives have more precise
information related to the company’s future cash flows. Therefore executives who expect future
cash flows to be bad, and who expect the stock price to decline accordingly should sell off their stocks
and call options. This information hypothesis could therefore explain negative abnormal returns
on stocks for which an announcement has been made that some top executives have exercised their
options.
This hypothesis does not explain, however, why some executives would exercise their stock
options earlier than others. In fact, one could argue that all top-5 executives in a corporation have
the same information, which means that they should all exercise at the same time. At least, we
should not expect one type of executive to exercise systematically before all other four.
It is also possible that CEOs forbid through non-written contracts top executives to exercise
stock options before the CEO does. A CEO would do that if he believes that the market would react
too negatively to such an announcement. One possible negative signal would be that the non-CEO
4
executive is planning on leaving the company. Hayes and Schaefer (1999) show that corporations
who lose a CEO or another top executive to another company have an abnormal return of -1,51%
around the date where the announcement that the executive is leaving for a CEO position elsewhere
is made. Therefore, if the market believes that an executive exercising his options is a signal that
he is thinking of leaving, then the estimation of -1,51% of Hayes and Schaefer is an upper bound of
the real negative abnormal return since the market reacted previously to the executive selling his
stock or exercising his stock options.
CEOs may want to prevent such an event from occurring by forbidding other executives from
exercising their options before he does. Given that other top-5 executives are more than five times
as likely to depart that the CEO (and that they are less that five times the number), we have that
a non-CEO executive who exercises his option is more likely to leave than a CEO who exercises his
option.
2 Model
2.1 Setup
Let us take a very stylized model of executive behavior. Suppose there are three players, the CEO
(agent 0), and two managers (agents 1 and 2) who live only two periods. The agent who is the CEO
receives perquisite Ii ≥ 0, i ∈ 0, 1, 2. An agent’s perquisite of being a CEO is private information,and may thus be different for all agents. Let λ(I) represent the distribution of perk-types.
All these players are endowed with ni options (at strike price K) and mi shares, and personal
wealth Yi, i ∈ 0, 1, 2. These endowments are common knowledge as they are made public inthe management information circular or in the management proxy statements. The initial period’s
stock price is P . Period one’s stock price is then P (1 + er), where return er is distributed with meansR = E (er) > 0 and standard deviation σ =
pV ar (er). This distribution of returns is the same for
every period. We suppose that the three players cannot disrupt the stock return by their behavior.
This is only done in order to simplify the model.1
In the first period, after observing period one’s stock price, every agent must decide simultane-
ously whether to hold on to their stock and stock options or not (agents can only keep all of their
endowed securities or sell all of their endowed securities).2 This means that at the beginning of the
1A more complete model would say that stock returns are more likely to be high when the CEO and the twomanagers have not sold any securities. We could then have that the behavior of the three agents influences theexpected return, but not the variance of those returns. There are 26 = 64 possible combinations of behavior by theplayers. It would be possible to assign one expected return to each possible contingency. One contingency, denotedby 101001 would mean: CEO sells stock options, Manager 1 keeps stock options, Manager 2 sells stock options, CEOkeeps stocks, Manager 1 keeps stocks, Manager 2 sells stocks.
2This approach does not take into account nesting periods and mandatory share ownership tagets. We feel,
5
second period agent i ∈ 0, 1, 2 has ni options3 and mi shares of the stock left in his portfolio,
where ni ∈ 0, ni and mi ∈ 0,mi. The decision to sell or not is based on the known level ofendowed securities, personal wealth and other financial parameters of the economy (stock price,
distribution, etc...).
An agent who does not exercise his options or does not sell his stock in period one has to sell in
period 2. Period 2 cash flows are discounted at rate di ≥ 0, i ∈ 0, 1, 2, which may differ betweenagents (the discount factor is thus (1 + di)
−1). This preference for time is private information for
an agent. Let δ (d) represent the distribution of discount-types.
Managers want to become the CEO. This may only occur when the incumbent CEO leaves the
firm.4 The incumbent CEO leaves the firm with exogenous probability sn (sm) before period 2 if
she exercised her option (sold her shares) in period 1. A CEO who leaves the firm receives outside
income W ≥ 0, which is known only to the incumbent CEO. Let Ω (W ) represent the distribution
of outside income. We may view this outside income as another job or as the utility of leisure upon
retirement.
In the case where the incumbent CEO has left the firm, a new CEO must be chosen. The
new CEO may either be an inside manager or someone from the outside. A manager becomes
the new CEO with some probability associated with the corporate citizenship he has shown to-
ward the firm. Specifically, we will suppose that manager i becomes the CEO with probability12
³ni
ni+n−i+εn+ mi
mi+m−i+εm
´. Variables nj and mj represent the number of stock options and the
number of shares left in each manager’s portfolio after the first period (that is, the number of each
securities a manager did not sell in the first period).5 The εn and εm terms represents the likelihood
that an outsider is named CEO; this occurs with probability 12
³εn
n1+n2+εn+ εm
m1+m2+εm
´. Table 1
in the appendix illustrates the timing of events.
Each agent’s payoff is given by the present value of each agent’s final wealth. One must not
forget that every agent must sell his shares of exercise his options by the end of the second period.
however, that these concerns are not essential in our model; we can view mi and ni as the number of securities thatare in play (i.e., that the manager or CEO is allowed to sell).
3Typical employee options have a much longer maturity than traded options. This means that there may be nomarket for these long term securities. We must then view the selling of options in our model as exercising the optionsat strike price K, and then selling of the stock itself at the market price.
4For a study on CEO turnover, see Agrawal et al. (2001) and Parrino (1997).5 It is clear that this stylized model can be generalized to A managers who fight for the CEO job, and by letting
the weights on stock options and restricted shares that determine the next CEO not be 12 . We would then have that
manager i becomes the next CEO with probability
ηniPA
j=1 nj + εn+ (1− η)
miPA
j=1 mj + εm
where η represents the weight assigned to stock options.
6
For ease of presentation let us separate the decision to exercise one’s options from the decision to
sell one’s shares.
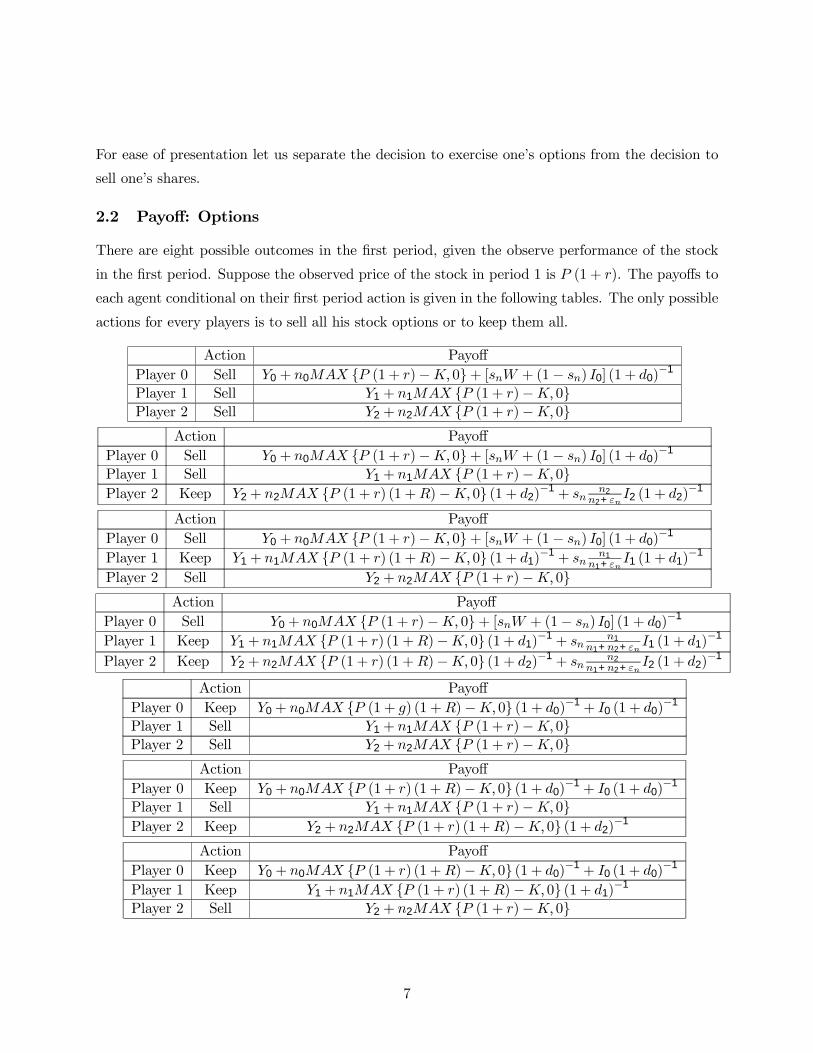
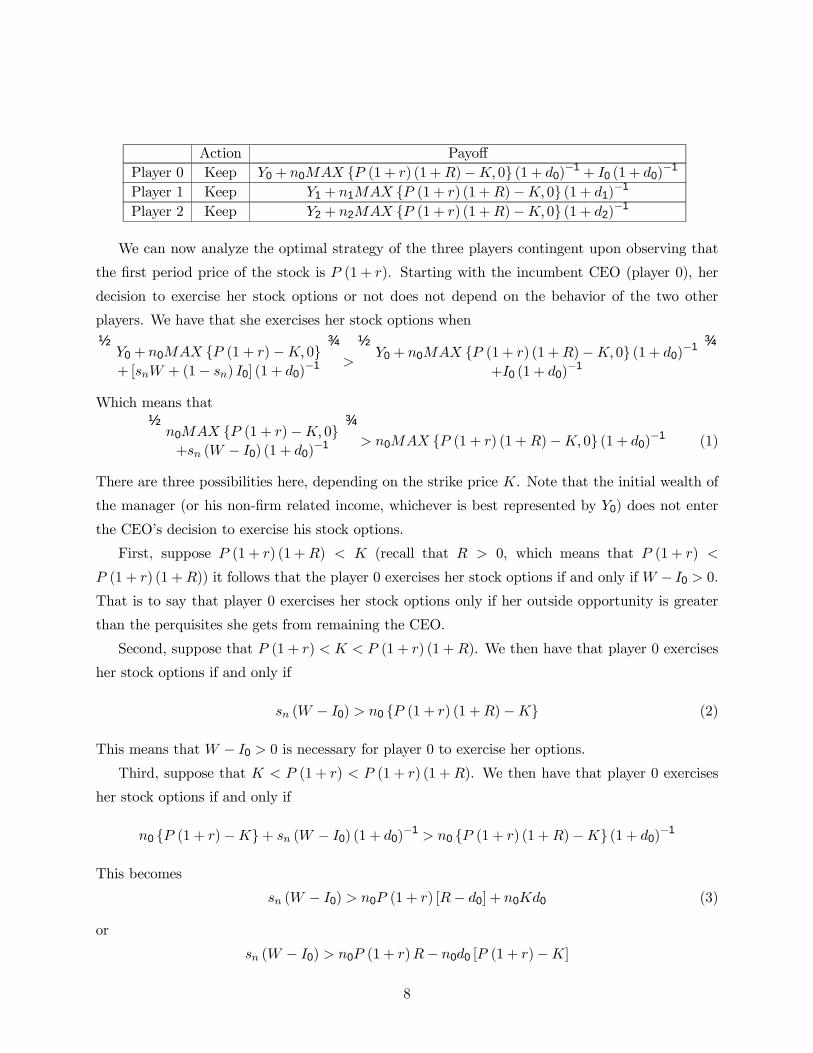
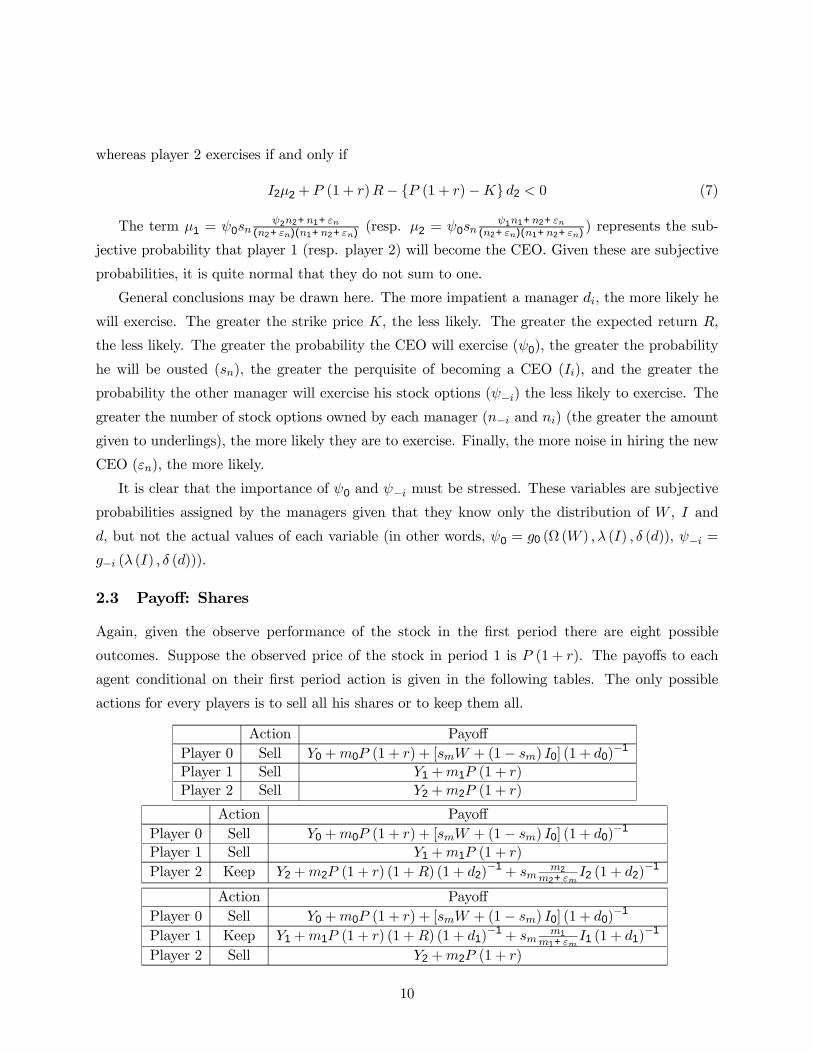
2.2 Payoff: Options
There are eight possible outcomes in the first period, given the observe performance of the stock
in the first period. Suppose the observed price of the stock in period 1 is P (1 + r). The payoffs to
each agent conditional on their first period action is given in the following tables. The only possible
actions for every players is to sell all his stock options or to keep them all.
Action PayoffPlayer 0 Sell Y0 + n0MAX P (1 + r)−K, 0+ [snW + (1− sn) I0] (1 + d0)
−1
Player 1 Sell Y1 + n1MAX P (1 + r)−K, 0Player 2 Sell Y2 + n2MAX P (1 + r)−K, 0
Action PayoffPlayer 0 Sell Y0 + n0MAX P (1 + r)−K, 0+ [snW + (1− sn) I0] (1 + d0)
−1
Player 1 Sell Y1 + n1MAX P (1 + r)−K, 0Player 2 Keep Y2 + n2MAX P (1 + r) (1 +R)−K, 0 (1 + d2)
−1 + snn2
n2+εnI2 (1 + d2)
−1
Action PayoffPlayer 0 Sell Y0 + n0MAX P (1 + r)−K, 0+ [snW + (1− sn) I0] (1 + d0)
−1
Player 1 Keep Y1 + n1MAX P (1 + r) (1 +R)−K, 0 (1 + d1)−1 + sn
n1n1+εn
I1 (1 + d1)−1
Player 2 Sell Y2 + n2MAX P (1 + r)−K, 0Action Payoff
Player 0 Sell Y0 + n0MAX P (1 + r)−K, 0+ [snW + (1− sn) I0] (1 + d0)−1
Player 1 Keep Y1 + n1MAX P (1 + r) (1 +R)−K, 0 (1 + d1)−1 + sn
n1n1+n2+εn
I1 (1 + d1)−1
Player 2 Keep Y2 + n2MAX P (1 + r) (1 +R)−K, 0 (1 + d2)−1 + sn
n2n1+n2+εn
I2 (1 + d2)−1
Action PayoffPlayer 0 Keep Y0 + n0MAX P (1 + g) (1 +R)−K, 0 (1 + d0)
−1 + I0 (1 + d0)−1
Player 1 Sell Y1 + n1MAX P (1 + r)−K, 0Player 2 Sell Y2 + n2MAX P (1 + r)−K, 0
Action PayoffPlayer 0 Keep Y0 + n0MAX P (1 + r) (1 +R)−K, 0 (1 + d0)
−1 + I0 (1 + d0)−1
Player 1 Sell Y1 + n1MAX P (1 + r)−K, 0Player 2 Keep Y2 + n2MAX P (1 + r) (1 +R)−K, 0 (1 + d2)
−1
Action PayoffPlayer 0 Keep Y0 + n0MAX P (1 + r) (1 +R)−K, 0 (1 + d0)
−1 + I0 (1 + d0)−1
Player 1 Keep Y1 + n1MAX P (1 + r) (1 +R)−K, 0 (1 + d1)−1
Player 2 Sell Y2 + n2MAX P (1 + r)−K, 0
7
Action PayoffPlayer 0 Keep Y0 + n0MAX P (1 + r) (1 +R)−K, 0 (1 + d0)
−1 + I0 (1 + d0)−1
Player 1 Keep Y1 + n1MAX P (1 + r) (1 +R)−K, 0 (1 + d1)−1
Player 2 Keep Y2 + n2MAX P (1 + r) (1 +R)−K, 0 (1 + d2)−1
We can now analyze the optimal strategy of the three players contingent upon observing that
the first period price of the stock is P (1 + r). Starting with the incumbent CEO (player 0), her
decision to exercise her stock options or not does not depend on the behavior of the two other
players. We have that she exercises her stock options when½Y0 + n0MAX P (1 + r)−K, 0+[snW + (1− sn) I0] (1 + d0)
−1
¾>
½Y0 + n0MAX P (1 + r) (1 +R)−K, 0 (1 + d0)
−1
+I0 (1 + d0)−1
¾Which means that½
n0MAX P (1 + r)−K, 0+sn (W − I0) (1 + d0)
−1
¾> n0MAX P (1 + r) (1 +R)−K, 0 (1 + d0)
−1 (1)
There are three possibilities here, depending on the strike price K. Note that the initial wealth of
the manager (or his non-firm related income, whichever is best represented by Y0) does not enter
the CEO’s decision to exercise his stock options.
First, suppose P (1 + r) (1 +R) < K (recall that R > 0, which means that P (1 + r) <
P (1 + r) (1 +R)) it follows that the player 0 exercises her stock options if and only if W − I0 > 0.
That is to say that player 0 exercises her stock options only if her outside opportunity is greater
than the perquisites she gets from remaining the CEO.
Second, suppose that P (1 + r) < K < P (1 + r) (1 +R). We then have that player 0 exercises
her stock options if and only if
sn (W − I0) > n0 P (1 + r) (1 +R)−K (2)
This means that W − I0 > 0 is necessary for player 0 to exercise her options.
Third, suppose that K < P (1 + r) < P (1 + r) (1 +R). We then have that player 0 exercises
her stock options if and only if
n0 P (1 + r)−K+ sn (W − I0) (1 + d0)−1 > n0 P (1 + r) (1 +R)−K (1 + d0)
−1
This becomes
sn (W − I0) > n0P (1 + r) [R− d0] + n0Kd0 (3)
or
sn (W − I0) > n0P (1 + r)R− n0d0 [P (1 + r)−K]
8
Again, W − I0 > 0 is necessary for player 0 to exercise her options.
We can draw some conclusions when options are in the money (P (1 + r)−K > 0). The greater
the outside opportunity W , the more likely a CEO will exercise his stock options. The higher the
perquisites I0 related to the CEO position in the firm, the less likely. The greater the number of
stock options n0, the less will he exercise them. The greater the strike price K, the less likely.
The greater the impatience d0 the more likely. The greater the expected return R, the less likely.
Finally, the greater the probability of being ousted, the more (less) likely he will exercise if W < I0
(W > I0).
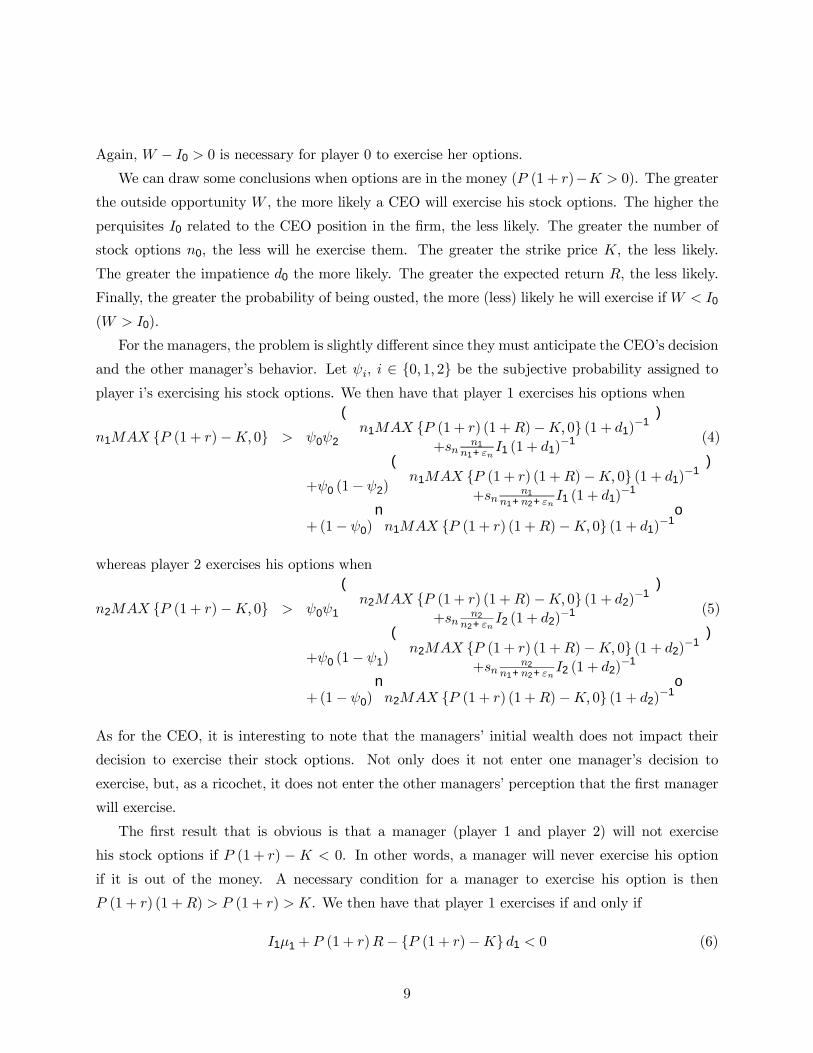
For the managers, the problem is slightly different since they must anticipate the CEO’s decision
and the other manager’s behavior. Let ψi, i ∈ 0, 1, 2 be the subjective probability assigned toplayer i’s exercising his stock options. We then have that player 1 exercises his options when
n1MAX P (1 + r)−K, 0 > ψ0ψ2
(n1MAX P (1 + r) (1 +R)−K, 0 (1 + d1)
−1
+snn1
n1+εnI1 (1 + d1)
−1
)(4)
+ψ0 (1− ψ2)
(n1MAX P (1 + r) (1 +R)−K, 0 (1 + d1)
−1
+snn1
n1+n2+εnI1 (1 + d1)
−1
)+(1− ψ0)
nn1MAX P (1 + r) (1 +R)−K, 0 (1 + d1)
−1o
whereas player 2 exercises his options when
n2MAX P (1 + r)−K, 0 > ψ0ψ1
(n2MAX P (1 + r) (1 +R)−K, 0 (1 + d2)
−1
+snn2
n2+εnI2 (1 + d2)
−1
)(5)
+ψ0 (1− ψ1)
(n2MAX P (1 + r) (1 +R)−K, 0 (1 + d2)
−1
+snn2
n1+n2+εnI2 (1 + d2)
−1
)+(1− ψ0)
nn2MAX P (1 + r) (1 +R)−K, 0 (1 + d2)
−1o
As for the CEO, it is interesting to note that the managers’ initial wealth does not impact their
decision to exercise their stock options. Not only does it not enter one manager’s decision to
exercise, but, as a ricochet, it does not enter the other managers’ perception that the first manager
will exercise.
The first result that is obvious is that a manager (player 1 and player 2) will not exercise
his stock options if P (1 + r) −K < 0. In other words, a manager will never exercise his option
if it is out of the money. A necessary condition for a manager to exercise his option is then
P (1 + r) (1 +R) > P (1 + r) > K. We then have that player 1 exercises if and only if
I1µ1 + P (1 + r)R− P (1 + r)−K d1 < 0 (6)
9
whereas player 2 exercises if and only if
I2µ2 + P (1 + r)R− P (1 + r)−K d2 < 0 (7)
The term µ1 = ψ0snψ2n2+n1+εn
(n2+εn)(n1+n2+εn) (resp. µ2 = ψ0snψ1n1+n2+εn
(n2+εn)(n1+n2+εn)) represents the sub-
jective probability that player 1 (resp. player 2) will become the CEO. Given these are subjective
probabilities, it is quite normal that they do not sum to one.
General conclusions may be drawn here. The more impatient a manager di, the more likely he
will exercise. The greater the strike price K, the less likely. The greater the expected return R,
the less likely. The greater the probability the CEO will exercise (ψ0), the greater the probability
he will be ousted (sn), the greater the perquisite of becoming a CEO (Ii), and the greater the
probability the other manager will exercise his stock options (ψ−i) the less likely to exercise. The
greater the number of stock options owned by each manager (n−i and ni) (the greater the amount
given to underlings), the more likely they are to exercise. Finally, the more noise in hiring the new
CEO (εn), the more likely.
It is clear that the importance of ψ0 and ψ−i must be stressed. These variables are subjective
probabilities assigned by the managers given that they know only the distribution of W , I and
d, but not the actual values of each variable (in other words, ψ0 = g0 (Ω (W ) , λ (I) , δ (d)), ψ−i =
g−i (λ (I) , δ (d))).
2.3 Payoff: Shares
Again, given the observe performance of the stock in the first period there are eight possible
outcomes. Suppose the observed price of the stock in period 1 is P (1 + r). The payoffs to each
agent conditional on their first period action is given in the following tables. The only possible
actions for every players is to sell all his shares or to keep them all.
Action PayoffPlayer 0 Sell Y0 +m0P (1 + r) + [smW + (1− sm) I0] (1 + d0)
−1
Player 1 Sell Y1 +m1P (1 + r)
Player 2 Sell Y2 +m2P (1 + r)
Action PayoffPlayer 0 Sell Y0 +m0P (1 + r) + [smW + (1− sm) I0] (1 + d0)
−1
Player 1 Sell Y1 +m1P (1 + r)
Player 2 Keep Y2 +m2P (1 + r) (1 +R) (1 + d2)−1 + sm
m2m2+εm
I2 (1 + d2)−1
Action PayoffPlayer 0 Sell Y0 +m0P (1 + r) + [smW + (1− sm) I0] (1 + d0)
−1
Player 1 Keep Y1 +m1P (1 + r) (1 +R) (1 + d1)−1 + sm
m1m1+εm
I1 (1 + d1)−1
Player 2 Sell Y2 +m2P (1 + r)
10
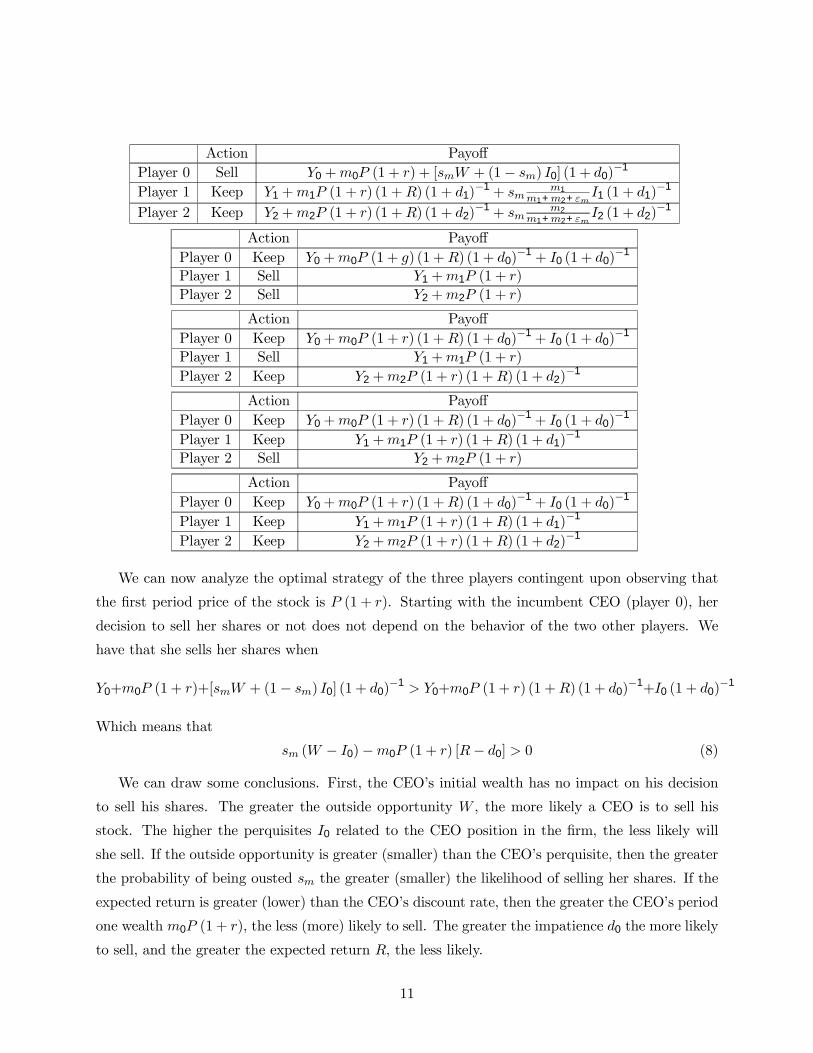
Action PayoffPlayer 0 Sell Y0 +m0P (1 + r) + [smW + (1− sm) I0] (1 + d0)
−1
Player 1 Keep Y1 +m1P (1 + r) (1 +R) (1 + d1)−1 + sm
m1m1+m2+εm
I1 (1 + d1)−1
Player 2 Keep Y2 +m2P (1 + r) (1 +R) (1 + d2)−1 + sm
m2m1+m2+εm
I2 (1 + d2)−1
Action PayoffPlayer 0 Keep Y0 +m0P (1 + g) (1 +R) (1 + d0)
−1 + I0 (1 + d0)−1
Player 1 Sell Y1 +m1P (1 + r)
Player 2 Sell Y2 +m2P (1 + r)
Action PayoffPlayer 0 Keep Y0 +m0P (1 + r) (1 +R) (1 + d0)
−1 + I0 (1 + d0)−1
Player 1 Sell Y1 +m1P (1 + r)
Player 2 Keep Y2 +m2P (1 + r) (1 +R) (1 + d2)−1
Action PayoffPlayer 0 Keep Y0 +m0P (1 + r) (1 +R) (1 + d0)
−1 + I0 (1 + d0)−1
Player 1 Keep Y1 +m1P (1 + r) (1 +R) (1 + d1)−1
Player 2 Sell Y2 +m2P (1 + r)
Action PayoffPlayer 0 Keep Y0 +m0P (1 + r) (1 +R) (1 + d0)
−1 + I0 (1 + d0)−1
Player 1 Keep Y1 +m1P (1 + r) (1 +R) (1 + d1)−1
Player 2 Keep Y2 +m2P (1 + r) (1 +R) (1 + d2)−1
We can now analyze the optimal strategy of the three players contingent upon observing that
the first period price of the stock is P (1 + r). Starting with the incumbent CEO (player 0), her
decision to sell her shares or not does not depend on the behavior of the two other players. We
have that she sells her shares when
Y0+m0P (1 + r)+[smW + (1− sm) I0] (1 + d0)−1 > Y0+m0P (1 + r) (1 +R) (1 + d0)
−1+I0 (1 + d0)−1
Which means that
sm (W − I0)−m0P (1 + r) [R− d0] > 0 (8)
We can draw some conclusions. First, the CEO’s initial wealth has no impact on his decision
to sell his shares. The greater the outside opportunity W , the more likely a CEO is to sell his
stock. The higher the perquisites I0 related to the CEO position in the firm, the less likely will
she sell. If the outside opportunity is greater (smaller) than the CEO’s perquisite, then the greater
the probability of being ousted sm the greater (smaller) the likelihood of selling her shares. If the
expected return is greater (lower) than the CEO’s discount rate, then the greater the CEO’s period
one wealth m0P (1 + r), the less (more) likely to sell. The greater the impatience d0 the more likely
to sell, and the greater the expected return R, the less likely.
11
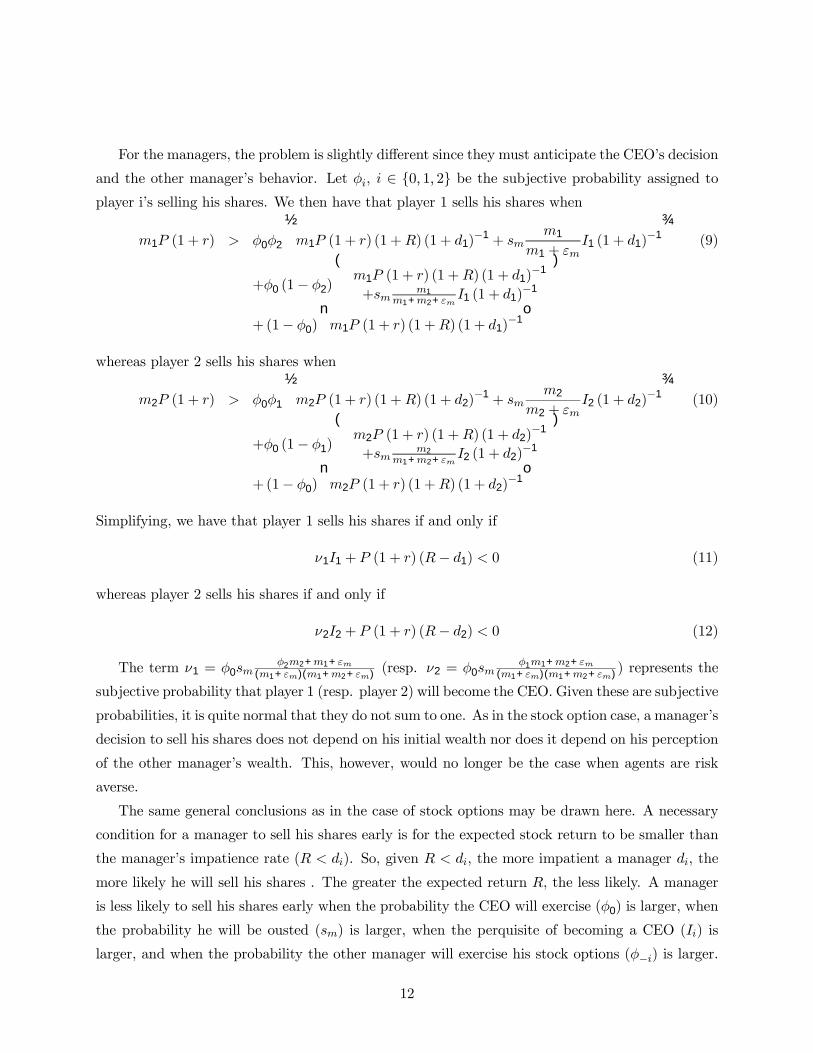
For the managers, the problem is slightly different since they must anticipate the CEO’s decision
and the other manager’s behavior. Let φi, i ∈ 0, 1, 2 be the subjective probability assigned toplayer i’s selling his shares. We then have that player 1 sells his shares when
m1P (1 + r) > φ0φ2
½m1P (1 + r) (1 +R) (1 + d1)
−1 + smm1
m1 + εmI1 (1 + d1)
−1
¾(9)
+φ0 (1− φ2)
(m1P (1 + r) (1 +R) (1 + d1)
−1
+smm1
m1+m2+εmI1 (1 + d1)
−1
)+(1− φ0)
nm1P (1 + r) (1 +R) (1 + d1)
−1o
whereas player 2 sells his shares when
m2P (1 + r) > φ0φ1
½m2P (1 + r) (1 +R) (1 + d2)
−1 + smm2
m2 + εmI2 (1 + d2)
−1
¾(10)
+φ0 (1− φ1)
(m2P (1 + r) (1 +R) (1 + d2)
−1
+smm2
m1+m2+εmI2 (1 + d2)
−1
)+(1− φ0)
nm2P (1 + r) (1 +R) (1 + d2)
−1o
Simplifying, we have that player 1 sells his shares if and only if
ν1I1 + P (1 + r) (R− d1) < 0 (11)
whereas player 2 sells his shares if and only if
ν2I2 + P (1 + r) (R− d2) < 0 (12)
The term ν1 = φ0smφ2m2+m1+εm
(m1+εm)(m1+m2+εm) (resp. ν2 = φ0smφ1m1+m2+εm
(m1+εm)(m1+m2+εm)) represents the
subjective probability that player 1 (resp. player 2) will become the CEO. Given these are subjective
probabilities, it is quite normal that they do not sum to one. As in the stock option case, a manager’s
decision to sell his shares does not depend on his initial wealth nor does it depend on his perception
of the other manager’s wealth. This, however, would no longer be the case when agents are risk
averse.
The same general conclusions as in the case of stock options may be drawn here. A necessary
condition for a manager to sell his shares early is for the expected stock return to be smaller than
the manager’s impatience rate (R < di). So, given R < di, the more impatient a manager di, the
more likely he will sell his shares . The greater the expected return R, the less likely. A manager
is less likely to sell his shares early when the probability the CEO will exercise (φ0) is larger, when
the probability he will be ousted (sm) is larger, when the perquisite of becoming a CEO (Ii) is
larger, and when the probability the other manager will exercise his stock options (φ−i) is larger.
12
The greater the number of shares owned by each manager (m−i and mi), the more likely - the
greater the amount given to underlings, the more likely they are to sell their shares early. Finally,
the more noise in hiring the new CEO (εm), the more likely.
It is clear that the importance of φ0 and φ−i must be stressed. These variables are subjective
probabilities assigned by the managers given that they know only the distribution of W , I and
d, but not the actual values of each variable (in other words, φ0 = h0 (Ω (W ) , λ (I) , δ (d)), φ−i =
η−i (λ (I) , δ (d))).
2.4 Exercising Stock Options vs. Selling Shares
What we want to do in this section is observe whether agents are more likely to exercise their
stock options or to sell their shares. As previously stated, exercising one’s options in this paper is
the equivalent of cashing out. In other words, exercising one’s options does not increase the share
ownership of the agent. Starting with the incumbent CEO, he is more likely to exercise his stock
options if6
s (W − I0) > n0P (1 + r) [R− d0] + n0d0K
is more likely than
s (W − I0) > m0P (1 + r) [R− d0]
This means that the CEO is more likely to exercise her stock options if and only if
m0P (1 + r) [R− d0] > n0P (1 + r) [R− d0] + n0d0K
and
(m0 − n0)P (1 + r) [R− d0] > n0d0K
It is interesting to note that if the CEO is endowed with the no more shares of stock than as stock
options (m0 ≤ n0), then he will always sell his shares before he exercises his stock options, provided
R > d0.
For a manager (say agent 2), he is more likely to exercise his stock options when
µ2I2 + P (1 + r) [R− d2] +Kd2 < 0
is more likely than
ν2I2 + P (1 + r) [R− d2] < 0
This occurs when
Kd2 − (ν2 − µ2) I2 < 0
6We only study the case where the options are in the money as of period one.
13
If ν2 ≤ µ2, that is the manager assigns greater subjective probability that he will become the
CEO because of stock options rather than shares, then the managers will sell his shares of stock
before he exercises his stock options. If this is not the case, then it is interesting to note that the
greater the perks of becoming a CEO (I2), the more likely a manager is to exercise his stock options
before he sells his shares of stock. On the other hand, the higher the stock option’s strike price
(K) and the higher the manager’s discount rate (d2), the more likely he is to sell his shares of stock
before he exercises his stock options.
Whether a manager believes that his ownership of shares is more or less important than his
ownership of stock options depends on a multitude of factors, some being objective, other being
subjective. A manager is more likely to sell his stock options before his shares of stock if ν2−µ2 > 0.
This occurs when
φ0smφ1m1 +m2 + εm
(m1 + εm) (m1 +m2 + εm)− ψ0sn
ψ1n1 + n2 + εn
(n2 + εn) (n1 + n2 + εn)> 0
This is more likely to occur the greater the subjective probability that the other two players sell
their shares of stock (φ0 and φ1), and the greater the objective probability that the incumbent CEO
will be ousted after he has sold his stock (sm). The opposite impact is true for the stock options.
3 Econometric Approach
The main test we want to conduct in this paper is whether other executives exercise their stock
options at a later date than CEOs. Since a CEO’s decision to exercise occurs at the same time
as the other executive’s decision, an executive’s decision to exercise cannot depend directly on
whether the CEO is exercising at the same time. What the executive can do, however, is evaluate
the probability that the CEO will exercise at the same time that he is. In other words, the executive
can try to predict whether the CEO will exercise. To reduce noise in the estimations, we aggregated
all non-CEO executives into one.
The main testable equation of our paper is that a manager’s decision to exercise depends on
many factors, including the CEO’s decision to exercise the previous period. The testable equation
can thus be written as
ExerRatiot = Cst+CeoExt−1 +Casht + Unvestedt + Si zet (13)
The dependent variable is constructed as the ratio of the value of exercised options to the value
of all exercisable options. All exercisable options is calculated as the sum of exercised options and
vested options:
ExerRatiot =Exercisedt
Exercisedt + V estedt(14)
14
The CeoExt−1 variables calculated the same way, but for the CEO: Ration of exercised options
to exercisable options. The Casht variable represents all other types of compensation received by
the executive that year: Salary, bonuses, other payments, etc. Unvestedt is the value of remaining
unexercisable options (that is, non-vested options) the manager is guaranteed to receive in the next
few years. Cash and Unvested are given in millions of dollars.
Our theory predicts a positive sign on the CeoEx variable since we expect non-CEO executives
to wait for the CEO to exercise their stock options before doing so themselves. The sign on the
Cash variable would be negative for two reasons. First, poorer individuals should be willing to bear
less risk than wealthier individuals. This means that wealthier managers should be more willing
to keep their stock options instead of cashing them out. Another reason why wealthier managers
should not want to exercise their stock options is that they are less likely to be faced with liquidity
problems. As the Cash variable can be seen as a proxy for wealth, we expect its impact on
ExerRatio to be negative. Similarly, managers that will have the right to exercise more options
in the future should smooth their income by exercising more today. We therefore expect that the
total value of unvested stock options (Unvested) will have a positive impact on the proportion of
exercised options to total options. Finally, we want to control for the size of the corporation (Size).
We proxy the size of the corporation as the log of the market value of the corporation. Size should
have a positive impact on the exercising behavior exercise behavior of managers if incumbent CEOs
extract more perks from being CEO of a large firm than CEO of a small firm. By receiving more
perks from being a large-corporation CEO reduces the probability that the CEO will leave, which
means that managers should exercise their options with greater probability. Another possibility
is that size represents the number of possible appointees to the CEO position: The greater the
size, the greater the competition. This means that with more managers competing for the job,
managers may feel that their probability of being appointed is small, which means that they may
(see Agrawal et al, 2001).
Following our tournament approach, we should expect that managers will exercise more often
when a new CEO has been appointed than if the CEO has more tenure. There are two possible
reasons to expect a positive impact of a new CEO appointment on option exercise. First, the CEO
has, presumably, more years ahead of him when initially appointed than with a few years under
his belt. This means that managers will need to wait a long time before being able to play the
CEO tournament again. Second, spurned managers are likely to cash out their options and leave
the firm: They do not want to serve in heaven. This means that the appointment of a new CEO
(NewCeo) should have a positive impact on ExerRatio.
Other variable used to control for the corporate governance are whether the CEO is also the
15
chairman of the board (CeoCob), whether the corporations has issued multiple classes of shares
(Multiple), the CEO’s percentage of ownership (PcCeo), the board member’s percentage of own-
ership (PcBoard), the blockholder’s percentage of ownership (PcBlock) and the ratio of firm
unrelated board member to total board members (UnrBoard). Our theory predicts that managers
are less likely to exercise when incumbent CEOs are more likely to leave (as a result of being fired
or whatever). This means that corporate governance factors that increase the CEO’s entrenchment
in the company should reduce the likelihood of the CEO leaving, and thus increase the likelihood
of the managers exercising their stock options.
The NewCeo variable takes the value 1 if a new CEO has been appointed that year and 0
otherwise. The CeoCob variable take the value 1 if the CEO is also the chairman of the board and 0
otherwise. Multiple equals 1 if the corporation has more than one class of shares outstanding, and 0
if there is only one class. The ownership variables (PcCeo, PcBoard and PcBlock) are constructed
as the shares of each type of owner (CEO, board members and blockholders respectively) divided
by the total number of shares in the corporation. We define a blockholder as a stockholder that
owns more than 10 % of the oustanding shares of the stock. Finally, UnrBoard is constructed as
the number of board directors that are unrelated to the corporation divided by the total number
of directors on the board.
Our prediction is therefore that when the CEO is the chairman of the board (CeoCob), when the
CEO has more stock (PcCeo) and the presence of multiple voting shares (Multiple) should increase
the likelihood that managers exercise their options. These three factors increase, presumably, the
CEOs control over the company. This means that CEO should be less likely to leave or be fired.
Consequently, managers do not need to behave as good citizens of the corporation as they are not
very likely to replace the current CEO.
On the other hand, the blockholder’s percentage of ownership (PcBlock) and the presence
of more unrelated directors on the board (UnrBoard) should reduce the managers’ incentives to
exercise their stock options early. It has been hypothesized (see Agrawal and Knoeber, 1996, and
Schleifer and Vishny, 1997) that large blockholders and outsiders on the board are more likely to
scrutinize the behavior of CEOs. Less entrenched CEOs are more likely to depart, whether they are
fired or because of any other reason (loss of prestige). As their departure is more likely, managers
should reduce their probability of exercising their options in the hope of becoming the next CEO.
3.1 Data Source
We collected precise information regarding executive compensation of publicly traded Canadian
companies listed on the Toronto Stock Exchange. Since 1993 every company traded on the TSE
16
must make public a lot more information that was required previously. They also needed to divulge
information regarding 1991 and 1992 in order for the investor public to get an historical point of
view. This information is made public once a year in the management proxy (information circular).
The information contained in these proxies include 1) the name of the main stockholder; 2) the total
compensation package (base salary, bonus, number of common shares and call options received)
for the firm’s top-5 executives; 3) the number of exercised options and their value, as well as the
number and the value of vested and non-vested options; and 4) the board structure (name and
position) and the number of shares owned by each member. Management proxies also gives us the
details about the type of vesting rights the executives have, as well as the voting rights of each type
of common shares.
Since 1996 all this information is available on the internet site of SEDAR (http://www.sedar.com/).
Prior to this date the information must be collected from the companies directly (for free allegedly),
or from Micromedia (at a price). The names of the 366 companies coded and the years used are
listed at the end of this paper. The summary statistics are presented in table 1 in the appendix.
4 Results
In figures 1 and 2 we compared the salaries and bonuses of the CEO and of the other top executives.
As we can see, it seems that the salary an bonus of CEOs and other top executives follow the same
pattern. When we include exercised options (figures 3 and 4), we see that CEOs seem to receive a
large lump-sum of money one year before other top executives. Since the only difference between
figures 1 and 3 is the value of exercised options, and that salaries and bonuses seem to follow
the same pattern, it has to be that CEOs exercise their options earlier that other top executives.
Figures 5 and 6 present the trend in options granted for the two groups.
These aggregate results allow us to imagine that there is probably some game played between
CEOs and managers who want to become managers. These results are not informative, however:
The aggregation is too large. What we want to look at more closely is the behavior of managers in
individual firms. These results appear in Table 2.
We present in Table 2 preliminary OLS regressions that explain the proportion of exercised
options of the managers as a group. In model 1, we present the basic results where no corporate
governance data is introduced. We see that all our initial hypotheses hold. The managers’ ratio
of exercised options to exercisable option is positively linked to the CEO’s past ratio of exercised
options to exercisable option (CeoExt−1), the manager’s cash income (Cash) and the value of
unvested options (Unvested). The market value of equity variable (Size) is also significant and
positive, supporting the view that larger firms may offer CEOs perks that make CEOs less likely
17
to leave.
In model 2, we replace the manager’s compensation variables (Cash and Unvested) by corporate
governance variables to see if the governance structure has any influence on the exercising behavior
of managers. We see that only the appointment of a new CEO (NewCeo) and the presence of large
blockholders (PcBlock) have an incidence on the exercising behavior of non-CEO executives. These
impacts are of the correct sign. When a new CEO is appointed, managers start exercising their
stock options as they have lost the CEO tournament; there is no longer any point in being a good
citizen of the corporation. The presence of large blockholders reduce the likelihood that managers
will exercise, in line with the hypothesis that blockholders oversee more carefully the CEO’s actions,
which makes him less entrenched and therefore more likely to leave. Similarly, blockholders may
put more emphasis on non-CEO managers for being good citizens of the corporation. None of the
other corporate governance variables are significant, although some have to expected sign. The
presence of a more entrenched CEO (those who are chairman of the board and/or who own more
stock in the company) increases the likelihood that managers will exercise their options.
The last model presented in table 2 combines both the corporate governance variables and the
manager’s compensation variables. The results do no change dramatically: The variables that were
significant in the two other models remain significant, and the variables that were not significant
remain non-significant.
5 Conclusion
This paper presents a model of managerial tournament where the big prize is to become CEO in
the event where the current CEO retires, is fired of leaves for any other reason. Our empirical
results suggest that, in accordance with tournament models, non-CEO managers wait to see if the
incumbent CEO has exercised his stock options before exercising theirs. Moreover, as soon as a
new CEO is appointed, other managers are more likely to exercise their options. This supports the
perception that managers who were not appointed as the new CEO lost the tournament, and that
they no longer need to bahave as spotless citizens of the corporation.
It is clear that we will need to refine the analysis by incorporating stock market data to explain
more precisely the timing of option exercise. Moreover, there is the need to account for the origin
of the CEO (was he appointed from within or from the outside) and other factors that may have
an impact on the manager’s decision to exercise.
An interesting avenue future avenue of research would be to test the probability that any
manager exercises his stock option. In the present paper, we aggregated all the managers into a
single agent. Given the tournament setting presented it may be important to treat each manager
18

seperatly and observe how the behavior of each manager influences the behavior of the others. .
19
6 References
1. Agrawal, A., C. R. Knoeber and T. Tsoulouhas (2001). CEO Succession: Insiders versus
Outsiders. Mimeo, University of Alabama.
2. Bryan, S., L. Hwang and S. Lilien (2000). CEO Stock-Based Compensation: An Empri-
cal Analysis of Incentive-Intensity, Relative Mix, and Economic Determinants. Journal of
Business, 73(4): 661-693.
3. Carpenter, J. N. (1998). The Exercise and Valuation of Executive Stock Options. Journal of
Financial Economics, 48(2): 127-158.
4. Chan, W. (1996). External Recruitment versus Internal Promotion. Journal of Labor Eco-
nomics, 14: 555-570.
5. Cuny, C. J. and P. Jorion (1995). Valuing Executive Stock Options with a Departure Decision.
Journal of Accounting and Economics, 20: 193-205.
6. Fox, J. (1997). How to Manage Your Stock Options. Fortune, 136(12): 167-173.
7. Hall, B. J. and K. J. Murphy (2000). Optimal exercise prices for executive stock options.
American Economic Review, 90(2): 209-214.
8. Hamill, J. R. and J. S. Sternberg (1995). How taxes influence whether to exercise executive
stock options. Journal of Taxation of Investments, 12(3): 187-199
9. Healy, P. (1985). The Effect of Bonus Schemes on Accounting Decisions. Journal of Account-
ing and Economics, 7:85-107.
10. Heath, C., S. J. Huddart and M. Lang (1999). Psychological Factors and Stock Option
Exercise. The Quarterly Journal of Economics, 114(2): 601-627
11. Helik, J. (1999). How to compensate your CEO. Benefits Canada, 23:51-53.
12. Hemmer, T., S. Matsunaga and T. Shevlin (1994). Estimating the ”Fair Value” of Employee
Stock Options with Expected Early Exercise. Accounting Horizons, 8(4): 23-37.
13. Hemmer, T., S. Matsunaga and T. Shevlin (1996). The influence of risk diversification on
the early exercise of employee stock options by executive officers. Journal of Accounting and
Economics, 21(1): 45-68.
20
14. Hemmer, T., S. Matsunaga and T. Shevlin (1998). Optimal Exercise and the Cost of Granting
Employee Stock Options with a Reload Provision. Journal of Accounting Research, 36(2):
231-255.
15. Huddart, S. (1994). Employee Stock Options. Journal of Accounting and Economics, 18:
207-231.
16. Huddart, S. (1998). Tax Planning and the Exercise of Employee Stock Options. Contempo-
rary Accounting Research, 15(2): 203-216
17. Huddart, S. and M. Lang (1996). Employee stock option exercises: An Empirical Analysis.
Journal of Accounting and Economics, January, 21(1) : 5-44
18. Jensen, M. and W. Meckling (1976). Theory of the Firm: Managerial Behavior, Agency Costs
and Ownership Structure. Journal of Financial Economics, 3:305-360.
19. Klassen, K. and A. Mawani (2000). The Impact of Financial and Tax Reporting Incentives
on Option Grants to Canadian CEOs. Contemporary Accounting Research, 17(2): 227-263.
20. Kole, S. R. (1997). The Complexity of Compensation Contracts. Journal of Financial Eco-
nomics, 43:79-104.
21. Lazaer, E. P. and S. Rosen (1981). Rank-order tournaments as oprtimal labor contracts.
Journal of Political Economy, 89: 841-864
22. Matsunaga, S. (1995). The Effects of Financial Reporting Costs on the Use Employee Stock
Options. The Accounting Review, 70: 1-26.
23. Mawani, A. (1998). Cancellation of Executive Stock Options: Tax and Accounting Income
Considerations. Working paper, University of British Columbia.
24. Murphy, K. (1999). Executive Compensation. Handbook of Labor Economics. North-Holland,
Amsterdam, Netherlands.
25. Parrino, R. (1997). CEO Turnover and Outside Succession: A Cross-Sectional Analysis.
Journal of Financial Economics, 46: 165-197.
26. Rappaport, A. (1999). New Thinking on How to Link Executive Pay with Performance.
Harvard Business Review, Boston; Mar/Apr 1999.
21
27. Rosen, S. (1986). Prizes and Incentives in Elimination Tournaments. American Economic
Review, 76: 701-715.
28. Scott, T. W and P. Tiessen (1999). Human Capital, Performance, and Executive Compensa-
tion. Working paper University of Alberta. 67p.
29. Smith, C. and R. Watts (1992). The Investment Opportunity Set and Corporate Financing,
Dividend, and Compensation Policies. Journal of Financial Economics, 33:263-292.
30. Tsoulouhas, T., A. Agrawal and C. R. Knoeber (2000). Contests to Become CEO. Mimeo,
North Caroline State University.
31. Yermack, D. (1995). Do Corporations Award CEO Stock Options Effectively? Journal of
Financial Economics, 39: 237-269.
32. Yermack, D. (1997). Good timing: CEO stock option awards and company news announce-
ments. The Journal of Finance, 52:449-476.
7 Appendix
Table 1. Summary Statistics
Variable Mean MedianStandardDeviation
ExerRatio 0.1502 0.0000 0.2878CeoExt−1 0.0987 0.0000 0.2652Size 8.8096 8.0828 9.3096Cash 0.2708 0.1835 0.3655
Unvested 0.1809 0.0019 1.0104NewCeo 0.1185 0.0000 0.3233CeoCob 0.4166 0.0000 0.4932PcCeo 0.1479 0.0143 0.2420PcBoard 0.2893 0.1945 0.2891PcBlock 0.4461 0.4535 0.2872Multiple 0.1828 0.0000 0.3866UnrBoard 0.6336 0.6667 0.1841
The number of usable observations is not the same for each variable due to missing values.The number of observations goes from 1433 to 1510.
22
Table 2. The determinants of non-CEO managers option exerciseDependent variable is ExerRatio = Exercised
Exercised+V ested.
Variable Model 1 Model 2 Model 3
Intercept-0.3428∗∗∗
(0.0862)-0.4202∗∗∗
(0.0851)-0.2924∗∗∗
(0.0961)
ExCeot−10.1140∗∗∗
(0.0279)0.1075∗∗∗
(0.0281)0.1072∗∗∗
(0.0281)
Size0.0248∗∗∗
(0.0048)0.0321∗∗∗
(0.0042)0.0243∗∗∗
(0.0050)
Cash0,0413∗
(0.0226)0,0471∗∗
(0.0233)
Unvested0.0326∗∗
(0.0163)0.0293∗
(0.0164)
NewCeo0.0456∗∗
(0.0233)0.0423∗
(0.0233)
CeoCob0.0207(0.0165)
0.0210(0.0165)
PcCeo0.0258(0.0442)
0.0301(0.0442)
PcBoard0.0005(0.0396)
-0.0162(0.0399)
PcBlock-0.0834∗∗∗
(0.0298)-0.0826∗∗∗
(0.0299)
Multiple-0.0092(0.0204)
-0.0079(0.0204)
UnrBoard-0.0350(0.0427)
-0.0257(0.0427)
R2
N0.0581416
0.0611409
0.0651409
The standard error is in parentheses.*, **, *** are significant at the 10 %, 5 % and 1 % level respectively.The differences in the sample size come from missing observations.
23
Initial period
Each agent i ∈ 0, 1, 2is endowed with
initial stock options ni
at strike price K
and shares mi
The initial priceof the stock is P
Period 1Nature choosesstock returnb < 0 < g
Agents choosesimultaneouslyto exercise theirstock optionsand/or to sell
their shares or notPeriod 2
CEO retires withprobability s if heexercised his optionsor sold his sharesin period 1
Agent i ∈ 1, 2becomes the new
CEO with probability12
³ni
ni+n−i+εn+ mi
mi+m−i+εm
´Nature choosesstock returnb < 0 < g
Agents exercisetheir remaining stockoptions and sell theirremaining shares
Period 2CEO stays if
he did not exerciseor sell anythingin period 1
CEO stays withprobability 1− s if heexercised his optionsor sold his shares
in period 1
No new CEOis appointed
Nature choosesstock returnb < 0 < g
Agents exercisetheir remaining stockoptions and sell theirremaining shares
24
FIGURE 1
FIGURE 2
Relative Compensation of Executives (Salary & Bonus)
0,00
20,00
40,00
60,00
80,00
100,00
120,00
140,00
1994 1995 1996 1997 1998 1999
Proxy Year
Rel
ativ
e C
om
pen
sati
on
(1
994=
100)
CEO Non-CEO Executives
Absolute Compensation of Executives (Salary & Bonus)
0 $
100 000 $
200 000 $
300 000 $
400 000 $
500 000 $
600 000 $
700 000 $
1994 1995 1996 1997 1998 1999
Proxy Year
Ab
solu
te C
om
pen
satio
n
CEO Non-CEO Executives
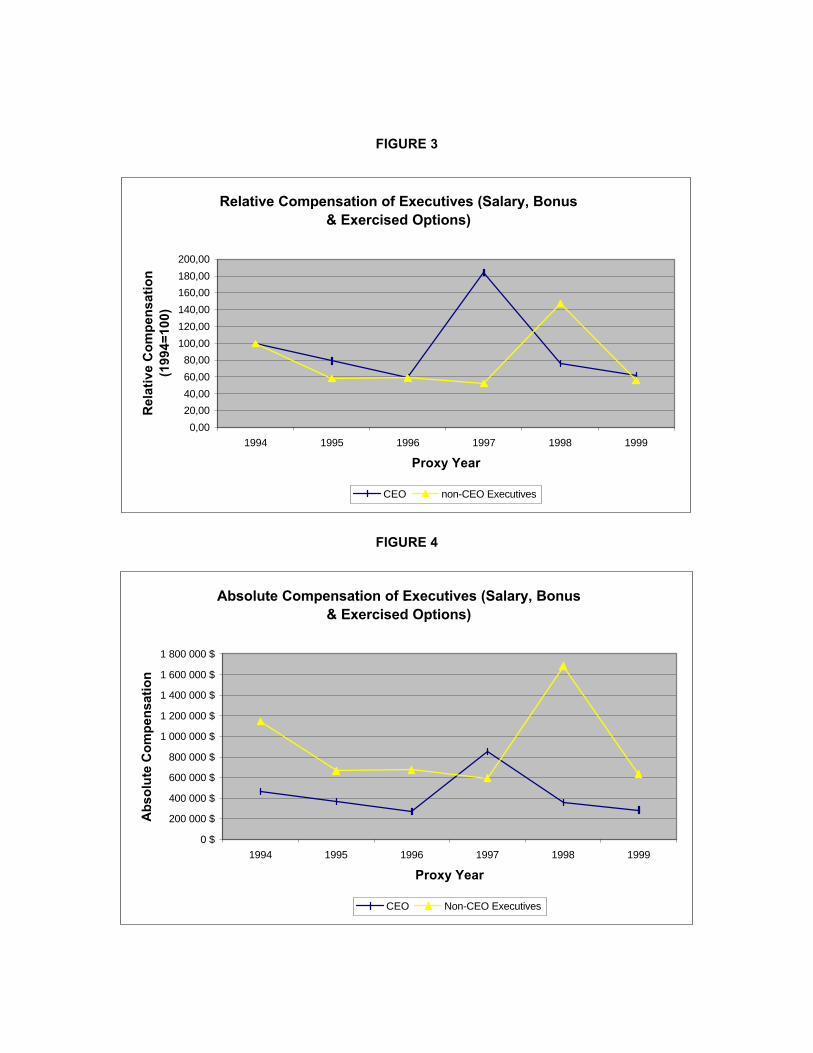
FIGURE 3
FIGURE 4
Relative Compensation of Executives (Salary, Bonus & Exercised Options)
0,00
20,00
40,00
60,00
80,00
100,00
120,00
140,00
160,00
180,00
200,00
1994 1995 1996 1997 1998 1999
Proxy Year
Rel
ativ
e C
om
pen
sati
on
(1
994=
100)
CEO non-CEO Executives
Absolute Compensation of Executives (Salary, Bonus & Exercised Options)
0 $
200 000 $
400 000 $
600 000 $
800 000 $
1 000 000 $
1 200 000 $
1 400 000 $
1 600 000 $
1 800 000 $
1994 1995 1996 1997 1998 1999
Proxy Year
Ab
solu
te C
om
pen
sati
on
CEO Non-CEO Executives
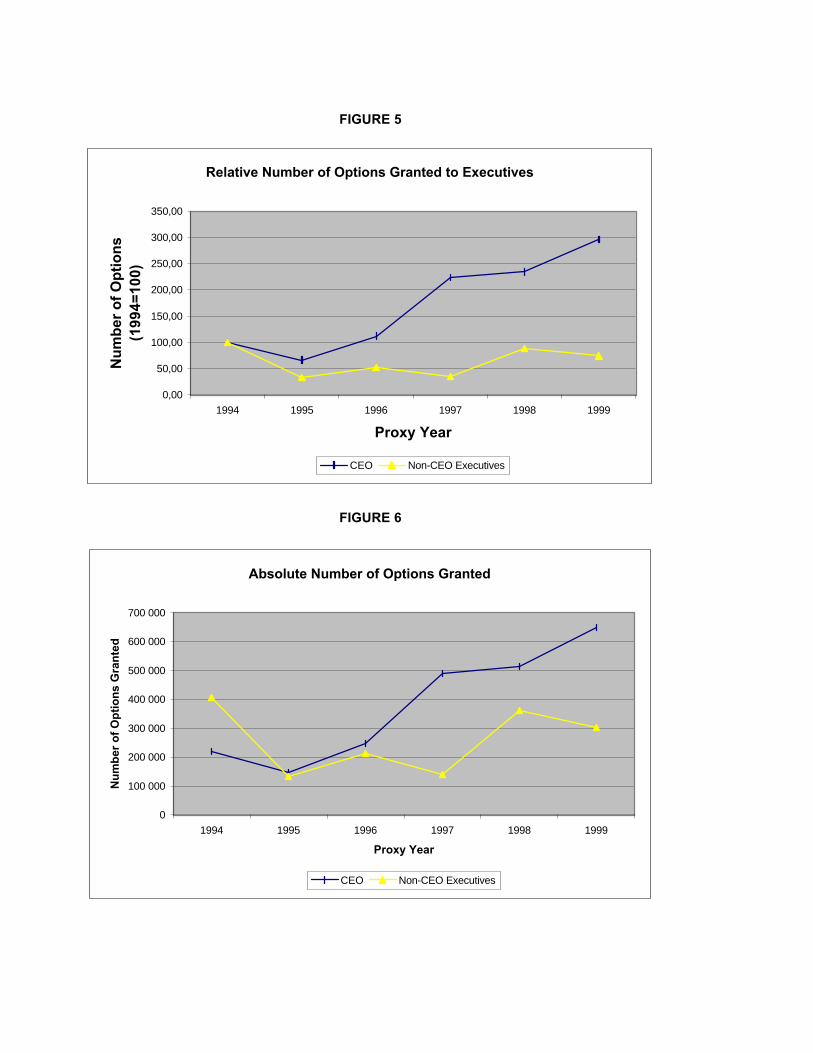
FIGURE 5
FIGURE 6
Relative Number of Options Granted to Executives
0,00
50,00
100,00
150,00
200,00
250,00
300,00
350,00
1994 1995 1996 1997 1998 1999
Proxy Year
Nu
mb
er o
f O
pti
on
s (1
994=
100)
CEO Non-CEO Executives
Absolute Number of Options Granted
0
100 000
200 000
300 000
400 000
500 000
600 000
700 000
1994 1995 1996 1997 1998 1999
Proxy Year
Nu
mb
er o
f O
pti
on
s G
ran
ted
CEO Non-CEO Executives
Company ID Years Company ID Years1 ALLELIX BIOPHARMACEUTICAL 1001 1992-1999 184 J D S FITEL INC 4020 1998-19992 ALTAREX CORP 1002 1996-1999 185 JETFORM CORP 4021 1997-19993 AXCAN PHARMA INC 1003 1996-1999 186 KASTEN CHASE APPLIED RSH LTD 4022 1997-19994 BIOCHEM PHARMA INC 1004 1992-1999 187 LG TECHNOLOGIES GROUP INC 4023 1997-19985 BIOMIRA INC 1005 1992-1999 188 LEITCH TECHNOLOGY CORP 4024 1994-19986 BIOVAIL CORP 1006 1993-1999 189 MDS INC 4025 1995-19977 CANGENE CORP 1007 1994-1999 190 MOSAID TECHNOLOGIES INC 4026 1993-19998 DRAXIS HEALTH INC 1008 1994-1999 191 MEMOTEC COMMUNICATIONS INC 4027 1993-19999 DRUG ROYALTY CORPORATION INC 1009 1992-1999 192 MITEL CORP 4028 1992-199910 HAEMACURE CORP 1010 1996-1999 193 NBS TECHNOLOGIES INC 4029 1994-199911 HEMOSOL INC 1011 1992-1999 194 NORSAT INTL INC 4030 1994-199912 HYAL PHARMACEUTICAL CP 1012 1992-1998 195 Nortel networks 4031 1994-199913 IBEX TECHNOLOGIES INC 1013 1992-1999 196 PERLE SYSTEMS LTD 4032 1994-199814 ID BIOMEDICAL CORP 1014 1994-1999 197 PROMIS SYSTEMS LIMITED 4033 1993-199515 LABOPHARM INC 1015 1996-1999 198 SIDUS SYSTEMS INC 4034 1993-199716 AETERNA LABORATORIES INC 1016 1996-1999 199 SPAR AEROSPACE LTD 4035 1993-199917 NU-LIFE CORPORATION 1017 1995-1999 200 SPECTRUM SIGNAL PROCESSING 4036 1996-199918 PATHEON INC 1018 1992-1999 201 SPEEDWARE CORP 4037 1996-199919 PHOENIX INTL. SCIENCES 1019 1995-1999 202 STRATOS GLOBAL CORP 4038 1997-199920 STRESSGEN BIOTECH CP -CL A 1020 1997-1999 203 TEKLIGIX INTERNATIONAL INC 4039 1995-199821 ORALIFE GROUP INC 1021 1996-1998 204 TROJAN TECHNOLOGIES INC 4040 1995-199922 ABITIBI CONSOLIDATED INC 2001 1997-1999 205 WESCAM INC 4041 1995-199923 ABITIBI-PRICE INC. 2002 1993-1996 206 I.S.G TECHNOLOGIES INC 4042 1993-199424 AINSWORTH LUMBER CO LTD 2003 1993-1999 207 S R TELECOM INC 4043 1993-199925 ALLIANCE FOREST PRODS INC 2004 1994-1999 208 ALGO GROUP INC -CL A 5001 1993-199926 BOWATER CANADA INC 2005 1993-1996 209 VAN HOUTTE LTEE A L 5002 1993-199827 CANFOR CORP 2006 1993-1999 210 ADVENTURE ELECTRONICS INC 5003 1994-199628 ST-LAURENT PAPERBOARD INC 2007 1994-1999 211 ANDRES WINES LTD 5004 1993-199829 CASCADES INC 2008 1993-1999 212 BC SUGAR REFINERY LIMITED 5005 1994-199630 C M L INDUSTRIES LTD 2009 1993-1999 213 BEAMSCOPE CANADA INC 5006 1993-199831 CONSOLIDATED RAMBLERS MINES LTD 2010 1993-1997 214 BIG ROCK BREWERY LTD 5007 1996-199932 CRESTBOOK FOREST INDUST. LTD 2011 1993-1997 215 CAMCO INC 5008 1993-199933 DOMAN INDUSTRIES -CL B 2012 1993-1999 216 CANADA BREAD LTD 5009 1993-199934 DOMTAR INC 2013 1993-1999 217 CANADIAN MANOIR INDS 5010 1994-199935 DONOHUE INC -CL A 2014 1993-1999 218 CANBRA FOODS LTD 5011 1993-199836 FLETCHER CHALLNGE CDA -CL A 2015 1992-1999 219 CASCADIA BRANDS INC 5012 1994-199737 NORANDA INC 2016 1993-1997 220 CFM MAJESTIC INC 5013 1996-199938 HARMAC PACIFIC INC 2017 1994-1998 221 CHAI NA TA CORP 5014 1993-199939 INTL FOREST PRODUCTS -CL A 2018 1993-1999 222 CINRAM INTERNATIONAL INC 5015 1995-199940 REPAP ENTERPRISES 2019 1993-1999 223 CLEARLY CDN BEVERAGE CP 5016 1994-199941 PERKINS PAPERS LTD 2020 1997-1999 224 CONSUMERS PACKAGING INC 5017 1993-199942 MACMILLAN BLOEDEL LIMITED 2021 1993-1998 225 CORBY (H,) DISTILLERY -CL A 5018 1996-199943 MALETTE QUEBEC INC 2022 1993-1998 226 COTT CORP QUE 5019 1993-199944 PACIFIC FOREST PRODUCTS LTD 2023 1993-1996 227 DOMCO TARKETT INC 5020 1996-199945 PAPERBOARD INDUSTRIES INTL 2024 1993-1999 228 DOREL INDUSTRIES -CL B 5021 1993-199946 PRIMEX FOREST PRODS LTD 2025 1993-1999 229 DOVER INDUSTRIES LTD 5022 1994-199947 RIVERSIDE FOREST PRODS LTD 2026 1993-1999 230 FANTOM TECHNOLOGIES INC 5023 1993-199948 ROLLAND INC 2027 1993-1999 231 FAR WEST INDUSTRIES INC 5024 1993-199949 ROMAN CORPORATION LTD 2028 1993-1999 232 FLETCHER CHALLENGE FIN CAN 5025 1996-199850 SINO-FOREST CORP -CL A 2029 1994-1999 233 FPI LTD 5026 1993-199951 SLOCAN FOREST PRODS LTD 2030 1993-1999 234 WESTON (GEORGE) LTD 5028 1993-199952 STELLA-JONES INC 2031 1993-1999 235 HOME PRODUCTS INC 5029 1993-199653 STONE-CONSOLIDATED CORP. 2032 1993-1996 236 IBEX TECHNOLOGIES INC 5030 1995-199954 TAIGA FOREST PRODUCTS LTD 2033 1993-1999 237 IMASCO LIMITED 5031 1993-199855 TEMBEC INC -CL A 2034 1993-1999 238 INTL COMFORT PRODUCTS CORP. 5032 1996-199856 TIMBERWEST FOREST CORPORATION 2035 1993-1995 239 INTL WALLCOVERINGS LTD 5033 1994-199757 UNIFORET INC -CL A 2036 1995-1999 240 IRWIN TOY LTD -NVTG 5034 1993-199958 WEST FRASER TIMBER CO 2037 1993-1999 241 LEF MCLEAN BROTHERS INTL. INC 5035 1995-199859 HJ FOREST PRODUCTS INC 2038 1994-1996 242 LINAMAR CORP 5036 1993-199960 SCOTT PAPER LIMITED 2039 1993-1994 243 MAGNA INTERNATIONAL -CL A 5037 1993-199961 ABL CANADA INC 3001 1993-1999 244 MAPLE LEAF FOODS INC 5038 1993-199962 ARC INTERNATIONAL CORP 3002 1998-1999 245 MICROTEC ENTERPRISES INC 5039 1996-199963 ACETEX CORP 3003 1995-1999 246 NATIONAL FIBRE TECH INC 5040 1993-1995

64 ALGOMA STEEL INC 3004 1993-1999 247 NATIONAL SEA PRODUCTS LTD 5041 1993-199765 ALPINE OIL SERVICES CORP 3005 1993-1999 248 NOBLE CHINA INC 5042 1993-199966 AMERICAN SENSORS INC 3006 1993-1995 249 NOMA INDUSTRIES LIMITED 5043 1993-199767 ANCHOR LAMINA INC 3007 1993-1996 250 NORWALL GROUP INC 5044 1993-199968 AT PLASTICS INC 3008 1993-1999 251 PEERLESS CARPET CORP. 5045 1993-199769 ATS AUTOMATION TOOLING SYS 3009 1993-1998 252 PREMDOR INC 5046 1993-199970 AUTREX INC 3010 1993-1995 253 QLT INC 5047 1993-199971 AVCORP INDUSTRIES INC 3011 1997-1999 254 ROTHMANS INC 5048 1993-199972 BALLARD POWER SYSTEMS INC 3012 1993-1999 255 SCHNEIDER CORP -CL A 5049 1994-199973 BEARING POWER (CANADA) LIMITED 3013 1994-1995 256 SEMI-TECH CORP -CL A 5050 1994-199774 BOMBARDIER INC -CL B 3014 1993-1999 257 SHERMAG INC 5051 1995-199975 BRAMPTON BRICK LTD -CL A 3015 1993-1999 258 SIGNATURE BRANDS LIMITED 5052 1993-199676 BUDD CANADA INC 3016 1994-1999 259 SLEEMAN BREWERIES LTD 5053 1996-199977 BUHLER INDUSTRIES INC 3017 1994-1996 260 SUN ICE LIMITED 5054 1993-199878 CO-STEEL 3018 1993-1999 261 SUN-RYPE PRODUCTS LTD 5055 1995-199879 CABLETEL COMMUNICATIONS CORP 3019 1994-1999 262 TECSYN INTERNATIONAL INC 5056 1993-199980 CELANESE CANADA INC 3020 1993-1997 263 TEE-COMM ELECTRONICS INC 5057 1993-199581 CFS GROUP INC 3021 1993-1999 264 MOLSON INC -CL A 5058 1993-199982 CHAMPION ROAD MACHINERY LTD 3022 1994-1995 265 NU-GRO CORPORATION 5059 1993-199983 CIRCUIT WORLD CORPORATION 3023 1995-1999 266 SEAGRAM CO LTD 5060 1994-199884 COGNOS INC 3024 1993-1999 267 VINCOR INTL INC 5061 1995-199885 COMPAS ELECTRONICS INC 3025 1993-1995 268 YOGEN FRUZ WORLD WIDE INC 5062 1994-199986 CONSOLTEX GROUP INC 3026 1993-1998 269 CCL INDUSTRIES -CL B 6001 1993-199987 DERLAN INDUSTRIES LTD 3027 1993-1997 270 COREL CORP 6002 1993-199988 DEVELCON ELECTRONICS LTD 3028 1997-1998 271 DOMINION TEXTILE INC 6003 1993-199689 DEVJO INDUSTRIES INC 3029 1993-1999 272 HARD SUITS INC 6004 1993-199690 DEVTEK CORP -SUB VTG 3030 1994-1999 273 OSF INC 6005 1996-199891 DOFASCO INC 3031 1993-1999 274 P F B CORPORATION 6006 1995-199992 DRECO ENERGY SERVICES LTD 3032 1994-1996 275 POLYAIR INTER PACK INC 6007 1996-199993 DUPONT CANADA -CL A 3033 1993-1999 276 SICO INC 6008 1993-199994 EAGLE PRECISION TECH INC 3034 1993-1999 277 SIMMONDS CAPITAL LTD 6009 1995-199995 EMCO LTD 3035 1993-1999 278 SMED INTERNATIONAL INC 6010 1996-199896 EXCO TECHNOLOGIES LTD 3036 1994-1999 279 W F I INDUSTRIES LTD 6011 1994-199997 FALVO CORPORATION 3037 1993-1996 280 ST CLAIR PAINT & WALLPAPER CORP. 6012 1993-199598 FOREMOST INDUSTRIES INC CDA 3038 1993-1999 281 ALIMENTN COUCHE-TARD -SVTG 7001 1996-199899 GANDALF TECHNOLOGIES INC 3039 1993-1995 282 AUTOSTOCK INC 7002 1993-1996100 GEAC COMPUTER CORP LTD 3040 1993-1998 283 CANADIAN TIRE CORP -CL A 7003 1995-1999101 THE VERSATECH GROUP INC 3041 1993-1997 284 CASSIDYS LTD 7004 1993-1998102 GREAT PACIFIC ENTERPRISES INC 3042 1994-1996 285 CHAPTERS INC 7005 1996-1998103 LAPERRIERE&VERREAULT -CL A 3043 1993-1998 286 CHATEAU STORES CDA -CL A 7006 1993-1999104 GSW INC -CL B 3044 1996-1999 287 DENNINGHOUSE INC 7007 1995-1999105 GWIL INDUSTRIES INC 3045 1993-1998 288 DYLEX LTD 7008 1993-1999106 H.PAULIN & CO.LIMITED 3046 1996-1998 289 EMPIRE COMPANY LTD -CL A 7009 1993-1998107 HALEY INDUSTRIES LTD 3047 1993-1999 290 FINNING INL INC 7010 1994-1999108 HALLMARK TECHNOLOGIES INC 3048 1994-1999 291 FUTURE SHOP LTD 7011 1993-1998109 HAMMOND MFG LTD -CL A 3049 1994-1999 292 GENDIS INC -CL A 7012 1993-1999110 HARRIS STEEL GROUP -CL A 3050 1993-1999 293 GESCO INDUSTRIES INC 7013 1997-1999111 HAWKER SIDDELEY CANADA 3051 1993-1999 294 GLENTEL INC 7014 1993-1999112 INTERTAPE POLYMER GROUP INC 3052 1993-1999 295 HARTCO ENTERPRISES INC 7015 1993-1998113 INVERPOWER CONTROLS LTD 3054 1995-1999 296 HUDSONS BAY CO 7016 1993-1999114 IPSCO INC 3055 1993-1999 297 HY & ZELS INC 7017 1993-1999115 IVACO INC -CL A 3056 1993-1999 298 JEWETT CAMERON TRADING LTD 7018 1996-1997116 JANNOCK PPTYS LTD 3057 1993-1998 299 LEONS FURNITURE LTD 7019 1993-1999117 KAUFEL GROUP LTD 3058 1994-1997 300 LIQUIDATION WORLD INC 7020 1996-1999118 KIMPEX INTERNATIONAL INC 3059 1993-1997 301 LOBLAW COS LTD 7021 1993-1999119 LAFARGE CDA INC -EX PREF 3060 1994-1999 302 MARKS WORK WEARHOUSE LTD 7022 1993-1999120 LEROUX STEEL (ACIER) -CL B 3061 1995-1999 303 METRO INC -CL A 7023 1994-1999121 GSI LUMONICS INC 3062 1995-1999 304 MOHAWK Canada LIMITED 7024 1996-1997122 MAAX INC 3063 1993-1998 305 PANTORAMA INDUSTRIES INC 7025 1993-1998123 MAGELLAN AEROSPACE 3064 1996-1999 306 PET VALU CANADA INC 7026 1996-1999124 MERIDIAN TECHNOLOGIES INC 3065 1996-1997 307 PROVIGO INC 7027 1994-1997125 METHANEX CORP 3066 1993-1999 308 REITMANS (CANADA) -CL A 7028 1993-1999126 MILLTRONICS LTD 3067 1993-1998 309 RICHELIEU HARDWARE LTD 7029 1993-1999127 NEEDLER GROUP LIMITED 3068 1993-1995 310 R T O ENTERPRISES INC 7030 1995-1999
128 NEWBRIDGE NETWORKS CORP. 3069 1993-1999 311 SEARS CDA INC 7031 1993-1999129 NOVA CHEMICALS CORP 3070 1993-1999 312 SILCORP LIMITED 7032 1993-1995130 NQL DRILLING TOOLS -CL A 3071 1993-1998 313 SUZY SHIER LTD 7034 1994-1999131 PLAINTREE SYSTEMS INC 3072 1993-1999 314 FORZANI GROUP LTD -CL A 7035 1993-1999132 PRUDENTIAL STEEL LTD 3073 1994-1999 315 JEAN COUTU GROUP 7036 1993-1998133 RE-CON BUILDING PRODUCTS INC 3074 1996-1999 316 THE OSHAWA GROUP LIMITED 7037 1993-1997134 REKO INTERNATIONAL GROUP INC 3075 1997-1999 317 SECOND CUP LTD 7038 1993-1998135 ROYAL GROUP TECH LTD 3076 1997-1999 318 T S C SHANNOCK CORP -CL A 7040 1993-1997136 SAMUEL MANU-TECH INC 3077 1993-1999 319 U A P INC 7041 1993-1997137 SCINTREX LIMITED 3078 1993-1996 320 UNI SELECT INC 7042 1993-1999138 SENVEST CAP INC 3079 1997-1999 321 WESTBURNE INC 7043 1993-1999139 SHAW INDUSTRIES LTD -CL A 3080 1993-1999 322 WHITE ROSE CRFTS&NRSY 7044 1995-1999140 SKYJACK INC 3081 1993-1999 323 ALLIANCE ATLANTS COMM -CL B 8001 1993-1996141 SLATER STEEL INC 3082 1993-1999 324 AMTELECOM GROUP INC 8002 1993-1999142 ST LAWRENCE CEM GRP -CL A 3083 1993-1999 325 ASTRAL MEDIA INC -CL A 8003 1993-1999143 STACKPOLE LTD 3084 1993-1999 326 BATON BROADCATING INC 8004 1994-1998144 STELCO INC -CL A 3085 1993-1999 327 CANWEST GLOBAL COM -NVTG 8005 1993-1999145 TARO INDUSTRIES LIMITED 3086 1993-1996 328 CFCF INC 8006 1995-1996146 TELEGLOBE INC 3087 1993-1999 329 CHUM LTD -CL B 8007 1994-1999147 TESCO CORP 3088 1993-1999 330 CINAR CORP -CL B 8008 1993-1995148 TESMA INTERNATNAL INC -CL A 3089 1995-1999 331 CINEPLEX ODEON CORPORATION 8009 1993-1996149 CANAM MANAC GROUP INC -CL A 3090 1993-1999 332 COGECO CABLE INC 8010 1995-1999150 WESTAIM CORP 3091 1996-1999 333 COSCIENT GROUP INC 8011 1997-1998151 TIMMINCO LTD 3092 1993-1999 334 ELECTROHOME LTD -CL Y 8012 1994-1997152 TOROMONT INDUSTRIES LTD 3093 1993-1999 335 FUNDY CABLE LTD 8013 1994-1996153 TRIAM AUTOMOTIVE INC 3094 1994-1996 336 GTC TRANSCONTINL GP -CL A 8014 1994-1999154 TRIMIN ENTERPRISES INC 3095 1993-1999 337 HOLLINGER INC 8015 1993-1999155 TRITECH PRECISION INC 3096 1994-1999 338 VIDEOTRN (LE GRPE) LTD 8016 1993-1999156 UNICAN SECURITY SYS -CL B 3097 1996-1998 339 MDC CORP 8017 1996-1999157 UNITED CANADIAN SHARES LIMITED 3098 1993-1995 340 MCGRAW-HILL RYERSON LTD 8018 1993-1999158 UNITED DOMINION INDUSTRIES 3099 1993-1999 341 MOFFAT COMMUNICATIONS 8019 1994-1999159 VELAN INC -SVTG 3100 1996-1998 342 MOFFAT COMMUNICATIONS 8019 1994-1999160 VENTRA GROUP INC 3101 1993-1999 343 OKANAGAN SKEENA GROUP LTD 8020 1994-1998161 WESCAST INDUSTRIES -CL A 3102 1994-1999 344 OKANAGAN SKEENA GROUP LTD 8020 1994-1998162 WESTERN STAR TRUCKS HLDGS LTD 3103 1994-1999 345 PARAGON ENTERTAINMENT CORP. 8021 1993-1996163 WINPAK LTD 3104 1993-1999 346 PARAGON ENTERTAINMENT CORP. 8021 1993-1996164 ZENON ENVIRONMENTAL INC 3105 1993-1999 347 QUEBECOR INC -CL B 8022 1993-1999165 ATI TECHNOLOGIES INC 4001 1993-1999 348 QUEBECOR INC -CL B 8022 1993-1999166 AIT ADVANCED INFO TECH CORP 4002 1994-1999 349 QUEBECOR WORLD INC -SUB VTG 8023 1993-1999167 AZCAR TECHNOLOGIES INC 4003 1996-1999 350 QUEBECOR WORLD INC -SUB VTG 8023 1993-1999168 ARCHITEL SYSTEMS CORP 4004 1996-1999 351 REGIONAL CABLESYSTEMS INC 8024 1996-1999169 BATTERY TECHNOLOGIES INC 4005 1997-1999 352 REGIONAL CABLESYSTEMS INC 8024 1996-1999170 CAE INC 4006 1993-1999 353 ROGERS COMMUNICATION -CL B 8025 1993-1999171 C-MAC INDUSTRIES INC 4007 1994-1999 354 ROGERS COMMUNICATION -CL B 8025 1993-1999172 CRS ROBOTICS CORP 4008 1995-1999 355 SHAW COMMUNICATN INC -CL B 8026 1994-1999173 CALIAN TECHNOLOGY LTD 4009 1994-1999 356 SHAW COMMUNICATN INC -CL B 8026 1994-1999174 BAE SYSTEMS CANADA INC 4010 1994-1999 357 SOUTHAM INC 8027 1993-1997175 CANADIAN SATELLITE COMMUN 4011 1993-1999 358 SOUTHAM INC 8027 1993-1997176 CORECO INC 4012 1996-1999 359 TELEMEDIA INC 8029 1994-1996177 DALSA CORP 4013 1996-1999 360 TELEMEDIA INC 8029 1994-1996178 DY 4 SYSTEMS INC 4014 1993-1999 361 THOMSON CORP 8030 1993-1998179 DIGITAL PROCESSING SYS INC 4015 1996-1999 362 THOMSON CORP 8030 1993-1998180 ELECTROHOME LTD -CL Y 4016 1993-1999 363 TORSTAR CORP -CL B 8031 1993-1999181 EPIC DATA INTERNATIONAL INC 4017 1996-1999 364 TORSTAR CORP -CL B 8031 1993-1999182 GENNUM CORP 4018 1997-1999 365 WIC WESTERN INTL COMM -CL B 8032 1994-1999183 IITC HOLDINGS LTD 4019 1995-1999 366 WIC WESTERN INTL COMM -CL B 8032 1994-1999


![LRUP v/s WebLand Comparision Reportwarangalurban.telangana.gov.in/wp-content/uploads/2017/12/... · 2ffsdqw 1dph >vie u 8f i 8² , ] c¥v h3t \ j 2ffxsdqw )1dph [_ s 8² , ] ]\ j.kdwd](https://img.pdfslide.us/doc/110x75/5acebbb87f8b9ae2138bb5be/lrup-vs-webland-comparision-1dph-vie-u-8f-i-8-cv-h3t-j-2ffxsdqw-1dph-.jpg)