Embed Size (px)
Citation preview
Study of Training and Development
FINAL REPORT
Audit and Evaluation DivisionMarch 2002

Study of Training and Development
Audit and Evaluation Division March 2002
Table of Contents
EXECUTIVE SUMMARY ..................................................................................................I
I. INTRODUCTION......................................................................................................... 1
BACKGROUND .................................................................................................................... 1OBJECTIVES AND SCOPE .................................................................................................... 1
II. METHODOLOGY........................................................................................................ 2
III. FINDINGS.................................................................................................................. 3
ACCESSIBILITY OF TRAINING ............................................................................................ 3
Employee Opinion Surveys ............................................................................................ 3Access by Group and Level ............................................................................................ 3Official Languages ......................................................................................................... 4Employment Equity ........................................................................................................ 5Availability of Information ............................................................................................ 8Required Training .......................................................................................................... 9Cost Considerations...................................................................................................... 11
EFFECTIVE MANAGEMENT .............................................................................................. 11
Planning and Support for Training and Development............................................... 12Tools, Methods and Practices to Evaluate Training................................................... 13
IV. RECOMMENDATIONS......................................................................................... 15
APPENDIX A – MANAGEMENT ACTION PLAN.......................................................17

Study of Training and Development
Audit and Evaluation Division March 2002 i
EXECUTIVE SUMMARY
Training and development are integrated elements of Statistics Canada’s corporate humanresource strategy. This strategy is supported by four pillars: entry-level recruitment of thebest and the brightest; training for skill building; career broadening to develop versatilityand to help nurture future leaders; and providing a positive work environment that helps towin the commitment of career employees.1
As a result of its efforts, the Agency has achieved recognition as a “best-practice”organization in career development.2 Notwithstanding this success, senior management iscommitted to finding ways to even further strengthen its management of training anddevelopment, as well as to identifying any opportunities that may exist to enhanceemployee access to training and development.
The objectives of the study were to assess the overall accessibility of training anddevelopment, as well as the extent to which training and development is managedeffectively. The scope of the study included formal training courses, with particularattention to flagship courses. Language training, computer-based training and survey-specific training were not included.
This work was accomplished through extensive interviews with managers, employees andtraining professionals as well as through researching of relevant training information andother documentation. Data gathering and analysis were carried out in the year 2000.
Findings on Accessibility of Training Accessibility was examined from several perspectives: group and level, employee opinionsurvey findings, employment equity, cost considerations, official languages, availability ofinformation and required training. While some improvements to the accessibility oftraining can be made, corporately the findings indicate that training is generally available.The timeliness of required training for ES recruits is acceptable, for the most part.However, the proportion of CS recruits receiving required training in a timely manner hasdeclined, over time. Some clarifications are still required concerning what constitutesrequired training and to whom it applies.
Findings on Effective Management
Two components of effective management were examined: planning and support fortraining and development; and evaluation tools, methods and practices. In general, thestudy found that planning and support for training and development at the corporate levelare incorporated into organizational plans and activities. At the divisional level, however,integrated planning and support is less evident.
Study of Training and Development
Audit and Evaluation Division March 2002 ii
Although the study did not examine the functionality of the human resources system,Global, and the sub-system, Global-Orbit, a number of those interviewed raised concernsregarding the completeness and usefulness of information in the system.
Training literature reviewed during the conduct of the study consistently underlined theimportance of using a number of different indicators to formally evaluate training. Theseinclude: participant reaction; learning; behaviour; and results. Participant reaction is themost commonly used technique within most organizations, and Statistics Canada is noexception. However, the Agency also carries out evaluation using the other threeindicators, although to a lesser extent.
Recommendations
This study makes the following four recommendations:
1. Senior management should encourage divisions that are not yet doing so, to plan andsupport training at a divisional level in order to ensure a more strategic, co-ordinatedapproach to the management of employee training.
2. For new training courses or programs, course designers should include measures toevaluate learning and behaviour (performance).
3. For existing courses, a plan should be established to identify ways in which to integrateevaluation measures that address learning and behaviour (performance).
4. Any user surveys undertaken as part of the renewal of the Global system should includeconsultations with training administrators and divisional managers in order to ensurethat the system’s capabilities better support their planning, management andinformation needs.
Appendix A contains the management action plan developed in response to theserecommendations.
Conclusion
The study’s findings on the accessibility of training are generally positive for all groups ofemployees and therefore we made no recommendations. As a helpful tool, information forline managers has been collated, focusing on promising practices and possible solutions tobarriers identified by employees. We expect it will assist managers in meeting challengesof a workplace recognized for a very positive culture surrounding human resourcesmanagement.
Study of Training and Development
Audit and Evaluation Division March 2002 iii
Of the four recommendations pertaining to effective management, the first one is mostimportant since with a coordinated approach, accountability is heightened, better planningoccurs and similar problems get addressed in a like manner. Therefore, it offers the mostpotential for improvement in divisions where such practices are not in use.
Recommendations 2 and 3 are in keeping with the federal government direction towardsperformance reporting and results-based management. There is no standard methodologyfor translating this into action, providing scope to the organization to determine what isappropriate.
1 Fellegi, Ivan. “On career development at Statistics Canada” Optimum, The Journal of Public SectorManagement, Vol. 29, No. 4 (1999), pp. 31-37
2 Lam, Nathalie et al. “Career Development in Best-practice Organizations: Critical Success Factors”Optimum, The Journal of Public Sector Management, Vol. 29, No. 4 (1999), pp. 22-30

Study of Training and Development
Audit and Evaluation Division March 2002
I. INTRODUCTION
Background
Training and development are integrated elements of Statistics Canada’s corporate humanresource strategy. This strategy is supported by four pillars: entry-level recruitment of thebest and the brightest; training for skill building; career broadening to develop versatilityand to help nurture future leaders; and providing a positive work environment that helps towin the commitment of career employees.1
As a result of its efforts, the Agency has achieved recognition as a “best-practice”organization in career development.2 Notwithstanding this success, senior management iscommitted to finding ways to even further strengthen its management of training anddevelopment, as well as to identifying any opportunities that may exist to enhanceemployee access to training and development.
Objectives and Scope
Objectives
The objectives of the study were to assess the overall accessibility of training anddevelopment, as well as the extent to which training and development is managedeffectively.
Scope
The study focussed on:
• Formal training courses e.g. computer courses, general overview courses, flagshipcourses, marketing courses, and Public Service Commission courses. Particularattention was paid to flagship courses which include: the Survey Skills DevelopmentCourse (SSDC) (households and businesses); the Survey Support Certificate Course(SSCC) Level 1; SSCC Level 2; and the Data Interpretation Workshop.
• Employees hired under the Public Service Employment Act (public servants)
The study did not focus on language training, computer-based training, and survey-specifictraining.
1 Fellegi, Ivan. “On career development at Statistics Canada” Optimum, The Journal of Public SectorManagement, Vol. 29, No. 4 (1999), pp. 31-37
2 Lam, Nathalie et al. “Career Development in Best-practice Organizations: Critical Success Factors”Optimum, The Journal of Public Sector Management, Vol. 29, No. 4 (1999), pp. 22-30

Study of Training and Development
Audit and Evaluation Division March 2002 2
Criteria
The criteria for this study reflect standards set in Statistics Canada policy and guidelines; areview of literature on training and development; and a training evaluation model widelyrecognized by training and development professionals. This model was used in an audit oftraining and development by the Office of the Auditor General in British Columbia.3
The specific criteria are as follows:
With respect to accessibility of training and development:1. That there are no barriers to access to training and career development programs for
Statistics Canada employees. 2. That employees targeted for required training as part of Statistics Canada recruitment
and development programs receive such training within the specified time frames.
With respect to effective management of training and development:3. That planning and support for training and development is a part of corporate and
divisional plans and activities. 4. That tools, methods and practices exist to assess training and development
performance.
II. METHODOLOGY
The following methods were used to carry out this study:
• A review of training and development information contained in policies; guidelines;reports; committee and meeting minutes; course calendars, outlines, and promotionalmaterial; correspondence; and web-sites;
• A total of 129 persons from 7 divisions were interviewed; these included: 21 trainers;24 training professionals; 38 divisional managers; and 46 employees;
• An examination of results from Statistics Canada and Public Service Employee OpinionSurveys;
• An analysis of data from the Global human resource system; and • Consolidation of summary data constructed from a variety of sources.
These inputs have enabled this study to: report on the extent to which the criteria weremet; provide tables related to access to training; identify barriers to training and suggestsolutions to overcome these barriers, wherever possible; and identify promising practicesrelated to training and development. Data gathering and analysis for this study was carriedout in the year 2000.
3 British Columbia. Office of the Auditor General. Maintaining Human Capital in the British ColumbiaPublic Service: The Role of Training and Development 1999/2000 Report 3.
Study of Training and Development
Audit and Evaluation Division March 2002 3
III. FINDINGS
This section provides findings related to the accessibility, and effective management, oftraining and development, primarily from a corporate perspective.
Accessibility of Training
Employee Opinion Surveys
The 1998 Statistics Canada Employee Opinion Survey and the 1999 Public ServiceEmployee Survey offer benchmarks to gauge how well Statistics Canada is faring withrespect to training and development in the view of its employees.
The 1998 Statistics Canada Survey found that 78.6% of indeterminate employees felt theywere treated fairly when requesting training although the results from all divisions were notequally positive. For example, in nine divisions, less than 69% of respondents indicatedthat they felt they received fair treatment related to their training requests, and in three ofthese nine divisions, the percentage of respondents who felt they had been treated fairlywas only 56%. This suggests that opportunities still exist for improvement in some areas.
The 1999 Public Service Employee Survey indicated that Statistics Canada rated betterthan the Public Service as a whole in response to questions about training and development.Survey results showed that 76% of Agency employees agreed with the statement “Mydepartment does a good job in supporting employee career development.” This comparedto only 48% of employees at a Public Service-wide level. In addition, the Survey showedthat 81% of Statistics Canada employees agreed that they received the training they neededto do their jobs, compared to 72% of employees across the Public Service.
Access by Group and Level
Recruitment and development programs for the ES, MA and CS professional groupsinclude formal training programs e.g. for the CS group, there is a requirement to participatein the SSDC course. As a result of program requirements, recruits in these professionalgroups generally receive more training than employees not enrolled in such programs.Although recruitment and development programs are viewed positively, some employeesbelieve recruits are “privileged” with the amount and type of training they receive.
Flagship course trainers report that the mix of participants has shifted over time to include ahigher number of new recruits than employees who have been with Statistics Canada for alonger period of time.
Study of Training and Development
Audit and Evaluation Division March 2002 4
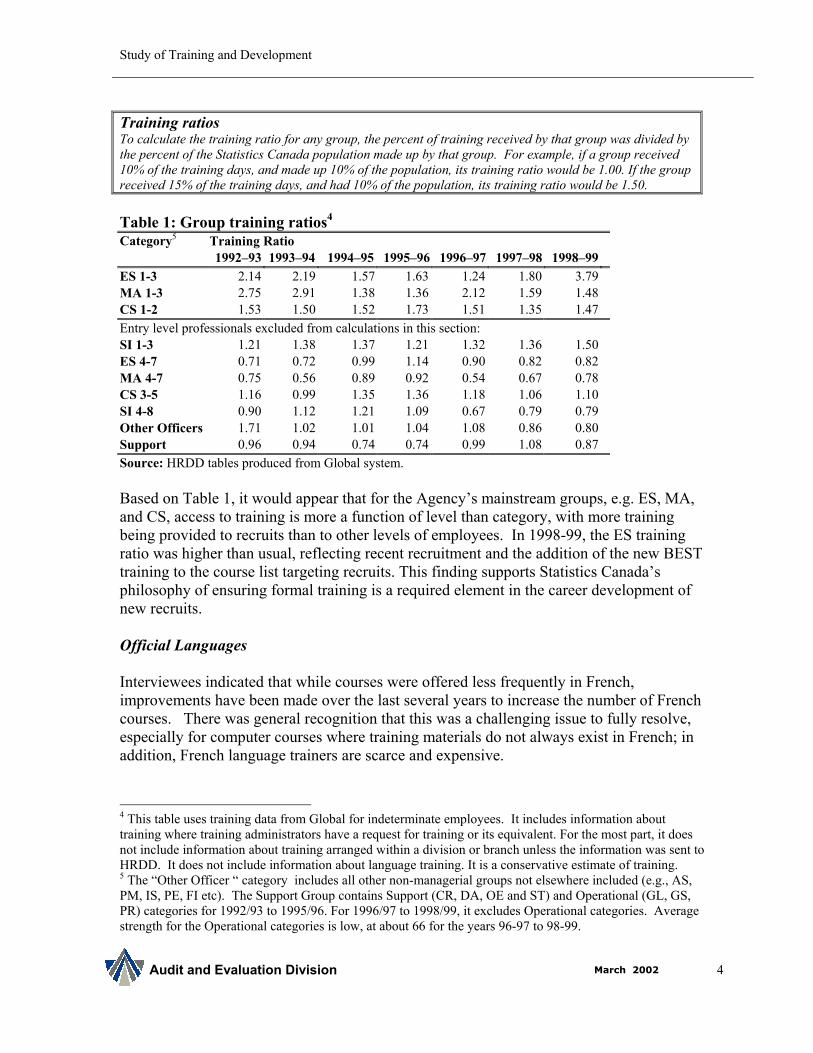
Training ratiosTo calculate the training ratio for any group, the percent of training received by that group was divided bythe percent of the Statistics Canada population made up by that group. For example, if a group received10% of the training days, and made up 10% of the population, its training ratio would be 1.00. If the groupreceived 15% of the training days, and had 10% of the population, its training ratio would be 1.50.
Table 1: Group training ratios4 Category5 Training Ratio
1992–93 1993–94 1994–95 1995–96 1996–97 1997–98 1998–99ES 1-3 2.14 2.19 1.57 1.63 1.24 1.80 3.79MA 1-3 2.75 2.91 1.38 1.36 2.12 1.59 1.48CS 1-2 1.53 1.50 1.52 1.73 1.51 1.35 1.47Entry level professionals excluded from calculations in this section:SI 1-3 1.21 1.38 1.37 1.21 1.32 1.36 1.50ES 4-7 0.71 0.72 0.99 1.14 0.90 0.82 0.82MA 4-7 0.75 0.56 0.89 0.92 0.54 0.67 0.78CS 3-5 1.16 0.99 1.35 1.36 1.18 1.06 1.10SI 4-8 0.90 1.12 1.21 1.09 0.67 0.79 0.79Other Officers 1.71 1.02 1.01 1.04 1.08 0.86 0.80Support 0.96 0.94 0.74 0.74 0.99 1.08 0.87Source: HRDD tables produced from Global system.
Based on Table 1, it would appear that for the Agency’s mainstream groups, e.g. ES, MA,and CS, access to training is more a function of level than category, with more trainingbeing provided to recruits than to other levels of employees. In 1998-99, the ES trainingratio was higher than usual, reflecting recent recruitment and the addition of the new BESTtraining to the course list targeting recruits. This finding supports Statistics Canada’sphilosophy of ensuring formal training is a required element in the career development ofnew recruits.
Official Languages
Interviewees indicated that while courses were offered less frequently in French,improvements have been made over the last several years to increase the number of Frenchcourses. There was general recognition that this was a challenging issue to fully resolve,especially for computer courses where training materials do not always exist in French; inaddition, French language trainers are scarce and expensive.
4 This table uses training data from Global for indeterminate employees. It includes information abouttraining where training administrators have a request for training or its equivalent. For the most part, it doesnot include information about training arranged within a division or branch unless the information was sent toHRDD. It does not include information about language training. It is a conservative estimate of training. 5 The “Other Officer “ category includes all other non-managerial groups not elsewhere included (e.g., AS,PM, IS, PE, FI etc). The Support Group contains Support (CR, DA, OE and ST) and Operational (GL, GS,PR) categories for 1992/93 to 1995/96. For 1996/97 to 1998/99, it excludes Operational categories. Averagestrength for the Operational categories is low, at about 66 for the years 96-97 to 98-99.
Study of Training and Development
Audit and Evaluation Division March 2002 5
Since 1997, approximately 20% of the computer courses organized by the InformationTechnology Services Division (ITSD) have been delivered in French. ITSD reported thatthe majority of Statistics Canada’s Francophones requested technical training using theEnglish version of a software package, but delivered by a qualified French instructor, usingmanuals written in French, and supported by English “screen shots”. As a point ofinterest, only 3.3% of employee computer systems are set up in French.
The availability of non-computer courses in both official languages is summarized asfollows. Eighty-six courses were listed. Of the 44 that provided course dates, the largemajority —36—offered dates in both English and French. The remaining 8 courses listedsessions in one language only, usually English. As of January 31, 2001, 41% ofindeterminate employees had French indicated as their first official language. However,some of these employees still request training in English, and overall, fewer employeesrequest training in French than in English.
Overall, considering the operational constraints within which the service providers operate,these findings show that they are reasonably successful in offering courses in both officiallanguages.
Employment Equity
To examine access to training and development by employment equity groups, data wasobtained from the Global human resource system regarding women, visible minorities,Aboriginal persons, and persons with disabilities.
This data was used to analyze, and compare, the share of training received by these groupsby occupational group and within the context of Statistics Canada as a whole. The resultsof this analysis provided generally positive findings.
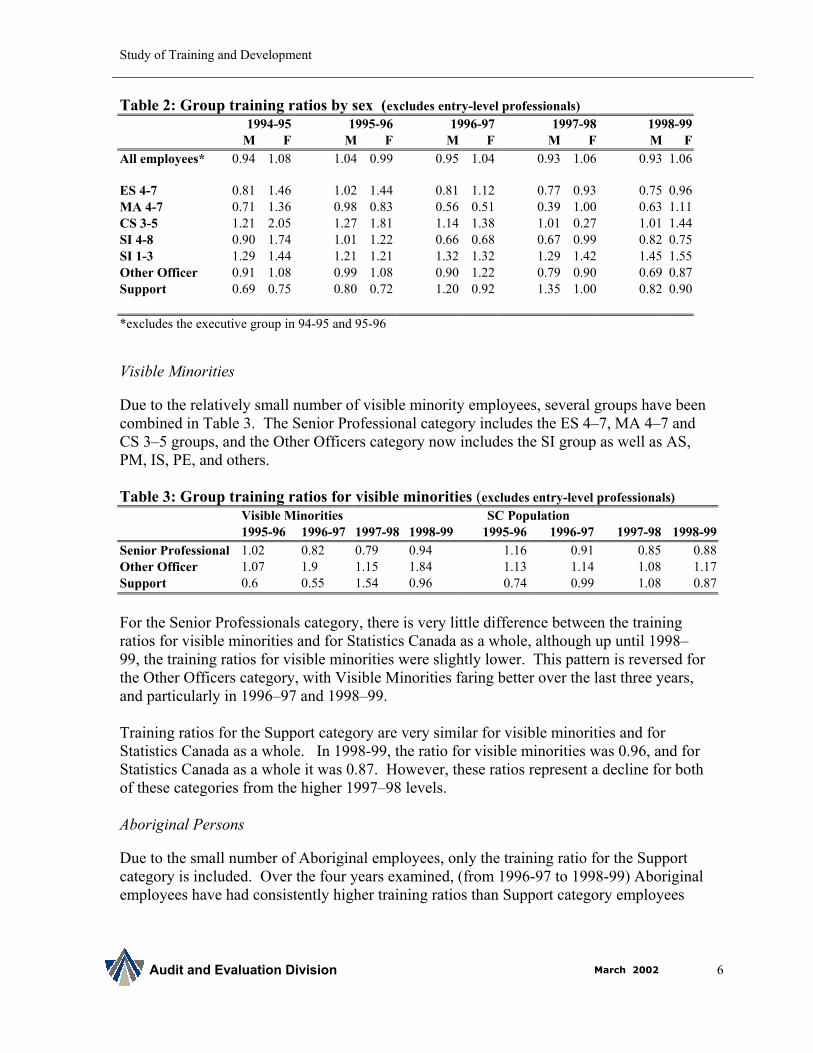
Women
Information in Table 2 excludes entry-level professionals from the calculations as thesegroups tend to have higher training ratios. This higher training ratio is due to the fact thatmost recruits are required to take formal training as part of their recruitment anddevelopment programs.
Taking all indeterminate employees at Statistics Canada into account, except for entry levelprofessionals, there is very little difference in the ratio of training provided according togender, although in some cases, the numbers indicate that women tend to have a marginaledge over their male colleagues. Similarly, within most individual occupational groups,women tend to receive more training, although this is not always the situation within theSupport category.
Study of Training and Development
Audit and Evaluation Division March 2002 6
Table 2: Group training ratios by sex (excludes entry-level professionals)1994-95 1995-96 1996-97 1997-98 1998-99
M F M F M F M F M FAll employees* 0.94 1.08 1.04 0.99 0.95 1.04 0.93 1.06 0.93 1.06
ES 4-7 0.81 1.46 1.02 1.44 0.81 1.12 0.77 0.93 0.75 0.96MA 4-7 0.71 1.36 0.98 0.83 0.56 0.51 0.39 1.00 0.63 1.11CS 3-5 1.21 2.05 1.27 1.81 1.14 1.38 1.01 0.27 1.01 1.44SI 4-8 0.90 1.74 1.01 1.22 0.66 0.68 0.67 0.99 0.82 0.75SI 1-3 1.29 1.44 1.21 1.21 1.32 1.32 1.29 1.42 1.45 1.55Other Officer 0.91 1.08 0.99 1.08 0.90 1.22 0.79 0.90 0.69 0.87Support 0.69 0.75 0.80 0.72 1.20 0.92 1.35 1.00 0.82 0.90
*excludes the executive group in 94-95 and 95-96
Visible Minorities
Due to the relatively small number of visible minority employees, several groups have beencombined in Table 3. The Senior Professional category includes the ES 4–7, MA 4–7 andCS 3–5 groups, and the Other Officers category now includes the SI group as well as AS,PM, IS, PE, and others.
Table 3: Group training ratios for visible minorities (excludes entry-level professionals)Visible Minorities SC Population1995-96 1996-97 1997-98 1998-99 1995-96 1996-97 1997-98 1998-99
Senior Professional 1.02 0.82 0.79 0.94 1.16 0.91 0.85 0.88Other Officer 1.07 1.9 1.15 1.84 1.13 1.14 1.08 1.17Support 0.6 0.55 1.54 0.96 0.74 0.99 1.08 0.87
For the Senior Professionals category, there is very little difference between the trainingratios for visible minorities and for Statistics Canada as a whole, although up until 1998–99, the training ratios for visible minorities were slightly lower. This pattern is reversed forthe Other Officers category, with Visible Minorities faring better over the last three years,and particularly in 1996–97 and 1998–99.
Training ratios for the Support category are very similar for visible minorities and forStatistics Canada as a whole. In 1998-99, the ratio for visible minorities was 0.96, and forStatistics Canada as a whole it was 0.87. However, these ratios represent a decline for bothof these categories from the higher 1997–98 levels.
Aboriginal Persons
Due to the small number of Aboriginal employees, only the training ratio for the Supportcategory is included. Over the four years examined, (from 1996-97 to 1998-99) Aboriginalemployees have had consistently higher training ratios than Support category employees

Study of Training and Development
Audit and Evaluation Division March 2002 7
for Statistics Canada as a whole. Beginning in 1995-96, the ratios for Aboriginalemployee ratios were: 1.53, 1.25, 1.37 and 1.10 compared with 0.74, 0.99, 1.08, and 0.87for Support category employees.
Persons with Disabilities
The small number of employees with disabilities has resulted in only two groups beingdisplayed in Table 4. The All Officers category now includes Senior Professionals, SIs andother officers.
Table 4: Group training ratios for persons with disabilities (excludes entry-level professionals)Persons with disabilities SC Population1995-96 1996-97 1997-98 1998-99 1995-96 1996-97 1997-98 1998-99
All Officers 0.84 0.72 0.85 1.03 1.14 1.05 1.01 1.06Support 0.59 0.9 0.77 1.06 0.74 0.99 1.08 0.87
Over time, the training ratio for employees with disabilities in the All Officers category hasincreased while the ratio for Statistics Canada as a whole has decreased slightly. By 1998–99, the two training ratios are virtually identical with a ratio of 1.
Similarly, for the Support category, the ratios for employees with disabilities haveimproved over time, although there has been a greater year-to-year fluctuation. By 1998–99, the ratio for employees with disabilities is above 1, slightly more than 0.87 for StatisticsCanada as a whole. Overall, the increase in training ratios for employees with disabilitiessuggests that concentrated efforts to improve the availability of training have had a positiveinfluence.
Statistics Canada’s Employment Equity Committee provides strategic direction for allemployment equity initiatives, including special programs through CAD for employeeswith disabilities and Aboriginal employees. The Committee is dedicated to supporting andfacilitating “the full participation and inclusion of employees with disabilities in trainingand development activities.”6
The results of a December 1999 Statistics Canada Report on Persons with Disabilities atStatistics Canada show “the lack of awareness of what is available to employees withdisabilities in terms of
• training and development opportunities• special tools available for regular work, competitions and training• funding for special tools and devices• a perceived attitude that persons with disabilities are restricted in their
access to training.”7
6 GPC Factor Research, Statistics Canada and Persons with Disabilities: Job Satisfaction and OtherWorkplace Issues, November 24, 1999, page 3.7 Dion, Marcelle and Susan Lensen, A Report on Persons with Disabilities at Statistics Canada: Results andRecommendations, December 1999, pages 9–10.
Study of Training and Development
Audit and Evaluation Division March 2002 8
Specific employment equity initiatives encouraged by the Committee include: bettercommunication regarding training and development opportunities to employees withdisabilities via the Internal Communications Network (ICN); and ensuring that trainers andother staff make the necessary arrangements to accommodate the needs of any employeewith disabilities, when advised of such needs in advance of the course start date. In orderfor this to be fully effective, participants are encouraged to provide as much advancenotification as possible.
Availability of Information
Much of the information related to training and development is available electronically attwo interconnected sites, and these sites were examined for ease of use, accuracy,completeness, and interconnectivity.
Training administered by the Human Resource Development Division’s (HRDD) TrainingInstitute resides on a site on the ICN, while computer-related training information resideson the ITSD Intranet site.
Both sites contain current training calendars and other key information e.g. a listing ofupcoming courses available in the short to medium term, and in some cases, over the longerterm; descriptions of courses and to whom they are targeted; and course eligibilityrequirements and prerequisites. In addition, the HRDD ICN site contains backgroundmaterial of a more general nature about training and career development at StatisticsCanada.
A web site for ES, CS, MA and SI recruits contains both general training information, aswell as training information specific to each recruitment and development program. Whilethe style of information provided on the site varied from program to program, theinformation was easy to locate, and in most cases, it was up-to-date and interconnectedamong programs.
Interviewees reported few problems in finding training information on these various sites,and some interviewees specifically highlighted the usefulness of having course targetpopulations and prerequisites provided. Feedback from staff responsible for maintainingand updating training information indicated that a number of enhancements were alreadybeing implemented, while other options to further improve the quality of information wereunder consideration.
HRDD and ITSD also highlighted the importance of the network of training co-ordinatorswithin divisions and branches as another effective way to keep managers and employeesinformed about upcoming courses and other training-related information.
Study of Training and Development
Audit and Evaluation Division March 2002 9
Required Training
For the purposes of this study, required training is defined as those courses which need tobe taken to support a recruit’s (or another employee’s) ability to perform optimally.However, not everyone shares the same understanding of what constitutes required trainingor to whom it applies. This study selected and examined the following two courses that areconsidered required training.
Encountering the Media - Statistics Canada policy requires divisions to ensure thatspokespersons and data contacts have the necessary training to do media interviews.Discussions with the course instructor revealed that, in general, data contacts understandthe need for this course. Since its implementation in 1992, an analysis of participationshows that 80% of data contact employees have taken this course.
Writing An Effective Daily Release - Since its implementation in the mid-1990’s, 296employees have taken this course. Discussions with the instructor revealed that there wasstill some ambiguity surrounding the required nature of this course, and that it is difficult topersuade some writers to take it. A sample of writers of major releases for The Dailyconcluded that only 38% have taken the course. The Communications Division willpropose policy changes clarifying that this course is required for writers of The Daily.
Statistics Canada makes significant investments in its initial recruitment decisions and theintake of new professionals, e.g. ES, MA, CS, and SI, is managed centrally. A corporateProfessional Recruitment and Development Committee forecasts future needs and engagesin recruitment. In order to gain broad exposure to the Agency, during the first two years,most newly hired recruits are rotated among several positions, are aided by mentors, andtake required training before they “graduate” to a regular position.
This study focussed on training required by ES and CS recruits8. ES recruits take one ortwo flagship courses within their specific program. CS recruits are required to take theSurvey Skills Development Course (SSDC). However, there has been a decline in theproportion of CS recruits who take this training within the program.
In part, this is a reflection of the fact that there are a higher number of CS recruits thanthere are in the ES category vying for a fixed number of available SSDC training seats.This was particularly the case in 1997-98 when CS intake totaled 119 recruits versus 28 forthe ES category.
Newer recruit programs were not examined in detail, however, it is worth noting that someof them, such as the SI program, also identify the SSCC as a required course, and this willplace even further demands on available SSCD seats.
8 Although the SI recruitment program has identified required training for its recruits, it was not examinedsince it has been running for a shorter time period and didn’t offer enough data for analysis.
Study of Training and Development
Audit and Evaluation Division March 2002 10
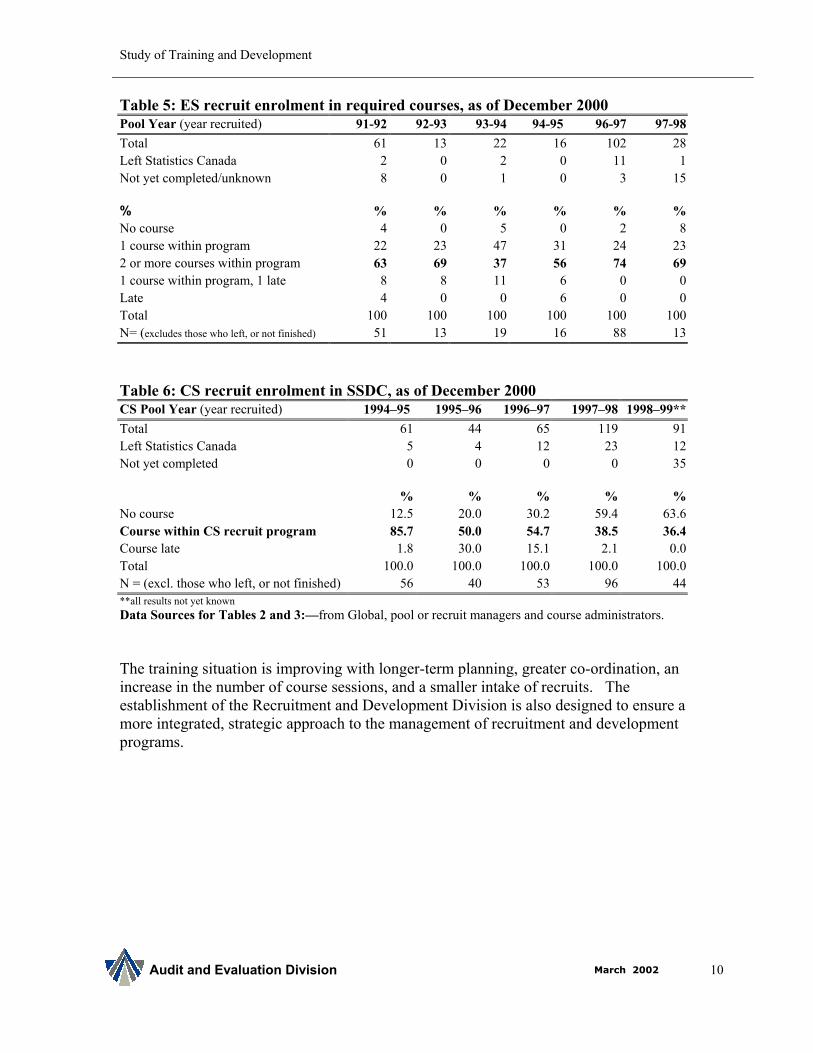
Table 5: ES recruit enrolment in required courses, as of December 2000 Pool Year (year recruited) 91-92 92-93 93-94 94-95 96-97 97-98Total 61 13 22 16 102 28Left Statistics Canada 2 0 2 0 11 1Not yet completed/unknown 8 0 1 0 3 15
% % % % % % %No course 4 0 5 0 2 81 course within program 22 23 47 31 24 232 or more courses within program 63 69 37 56 74 691 course within program, 1 late 8 8 11 6 0 0Late 4 0 0 6 0 0Total 100 100 100 100 100 100N= (excludes those who left, or not finished) 51 13 19 16 88 13
Table 6: CS recruit enrolment in SSDC, as of December 2000 CS Pool Year (year recruited) 1994–95 1995–96 1996–97 1997–98 1998–99**Total 61 44 65 119 91Left Statistics Canada 5 4 12 23 12Not yet completed 0 0 0 0 35
% % % % %No course 12.5 20.0 30.2 59.4 63.6Course within CS recruit program 85.7 50.0 54.7 38.5 36.4Course late 1.8 30.0 15.1 2.1 0.0Total 100.0 100.0 100.0 100.0 100.0N = (excl. those who left, or not finished) 56 40 53 96 44**all results not yet knownData Sources for Tables 2 and 3:—from Global, pool or recruit managers and course administrators.
The training situation is improving with longer-term planning, greater co-ordination, anincrease in the number of course sessions, and a smaller intake of recruits. Theestablishment of the Recruitment and Development Division is also designed to ensure amore integrated, strategic approach to the management of recruitment and developmentprograms.
Study of Training and Development
Audit and Evaluation Division March 2002 11
Cost Considerations
Managers were consulted regarding whether they felt they had sufficient flexibility in theirbudgets to cover training costs or whether budget levels limited their ability to do so. Forthe most part, managers did not see covering direct training costs as problematic. ITSDtraining administration indicated that client divisions can be affected twice with respect tocomputer training in French - first, because the courses are not always as available or astimely, and second, because higher costs must be passed on to the division.
Under the University Certificate Program, Statistics Canada pays the costs and theemployee avoids the need to outlay tuition fees. For other courses at educationalinstitutions, it is Statistics Canada’s “practice to reimburse (emphasis added) tuition feesand related course costs, in whole or in part…”9 Regional office staff do not have access tothe University Certificate Program by virtue of their locations. However, the spirit of theUniversity Certificate Program concerning up front payment could be applied in regionaloffices. The manager responsible intends to clarify this with regional office directors.
Summary on Accessibility
While some improvements to the accessibility of training can be made, corporately thefindings indicate that training is generally available. The timeliness of required training forES recruits is acceptable, for the most part. However, the proportion of CS recruitsreceiving required training in a timely manner has declined, over time. Some clarificationsare still required concerning what constitutes required training and to whom it applies.
Effective Management
This section highlights how training and development are managed from the perspective ofplanning and support, and of evaluation.
An important element of planning and support for training and development is the strategicdirection provided by the corporate Training and Development Committee. ThisCommittee continually monitors the need for, and development of, training programs, andit is one of a number of management committees that support the Agency’s management ofhuman resources. Others include: Recruitment and Development Committee, CareerStreams Committee, and Employment Equity Committee. Where appropriate, humanresource proposals from these committees are integrated and presented for policy decisionsby the corporate Human Resource Development Committee. Ultimately, however, linemanagers (supported by human resource specialists) are accountable for the management ofhuman resources, and this includes ensuring employees receive the appropriate training anddevelopment.
The Training and Development Committee draws its 21 members from across the Agency,mainly at the director level or above, in order to ensure the necessary background and
9 Training and Development at Statistics Canada, 1996 . Section 9.6
Study of Training and Development
Audit and Evaluation Division March 2002 12
experience on training issues. The work of the Committee is supported by formal meetingagendas and minutes. The Committee reports to the Sub-Committee on Human ResourcesDevelopment. This latter committee is Syndicate E for long-term planning purposes. Here,long term planning (LTP) proposals related to training and development are developed,tabled, discussed, and if approved, implemented and monitored through steeringcommittees. Recent examples include the funding of the Management DevelopmentProgram, and the capacity expansion of the Survey Skills development course.
Planning and Support for Training and Development
In general, the study found that planning and support for training is integrated intoorganizational plans and activities at corporate, divisional, and other levels. For example,corporately, there are:
• regular meetings of the Training and Development Committee to discuss prioritytraining and development issues;
• easily accessible corporate training and development policies, systems, guidelines,reports and other information in electronic and hard copy;
• comprehensive web sites such as HRDD’s Training Institute and ITSD’s site relating tocomputer training; Statistics Canada’s departmental web site on the Internet alsocontains information on its human resource strategies including training anddevelopment;
• divisional training committees; • training co-ordinators; • entrenched human resource management processes such as annual employee
performance review processes which address employee training; and • steering committees with subject matter experts, managers and others to guide the
development of new training courses and/or revisions to existing courses.
Global-Orbit, a sub-system of Global, is accessible to divisions to help manage training.Although this study did not conduct a specific investigation of the functionality of Global, anumber of those interviewed expressed some concerns about the system; these included:
• divisional information is not perceived as current; as a result, some divisions havecreated their own databases to manage training information;
• some managers and training co-ordinators were not aware of the existence, availabilityor capabilities of Global-Orbit;
• regionally, there was little or no assurance that training particulars were entered intoGlobal although managers indicated that training forms were routinely completed; and
• forms for some self-arranged divisional training were not completed and/or entered intothe system.
Study of Training and Development
Audit and Evaluation Division March 2002 13
As a result, information contained within the Global system may not yet accuratelyrepresent the full extent of all Statistics Canada training activity.
Divisions often plan training only at the individual employee level i.e. through discussionsand agreements between the employee and the supervisor at appraisal time. While thistype of communication and planning is important, a more strategic, integrated divisionalapproach would add substantially to the process.
Some divisions have developed frameworks and practices to guide the training ofemployees in their current jobs as well as to provide information related to career paths tofuture jobs. Other divisions are in the process of developing, or planning to develop,outlines of training courses appropriate to specific occupational groups and levels. Theseinitiatives should be regarded as generally positive as they will further strengthen theplanning and management of training within divisions. As well, the work being carried outby the Career Streams Committee related to career paths and associated training, willprovide divisions with additional information and context within which to identify andmanage their own training needs and activities.
Some of the training professionals interviewed indicated that there is a need for additionalmechanisms to encourage more systematic linkages among various courses. Instructors ofone course can be isolated from instructors of another course and therefore know a limitedamount about the content of their colleagues’ courses. Opportunities should be identifiedto enable greater sharing of information, including the highlighting of complementarythemes from one course to another (where they do not already exist) that instructors couldreinforce during delivery. Collectively, this would present a more integrated approach totraining.
Tools, Methods and Practices to Evaluate Training
Training literature reviewed during the conduct of the study consistently emphasizes theimportance of formally evaluating training using a number of different indicators, e.g.participant reaction; learning; behaviour; and results. However, this literature alsoacknowledges that organizations infrequently carry out such comprehensive evaluations,choosing instead to focus more on “reactions” through identification of the ways in whichparticipants liked the design, content or presentation of the course.
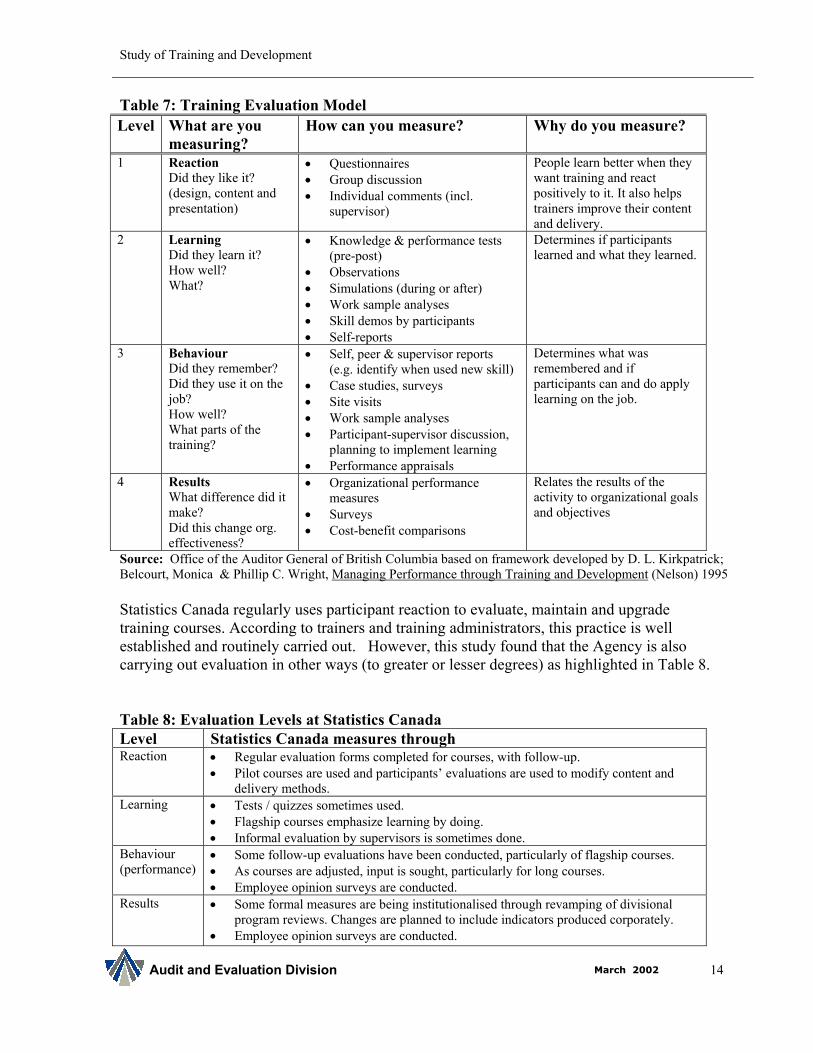
To address the issue of evaluation, this study selected as a benchmark, a training evaluationmodel that is widely recognized and used among training and development professionals.This model, described in the following chart, was used by the Office of the Auditor Generalof British Columbia and referenced in his 1999/2000 report.
Study of Training and Development
Audit and Evaluation Division March 2002 14
Table 7: Training Evaluation ModelLevel What are you
measuring?How can you measure? Why do you measure?
1 ReactionDid they like it?(design, content andpresentation)
• Questionnaires • Group discussion• Individual comments (incl.
supervisor)
People learn better when theywant training and reactpositively to it. It also helpstrainers improve their contentand delivery.
2 LearningDid they learn it?How well?What?
• Knowledge & performance tests(pre-post)
• Observations• Simulations (during or after)• Work sample analyses• Skill demos by participants• Self-reports
Determines if participantslearned and what they learned.
3 Behaviour Did they remember?Did they use it on thejob?How well?What parts of thetraining?
• Self, peer & supervisor reports(e.g. identify when used new skill)
• Case studies, surveys• Site visits• Work sample analyses • Participant-supervisor discussion,
planning to implement learning• Performance appraisals
Determines what wasremembered and ifparticipants can and do applylearning on the job.
4 ResultsWhat difference did itmake?Did this change org.effectiveness?
• Organizational performancemeasures
• Surveys• Cost-benefit comparisons
Relates the results of theactivity to organizational goalsand objectives
Source: Office of the Auditor General of British Columbia based on framework developed by D. L. Kirkpatrick;Belcourt, Monica & Phillip C. Wright, Managing Performance through Training and Development (Nelson) 1995
Statistics Canada regularly uses participant reaction to evaluate, maintain and upgradetraining courses. According to trainers and training administrators, this practice is wellestablished and routinely carried out. However, this study found that the Agency is alsocarrying out evaluation in other ways (to greater or lesser degrees) as highlighted in Table 8.
Table 8: Evaluation Levels at Statistics CanadaLevel Statistics Canada measures throughReaction • Regular evaluation forms completed for courses, with follow-up.
• Pilot courses are used and participants’ evaluations are used to modify content anddelivery methods.
Learning • Tests / quizzes sometimes used.• Flagship courses emphasize learning by doing.• Informal evaluation by supervisors is sometimes done.
Behaviour(performance)
• Some follow-up evaluations have been conducted, particularly of flagship courses. • As courses are adjusted, input is sought, particularly for long courses. • Employee opinion surveys are conducted.
Results • Some formal measures are being institutionalised through revamping of divisionalprogram reviews. Changes are planned to include indicators produced corporately.
• Employee opinion surveys are conducted.
Study of Training and Development
Audit and Evaluation Division March 2002 15
To carry out the challenging process of accurately evaluating organizational effectiveness,organizations often tend to use indirect measures. Statistics Canada periodicallyadministers its Employee Opinion Survey as one way to benchmark how well it is doingfrom the point of view of its most important asset - its employees. Recently, initiativeshave been undertaken to improve the strategic planning and review of Statistics Canadaprograms through the use of biennial and quadrennial performance reviews. As a part ofthese processes, performance indicators related to training are being developed corporately.
In summary, therefore, although Statistics Canada most frequently uses participant reactionas the key element of training evaluation, other measures exist, and are being applied, toreport on training and development performance. In this context, however, a greater use ofmeasures related to learning and behaviour (performance) is desirable.
IV. RECOMMENDATIONS
Four recommendations are proposed:
1. Senior management should encourage divisions that are not yet doing so, to plan andsupport training at a divisional level in order to ensure a more strategic, co-ordinatedapproach to the management of employee training.
2. For new training courses or programs, course designers should include measures toevaluate learning and behaviour (performance).
3. For existing courses, a plan should be established to examine ways in which to integrateevaluation measures that address learning and behaviour (performance).
4. Any user surveys undertaken as part of the renewal of the Global system should includeconsultations with training administrators and divisional managers in order to ensurethat the system’s capabilities better support their planning, management andinformation needs.
Appendix A contains the management action plan developed in response to theserecommendations.
Conclusion
The study’s findings on the accessibility of training are generally positive for all groups ofemployees and therefore we made no recommendations. As a helpful tool, information forline managers has been collated, focusing on promising practices and possible solutions tobarriers identified by employees. We expect it will assist managers in meeting challengesof a workplace recognized for a very positive culture surrounding human resourcesmanagement.
Study of Training and Development
Audit and Evaluation Division March 2002 16
Of the four recommendations pertaining to effective management, the first one is mostimportant since with a coordinated approach, accountability is heightened, better planningoccurs and similar problems get addressed in a like manner. Therefore, it offers the mostpotential for improvement in divisions where such practices are not in use.
Recommendations 2 and 3 are in keeping with the federal government direction towardsperformance reporting and results-based management. There is no standard methodologyfor translating this into action, providing scope to the organization to determine what isappropriate.

Appendix A—Management Action PlanPrepared by L. Reid and reviewed by J-F. Gosselin and L. Brown
Audit and Evaluation Division August 2002 17
Recommendations Action Plan on the Recommendations Responsible for Action EstimatedCompletion Date
1. Senior management should encouragedivisions that are not yet doing so, to planand support training at a divisional levelin order to ensure a more strategic, co-ordinated approach to the management ofemployee training.
• A correlation will be done between thepresence of divisional training plansand the results of the 2002 PS.Employee Survey results. Thefindings will be used to determinesubsequent actions required and bestpractices will be shared withdivisional training co-ordinators.
• Identify and share best practices withDivision Training Co-ordinators
L. Reid
T and D Committee
L. Reid
April 2003
Ongoing
2. For new training courses or programs,course designers should include measuresto evaluate learning and behaviour(performance).
For recommendations 2 and 3• A work group, under the direction of
the T&D Committee will beestablished to assess the extent towhich appropriate evaluationmeasures can be put into place andtheir resultant benefits
• Investigate the possibilities ofestablishing macro measures todetermine the impact of the STCtraining and development strategy onthe STC workforce
J.F. Gosselin and L. Reid
L. Reid and L. Brown
January 2003
April 2003
3. For existing courses, a plan should beestablished to examine ways in which tointegrate evaluation measures that addresslearning and behaviour (performance).

Appendix A—Management Action PlanPrepared by L. Reid and reviewed by J-F. Gosselin and L. Brown
Audit and Evaluation Division August 2002 17
Recommendations Action Plan on the Recommendations Responsible for Action EstimatedCompletion Date
4. Any user surveys undertaken as part ofthe renewal of the Global system shouldinclude consultations with trainingadministrators and divisional managers inorder to ensure that the system’scapabilities better support their planning,management and information needs.
• Redesign the Global Training Moduleas a part of Re-engineering of Admin.Systems, including consultation withusers.
CMIS and HRDD April 2004