Embed Size (px)
Citation preview

2002 Number 3
IN THIS ISSUE
• Symptoms Associated with Potassium
Deficiency in Corn• Starter Fertilizer Benefits
Grain Sorghum inConservation Tillage
• Tillage Effects on Soil Pand K Distribution... and much more

Our Cover: Sunflower field near Woodland, California.Photo Credit: Bill Barksdale, Barksdale Agri-Communications
Editor: Donald L. ArmstrongAssistant Editor: Katherine P. Griffin Circulation Manager: Carol MeesDesign: Debbie Nguyen, S.O.H.O.
Potash & Phosphate Institute (PPI) H. Mathot, Chairman of the Board
Cargill, IncorporatedS.A. Riemann, Vice Chairman of the Board
Farmland Industries, Inc.J.M. Van Brunt, Chairman, Finance Committee
Agrium Inc.
HEADQUARTERS: NORCROSS, GEORGIA, U.S.A.D.W. Dibb, President T.L. Roberts, Vice President, PPI and
Vice President, PPIC, Latin AmericaB.C. Darst, Technical EditorC.V. Holcomb, Assistant Treasurer S.O. Danner, Executive Assistant W.R. Agerton, Communications SpecialistS.J. Couch, IT ManagerB. Rose, Statistics/AccountingC. Heaton, Circulation Assistant
NORTH AMERICAN PROGRAMS-Brookings, South DakotaP.E. Fixen, Senior Vice President, North American Program
Coordinator, and Director of ResearchP. Pates, Secretary
REGIONAL DIRECTORS-North America T.W. Bruulsema, Guelph, OntarioA.M. Johnston, Saskatoon, SaskatchewanT.S. Murrell, Woodbury, MinnesotaH.F. Reetz, Jr., Monticello, Illinois C.S. Snyder, Conway, Arkansas W.M. Stewart, Lubbock, Texas
INTERNATIONAL PROGRAMS-Saskatoon, SaskatchewanM.D. Stauffer, Senior Vice President, International
Programs (PPI), and President, Potash & Phosphate Institute of Canada (PPIC)
J. Wang, Scientific Associate, ChinaG. Sulewski, AgronomistL.M. Doell, Administrative AssistantD. Gibson, Executive Secretary
INTERNATIONAL PROGRAM LOCATIONS Brazil T. Yamada, POTAFOS, PiracicabaChina S.S. Portch, Hong Kong
Ji-yun Jin, Beijing Fang Chen, WuhanShihua Tu, ChengduRonggui Wu, BeijingRongle Liu, Beijing
India K.N. Tiwari, Gurgaon, Haryana T.N. Rao, Secunderabad, Andhra PradeshK. Majumdar, Calcutta, West Bengal
Northern Latin America J. Espinosa, Quito, EcuadorLatin America-Southern Cone F.O. Garcia, Buenos Aires, Argentina Mexico I. Lazcano-Ferrat, QuerétaroEast and Southeast Asia T.H. Fairhurst, Singapore
BETTER CROPS WITH PLANT FOOD(ISSN:0006-0089) is published quarterly by the Potash & PhosphateInstitute (PPI). Periodicals postage paid at Norcross, GA, and at additional mailing offices (USPS 012-713). Subscription free on request to qualified individuals; others $8.00 per year or $2.00 perissue. POSTMASTER: Send address changes to Better Crops with PlantFood, 655 Engineering Drive, Suite 110, Norcross, GA 30092-2837.Phone (770) 447-0335; fax (770) 448-0439. www.ppi-ppic.org. Copyright 2002 by Potash & Phosphate Institute.
Members: Agrium Inc. • Cargill, Incorporated • Farmland Hydro, Inc. • IMC Global Inc.Intrepid Mining, LLC/Moab Potash • Mississippi Chemical Corporation • Potash Corporation of Saskatchewan Inc. • Simplot
Third Edition of Southern Forages 3Book Now Available
PPI/PPIC on the Web 3
Conservation Tillage Effects on 4Soil Phosphorus Distribution (Western Canada)
Fernando Selles, Cynthia A. Grant,and Adrian M. Johnston
Robert E. Wagner Award Winners 7Announced
J. Fielding Reed PPI Fellowships 8Awarded to Outstanding Graduate Students
Starter Fertilizer Application Effects 10on Reduced and No-Tillage GrainSorghum Production (Great Plains)
W.B. Gordon and D.A. Whitney
Symptoms Associated with Potassium 12Deficiency in Corn (Northcentral)
Anthony Bly, Ron H. Gelderman, JamesGerwing, and T. Scott Murrell
Residual Impacts of Previous Corn 16Rows on Potassium Nutrition ofNo-Till Narrow Row Soybeans (Ontario)
Xinhua Yin and Tony J. Vyn
Inorganic and Organic Soil Phosphorus 20Fractions after Long-Term AnimalManure and Fertilizer Applications(Missouri)
Peter P. Motavalli and Randall J. Miles
Will Your Crop Run Out of Gas 24This Year?
Dr. B.C. Darst
C O N T E N T S
Vol. LXXXVI (86) 2002, No. 3

Better Crops/Vol. 86 (2002, No. 3) 3
The book Southern Forages was first introduced in1991 and has since gained wide recognition as apractical and reliable source of information on
modern forage crop management. The Third Edition ofSouthern Forages, released in May, 2002, is an evenmore valuable book, with extensive chapter revisions,topic updates, and other improvements.
Published jointly by the Potash & PhosphateInstitute (PPI) and the Foundation for AgronomicResearch (FAR), the Third Edition of SouthernForages includes new chapters on “Forage Ecology”and “Minimizing Stored Feed Requirements,” plusan expanded chapter on grazing management.Fifteen additional pages of information have beenadded to the popular appendix section. Otherimprovements include color drawings of forageseed and new diagrams in various chapters.
Authors of the book are Dr. Don Ball, ExtensionAgronomist/Alumni Professor, Auburn University; Dr. Carl Hoveland, Terrell DistinguishedProfessor, University of Georgia; and Dr. Garry Lacefield, Extension Agronomist/Professor,University of Kentucky. All are former presidents of the American Forage and GrasslandCouncil and have many years of experience working with forage/livestock production.
Southern Forages is written for a wide range of audiences. It is used by livestock pro-ducers, by seed, equipment and fertilizer dealers, by Extension and conservation workers,and by teachers as a text for students learning about forages. More than 50 colleges and uni-versities have included the book as a text or resource in forage classes.
While the content is focused on forages for the southern U.S., many of the principles andspecies of plants discussed can be adapted to other regions. Chapters discuss forage systemsfor beef, dairy, horses, sheep, goats, and other types of livestock. Wildlife, soil conservation,and environmental benefits of forages are also emphasized.
The Third Edition of Southern Forages is a 6 x 9-inch paperback book containing 332pages. It features more than 150 color photos, including over 60 close-up images of grassesand legumes. Discussions of management and utilization, forage adaptation zones, seasonalgrowth curves, seeding rates, and nutrient content of fertilizer materials are examples of sub-ject matter helpful to many readers.
Southern Forages is priced at US$30.00 per copy, plus shipping and handling. To orderone book for delivery in the U.S., send a check payable to “Potash & Phosphate Institute”for $34.00 to: 655 Engineering Drive, Suite 110, Norcross, GA 30092-2837. To inquireabout multiple book or international orders, phone (770) 825-8082 or 825-8084; fax (770)448-0439; e-mail: [email protected]; or order online at www.ppi-ppic.org.
Third Edition of Southern Forages Book Now Available
Learn more about PPI/PPIC programs, research support, publications, and links by vis-iting the website at www.ppi-ppic.org. From the central website, visitors may reach the
various individual regional sites where PPI/PPIC programs are at work in the world.
PPI/PPIC on the Web: www.ppi-ppic.org
4 Better Crops/Vol. 86 (2002, No. 3)
Conservation tillage seeding systems arethe most rapidly adopted tillage prac-tice in western Canada. Because con-
servation tillage seeding encompasses a broadrange of seeding and fertilization methods,there are questions regarding the long-termimpact of reduced tillage onsoil fertility.
The role of tillage on soilnutrient levels is largelydetermined by the nature ofeach specific nutrient, andthe impact that the changesin the soil environment haveon its transformations. Thus,immobile nutrients in the soilsuch as P and potassium (K)tend to be affected substan-tially by the adoption ofreduced tillage management.Most notable is their tendency to become con-centrated near the surface of the soil inresponse to the reduced soil disturbance andelimination of soil inversion characteristic ofconventional tillage systems.
One of the main benefits achieved withthe adoption of conservation tillage is themaintenance of soil moisture for crop produc-tion. By increasing the amount of plant-avail-able water in the soil, both the cropping inten-sity, and diversity of crops grown can beincreased. Previous research in the U.S. CornBelt has found that while soil P and K wereconsiderably higher in the surface 3 in. depthof no-till treatments, the plowed treatmentshad uniform nutrient levels down to 9 in.depth. Given the density of corn roots in thissoil layer, the stratification of P and K were notconsidered to be as big a problem as first
thought. In fact, by concentrating roots in azone of higher fertility, nutrient availabilitymay be increased. A similar scenario exists forthe root development of crops on the CanadianPrairies, and the maintenance of surfaceresidues helps to maintain plant-available
water for crop uptake nearthe soil surface.
Soil P in long-term tillagestudies has been evaluated atthe Swift Current ResearchCentre on a silt loam soil andthe Brandon Research Centreon fine sandy loam and siltyclay soils. Both of thesefacilities are part of theAgriculture and Agri-FoodCanada Research Centre network on the CanadianPrairies. Swift Current is
located in a semiarid region (13 in. annualprecipitation, 29 in. potential evapo-transpira-tion), while Brandon (19 in. annual precipita-tion, 25 in. potential evapo-transpiration) is inthe sub-humid region. Spring wheat wasgrown at each location, with the fertilizer Papplied in the seed row at Swift Current andpre-plant banded at Brandon.
Conventional tillage at both locationsinvolved use of a cultivator with sweeps thatmixes but does not invert the soil above thedepth of tillage. Soil samples were collectedfrom the experimental plots to include boththe crop row and inter-row area, and segment-ed into varying depths for further analysis. AtSwift Current, soil P fractions were deter-mined using the Hedley fractionation proce-dure. It partitions P into inorganic and organ-ic P fractions of varying availability. Labile P
Conservation Tillage Effects on Soil Phosphorus DistributionB y F e r n a n d o S e l l e s , C y n t h i a A . G r a n t , a n d A d r i a n M . J o h n s t o n
W E S T E R N C A N A DA
While soil phosphorus (P)was found to accumulatenear the surface in no-tillfields, no negative impacton crop production wasrecorded due to this nutri-ent distribution. In-soil bandplacement of fertilizer P isan effective means ofincreasing soil P content inthe absence of tillage forincorporation.
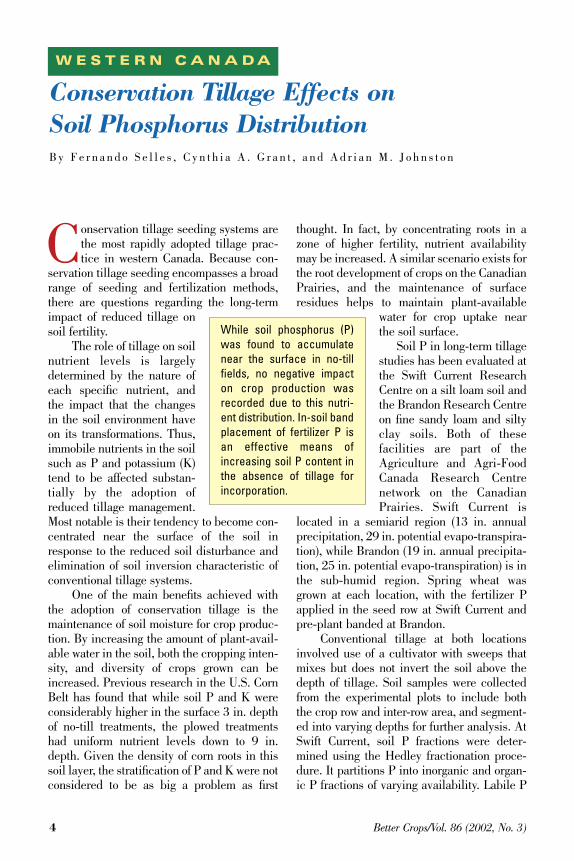
is that soil P that isavailable or becomesavailable to plants andmicroorganisms in atime span of days to afew weeks. Moderatelylabile P, while notimmediately availableto plants, has thepotential to becomeavailable over a periodof months to a fewyears. At Brandon, soilP was determinedusing the 0.5 M sodi-um bicarbonate ex-traction procedure.
At Swift Current,results showed that 12years after converting from conventional tillwheat-fallow (CT-FW) to no-till continuouswheat (ZT-CW), forms of P easily available tothe crop accumulated in the surface 2.5 in.layer (Figure 1).
This was not the case for the no-till fal-low-wheat (ZT-FW), or the conventional tillcontinuous wheat (CT-CW), where the con-centration of labile P was uniform in the top 4in. of the soil. The labile P fraction (inorganicP extracted by an anion resin plus organic andinorganic P extracted by 0.5 M sodium bicar-bonate) is the soil P that is immediately avail-able, or becomes available to plants withindays to a few weeks. This specific treatmentdifference was attributed to the accumulationof organic materials (crop residues and soilorganic matter) at the surface of zero-tilledsoils, resulting from the reduction of soil dis-turbance and mixing of the soil. However, it isimportant to note that in this study, where 15lb P2O5/A were seed-placed each year, theincreased soil P in the surface of no-till con-tinuous wheat fields did not result inincreased plant uptake of P. This was attrib-uted to the proven yield increase shown bycrops that receive starter P at seeding in soilsthat remain cool in early spring.
An enhanced P supply, arising from anincreased accumulation of available forms ofP, would benefit mid-season uptake of P by ahigh yielding crop. This is illustrated by the
Better Crops/Vol. 86 (2002, No. 3) 5
0 5 10 15 20 25 30
0.0
0.8
1.6
2.4
3.2
Soil
dept
h, in
.
Labile P, lb/A/0.4 in.40 45 50 55 60 65 70Moderately labile P, lb/A/0.4 in.
LSD4.0 LSD3.8
CT-CW CT-FW ZT-CW ZT-FW
increase in moderately labile soil P (sodiumhydroxide extractable P). Adoption of no-tillseeding with continuous wheat croppingresulted in a substantial increase in plant-available P in the surface 2.5 in. of soil. Insoils under zero-tillage management for sometime, soil sampling procedures for P determi-nation and P fertilizer recommendations mayhave to be modified to account for the accu-mulation of labile forms of P near the soil sur-face. Furthermore, the accumulation of bio-available forms of P near the soil surface mayhave a substantial impact on surface waterquality, if soil materials are transported fromthe field to surface water bodies, despite thereduced erosion risk characteristic of zero-tillage management systems.
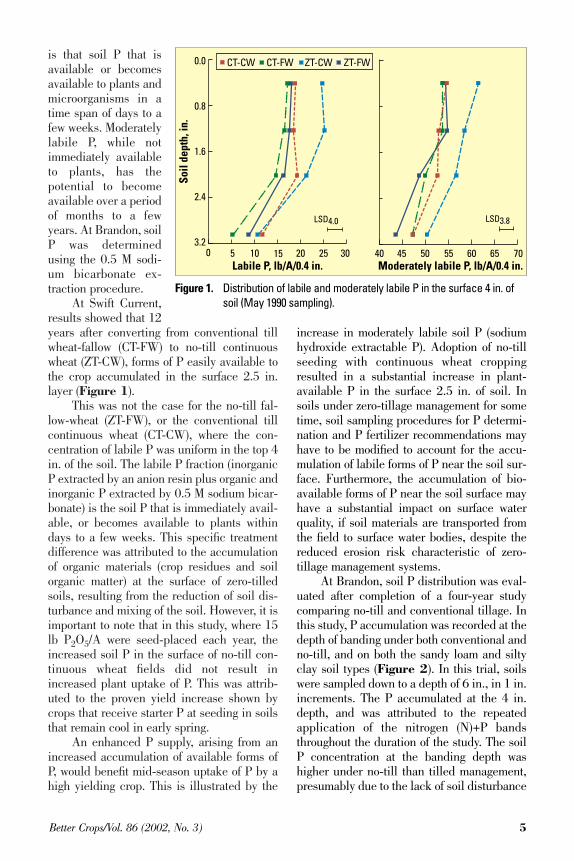
At Brandon, soil P distribution was eval-uated after completion of a four-year studycomparing no-till and conventional tillage. Inthis study, P accumulation was recorded at thedepth of banding under both conventional andno-till, and on both the sandy loam and siltyclay soil types (Figure 2). In this trial, soilswere sampled down to a depth of 6 in., in 1 in.increments. The P accumulated at the 4 in.depth, and was attributed to the repeatedapplication of the nitrogen (N)+P bandsthroughout the duration of the study. The soilP concentration at the banding depth washigher under no-till than tilled management,presumably due to the lack of soil disturbance
Figure 1. Distribution of labile and moderately labile P in the surface 4 in. of soil (May 1990 sampling).
and soil mixing withtillage. This increasein P concentrationlikely reflects accumu-lation of the nutrientfrom the previousyear’s application.
One additionalproject evaluated theimpact of tillage on thedistribution of soil P atIndian Head, Saskat-chewan, also in thesub-humid (16 in.annual precipitation,24 in. potential evapo-transpiration) regionin a heavy clay soil.After four years, nodifference was recorded in soil P at 0 to 2 in.,2 to 4 in., or 4 to 6 in. soil depths betweenconventional and no-till seeding systems. Thisstudy involved a series of cereal, oilseed, andgrain/legume rotations. Rotation also did nothave any impact on soil P distribution.
It would appear that soil P can accumu-late near the soil surface of no-till treatments,relative to conventional tillage. No negativeimpact was recorded in these studies due tothis nutrient distribution, and is not expectedto pose a problem to future production. Theaccumulation of surface crop residues does anexcellent job of maintaining increased plant-available water in no-till fields. This will keeproots active and in a position to access accu-mulated nutrients. However, under dryingconditions, a deficiency of P may mean thatplants cannot access these surface nutrientsand place an increased importance on in-soilband placement of P.
Fertilizer management with reduced andno-till seeding requires careful attention toplacement in order to optimize efficiency offertilizer-use by the crop. There is little doubtthat broadcast application of P onto theresidue-covered soil surface is not a realisticmanagement option in most instances.Application of P in bands either with or closeto the seed minimizes tie-up by the soil andfosters early season uptake by the crop,
6 Better Crops/Vol. 86 (2002, No. 3)
increasing the chances for higher crop yields.One of the challenges facing no-till farm-
ers is fertilizer placement. When side bandingis not a choice because of the seeding openerused, the placement of starter P, K, and sulfur(S) fertilizer with the seed can often be limit-ed by the width (spread) in which the selectedopener scatters the seeds and fertilizer mater-ial. Limiting the amount of these nutrients canoften reduce the response to applied N, as a result of imbalance between nutrients.
In the absence of building soil P levelsprior to adopting a no-till program, deficien-cies in these nutrients should be addressedwith low disturbance banding operationscarried out independently of seeding.Implementing the best conservation tillagepractices will not make up for deficiencies, orimbalances, in soil nutrients required for opti-mization of crop yield and quality.
Dr. Selles (e-mail: [email protected]) is a soil scientist at the Agriculture and Agri-Food CanadaResearch Centre in Swift Current, Saskatchewan; Dr. Grant is a soil scientist at the Agriculture andAgri-Food Canada Research Centre in Brandon,Manitoba. Dr. Johnston is PPI/PPIC WesternCanada Director, located at Saskatoon,Saskatchewan.
Figure 2. Effect of conventional tillage (CT) and zero tillage (ZT) on P distribu-tion [parts per million (ppm)] through fine sandy loam and silty clayloam soil profiles.
0 5 10 15 20 0 10 20 30 40 50 60 70 80P, ppm P, ppm
Fine sandy loam Silty clay
Soil
dept
h, in
.
CT ZT0
1
2
3
4
5
6
9
18
36
48
Two outstanding agronomic scientistshave been selected to receive the 2001-2002 Robert E. Wagner
Award by the Potash & PhosphateInstitute (PPI). The award encour-ages worldwide candidate nomina-tions and has two categories...SeniorScientist and Young Scientist,under the age of 45. The recipientin each category receives $5,000along with the award.
Dr. David B. Mengel,Professor and Head, Department ofAgronomy, Kansas State University, Manhat-tan, was selected in the Senior Scientist cate-gory. Dr. Michael A. Schmitt, Professor andAssociate Dean (Interim), College of Agricul-tural, Food, and Environmental Sciences,University of Minnesota, St. Paul, receives thehonor in the Young Scientist division.
The Robert E. Wagner Award recognizesdistinguished contributions toadvanced crop yields through max-imum yield research (MYR) andmaximum economic yield (MEY)management. The award honors Dr.Wagner, President (Retired) of PPI,for his many achievements and inrecognition of his development ofthe MEY management concept...forprofitable, efficient agriculture.
“We congratulate Dr. Mengeland Dr. Schmitt for notable achievements intheir profession. The standards for this awardare high, and the recipients are truly deserv-ing of this honor,” said Dr. David W. Dibb,President of PPI.
Dr. Mengel is widely recognized for hispioneering work with efficient fertilizer prac-tices for reduced tillage and no-tillage systemsin corn production. His research improved theunderstanding of stratification of immobilenutrients and led to management practiceswhich reduced nutrient carryover and runoff,lessening potential impacts on water quality.
Dr. Mengel was Extension Specialist inSoil Fertility and Crop Production, Purdue
University Agronomy Department,from 1979 to 1998. A native ofIndiana, Dr. Mengel earned his B.S.and M.S. degrees at Purdue, thencompleted his Ph.D. in Soil Scienceat North Carolina State Universityin 1975.
Dr. Mengel has received numer-ous awards, including recognitionas Fellow in the American Societyof Agronomy and the Soil Science
Society of America. Dr. Schmitt has gained national recog-
nition and respect for his excellent work withthe management of both livestock manure andnitrogen fertilizer for crop production. Thevaluable database that has evolved from thisresearch has been used to develop an excel-lent series of Extension publications focused
on manure management and bestmanagement practices for nitrogen.His programs have enabled growersto integrate effective managementof organic and inorganic nitrogensources into crop production sys-tems, thereby improving net returns.
After receiving his B.S. degreeat the University of Minnesota in1980, Dr. Schmitt completed hisM.S. and Ph.D. degrees in soil sci-
ence at the University of Illinois. He workedas training coordinator for CENEX/LandO’Lakes Agronomy Company before returningto the University of Minnesota, first as anExtension Agronomist and then as anExtension Soil Scientist and in theDepartment of Soil, Water, and Climate. Hebecame Associate Professor in 1994 andProfessor in 1999. He accepted his currentposition in 2000. In 2001, Dr. Schmitt wasrecognized as Fellow of the American Societyof Agronomy.
Robert E. Wagner Award Winners Announced
Better Crops/Vol. 86 (2002, No. 3) 7
Dr. David Mengel
Dr. Michael Schmitt

8 Better Crops/Vol. 86 (2002, No. 3)
Seven graduate students have beenannounced as the 2002 winners of the J.Fielding Reed PPI Fellowship awards by
the Potash & Phosphate Institute (PPI). Grantsof $2,500 each are presented to the individuals.All are candidates for either the Master ofScience (M.S.) or the Doctor of Philosophy(Ph.D.) degree in soil fertility and related fields.The winners for the year 2002 are:• Amy Suzanne Berg, Purdue
University, West Lafayette, Indiana• William Kess Berg, Purdue
University, West Lafayette, Indiana• Dennis Chessman,
Texas A&M University, College Station• Ann Kline, Purdue University, West
Lafayette, Indiana• Mariya Murashkina Meese,
University of California, Davis• Ryan Russell Paul Noble, University
of Tennessee, Knoxville• Mark Stephen Reiter,
Auburn University, Alabama“Since the awards began in 1980, 135
students have now been named as recipients,”said Dr. David W. Dibb, President of PPI.“This time we have a first. Two of the winners,Kess Berg and Amy Suzanne Berg, are hus-band and wife. Congratulations to all in thisexceptional group.”
Scholastic record, leadership, and excel-lence in original research are among theimportant criteria evaluated for theFellowships. Following is a brief summary ofinformation for each of the 2002 recipients.
Amy SuzanneBerg received her B.S.degree from PurdueUniversity in 2001 and iscurrently working on herM.S. degree there. Ms.Berg has received num-erous awards and scholar-ships, including the BeckFoundation Scholarship, Robert J. Woods
Scholarship, Carole Thiele Agronomy Scholar-ship, Gentry Family Scholarship, and the LewisRunkle Scholarship. In addition, she was arecipient of the American Society of Agro-nomy’s Outstanding Senior Award. Her thesistitle is ‘Changes in Phosphorus Status in Soilsof Differing Chemical and Physical Propertiesafter Applications of Manure and PhosphateFertilizer.’ This research is striving to identifythe phosphorus compounds present in livestockmanures and extracts from soils fertilized withmanure and commercial fertilizer. One of theobjectives is to determine the mobility of spe-cific phosphorus compounds in soils.
William Kess Bergreceived his B.S. degreefrom Ohio State Univer-sity in 1996 and is com-pleting a M.S. degreefrom Purdue University in2002. Mr. Berg is a recip-ient of the George D.Scarseth Graduate Award.He has published his research in scientificjournals and presented the findings at theAmerican Society of Agronomy meetings andnumerous extension meetings. Mr. Berg’sresearch program integrated field-based fertil-ity response trials with modern physiologicaland biochemical assays. His objective was todetermine the impact of phosphorus andpotassium fertilization on alfalfa yield, quality,persistence, and related physiological, bio-chemical, and molecular mechanisms.
Dennis Chessman,received his B.S. degreefrom Stephen F. AustinState University, Nacog-doches, Texas, and hisM.S. degree from KansasState University inManhattan. He beganwork on his doctorate atTexas A&M in College Station in 1999. Mr.Chessman was recognized as Outstanding
J. Fielding Reed PPI Fellowships Awardedto Outstanding Graduate Students

Student in Agronomy and OutstandingAgriculture Graduate as an undergraduate, andhas been the recipient of the American Societyof Agronomy ‘Certificate of Excellence’ in thepublication category. The title of his disserta-tion is ‘Alfalfa Production on Acid CoastalPlain Soils.’ The objective is to evaluate theeffectiveness of gypsum and a flue gas desulfu-rization byproduct from a coal-fired electricpower generating plant in ameliorating alu-minum toxicity on highly weathered soils.
Ann Kline, a nativeof Hudson, Indiana,began working on herMasters degree at PurdueUniversity in 2001. In2000 she graduated witha B.S. in Soil and CropScience from Purdueafter transferring fromHuntington College, Huntington, Indiana.Ms. Kline was the Outstanding Sophomoreand Junior in Purdue’s Agronomy Departmentand was recognized for her exemplary perfor-mance by Dow AgroSciences while workingas a Science Intern during the summers of1999 and 2000. Her M.S. research is investi-gating the effects of deep placement of phos-phorus and potassium on corn response inhigh yield environments.
Mariya Murash-kina Meese was born inMoscow, Russia, andreceived a B.S. fromMoscow State Universityin 1996. She worked as aResearch Assistant inRussia until entering aPh.D. program at theUniversity of California, Davis, in 2000. Shehas authored several scientific papers andpresented research results at scientific meet-ings in Russia, France, Japan, and the U.S.Her research is testing a new method of eval-uating plant-available potassium in the highpotassium-fixing soils of the San JoaquinValley. It is also utilizing geographic informa-tion systems (GIS) technology to map thelocation of potassium-fixing soils that are incotton production in the San Joaquin Valley.
Ryan Noble wasborn in Rosebud, Austra-lia. He received his B.S.degree from the Univer-sity of Tennessee in 2000and is presently workingon his M.S. Mr. Noble hasbeen the recipient ofnumerous awards, includ-ing the University’s Provost Award for extraor-dinary professional promise and the J.J. BirdMemorial Scholarship in Agriculture as anundergraduate. He has also been recognizedas an Outstanding Senior in Plant and SoilScience, Outstanding Horticulture Student,and received the Outstanding UndergraduateAward from the Tennessee AgricultureProduction Association. His thesis is titled‘The Characterization, Genesis, andClassification of Six Selected Soil Profiles ofthe Kursk Oblast, Russia.’
Mark S. Reiter wasraised on a family farm inDinwiddie County, Virgi-nia. He graduated MagnaCum Laude from VirginiaTech in 2001 with a B.S.degree and is presentlyworking toward a M.S. atAuburn University. He isa current recipient of the Frank D. KeimGraduate Fellowship and was awarded theCharles R. Drake Scholarship, the AbrahamsScholarship, and the Robert HarrisonScholarship as an undergraduate. The title ofhis thesis is ‘Nitrogen Management for HighResidue Conservation Tillage Cotton in theTennessee Valley.’ The objectives are toimprove the understanding of nitrogen dynam-ics on silt loam and silty clay loam soils and toimprove nitrogen management guidelines forcotton producers.
The Fellowships are named in honor of Dr.J. Fielding Reed, who served as President ofthe Institute from 1964 to 1975. Dr. Reed, whopassed away in 1999, was well-known for hisencouragement of students and inspiringadvanced study.
Funding for the Fellowships is providedthrough support of potash and phosphate pro-ducers who are member companies of PPI.
Better Crops/Vol. 86 (2002, No. 3) 9
Conservation tillage production sys-tems are being used by an increasingnumber of producers in the central
Great Plains because of several inherentadvantages. These include reduction of soilerosion losses, increased soil water use effi-ciency, and improved soilquality. However, early-sea-son plant growth can bepoorer in reduced tillagesystems than in convention-al systems. The largeamount of surface residuepresent in a no-tillage sys-tem can lower seed zonetemperatures. Lower thanoptimum soil temperaturecan reduce the rate of rootgrowth and P uptake byplants.
Starter fertilizers can beapplied to place nutrientswithin the rooting zone of young seedlingsfor better availability to hasten maturity and
avoid late-season damage by low tempera-tures. Some experiments that have evaluatedcrop response to N and P starter fertilizershave demonstrated improved early growthand increased yield and attributed thoseresponses to the P component of the combi-
nation. Other studies haveindicated that N is the mostcritical nutrient in the N-Pstarter on soils not low in P. Many producers do not favor2x2 (2 in. to the side and 2in. below the seed) place-ment of starter fertilizer dueto high initial cost of appli-cation equipment and prob-lems associated with knifeapplications in high residuesituations. This researchwas aimed at minimizingfertility problems that arisewith reduced tillage sys-
tems, thus making conservation tillage moreattractive to producers.
10 Better Crops/Vol. 86 (2002, No. 3)
Starter Fertilizer Application Effects on Reduced and No-Tillage Grain Sorghum Production B y W. B . G o r d o n a n d D . A . W h i t n e y
G R E A T P L A I N S
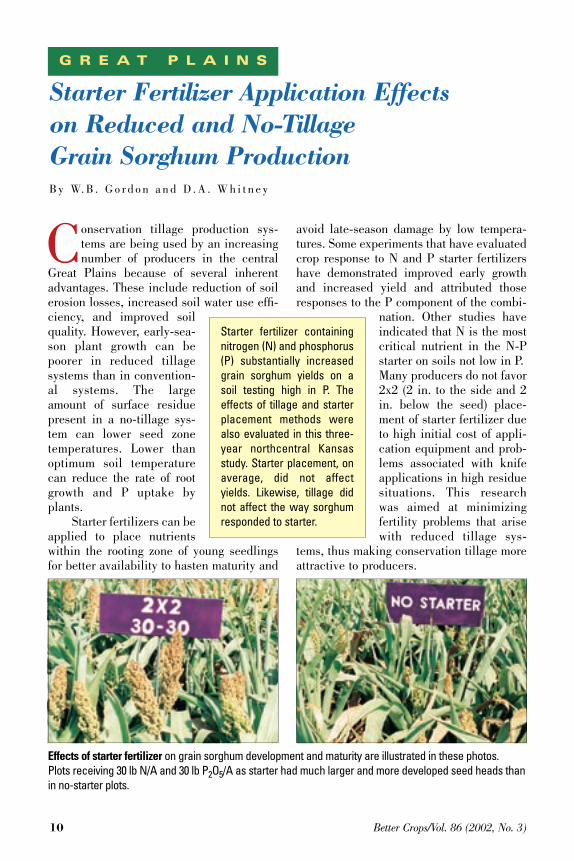
Starter fertilizer containingnitrogen (N) and phosphorus(P) substantially increasedgrain sorghum yields on asoil testing high in P. Theeffects of tillage and starterplacement methods werealso evaluated in this three-year northcentral Kansasstudy. Starter placement, onaverage, did not affectyields. Likewise, tillage didnot affect the way sorghumresponded to starter.
Effects of starter fertilizer on grain sorghum development and maturity are illustrated in these photos. Plots receiving 30 lb N/A and 30 lb P2O5/A as starter had much larger and more developed seed heads thanin no-starter plots.
Better Crops/Vol. 86 (2002, No. 3) 11
MethodsThe experiment was conducted at the
North Central Kansas Experiment Field on aCrete silt loam soil from the spring of 1999to the fall of 2001. Analysis by the KansasState University (KSU) Soil Testing Labora-tory showed that initial soil pH was 6.2,organic matter was 2.2 percent, Bray P-1was high [45 parts per million (ppm)], andexchangeable K was 320 ppm (very high) inthe top 6 in. of soil. Treatments consisted oftwo tillage systems (no-tillage and minimumtillage). The minimum tillage treatmentreceived one discing and harrowing opera-tion in the spring three weeks prior to plant-ing. Starter fertilizer was placed either 2x2or dribbled in a band on the soil surface 2 in.beside the seed at planting. Starter fertilizertreatments consisted of N and P2O5 combi-nations giving 15, 30, or 45 lb N/A with 30lb P2O5/A.
Treatments consisting of either 30 lbN/A or 30 lb P2O5/A applied alone and a nostarter check also were included. Startercombinations were made using 10-34-0 and28-0-0. After planting, knife applications of28-0-0 were made to bring N applied to eachplot to a total of 140 lb/A. Grain sorghum(NC + 7R83) was planted at the rate of60,000 seed/A in mid-May each year of theexperiment. At the V6 stage of growth, 20plants were randomly selected from eachplot and analyzed for dry weight and N andP concentration. Starting on September 8,2001, 10 sorghum heads were randomlyselected from each plot, threshed, and grainmoisture content measured. Plots were har-vested in mid-October each year.
ResultsOver the three years of the experiment,
tillage had no effect on the way grainsorghum responded to starter fertilizer(Table 1). All starter treatments increasedgrain yield over the no-starter check plots.There was no significant difference in starterplacement methods in yield of grainsorghum when averaged over starter fertiliz-er combinations and years (Table 2).However, some individual 2x2-placed startertreatments were superior to dribble applied.
The highest yields occurred with applica-tions of starter fertilizer containing higherrates of N (30 or 45 lb N/A) in combinationwith P. The N alone or the P alone treatments
TABLE 1. Tillage effects on grain yield, num-ber of days from emergence to mid-bloom and 6-leaf stage whole plant dry matter (averaged over starter treatment and placement method), Belleville 1999-2001.
Yield, Days to 6-leaf dryTillage bu/A mid-bloom matter, lb/A
Reduced 113 58 906No-Till 116 59 883LSD (0.05) NS* NS NS
*NS = not significant at the 5% level of probability.
TABLE 2. Starter fertilizer composition and application method effects on yield of grain sorghum, Belleville, 1999-2001.
Starter, lb/A Grain yield1, bu/AN P2O5 2x2 Dribble
0 30 104 10130 0 111 10815 30 116 11130 30 127 11845 30 127 120
Average 117 112LSD (0.05) 6
1No-starter check = 93 bu/A.
TABLE 3. Starter fertilizer composition and application method effects on num-ber of days from emergence to mid-bloom, Belleville, 1999-2001.
Number of days fromemergence to
Starter, lb/A mid-bloom1
N P2O5 2x2 Dribble
0 30 62 6230 0 58 60 15 30 55 6030 30 55 5745 30 54 55
Average 57 59LSD (0.05) 2
1No-starter check = 65 days.
(continued on page 15)
Most agronomic textbooks describethe visual symptoms of K deficiency as chlorosis (yellowing
of plant tissue due to a reduction in the chlorophyll formation process) or necrosis (death of plant tissue) on margins of lower, olderleaves. In practice, suchclassic symptoms may notalways be seen when thereis a shortage of K.
For those scoutingfields, it may prove useful to have pho-tographs of visual K deficiency symptomsassociated with end-of-season grain yieldsand tissue concentrations. This article pre-sents pictures of K-deficient corn plantstaken from research plots in eastern South
Dakota during the 2000 growing season. Descriptions are provided, alongwith other management information whenev-er possible.
In the following examples, averageyields are shown (where available) for the
treatments associated withthe pictures. For compari-son purposes, average yieldsand ear leaf K concentra-tions for the highest statisti-cally significant treatment
are shown in brackets [ ]. For digital images of these pictures,
visit the PPI Northcentral Region website athttp://www.ppi-ppic/northcentral and go to“Galleries.”
B y A n t h o n y B l y, R o n H . G e l d e r m a n , J a m e s G e r w i n g , a n d T. S c o t t M u r r e l l
N O R T H C E N T R A L
This article provides exam-ples of visual symptoms ofpotassium (K) deficiency incorn.
12 Better Crops/Vol. 86 (2002, No. 3)
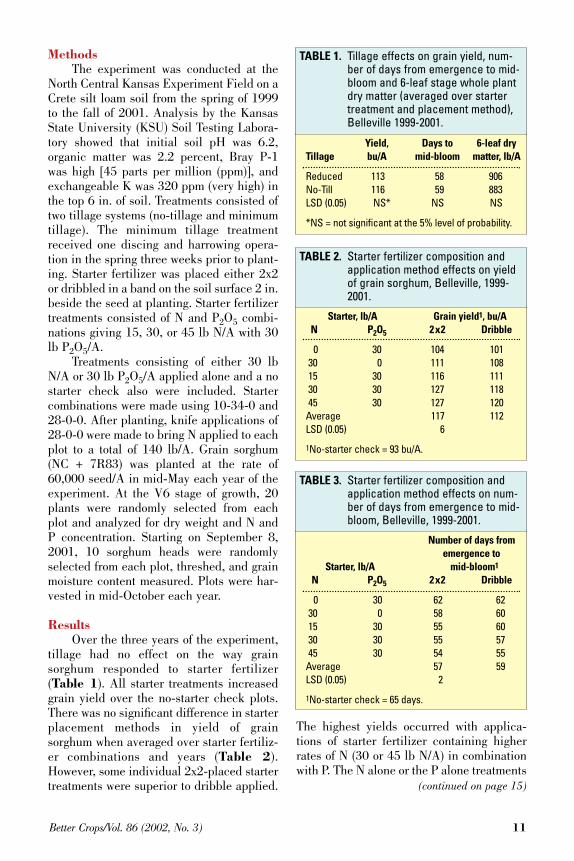
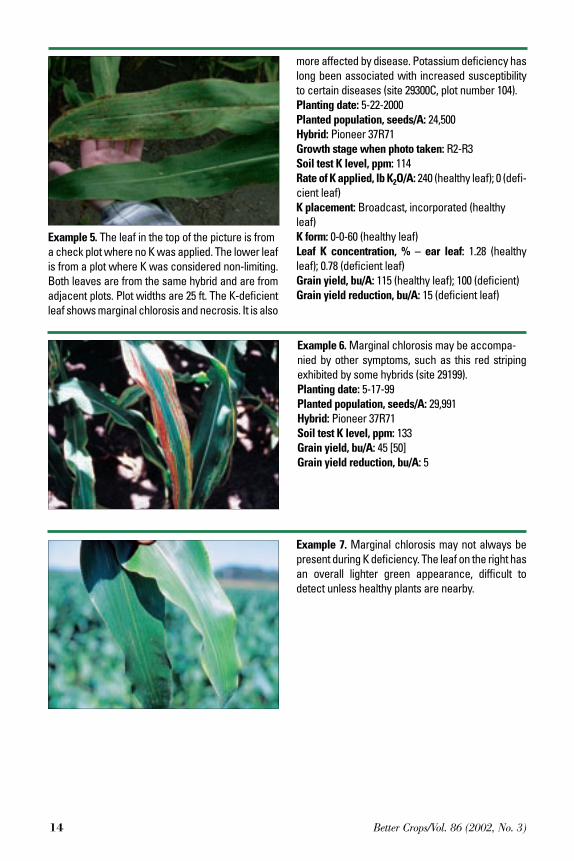
Example 1. Visible K deficiency symptoms usuallyoccur first on the lower, older tissue of the cornplant. At this South Dakota State University (SDSU)research location near White, SD, the K-deficient
lower leaves show marginal chlorosis and necrosis.The lowest leaf has more necrotic leaf area thandoes the leaf above it (site 29300C, plot number 102).Planting date: 5-22-2000Planted population, seeds/A: 24,500Hybrid: Pioneer 37R71Growth stage when photo taken: R2-R3Soil test K level, parts per million (ppm): 114Rate of K applied, lb K2O/A: 60K placement: Broadcast and incorporatedK form: 0-0-60 Leaf K concentration, % – ear leaf: 1.04 [1.04]Grain yield, bu/A: 119 [119]Grain yield reduction, bu/A: 0
Symptoms Associated with Potassium Deficiency in Corn

Better Crops/Vol. 86 (2002, No. 3) 13
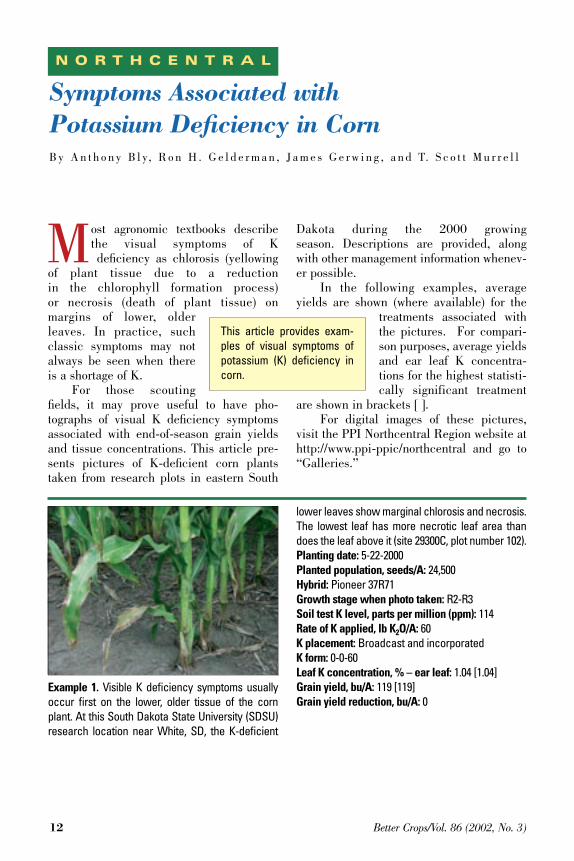
Example 2. At the same location as Example 1, K fer-tilizer (0-0-60) was broadcast at incremental ratesand then incorporated. The leaf in this picture isfrom a check plot where no K was applied. This K-
deficient leaf shows marginal chlorosis and necro-sis, worse at the leaf tip, and becoming progressive-ly less intense down the margin of the leaf (site29300C, plot number 104).Planting date: 5-22-2000Planted population, seeds/A: 24,500Hybrid: Pioneer 37R71Growth stage when photo taken: R2-R3Soil test K level, ppm: 114Rate of K applied, lb K2O/A: 0Leaf K concentration, % – ear leaf: 0.78 [1.04]Grain yield, bu/A: 100 [119]Grain yield reduction, bu/A: 19
Example 3. At this SDSU research location, 40 lbK2O/A was applied to the corn on the right, and no Kwas applied to the corn on the left. Potassium fertil-izer was 0-0-30 (a liquid mixture of potassiumhydroxide and potassium carbonate), applied 2 in. tothe side and 2 in. below the seed. All corn is thesame hybrid. Plot length is 50 ft. Many ears in the fer-tilized plot are higher from the ground than in the
unfertilized plot. When ears grow too low to theground, they become difficult to harvest and lossescan occur. Such differences are influenced not onlyby K fertility, but also by hybrid. Some hybrids in thistrial did not show such marked differences (site29900, plot number 327 left and 328 right).Planting date: 5-22-2000Planted population, seeds/A: 24,500Hybrid: Garst 8830Growth stage when photo taken: R6Soil test K level, ppm: 114Rate of K applied, lb K2O/A: 0 (left); 40 (right)K placement: 2x2 starter (right)K form: liquid mixture (0-0-30) Leaf K concentration, % – ear leaf: 0.87 (left); 1.11(right)Grain yield, bu/A: 69, (left); 83 (right)Grain yield reduction, bu/A: 14
Example 4. In this farmer field, corn the previousyear was K deficient and ears were low to theground. The combine missed many of the ears,resulting in harvest losses. Grain left in the field cre-ated a significant volunteer corn problem in the sub-sequent soybean crop. This illustrates the impactsof K deficiency on management areas other thansoil fertility and plant nutrition (area to left of site29100R).Growth stage when photo taken: R2Soil test K level, ppm: 126Soybean yield, bu/A: 21 (field average)
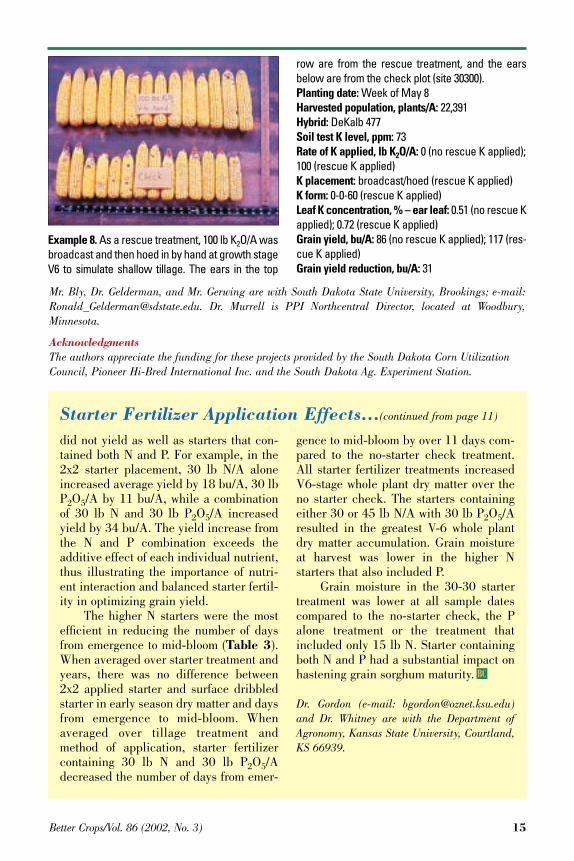
Example 6. Marginal chlorosis may be accompa-nied by other symptoms, such as this red stripingexhibited by some hybrids (site 29199).Planting date: 5-17-99Planted population, seeds/A: 29,991Hybrid: Pioneer 37R71Soil test K level, ppm: 133Grain yield, bu/A: 45 [50]Grain yield reduction, bu/A: 5
Example 7. Marginal chlorosis may not always bepresent during K deficiency. The leaf on the right hasan overall lighter green appearance, difficult todetect unless healthy plants are nearby.
14 Better Crops/Vol. 86 (2002, No. 3)
Example 5. The leaf in the top of the picture is from a check plot where no K was applied. The lower leafis from a plot where K was considered non-limiting.Both leaves are from the same hybrid and are fromadjacent plots. Plot widths are 25 ft. The K-deficientleaf shows marginal chlorosis and necrosis. It is also
more affected by disease. Potassium deficiency haslong been associated with increased susceptibilityto certain diseases (site 29300C, plot number 104).Planting date: 5-22-2000Planted population, seeds/A: 24,500Hybrid: Pioneer 37R71Growth stage when photo taken: R2-R3Soil test K level, ppm: 114Rate of K applied, lb K2O/A: 240 (healthy leaf); 0 (defi-cient leaf)K placement: Broadcast, incorporated (healthy leaf)K form: 0-0-60 (healthy leaf)Leaf K concentration, % – ear leaf: 1.28 (healthyleaf); 0.78 (deficient leaf)Grain yield, bu/A: 115 (healthy leaf); 100 (deficient)Grain yield reduction, bu/A: 15 (deficient leaf)
Better Crops/Vol. 86 (2002, No. 3) 15
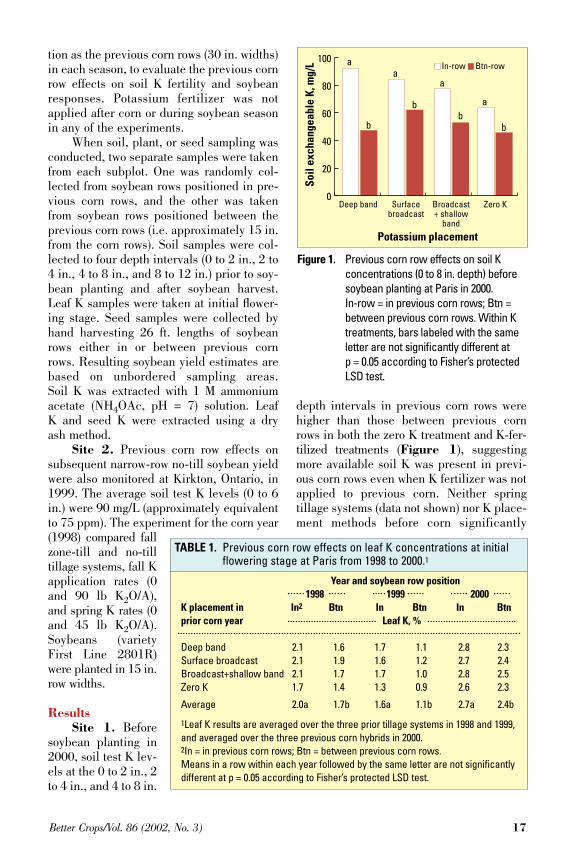
Example 8. As a rescue treatment, 100 lb K2O/A wasbroadcast and then hoed in by hand at growth stageV6 to simulate shallow tillage. The ears in the top
row are from the rescue treatment, and the earsbelow are from the check plot (site 30300).Planting date: Week of May 8Harvested population, plants/A: 22,391Hybrid: DeKalb 477Soil test K level, ppm: 73Rate of K applied, lb K2O/A: 0 (no rescue K applied);100 (rescue K applied)K placement: broadcast/hoed (rescue K applied)K form: 0-0-60 (rescue K applied)Leaf K concentration, % – ear leaf: 0.51 (no rescue Kapplied); 0.72 (rescue K applied)Grain yield, bu/A: 86 (no rescue K applied); 117 (res-cue K applied)Grain yield reduction, bu/A: 31
Mr. Bly, Dr. Gelderman, and Mr. Gerwing are with South Dakota State University, Brookings; e-mail:[email protected]. Dr. Murrell is PPI Northcentral Director, located at Woodbury,Minnesota.
Acknowledgments The authors appreciate the funding for these projects provided by the South Dakota Corn UtilizationCouncil, Pioneer Hi-Bred International Inc. and the South Dakota Ag. Experiment Station.
did not yield as well as starters that con-tained both N and P. For example, in the2x2 starter placement, 30 lb N/A aloneincreased average yield by 18 bu/A, 30 lbP2O5/A by 11 bu/A, while a combinationof 30 lb N and 30 lb P2O5/A increasedyield by 34 bu/A. The yield increase fromthe N and P combination exceeds theadditive effect of each individual nutrient,thus illustrating the importance of nutri-ent interaction and balanced starter fertil-ity in optimizing grain yield.
The higher N starters were the mostefficient in reducing the number of daysfrom emergence to mid-bloom (Table 3).When averaged over starter treatment andyears, there was no difference between2x2 applied starter and surface dribbledstarter in early season dry matter and daysfrom emergence to mid-bloom. Whenaveraged over tillage treatment andmethod of application, starter fertilizercontaining 30 lb N and 30 lb P2O5/Adecreased the number of days from emer-
gence to mid-bloom by over 11 days com-pared to the no-starter check treatment.All starter fertilizer treatments increasedV6-stage whole plant dry matter over theno starter check. The starters containingeither 30 or 45 lb N/A with 30 lb P2O5/Aresulted in the greatest V-6 whole plantdry matter accumulation. Grain moistureat harvest was lower in the higher Nstarters that also included P.
Grain moisture in the 30-30 startertreatment was lower at all sample datescompared to the no-starter check, the Palone treatment or the treatment thatincluded only 15 lb N. Starter containingboth N and P had a substantial impact onhastening grain sorghum maturity.
Dr. Gordon (e-mail: [email protected])and Dr. Whitney are with the Department ofAgronomy, Kansas State University, Courtland,KS 66939.
Starter Fertilizer Application Effects...(continued from page 11)

Vertical as well as horizontal K strati-fication occurs in surface soil hori-zons of no-till fields following corn
production. Several recent studies haveaddressed the effects of vertical stratifica-tion and the benefits of broadcast versusband placement of K fertil-izers before soybeans.
The issue of horizontalK stratification has beenlargely ignored, even thoughthe majority of no-till soy-bean production in NorthAmerica is in narrow-rowsystems following corn. Theresultant soybean plants in7.5 to 20 in. row width sys-tems are thus at various dis-tances from previous cornrows, but little is knownabout whether soybeanresponse varies with dis-tance to prior corn rows. Theknowledge gap becomesmore critical as the K fertil-ization strategies used bycorn farmers shift from pri-marily broadcast K applica-tion to deep banding (andwith or without starter appli-cation), when farmers relyonly on biennial K application before corn ina corn-soybean sequence, and when overallsoil exchangeable K is at less than optimumlevels for soybean production.
The primary objectives of this studywere to: 1) investigate the impacts of previ-ous corn rows on soil K fertility, leaf K nutri-tion, and seed yield of subsequent narrow-
row no-till soybeans; and 2) evaluate theinfluences of K fertilizer placement for thepreceding corn on soybean response to rela-tive proximity to corn rows.
Experimental ApproachSite 1. A corn-soybean
rotation was studied from1997 to 2000 on fields nearParis, Ontario, with a mini-mum six-year history of con-tinuous no-till. Soil test Klevels (0 to 6 in.) were in thelow range, less than 61 mg/L[approximately equivalent to 51 parts per million(ppm)], and the soil texturewas silt loam.
In 1997 and 1998, threespring tillage systems (no-till, zone-till, and mulch-till) were compared, withfour K placement meth-ods...deep band (6 in. deep),surface broadcast, broadcast+ shallow band (2 in. deep),and zero K. In 1999, thesame K placement methodswere compared, but only ina no-till system. Onlyspring-applied K was evalu-
ated in each season. When K fertilizer wasapplied, the rate was 107 lb K2O/A.
The identical experimental design andplot layout in the corn year were used for thesubsequent soybean seasons. Soybean vari-ety Pioneer 9163 was no-till planted in 1998and 1999, and NK S08-80 was grown in2000 in 7.5 in. row widths in the same direc-
Residual Impacts of Previous Corn Rowson Potassium Nutrition of No-Till Narrow Row SoybeansB y X i n h u a Yi n a n d To n y J . Vy n
O N T A R I O
Both leaf potassium (K) con-centrations and yield werehigher for no-till soybeanrows positioned near previ-ous corn rows than for thosesoybean rows positionedbetween corn rows inOntario research. The bene-fit of proximity to a previouscorn row was associatedwith higher soil test K levelsin corn rows and wasenhanced by K fertilizerapplications (particularlydeep banding) to corn.Adjustments to the currentsoil sampling method (usinga composite sample basedon random points within anarea) may be needed whennarrow-row no-till soybeansfollow corn on low- andmedium-testing K soils.
16 Better Crops/Vol. 86 (2002, No. 3)
tion as the previous corn rows (30 in. widths)in each season, to evaluate the previous cornrow effects on soil K fertility and soybeanresponses. Potassium fertilizer was notapplied after corn or during soybean seasonin any of the experiments.
When soil, plant, or seed sampling wasconducted, two separate samples were takenfrom each subplot. One was randomly col-lected from soybean rows positioned in pre-vious corn rows, and the other was takenfrom soybean rows positioned between theprevious corn rows (i.e. approximately 15 in.from the corn rows). Soil samples were col-lected to four depth intervals (0 to 2 in., 2 to4 in., 4 to 8 in., and 8 to 12 in.) prior to soy-bean planting and after soybean harvest.Leaf K samples were taken at initial flower-ing stage. Seed samples were collected byhand harvesting 26 ft. lengths of soybeanrows either in or between previous cornrows. Resulting soybean yield estimates arebased on unbordered sampling areas. Soil K was extracted with 1 M ammoniumacetate (NH4OAc, pH = 7) solution. Leaf K and seed K were extracted using a dry ash method.
Site 2. Previous corn row effects onsubsequent narrow-row no-till soybean yieldwere also monitored at Kirkton, Ontario, in1999. The average soil test K levels (0 to 6in.) were 90 mg/L (approximately equivalentto 75 ppm). The experiment for the corn year(1998) compared fallzone-till and no-tilltillage systems, fall Kapplication rates (0and 90 lb K2O/A),and spring K rates (0and 45 lb K2O/A).Soybeans (varietyFirst Line 2801R)were planted in 15 in.row widths.
ResultsSite 1. Before
soybean planting in2000, soil test K lev-els at the 0 to 2 in., 2to 4 in., and 4 to 8 in.
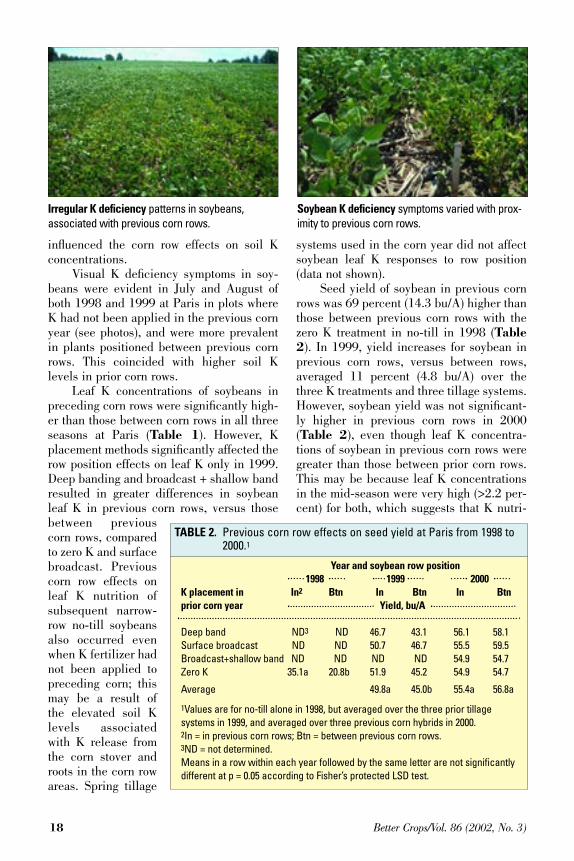
depth intervals in previous corn rows werehigher than those between previous cornrows in both the zero K treatment and K-fer-tilized treatments (Figure 1), suggestingmore available soil K was present in previ-ous corn rows even when K fertilizer was notapplied to previous corn. Neither springtillage systems (data not shown) nor K place-ment methods before corn significantly
Better Crops/Vol. 86 (2002, No. 3) 17
TABLE 1. Previous corn row effects on leaf K concentrations at initialflowering stage at Paris from 1998 to 2000.1
Year and soybean row position1998 1999 2000
K placement in In2 Btn In Btn In Btnprior corn year Leaf K, %
Deep band 2.1 1.6 1.7 1.1 2.8 2.3Surface broadcast 2.1 1.9 1.6 1.2 2.7 2.4Broadcast+shallow band 2.1 1.7 1.7 1.0 2.8 2.5Zero K 1.7 1.4 1.3 0.9 2.6 2.3
Average 2.0a 1.7b 1.6a 1.1b 2.7a 2.4b
1Leaf K results are averaged over the three prior tillage systems in 1998 and 1999,and averaged over the three previous corn hybrids in 2000.2In = in previous corn rows; Btn = between previous corn rows.Means in a row within each year followed by the same letter are not significantlydifferent at p = 0.05 according to Fisher’s protected LSD test.
0
20
40
60
80
100
Deep band Surfacebroadcast
Broadcast+ shallow
band
Zero K
Potassium placement
Soil
exch
ange
able
K, m
g/L In-row Btn-rowa
aa
a
b
bb
b
Figure 1. Previous corn row effects on soil K concentrations (0 to 8 in. depth) before soybean planting at Paris in 2000. In-row = in previous corn rows; Btn = between previous corn rows. Within K treatments, bars labeled with the same letter are not significantly different at p = 0.05 according to Fisher’s protected LSD test.
influenced the corn row effects on soil Kconcentrations.
Visual K deficiency symptoms in soy-beans were evident in July and August ofboth 1998 and 1999 at Paris in plots whereK had not been applied in the previous cornyear (see photos), and were more prevalentin plants positioned between previous cornrows. This coincided with higher soil K levels in prior corn rows.
Leaf K concentrations of soybeans inpreceding corn rows were significantly high-er than those between corn rows in all threeseasons at Paris (Table 1). However, Kplacement methods significantly affected therow position effects on leaf K only in 1999.Deep banding and broadcast + shallow bandresulted in greater differences in soybeanleaf K in previous corn rows, versus thosebetween previouscorn rows, comparedto zero K and surfacebroadcast. Previouscorn row effects onleaf K nutrition ofsubsequent narrow-row no-till soybeansalso occurred evenwhen K fertilizer hadnot been applied topreceding corn; thismay be a result ofthe elevated soil Klevels associatedwith K release fromthe corn stover androots in the corn rowareas. Spring tillage
systems used in the corn year did not affectsoybean leaf K responses to row position(data not shown).
Seed yield of soybean in previous cornrows was 69 percent (14.3 bu/A) higher thanthose between previous corn rows with thezero K treatment in no-till in 1998 (Table2). In 1999, yield increases for soybean inprevious corn rows, versus between rows,averaged 11 percent (4.8 bu/A) over thethree K treatments and three tillage systems.However, soybean yield was not significant-ly higher in previous corn rows in 2000(Table 2), even though leaf K concentra-tions of soybean in previous corn rows weregreater than those between prior corn rows.This may be because leaf K concentrationsin the mid-season were very high (>2.2 per-cent) for both, which suggests that K nutri-
18 Better Crops/Vol. 86 (2002, No. 3)
TABLE 2. Previous corn row effects on seed yield at Paris from 1998 to 2000.1
Year and soybean row position1998 1999 2000
K placement in In2 Btn In Btn In Btnprior corn year Yield, bu/A
Deep band ND3 ND 46.7 43.1 56.1 58.1Surface broadcast ND ND 50.7 46.7 55.5 59.5Broadcast+shallow band ND ND ND ND 54.9 54.7Zero K 35.1a 20.8b 51.9 45.2 54.9 54.7
Average 49.8a 45.0b 55.4a 56.8a
1Values are for no-till alone in 1998, but averaged over the three prior tillage systems in 1999, and averaged over three previous corn hybrids in 2000.2In = in previous corn rows; Btn = between previous corn rows.3ND = not determined.Means in a row within each year followed by the same letter are not significantlydifferent at p = 0.05 according to Fisher’s protected LSD test.
Irregular K deficiency patterns in soybeans, associated with previous corn rows.
Soybean K deficiency symptoms varied with prox-imity to previous corn rows.
tion was unlikely to have been alimiting factor for soybean yield in2000. The rainfall in June 2000was 8.6 in., 2.5 times higher thanthe 30-year average of 3.4 in.Higher soil moisture during criticalperiods in the growing season couldgreatly increase soil K availabilityand plant K uptake, and thusdecrease soybean responses toresidual K fertilizer applications.
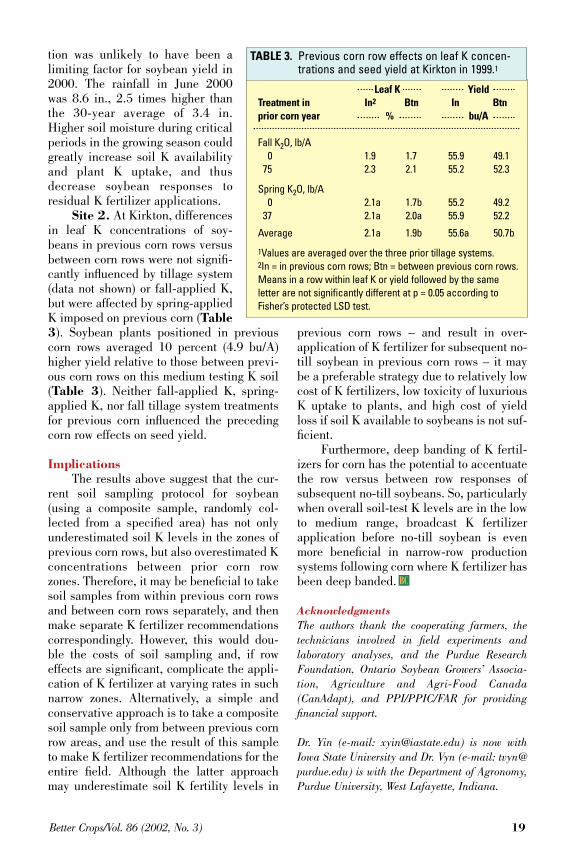
Site 2. At Kirkton, differencesin leaf K concentrations of soy-beans in previous corn rows versusbetween corn rows were not signifi-cantly influenced by tillage system(data not shown) or fall-applied K,but were affected by spring-appliedK imposed on previous corn (Table3). Soybean plants positioned in previouscorn rows averaged 10 percent (4.9 bu/A)higher yield relative to those between previ-ous corn rows on this medium testing K soil(Table 3). Neither fall-applied K, spring-applied K, nor fall tillage system treatmentsfor previous corn influenced the precedingcorn row effects on seed yield.
ImplicationsThe results above suggest that the cur-
rent soil sampling protocol for soybean(using a composite sample, randomly col-lected from a specified area) has not onlyunderestimated soil K levels in the zones ofprevious corn rows, but also overestimated Kconcentrations between prior corn rowzones. Therefore, it may be beneficial to takesoil samples from within previous corn rowsand between corn rows separately, and thenmake separate K fertilizer recommendationscorrespondingly. However, this would dou-ble the costs of soil sampling and, if roweffects are significant, complicate the appli-cation of K fertilizer at varying rates in suchnarrow zones. Alternatively, a simple andconservative approach is to take a compositesoil sample only from between previous cornrow areas, and use the result of this sampleto make K fertilizer recommendations for theentire field. Although the latter approachmay underestimate soil K fertility levels in
Better Crops/Vol. 86 (2002, No. 3) 19
TABLE 3. Previous corn row effects on leaf K concen-trations and seed yield at Kirkton in 1999.1
Leaf K YieldTreatment in In2 Btn In Btnprior corn year % bu/A
Fall K2O, lb/A0 1.9 1.7 55.9 49.1
75 2.3 2.1 55.2 52.3
Spring K2O, lb/A0 2.1a 1.7b 55.2 49.2
37 2.1a 2.0a 55.9 52.2
Average 2.1a 1.9b 55.6a 50.7b
1Values are averaged over the three prior tillage systems.2In = in previous corn rows; Btn = between previous corn rows.Means in a row within leaf K or yield followed by the same letter are not significantly different at p = 0.05 according toFisher’s protected LSD test.
previous corn rows – and result in over-application of K fertilizer for subsequent no-till soybean in previous corn rows – it maybe a preferable strategy due to relatively lowcost of K fertilizers, low toxicity of luxuriousK uptake to plants, and high cost of yieldloss if soil K available to soybeans is not suf-ficient.
Furthermore, deep banding of K fertil-izers for corn has the potential to accentuatethe row versus between row responses ofsubsequent no-till soybeans. So, particularlywhen overall soil-test K levels are in the lowto medium range, broadcast K fertilizerapplication before no-till soybean is evenmore beneficial in narrow-row productionsystems following corn where K fertilizer hasbeen deep banded.
AcknowledgmentsThe authors thank the cooperating farmers, thetechnicians involved in field experiments and laboratory analyses, and the Purdue ResearchFoundation, Ontario Soybean Growers’ Associa-tion, Agriculture and Agri-Food Canada(CanAdapt), and PPI/PPIC/FAR for providingfinancial support.
Dr. Yin (e-mail: [email protected]) is now withIowa State University and Dr. Vyn (e-mail: [email protected]) is with the Department of Agronomy,Purdue University, West Lafayette, Indiana.

Maintenance of adequate amounts ofsoil P through application of inorgan-ic and/or organic P sources is critical
for long-term agricultural productivity. In thesoil, applied P is partitioned into readily-avail-able (labile) and less readily-available (stable)inorganic and organic formswith different desorption, dis-solution, and mineralizationrates that may contribute toplant P nutrition. In general,long-term studies have ob-served a decline in soil organ-ic P fractions with continuouscultivation and no fertilityinputs. In farming systemsthat rely on organic fertility amendments, suchas animal manure, organic P fractions may bea more important source of plant-available Pthan for farming systems relying on P fertilizer.
Some have questioned whether traditionalsoil test procedures for plant-available P (e.g.Bray P-1) adequately assess the contribution ofmore stable inorgan-ic and organic soil Pfractions to nutritionof crops after long-term cultivation andrepeated fertilizer Papplicat ions.Weused a sequential Pextraction method todetermine potentialdifferences in theform and quantity ofdifferent inorganic(Pi) and organic (Po)soil P fractions(modified Hedley
procedure) in long-term (111 years) cultivatedplots and to assess the use of the Bray P-1extractant for determining changes in soil Pavailability in fertility programs utilizing fertil-izer or animal manure.
Plots on Sanborn Field at the Universityof Missouri campus havebeen unamended or annuallyamended with commercialfertilizers based on soil testrecommendations for Mis-souri or with 6 tons/A (wetweight basis) horse or dairymanure since 1888. Based onanalyses initiated in 1990,dairy manure applied to
Sanborn Field has had an average moisturecontent of 79 ± 7 percent and a nutrient con-tent of 1.9 ± 0.4 percent total nitrogen (N), 0.4± 0.5 percent total P, and 0.9 ± 0.7 percenttotal potassium (K). Horse manure appliedprior to the 1950s contained a relatively largerproportion of bedding material compared to
dairy manure. Allmanure was broad-cast-applied in thefall and commercialfertilizers were broad-cast-applied in thespring. Fertilizer Pwas applied as crudegrade acid phos-phate or normalsuperphosphate (16to 20 percent P2O5)up to the 1940s andtriple superphos-phate (46 percentP2O5) was applied
Inorganic and Organic Soil PhosphorusFractions after Long-Term Animal Manureand Fertilizer ApplicationsBy Pe t e r P. Mo t ava l l i and Randa l l J . M i l e s
M I S S O U R I
Analysis of soil test phos-phorus (P) fractions andBray P-1 after 111 years offertilizer or manure applica-tion on Sanborn Field indi-cates that cropping systemsand fertility practices affectthe proportion of soil inor-ganic and organic P.
Sanborn Field is shown during the 2000 growing season.Note the difference in corn growth response among thehistorical continuous corn plots with no added fertilityamendment and added manure or fertilizer.
20 Better Crops/Vol. 86 (2002, No. 3)
No fertilityamendment
Fertilizer –No-tillManure
Fertilizer

afterward. Rock phosphate (30 to 37 percentP2O5) was also applied sporadically to fertil-ized plots. All plots considered in this studywere tilled using a moldboard plow and thenwere disked twice before planting. We collect-ed soil samples from Sanborn Field to a depthof 8 in. during the fall of 1999 from long-termcropping systems plots including continuouscorn, continuous wheat, a corn-wheat-redclover rotation, and continuous timothy.Additional soil from the same plots was ana-lyzed by subsampling stored samples taken toa depth of 8 in. in 1915, 1938, and 1962.
Yield goals for grain and forage crops onSanborn Field increased from the croppingperiod of 1888-1949 to the cropping period of1990-1999, corresponding to changes in cropgenetics, fertilizer sources, and other develop-ments in agricultural technology (Table 1).Higher rates of N, P, and K fertilizer wereapplied on fertilizer-treated plots based onUniversity of Missouri soil test recommenda-tions to meet the higher yield goals. However,average crop yields observed on fertilizer- and
manure-treated plots during the three selectedperiods were below yield goals, especially onthe grain crops (Table 1), suggesting a possi-ble consistent over-application of nutrients dueto an over-estimation of the yield potential.Over-application of animal manure, and some-times commercial P fertilizer, can lead to soil Paccumulation in agricultural soils.
Corn grain yields were consistently high-er in fertilizer-amended plots compared to themanure-amended and control treatments overthe three periods of Sanborn’s history (Table1). The relatively lower corn yields withmanure can be explained by the low manureapplication rate (6 wet tons/A), the effects ofvarying amounts of bedding in the manure onN released to the crop, especially in the earlyperiods of Sanborn’s history when horsemanure was used, and the fact that most of themanure additions were calculated on a wetweight basis (thereby reducing the actualamount of nutrient-containing manure applied).Wheat yields increased with either addedmanure or fertilizer compared to the control
TABLE 1. Yield goals, fertilizer nutrient applications, and average grain and forage yields in selected periods for Sanborn Field.
Yield Fertilizer nutrients applied Grain or forage yields1
goal, N P2O5 K2O None Fertilizer ManurePeriod Crop bu or tons/A lb/A bu or tons/A
1888 - 19492 Corn (grain) 79 bu/A 126 44 82 21 bu/A 42.9 bu/A 35.7 bu/AWheat (grain) 40 bu/A 82 27 66 20 bu/A 20 bu/A 20 bu/AClover (forage) 3.0 tons/A 128 34 130 0.7 tons/A 3.1 tons/A 1.4 tons/ATimothy (forage) 3.0 tons/A — — — 1.1 tons/A — 2.4 tons/A
1950 - 19893 Corn (grain) 179 bu/A 167 67 144 21 bu/A 100 bu/A 64.3 bu/AWheat (grain) 40 bu/A 76 23 67 13 bu/A 40 bu/A 36.6 bu/AClover (forage) NA NA NA NA 1.8 tons/A 3.6 tons/A 3.2 tons/ATimothy (forage) NA — — — 1.0 tons/A — 2.9 tons/A
1990 - 19994 Corn (grain) 179 bu/A 208 0 0 25 bu/A 118 bu/A 64.3 bu/AWheat (grain) 70 bu/A 82 32 25 17 bu/A 33 bu/A 33.3 bu/AClover (forage) 4.2 tons/A 0 46 168 2.0 tons/A 1.4 tons/A 4.3 tons/ATimothy (forage) 4.0 tons/A — — — 1.0 tons/A — 2.7 tons/A
1Average annual grain or forage yields over selected period.2Crop residues removed after harvest. Horse manure with bedding applied for manure treatment. Fertilizer wasnot applied to the timothy cropping system.3Crop residues returned after harvest. Dairy manure applied for manure treatment. Information not available(NA) regarding yield goals for clover and timothy during this period. Fertilizer was not applied to the timothycropping system. For clover, P and K fertilizer were added based on soil test recommendations and informationon specific rates was not recorded.4Crop residues returned after harvest. Dairy manure applied for manure treatment. N, P, and K fertilizers addedbased on soil test recommendations. Numbers presented are averages over years of actual fertilizer applied.Fertilizer was not applied to the timothy cropping system.
Better Crops/Vol. 86 (2002, No. 3) 21
during the two periods from 1950 to 1999, butnot during the period from 1888 to 1949.Clover yields were higher with added fertilizeror manure during 1888 to 1989, but were notresponsive to fertilizer from 1990 to 1999.Timothy yields were consistently higher withadded manure compared to the control.
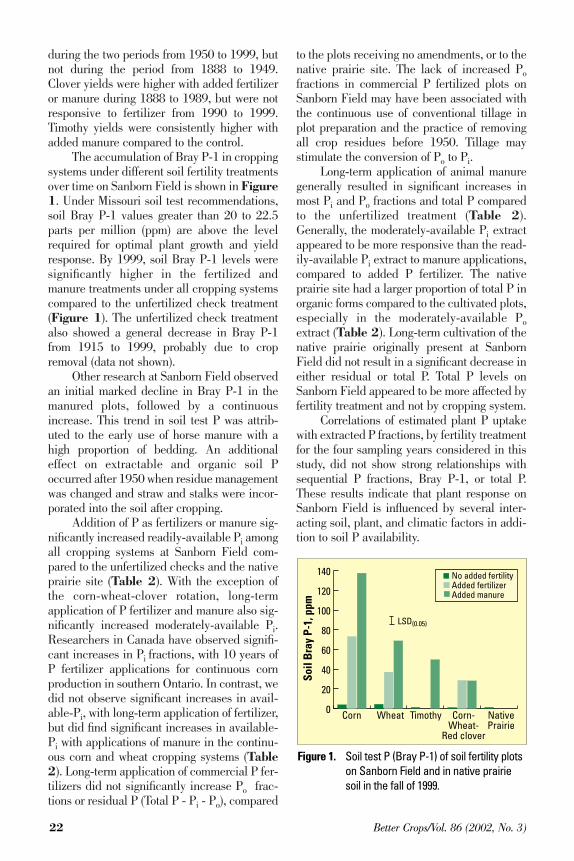
The accumulation of Bray P-1 in croppingsystems under different soil fertility treatmentsover time on Sanborn Field is shown in Figure1. Under Missouri soil test recommendations,soil Bray P-1 values greater than 20 to 22.5parts per million (ppm) are above the levelrequired for optimal plant growth and yieldresponse. By 1999, soil Bray P-1 levels weresignificantly higher in the fertilized andmanure treatments under all cropping systemscompared to the unfertilized check treatment(Figure 1). The unfertilized check treatmentalso showed a general decrease in Bray P-1from 1915 to 1999, probably due to cropremoval (data not shown).
Other research at Sanborn Field observedan initial marked decline in Bray P-1 in themanured plots, followed by a continuousincrease. This trend in soil test P was attrib-uted to the early use of horse manure with ahigh proportion of bedding. An additionaleffect on extractable and organic soil Poccurred after 1950 when residue managementwas changed and straw and stalks were incor-porated into the soil after cropping.
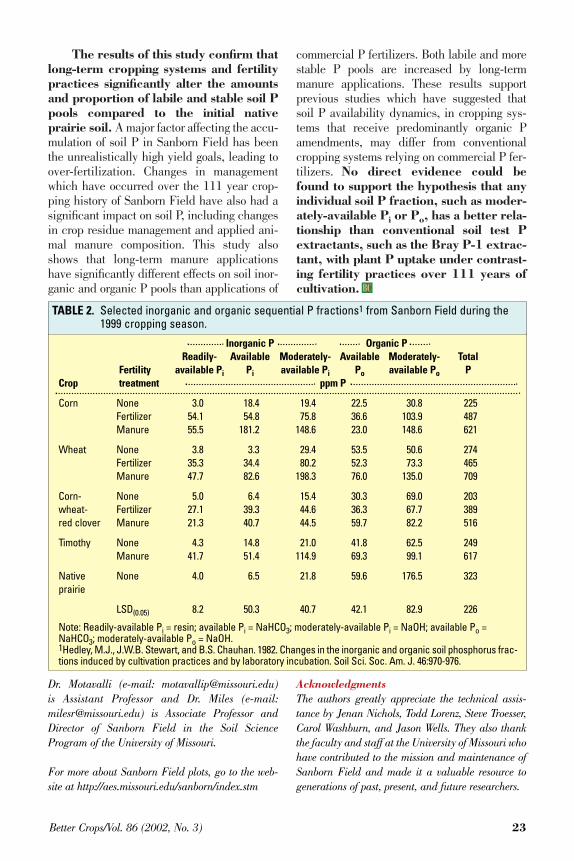
Addition of P as fertilizers or manure sig-nificantly increased readily-available Pi amongall cropping systems at Sanborn Field com-pared to the unfertilized checks and the nativeprairie site (Table 2). With the exception ofthe corn-wheat-clover rotation, long-termapplication of P fertilizer and manure also sig-nificantly increased moderately-available Pi.Researchers in Canada have observed signifi-cant increases in Pi fractions, with 10 years ofP fertilizer applications for continuous cornproduction in southern Ontario. In contrast, wedid not observe significant increases in avail-able-Pi, with long-term application of fertilizer,but did find significant increases in available-Pi with applications of manure in the continu-ous corn and wheat cropping systems (Table2). Long-term application of commercial P fer-tilizers did not significantly increase Po frac-tions or residual P (Total P - Pi - Po), compared
to the plots receiving no amendments, or to thenative prairie site. The lack of increased Pofractions in commercial P fertilized plots onSanborn Field may have been associated withthe continuous use of conventional tillage inplot preparation and the practice of removingall crop residues before 1950. Tillage maystimulate the conversion of Po to Pi.
Long-term application of animal manuregenerally resulted in significant increases inmost Pi and Po fractions and total P comparedto the unfertilized treatment (Table 2).Generally, the moderately-available Pi extractappeared to be more responsive than the read-ily-available Pi extract to manure applications,compared to added P fertilizer. The nativeprairie site had a larger proportion of total P inorganic forms compared to the cultivated plots,especially in the moderately-available Poextract (Table 2). Long-term cultivation of thenative prairie originally present at SanbornField did not result in a significant decrease ineither residual or total P. Total P levels onSanborn Field appeared to be more affected byfertility treatment and not by cropping system.
Correlations of estimated plant P uptakewith extracted P fractions, by fertility treatmentfor the four sampling years considered in thisstudy, did not show strong relationships withsequential P fractions, Bray P-1, or total P.These results indicate that plant response onSanborn Field is influenced by several inter-acting soil, plant, and climatic factors in addi-tion to soil P availability.
0
20
40
60
80
100
120
140
Corn Wheat Timothy Corn-Wheat-
Red clover
NativePrairie
Soil
Bra
y P-
1, p
pm
No added fertilityAdded fertilizerAdded manure
LSD(0.05)
Figure 1. Soil test P (Bray P-1) of soil fertility plots on Sanborn Field and in native prairie soil in the fall of 1999.
22 Better Crops/Vol. 86 (2002, No. 3)
The results of this study confirm thatlong-term cropping systems and fertilitypractices significantly alter the amountsand proportion of labile and stable soil Ppools compared to the initial nativeprairie soil. A major factor affecting the accu-mulation of soil P in Sanborn Field has beenthe unrealistically high yield goals, leading toover-fertilization. Changes in managementwhich have occurred over the 111 year crop-ping history of Sanborn Field have also had asignificant impact on soil P, including changesin crop residue management and applied ani-mal manure composition. This study alsoshows that long-term manure applicationshave significantly different effects on soil inor-ganic and organic P pools than applications of
commercial P fertilizers. Both labile and morestable P pools are increased by long-termmanure applications. These results supportprevious studies which have suggested thatsoil P availability dynamics, in cropping sys-tems that receive predominantly organic Pamendments, may differ from conventionalcropping systems relying on commercial P fer-tilizers. No direct evidence could befound to support the hypothesis that anyindividual soil P fraction, such as moder-ately-available Pi or Po, has a better rela-tionship than conventional soil test Pextractants, such as the Bray P-1 extrac-tant, with plant P uptake under contrast-ing fertility practices over 111 years ofcultivation.
TABLE 2. Selected inorganic and organic sequential P fractions1 from Sanborn Field during the 1999 cropping season.
Better Crops/Vol. 86 (2002, No. 3) 23
Inorganic P Organic PReadily- Available Moderately- Available Moderately- Total
Fertility available Pi Pi available Pi Po available Po PCrop treatment ppm P
Corn None 3.0 18.4 19.4 22.5 30.8 225Fertilizer 54.1 54.8 75.8 36.6 103.9 487Manure 55.5 181.2 148.6 23.0 148.6 621
Wheat None 3.8 3.3 29.4 53.5 50.6 274Fertilizer 35.3 34.4 80.2 52.3 73.3 465Manure 47.7 82.6 198.3 76.0 135.0 709
Corn- None 5.0 6.4 15.4 30.3 69.0 203wheat- Fertilizer 27.1 39.3 44.6 36.3 67.7 389red clover Manure 21.3 40.7 44.5 59.7 82.2 516
Timothy None 4.3 14.8 21.0 41.8 62.5 249Manure 41.7 51.4 114.9 69.3 99.1 617
Native None 4.0 6.5 21.8 59.6 176.5 323prairie
LSD(0.05) 8.2 50.3 40.7 42.1 82.9 226
Note: Readily-available Pi = resin; available Pi = NaHCO3; moderately-available Pi = NaOH; available Po =NaHCO3; moderately-available Po = NaOH.1Hedley, M.J., J.W.B. Stewart, and B.S. Chauhan. 1982. Changes in the inorganic and organic soil phosphorus frac-tions induced by cultivation practices and by laboratory incubation. Soil Sci. Soc. Am. J. 46:970-976.
Dr. Motavalli (e-mail: [email protected]) is Assistant Professor and Dr. Miles (e-mail:[email protected]) is Associate Professor andDirector of Sanborn Field in the Soil ScienceProgram of the University of Missouri.
For more about Sanborn Field plots, go to the web-site at http://aes.missouri.edu/sanborn/index.stm
AcknowledgmentsThe authors greatly appreciate the technical assis-tance by Jenan Nichols, Todd Lorenz, Steve Troesser,Carol Washburn, and Jason Wells. They also thankthe faculty and staff at the University of Missouri whohave contributed to the mission and maintenance ofSanborn Field and made it a valuable resource togenerations of past, present, and future researchers.
Potash & Phosphate InstituteSuite 110, 655 Engineering Drive
Norcross, Georgia 30092-2837
PeriodicalsPostage
WILL YOUR CROP RUN OUT OF GAS THIS YEAR?
I’ve never understood why people let their cars run out of gas. Everybody knows a carwon’t run without gasoline in the tank. The gas gauge tells them when the tank isapproaching empty, and there are gas stations on nearly every street corner. Maybe some
like the challenge of seeing if they can go one more mile or reach the next station before theengine sputters to a stop. Maybe they just like taking risks. Whatever the reason, it doesn’tmake sense. Gasoline may be expensive, but a tank full is still cheaper than the cost of a towtruck.
Phosphorus (P) and potassium (K) are a lot like gasoline. Crops can’t grow and producean economic yield without them. Soil tests, as the gas gauge in a car, measure P and K lev-els and tell farmers when these (and other) essential plant nutrients should be applied.However, when farmers allow their soils to run low in P or K, they are risking much morethan a car stalled on a roadside because of an empty gas tank. They are risking yield poten-tial and profits…their very livelihood.
A recent North American soil test survey conducted by the Institute showed thatbetween 40 and 50 percent of the more than 2.0 million soil samples evaluated tested medi-um or below in either or both P and K. Unlike the automobile, the soil’s PK tank doesn’t haveto be empty before crop yields and farmer profits are negatively affected. Low and mediumsoil tests take away from potential yields and profits, and they do it every year fertility lev-els aren’t rebuilt to an optimum level.
Where is the PK gauge registering in your fields or those of your farmer customers? Isit approaching the empty mark? Take the opportunity to find out, beginning during this grow-ing season. Make visual observations. Look for deficiencies. Document potential problemareas by taking plant samples and having them analyzed. When crops are harvested this fall,have soils tested. Then put all the information together and come up with a plan to refill thesoil’s PK tank before next year’s crop is planted.
Don’t take the risk of allowing a crop to run out of P and K when it is so easy to refillthe tank. Keep soil fertility levels high to help crops reach their yield potential.