Embed Size (px)
Citation preview

2002 Investors’ GuideYear Ended March 31, 2002

Nippon COMSYS Corporation was established in 1951, during Japan’s postwar turmoil, to undertake the rebuilding of the
country’s telecommunications infrastructure. That was the year before the establishment of Nippon Telegraph and
Telephone Public Corporation, which was later privatized and renamed Nippon Telegraph and Telephone Corporation (NTT).
At that time, the primary function of Nippon COMSYS Corporation was to execute telecommunications network construction
projects in support of NTT. The Company subsequently made a place for itself in the industry on the basis of its successes
in the postwar construction of Japan’s telecommunications infrastructure, and has remained an industry leader to this
day. Nippon COMSYS Corporation will continue to expand its business, seeking to contribute to the development of the
information society of the future.
Five-Year Financial Summary ・・・・・・・・・・・・・・・・・・・・・・・・1
Toward Ubiquitous Computing in a Networked Society ・・・・・・・・・・・・・2
Medium-Term Management Plan ・・・・・・・・・・・・・・・・・・・・・・4
Construction Flow for COMSYS’s Telecommunications Equipment ・・・・・・・・5
Our Operations: an Overview・・・・・・・・・・・・・・・・・・・・・・・・6
Featured Technologies・・・・・・・・・・・・・・・・・・・・・・・・・・・9
Activities to Preserve the Earth’s Environment・・・・・・・・・・・・・・・・・10
Financial Section (Non-Consolidated Basis)・・・・・・・・・・・・・・・・・・11
Non-Consolidated Statements of Income (10 Years) ・・・・・・・・・・・・・・23
Non-Consolidated Balance Sheets (10 Years) ・・・・・・・・・・・・・・・・・24
Consolidated Subsidiaries and Affiliates ・・・・・・・・・・・・・・・・・・・26
Group Companies・・・・・・・・・・・・・・・・・・・・・・・・・・・・27
Comparison of Three Major Telecommunications Construction Companies in Japan
Non-Consolidated Basis・・・・・・・・・・・・・・・・・・・・・・・・28
Consolidated Basis ・・・・・・・・・・・・・・・・・・・・・・・・・29
Stock Price Information ・・・・・・・・・・・・・・・・・・・・・・・・・30
Corporate Information ・・・・・・・・・・・・・・・・・・・・・・・・・・31
Brief History of COMSYS・・・・・・・・・・・・・・・・・・・・・・・・・32
■ Profile
■ Contents
■ Cautionary Statement with Respect to Forward-Looking StatementsThis Investors’ Guide contains forward-looking statements that reflect management’s views and assumptions in the light of information
currently available with respect to certain future events, including expected financial position, operating results and business strategies.
These statements can be identified by the use of terms such as “will,” “believes,” “should,” “projects,” “plans,” “expects” and similar
terms and expressions that identify future events or expectations. Actual results may differ materially from those projected, and the events
and results of such forward-looking assumptions cannot be assured. Any forward-looking statements speak only as of the date of this
Investors’ Guide, and COMSYS assumes no duty to update such statements.
Factors that may cause actual results to differ materially from those predicted by such forward-looking statements include, but are
not limited to, unanticipated changes in demand for the Company’s principal business, owing to changes in the economic conditions in
the Company’s principal markets; the impact of increased competition; uncertainties as to the results of the Company’s research and devel-
opment efforts and its ability to access and protect certain intellectual property rights; and the impact of regulatory changes and
accounting principles and practices.
2COMSYS Chosen for NikkeiOn March 6, 2002, COMSYS was chosen for
inclusion in the Nikkei Stock Average, joining the
225 leading firms on the first section of the
Tokyo Stock Exchange whose stock prices are
included in this important indicator.
1COMSYS Again Selected as Top IR FirmFor the second consecutive year, COMSYS has been
selected as the firm with the best investor relations
program in the construction industry. The award was
made in October 2001 by the Securities Analysts
Association of Japan, and is public acknowledgement
of the Company’s vigorous information disclosure
measures. COMSYS will do its utmost to continue to be
worthy of this award.

Investors’ Guide 2002
1
■ Consolidated(Millions of yen) 1998/3 1999/3 2000/3 2001/3 2002/3
New Orders Received during the Year 235,923 229,875 228,518 229,211 213,985Net Sales 225,313 220,522 231,750 222,220 231,351Operating Income 14,348 14,261 15,559 11,628 10,500Income before Income Taxes 14,333 13,522 13,054 9,117 8,913Net Income 8,309 5,625 6,315 4,498 4,107Total Assets 166,067 171,669 188,961 188,250 190,576Shareholders’ Equity 94,654 101,721 115,834 118,055 111,919
(Yen)
Primary Earnings per Share 66.55 42.97 46.73 33.11 30.39Book Value per Share 725.59 765.74 851.01 869.84 835.04
■ Non-Consolidated(Millions of yen) 1998/3 1999/3 2000/3 2001/3 2002/3
New Orders Received during the Year 234,877 228,838 223,789 222,486 200,900Net Sales 224,103 219,764 226,146 215,586 219,206Operating Income 14,061 13,877 13,626 10,402 8,526Income before Income Taxes 14,041 12,755 10,781 7,980 6,519Net Income 7,611 5,075 5,818 4,283 3,461Total Assets 160,561 166,002 171,802 174,118 159,344Shareholders’ Equity 90,101 96,635 110,400 112,529 102,883
(Yen)
Primary Earnings per Share 60.96 38.78 42.78 31.27 25.48Book Value per Share 690.68 727.44 804.86 822.32 763.53
■ Ratios of Consolidated to Non-Consolidated Performance(Times) 1998/3 1999/3 2000/3 2001/3 2002/3
Net Sales 1.01 1.00 1.02 1.03 1.06Operating Income 1.02 1.03 1.14 1.12 1.23Income before Income Taxes 1.02 1.06 1.21 1.14 1.37Net Income 1.09 1.11 1.09 1.05 1.19Number of Consolidated Subsidiaries and Affiliates 2 2 8 14 14
■ Net Sales
0200 0199980
250,000
150,000
200,000
100,000
50,000
1.45
1.25
1.35
1.15
1.05
0.95
(Million ¥) (Times)
ConsolidatedNon-Consolidated
Consolidated/Non-Consolidated ConsolidatedNon-Consolidated
Consolidated/Non-Consolidated
■ Operating Income
0200 0199980
17,500
10,500
14,000
7,000
3,500
1.45
1.25
1.35
1.15
1.05
0.95
(Million ¥) (Times)
ConsolidatedNon-Consolidated
Consolidated/Non-Consolidated
■ Income before Income Taxes
0200 0199980
15,000
9,000
12,000
6,000
3,000
1.45
1.25
1.35
1.15
1.05
0.95
(Million ¥) (Times)
ConsolidatedNon-Consolidated
Consolidated/Non-Consolidated
■ Net Income
0200 0199980
10,000
6,000
8,000
4,000
2,000
1.45
1.25
1.35
1.15
1.05
0.95
(Million ¥) (Times)
■ Five-Year Financial Summary

■ Fostering and Organizing IP Technicians—IT Business Division LaunchedWith the explosion of information technology, various systems using Internet protocol network tech-
nology are being developed in the marketplace. The need for design, maintenance, and adminis-
tration services is growing as a result, as is the need for package outsourcing of these functions.
At COMSYS, we have designated the provision of network solutions to these needs as
one of our core businesses, and in March 2001 established the IT Business Division. This new
division is composed of a Marketing Section, a Systems Solutions Section, an Internet
Protocol Section, a Broadband Development Section, and a Comsys IP Network Integration
Support Section. Combining the Company’s experience in telecommunications construction
project execution, its expertise in the development of application software, and its strength in
cutting-edge IP Network technology, we will be providing top flight total solutions service.
COMSYS has been placing particular emphasis on the training of IP technicians, with
a view to expanding its IP business, and approximately 1,000 employees have obtained various
vendor certifications in IP-related areas. These IP technicians will augment their abilities in
the course of their business activities, and we believe that this will strengthen the
Company’s overall strength.
■ Strengthening our Affiliate StructureApproximately 70% of the cost of completed projects is composed of subcontracting costs. That
is why strengthening the structure of affiliates is an important issue for COMSYS. As many of
our affiliates are small firms that specialize in particular areas, we are combining some
affiliates and strengthening their structures with the aim of to diversifying technological
capabilities, enhancing operational efficiency, and upgrading project supervision.
In addition, we are identifying those affiliates that efficiently produce high-quality work,
and have instituted a subcontracting system that provides them with an incentive in the form
of increased order volume. Further, COMSYS is providing these designated companies
with numerous technicians through temporary or permanent transfer, thus promoting the
active transfer of technologies.
■ Toward Ubiquitous Computing in a Networked Society
Investors’ Guide 2002
2
■ Training Schedule (Fiscal Year Ended March 31, 2003)COMSYS employees Partner company employees Total
Participants Approx. 7,100 Approx. 3,800 Approx. 10,900Total number of personnel/day Approx. 27,400/day Approx. 8,200/day Approx. 35,600/day
■ Main Training ItemsIP technical training, access construction techniques, design, infrastructure construction techniques,“Inside” construction techniques, measurement training, safety training, quality control training,cost estimation training, qualifications acquisition, basic training for new employees, etc.
■ Training CostsTraining will generally carry an annual cost from ¥600 to ¥700 million.
Education and Training Center in Omiya

Investors’ Guide 2002
3
■ Expanding our Business DomainThe development of new businesses is an important issue under our COMSYS-21 plan,
which sets forth the new goal of becoming a comprehensive engineering firm for the
21st century. Since being established in July 2000, the Company’s Business Development
Department has undertaken various projects such as the “LAN Convenience Store” service to
assist small office-home office users and small and medium sized businesses in building LANs
and WANs using the Internet and environment-related projects operating in the fields of
wind power and solar power.
To further expand its new business development projects, in December 2001 the
Company instituted an internal venture system, which asks each employee throughout
the Company for new businesses ideas in the key fields of IP, IT, health, benefits, and the envi-
ronment. This supports the vigorous establishment of new businesses. The Business
Development Department has established a new business home page and the New
Business Mail Magazine for employees, establishing a new business development system in
which all employees participate regardless of division or position.
The government’s e-Japan Strategy speaks of the goal of becoming the world’s
preeminent IT nation within five years, through the construction of an ultra-high-speed Internet
infrastructure, the quick realization of continuous connection Internet service, the estab-
lishment of regulations for e-commerce, the realization of e-government, and, through
human development suited to the new era, the establishment of an environment that is based on
market principles and allows the fullest possible expression of the power of the private sector.
In addition to IT, we at COMSYS are also concerned with the environment and the aging
society, and are striving to evolve quickly into a comprehensive engineering firm for the IT-
revolution era that can make a substantial contribution to a better society in the 21st century.
■ Acquisition of Main Vendor Qualifications(Unit: Persons)
Qualifications Name 2001/3 2002/3 AnnualIncrease
Microsoft Certified Engineer (MCSE) 1 1 0
MicrosoftMicrosoft Certified Engineer (MCSE+INTERNET) 1 1 0
Microsoft Certified Engineer (Professional) 0 19 19
Microsoft Certified Engineer (MCP) 445 511 66
Cisco Certified Engineer (CCNA) 234 452 218
Cisco Cisco Certified Engineer (CCDA) 8 28 20
Cisco Certified Engineer (CCNP) 0 38 38
Oracle Master (SILVER) 32 45 13
Oracle Oracle Master (GOLD) 6 9 3
Oracle Master (PLATINUM) 1 4 3
hp HP Certified Engineer (HP-UX System Administration) 0 2 2
NotesNotes (CLP) 11 11 0
Notes (CLS) 2 4 2
Total 741 1,125 384
Home page Mail Magazine Forum room
MALIONET(Intranets)
Employees can participate using their home computers
Proposals andparticipation
Registration system (by theme)Registration
system
Business Development Department
· Announcement of launch of Mail Magazine· Call for participation (e-mail to employees)
BREEZYCOMSYS
(Company newsletter)
Staff
Internal venture system
■ New Business Development System Enabling Universal Employee Participation

Investors’ Guide 2002
4
■ Medium-Term Management Plan
■ Performance Indicators2002/3 2007/3 Percent
(Performance) (Planned) change
NTT Projects 1,323 1,100 0.83Net sales
Other Business 870 2,000 2.30(¥100 million)Total 2,192 3,100 1.41
Recurring Profit (¥100 million) 93 160 1.72
Recurring Profit Margin (%) 4.3 5.2 —
Number of Employees 3,542 3,240 0.91
NTT and NTT DoCoMo Type 1 carriers (fixed + mobile)
Public & private sector demand (including some IT and software related demand)
■ Telecommunications Construction Market
(¥100 million)
As a comprehensive engineering firm for the high-order information society, Nippon COMSYS Corporation pursues its business
within the context of a corporate philosophy that strives to support social progress. COMSYS launched its COMSYS-21 medium-term
management plan in fiscal 2001, ended March 31, 2002, when the Company marked its 50th anniversary. This is the initial
strategy of our next 50 years.
Throughout the world, humankind is literally entering an IT-revolution era. The telecommunications market, in particular,
has advanced from its 20th century emphasis on telephony to become centered on Internet protocol communications.
Changes are diverse and rapid, making for intense cost competition.
The Company is striving to respond to these market conditions with the cooperation of its affiliates, while pursuing the
goals of its medium-term management plan through the five innovations described below.
■ FIVE INNOVATIONS1. Man Power Innovation Dynamic deployment and right-sizing of the workforce—training, integration, and proper organization of IP techniciansOperational personnel will be organized into a pool to facilitate support, and IP technological capabilities will be strengthened as called for in the COINS
Project. Marketing personnel will be reorganized according to their skills and market needs, and the administrative sector will be slimmed down.
2. Motivation Power InnovationShifting to a winning personnel and remuneration structureThe Company will implement a wage structure corresponding to the Company’s performance, a regional wage structure that
reflects actual competitive conditions, an annual salary system for all management-level employees, reforms of the personnel system
to include an ability-based grade system, and a re-evaluation of the wage structure.
3. Collaboration Power InnovationEnhancing project-execution capabilities by strengthening the affiliate structure, and optimizing subcontracting expensesThis will involve concentrating capabilities by reorganizing the Companies of the Group, fostering superior subsidiaries, affiliates, and
associates through directed subcontracting, and reducing subcontracting costs through enhanced and strengthened subcontracting control.
4. Business Spec InnovationBroad-ranging enhancement of administrative efficiencyEfficiency gains will be enhanced through the establishment of a computerized work-site administrative support system. Together with
this, Group administration will be concentrated through joint administration and outsourcing.
5. Corporate Ability InnovationExpanding our sphere of operationsThe Company will strengthen its involvement in wind and solar power generation projects, as well as its involvement in “total business
solutions.” We will also press forward in joint businesses with firms in other industries, as well as expanding the scope of new businesses.
IT business (including some software related sales)
Architecture NTT and NTT DoCoMo
Systems engineering (including some IT related sales)
Information systems OverseasEcosystems
■ Sales Targets
(¥100 million)

■ Construction Flow for COMSYS’s Telecommunications Equipment
Wire-link Communication System
Cable Broadcasting System
Radio Broadcasting System
Radio Telephony System
Business Users
BS/CS
Radio Base Station
Mobile Telephony Switching Station
MobileTelecommunication
System
PDCW-CDMA(FOMA)CDMA2000
ADSL・FTTH
FWATelephoneFAXPC
Cable Feeder Point
Data Center
Internet Provider
Internet Cafe
Hotspot
Toll on Trank Bldg.
Relay Station
Submarine Optical Fiber Cable
Cable Television Firm
Broadcasting Station
Land Station
Local Swich Bldg.
Junction Swich Bldg.
Home User
Home User
Home User
Regional network for prefectual and municipal governments Building of infrastructure
Internet-ready condominium/hotel
Home User
Call Center
Mobile Telephone
Microwave Transmitter
Ground Wave Broadcast
Broadcast Satellite/Communications Satellite Broadcasts CTI
LAN/WAN
Cable Feeder Point
Building of VPN for business users―IP-VPN�―Internet VPN�―Wide area Ethernet
Swich
Router Router
Local Swich Bldg.Junction Swich Bldg.
Swich
Router
Router
Server
Core Router Toll on Trank Bldg.
Server
Core Router
Switch
Optical Fiber Cable
WDM Equipment
Land Station
WDM Equipment
Server/HUB/Router
Solar Power Facility ATM Switch
Switch
Switch
Investors’ Guide 2002
5

Investors’ Guide 2002
6
■ Our Operations: an Overview
As the high-order information society continues to advance, the focus of
communications is shifting from voice to digital data. For this reason,
Japan needs to develop an Internet-provider network, beginning with
high-speed broadband access facilities. Since its founding in 1951, reliable
technological expertise has kept COMSYS in the forefront of the
telecommunications construction industry, and the Company has played a
significant role in the building of Japan’s communications infrastructure. In
this era, with the IT revolution progressing at an accelerating pace,
COMSYS is pursuing leading-edge technology and demonstrating an
eagerness to take on these new challenges. At the same time, we
are contributing to the growth of the communications society.
■ Cable-Tunnel Construction Project(underground tunnel construction)
This shows the laying of high-capacity undergroundcommunications cables. Such projects are complex, asurban areas lay not only communications cablesunderground, but also gas lines, water lines, and variousother infrastructure. COMSYS’s high technologicallevel allows the Company to carry out high-levelprojects, and has executed approximately one-third of allsuch communications tunnel projects in Japan.
■ Conduit Line Construction Project by the Open-Cut Method
Digging directly from the surface, COMSYSinstalls CC BOX and Information BOX facilities.Because telephone poles are eliminated, thesefacilities are more resistant to natural disaster,and contribute to urban beautification.
■ Cable Engineering Works Project (installation of communications cables)COMSYS is engaged in the design, installation,and testing of communications cable networks invarious locations, including cable systems linking thevarious NTT buildings and linking the facilities ofother common carriers, and cable systems withinintelligent buildings. The Company is also linkingfamily homes to various services using telephonelines. More than telephone lines, the Company isengaged in the building of optical-fiber, cabletelevision, Internet-protocol, and other communi-cations networks.
■ Switching System and Transmission Equipment ProjectsCOMSYS is engaged in the installation of switching systems and transmission equip-ment, together with the installation, connection, and maintenance of cables,connectors, and other peripherals. We are building systems and facilities that allowthe error-free switching and long-distance transmission of the information thatcomes through telecommunications providers.
■ Electric Power Equipment ProjectsTo enable communications facilities to function smoothly, an infrastructure of powergeneration facilities, battery-charging equipment, converters, cable connections,and maintenance services is necessary. COMSYS is engaged in the construction andexpansion of this infrastructure, and is building electric power systems suited to supplythe communications facilities and equipment of telecommunications firms.
■ “Outside” Projects
■ “Inside” Projects
Communications Infrastructure Projects

Investors’ Guide 2002
7
The Company executes all phases of the construction of mobile telephone base stations, from selection
of locations and negotiations of property rights, to the design, execution, and testing of the stations them-
selves. Because base stations must be designed to suit and constructed in a wide variety of environments,
a high degree of technological expertise and specialized knowledge is required. For this reason,
COMSYS is ideally suited to operate in the field of mobile telecommunications projects. COMSYS has also
achieved a number of successes in the construction of third-generation mobile telephone facilities.
■ A Steel Tower for a Mobile Telecommunications SystemCOMSYS has built the best track record in the industry for the construction ofsteel towers for mobile telecommunications systems. We are bringing ourtechnology and experience to bear in the execution of tower projects in a numberof locations, including the roofs of the NTT Building and other high-rises.
■ Aiming a Microwave AntennaThe correct aiming of microwave antennae to ensure the efficienttransmission and reception of microwave signals is an importantelement of our telecommunications infrastructure. A key towinning these important contracts is the trust born of experienceand a reputation for the ability to produce high-quality work.
■ A Mobile Telephone Base StationIn the suburbs, mobile telephone antennae are usually free-standing towers. In cities, they are usually located on theroofs of high-rise buildings. Over and above the construction ofbase stations, COMSYS offers integrated services that includethe installation of electric power sources, transmitter equipment,and other related facilities and equipment.
■ Test Operation of Switching EquipmentCOMSYS has a comprehensive contract for the design andconstruction of this mobile telephone facility, which will includebackward-compatible mobile telephone equipment, third gener-ation mobile telephone-capable switching systems and transmitterequipment, as well as electric power facilities.
Mobile Communications Projects
Base station for a mobiletelecommunication system
(in a suburb)
Antenna on a building roof fora mobile telecommunicationsystem (in a city)

Investors’ Guide 2002
8
COMSYS is engaged in the development of commercial
systems, and has built a strong track record through
the development of many business applications,
networks, and database solutions. The Company
has also developed many applications and control
systems for various types of infrastructure for the NTT
Group and other telecommunications firms, offering
total solutions service packages encompassing every-
thing from design to maintenance and administration.
Last year the company launched its highly
lauded LAN Convenience Store service, which
provides LAN and WAN construction support to small office, home office (SOHO) operators, Internet service
providers, and small and medium-sized businesses using the Internet. Until now, as the scope of a business
service contract became smaller, it became relatively more expensive. We have thoroughly reevaluated our
business flow with a view to eliminating that drawback, and have achieved cost reductions by building
systems that can be administered through the Internet and offering service package contracts. This has given
birth to a new service that allows the client to build a network as easily as shopping at a convenience store.
Other information systems businesses include the production of interactive programming for digital
satellite broadcasts, which allow viewers to interact with broadcast stations. The Company will be
watching the rapid progress of IT for opportunities to employ its high level of technological expertise in
crafting proposals for new services.
Information Systems
■ A screen shot from one of the Company’s digital satellite broadcast programs.Digital technology greatly increases the number of channels available, leading toforecasts of expanded demand for programming. COMSYS is positioning itself totake advantage of the business opportunity this represents.
Using the technological expertise in civil engineering and construction that COMSYS has accumulated in the
course of its cable tunnel construction activities, the Company is engaged in the construction of commu-
nications antenna towers for mobile telephony and the design and construction of office buildings and
condominiums. In addition, the Company is engaged in design and construction activities in such environment-
related areas as wind power and solar power.
Recent years have seen growing demand for the construction of intelligent buildings that fully utilize
information technology, and in the past few years demand has grown for new condominiums furnished with
complete home LANs to serve as platforms for home security systems and Internet access. Therefore, COMSYS
is shifting its emphasis from the construction of radio facilities to the construction and maintenance of residential
buildings. COMSYS has already gained experience in the building of small-scale LANs through its LAN
Convenience Store operations, but the Company’s greatest strength is that it possesses not only expertise
in construction technology, but also high-level information technology skills. This strength is highly
regarded by those in the industry who select contractors for these projects.
With the advance of computerization, this strength will be a significant asset to COMSYS in the com-
petition to win contracts. Demand is forecast in connection with the refurbishment of office buildings
constructed during the high-growth period, and we therefore expect our architecture business to expand.
Wind power facilities in Hokkaido
The Mio Castello Kouhoku ILVIALE Condominiums, a COMSYS project
Architecture Business
COMSYS personnel preview a satellite-broadcast programwith the clients who ordered it.

Investors’ Guide 2002
9
■Featured Technologies
The Keybox Key Control System
Jointly with a control equipment development firm, COMSYS has developed a key control system
that provides real-time, unitary control, and commenced marketing this system in January
2002. This system uses a non-contact integrated circuit to control access to the key locker
through the user’s identification card. Each key is attached to a key holder that has a non-contact
IC attached, which passes data on key check-out and return to a computer, allowing unitary key
control. This provides real-time information on who is using what key at any given moment, as well
as a historical record of who has used keys in the past. Further, this data can be accessed from
remote sites using the Internet.
In this joint project, COMSYS was primarily responsible for the control software. Because the
system will reduce labor costs at facilities that are open 24 hours a day, we are marketing it to security
companies, power and gas utility companies, commercial building and parking lot maintenance
companies, hospitals, and hotels.
Passing the user’s ID in front of the integratedcircuit card unlocks the key locker, allowingremoval of keys.
In 1999, our Technology Research & Development Center began the develop-
ment of a tuned rotary-mass damper jointly with the Shimazaki Research
Laboratory of Tokai University’s Engineering Department. This effort was a
resounding success. Field tests are complete, and we are now at the stage of
readying the product for market.
Dampers are installed in buildings, bridges, and towers to reduce the
effects of earthquakes and high winds. This joint development project produced
a very simple yet epoch-making device, which uses a rotating cylindrical
weight within another cylinder to absorb vibration energy.
The Technology Research & Development Center commenced actual
device testing from August 2001, assuming the devices would be used with
expressway panel lamps to help prevent metal fatigue and burnt out light
bulbs. After the devices were installed, one-tenth of sudden vibration and
one fourth of continuous vibration was absorbed, an extremely high damping ratio.
Data developed during testing was compiled and published in the
Journal of Structural Engineering, and received a high scholarly evaluation.
Because of its simple design it will have an extremely low construction cost of
about one-fifth that of previous devices, and will cause little concern with
regard to breakage. For these reasons, we have had a large number of
inquiries from concerned firms. The Technology Research & Development
Center will be preparing a pamphlet and a video introducing the tuned
rotary-mass damper, which it will distribute to prefectural and municipal
governments, and to highway and expressway public corporations.
New Technologies—The Tuned Rotary-Mass Damper
15
10
5
0
20
-5
-10
-15
30
10
00 10 20 30 40 50 60 0.80 0.90 1.00 1.10 1.20
Without damperWith damper
Without damperWith damper
Disp
lace
men
t (m
m)
Disp
lace
men
t (m
m)
Time (sec) Comparison of vibration values
Vibration Mode [Dangerous Sway]
Displacement
A damper
Strong vibration: an exciter adds to the vibration
Free vibration: Instantaneously cuts the wire loading on the plumb bob
Graph A: Results of free vibration test Graph B: Results of strong vibration test

Investors’ Guide 2002
10
■ Activities to Preserve the Earth’s Environment
COMSYS recognizes environmental problems to be one of its most important management issues, and gives
environmental business a prominent place in its operations. In June 2001 the Company acquired ISO-14001
certification, demonstrating our compliance with international environmental standards. Based on our estab-
lished basic policy on the environment and our action guidelines, we are cooperating with regional societies
to protect the global economy.
■ Basic Policy on the EnvironmentNippon COMSYS Corporation, as a comprehensive telecommunications engineering firm, is continuously
engaged in the protection of the global environment, and is contributing to the building of a future in
which men and nature live in harmony.
■ Action Guideline1. To reduce the burden on the environment represented by our business activities, we will include envi-
ronmental concerns and establish environmental goals for each of our construction projects,
while conducting continuous improvement of our environmental management systems.
2. We will comply with all environmental statutes and regulations.
3. To prevent pollution, we will in all our operations reduce and recycle industrial waste and, in our office
operations, we will practice resource and energy conservation and promoting green procurement.
4. We will achieve an enhanced awareness of environmental issues on the part of all our employees
and everyone concerned with our construction projects, and will establish strong, cooperative rela-
tionships with regional societies.
■ COMSYS’s Environmental Goals
■ COMSYS’s Environmental Management System
1. Reducing electricity consumption
sTo reduce electricity consumption in our major buildings to 3 percent below its 1999 level by 2002.
2. Reducing office paper use
sTo reduce paper consumption in our major buildings to 10 percent below its 1999 level by 2002.
3. Increasing paper recycling
sTo increase paper recycling in our major buildings to 70 percent by 2002.
4. Reducing and recycling industrial waste
sTo achieve thorough sorting of industrial waste by expanding the role of on-site construction offices in sorting, and thereby to enable reductions in industrial-waste generation, as well as increasedrecycling of industrial waste.
5. Promoting concern for the environment in facilities design
sTo increase proposals for the use of facilities with less environmental impact.
6. Promoting green procurement practices
sTo expand green procurement of office consumables and supplies.
7. Reducing the Company’s vehicle use
sTo reduce the Company’s vehicle ownership to 20 percent below its 1999 level by 2002.sTo reduce the Company’s vehicle leasing to 5 percent below its 1999 level by 2002.
8. Improving methods of handling soil excavated in telephone pole installation
sTo improve procedures for handing soil excavated in telephone pole installation.

Investors’ Guide 2002
11
Performance
Operating Results・・・・・・・・・・・・・・・・・・・・・・・・・・・・・・・・・・・・12
Performance by Business Category・・・・・・・・・・・・・・・・・・・・・・・・・・・・・13
NTT Construction ・・・・・・・・・・・・・・・・・・・・・・・・・・・・・・・・・・・14
Domestic Construction and Engineering ・・・・・・・・・・・・・・・・・・・・・・・・・・15
Overseas Construction, Information Systems ・・・・・・・・・・・・・・・・・・・・・・・・16
Key Financial Indicators
Profitability ・・・・・・・・・・・・・・・・・・・・・・・・・・・・・・・・・・・・・・17
Efficiency ・・・・・・・・・・・・・・・・・・・・・・・・・・・・・・・・・・・・・・・18
Stability・・・・・・・・・・・・・・・・・・・・・・・・・・・・・・・・・・・・・・・・19
Per Share Data・・・・・・・・・・・・・・・・・・・・・・・・・・・・・・・・・・・・・20
Per Employee Data ・・・・・・・・・・・・・・・・・・・・・・・・・・・・・・・・・・・21
Other Data ・・・・・・・・・・・・・・・・・・・・・・・・・・・・・・・・・・・・・・22
Non-Consolidated Statements of Income (10 Years) ・・・・・・・・・・・・・・・・・23
Non-Consolidated Balance Sheets (10 Years) ・・・・・・・・・・・・・・・・・・・・・24
Consolidated Subsidiaries and Affiliates・・・・・・・・・・・・・・・・・・・・・・・・26
Group Companies ・・・・・・・・・・・・・・・・・・・・・・・・・・・・・・・・・・・27
Comparison of Three Major Telecommunications Construction Companies in Japan
Non-Consolidated Basis ・・・・・・・・・・・・・・・・・・・・・・・・・・・・・・・・・・28
Consolidated Basis ・・・・・・・・・・・・・・・・・・・・・・・・・・・・・・・・・・・・29
■ Financial Section (Non-Consolidated Basis)Contents

Investors’ Guide 2002
■ Performance
12
Operating Results
0200 0199980
250,000
150,000
200,000
100,000
50,000
(Million ¥)
■ New Orders Received during the Year
0200 0199980
250,000
150,000
200,000
100,000
50,000
■ Net Sales
(Million ¥)
0200 0199980
35,000
21,000
28,000
14,000
7,000
■ Gross Profits/Operating Income
(Million ¥)
Gross ProfitsOperating Income
0200 0199980
15,000
9,000
12,000
6,000
3,000
■ Income before Income Taxes
(Million ¥)
0200 0199980
8,000
4,800
6,400
3,200
1,600
■ Net Income
(Million ¥)
Note: For the purpose of supporting an affiliate in Thailand, a portion of construction orders received in FY March 2000 was assigned to the said company. As a result, our contract backlog at the end of FY March 2001 decreased by ¥3,369 million.
(Millions of yen) 1993/3 1994/3 1995/3 1996/3 1997/3 1998/3 1999/3 2000/3 2001/3 2002/3
New Orders Received during the Year 128,073 135,762 143,034 186,180 225,147 234,877 228,838 223,789 222,486 200,900
Net Sales 125,771 136,037 152,213 180,629 220,590 224,103 219,764 226,146 215,586 219,206
Contract Backlog at End of Fiscal Year 57,029 56,754 47,575 53,126 57,683 68,457 77,531 75,174 78,705 60,399
Gross Profits 13,658 16,632 18,018 21,965 27,890 27,838 26,491 26,599 23,804 23,043
Operating Income 3,929 5,698 7,042 8,544 13,582 14,061 13,877 13,626 10,402 8,526
Income before Income Taxes 4,071 5,759 7,127 8,092 13,397 14,041 12,755 10,781 7,980 6,519
Net Income 1,631 2,419 3,637 3,742 6,267 7,611 5,075 5,818 4,283 3,461

Investors’ Guide 2002
13
Note: For the purpose of supporting an affiliate in Thailand, a portion of construction orders received in FY March 2000 was assigned to the said company. As a result, our con-tract backlog at the end of FY March 2001 decreased by ¥3,369 million.
0200 01999897969594930
250,000
150,000
200,000
100,000
50,000
■ Orders Received by Business Category(Million ¥)
“Outside” Projects“Inside” Projects
Overseas ConstructionDomestic Construction and Engineering
Information Systems
0200 01999897969594930
250,000
150,000
200,000
100,000
50,000
■ Net Sales by Business Category
(Million ¥)“Outside” Projects“Inside” Projects
Overseas ConstructionDomestic Construction and Engineering
Information Systems
0200 01999897969594930
80,000
48,000
64,000
32,000
16,000
■ Contract Backlog at End of the Year, by Business Category(Million ¥)
“Outside” Projects“Inside” Projects
Overseas ConstructionDomestic Construction and Engineering
Information Systems
■ Orders Received by Business Category(Millions of yen) 1993/3 1994/3 1995/3 1996/3 1997/3 1998/3 1999/3 2000/3 2001/3 2002/3
NTT Group Construction“Outside” Projects 47,118 51,940 55,723 71,123 78,976 74,038 69,221 58,183 48,737 41,447“Inside” Projects 42,882 49,264 50,414 60,060 78,164 81,457 73,810 74,856 77,894 80,208
Subtotal 90,000 101,204 106,137 131,183 157,140 155,495 143,031 133,039 126,631 121,655
Overseas Construction 7,504 1,982 4,059 8,780 11,468 9,362 4,044 4,027 824 2,970Domestic Construction and Engineering 18,948 20,732 18,869 31,196 41,058 53,792 63,845 68,609 78,672 62,305Information Systems 11,621 11,844 13,969 15,021 15,481 16,228 17,918 18,114 16,359 13,970
Total 128,073 135,762 143,034 186,180 225,147 234,877 228,838 223,789 222,486 200,900
■ Net Sales by Business Category(Millions of yen) 1993/3 1994/3 1995/3 1996/3 1997/3 1998/3 1999/3 2000/3 2001/3 2002/3
NTT Group Construction
“Outside” Projects 49,096 50,484 58,646 70,494 79,306 75,658 68,562 63,254 54,520 48,085“Inside” Projects 40,765 48,813 52,407 59,119 80,081 74,339 74,385 77,714 74,647 84,171
Subtotal 89,861 99,297 111,053 129,613 159,387 149,997 142,947 140,968 129,167 132,256
Overseas Construction 3,738 4,274 8,729 6,697 8,925 10,545 7,850 3,007 1,314 2,500Domestic Construction and Engineering 19,467 20,944 19,392 28,706 37,415 47,476 52,411 64,560 68,973 69,927Information Systems 12,705 11,522 13,039 15,613 14,863 16,085 16,556 17,611 16,132 14,523
Total 125,771 136,037 152,213 180,629 220,590 224,103 219,764 226,146 215,586 219,206
■ Contract Backlog at End of the Year, by Business Category(Millions of yen) 1993/3 1994/3 1995/3 1996/3 1997/3 1998/3 1999/3 2000/3 2001/3 2002/3
NTT Group Construction
“Outside” Projects 27,310 28,766 25,843 26,472 26,142 24,522 25,181 20,110 14,327 7,689“Inside” Projects 7,820 8,271 6,278 7,219 5,302 12,420 11,845 8,987 12,234 8,271
Subtotal 35,130 37,037 32,121 33,691 31,444 36,942 37,026 29,097 26,561 15,960
Overseas Construction 10,993 8,701 4,031 6,114 8,657 7,474 3,668 4,688 829 1,299Domestic Construction and Engineering 8,942 8,730 8,207 10,697 14,340 20,656 32,090 36,139 45,838 38,216Information Systems 1,964 2,286 3,216 2,624 3,242 3,385 4,747 5,250 5,477 4,924
Total 57,029 56,754 47,575 53,126 57,683 68,457 77,531 75,174 78,705 60,399

Investors’ Guide 2002
14
9795 969493 0200 0199980
165,000
99,000
132,000
66,000
33,000
■ Total Sales of NTT Construction/Percentage of Total Sales
0
75
45
60
30
15
“Inside” Projects“Outside” Projects
NTT Construction’s Percentage of Total Sales
(Million ¥) (%)
0200 0199980
7,000
4,200
5,600
2,800
1,400
■ Total Subscribers of Mobile TelephonesPHS SubscribersTotal Mobile Telephone Subscribers
Fixed Telephones
(Ten thousand)
0200 0199980 0
4,000 60
2,400 36
3,200 48
1,600 24
800 12
■ The NTT DoCoMo Group SubscribersNTT DoCoMo GroupNTT DoCoMo Share
(Ten thousand) (%)
■ Number of Subscribers by Carriers
1,22117.7%
3895.6%
4,07859.0%
1,22317.7%
As of March 31, 2002
TU-KAGroup
J-PHONEGroup
NTT DoCoMo
Groupau Group
(Ten thousand)
NTT Construction
(Ten thousand, except where noted) 1993/3 1994/3 1995/3 1996/3 1997/3 1998/3 1999/3 2000/3 2001/3 2002/3
Total Subscribers of Mobile Telephones 171 213 433 1,020 2,087 3,152 4,153 5,114 6,094 6,912
The NTT DoCoMo Group 102 132 220 493 1,096 1,798 2,389 2,936 3,603 4,078
Share of NTT DoCoMo (%) 59.6 62.0 50.8 48.3 52.5 57.0 57.5 57.4 59.1 59.0
PHS Subscribers — — — 151 603 673 578 571 584 569Fixed Telephones 5,760 5,878 5,988 6,104 6,146 6,038 5,847 5,545 5,209 5,074
(100 millions of yen, except where noted) 1997/3 1998/3 1999/3 2000/3 2001/3 2002/3 2003/3 (Forecast)
Planned Construction 19,911 18,870 17,279 14,598 13,116 9,350 10,000
Completion of Optical Fiber Cable Installation (%) 16.0 19.0 23.0 36.0East Japan 48.0 54.0 69.0
West Japan 37.0 42.0 53.0Investment in Optical Fiber Cable 2,310 2,100 2,440 2,400 1,900 1,900 2,600

Investors’ Guide 2002
15
■ Total Sales of Domestic Construction and Engineering/Percentage in Total Sales
0200 0194 95 96 97 98 99930 0
75,000 40
45,000 24
60,000 32
30,000 16
15,000 8
(Million ¥) (%)
Sales of Domestic Construction and EngineeringPercentage of Domestic Construction and Engineering in Total Sales
■ Domestic Construction and Engineering Orders Received by Major Client
Others17%
Manufacturers5%
NTT Group15%
New Common Carriers24%
Government Agencies17%
General Contractors22%
As of March 31, 2002
Domestic Construction and Engineering

Investors’ Guide 2002
16
■ Major Overseas Projects CompletedNigeria Ibadan new local line projectIraq Installation of telephone lines for 17 local exchangesEgypt Supply and installation of telecommunication cable network in Ismailia and SuezThailand Installation of digital exchange equipmentTaiwan Installation of highway traffic control systemSri Lanka Installation of local telephone lines in the Badulla and Anuradhapura regionsNepal Installation of microwave telecommunications system (inside and remote)Thailand Fifth local cable network installation for TOT in Bangkok and provincesKuwait Installation of digital loop coil system in Farwaniah ExchangeTanzania Rehabilitation of telecommunications network in Dar es SalaamThailand Seventh local cable network for TelecomAsia and TT&TPhilippines Supply and installation of local cable network for Major Telecom Inc. in MindanaoPhilippines Supply and installation of OSP equipment and optical fiber cable for ICC in ManilaPhilippines Installation of trunk lines and local network for GLOBE Telecom PHASE-2 in Manila and the provincesThailand The telephone expansion project to overcome short-term line shortage / B.E.1996-1998 for TOT (800K)Philippines Supply contract for OSP & optical fiber cable (BAYANTEL 40K)Philippines Turnkey backhaul fiber optic network construction for DCI in Philippines
■ Overseas Projects in Progress (As of June 2002)Philippines Supply and installation of local cable and junction network for GLOBE Telecom PHASE-4 in Manila and the provincesThailand Optic Fiber Transmission Network Expansion Project for TOTThailand 100,000 Telephone Line Expansion Project in the North-East, North, South and Central Regions for TOT
0200 0194 95 96 97 98 99930 0
12,500 7.5
7,500 4.5
10,000 6.0
5,000 3.0
2,500 1.5
Sales of Overseas Construction Percentage of Overseas Construction in Total Sales
■ Total Sales of Overseas Construction/Percentage in Total Sales
(Million ¥) (%)
■ Total Sales of Information Systems/Percentage in Total Sales
0200 0194 95 96 97 98 99930 0
20,000 12.5
12,000 7.5
16,000 10.0
8,000 5.0
4,000 2.5
Sales of Information Systems Percentage of Information Systems in Total Sales
(Million ¥) (%)
■ Net Sales of Information Service Industry in Japan
0200 0194 95 96 97 98 99930
140,000
84,000
112,000
56,000
28,000
(¥100 Million)
Source: Ministry of Economy, Trade and Industry, Research and Statistics Department,“Preliminary Report on the Survey of Selected Service Industries.”
Information SystemsOverseas Construction

Investors’ Guide 2002
17
■ Key Financial Indicators
■ Gross Profit Margin/Operating Margin
0200 0199980
13.0
7.8
10.4
5.2
2.6
(%)
Gross Profit MarginOperating Margin
■ Net Profit Margin
0200 0199980
3.5
2.1
2.8
1.4
0.7
(%)
■ Pre-Tax Profit Margin
0200 0199980
7.0
4.2
5.6
2.8
1.4
(%)
■ Return on Equity (ROE)
0200 0199980
11.0
6.6
8.8
4.4
2.2
(%)
■ Return on Total Assets (ROA)
0200 0199980
5.0
3.0
4.0
2.0
1.0
(%)
Profitability
(%) 1993/3 1994/3 1995/3 1996/3 1997/3 1998/3 1999/3 2000/3 2001/3 2002/3
Gross Profit Margin 10.86 12.23 11.84 12.16 12.64 12.42 12.05 11.76 11.04 10.51
Operating Margin 3.12 4.19 4.63 4.73 6.16 6.27 6.31 6.03 4.82 3.89
Pre-Tax Profit Margin 3.24 4.23 4.68 4.48 6.07 6.27 5.80 4.77 3.70 2.97
Net Profit Margin 1.30 1.78 2.39 2.07 2.84 3.40 2.31 2.57 1.99 1.58
Return on Equity (ROE) 5.35 6.78 7.56 6.47 10.08 9.81 5.44 5.62 3.84 3.21
Return on Total Assets (ROA) 2.06 2.52 3.28 2.93 4.28 4.84 3.11 3.44 2.48 2.08
Return on Equity (ROE) =Net Income
x100Shareholders’ Equity (Average of two year-ends)
Return on Total Assets (ROA) =Net Income
x100Total Assets (Average of two year-ends)

Investors’ Guide 2002
18
■ Total Assets/Shareholders’ Equity
0200 0199980
175,000
105,000
140,000
70,000
35,000
(Million ¥)
Total AssetsShareholders’ Equity
■ Modified Working Capital
0200 0199980
60,000
36,000
48,000
24,000
12,000
(Million ¥)
0.0
0.4
0.8
1.2
1.6
2.0
■ Turnover of Total Assets
0200 019998
(Times)
■ Turnover of Property and Equipment
0200 0199980
9.0
5.4
7.2
3.6
1.8
(Times)
Efficiency
(Millions of yen, except where noted) 1993/3 1994/3 1995/3 1996/3 1997/3 1998/3 1999/3 2000/3 2001/3 2002/3
Total Assets 86,382 105,450 116,617 138,610 154,246 160,561 166,002 171,802 174,118 159,344
Shareholders’ Equity 31,556 39,821 56,395 59,277 65,096 90,101 96,635 110,400 112,529 102,883
Modified Working Capital 26,902 27,267 47,603 44,693 42,971 57,799 48,544 53,279 56,274 50,085
Turnover of Total Assets (times) 1.59 1.42 1.37 1.42 1.51 1.42 1.35 1.34 1.25 1.31
Turnover of Property and Equipment (times) 10.81 9.50 9.08 8.50 8.64 8.40 7.59 6.80 6.05 6.52
Turnover of Total Assets =Net Sales
Total Assets (Average of two year-ends)
Turnover of Property and Equipment = Net Sales
Property and Equipment (Average of two year-ends)
Modified Working Capital = (Current Assets - Accumulated Cost of Construction in Progress) - (Current Liabilities - Advances Received on Construction in Progress)

Investors’ Guide 2002
19
Stability
■ Equity Ratio
0200 0199980
75
45
60
30
15
(%)
■ Current Ratio/Quick Ratio
0200 0199980
250
150
200
100
50
(%)
Current RatioQuick Ratio
■ Fixed Assets-to-Equity Capital Ratio/Ratio of Fixed Assets-to-Equity Capital and Long-Term Liabilities
0200 0199980
60
36
48
24
12
(%)
Fixed Assets-to-Equity Capital RatioRatio of Fixed Assets-to-Equity Capital and Long-Term Liabilities
■ Interest Coverage
0200 0199980
2,500
1,500
2,000
1,000
500
(Times)
(%, except where noted) 1993/3 1994/3 1995/3 1996/3 1997/3 1998/3 1999/3 2000/3 2001/3 2002/3
Equity Ratio 36.53 37.76 48.36 42.77 42.20 56.12 58.21 64.26 64.63 64.57
Current Ratio 241.72 180.71 309.57 208.28 181.05 230.90 199.13 220.44 226.67 206.85
Quick Ratio 233.85 176.79 304.01 204.80 178.57 228.28 195.03 211.22 218.81 195.23
Fixed Assets-to-Equity Capital Ratio 65.44 61.79 46.94 57.64 59.89 47.28 50.97 51.01 49.25 49.32
Ratio of Fixed Assets-to-Equity Capital and Long-Term Liabilities 35.18 38.03 29.59 37.11 40.25 37.76 43.59 45.61 44.59 46.30
Interest Coverage (times) 7.46 9.57 16.09 308.80 2,017.57 2,114.00 1,318.91 2,012.14 399.54 314.64
Current Ratio =Current Assets - Accumulated Cost of Construction in Progress
x100Current Liabilities - Advances Received on Construction in Progress
Quick Ratio =Cash, Time Deposits, Marketable Securities and Trade Accounts Receivable
x100Current Liabilities - Advances Received on Construction in Progress
Fixed Assets-to-Equity Capital Ratio =Property, Equipment, Investments and Other Assets
x100Shareholders’ Equity
Interest Coverage =Operating Income + Interest and Dividend Income
Interest Expenses
Ratio of Fixed Assets-to-Equity Capital and Long-Term Liabilities =Property, Equipment, Investments and Other Assets
x100Shareholders’ Equity + Long-Term Liabilities

Investors’ Guide 2002
20
Per Share Data
■ Primary Earnings per Share (EPS)
0200 0199980
65
39
52
26
13
(¥)
0200 0199980
1,000
600
800
400
200
■ Book Value per Share (BPS)
(¥)
0200 0199980 0
15 40
9 24
12 32
6 16
3 8
■ Cash Dividends per Share/Payout Ratio
(¥) (%)
Cash Dividends per SharePayout Ratio
0200 0199980
140,000
84,000
112,000
56,000
28,000
■ Common Stock Issued
(Thousand shares)
Note: Primary Earnings per Share is based on the weighted average number of shares outstanding in the respective fiscal years. The others are based on the number of shares outstanding at the end of the respective fiscal years.
(Yen, except where noted) 1993/3 1994/3 1995/3 1996/3 1997/3 1998/3 1999/3 2000/3 2001/3 2002/3
Primary Earnings per Share (EPS) 22.78 26.62 37.69 32.91 54.27 60.96 38.78 42.78 31.27 25.48
Book Value per Share (BPS) 430.19 428.19 539.09 514.90 562.23 690.68 727.44 804.86 822.32 763.53
Cash Dividends per Share 6.00 7.25 8.00 9.75 11.75 14.25 10.00 10.00 12.00 10.00
Payout Ratio (%) 26.99 27.87 23.01 30.00 21.71 24.20 25.96 23.54 38.23 39.08
Common Stock Issued (thousand shares) 73,353 93,000 104,612 115,123 115,781 130,453 132,841 137,166 136,842 135,264

Investors’ Guide 2002
21
Per Employee Data
0200 0199980
65,000
39,000
52,000
26,000
13,000
■ Net Sales per Employee
(Thousand ¥)
0200 0199980
4,000
2,400
3,200
1,600
800
■ Pre-Tax Profit per Employee
(Thousand ¥)
0200 0199980
2,500
1,500
2,000
1,000
500
■ Net Income per Employee
(Thousand ¥)
■ Number of Employees at Fiscal Year-End
0200 0199980
4,000
2,400
3,200
1,600
800
(Persons)
(Thousands of yen, except where noted) 1993/3 1994/3 1995/3 1996/3 1997/3 1998/3 1999/3 2000/3 2001/3 2002/3
Net Sales per Employee 34,820 36,836 40,241 46,656 57,528 59,921 59,906 61,344 58,936 61,592
Pre-Tax Profit per Employee 1,127 1,560 1,884 2,090 3,493 3,754 3,477 2,924 2,181 1,832
Net Income per Employee 452 655 962 967 1,634 2,035 1,383 1,578 1,171 972
Number of Employees at Fiscal Year-End (persons) 3,683 3,703 3,862 3,881 3,788 3,692 3,645 3,728 3,588 3,530
Net Sales per Employee =Net Sales
Number of Employees (Average of two year-ends)
Pre-Tax Profit per Employee=Income before Income Taxes
Number of Employees (Average of two year-ends)
Net Income per Employee =Net Income
Number of Employees (Average of two year-ends)

Investors’ Guide 2002
22
Other Data
■ Capital Expenditure
0200 0199980
7,000
4,200
5,600
2,800
1,400
(Million ¥)
■ Research and Development Expenditure
0200 0199980
700
420
560
280
140
(Million ¥)
0200 0199980
1,600
960
1,280
640
320
■ Depreciation Charged against Property and Equipment
(Million ¥)
■ Percentage of Stock Held by Foreigners
0200 0199980
25
15
20
10
5
(%)
(Millions of yen, except where noted) 1993/3 1994/3 1995/3 1996/3 1997/3 1998/3 1999/3 2000/3 2001/3 2002/3
Capital Expenditure 3,250 4,118 2,879 10,491 3,246 2,555 5,041 6,528 1,037 3,529
Research and Development Expenditure 500 500 500 650 650 670 660 601 418 416
Depreciation Charged against Property and Equipment 943 914 1,063 1,321 1,468 1,503 1,377 1,188 1,099 1,238
Percentage of Stock Held by Foreigners (%) 7.46 9.84 13.78 15.80 15.77 15.80 13.46 20.14 14.83 25.50

■ Non-Consolidated Statements of Income (10 Years)
Investors’ Guide 2002
23
(Millions of yen)
1993/3 1994/3 1995/3 1996/3 1997/3 1998/3 1999/3 2000/3 2001/3 2002/3
Net Sales:
Construction contracts 113,066 124,515 139,174 165,016 205,727 208,018 203,208 208,535 199,454 204,683Other 12,705 11,522 13,039 15,613 14,863 16,085 16,556 17,611 16,132 14,523
125,771 136,037 152,213 180,629 220,590 224,103 219,764 226,146 215,586 219,206Cost of Sales:
Construction contracts 100,634 109,084 122,707 145,238 179,917 182,819 179,419 184,300 176,949 182,437Other 11,479 10,321 11,488 13,426 12,783 13,446 13,854 15,247 14,833 13,726
112,113 119,405 134,195 158,664 192,700 196,265 193,273 199,547 191,782 196,163Gross profits 13,658 16,632 18,018 21,965 27,890 27,838 26,491 26,599 23,804 23,043
Selling, General and Administrative Expenses 9,729 10,934 10,976 13,421 14,308 13,777 12,614 12,973 13,402 14,517Operating income 3,929 5,698 7,042 8,544 13,582 14,061 13,877 13,626 10,402 8,526
Other Income (Expenses):
Interest and dividend income 981 993 1,053 720 541 737 631 461 785 284Interest expenses (658) (699) (503) (30) (7) (7) (11) (7) (28) (28)Other, net (181) (233) (465) (1,142) (719) (750) (1,742) (3,299) (3,179) (2,263)
142 61 85 (452) (185) (20) (1,122) (2,845) (2,422) (2,007)Income before Income Taxes 4,071 5,759 7,127 8,092 13,397 14,041 12,755 10,781 7,980 6,519Income Taxes 2,440 3,340 3,490 4,350 7,130 6,430 7,680 4,963 3,697 3,058Net Income 1,631 2,419 3,637 3,742 6,267 7,611 5,075 5,818 4,283 3,461

Investors’ Guide 2002
24
■ Non-Consolidated Balance Sheets (10 Years)
(Millions of yen)
ASSETS 1993/3 1994/3 1995/3 1996/3 1997/3 1998/3 1999/3 2000/3 2001/3 2002/3
Current Assets:
Cash and time deposits 16,631 21,649 29,434 25,852 21,171 26,871 21,366 18,746 18,039 34,079Marketable securities 5,680 11,931 12,041 17,013 15,411 17,106 11,886 15,818 14,730 880Notes and accounts receivable-trade 22,080 26,146 27,581 41,671 58,091 56,817 62,258 58,876 64,442 56,553Inventories:
Accumulated cost of construction in progress 19,848 19,796 18,924 16,978 18,375 15,707 19,235 17,967 17,995 11,641Other 666 546 421 247 276 262 168 124 101 72
Other current assets 887 854 915 1,292 1,169 1,025 1,955 4,062 3,512 5,484Less: Allowance for doubtful receivables (59) (76) (74) (105) (131) (128) (117) (111) (123) (110)
Total current assets 65,733 80,846 89,242 102,948 114,362 117,660 116,751 115,482 118,696 108,599Investments and Other Assets:
Investment securities:
Subsidiaries and affiliates 969 969 1,041 1,087 1,053 1,490 1,906 2,214 1,683 1,876Other 2,369 2,524 2,526 2,263 4,985 6,293 7,435 7,442 4,077 3,618
Long-term loans receivable:
Subsidiaries and affiliates 500 340 748 522 356 219 1,606 786 717 234Other 1,627 1,660 1,570 2,403 2,769 3,032 3,172 3,242 3,434 3,389
Other assets 2,426 3,259 2,938 3,083 3,597 4,464 4,372 7,012 11,019 11,303Less: Allowance for doubtful receivables (15) (14) (15) (6) (20) (18) (23) (83) (1,099) (1,289)
Total investments and other assets 7,876 8,738 8,808 9,352 12,740 15,480 18,468 20,613 19,831 19,131Property and Equipment:
Land 7,771 9,711 10,092 14,696 16,320 16,452 17,821 22,157 22,160 16,846Buildings and structures 4,928 5,339 7,244 10,400 10,523 10,554 13,275 14,958 15,071 19,116Machinery and equipment 5,054 5,109 5,812 6,855 7,709 7,887 8,207 6,184 5,969 6,064Construction in progress 34 999 702 — 21 1,513 1,828 2,034 2,649 —Less: Accumulated depreciation (5,014) (5,292) (6,186) (7,137) (8,326) (9,283) (10,348) (9,626) (10,258) (10,412)
Total property and equipment 12,773 15,866 17,664 24,814 26,247 27,123 30,783 35,707 35,591 31,614Deferred Charges:
Discount on notes payable — — 903 1,496 897 298 — — — —Total deferred charges — — 903 1,496 897 298 — — — —
86,382 105,450 116,617 138,610 154,246 160,561 166,002 171,802 174,118 159,344

Investors’ Guide 2002
25
(Millions of yen)
LIABILITIES AND SHAREHOLDERS’ EQUITY 1993/3 1994/3 1995/3 1996/3 1997/3 1998/3 1999/3 2000/3 2001/3 2002/3
Current Liabilities:
Short-term bank loans 1,850 830 480 440 440 — — — — —Current portion of convertible bonds — — — 393 — — — — — 9,312Current portion of notes and notes with warrants — 12,491 — 7,016 9,867 7,755 7,373 — — —Accounts payable:
Trade 11,277 12,493 12,578 21,675 29,108 26,898 32,939 35,473 39,232 30,077Other 805 980 1,607 2,774 2,228 2,398 1,863 4,216 2,670 2,521
Advances received on construction in progress 8,711 6,963 4,435 5,257 4,372 3,586 4,038 4,088 5,406 2,863Income taxes payable 1,671 2,772 2,490 3,649 6,195 3,535 3,748 2,160 576 2,986Employees’ savings deposits 1,588 1,831 2,066 — — — — — — —Warrants — — 1,204 2,396 2,351 1,291 917 — — —Other current liabilities 1,792 2,386 2,290 2,934 2,827 2,277 2,132 2,387 1,949 1,977
Total current liabilities 27,694 40,746 27,150 46,534 57,388 47,740 53,010 48,324 49,833 49,736Long-Term Liabilities:
Notes and notes with warrants 19,506 16,883 24,638 24,995 15,128 7,373 — — — —Convertible bonds 1,004 859 444 — 10,000 9,418 9,409 9,312 9,312 —Accrued severance indemnities 6,117 6,188 6,399 6,663 6,161 5,876 5,356 379 2,444 2,561Provision for losses from overseas investments — — — — — — 1,592 1,442 — —Allowance for losses arising from guarantees of loans — — — — — — — — — 1,680Deferred tax liabilities for unrealized gains on land revaluation — — — — — — — — — 2,484Other long-term liabilities 505 953 1,591 1,141 473 53 — 1,945 — —
Total long-term liabilities 27,132 24,883 33,072 32,799 31,762 22,720 16,357 13,078 11,756 6,725Shareholders’ Equity:
Common stock 6,846 10,025 16,869 16,895 17,250 26,592 27,983 31,141 31,141 31,141Additional paid-in capital 4,092 7,259 14,096 14,122 14,521 24,904 26,666 30,736 30,736 30,736Legal reserve 923 974 1,049 1,141 1,271 1,511 1,686 1,834 1,983 2,093Unrealized loss on land revaluation — — — — — — — — — (8,633)Retained earnings 19,695 21,563 24,381 27,119 32,054 37,094 40,300 46,689 48,716 48,697Unrealized gain on securities — — — — — — — — (47) (187)Treasury stock, at cost — — — — — — — — — (964)
Total shareholders’ equity 31,556 39,821 56,395 59,277 65,096 90,101 96,635 110,400 112,529 102,88386,382 105,450 116,617 138,610 154,246 160,561 166,002 171,802 174,118 159,344
Investors’ Guide 2002
26
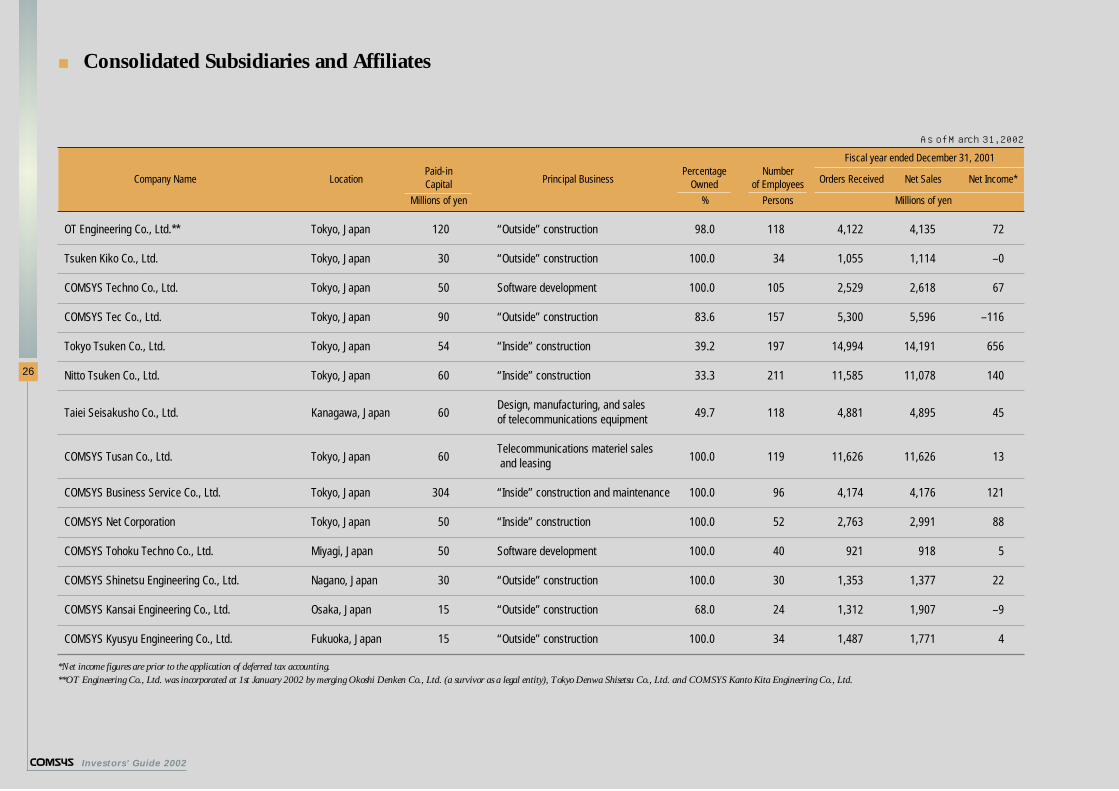
■ Consolidated Subsidiaries and Affiliates
As of March 31, 2002
Fiscal year ended December 31, 2001
Company Name LocationPaid-in
Principal BusinessPercentage Number
Orders Received Net Sales Net Income*Capital Owned of Employees
Millions of yen % Persons Millions of yen
OT Engineering Co., Ltd.** Tokyo, Japan 120 “Outside” construction 98.0 118 4,122 4,135 72
Tsuken Kiko Co., Ltd. Tokyo, Japan 30 “Outside” construction 100.0 34 1,055 1,114 –0
COMSYS Techno Co., Ltd. Tokyo, Japan 50 Software development 100.0 105 2,529 2,618 67
COMSYS Tec Co., Ltd. Tokyo, Japan 90 “Outside” construction 83.6 157 5,300 5,596 –116
Tokyo Tsuken Co., Ltd. Tokyo, Japan 54 “Inside” construction 39.2 197 14,994 14,191 656
Nitto Tsuken Co., Ltd. Tokyo, Japan 60 “Inside” construction 33.3 211 11,585 11,078 140
Taiei Seisakusho Co., Ltd. Kanagawa, Japan 60Design, manufacturing, and sales
49.7 118 4,881 4,895 45 of telecommunications equipment
COMSYS Tusan Co., Ltd. Tokyo, Japan 60Telecommunications materiel sales
100.0 119 11,626 11,626 13and leasing
COMSYS Business Service Co., Ltd. Tokyo, Japan 304 “Inside” construction and maintenance 100.0 96 4,174 4,176 121
COMSYS Net Corporation Tokyo, Japan 50 “Inside” construction 100.0 52 2,763 2,991 88
COMSYS Tohoku Techno Co., Ltd. Miyagi, Japan 50 Software development 100.0 40 921 918 5
COMSYS Shinetsu Engineering Co., Ltd. Nagano, Japan 30 “Outside” construction 100.0 30 1,353 1,377 22
COMSYS Kansai Engineering Co., Ltd. Osaka, Japan 15 “Outside” construction 68.0 24 1,312 1,907 –9
COMSYS Kyusyu Engineering Co., Ltd. Fukuoka, Japan 15 “Outside” construction 100.0 34 1,487 1,771 4
*Net income figures are prior to the application of deferred tax accounting.**OT Engineering Co., Ltd. was incorporated at 1st January 2002 by merging Okoshi Denken Co., Ltd. (a survivor as a legal entity), Tokyo Denwa Shisetsu Co., Ltd. and COMSYS Kanto Kita Engineering Co., Ltd.

Investors’ Guide 2002
27
■ Group Companies
The COMSYS GroupAt present, the COMSYS Group consists of 35 companies, including Nippon COMSYS. Of these, 20 are involved in “outside” projects, 6 are involved in
“inside” projects, 2 are software development firms, 4 are overseas subsidiaries, and 3 are in other fields.
To allow us to respond to the rapid changes brought by the diversification of projected needs and the intensification of competition in this era
of information technology, we are striving throughout the entire group to take cost competition to new levels, and to manifest our ability to coor-
dinate diverse capabilities. All the companies of the COMSYS Group are engaged in continual strategic reorganization, while at the same time
increasing the efficiency of our project execution through adjustment of the division of responsibilities and territories. In addition, while
fostering the multifaceted technological expertise required by the IT era, the COMSYS group always strives to grow.
Business Category Location Company Name
1 “Outside” Projects Saitama Jinwa Co., Ltd.
2 “Outside” Projects Tokyo OT Engineering Co., Ltd.
3 “Outside” Projects Tokyo COMSYS Tec Co., Ltd.
4 “Outside” Projects Tokyo Tsuken Kiko Co., Ltd.
5 “Outside” Projects Tokyo Nippo Kensetsu Kogyo Co., Ltd.
6 “Outside” Projects Tokyo Kokusai Densetsu Co., Ltd.
7 “Outside” Projects Tokyo Nisshin Denwa Setsubi Co., Ltd.
8 “Outside” Projects Tokyo SE Technical Co., Ltd.
9 “Outside” Projects Kanagawa Tsushin Densetsu Co., Ltd.
0 “Outside” Projects Kanagawa Asahi Tsushin Co., Ltd.
- “Outside” Projects Kanagawa Sanyo Co., Ltd.
= “Outside” Projects Nagano COMSYS Shinetsu Engineering Co., Ltd.
q “Outside” Projects Nagano Nihonkai Tsushin Kensetsu Co., Ltd.
Business Category Location Company Name
w “Outside” Projects Nagano CRT Co., Ltd.
e “Outside” Projects Nagano Odanaka Tsushin Co., Ltd.
r “Outside” Projects Osaka COMSYS Kansai Engineering Co., Ltd.
t “Outside” Projects Osaka Shin Osaka Tsuken Co., Ltd.
y “Outside” Projects Tokushima Tokushima Tsushin Kensetsu Co., Ltd.
u “Outside” Projects Fukuoka COMSYS Kyushu Engineering Co., Ltd.
i “Outside” Projects Okinawa Ryukyu Tsushin Koji Co., Ltd.
o “Inside” Projects Tokyo COMSYS Business Service Co., Ltd.
p “Inside” Projects Tokyo COMSYS Net Corporation
[ “Inside” Projects Tokyo Tokyo Tsuken Co., Ltd.
] “Inside” Projects Tokyo Nitto Tsuken Co., Ltd.
\ “Inside” Projects Ishikawa Kanazawa Tushin Industries LLC
a “Inside” Projects Osaka Yashiro Tsushin Kensetsu Co., Ltd.
Business Category Location Company Name
s Software Miyagi COMSYS Tohoku Techno Co., Ltd.
d Software Tokyo COMSYS Techno Co., Ltd.
f IT Tokyo Emport Co., Ltd
g Manufacturer Kanagawa Taiei Seisakusho Co., Ltd.
h Leasing Tokyo COMSYS Tsusan Co., Ltd.
— Overseas Affiliates —
“Outside” Projects Philippines COMSYS Philippines, Inc.
“Outside” Projects Malaysia CMC Engineering SDN. BHD.
“Outside” Projects Thailand Thai COMSYS & Jackson Co., Ltd.
“Outside” Projects Thailand COMSYS Thailand Co., Ltd.

Investors’ Guide 2002
28
■ Comparison of Three Major Telecommunications Construction Companies in Japan
■ Net Sales
01 0299 00980
245,000
147,000
196,000
98,000
49,000
Nippon COMSYSKYOWA EXEO
DAIMEI TELECOM ENGINEERING
(Million ¥)
■ Operating Income
01 0299 00980
15,000
9,000
12,000
6,000
3,000
Nippon COMSYSKYOWA EXEO
DAIMEI TELECOM ENGINEERING
(Million ¥)
■ Income before Income Taxes
01 0299 00980
15,000
9,000
12,000
6,000
3,000
Nippon COMSYSKYOWA EXEO
DAIMEI TELECOM ENGINEERING
(Million ¥)
■ Net Income
01 0299 00980
8,000
4,800
6,400
3,200
1,600
Nippon COMSYSKYOWA EXEO
DAIMEI TELECOM ENGINEERING
(Million ¥)
■ Net Income per Share
01 0299 00980
70.00
42.00
56.00
28.00
14.00
Nippon COMSYSKYOWA EXEO
DAIMEI TELECOM ENGINEERING
(¥)
■ Return on Equity (ROE)
01 0299 00980
13.0
7.8
10.4
5.2
2.6
Nippon COMSYSKYOWA EXEO
DAIMEI TELECOM ENGINEERING
(%)
*DAIMEI TELECOM ENGINEERING changed the end of its fiscal year from September to March as of fiscal 1998. Accordingly, the company’s fiscal year that ended in March 1999 is a period of only six months. (Source: Company business reports)
■ Net Sales (Millions of yen)
1998/3 1999/3 2000/3 2001/3 2002/3
Nippon COMSYS 224,103 219,764 226,146 215,586 219,206
KYOWA EXEO 210,454 218,564 204,989 190,317 190,687
DAIMEI TELECOM ENGINEERING* 91,207 51,984 101,959 98,195 86,929
■ Operating Income (Millions of yen)
1998/3 1999/3 2000/3 2001/3 2002/3
Nippon COMSYS 14,061 13,877 13,626 10,402 8,526
KYOWA EXEO 9,108 11,028 10,318 7,507 7,207
DAIMEI TELECOM ENGINEERING* 3,228 2,958 5,512 3,455 3,637
■ Income before Income Taxes (Millions of yen)
1998/3 1999/3 2000/3 2001/3 2002/3
Nippon COMSYS 14,041 12,755 10,781 7,980 6,519
KYOWA EXEO 7,732 8,609 3,951 6,604 4,385
DAIMEI TELECOM ENGINEERING* 3,262 2,554 4,250 2,570 1,353
■ Net Income (Millions of yen)
1998/3 1999/3 2000/3 2001/3 2002/3
Nippon COMSYS 7,611 5,075 5,818 4,283 3,461
KYOWA EXEO 4,002 3,611 1,850 3,331 2,330
DAIMEI TELECOM ENGINEERING* 1,332 904 2,297 1,325 707
■ Net Income per Share (Yen)
1998/3 1999/3 2000/3 2001/3 2002/3
Nippon COMSYS 60.96 38.78 42.78 31.27 25.48
KYOWA EXEO 37.47 33.80 17.32 31.17 19.92
DAIMEI TELECOM ENGINEERING* 34.84 23.64 56.52 30.96 16.95
■ Return on Equity (ROE) (%)
1998/3 1999/3 2000/3 2001/3 2002/3
Nippon COMSYS 9.8 5.4 5.6 3.8 3.2
KYOWA EXEO 9.1 7.6 3.7 6.5 4.2
DAIMEI TELECOM ENGINEERING* 7.0 4.6 9.8 4.8 2.6
Non-Consolidated Basis

Investors’ Guide 2002
29
■ Net Sales
01 0299 00980
245,000
147,000
196,000
98,000
49,000
Nippon COMSYSKYOWA EXEO
DAIMEI TELECOM ENGINEERING
(Million ¥)
■ Operating Income
01 0299 00980
20,000
12,000
16,000
8,000
4,000
Nippon COMSYSKYOWA EXEO
DAIMEI TELECOM ENGINEERING
(Million ¥)
■ Income before Income Taxes
01 0299 00980
20,000
12,000
16,000
8,000
4,000
Nippon COMSYSKYOWA EXEO
DAIMEI TELECOM ENGINEERING
(Million ¥)
■ Net Income
01 0299 00980
10,000
6,000
8,000
4,000
2,000
Nippon COMSYSKYOWA EXEO
DAIMEI TELECOM ENGINEERING
(Million ¥)
■ Net Income per Share
01 0299 00980
70.00
42.00
56.00
28.00
14.00
Nippon COMSYSKYOWA EXEO
DAIMEI TELECOM ENGINEERING
(¥)
■ Return on Equity (ROE)
01 0299 00980
13.0
7.8
10.4
5.2
2.6
Nippon COMSYSKYOWA EXEO
DAIMEI TELECOM ENGINEERING
(%)
*DAIMEI TELECOM ENGINEERING changed the end of its fiscal year from September to March as of fiscal 1998. Accordingly, the company’s fiscal year that ended in March 1999 is a period of only six months. (Source: Company business reports)
■ Net Sales (Millions of yen)
1998/3 1999/3 2000/3 2001/3 2002/3
Nippon COMSYS 225,313 220,522 231,750 222,220 231,351
KYOWA EXEO 219,549 228,420 216,499 203,069 203,336
DAIMEI TELECOM ENGINEERING* 94,654 54,122 109,999 109,703 98,587
■ Operating Income (Millions of yen)
1998/3 1999/3 2000/3 2001/3 2002/3
Nippon COMSYS 14,348 14,261 15,559 11,628 10,500
KYOWA EXEO 9,876 12,688 11,841 8,304 8,308
DAIMEI TELECOM ENGINEERING* 3,332 3,068 6,564 4,443 3,880
■ Income before Income Taxes (Millions of yen)
1998/3 1999/3 2000/3 2001/3 2002/3
Nippon COMSYS 14,333 13,522 13,054 9,117 8,913
KYOWA EXEO 8,471 10,277 5,509 7,897 5,949
DAIMEI TELECOM ENGINEERING* 3,353 2,746 4,863 3,368 920
■ Net Income (Millions of yen)
1998/3 1999/3 2000/3 2001/3 2002/3
Nippon COMSYS 8,309 5,625 6,315 4,498 4,107
KYOWA EXEO 4,069 4,224 2,530 3,622 2,989
DAIMEI TELECOM ENGINEERING* 1,366 1,015 2,590 1,559 232
■ Net Income per Share (Yen)
1998/3 1999/3 2000/3 2001/3 2002/3
Nippon COMSYS 66.55 42.97 46.73 33.11 30.39
KYOWA EXEO 38.09 39.53 23.68 34.00 25.56
DAIMEI TELECOM ENGINEERING* 35.94 26.56 63.83 36.48 5.58
■ Return on Equity (ROE) (%)
1998/3 1999/3 2000/3 2001/3 2002/3
Nippon COMSYS 10.2 5.7 5.8 3.8 3.6
KYOWA EXEO 8.9 8.6 4.9 6.7 5.1
DAIMEI TELECOM ENGINEERING* 6.8 5.0 10.6 5.4 0.8
Consolidated Basis

Investors’ Guide 2002
30
■ Stock Price Information
0299 0093 94 95 96 97 980
3,000
1,800
2,400
1,200
600
01
■ Common Stock Price Range
(¥)
■ Trading Volume
01 0299 0093 94 95 96 97 980
350,000
210,000
280,000
140,000
70,000
(Thousand shares)
Notes 1. The numbers above are based on Tokyo Stock Exchange First Section figures.
2. Stock price data marked with an asterisk reflect conditions after a stock split.
1993/3 1994/3 1995/3 1996/3 1997/3 1998/3 1999/3 2000/3 2001/3 2002/3
988 1,620
Common Stock Price Range (¥)
High Price*1,130
1,570*1,280
1,450 1,560 2,020 1,710 2,700 2,370 2,095
460 1,170Low Price
* 901930
*1,180980 1,190 1,240 1,281 1,420 1,636 580
Trading Volume (thousand shares) 105,119 343,329 116,184 92,776 128,401 144,820 85,708 96,361 94,043 230,769

Investors’ Guide 2002
31
■ Corporate Information
Trade Name Nippon COMSYS CorporationAddress 17-1, Higashigotanda 2-chome
Shinagawa-ku, Tokyo 141-8647, JapanTelephone 81(3)3448-7000Facsimile 81(3)3448-7001
Establishment December 1951Paid-in Capital ¥31,140 millionStock Listings Common Stock-Tokyo, Osaka
Representative PresidentHironobu Takeuchi
Number of Employees 3,530Net Sales ¥219,200 million
n BusinessesTelecommunications Facilities Businessn Cable works (optical fiber cable laying, burying telephone lines, etc.)n Civil engineering works (underground conduit lines,
manholes and cable-tunnel construction, etc.)n Switching works (digital telephone switch-boards, etc.)n Transmission wireless works (digital/micro communications
facilities, etc.)n Mobile communications works (mobile wireless base stations, etc.)
Electric Facilities Businessn Communications power supply works
(transformer, generation, and storage-battery facilities)n General electrical facilities works
Civil Engineering-Related Businessn General civil engineering worksn Construction of multi-use underground cable conduit facilities (C·C·BOX)n Water supply and sewage facilities worksn Land developmentn Surveying
Building Construction and Real Estate-Related Businessn Building construction and ancillary facilities worksn Land sales, purchase and intermediationn Piping works
Information-Related Businessn Development, commissioning and sales of all types of softwaren Dispatch of data processing engineersn Planning, design, construction and maintenance of intelligent
buildings and systemsn Commissioning and construction of data communications
systems (LAN, CATV, etc.)n Commissioning, construction and maintenance of network
systems, centered on PBXn Systems integrator
n Sales NetworkHead OfficeWestern Japan HeadquartersBranches
Hokkaido/Tohoku/Akita/Fukushima/Kantominami/KantonakaTochigi/Shinetsu/Niigata/Tokai/Hokuriku/Kansai/Chugoku/ShikokuTakamatsu/Kyushu/Okinawa
Overseas Bangkok Liaison Office
Sales OfficesTohoku Area
Aomori/Morioka/Yokote/Akitakenhoku/Oomagari/YamagataKanto Area
Urawa/Kawagoe/Kumagaya/Oyama/Mito/Tsuchiura/TakasakiKoshigaya/Chiba/Urayasu/Chiyoda/Shinjuku/Setagaya/NakanoSuginami/Arakawa/Itabashi/Adachi/Edogawa/Tama/KawasakiYokosuka/Shonan/Zama
Chubu AreaJoetsu/Chuetsu/Fukui/Toyama/Kofu/Matsumoto/Toshin/KisoShizuoka/Ueda
Kinki AreaKitaosaka/Higashiosaka/Minamiosaka/Kobe/Kyoto/Shiga
Chugoku AreaOkayama/Matsue/Yamaguchi/Tottori
Shikoku AreaMinamihoribata/Kochi/Tokushima
Kyushu AreaKitakyushu/Kumamoto/Oita/Kagoshima
Corporate Profile As of March 31, 2002 Investor Information As of March 31, 2002
Fiscal Year-End March 31, 2002Annual Shareholders’ Meeting June 27, 2002
Common Stock Authorized :249,341,000 sharesIssued :135,264,252 shares
Number of Shareholders 9,641Date of Listing July 1962
Stock Exchange Listing First Section of Tokyo Stock Exchange and Osaka Securities Exchange
Transfer Agent The Mitsubishi Trust and Banking Corporation Securities Department11-1, Nagatacho 2-chomeChiyoda-ku, Tokyo 100-0014
Auditor Certified Public Accountants of JapanO-Yu Kyodo Office
Share Held PercentageCompany Name (Thousands) of Shares
Outstanding
Japan Trustee Services Bank, Ltd. (Trust Account) 8,694 6.42%
Fujikura Ltd. 5,212 3.85
Sumitomo Electric Industries, Ltd. 5,166 3.81
The Furukawa Electric Co., Ltd. 5,166 3.81
The Mitsubishi Trust and Banking Corp. (Trust Account) 4,952 3.66
UFJ Bank Limited (Trust Account) 4,902 3.62
The Chase Manhattan Bank, N.A. London 4,161 3.07
ASAD 3,517 2.60
Nippon Life Insurance Company (Pension Trust Account) 2,839 2.09
Fujitsu Limited 2,413 1.78
Major Shareholders As of March 31, 2002

Investors’ Guide 2002
32
■ Brief History of COMSYS
Dec. 1951 Founded as The Nippon Telecommunications
Construction Co., Ltd. (NTK).
Mar. 1952 Won first contract for cable-laying and machinery
installation.
Aug. 1952 As Japan’s only firm with top certifications in cable laying,
machinery installation, and radio facilities projects,
designated approved contractor by Nippon Telegraph
and Telephone Public Corporation (now NTT).
Jun. 1953 Won contract for cable installation at a microwave telecommunications relay station as part of
a project linking Tokyo, Nagoya, and Osaka.
Sep. 1953 Established our Osaka Branch (now our Kansai Branch).
Sep. 1957 Established our Nagano Branch (now our Shinetsu Branch).
Sep. 1959 Orders received break ¥10 billion.
Dec. 1961 Completed our 100th microwave station.
Jul. 1962 Increased paid-in capital to ¥300 million.
Jul. 1962 Listed on the Tokyo Stock Exchange, Second Section.
Nov. 1963 Won our first contract for a Shield Tunneling Method project.
Dec. 1965 Won our first overseas contract (Bangkok).
Aug. 1970 Established our Urawa Branch (now our Kantonaka Branch).
Sep. 1970 Won a contract for a satellite-communication Earth station.
Jul. 1972 Established our Yokohama Branch (Now our
Kantominami Branch).
Feb. 1972 Listed on the Osaka Stock Exchange, Second Section.
Nov. 1972 Listed on the First Section of the Tokyo and Osaka Stock Exchanges.
Dec. 1972 Increased paid-in capital to ¥1.5 billion.
Jul. 1973 Established our Akita and Utsunomiya Branches (now our Tochigi Branch).
Apr. 1976 Increased paid-in capital to ¥2.5 billion.
Mar. 1982 Established our Hokkaido, Tohoku, Hokuriku, Tokai, Chugoku, Shikoku, and Kyushu Branches.
Aug. 1982 Won contract for Japan’s first fiber-optic cable
installation project.
Apr. 1984 Established our Niigata Branch.
Jul. 1990 Changed our name from The Nippon
Telecommunications Construction Co., Ltd. to Nippon
COMSYS Corporation.
Jul. 1990 Established our Hokuriku Branch.
Feb. 1991 Certified as comprehensive contractor for
telecommunications construction projects by NTT.
Mar. 1992 Won Japan’s first contract under the Rapid Reconstruction
Project in Kuwait following the Gulf War.
Mar. 1994 Increased paid-in capital to ¥10 billion.
Mar. 1997 Orders received and net sales exceeded ¥200 billion.
Jul. 1997 Increased paid-in capital to ¥20 billion.
Aug. 1999 Increased paid-in capital to ¥30 billion.
Apr. 2000 Established our Fukushima, Takamatsu, and Okinawa
Branches.
Jul. 2000 Developed the Tuned Rotary-Mass Damper jointly with
Tokai University.
Sep. 2000 Developed “SweeCOM,”a revolutionary negative pressure
and absorption cable installation system, for the efficient
laying of fiber-optic cable.
Aug. 2001 Completed our new headquarters building at 17-1,
Higashigotanda 2-chome, Shinagawa-ku, Tokyo.
Dec. 2001 50th Anniversary of the Company’s founding.
Mar. 2002 Selected as one of the 225 companies included
in the Nikkei Stock Price Average.
The Bangkok cable project (Dec. 1965)
Satellite communications project (Sep. 1970)
Our first Head offices building (Dec. 1951)
Cable conversion project (1978)
New Headquarters Building in Osaki(Aug. 2001)

www.comsys.co.jp/
Welcome to COMSYS Website■ COMSYS Website

17-1, Higashigotanda 2-chomeShinagawa-ku, Tokyo 141-8647, JapanURL http://www.comsys.co.jp
Public Relations OfficeTEL. 03-3448-7000FAX. 03-3448-7001
Printed in Japan on recycled paper made from 100% post-consumer materials.