Embed Size (px)
Citation preview
University of WollongongResearch Online
University of Wollongong Thesis Collection University of Wollongong Thesis Collections
2002
Investigation of the electrochemical behaviour ofmetal electrodes in biological mediaSimon Edward MoultonUniversity of Wollongong
Research Online is the open access institutional repository for theUniversity of Wollongong. For further information contact the UOWLibrary: [email protected]
Recommended CitationMoulton, Simon Edward, Investigation of the electrochemical behaviour of metal electrodes in biological media, Doctor of Philosophythesis, Department of Chemistry, University of Wollongong, 2002. http://ro.uow.edu.au/theses/2919
Investigation of the Electrochemical
Behaviour of Metal Electrodes in
Biological Media
A thesis submitted in fulfilment of the requirements for the
award of the degree
DOCTOR OF PHILOSOPHY
from
UNIVERSITY OF WOLLONGONG
by
Simon Edward Moulton, BTech. (Environmental
Geochemistry), BSc. (Hons)
Department of Chemistry
2002
Declaration
I, Simon Edward Moulton, declare that this thesis, submitted in fulfilment of the
requirements for the award of Doctor of Philosophy, in the Department of
Chemistry, University of Wollongong, is wholly my own work unless otherwise
referenced or acknowledged. The work described in this thesis has never been
submitted for a higher degree at any other university or institution.
Simon Edward Moulton
2002
I

I dedicate this Thesis to m y family
Louise, Aleida and Liam
II
Acknowledgements
I would like to sincerely thank my supervisors Prof Gordon Wallace and Dr
Norm Barisci for giving me the opportunity to undertake my PhD in an
extremely fascinating area of research. I would also like to thank them for their
tireless efforts in assisting and guiding me through all aspects of my project.
This PhD would not have been possible if it were not for my Industry partner,
Polartechnics Ltd. The warm welcome I received from all Polartechnics staff, the
supply of materials and the invaluable discussions have helped me immensely.
Their financial assistance to attend an international conference was greatly
appreciated. Special thanks goes to Dr Rita Stella, Dr Warren Smith, Dr Richard
Thomson and Mr Andrew Bath for helpful discussion, particularly on the
operation of TruScan™ and the development of the SUS units.
I would like to thank Jason McArthur, Darren Saunders and Nick Andronicus
from the Biological Sciences Department (UoW) for their assistance in
performing the radiolabelling work. A big thanks also for their patience as they
tried to teach an electrochemist the concepts of protein chemistry.
The spectroscopic work was made possible by the generosity and hospitability of
Prof Jim McQuillan from the Chemistry Department at Otago University,
Dunedin, New Zealand. Lee Bronkhurst of the Engineering Facility at UoW
provided invaluable assistance in obtaining the AFM images presented in this
thesis.
Ill
I would like to thank everyone at IPRI for their friendship and assistance during
my PhD and for the 6 years I have been at IPRI. Especially Dr Michael Davey,
Dr Rod Shephard, Dr Andy Minnet, Dr Peter Innis, Dr Chee On Too, Dr Toni
Campbell and Prof Leon Kane Maguire. Thanks to Violeta Misoska for her help
in acquiring the AFM images.
Thankyou to my whole family who helped me in various ways over the last 4
years. Especially Dad, Mum and Fred, Caroline and Simon, Jan and Tim.
Thankyou from the bottom of my heart.
Finally to the most important people, who without, my PhD would have gone by
the wayside years ago. Thank you Louise, Aleida and Liam for being there for
me. Your love and unwavering support has helped me through the difficult times
and kept me focussed.
IV
Table of Contents
Declaration I
Acknowledgments III
Table of Contents V
Publications IX
Conference Presentations IX
Abbreviations XI
Abstract XIII
CHAPTER 1: Introduction 1
1.1 General Introduction 2
1.2 TruScan™ 2
1.3 Electrode Material 7
1.3.1 Gold 7
1.3.2 Titanium Dioxide (Ti02) 8
1.4 Proteins 10
1.4.1 Human Serum Albumin (HSA) 13
1.4.2 Immunoglobulin G (Ig.G) 15
1.5 Proteins at Interfaces 16
1.5.1 Influence of Charge 19
1.5.2 Hydrophobicity 20
1.5.3 Influence of Protein Structural Stability 21
1.5.4 Protein Adsorption and Electrochemistry 25
1.6 Aims of this Work 30
References 32
CHAPTER 2: Experimental Techniques and Procedures 42
2.1 Quartz Crystal Microbalance 43
2.1.1 Experimental 43
2.2 Radiolabelling 44
2.2.1 Experimental 46
2.3 Electrochemical Impedance Spectroscopy (EIS) 51
V
2.3.1 Experimental 54
2.4 Cyclic Voltammetry 57
2.4.1 Experimental 58
2.5 Attenuated Total Reflectance Infrared (ATR-IR) Spectroscopy 59
2.5.1 Experimental 61
2.6 Solutions and Reagents 62
References 66
CHAPTER 3: Adsorption of protein on Gold 67
3.1 Introduction 68
3.1.1 Radiolabelling 68
3.1.2 Quartz Crystal Microbalance 68
3.1.3 Electrochemical Impedance Spectroscopy 71
3.2 Results and Discussion 72
3.2.1 Adsorption at Constant Potential 74
3.2.1.1 Adsorption of H S A 74
3.2.1.2 125l Radiolabelling 78
3.2.1.2.1 Effect of pH 82
3.2.1.2.2 Protein Removal 85
3.2.2 Adsorption Profiles with Pulsed Potential Routine Applied 90
3.2.3 EIS Study - Protein Adsorption Kinetics 93
3.3 Conclusions 100
References 102
CHAPTER 4: Effect of Protein Adsorption on the
Electrochemical Behaviour of Gold 108
4.1 Introduction 109
4.1.1 Electrochemical Impedance Spectroscopy 109
4.1.2 Cyclic Voltammetry 110
4.2 Results and Discussion 111
4.2.1 Electrode Characterisation 111
4.2.2 Open Circuit Potential (OCP) Measurement 112
4.2.3 Potential of Zero Charge 113
4.2.4 Non-Faradaic - Double layer Effects 114
4.2.4.1 Adsorption at O C P and Impedance at Various Potentials 115
4.2.4.2 Impedance Measurements at Various Potentials 122
4.2.4.3 Effect of Electrode Surface Area 123
4.2.4.4 Adsorption of Ig.G with Pulsed Potential Routine Applied 127
4.2.4.5 Impedance at a Single Frequency 132
4.2.5 Faradaic - Electron Transfer Effects 137
4.2.5.1 Cyclic Voltammetry in K3Fe(CN)6 137
4.2.5.1.1 Adsorption at O C P 137
4.2.5.1.2 Effect of Applied Potential During Adsorption 141
4.2.5.1.3 Effect of Solution pH 143
4.2.5.2 Electrochemical Impedance Spectroscopy in K3Fe(CN)6 146
4.2.6 Electrical Equivalent Circuit (EEC) Modelling 149
4.3 Conclusions 152
References 155
CHAPTER 5: Adsorption of Ig.G on Titanium Dioxide 158
5.1 Introduction 159
5.2 Results and Discussion 161
5.2.1 Adsorption at Constant Potential 161
5.2.2 Adsorption at Pulsed Potential 165
5.2.3 EIS Study - Protein Adsorption Kinetics 167
5.3 Conclusions 173
References 175
CHAPTER 6: Effect of Ig.G Adsorption on the
Electrochemical Behaviour of
Titanium Dioxide 177
6.1 Introduction 178
6.2 Results and Discussion 179
6.2.1 Electrochemical Characterisation 179
6.2.2 Open Circuit Potential (OCP) Measurements 184
6.2.3 Potential of Zero Charge 184
6.2.4 Non-Faradaic - Double layer Effects 186
6.2.4.1 Impedance and Adsorption at Constant Potential 186
6.2.4.2 Impedance at O C P 191
6.2.4.2.1 Adsorption at Constant Potential 191
6.2.4.2.2 Adsorption of Ig.G with Pulsed Potential Routine
Applied 195
6.2.4.3 Impedance at a Single Frequency 199
6.2.5 Faradic-Electron Transfer Effects 203
6.2.5.1 Cyclic Voltammetry in K3Fe(CN)6 203
6.2.5.2 Impedance in K3Fe(CN)6 205
6.2.6 Electrical Equivalent Circuit (EEC) Modelling 207
6.3 Conclusions 210
References 213
CHAPTER 7: ATR-IR Spectroscopy Studies of Ig.G
Adsorption onto Titanium Dioxide 215
7.1 Introduction 216
7.2 Results and Discussion 217
7.2.1 Effect of Phosphate on Ig.G Spectra 217
7.2.2 Phosphate Induced Ig.G Desorption 222
7.2.3 pH Studies 226
7.3 Conclusions 229
References 230
CHAPTER 8 Conclusions 233
Publications
1. ATR-IR Spectroscopic Studies of the Influence of Phosphate Buffer on
Adsorption of Immunoglobulin G to Ti02. S.E. Moulton, J.N. Barisci,
A.J. McQuillan and G.G. Wallace, Colloids and Surfaces A:
Physicochemical and Engineering Aspects, 2002 (Accepted: in print)
2. Investigation of Protein Adsorption and Electrochemical Behaviour at
a Gold Electrode. S.E. Moulton, J.N. Barisci, A. Bath, R. Stella and
G.G. Wallace, Journal of Colloid and Interface Science 2002
(Accepted: in print).
Conference Presentations
1. TruScan: A New Approach to Cervical Cancer Detection. S.E
Moulton, J.N. Barisci and G.G. Wallace. Oral presentation at the
Junior Electrochemist Research Conference, Macquarie University,
Sydney, Australia, 1998.
2. Investigation of the Electrochemistry and Adsorption of Proteins
at Metal Electrodes. S.E Moulton, J.N. Barisci, A. Bath and G.G.
Wallace. Oral presentation at the 7l Annual Research and
Development Topics 1999, University of New South Wales, Sydney,
Australia, 1999.
IX
3. Electrochemical Responses of Metal Electrode Measured in
Biological Media. S.E Moulton, J.N. Barisci, A. Bath, R. Stella and
G.G. Wallace. Poster presentation at the 11th Australasian
Electrochemistry Conference (11AEC), Sydney, Australia, 2000.
4. Effect of Protein Adsorption on Electrochemical Responses of
Metal Electrodes. S.E Moulton, J.N. Barisci, A. Bath, R. Stella and
G.G. Wallace. Oral presentation at the 2001 Joint International
Meeting of The Electrochemical Society and the International Society
of Electrochemistry, San Francisco, USA, 2001.
X
Abbreviations
AC
A
CD
ia
Ea
ATR-IR
C
ic
Ec
Ret
Q
cpm
cps
Ci
CV
D
DF
DC
dps
Cdi
EEC
EIS
F
Vfb
F
Hz
HSA
7
Ig.G
Alternating current
A m p
Angular frequency
Anodic peak current
Anodic peak potential
Attenuated total reflection infrared spectroscopy
Capacitor
Cathodic peak current
Cathodic peak potential
Charge transfer resistance
Const phase element
Counts per minute
Counts per second
Curie
Cyclic voltammetry
Dalton
Dilution factor
Direct current
Disintegrations per second
Double layer capacitance
Electrical equivalent circuit
Electrical impedance spectroscopy
Farad
Flat band potential
Frequency
Hertz
Human Serum Albumin
Imaginary impedance
Immunoglobulin G
Z Impedance
IR Infrared spectroscopy
pi Isoelectric point
min Minute
Q Ohm
O C P Open circuit Potential
Roi Oxide layer resistance
P B S Phosphate buffer saline
Z R Real impedance
s Second
S U S Single use sensor
Rs Solution resistance
V volt
Abstract
The development of an optoelectric device (TruScan™) for the detection of
cervical cancer provides the framework for this thesis. TruScan™ stimulates the
cervical tissue with low energy electrical pulses producing a tissue response. This
response is recorded at the three electrode tip and the signal is interpreted for a
tissue classification. The aim of this work was to measure the extent of protein
adsorption onto metal electrodes under various conditions, and then investigate
the effects this protein layer had on the electrochemical behaviour measured at
the electrode/solution interface.
The adsorption trends of proteins, and the effect that adsorption has on
electrochemical responses of metal electrodes has been studied using various
experimental techniques. The effect of p H and electrode potential on adsorption
trends has been investigated using the proteins human serum albumin (HSA) and
human immunoglobulin G (Ig.G) at both gold (Au) and titanium dioxide (Ti02)
metal surfaces.
This work showed that protein adsorbs spontaneously at metal electrodes at
neutral pH. The protein adsorption trends followed electrostatic interactions, with
the greatest amount of adsorption occurring when the electrode and protein had
opposite charges, and the least amount when they possessed the same charge.
The extent of protein adsorption also appeared to be influenced by the waveform
of the applied potential. Only a small percentage of the total adsorbed protein
could be removed. This was attributed to the denaturing of the protein allowing it
XIII
to form multiple binding sites, which increased its binding strength. This result
lead to the hypothesis of two types of bound protein, namely weakly and strongly
bound. Spectroscopic studies showed that the presence of phosphate in the
protein solution hinders adsorption, resulting in lower adsorbed amounts.
Phosphate was also shown to partially displace preadsorbed protein from a Ti02
surface. The fact that not all of the preadsorbed protein was displaced
strengthened the hypothesis of two types of bound protein.
The effect of protein adsorption on the electrochemical behaviour of metal
electrodes was studied using electrochemical impedance spectroscopy and cyclic
voltammetry. Upon adsorption of protein at Au and Ti02 the capacitance
decreased, which was attributed to the formation of a proteinaceous layer on the
electrode surface. This decrease in capacitance was accentuated when the
electrode surface was treated in such a way that the surface area and roughness
increased. The formation of a proteinaceous layer on the electrode surface had
the effect of increasing the charge transfer resistance. The resistance to charge
transfer was shown to increase as the amount of adsorbed protein increased due
to the increase in proteinaceous layer thickness. The electrode/electrolyte
interface, for both electrode materials, was successfully modelled using a
modified Randies circuit.
XIV

Chapter 1 - Introduction
Chapter 1
Introduction
1
Chapter 1 - Introduction
1.1 General Introduction
The purpose of this project was to achieve an understanding of the characteristics
of metal electrodes operating in a proteinaceous environment which is used in
detecting pre-cancer and cancer of the cervix. This was investigated by
considering the factors influencing the transient electrochemical responses
obtained at these electrodes in a biological test medium. Protein adsorption
trends at metal electrodes under various conditions were determined and the
effect that the adsorbed protein has on the electrochemical responses of the metal
electrode in biological media investigated.
This work was motivated by the development of a new optoelectronic medical
device, developed by Polartechnics Pty Ltd., for the detection of cervical cancer.
The device is called TruScan™. The environment in which TruScan™ works
means that interaction of the probe electrodes with proteinaceous material is
inevitable.
1.2 TruScan™
TruScan™ is currently being developed by Polartechnics Pty Ltd (Sydney-
Australia). Polartechnics has been developing TruScan™ for the last 14 years and
the device in now nearing commercialisation in some countries [1]. TruScan™ is
a computerised medical device designed to screen for cervical pre-cancer and
cancer by instantaneously assessing the normality of tissue by measuring the
response of the tissue to low energy light and electrical pulses.
2
Chapter 1 - Introduction
In contrast to competing cervical pre-cancer and cancer screening methods, the
technology utilised in TruScan™ is based on the physical characteristics of the
cervical tissue, such as tissue capacitance, rather than its chemical or visible
characteristics, such as visual examination or the response of the non-living
tissue to a chemical reagent. With TruScan™ the tissue response to an optical and
electrical stimulus is compared algorithmically in real time to that stored in a
databank of cervical tissue types. Once a tissue type is matched a result is
displayed to the clinical operator. Independent trials last year showed TruScan™
was up to 20% more accurate than the currently employed Pap smear for cervical
cancer detection [2].
The conceptual initiation of such a device has its foundations in the pioneering
work of Fricke and Morse, who in 1926 conducted a study involving the
electrical capacitance measurements of breast tumors [3, 4]. This was followed in
1949 with a study of electrical parameters derived from measurements of cervical
tissue by Langman and Burr, who reported a significant difference in cancerous
and non-cancerous tissue [3, 5].
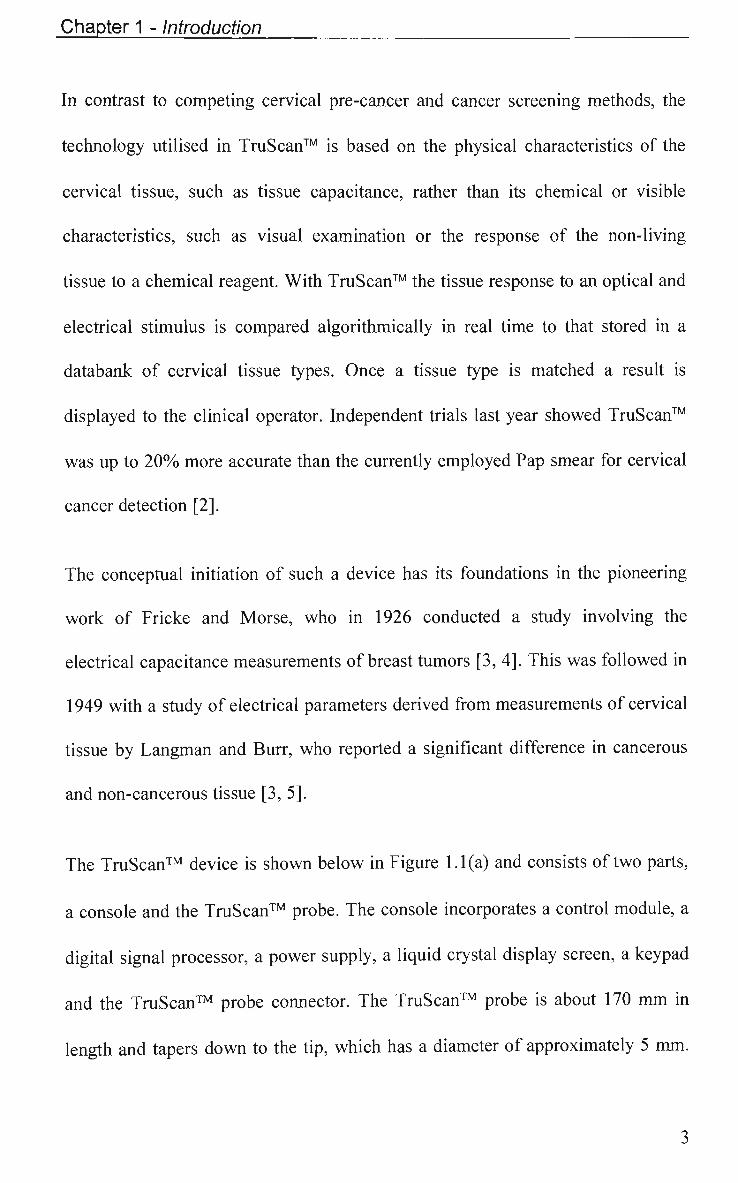
The TruScan™ device is shown below in Figure 1.1(a) and consists of two parts,
a console and the TruScan™ probe. The console incorporates a control module, a
digital signal processor, a power supply, a liquid crystal display screen, a keypad
and the TruScan™ probe connector. The TruScan™ probe is about 170 mm in
length and tapers down to the tip, which has a diameter of approximately 5 mm.
3
Chapter 1 - Introduction
Situated at the tip are the optical and electrical electrodes which are shown in
Figure 1.1(b).
(a)
(b)
Figure 1.1 (a) TruScan ™ device showing the console and probe unit (b) Schematic
of the probe tip showing the three electrodes (A, B, C) surrounding the light emitting
and detecting fibres. (Source: http://www.polartechnics.com.au)
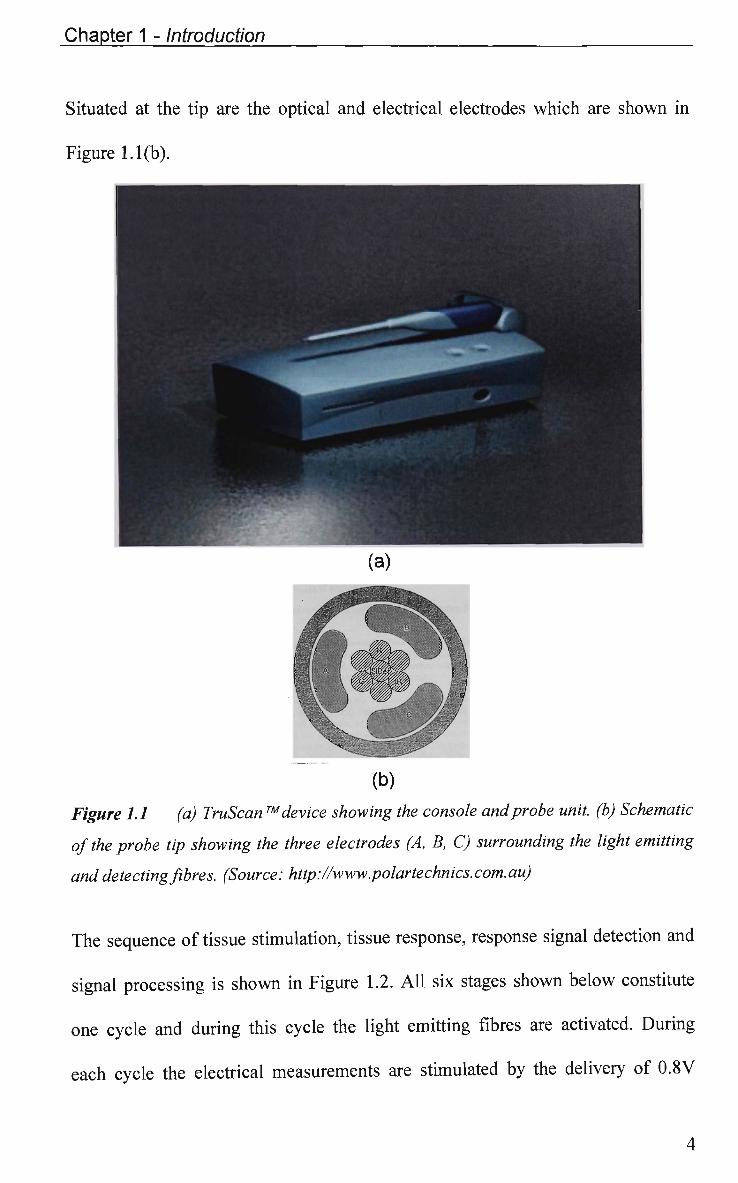
The sequence of tissue stimulation, tissue response, response signal detection and
signal processing is shown in Figure 1.2. All six stages shown below constitute
one cycle and during this cycle the light emitting fibres are activated. During
each cycle the electrical measurements are stimulated by the delivery of 0.8V
4
Chapter 1 - Introduction
electrical pulses of 260ps duration. Following removal of the applied electrical
potential, the residual charge dissipates within the tissue with a decay constant
dependant on the tissue capacitance, the electrode/tissue interface and electronic
and ionic conductance [3].
Figure 1.2 The TruScan™ tissue stimulation and processing. (Source:
http://www.polartech.nics. com. au)
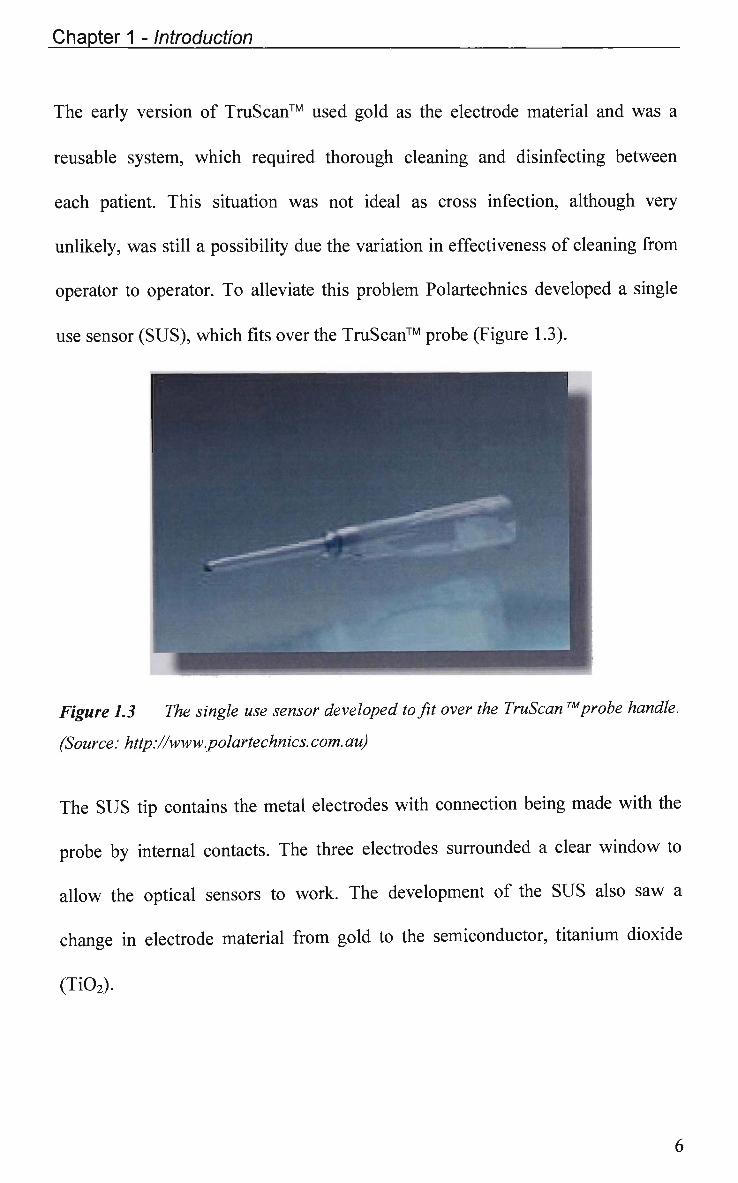
The electrical pulses are delivered across varying combinations of the three
electrodes. In each case one electrode acts as the working electrode whilst the
other two are held as the counter electrode. Electrical pulse delivery and the
corresponding relaxation curve measurements are continually cycled through all
three electrode combinations. The use of three electrodes allows the detection of
conditions of asymmetric charge imbalance between the electrodes resulting
from poor contact between the tip and cervical tissue caused by operator error
[3]-
5
Chapter 1 - Introduction
The early version of TruScan™ used gold as the electrode material and was a
reusable system, which required thorough cleaning and disinfecting between
each patient. This situation was not ideal as cross infection, although very
unlikely, was still a possibility due the variation in effectiveness of cleaning from
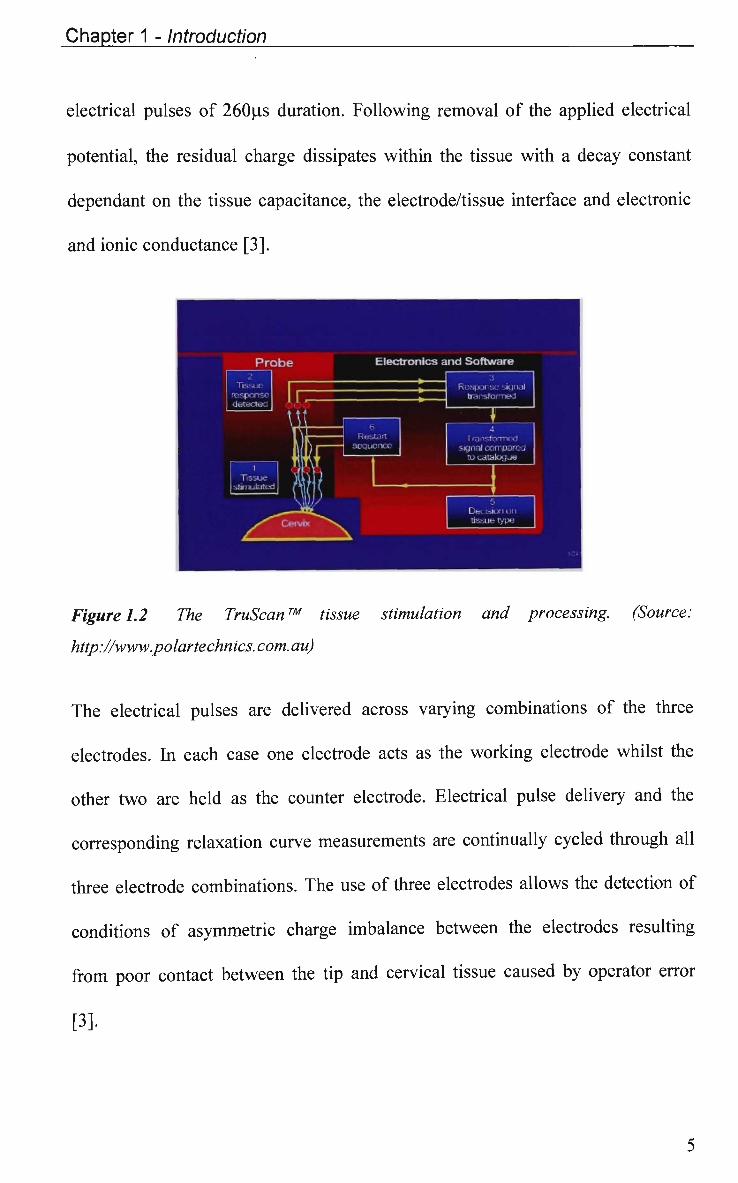
operator to operator. To alleviate this problem Polartechnics developed a single
use sensor (SUS), which fits over the TruScan™ probe (Figure 1.3).
Figure 1.3 The single use sensor developed to fit over the TruScan ™probe handle.
(Source: http://www.polartechnics. com. au)
The SUS tip contains the metal electrodes with connection being made with the
probe by internal contacts. The three electrodes surrounded a clear window to
allow the optical sensors to work. The development of the S U S also saw a
change in electrode material from gold to the semiconductor, titanium dioxide
(Ti02).
6
Chapter 1 - Introduction
1.3 Electrode Material
1.3.1 Gold
Gold electrodes can either be single crystal, such as Au (100), Au (110), Au
(111) or polycrystalline which combine two or more of the single crystal types.
The number in brackets refers to their lattice structure. Polycrystalline gold is one
of the most commonly used noble metals in the manufacturing of electrodes. Its
appeal lies in the very favorable electron-transfer kinetics and a large anodic
potential range, however, the low hydrogen overpotential of this electrode limits
the cathodic potential window [6]. In acid chloride media the anodic range of
gold is severely limited by oxidation of the metal to complex chlorides [7].
The experimentally determined potential limits of gold electrodes in a variety of
electrolytes at various pH regularly exceed the theoretical limit determined using
equations (1.1) and (1.2). The variation occurs due to the fact that these equations
do not take info account the electrode material and specific interactions between
the electrode metal and background electrolyte [7].
Reduction of hydrogen ions: E = -0.059pH (1.1)
Oxidation of water: E = 1.23 - 0.059pH (1.2)
Surface oxidation of gold introduces complications. While the anodic limit of
gold in 1.0M perchloric acid is given to be +1.5V (vs. SCE) [7] Bauman and
Shain [8] point out the practical range extends to only +0.8V (vs. SCE) due to
interferences by the gold oxide formation. Gold does not sorb hydrogen to any
7
Chapter 1 - Introduction
appreciable extent [6] and after hydrogen evolution gold shows practically none
of the hydrogen dissolution current associated with platinum [7].
Gold electrodes have been used extensively in many areas of research such as the
development of biosensors [9-12], the study of redox proteins [13, 14] and the
investigation of adsorption processes [15-17] to name a few.
1.3.2 Titanium Dioxide (Ti02)
Titanium dioxide is a semiconductor and has been studied as an electrode in
electrochemical systems for many years, particularly in its use as an electrode for
the conversion of solar energy to electrical energy. Fujishima and Honda [18, 19]
were the first to report the continuous conversion of light to current and a
chemical reaction using a semiconductor electrode. Ti02 has three naturally
occurring crystal phases: rutile, anatase and brookhite. To date, all
electrochemical work has been performed on rutile or anatase, or a mixture of
both [20]. The electrochemical properties of polycrystalline and single crystal
Ti02 electrodes have been investigated by many researchers [21-23].
There are several techniques that can be employed to fabricate Ti02 electrodes,
namely, thermally oxidised titanium, sintered compressed powders, sol-gel
methods from such material as Degussa P25, and electrochemical oxidation at
either sweep potential or constant current or either solid titanium or a sputtered
film of titanium.
8
Chapter 1 - Introduction
Electrical properties of Ti0 2 necessarily refer to the doped form due to the high
resistivity of undoped Ti02. Ti02 can be doped by reduction or substitution
creating donor levels near the conduction band, and hence the semiconductor is
always n-type doped. The term n-type refers to the fact that electrical current is
carried predominantly by the negative charge carriers in the conduction band.
Doping by reduction can occur either by heating in a vacuum, hydrogen, argon,
or a mixture of CO and C02 or by biasing the electrode negative of the flatband
potential (Va). Flatband potential refers to the unique potential of a
semiconductor for which the potential drop between the surface and the bulk of
the electrode is zero.
The electrochemical properties of Ti02 in aqueous solutions are characterised by
charging currents, which are proportional to the space charge capacitance, which
diminish for increasing positive potential. The magnitude of the current peaks are
proportional to the sweep rate in a linear scan voltammogram, indicating that the
redox process is confined to the Ti02 surface and not dependent on mass transfer
of a substance from the solution [20]. At a significantly positive potential the
small faradaic current characteristic of a depletion layer abruptly rises, and
oxygen evolves from the electrode [24-26]. Water reduction is omnipresent at
potentials negative of the Va and is often the dominant process and at potentials
biased ca. 0.5V more negative than Vft the Ti02 exhibits a number of altered
properties, such as a changed photocurrent spectrum and an increase in the
electrode capacitance [27, 28].
9
Chapter 1 - Introduction
1.4 Proteins
The environment in which TruScan™ operates in is one of high biological
activity. Surrounding the cervix is a protective layer of cervical mucus, which is
a complex mixture, produced continually by the endocervical cells called goblet
cells [29]. The major structural components of mucus are mucins - highly
glycosylated proteins, the major mass of which are (9-linked carbohydrates [30].
Proteins are a large group of nitrogenous compounds of high molecular weight
that are essential constituents of all living organisms. The stunning diversity of
the thousands of proteins found in nature arises from the intrinsic properties of
only 20 commonly occurring aminoacids [31]. These aminoacid units are joined
together in a precise sequence when the protein is made on a ribosome. The chain
is then folded, often into a very compact form [31].
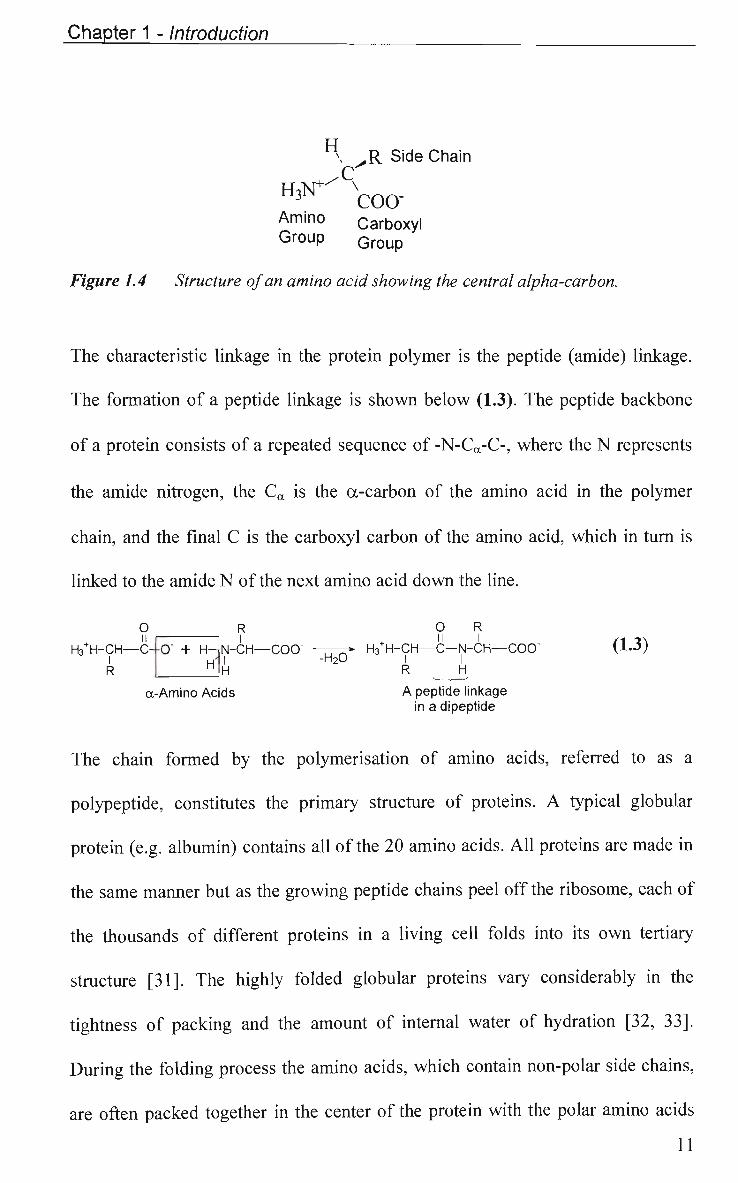
The structure of a typical amino acid is shown below in Figure 1.4. Central to the
structure is the tetrahedral alpha-carbon (Ca), which is covalently linked to both
the amino group and the carboxyl group. Also bonded to this a-carbon is a
hydrogen and a variable side chain (R). These side chain groups fill much of the
space in the interior of a protein molecule and also protrude from the external
surfaces of the protein where they determine many of the chemical and physical
properties of the molecule [31]. It is the side chain that gives each amino acid a
particular identity. Amino acids fall into two general classes, polar (hydrophilic)
and non-polar (hydrophobic).
10
Chapter 1 - Introduction
\ V R Side Chain
H^Ccoo-Amino Carboxyl
Group G r o u p
Figure 1.4 Structure of an amino acid showing the central alpha-carbon.
The characteristic linkage in the protein polymer is the peptide (amide) linkage.
The formation of a peptide linkage is shown below (1.3). The peptide backbone
of a protein consists of a repeated sequence of -N-Ca-C-, where the N represents
the amide nitrogen, the Ca is the a-carbon of the amino acid in the polymer
chain, and the final C is the carboxyl carbon of the amino acid, which in turn is
linked to the amide N of the next amino acid down the line.
H3+H-CH—C R
O R O R II I O" + H-JN-CH—COO" ~rr^ H3 H-CH—C—N-CH—COO (1.3)
L/ | -H20 | | H H R H a-Amino Acids A peptide linkage
in a dipeptide
The chain formed by the polymerisation of amino acids, referred to as a
polypeptide, constitutes the primary structure of proteins. A typical globular
protein (e.g. albumin) contains all of the 20 amino acids. All proteins are made in
the same manner but as the growing peptide chains peel off the ribosome, each of
the thousands of different proteins in a living cell folds into its own tertiary
structure [31]. The highly folded globular proteins vary considerably in the
tightness of packing and the amount of internal water of hydration [32, 33].
During the folding process the amino acids, which contain non-polar side chains,
are often packed together in the center of the protein with the polar amino acids
11
Chapter 1 - Introduction
occupying the exterior of the protein. This results in most proteins having a
hydrophilic exterior, which shields the hydrophobic interior from the surrounding
water.
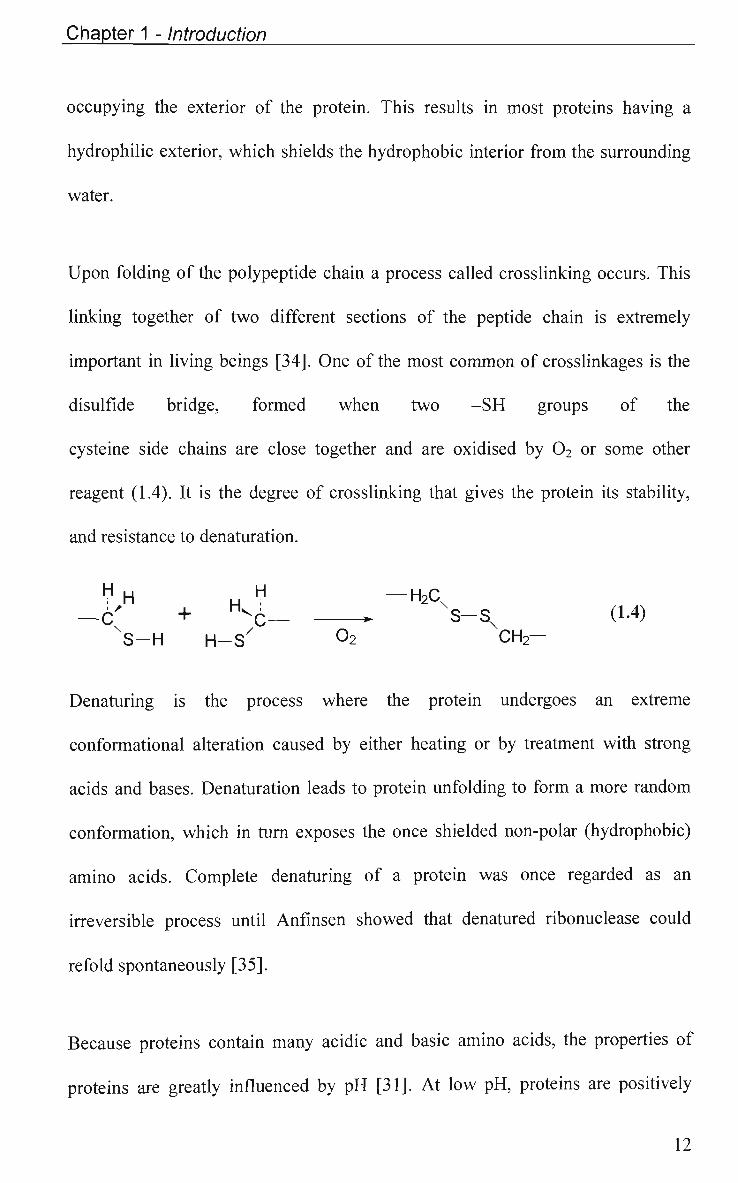
Upon folding of the polypeptide chain a process called crosslinking occurs. This
linking together of two different sections of the peptide chain is extremely
important in living beings [34]. One of the most common of crosslinkages is the
disulfide bridge, formed when two -SH groups of the
cysteine side chains are close together and are oxidised by 02 or some other
reagent (1.4). It is the degree of crosslinking that gives the protein its stability,
and resistance to denaturation.
V H H H —H2CX — 6 ' + V C - S-Sx (1.4)
V S - H H - S X °2 C H 2 -
Denaturing is the process where the protein undergoes an extreme
conformational alteration caused by either heating or by treatment with strong
acids and bases. Denaturation leads to protein unfolding to form a more random
conformation, which in turn exposes the once shielded non-polar (hydrophobic)
amino acids. Complete denaturing of a protein was once regarded as an
irreversible process until Anfinsen showed that denatured ribonuclease could
refold spontaneously [35].
Because proteins contain many acidic and basic amino acids, the properties of
proteins are greatly influenced by pH [31]. At low pH, proteins are positively
12
Chapter 1 - Introduction
charged due to the carboxylates, -S" and imidazole groups accepting protons to
become neutral, resulting in an excess of positively charged acidic amino acids
remaining. At high pH the protein is negatively charged due to the loss of
protons. The point between the high and low pH where the protein charge is zero
is called the isoelectric point (pi).
The two proteins used in this study are both globular proteins, and are Human
Serum Albumin and human Immunoglobulin G. These proteins are described in
more detail below.
1.4.1 Human Serum Albumin (HSA)
Human Serum Albumin (HSA) is a globular protein and, as the name suggests, is
part of the albumin family of proteins. HSA has a molecular weight of
approximately 66kD and has been described to have a shape of an oblate
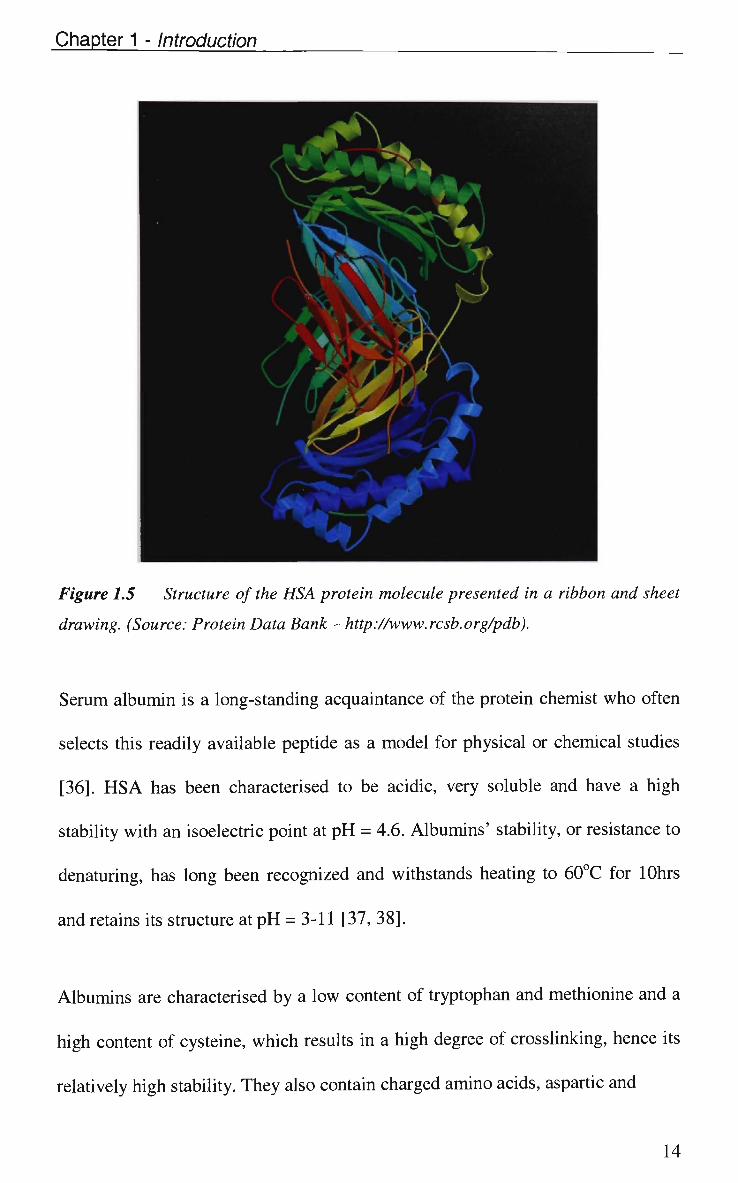
spheroid with dimensions of 38 x 150A. Through the use of sophisticated
computer graphics it is possible to show the structure of HSA using
crystallographic data (Figure 1.5). The wide ribbons are used to show the p
strands and the helical turns while narrower ribbons are used for bends and loops
of the peptide chains. The arrowheads on the p strands indicate the direction from
the N terminus to C terminus. No individual atmos are shown and all side chains
are omitted.
13
Chapter 1 - Introduction
Figure 1.5 Structure of the HSA protein molecule presented in a ribbon and sheet
drawing. (Source: Protein Data Bank - http://www.rcsb.org/pdb).
Serum albumin is a long-standing acquaintance of the protein chemist who often
selects this readily available peptide as a model for physical or chemical studies
[36]. H S A has been characterised to be acidic, very soluble and have a high
stability with an isoelectric point at p H = 4.6. Albumins' stability, or resistance to
denaturing, has long been recognized and withstands heating to 60°C for lOhrs
and retains its structure at pH = 3-11 [37, 38].
Albumins are characterised by a low content of tryptophan and methionine and a
high content of cysteine, which results in a high degree of crosslinking, hence its
relatively high stability. They also contain charged amino acids, aspartic and
14
Chapter 1 - Introduction
glutamic acids, lysine, and arginine giving the molecule a net negative charge at
neutral pH. HSA is not uniformly charged throughout its length, rather is has
three domains each exhibiting different charges. The amino terminal of HSA is
highly negative and the carboxyl terminal is nearly neutral.
Due to HSA being well characterised and a commonly available protein it was
used in this work to validate the effectiveness of several experimental techniques
in investigating the adsorption behavior of protein at metal electrode surfaces.
1.4.2 Immunoglobulin G (Ig.G)
Immunoglobulin G (Ig.G) is also a globular protein with a molecular weight of
approximately 156kD, which falls into the glycoprotein family, and is one of the
antibodies found in cervical mucus. A glycoprotein as described by Metzler [31]
is a protein, including the ones secreted from living cells and many that are
components of cell surfaces, which carry covalently attached oligosaccharides.
Spiegelberg [39] described human immunoglobulins as a group of structurally
and functionally similar glycoproteins that confer humoral immunity in man. In
short, immunoglobulins are antibody proteins which are present in fluid (mucus)
excreted from living cells.
The immunoglobulin (lg) protein "backbone" consists of heavy and light chains,
terms based on their relative size. There are five types of heavy chains, which
distinguish the class of immunoglobulins Ig.M, Ig.G, Ig.D, Ig.A and Ig.E, and
two types of light chains [40]. The shape of all Ig's is that of a "Y" (Figure 1.6).
15
Chapter 1 - Introduction
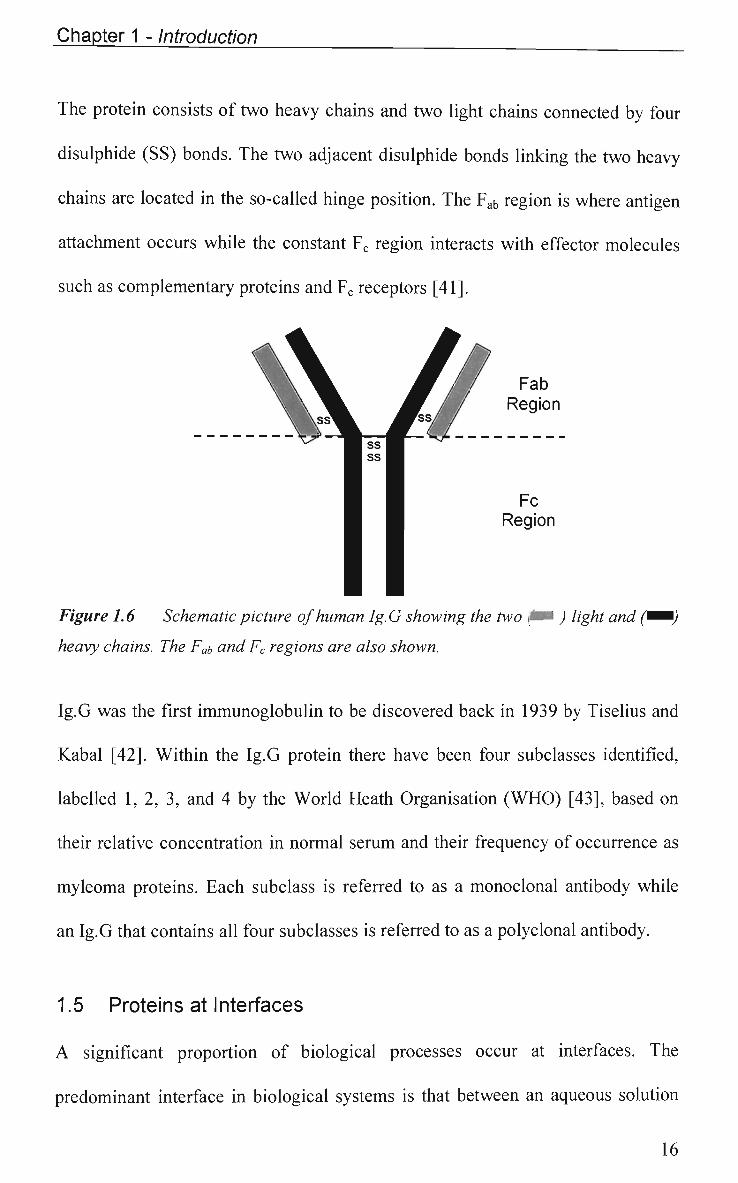
The protein consists of two heavy chains and two light chains connected by four
disulphide (SS) bonds. The two adjacent disulphide bonds linking the two heavy
chains are located in the so-called hinge position. The Fab region is where antigen
attachment occurs while the constant Fc region interacts with effector molecules
such as complementary proteins and Fc receptors [41].
Fab Region
Fc Region
Figure 1.6 Schematic picture of human Ig.G showing the two p& ) light and (*••)
heavy chains. The Fab and Fc regions are also shown.
Ig.G was the first immunoglobulin to be discovered back in 1939 by Tiselius and
Kabal [42]. Within the Ig.G protein there have been four subclasses identified,
labelled 1, 2, 3, and 4 by the World Heath Organisation (WHO) [43], based on
their relative concentration in normal serum and their frequency of occurrence as
myleoma proteins. Each subclass is referred to as a monoclonal antibody while
an Ig.G that contains all four subclasses is referred to as a polyclonal antibody.
1.5 Proteins at Interfaces
A significant proportion of biological processes occur at interfaces. The
predominant interface in biological systems is that between an aqueous solution
16
Chapter 1 - Introduction
and a cell membrane. Adsorption/desorption processes and surface reactions take
place at this surface [44]. Interfacial electrochemical processes take place on
both, electrode surfaces and, between redox systems on the two sides of a phase
boundary. Given the fraction of biological processes which proceed at interfaces,
it is desirable to gain an adequate understanding of basic interfacial science,
including adsorption and interfacial electrochemical processes.
The study of the adsorption of proteins at solid surfaces has attracted a great deal
of interest in the last few decades with notable reviews by Haynes and Norde
[45-48], MacRitchie [49] and Andrade and Hlady [50]. Often, this interest
originates from the importance of the interfacial behaviour of proteins in a
variety of applications in medicine, biotechnology, diagnostics, and food
technology [51]. For example, medical scientists, pathologists and biomedical
engineers have determined that thrombosis development on cardiovascular
implant materials is intimately related to protein adsorption processes involving
fibrinogen, Factor 11 and Factor 12, high molecular weight kininogen, and
possibly a number of other plasma proteins [52-54]. This undesirable medical
effect is contrary to recent applications of controlled protein adsorption in the
development of drug delivery systems [55].
An important result of these rich and diverse research efforts has been the steady
accumulation of new experimental and theoretical strategies for studying protein
adsorption [45]. Of primary interest is the kinetics of adsorption, adsorbed
amount, conformation of adsorbed protein and activity of the adsorbed protein.
17
Chapter 1 - Introduction
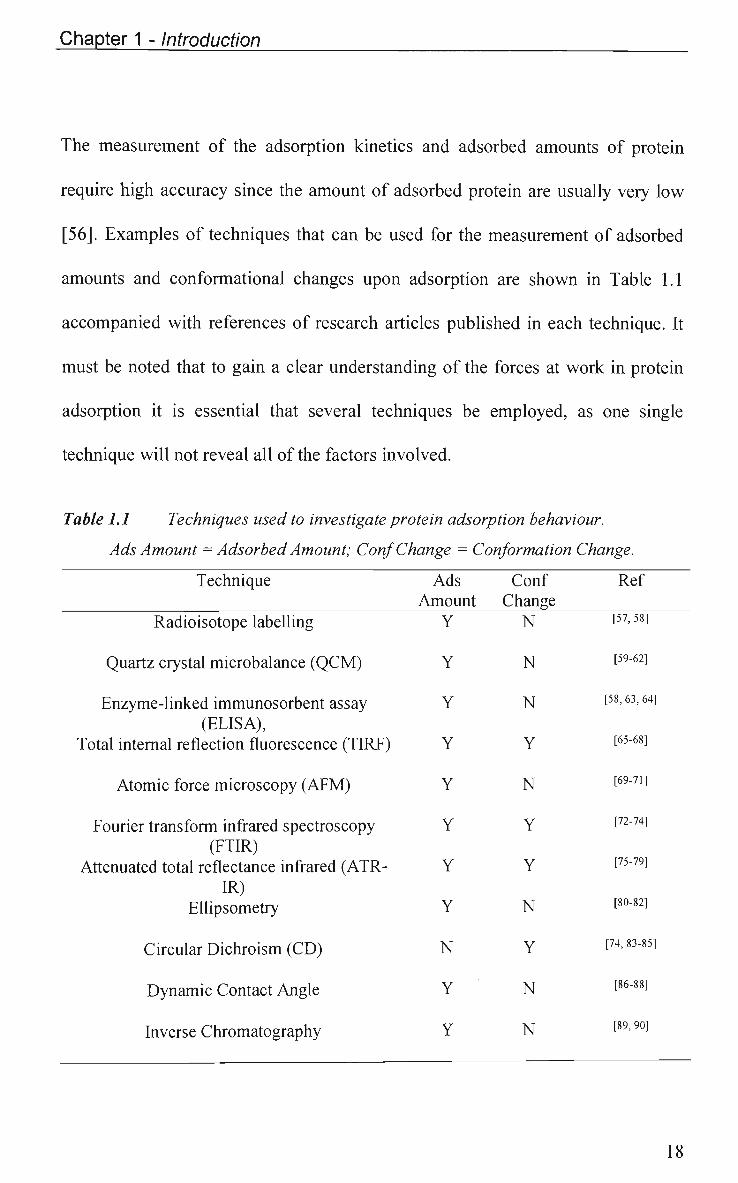
The measurement of the adsorption kinetics and adsorbed amounts of protein
require high accuracy since the amount of adsorbed protein are usually very low
[56]. Examples of techniques that can be used for the measurement of adsorbed
amounts and conformational changes upon adsorption are shown in Table 1.1
accompanied with references of research articles published in each technique. It
must be noted that to gain a clear understanding of the forces at work in protein
adsorption it is essential that several techniques be employed, as one single
technique will not reveal all of the factors involved.
Table 1.1 Techniques used to investigate protein adsorption behaviour.
Ads Amount — Adsorbed Amount; Conf Change = Conformation Change.
Technique
Radioisotope labelling
Quartz crystal microbalance (QCM)
Enzyme-linked immunosorbent assay (ELISA),
Total internal reflection fluorescence (TIRF)
Atomic force microscopy (AFM)
Fourier transform infrared spectroscopy (FTIR)
Attenuated total reflectance infrared (ATR-IR)
Ellipsometry
Circular Dichroism (CD)
Dynamic Contact Angle
Inverse Chromatography
Ads Amount
Y
Y
Y
Y
Y
Y
Y
Y
N
Y
Y
Conf Change
N
N
N
Y
N
Y
Y
N
Y
N
N
Ref
[57, 58]
[59-62]
[58, 63, 64]
[65-68]
[69-71]
[72-74]
[75-79]
[80-82]
[74, 83-85]
[86-88]
[89, 90]
18
Chapter 1 - Introduction
The way in which the protein interacts with the solid surface is dependent on
many factors, such as, protein net charge, the charge on the substrate, protein size
and the occurrence of hydrophobic domains in the protein surface to mention a
few. However there are few general rules as to the effects of surface charge,
hydrophobicity, etc., on protein adsorption [56, 91-96].
1.5.1 Influence of Charge
In terms of their electrostatic properties, solid substrates can be categorized as (1)
uncharged surfaces, (2) surfaces where the charge is determined by ions other
than protons, (3) surfaces that contain strongly acidic or basic groups, which
titrate at extreme pH values, or (4) surfaces with charged groups that protonate at
moderate pH values [45]. Surfaces (1) and (2) are ideal for protein adsorption
studies as the surface charge is not affected by the protein pH and therefore the
coulomb interactions on protein adsorption are less ambiguous.
Protein adsorption at a charged surface involves the overlap of the electrical
double layer at the solvated surface and the solvated protein surface [45]. It has
already been mentioned that by varying the protein pH it is possible to vary the
overall protein net charge. If these two surfaces have opposite charges then
electrostatic attraction results or repulsion if the charges are the same. This was
clearly demonstrated by Norde and coworkers [45, 46, 97] who presented
isotherms showing the adsorption of several proteins at pH = 7.0 onto negatively
and positively charged polystyrene beads. In general, the results showed that for
those proteins carrying a negative charge maximum adsorption was observed on
19
Chapter 1 - Introduction
the positively charge polystyrene and vice versa for the positively charged
proteins. This suggests that electrostatic interactions are the driving force behind
adsorption, however, some results in the above study did not agree with this trend
indicating that while global electrostatic forces undoubtedly affect adsorption,
they do not dominate them.
1.5.2 Hydrophobicity
As mentioned above protein surface hydrophobicity is influential in protein
adsorption. With respect to hydrophobicity the state of the substrate and protein
must be taken into account. Due to the complex nature of proteins it is not
possible to simply label one protein hydrophobic and another hydrophilic. The
true picture of a protein is one with regions of hydrophobicity and regions of
hydrophilicity dispersed throughout the surface, this is also true for most solid
surfaces.
Most proteins tend to adsorb more extensively at hydrophobic than hydrophilic
surfaces [45, 98]. Malmsten [99] was able to show using protein-protein
exchange experiments that more limited exchange occurred at hydrophobic
surfaces than at hydrophilic surfaces, which suggests that, proteins tend to adsorb
more strongly at hydrophobic surfaces. These effects are most likely the result of
differences in conformation of the adsorbed protein at the respective surface.
Regnier [100] and Gorbunov [101] et al have provided an excellent review on the
effect of protein hydrophobicity on adsorption using studies related to
20
Chapter 1 - Introduction
hydrophobic interaction chromatography, van Oss [102] used contact angle
measurements to show a strong correlation between protein surface
hydrophobicity and the driving force for adsorption. Haynes and Norde
suggested that an alternative approach to understanding the influence of protein
surface hydrophobicity on adsorption behaviour was to correlate surface
hydrophobicity with adsorbed amounts (isotherm plateau values - Tp ). When this
was done for several similar sized proteins on negatively charged polystyrene
(PS) the Tpl increased with increasing surface hydrophobicity, suggesting that the
driving force is related to the protein surface hydrophobicity. Unfortunately one
protein (a-lactalbumin) deviated greatly from the correlation, indicating that
another factor governs its adsorption behavior on PS. oc-Lactalbumin has low
structural stability compared to the other protein used in the study [45], therefore
structural rearrangement may dominate its adsorption behavior.
1.5.3 Influence of Protein Structural Stability
The stability of proteins in an aqueous environment varies from protein to
protein. Globular proteins in an aqueous environment for example can be
denatured by a modest change in environment, such as an increase in
temperature, change in solution pH or the introduction of a foreign surface or
interface. Conformational stability is important for determining the state of
adsorption of a protein, and notably the adsorbed layer structure and adsorption
strength; however, the stability of a protein may also affect the extent of
adsorption [96].
21
Chapter 1 - Introduction
In the native state the protein conformation is quite restricted, and hence the
conformational entropy is low. When proteins undergo denaturing upon
adsorption, its conformation changes and frequently loses a fraction of their
overall structure (e.g., the content of the a-helix and P-sheet decreases).
Therefore, the adsorption process may be associated with a conformational
entropy gain, which in principle can act as an adsorption driving force [45, 98].
Proteins with low internal stability such as a-lactalbumin, P-casein, hemoglobin
and catalase generally tend to adsorb on all surfaces irrespective of the
electrostatic interactions, owing to a gain in conformational entropy resulting
from adsorption [103, 104]. Upon adsorption on hydrophobic surfaces, these
proteins change their conformation to a great extent.
Vroman was one of the first to recognize that proteins denature at solid surfaces.
He stated [105] that "those (globular proteins) which can open easily will do so
when they see a hydrophobic surface, and will turn themselves inside out to paste
their fatty hearts onto that surface". Carrying on from Vroman's earlier
observation many researchers have studied the denaturing process of proteins
upon adsorption. Norde [46] performed extensive thermodynamic studies on the
adsorption of HSA and bovine pancreas ribonuclease on polystyrene surfaces to
confirm Vroman's hypothesis. Norde and Favier [106] were able to show, using
transmission circular dichroism, that the extent of a-helix breakdown increases
as the protein native structure stability decreased. Furthermore Buijs [107] et al
used ATR-FTIR to show that the adsorbed amounts of Ig.G decreased as the p-
22
Chapter 1 - Introduction
sheet content was reduced upon adsorption. This reduction in p-sheet content was
attributed to a slow conformational change upon adsorption. However, not all
proteins that adsorbed undergo conformation changes, which leads to the
conclusion that while protein structural rearrangement contributes to protein
adsorption, it is not the sole contributor.
It is clear that the driving force for protein adsorption is very complex involving
contributions from hydrophobic interactions, electrostatic interactions between
oppositely charged surfaces, proteins or protein domains and conformational
change of the adsorbed protein to name a few.
Much of the work performed in the area of protein interfacial behaviour has been
concerned with adsorption trends and the effect various conditions have on these
trends. Due to the complex nature of even the simplest proteins, investigation
into the mechanism of protein binding (i.e., binding site chemistry) has been
difficult. A way in which many researchers overcome this difficulty is to look at
the binding mechanism of simpler amino acids and some small peptides. The
amino acid compositions and/or sequences of the peptide regions might be
determinant for the adsorption behaviour of proteins on solid surfaces [56].
The adsorption of peptides on solid surfaces has been investigated in connection
with the formation mechanism of various solid surfaces. The in-situ infrared
spectroscopic investigation of the adsorption of lysine and polylysine to Ti02
performed by Roddick-Lanzilotta and McQuillan [78] found that the carboxylate
23
Chapter 1 - Introduction
group was involved in the peptide/Ti02 interaction. Recently efforts have been
made to screen peptides that have a high affinity to solid surfaces. The chemical
structures of such peptides provide fundamental information on the adsorption
mechanism of peptides and proteins. One way of doing this is to synthesise
various peptides with different amino acid sequences to compare their adsorption
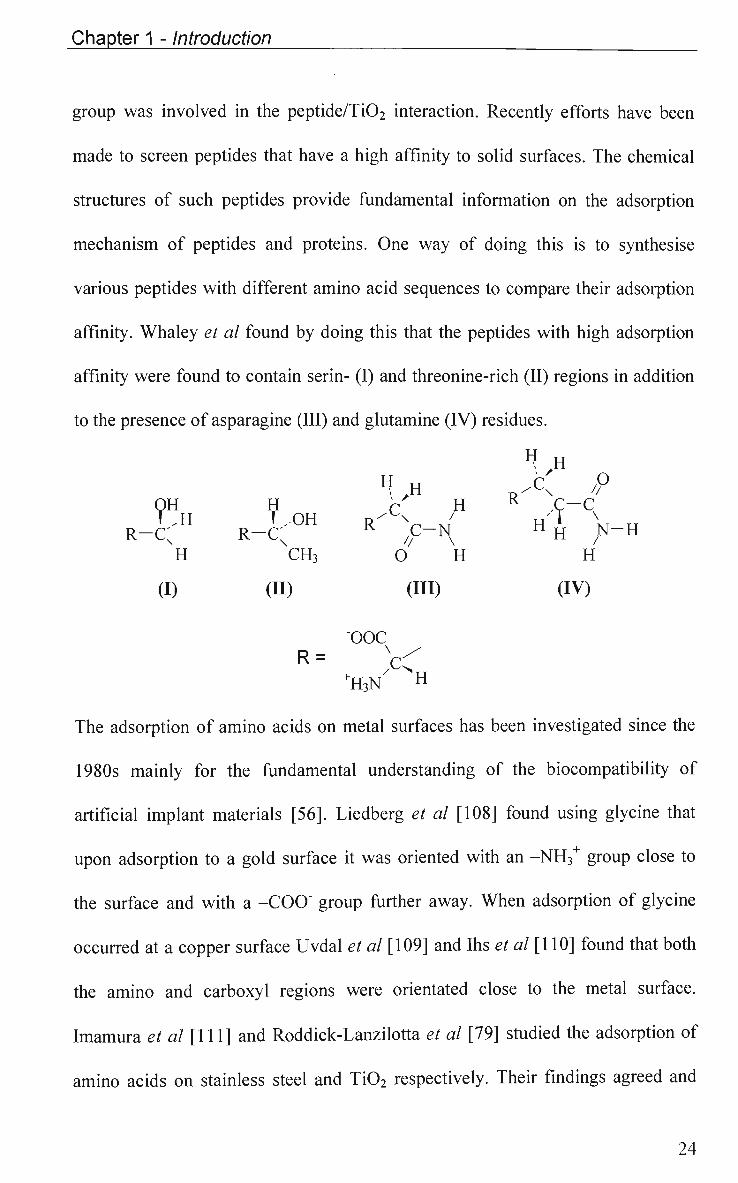
affinity. Whaley et al found by doing this that the peptides with high adsorption
affinity were found to contain serin- (I) and threonine-rich (II) regions in addition
to the presence of asparagine (III) and glutamine (IV) residues.
OH H c H R ,C—C
T.H f ,.OH R-" V J H* \T T_r
R-C; R-C; K f~*\ n
H N-H H CH3 O H H (I) (H) (HI) (IV)
OOC
R= Xc^ +H3N
X "H
The adsorption of amino acids on metal surfaces has been investigated since the
1980s mainly for the fundamental understanding of the biocompatibility of
artificial implant materials [56]. Liedberg et al [108] found using glycine that
upon adsorption to a gold surface it was oriented with an -NH3+ group close to
the surface and with a -COO" group further away. When adsorption of glycine
occurred at a copper surface Uvdal et al [109] and Ihs et al [110] found that both
the amino and carboxyl regions were orientated close to the metal surface.
Imamura et al [111] and Roddick-Lanzilotta et al [79] studied the adsorption of
amino acids on stainless steel and Ti02 respectively. Their findings agreed and
24
Chapter 1 - Introduction
showed that adsorption occurred by the interaction between two dissociated
carboxyl groups and the surface metal ions.
While investigation of the adsorption mechanisms for amino acids and peptide
goes a long way towards elucidation of protein adsorption mechanisms, the
amount of published results is rather limited and further work is required in this
area to aid in understanding and controlling adsorption of proteins.
1.5.4 Protein Adsorption and Electrochemistry
Protein adsorption and electrochemistry has long been associated with the
development of biosensors. The most famous of these being the glucose
biosensor developed from pioneering work by Clarke and Lyons some 40 years
ago for the treatment of diabetes [112]. The deliberate entrapment of DNA,
RNA and oligonucleotides has also been performed for the development of a
polypyrrole based electrochemical biosensor [113]. In more recent times
electrochemistry has been the technique of choice for many researchers
investigating protein adsorption trends. Many studies have provided a valuable
insight into the effects that protein adsorption has on electrochemical responses
of various electrode material.
Electrochemical methods are frequently applied for analysis of inorganic
substances such as electroactive metallic ions and low weight organic and
organometallic compounds [95]. The sensitivity of these methods for a substance
depends on the possibility of electron transfer between the electrode and the
25
Chapter 1 - Introduction
substance. The possibility of electron transfer depends on both the material and
potential of the electrode and on the character of the substance. Interpretation of
electrochemical data from proteins is very complex due to the mobility of the
electroactive group in a protein being hindered by its bonds to the surrounding
organic framework. Electron transfer reactions may occur at an electrode in a
protein solution if electroactive groups are present within the protein moiety and
if these groups lie close enough to the electrode surface for a charge transfer [95].
Electrochemical methods reveal charge transfer processes occurring within a
very narrow zone close to the electrode surface, the electrode/electrolyte
interface. Experimentally, this interface region has been shown to behave similar
to a capacitor, which implies a charge separation at the electrode/electrolyte
interface. The most accepted model for this charge distribution is a double layer
structure [114], which is described in Figure 1.7. This double layer structure
suggests three ionic zones to be formed on the solution side as a compensation
for the excess of charge, of either positive or negative sign, within the electrode.
The layer of ions closest to the electrode surface is called the inner Helmholtz
layer and contains water molecules and specifically adsorbed ions that are not
strongly hydrated. The plane passing through the centers of these ions is called
the inner Helmholtz plane (IHP). Fully solvated ions, referred to as
nonspecifically adsorbed ions, are separated from the IHP with the locus of
centers of the nearest solvated ions in the outer Helmholtz plane (OHP). The
forces binding the ions in the IFIP depends on the nature of the ions as well as the
26
Chapter 1 - Introduction
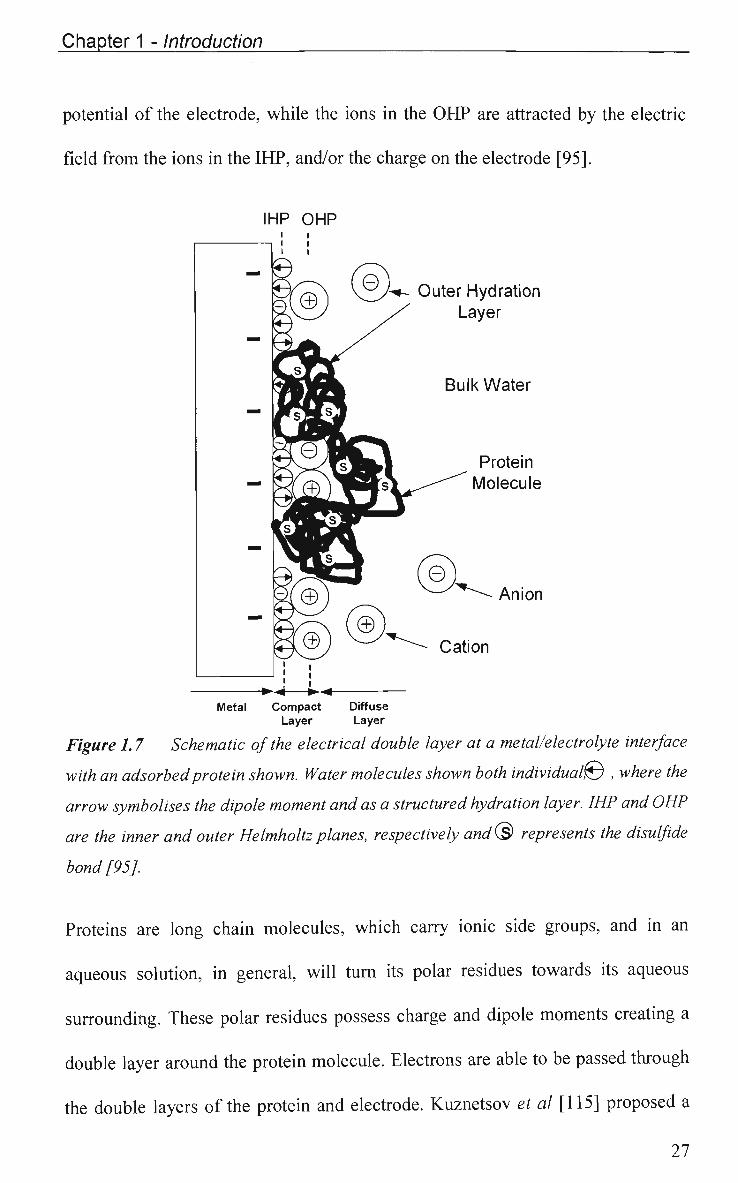
potential of the electrode, while the ions in the OFTJP are attracted by the electric
field from the ions in the IHP, and/or the charge on the electrode [95].
IHP O H P
Outer Hydration Layer
Bulk Water
Protein Molecule
Anion
Cation
-**M *-# Metal Compact Diffuse
Layer Layer
Figure 1.7 Schematic of the electrical double layer at a metal/electrolyte interface
with an adsorbed protein shown. Water molecules shown both individual^) , where the
arrow symbolises the dipole moment and as a structured hydration layer. IHP and OHP
are the inner and outer Helmholtz planes, respectively and® represents the disulfide
bond [95].
Proteins are long chain molecules, which carry ionic side groups, and in an
aqueous solution, in general, will turn its polar residues towards its aqueous
surrounding. These polar residues possess charge and dipole moments creating a
double layer around the protein molecule. Electrons are able to be passed through
the double layers of the protein and electrode. Kuznetsov et al [115] proposed a
27
Chapter 1 - Introduction
model where electron transfer between an electroactive group of a protein and a
metal electrode calls for an overlap of the double layers at the protein molecule
and electrode surface, respectively, and that the electroactive group is present in
the overlap region. Therefore, based on this model, the compact double layer
zone is the sensitive zone for electrode processes in voltammetry.
However, the interaction of so called non-electroactive proteins at interfaces can
also be studied using electrochemical techniques. It is possible to study electron
transfer properties of a protein solution that contain electroactive species such as
potassium ferricyanide that are not attached to the protein molecule. It is also
possible to apply a polarizing potential to an electrode in a non-electroactive
protein solution to induce electron transfer through the formation of reduction
processes, such as the reduction of dissolved oxygen or water.
Phillips et al [116] used electrochemical techniques, namely electrochemical
impedance spectroscopy (EIS) and cyclic voltammetry (CV) to study the
adsorption of yeast alcohol dehydrogenase at a platinum electrode. They found
that the surface charge density and corresponding polarisation resistance,
resulting from protein adsorption and its oxidation, respectively, are directly
proportional to the amount of adsorbed protein, indicating that the adsorption at
anodic potential is accompanied by the transfer of charge, that is, chemisorption
through carboxylate groups on the protein. Omanovic et al [117] found, using
electrochemical impedance spectroscopy, that the adsorption of bovine serum
albumin on stainless steel increased the dissolution rate of the metal. The
28
Chapter 1 - Introduction
adsorption of the amino acids, serin (Ser), tyrosine (Tyr) and histidine (His) was
studied by Slojkowska et al [118] using EIS with the results indicating that
adsorption of amino acids on the gold electrode decrease in order, Tyr > His >
Ser.
Roscoe et al have used various electrochemical techniques, such as cyclic
voltammetry and electrochemical impedance spectroscopy, to study the
interfacial behavior of proteins such as p-lactalbumin [119-121], a-lactalbumin
[122], ribonuclease [119, 120], lysozyme [119, 120], BSA [122], and
hemoglobin [123] at a platinum surface. Oliva et al [124] used electrochemical
impedance spectroscopy to study the interaction of HSA at a Ti02
nanocrystalline electrode, while Jackson et al [125] studied the adsorption
behavior of fibrinogen, a fibrous protein, at a commercially pure titanium
surface.
The studies listed above were able to show trends in adsorbed amounts of each
protein as well as the extent of protein denaturing upon adsorption, with their
results agreeing very well with those obtained by others using non-
electrochemical techniques. The above studies were also used to elucidate the
changes in the electrochemical properties of the electrode due to adsorbed
protein. In all cases it was found, that upon adsorption of protein, the electron
transfer rates occurring between the electrode surface and electrolyte are severely
hindered. This effect was also clearly demonstrated by the work performed by
Guo et al [126] using cyclic voltammetry at a gold disc, platinum and glassy
29
Chapter 1 - Introduction
carbon electrode in potassium ferricyanide before and after adsorption of serum
albumin. They found that as protein was adsorbed, the formation of the inert
protein layer caused a decrease in anodic peak current and an associated
oxidation/reduction potential shift resulting in a decrease in the electron transfer
in the redox reaction of Fe(CN)647Fe(CN)6
3" ions at the electrode surface.
1.6 Aims of this Work
TruScan™ identifies cancerous tissue in the cervix by detecting variations in
electrical signals, in particular capacitance, generated in cervical tissue as a result
of external electrical stimulation. It is therefore critical to elucidate any effect
biofouling (protein adsorption) has on the TruScan™ probe electrodes sensitivity
in detecting these signal variations. The main aim of this work was to investigate
the electrochemical behaviour of metal electrodes in biological solutions using a
variety of experimental techniques. Two metal electrodes were used, namely,
gold and titanium dioxide, while the proteins used were human serum albumin
and immunoglobulin G.
This main aim was further divided into two areas with the first one being to
monitor the adsorption trends of two proteins at metal electrodes under various
experimental conditions. Protein adsorption trends were studied from buffered
solutions of various pH using non-electrochemical techniques such as quartz
crystal microbalance, radiolabelling and attenuated total internal infrared
spectroscopy. The effect of electrode potential on the adsorption trends was also
investigated.
30
Chapter 1 - Introduction
The second area involved the investigation of the effects the adsorbed protein
had on the electrochemical behaviour of the metal electrodes. Electrochemical
responses were studied at various electrode potentials using the electrochemical
techniques cyclic voltammetry and electrochemical impedance spectroscopy.
Since TruScan initially was manufactured using gold (Au) as the electrode
material followed by the use of titanium dioxide (Ti02), these two metals were
used as the test electrode material for all of the work presented in this thesis. Two
model proteins were used to foul the electrode surface, namely human serum
albumin (HSA) and immunoglobulin G (Ig.G). These proteins were chosen since
HSA is a protein which has been well characterised over the years and is a
common protein used in these types of experiments. Ig.G was chosen as this
antibody is found in cervical mucus which covers the cervix and is therefore
expected to play a role in the fouling of TruScan™ during operation.
31
Chapter 1 - Introduction
References
1. V. Skladnev, in Polartecnics Ltd Corporate Report, from Polartechnics
Ltd, Sydney, (2001)
2. A. Deans, The Bulletin, Cancer Catchers, October 11 (2001)
3. M. Coppleson, K. Canfell, V. Skladnev, S.C. Quek, T. Mould and A.
Snger, Annals Academy of Medicine, 27 111 (1998)
4. H. Fricke and S. Morse, Journal of Cancer Research, 10 340 (1926)
5. L. Langman and H. Burr, American Journal of Obstetrics and
Gynecology, 57 274 (1949)
6. A. Wieckowski, in Interfacial Electrochemistry: Therory, Experimental,
and Applications, Vol. (ed. A. Wieckowski), Marcel Dekker, Inc, New
York, (1999)
7. R.N. Adams, in Electrochemistry at Solid Electrodes, Vol. 1, (ed. AJ.
Bard), Marcel Dekker, Inc, New York, (1969)
8. F. Bauman and I. Shain, Analytical Chemistry, 29 303 (1957)
9. Y. Fung and Y. Wong, Analytical Chemistry, 73 5302 (2001)
10. N.K. Chaki and K. Vijayamohanan, Biosensors and Bioelectronics, 17 1
(2002)
11. K.V. Gobi and F. Mizutani, Sensors & Actuators B-Chemical, 80 272
(2001)
12. C. Berggren, B. Bjarnason and G. Johansson, Electroanalysis, 13 173
(2001)
32
Chapter 1 - Introduction
13. M. Kudera, A. Aitken, L. Jiang, S. Kaneko, H.A.O. Hill, P.J. Dobson,
P.A. Leigh and W. Mclntire, Journal of Electroanalytical Chemistry, 495
36 (2000)
14. D.H. Murgida and P. Hildebrandt, Journal of the American Chemical
Society, 123 4062 (2001)
15. M. Bisenberger, C. Brauchle and N. Hampp, Sensors & Actuators B-
Chemical, 28 181 (1995)
16. E. Casero, M. Darder, K. Takada, H.D. Abruna, F. Pariente and E.
Lorenzo, Langmuir, 15 127 (1999)
17. M. Niwa, T. Murata, M. Kitamastu, T. Matsumoto and N. Higashi,
Journal of Materials Chemistry, 9 343 (1999)
18. A. Fujishima and K. Honda, Bulletin. Chemical Society of Japan, 44 1148
(1971)
19. A. Fujishima and K. Honda, Nature, 238 37 (1972)
20. H.O. Finklea, in Studies in Physical and Theoretical Chemistry -
Semiconductor Electrodes, Vol. 55, (ed. H.O. Finklea), Elsevier Science,
New York, (1988)
21. G. Nogami and Y. Ogawa, Journal of the Electrochemical Society:
ELECTROCHEMICAL SCIENCE AND TECHNOLOGY, 135 3008 (1988)
22. Y. Matsumoto, A. Funatsu, D. Matsuo and U. Unal, Journal of Physical
Chemistry B, 105 10893 (2001)
23. M. Dolata, P. Kedzierzawski and J. Augstynski, Electrochimica Acta, 41
1287 (1996)
33
Chapter 1 - Introduction
24. H. Morisaki and K. Yazawa, Applied Physics Letter, 33 1013 (1978)
25. R. Noufi, P. Kohl, S. Frank and A.J. Bard, Journal of the Electrochemical
Society, 125 246 (1978)
26. P. Boddy, Journal of the Electrochemical Society, 115 199 (1968)
27. T. Hepel, M. Hepel and R. Osteryoung, Journal of the Electrochemical
Society, 129 2132(1982)
28. M. Weber, L. Schumacher and M. Dignam, Journal of the
Electrochemical Society, 129 2022 (1982)
29. M.M. Kasi, F. Mahrukh, S.M. Baloch, N.H. Shah, A.H. Kahn, Z.
Mahmood, K. Mehmood and N. Ud-bin, Journal of the Chemical Society
of Pakistan, 19 153 (1997)
30. I.K. Gipson, S. Spurr-Michaud, R. Moccia, Q. Zhan, N. Toribara, S.B. Ho,
A.R. Gargiulo and J.A. Hill, Biology of Reproduction, 60 58 (1999)
31. D.E. Metzler, in BIOCHEMISTRY - The Chemical Reactions of Living
Cells, Vol. 1, (ed. D.E. Metzler), Hardcourt Academic Press, New York,
(2001)
32. E. Margoliash and H.R. Bosshard, Trends in Biochemical Science, 8 316
(1983)
33. E. Poerio, G.R. Parr and H. Taniuchi, Journal of Biological Chemistry,
261 10976 (1986)
34. M.P. Scott and J. Biggins, Protein Science, 6 340 (1997)
35. T.C. Bruice and R. Maskiewicz, Procedings of the National Acadey of
Science - USA, 72 231 (197'5)
34
Chapter 1 - Introduction
36. T. Peters, in Advances in Protein Chemistry, Vol. 37, (ed. T. Peters),
Academic Press, New York, (1985)
37. S. Michael, Biochemical Journal, 82 212 (1962)
38. T. Iwata, H. Iwata and J. Holland, Clinical Chemistry, 14 22 (1968)
39. H.L. Spiegelberg, Advanced Immunology, 19 259 (1974)
40. R. Hidalgo-Alvarez and F. Galisteo-Gonzalez, Heterogeneous Chemistry
Reviews, 2 249 (1995)
41. M. Raghavan and P. J. Bj orkman, Annual Review of Cell and Development
Biology, 12 181 (1996)
42. C. Black, Immunology and Cell Biology, 75 65 (1997)
43. R.G. Hamilton, in The Human Ig.G Subclasses, Vol. (ed. C. Mohan),
Calbiochem-Novabiochem Corporation Technical Notes, (1996)
44. I. Miller, in Adsorption and Surface Reactions, Vol. 1, (ed. S. Caplan, I.
Miller, and G. Milazzo), Birkhauser Verlag, Basel, Switzerland, (1995)
45. CA. Haynes and W. Norde, Colloids and Surfaces B: Biointerfaces, 2 517
(1994)
46. W. Norde, Thesis: from Wageningen Agricltural University, Chemistry,
Wageningen, (1976)
47. W. Norde and J. Lyklema, Journal of Colloid and Interface Science, 66
295 (1978)
48. W. Norde, in Polymer Science and Technology, Vol. 12B, (ed. L. Lee),
Plenum Press, New York, (1980)
49. F. MacRitchie, Advanced Protein Chemistry, 32 283 (1978)
35
Chapter 1 - Introduction
50. J.D. Andrade and V. Hlady, Advanced Polymer Science, 79 1 (1986)
51. M. Malmsten, Journal of Colloid and Interface Science, 166 333 (1994)
52. G.M. Willems, W.R.M. Hermans and H.C. Hemker, Journal of
BiomaterialScience, 2217(1991)
53. L. Vroman and E.F. Leonard, Biofouling, 4 81 (1991)
54. P.M. Wojciechowski and J.L. Brash, Journal of Biomaterial Science, 2
203 (1991)
55. Y. Bae, T. Okano and S. Kim, Journal of Polymer Science; Polymer
Physics Edition, 28 923 (1990)
56. K. Nakanishi, T. Sakiyama and K. Imamura, Journal of Bioscience and
Bioengineering, 91 233 (2001)
57. R.M. Cornelius and J.L. Brash, Biomaterials, 20 341 (1999)
58. W.Y.J. Kao, Biomaterials, 21 2295 (2000)
59. K. Glasmastar, C. Larsson, F. Hook and B. Kasemo, Journal of Colloid
and Interface Science, 246 40 (2002)
60. Y.C. Liu, CM. Wang and K.P. Hsiung, Analytical Biochemistry, 299 130
(2001)
61. M. Tanaka, A. Mochizuki, T. Motomura, K. Shimura, M. Onishi and Y.
Okahata, Colloids and Surfaces A- Physicochemical & Engineering
Aspects, 193 145 (2001)
62. B.S. Murray and C. Deshaires, Journal of Colloid and Interface Science,
227 32 (2000)
63. N. Weber, H.P. Wendel and G. Ziemer, Biomaterials, 23 429 (2002)
36
Chapter 1 - Introduction
64. U. Fagiolo, F. Kricek, C. Ruf, A. Peserico, A. Amadori and M. Cancian,
Journal of Allergy & Clinical Immunology, 106 567 (2000)
65. CF. Wertz and M.M. Santore, Langmuir, 18 1190 (2002)
66. V. Hlady and C.H. Ho, Materialwissenschaft und Werkstofftechnik, 32
185 (2001)
67. S. Petrash, T. Cregger, B. Zhao, E. Pokidysheva, M.D. Foster, W.J.
Brittain, V. Sevastianov and CF. Majkrzak, Langmuir, 17 7645 (2001)
68. H.P. Jennissen, A. Sanders, H.J. Schnittler and V. Hlady,
Materialwissenschaft und Werkstofftechnik, 30 850 (1999)
69. P. Cacciafesta, A.D.L. Humphris, A.C Watkinson, K.D. Jandt and MJ.
Miles, Langmuir, 16 8167 (2000)
70. P. Cacciafesta, K.R. Hallam, A.C. Watkinson, G.C Allen, M.J. Miles and
K.D. Jandt, Surface Science, 491 405 (2001)
71. M.A. Childs, D.D. Matlock, J.R. Dorgan and T.R. Ohno,
Biomacromolecules, 2 526 (2001)
72. V.A. Tegoulia, W.S. Rao, A.T. Kalambur, J.R. Rabolt and S.L. Cooper,
Langmuir, 17 4396(2001)
73. S. Lecomte, C. Hilleriteau, J.P. Forgerit, M. Revault, M.H. Baron, P.
Hildebrandt and T. Soulimane, Chembiochem, 2 180 (2001)
74. L.M. Gordon, P.W. Mobley, R. Pilpa, M.A. Sherman and A.J. Waring,
Biochimica et Biophysica Acta- Biomembranes, 1559 96 (2002)
75. K.D. Dobson, A.D. Roddick-Lanzilotta and A.J. McQuillan, Vibrational
Spectroscopy, 24 287 (2000)
37
Chapter 1 - Introduction
76. A.J. McQuillan, Advanced Materials, 13 1034 (2001)
77. A.D. Roddick-Lanzilotta and A.J. McQuillan, Langmuir, 14 6479 (1998)
78. A.D. Roddick-Lanzilotta and A.J. McQuillan, Journal of Colloid and
Interface Science, 217 194 (1999)
79. A.D. Roddick-Lanzilotta and A.J. McQuillan, Journal of Colloid and
Interface Science, 227 48 (2000)
80. CS. Giannoulis and T.A. Desai, Journal of Materials Science-Materials
in Medicine, 13 75 (2002)
81. J. Benesch, S. Svedhem, S.C.T. Svensson, R. Valiokas, B. Liedberg and P.
Tengvall, Journal of Biomaterials Science, Polymer Edition, 12 581
(2001)
82. P. Tengvall and A. Askendal, Journal of Biomedical Materials Research,
57 285 (2001)
83. S. Gorinstein, A. Caspi, A. Rosen, I. Goshev, M. Zemser, M. Weisz, M.C.
Anon, I. Libman, H.T. Lerner and S. Trakhtenberg, Journal of Peptide
Research, 59 71 (2002)
84. R. Grandori, I. Matecko and N. Muller, Journal of Mass Spectrometry, 37
191 (2002)
85. Y. Cordeiro, F. Machado, L. Juliano, M.A. Juliano, R.R. Brentani, D.
Foguel and J.L. Silva, Journal of Biological Chemistry, 276 49400 (2001)
86. B. Muller, M. Riedel, R. Michel, S.M. De Paul, R. Hofer, D. Heger and D.
Grutzmacher, Journal of Vacuum Science & Technology B, 19 1715
(2001)
38
Chapter 1 - Introduction
87. K. Grundke, C. Werner, K. Poschel and H.J. Jacobasch, Colloids &
Surfaces A-Physicochemical & Engineering Aspects, 156 19(1999)
88. A.P.V.A. do Serro, A.C. Femandes, B.D.V. Saramago and W. Norde,
Journal of Biomedical Materials Research, 46 376 (1999)
89. K. Saito, Separation Science & Technology, 37 535 (2002)
90. H. Ge, K.G. Gilmore and G.G. Wallace, Journal of Liquid
Chromatography, 17 1301 (1994)
91. B. Lassen and M. Malmsten, Journal of Colloid and Interface Science,
180 339 (1996)
92. S. Fukuzaki, H. Urano and K. Nagata, Journal of Fermentation and
Bioengineering, 81 163 (1995)
93. L. Feng and J.D. Andrade, Journal of Colloid and Interface Science, 166
419(1994)
94. J.J. Ramsden, Quarterly Reviews of Biophysics, 27 41 (1993)
95. B. Ivarsson and I. Lundstrom, CRC Critical Reviews in Biocompatibility,
2 1 (1986)
96. M. Malmsten, Journal of Colloid and Interface Science, 207 186 (1998)
97. T. Arai and W. Norde, Colloids Surfaces, 51 1 (1990)
98. W. Norde, Advance Colloid Interface Science, 25 267 (1986)
99. M. Malmsten and B. Lassen, Colloids and Surfaces B: Biointerfaces, 4
173 (1995)
100. F. Regnier, Science, 328 319 (1987)
101. A. Gorbunov, Journal of Chromatography, 365 205 (1986)
39
Chapter 1 - Introduction
102. C.J. van Oss, Biofouling, 4 25 (1991)
103. T. Sakiyama, K. Tanino, M. Urakawa, K. Imamura, T. Takahashi, T.
Nagai and K. Nakanishi, Journal of Bioscience and Bioengineering, 88
536 (1999)
104. M.A. Bos, Z. Shervani, A.C.I. Anusiem, M. Giesbers, W. Norde and J.M.
Kleijn, Colloids and Surfaces B -Biointerfaces, 3 91 (1994)
105. L. Vroman, in Blood, Vol. 1, (ed. L. Vroman), Washington, (1967)
106. W. Norde and J. Favier, Colloids Surfaces, 64 87 (1992)
107. J. Buijs, W. Norde and J.W. Lichtenbelt, Langmuir, 12 1605 (1996)
108. B. Liedberg, I. Lundstrom, C. Wu and W.R. Salaneck, Journal of Colloid
and Interface Science, 108 123 (1985)
109. K. Uvdal, P. Bodo, A. Ins, B. Liedberg and W. Slaneck, Journal of
Colloid and Interface Science, 140 207 (1990)
110. A. Ihs, B. Liedberg, K. Uvdal, P. Bodo and I. Lundstrom, Journal of
Colloid and Interface Science, 140 192(1990)
111. K. Imamura, T. Mimura, M. Okamoto, T. Sakiyama and K. Nakanishi,
Journal of Colloid and Interface Science, 229 237 (2000)
112. J. Wang, Electroanalysis, 13 983 (2001)
113. J. Wang, Analytical Chemistry, 71 4095 (1999)
114. J. Bockris and A. Reddy, in Modern Electrochemistry, Vol. 2, (ed. Plenum
Press, New York, (1998)
115. B.A. Kuznetsov, N.M. Mestechkina and G.P. Shumakovich,
Bioelectrochemistry and Bioengineering, 4 1 (1977)
40
Chapter 1 - Introduction
116. R.K.R. Phillips, S. Omanovic and S.G. Roscoe, Langmuir, 17 2471 (2001)
117. S. Omanovic and S.G. Roscoe, Langmuir, 8315 (1999)
118. R. Slojkowska and M. Jurkiewicz-Herbich, Colloids and Surfaces A:
Physicochemical and Engineering Aspects, 178 325 (2001)
119. S.G. Roscoe, in Modern Aspects of Electrochemistry, Vol. 29, (ed. J.O.M.
Bockris, B.E. Conway, and R.E. White), Plenum Press, New York, (1996)
120. S.G. Roscoe and K. Fuller, Journal of Colloid and Interface Science, 152
429 (1992)
121. S. Roscoe, G, K. Fuller and G. Robitaille, Journal of Colloid and
Interface Science, 160 243 (1993)
122. R. Rouhana, S.M. Budge, S.M. Macdonald and S.G. Roscoe, Food
Research International, 30 303 (1997)
123. K. Hanrahan, S.M. Macdonald and S.G. Roscoe, Electrochimica Acta, 41
2469(1996)
124. F.Y. Oliva, L.B. Avalle, V.A. Macagno and CP. De Pauli, Biophysical
Chemistry, 91 141 (2001)
125. D.R. Jackson, S. Omanovic and S.G. Roscoe, Langmuir, 16 5449 (2000)
126. B. Guo, J. Anzai and T. Osa, Chemical and Pharmaceutical Bulletin, 44
800 (1996)
41
Chapter 2 - Experimental Techniques and Procedures
Chapter 2
Experimental Techniques and Procedures
42
Chapter 2 - Experimental Techniques and Procedures
2.1 Quartz Crystal Microbalance
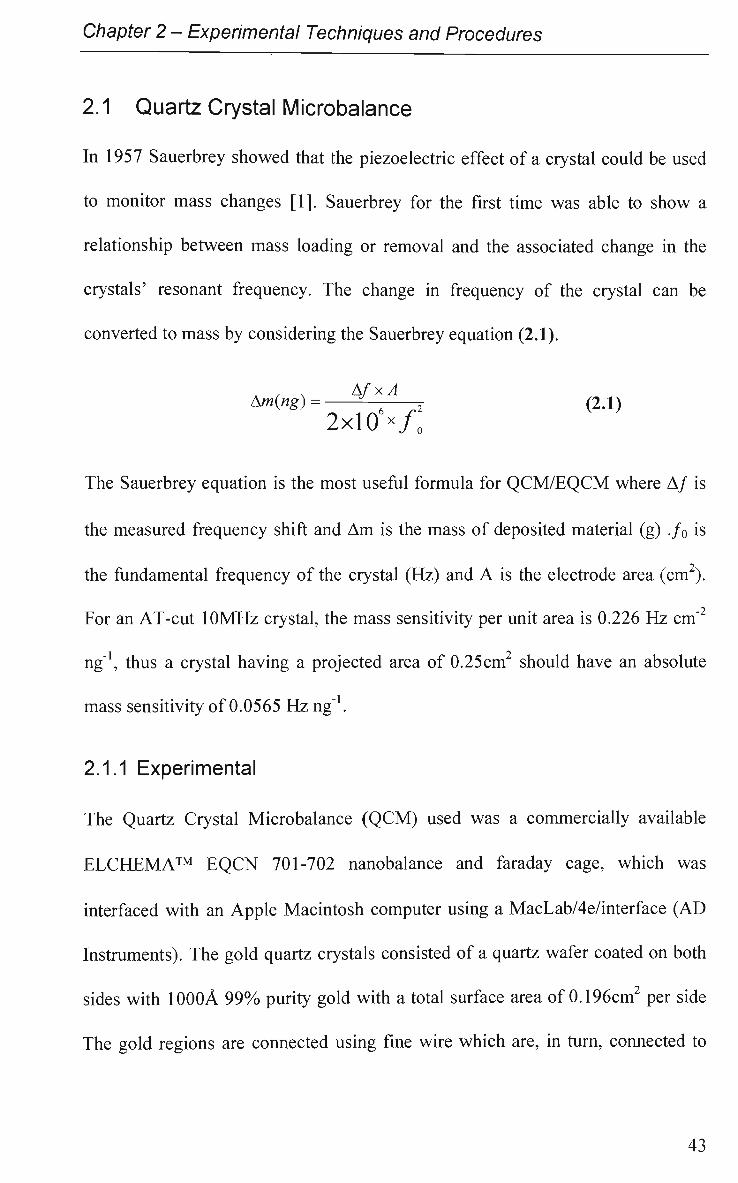
In 1957 Sauerbrey showed that the piezoelectric effect of a crystal could be used
to monitor mass changes [1]. Sauerbrey for the first time was able to show a
relationship between mass loading or removal and the associated change in the
crystals' resonant frequency. The change in frequency of the crystal can be
converted to mass by considering the Sauerbrey equation (2.1).
. , . AfxA Am(n§) = „ 'e ri (2-1)
2x10 x/0
The Sauerbrey equation is the most useful formula for Q C M / E Q C M where A/ is
the measured frequency shift and Am is the mass of deposited material (g) ./0 is
the fundamental frequency of the crystal (FIz) and A is the electrode area (cm ).
For an AT-cut 10MHz crystal, the mass sensitivity per unit area is 0.226 FIz cm"
ng" , thus a crystal having a projected area of 0.25cm should have an absolute
mass sensitivity of 0.0565 Hz ng" .
2.1.1 Experimental
The Quartz Crystal Microbalance (QCM) used was a commercially available
ELCHEMA™ EQCN 701-702 nanobalance and faraday cage, which was
interfaced with an Apple Macintosh computer using a MacLab/4e/interface (AD
Instruments). The gold quartz crystals consisted of a quartz wafer coated on both
sides with 1000A 99% purity gold with a total surface area of 0.196cm2 per side
The gold regions are connected using fine wire which are, in turn, connected to
43
Chapter 2 - Experimental Techniques and Procedures
the crystal contacts. A MacLab Micropump™ controlled by Chart v3.1.5
software was used to deliver the protein solution to the QCM cell.
The gold crystal electrode was attached to the QCM three-electrode cell, placed
inside the faraday cage, and connected to the commercial QCM. The three
electrode cell and holder were designed and built in the mechanical workshop at
the University of Wollongong. The cell was filled with 5mL of pH = 7.0 PBS and
allowed to equilibrate for a period of 30min, ensuring a steady baseline. At this
point the Micropump was activated delivering a quantity of protein to the cell.
Gold was the only electrode used for this work while HSA was the only protein
used that had a pH = 7.0. The HSA concentration investigated was lOOug mL"1.
The adsorption behaviour of the HSA was investigated at various applied
potentials.
2.2 Radiolabelling
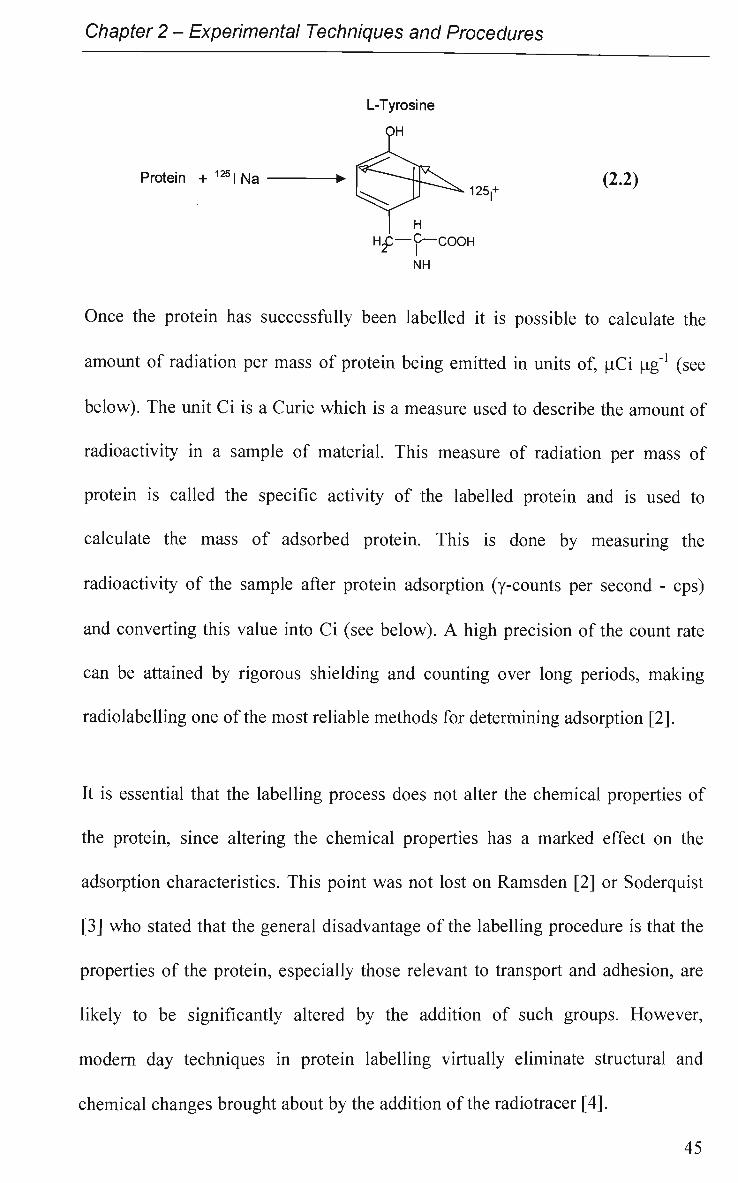
Radiolabelling has long been an efficient and relatively easy way to study many
biological systems. Iodine 125 (125I) has a sixty day half-life making it ideal as a
radio label for adsorption experiments. I is a low energy gamma emitter and its
radioactivity can easily be measured using a gamma counter. When used with
proteins the iodine attaches adjacent to the hydroxyl on the free tyrosine sections
following the reaction (2.2) mechanism.
44
Chapter 2 - Experimental Techniques and Procedures
L-Tyrosine
Protein +125INa •
I H
H£— C— COOH NH
Once the protein has successfully been labelled it is possible to calculate the
amount of radiation per mass of protein being emitted in units of, uCi ug"1 (see
below). The unit Ci is a Curie which is a measure used to describe the amount of
radioactivity in a sample of material. This measure of radiation per mass of
protein is called the specific activity of the labelled protein and is used to
calculate the mass of adsorbed protein. This is done by measuring the
radioactivity of the sample after protein adsorption (y-counts per second - cps)
and converting this value into Ci (see below). A high precision of the count rate
can be attained by rigorous shielding and counting over long periods, making
radiolabelling one of the most reliable methods for determining adsorption [2].
It is essential that the labelling process does not alter the chemical properties of
the protein, since altering the chemical properties has a marked effect on the
adsorption characteristics. This point was not lost on Ramsden [2] or Soderquist
[3] who stated that the general disadvantage of the labelling procedure is that the
properties of the protein, especially those relevant to transport and adhesion, are
likely to be significantly altered by the addition of such groups. However,
modern day techniques in protein labelling virtually eliminate structural and
chemical changes brought about by the addition of the radiotracer [4].
45
(2.2)
Chapter 2 - Experimental Techniques and Procedures
2.2A Experimental
All experiments took place in a controlled "hot" laboratory located in the
Biological Sciences building at the University of Wollongong and were
performed behind a lead impregnated Perspex shield set up in a fume hood. A
stock solution of 500u\g mL"1 of protein was prepared using 0.2M PBS (pH =
7.0). Concentrated HC1 and NaOH were added to the protein solution to prepare
the pH = 3.0 and pH = 9.0 solutions. Each solution was made up to contain
0.15MNaCl.
125I Labelling Protocol
The standard protocol (adjusted to suit required concentrations) for attachment of
125I to proteins as set out by Pierce Ltd. is as follows,
1. Wash and dry three IODO-BEADS® on filter paper using lOOmM PBS.
Place beads along with 500uL of lOOmM PBS into an Eppendorf vial.
2. Add 2.0pL of 125I to Eppendorf and leave for 5 min.
3. Add 800LIL of stock protein to Eppendorf and leave for 15 min.
4. Remove solution from Eppendorf to stop reaction and place in a second
Eppendorf, discard IODO-BEADS® in the appropriate manner for
radioactive waste.
5. Condition a PD-10 gel filtration column by passing 5.0mL of 20mM PBS
through it, discard PBS to waste.
6. Pass labelled protein through the PD-10 column and collect the fraction in
an Eppendorf vial.
46
Chapter 2 - Experimental Techniques and Procedures
7. Pass 10 x 1.0ml portions of 20mM PBS through the column and collect
each fraction in a separate Eppendorf vial.
8. Place 2.0uL of each fraction onto a separate piece of filter paper, place the
filter paper into glass tubes and measure the radioactivity using a gamma
counter.
9. Record the counts per minute (cpm) over a 10 min period. Convert the
cpm to counts per second (cps) and plot these values for each fraction.
10. Calculate the specific activity of the labelled HSA (see below for details).
Specific Activity Calculations
The plot of cps versus fraction should exhibit two distinct peaks, the first one due
to the labelled protein and the second due to the free 125I. Determine which
fractions are responsible for the protein peak and add all the cps values together,
this gives a total cps for all of the labelled protein used in those fractions. For
example, if fraction 3, 4, 5 and 6 contributed to the protein peak then adding all
the cps will give a total cps for 8.0LIL of labelled protein (2.0uL of each fraction
was placed onto the filter paper which was then measured to produce the cps -
step 8). Once all the above data is gathered the following calculations can be
done.
Total Protein (cps in auL) = p (2-3)
(auL in the above paragraph is 8.0uL)
Total Protein (cps mL"1) ' JL | x 1000 = 5 (2.4) KapL j
Al
Chapter 2 - Experimental Techniques and Procedures
-1 Total Protein (cps Lig") = (2.5)
PPmPr
Where ppmpr is the concentration of the protein used in the labelling process in
pg mL"1.
Strictly speaking gamma counters measure disintegrations per sec (dps) rather
than cps, however the measured cps can be converted into dps using equation
(2.6). Where effy.counter is the efficiency of the gamma counter for the radiolabel
of interest:
j CPS
<IPS= rr (2.6) J J y-counter
Knowing that 3.7xl04 dps equals lu.Ci (Ci = Curie) it is possible calculate the
specific activity of the labelled HSA (2.7):
dps , Specific activity = -r (uCi ug") (2.7)
3.7xl04
Specific activity is a measure of the radiation per mass of labelled protein.
Therefore, when an experimental measurement is made and the resulting cps are
converted to pCi then the amount of labelled protein present can be calculated
using the specific activity. The specific activity of a labelled protein solution
remains the same regardless of the amount of the labelled protein used for
adsorption experiments.
48
Chapter 2 - Experimental Techniques and Procedures
Decay Correction
125I has a half-life of 60 days, it is therefore necessary to correct for decay with
1 0^
time. W h e n the I is ordered the supplier provides a table presenting the rate of
decay. Equation (2.8) is used to correct for decay, where DF is the decay factor
provided by the supplier.
_ CPS CPS corrected ~ "7777 (2.8)
Adsorption
When the iodination of the protein was complete and the specific activity
calculated, adsorption experiments were performed. Various amounts of labelled
(hot) and unlabelled (cold) protein were combined to produce final
concentrations of hot to cold protein of a LlOOppm ratio.
The gold electrode used for this work was gold Mylar sheeting while the Ti02
electrode was a Ti coated polycarbonate sheet, which had been electrochemically
oxidised. The gold and Ti02 samples had an area of 0.50cm . The gold samples
were cleaned in methanol, then in water and dried in a 60°C oven for 5min to
remove any surface impurities. No pretreatment of the Ti02 samples was
performed. The samples were placed in the protein solution for various lengths of
time, during which various external potentials were applied. The potentials were
applied using a BAS CV-27 voltammograph. The adsorption at an applied
potential was performed in a three electrode cell.
A 1480 Wizard "3" Automated Gamma Counter was used to measure the cps
which operates at an efficiency for 125I of 82%. Due to time constraints resulting
49
Chapter 2 - Experimental Techniques and Procedures
from the need to conduct the experiments and cps measurements in the same day
1 0 ^
for I decay reasons, each experiment was only performed in duplicate. The
adsorbed amount results are presented as an average of the duplicate
measurements. The error bars show the range of data as an indicator of the
measurement error in the experiments.
Each gold and Ti02 sample was placed in an Eppendorf vial and 200uL of the
1:100 protein solution was added. After the desired exposure time the sample
was removed and rinsed in 0.2M PBS followed by Milli-Q water, and then left
to dry at room temperature. The sample was transferred to a scintillation tube for
counting in the gamma counter for 10 min.
EChem vl.3.2 software was used to apply the pulse potential. For the pulsed
potential and various pH experiments the above procedure of adsorption,
counting and calculating adsorbed amount was also used. The pulsed
experiments were only performed at pH = 7.0, with the potential being pulsed on
for one second and off for one second between 0.0V and a potential Ei (Figure
2.1). The Ei potentials used were 700mV and -800mV. The adsorption time for
both the pulsed and pH experiments was 30 min.
50
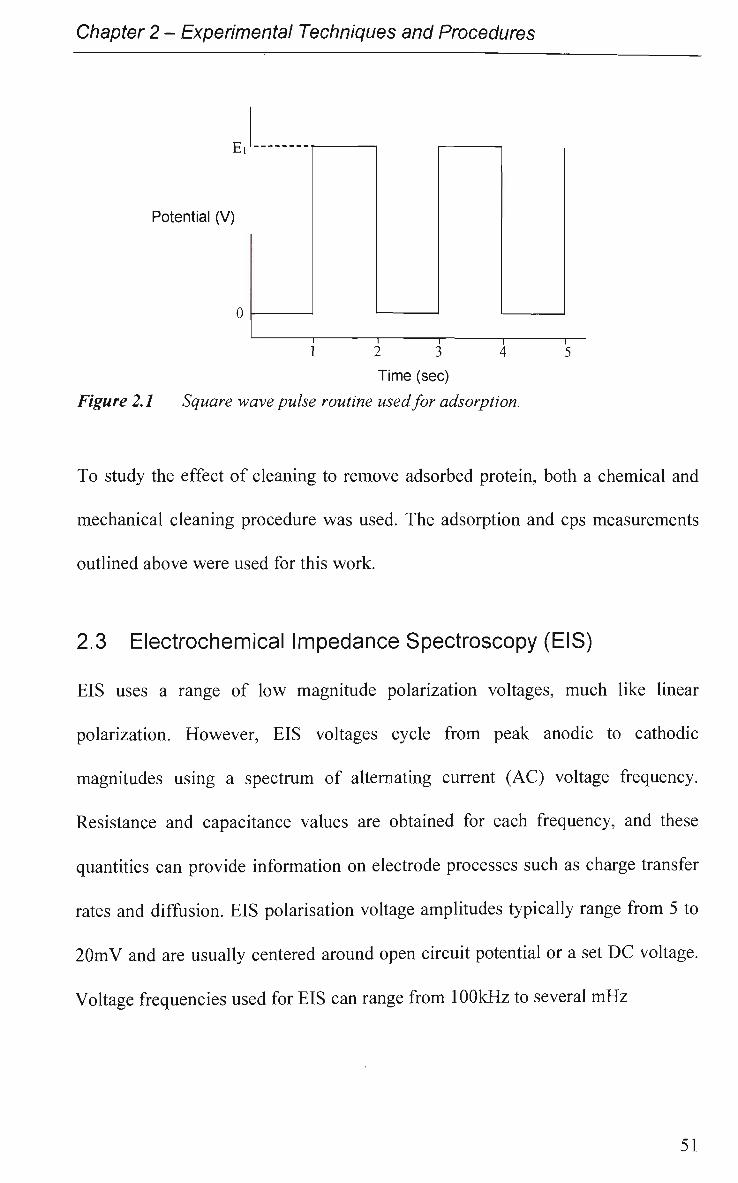
Chapter 2 - Experimental Techniques and Procedures
Potential (V)
Figure 2.1
1 2 3 4 5
Time (sec)
Square wave pulse routine used for adsorption.
To study the effect of cleaning to remove adsorbed protein, both a chemical and
mechanical cleaning procedure was used. The adsorption and cps measurements
outlined above were used for this work.
2.3 Electrochemical Impedance Spectroscopy (EIS)
EIS uses a range of low magnitude polarization voltages, much like linear
polarization. However, EIS voltages cycle from peak anodic to cathodic
magnitudes using a spectrum of alternating current (AC) voltage frequency.
Resistance and capacitance values are obtained for each frequency, and these
quantities can provide information on electrode processes such as charge transfer
rates and diffusion. EIS polarisation voltage amplitudes typically range from 5 to
20mV and are usually centered around open circuit potential or a set DC voltage.
Voltage frequencies used for EIS can range from 100kHz to several mHz
51
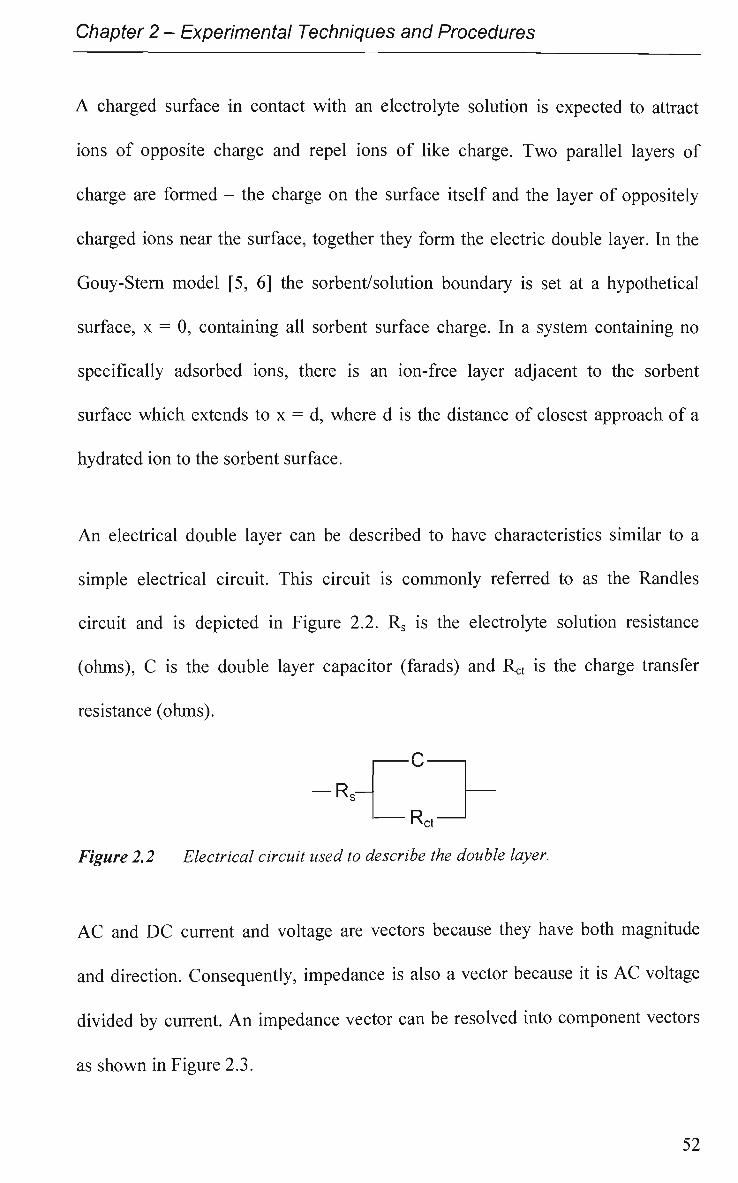
Chapter 2 - Experimental Techniques and Procedures
A charged surface in contact with an electrolyte solution is expected to attract
ions of opposite charge and repel ions of like charge. T w o parallel layers of
charge are formed - the charge on the surface itself and the layer of oppositely
charged ions near the surface, together they form the electric double layer. In the
Gouy-Stern model [5, 6] the sorbent/solution boundary is set at a hypothetical
surface, x = 0, containing all sorbent surface charge. In a system containing no
specifically adsorbed ions, there is an ion-free layer adjacent to the sorbent
surface which extends to x = d, where d is the distance of closest approach of a
hydrated ion to the sorbent surface.
An electrical double layer can be described to have characteristics similar to a
simple electrical circuit. This circuit is commonly referred to as the Randies
circuit and is depicted in Figure 2.2. Rs is the electrolyte solution resistance
(ohms), C is the double layer capacitor (farads) and Rct is the charge transfer
resistance (ohms).
- F L -
R e t -
Figure 2.2 Electrical circuit used to describe the double layer.
AC and DC current and voltage are vectors because they have both magnitude
and direction. Consequently, impedance is also a vector because it is A C voltage
divided by current. A n impedance vector can be resolved into component vectors
as shown in Figure 2.3.
52
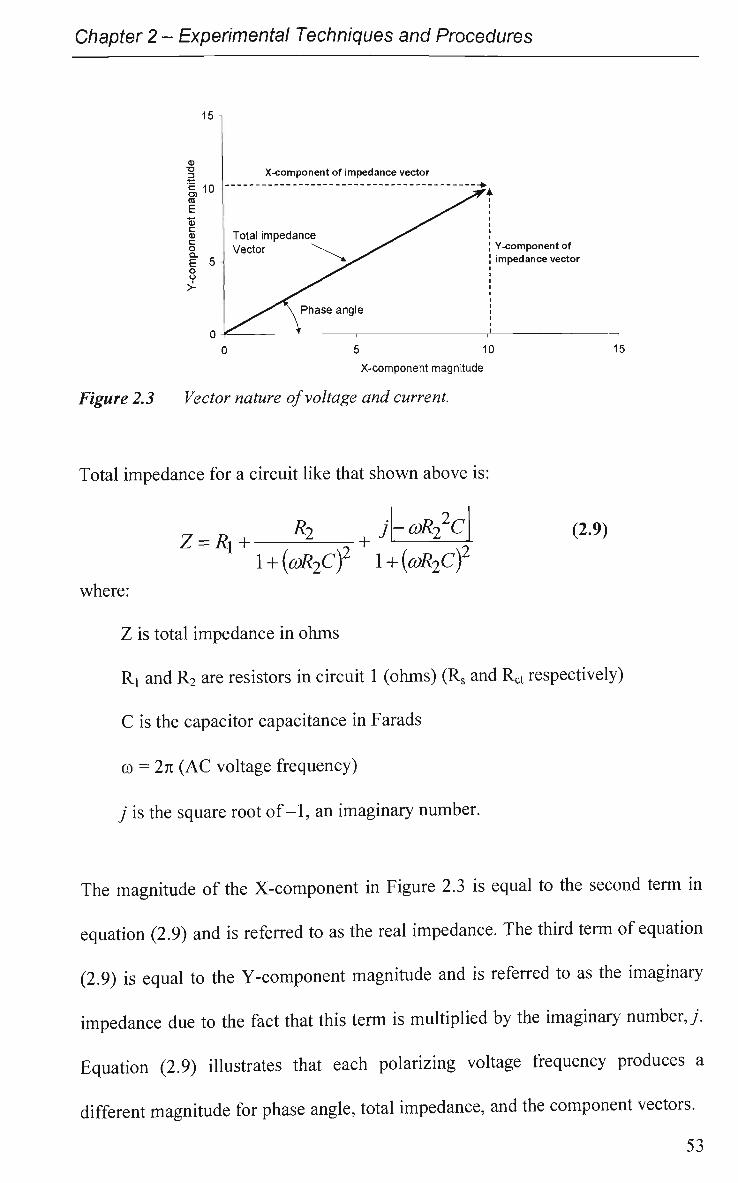
Chapter 2 - Experimental Techniques and Procedures
15 -
<B T3 3
10
E aS c w c o
I 5 o o
X-component of impedance vector
Total impedance Vector Y-component of
impedance vector
5 10 X-component magnitude
15
Figure 2.3 Vector nature of voltage and current.
Total impedance for a circuit like that shown above is:
Z=&4 Rr, J - coRiC
! l + (o)R2C)2 \ + {coR2C)
2
(2.9)
where:
Z is total impedance in ohms
Ri and R2 are resistors in circuit 1 (ohms) (Rs and Rct respectively)
C is the capacitor capacitance in Farads
co = 27t (AC voltage frequency)
J is the square root of-1, an imaginary number.
The magnitude of the X-component in Figure 2.3 is equal to the second term in
equation (2.9) and is referred to as the real impedance. The third term of equation
(2.9) is equal to the Y-component magnitude and is referred to as the imaginary
impedance due to the fact that this term is multiplied by the imaginary number,;.
Equation (2.9) illustrates that each polarizing voltage frequency produces a
different magnitude for phase angle, total impedance, and the component vectors.
53
Chapter 2 - Experimental Techniques and Procedures
Impedance data can be presented in various ways, with the most common graphs
being, Nyquist, Bode Z and Bode phase angle. The Nyquist plot is formed by
plotting the real impedance against the imaginary impedance. From the plot it is
possible to calculate solution resistance as well as the charge transfer resistance.
The shape of this plot also helps to elucidate the electrode process occurring at
the particular dc polarisation voltage. The Bode Z and phase angle plots are
formed by plotting the logarithm of frequency against the absolute impedance
and phase angle, respectively. These graphs also aid in elucidating electrode
processes. Another graph, which is not as commonly used, is the capacitance
plot, where the real capacitance is plotted against the imaginary capacitance.
From this plot the electrode total capacitance can be calculated.
2.3.1 Experimental
All impedance measurements were made in a three-electrode cell using a
Princeton Applied Research BES Impedance system, utilizing a PAR 263
Potentiostat plus 5210 lock-in amplifier. The impedance spectra were recorded
using PowerSine™ V. 2.0 software between 100kHz and 50mHz with an AC
amplitude of lOmV.
Prior to every impedance measurement the gold electrode was polished on a
0.45pm alumina slurry for 3-5min, followed by sonication in Milli-Q water for
2min. No polishing was performed for the Ti02 electrode. The gold electrode
was roughened (Results Chapter 4: section 4.2.4.3) by polishing the gold disc
electrode using a 800grit emery (wet and Dry paper) using Milli-Q water as the
54
Chapter 2 - Experimental Techniques and Procedures
lubricant. After roughening, the electrode was rinsed in methanol followed by
Milli-Q water to remove any impurities. For the work performed at a roughened
electrode surface the electrode For all experiments, except impedance measured
at open circuit potential (OCP), the electrode was conditioned prior to
performing the impedance measurement. This involved the EIS system
measuring the OCP for 15s, followed by the application of this open circuit
potential for 15s, finally the electrode was held at the potential which the
impedance measurement was to be recorded at for 15s. The electrodes were
conditioned in the media in which the impedance measurements were to be
made.
impedance spectra were recorded in 0.2M PBS before and after immersion into
solutions of protein and PBS. For all experiments the concentration of the protein
solution was lOOOug mL"1 and for PBS solution it was 0.2M. The impedance
measured before immersion is always referred to as the "Initial", whilst the
impedance measured after immersion into protein is always referred to as "Final
Ig.G" or "Final HSA" respectively (depending on the protein). The Impedance
recorded after immersion in 0.2M PBS is referred to as the "Final PBS"
measurement. This "Final PBS" measurement was used as the blank when the
protein adsorption experiments where completed.
Impedance was also measured at a single frequency, 1000Hz, with a
measurement taken every 8s. The impedance measurements were performed
immediately after the Au and Ti02 electrodes were placed in the protein solution
55
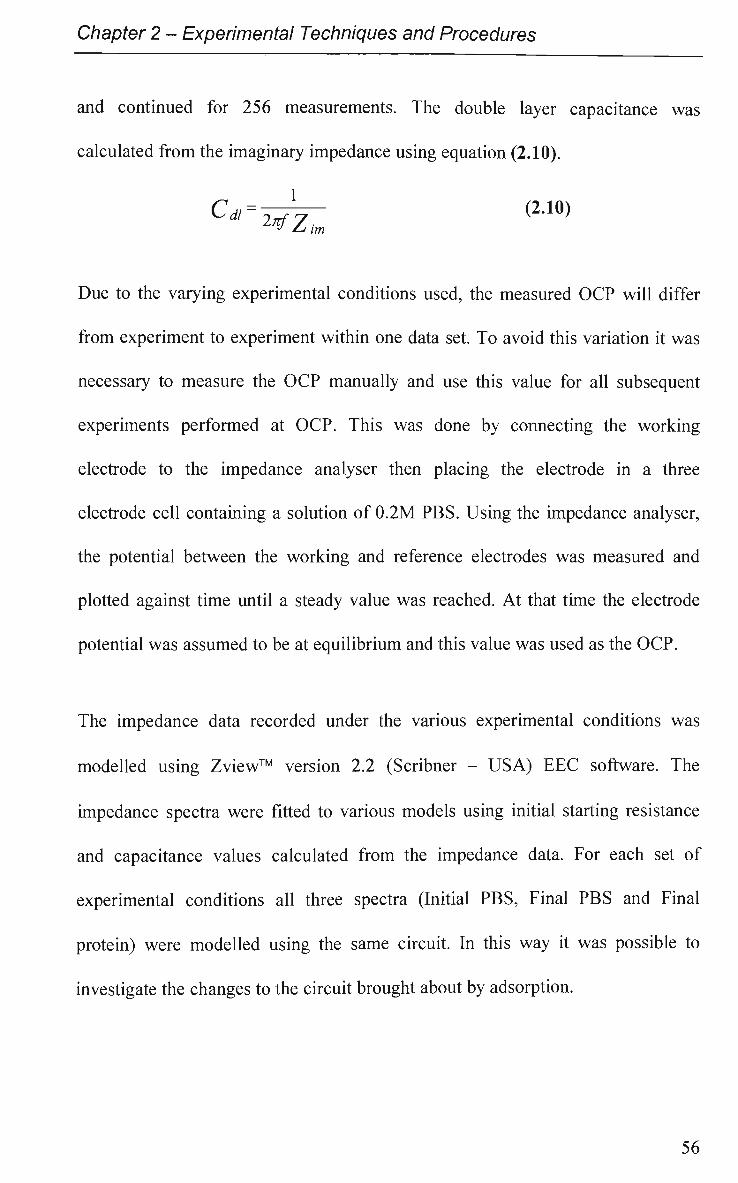
Chapter 2 - Experimental Techniques and Procedures
and continued for 256 measurements. The double layer capacitance was
calculated from the imaginary impedance using equation (2.10).
c"'=Wz~ (2-10)
Due to the varying experimental conditions used, the measured OCP will differ
from experiment to experiment within one data set. To avoid this variation it was
necessary to measure the OCP manually and use this value for all subsequent
experiments performed at OCP. This was done by connecting the working
electrode to the impedance analyser then placing the electrode in a three
electrode cell containing a solution of 0.2M PBS. Using the impedance analyser,
the potential between the working and reference electrodes was measured and
plotted against time until a steady value was reached. At that time the electrode
potential was assumed to be at equilibrium and this value was used as the OCP.
The impedance data recorded under the various experimental conditions was
modelled using Zview™ version 2.2 (Scribner - USA) EEC software. The
impedance spectra were fitted to various models using initial starting resistance
and capacitance values calculated from the impedance data. For each set of
experimental conditions all three spectra (Initial PBS, Final PBS and Final
protein) were modelled using the same circuit. In this way it was possible to
investigate the changes to the circuit brought about by adsorption.
56
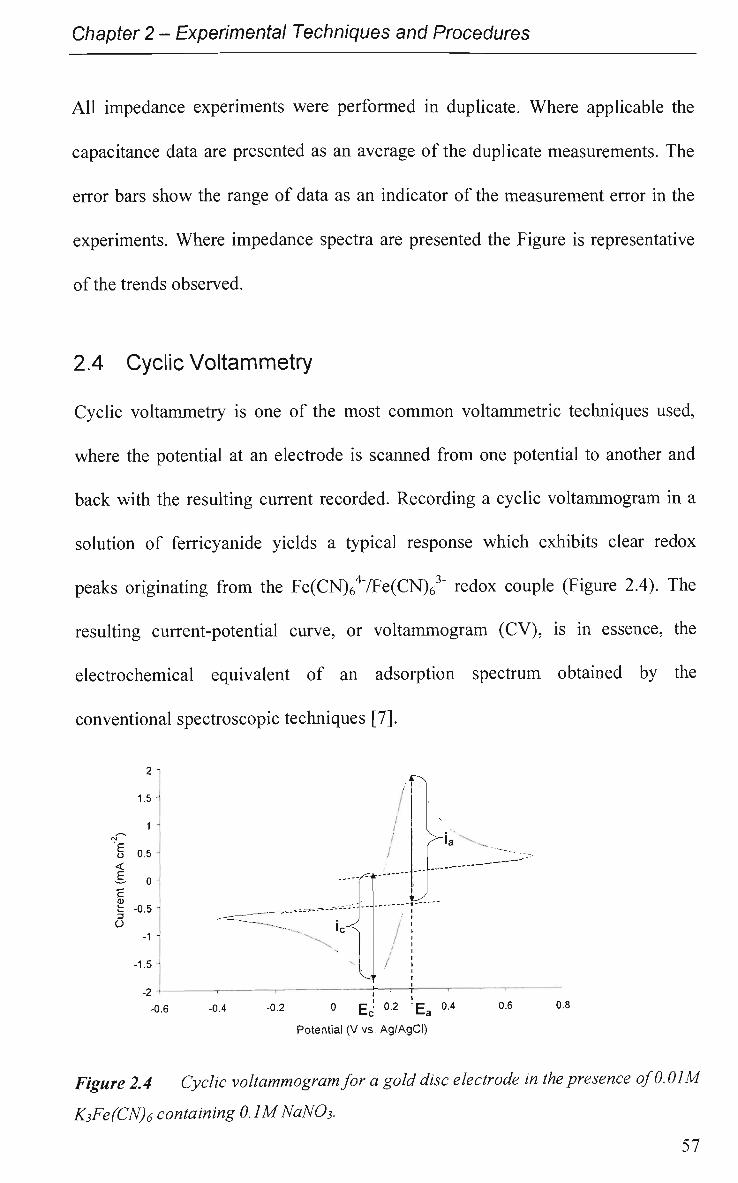
Chapter 2 - Experimental Techniques and Procedures
All impedance experiments were performed in duplicate. Where applicable the
capacitance data are presented as an average of the duplicate measurements. The
error bars show the range of data as an indicator of the measurement error in the
experiments. Where impedance spectra are presented the Figure is representative
of the trends observed.
2.4 Cyclic Voltammetry
Cyclic voltammetry is one of the most common voltammetric techniques used,
where the potential at an electrode is scanned from one potential to another and
back with the resulting current recorded. Recording a cyclic voltammogram in a
solution of ferricyanide yields a typical response which exhibits clear redox
peaks originating from the Fe(CN)647Fe(CN)6
3" redox couple (Figure 2.4). The
resulting current-potential curve, or voltammogram (CV), is in essence, the
electrochemical equivalent of an adsorption spectrum obtained by the
conventional spectroscopic techniques [7].
2
1.5
1 1
§ 0.5
c t
o -0.5
-1
-1.5
-2
f^
^ *
M
\y
I
-0.6 -0.4 -0.2 0 E J 0.2 E a 0 4
Potential (V vs. Ag/AgCl)
0.6 0.8
Figure 2.4 Cyclic voltammogram for a gold disc electrode in the presence ofO. 01M
K3Fe(CN)6 containing 0.1MNaNO3.
57
Chapter 2 - Experimental Techniques and Procedures
The main parameters of interest of a cyclic voltammogram are: anodic
(oxidation) peak current (ipa); cathodic (reduction) peak current (ipc); anodic peak
potential (Epa) and cathodic peak potential (Epc).
2.4.1 Experimental
The following experimental procedure was performed for both HSA and Ig.G
proteins. A three-electrode cell was used for the CV experiments. For the work
performed with the gold electrode, protein solutions with a concentration of
lOOpg mL"1 were prepared in 0.2M PBS, at pH = 3.0, 7.0 and 9.0. The CVs were
recorded in a 0.01M potassium ferricyanide containing 0.1M sodium nitrate
solution. The CV was recorded between 700mV and -400mV at a scan rate of
lOOmV s"1, for four cycles.
The gold electrode was polished with 0.45um alumina slurry using a polishing
cloth. Once polished, the electrode was sonicated for 2min in Milli-Q water then
placed into the ferricyanide solution and four CVs recorded. The fourth CV in
each set acted as the reference which successive CVs were compared against.
The electrode was polished again and placed in one of the protein solutions with
an applied potential and for a given time. On completion of the adsorption, the
electrode was removed from the protein solution and rinsed in PBS and then in
Milli-Q water. Following the rinsing, the electrode was placed in the
ferrocyanide solution and the CVs recorded. This procedure continued until all
the applied potential, pH and adsorption time combinations were completed.
58
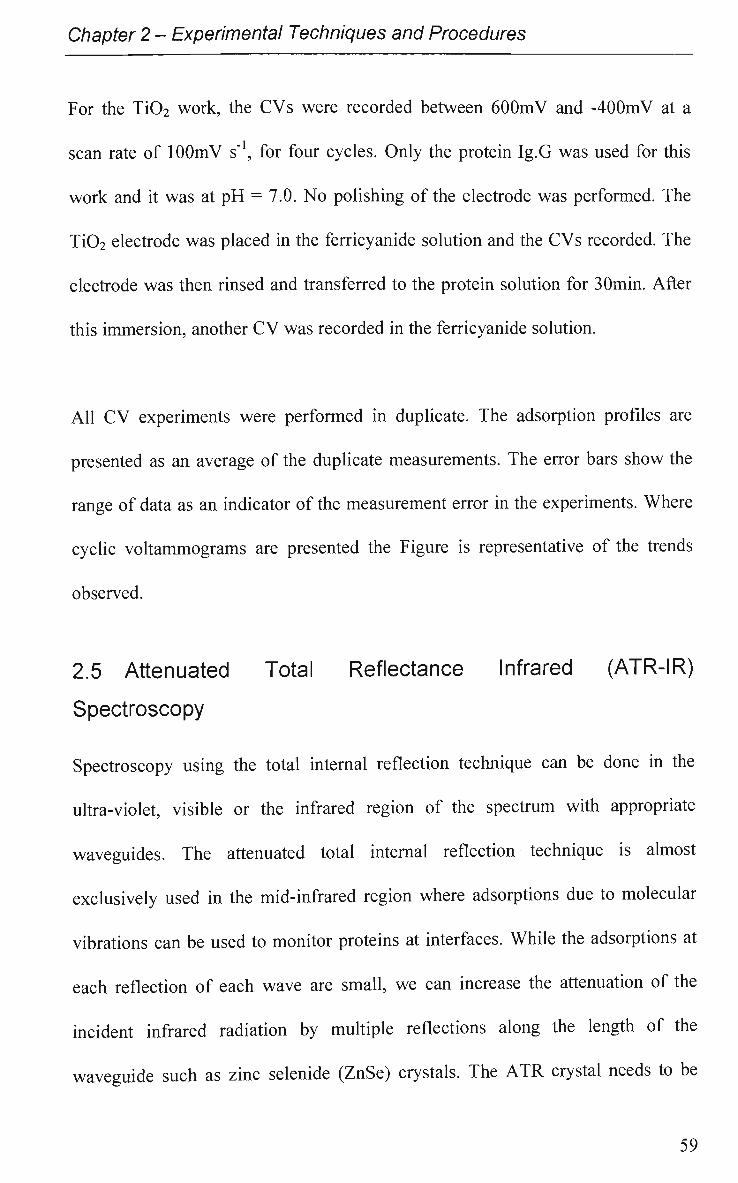
Chapter 2 - Experimental Techniques and Procedures
For the Ti02 work, the CVs were recorded between 600mV and -400mV at a
scan rate of lOOmV s"1, for four cycles. Only the protein Ig.G was used for this
work and it was at pH = 7.0. No polishing of the electrode was performed. The
Ti02 electrode was placed in the ferricyanide solution and the CVs recorded. The
electrode was then rinsed and transferred fo the protein solution for 30min. After
this immersion, another CV was recorded in the ferricyanide solution.
All CV experiments were performed in duplicate. The adsorption profiles are
presented as an average of the duplicate measurements. The error bars show the
range of data as an indicator of the measurement error in the experiments. Where
cyclic voltammograms are presented the Figure is representative of the trends
observed.
2.5 Attenuated Total Reflectance Infrared (ATR-IR)
Spectroscopy
Spectroscopy using the total internal reflection technique can be done in the
ultra-violet, visible or the infrared region of the spectrum with appropriate
waveguides. The attenuated total internal reflection technique is almost
exclusively used in the mid-infrared region where adsorptions due to molecular
vibrations can be used to monitor proteins at interfaces. While the adsorptions at
each reflection of each wave are small, we can increase the attenuation of the
incident infrared radiation by multiple reflections along the length of the
waveguide such as zinc selenide (ZnSe) crystals. The ATR crystal needs to be
59
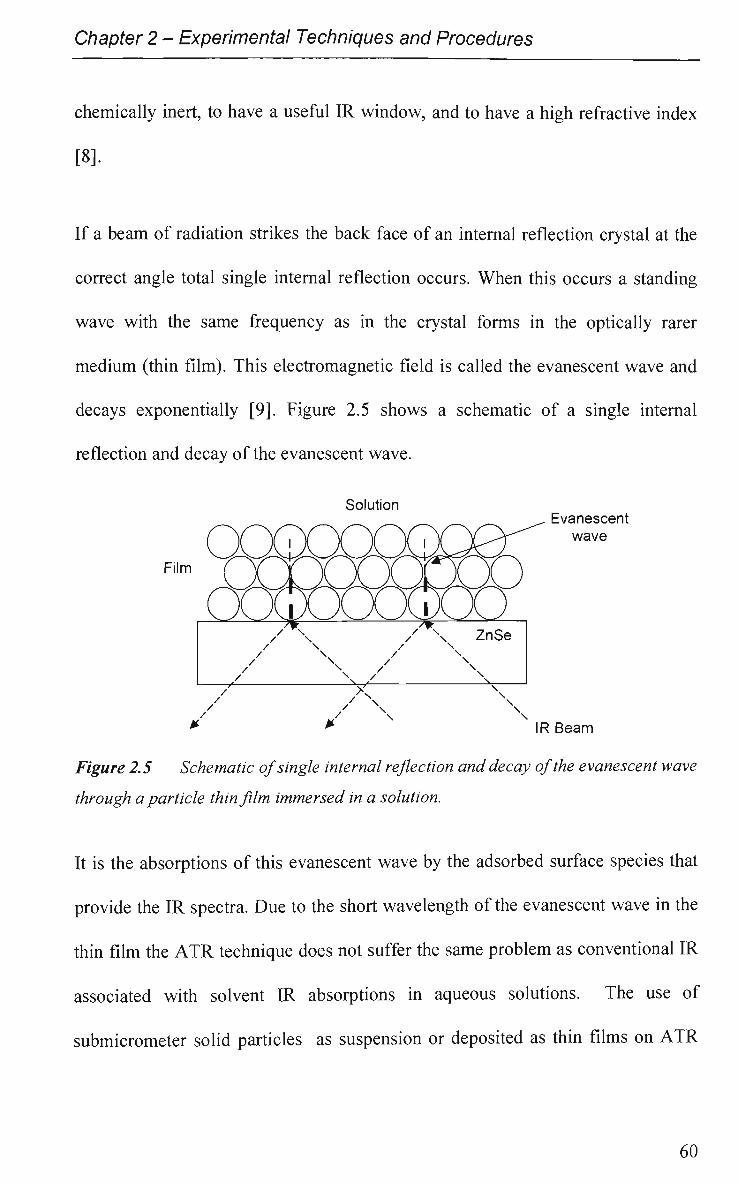
Chapter 2 - Experimental Techniques and Procedures
chemically inert, to have a useful IR window, and to have a high refractive index
[8].
If a beam of radiation strikes the back face of an internal reflection crystal at the
correct angle total single internal reflection occurs. When this occurs a standing
wave with the same frequency as in the crystal forms in the optically rarer
medium (thin film). This electromagnetic field is called the evanescent wave and
decays exponentially [9]. Figure 2.5 shows a schematic of a single infernal
reflection and decay of the evanescent wave.
Solution
Film
Evanescent wave
IR Beam
Figure 2.5 Schematic of single internal reflection and decay of the evanescent wave
through a particle thin film immersed in a solution.
It is the absorptions of this evanescent wave by the adsorbed surface species that
provide the IR spectra. Due to the short wavelength of the evanescent wave in the
thin film the ATR technique does not suffer the same problem as conventional IR
associated with solvent IR absorptions in aqueous solutions. The use of
submicrometer solid particles as suspension or deposited as thin films on ATR
60
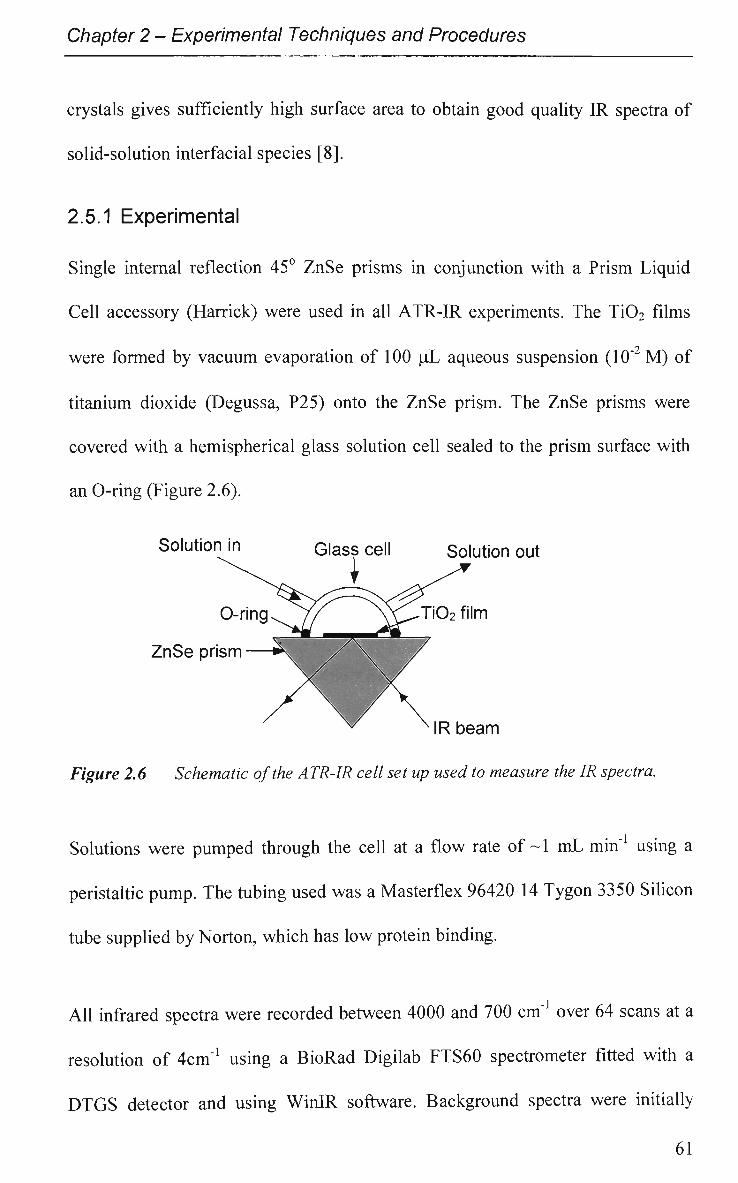
Chapter 2 - Experimental Techniques and Procedures
crystals gives sufficiently high surface area to obtain good quality IR spectra of
solid-solution interfacial species [8].
2.5.1 Experimental
Single internal reflection 45° ZnSe prisms in conjunction with a Prism Liquid
Cell accessory (Harrick) were used in all ATR-IR experiments. The Ti02 films
were formed by vacuum evaporation of 100 pL aqueous suspension (10"2 M) of
titanium dioxide (Degussa, P25) onto the ZnSe prism. The ZnSe prisms were
covered with a hemispherical glass solution cell sealed to the prism surface with
an O-ring (Figure 2.6).
Solution in Glass cell Solution out
O-ring^Sy^ ^N^Ti02 film
^ NRbeam
Figure 2.6 Schematic of the ATR-IR cell set up used to measure the IR spectra.
Solutions were pumped through the cell at a flow rate of ~1 mL min"1 using a
peristaltic pump. The tubing used was a Masterflex 96420 14 Tygon 3350 Silicon
tube supplied by Norton, which has low protein binding.
All infrared spectra were recorded between 4000 and 700 cm"1 over 64 scans at a
resolution of 4cm"1 using a BioRad Digilab FTS60 spectrometer fitted with a
DTGS detector and using WinIR software. Background spectra were initially
61
Chapter 2 - Experimental Techniques and Procedures
recorded by flowing the solution of interest, but without the protein component,
through the cell. Subsequently the protein solution was flowed through the cell
and absorbance spectra of the adsorbed species obtained from these two
measurements. In each case, spectra were recorded 30min after the Ti02 film was
exposed to the solution. Unpublished work performed in our laboratories
indicates that 30min adsorption results in equilibrium being reached between the
adsorbing protein and the protein in solution.
Due to time constraints the ATR-IR work was not performed in duplicate. The
results presented in Chapter 7 are of data obtained from single experiments.
2.6 Solutions and Reagents
All chemicals and reagents were used as received unless otherwise stated.
Human Serum Albumin (HSA) and human polyclonal Immunoglobulin G (Ig.G)
were obtained from Sigma Aldrich and were reagent grade isolated from pooled
normal serum. Potassium ferricyanide, sodium chloride, sodium nitrate, disodium
orthophosphate and sodium dihydrogen orthophosphate were all obtained from
Sigma Aldrich. All solutions were prepared in Milli-Q water. The buffer used
was phosphate buffer saline solution (PBS), which was prepared by combining
0.2M Na2HP04 and 0.2M NaH2P04. Enough NaCl was added to produce a final
saline concentration of 0.15M. This buffer was prepared at pH = 7.0 and
concentrated HC1 or NaOH solutions were added to lower or raise the pH.
62
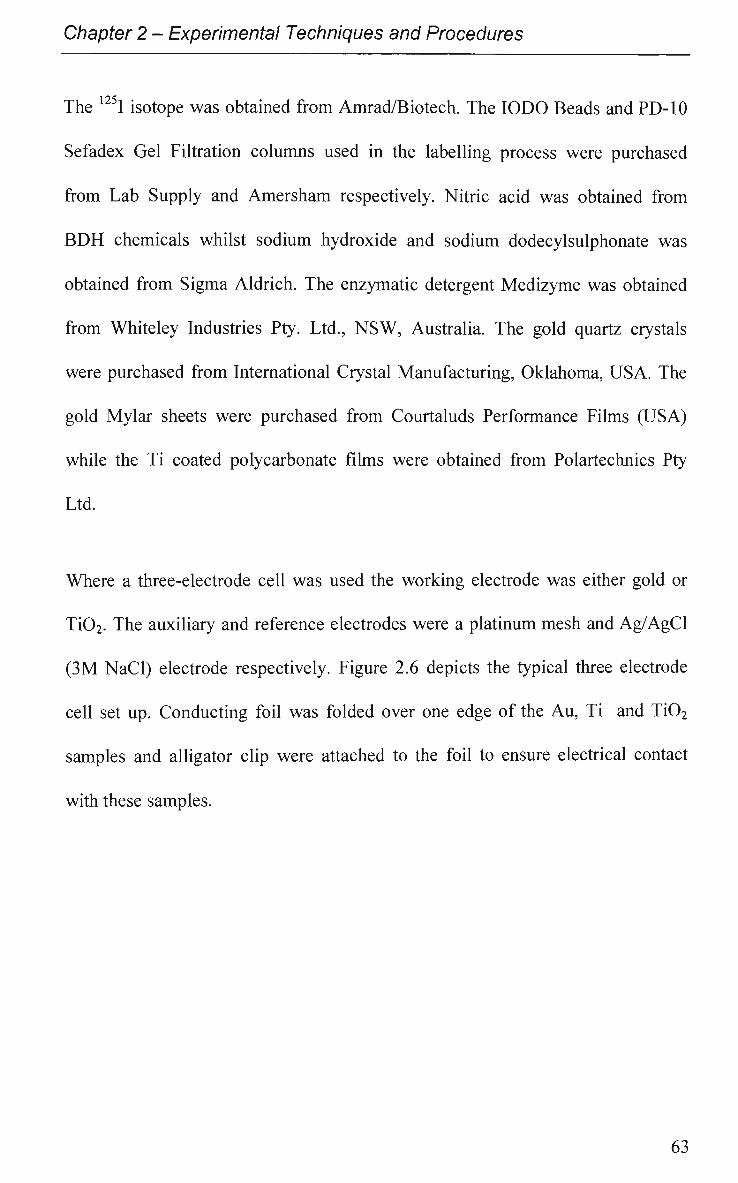
Chapter 2 - Experimental Techniques and Procedures
i o^
The I isotope was obtained from Amrad/Biotech. The I O D O Beads and PD-10
Sefadex Gel Filtration columns used in the labelling process were purchased
from Lab Supply and Amersham respectively. Nitric acid was obtained from
BDH chemicals whilst sodium hydroxide and sodium dodecylsulphonate was
obtained from Sigma Aldrich. The enzymatic detergent Medizyme was obtained
from Whiteley Industries Pty. Ltd., NSW, Australia. The gold quartz crystals
were purchased from International Crystal Manufacturing, Oklahoma, USA. The
gold Mylar sheets were purchased from Courtaluds Performance Films (USA)
while the Ti coated polycarbonate films were obtained from Polartechnics Pty
Ltd.
Where a three-electrode cell was used the working electrode was either gold or
Ti02. The auxiliary and reference electrodes were a platinum mesh and Ag/AgCl
(3M NaCl) electrode respectively. Figure 2.6 depicts the typical three electrode
cell set up. Conducting foil was folded over one edge of the Au, Ti and Ti02
samples and alligator clip were attached to the foil to ensure electrical contact
with these samples.
63
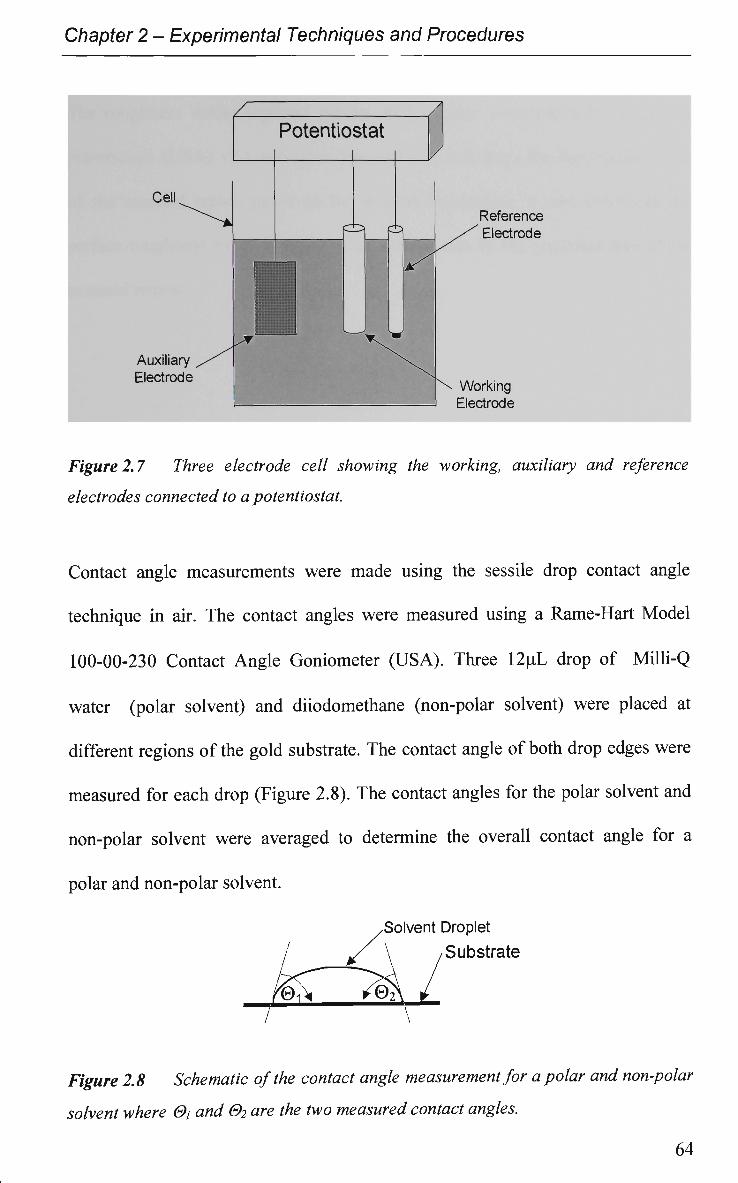
Chapter 2 - Experimental Techniques and Procedures
Figure 2.7 Three electrode cell showing the working, auxiliary and reference
electrodes connected to a potentiostat.
Contact angle measurements were made using the sessile drop contact angle
technique in air. The contact angles were measured using a Rame-Hart Model
100-00-230 Contact Angle Goniometer (USA). Three 12uL drop of Milli-Q
water (polar solvent) and diiodomethane (non-polar solvent) were placed at
different regions of the gold substrate. The contact angle of both drop edges were
measured for each drop (Figure 2.8). The contact angles for the polar solvent and
non-polar solvent were averaged to determine the overall contact angle for a
polar and non-polar solvent.
.Solvent Droplet
/ f \ /Substrate
Figure 2.8 Schematic of the contact angle measurement for a polar and non-polar
solvent where 0j and 02 are the two measured contact angles.
64
Chapter 2 - Experimental Techniques and Procedures
The roughness values reported for the AFM images were calculated using the
NanoScope (USA) v2.1 software. The software calculates the total surface area
of the scanned region based on the imaged topography. It then calculates the
surface roughness by dividing the total surface area by the projected area of the
scanned region.
65
Chapter 2 - Experimental Techniques and Procedures
References
1. K. Kanazawa and O. Melroy, IBM J. Res. Develop., 37 157 (1993)
2. JJ. Ramsden, Quarterly Reviews of Biophysics, 27 41 (1993)
3. J. Soderquist and A. Walton, Journal of Colloid and Interface Science, 75
386 (1980)
4. R.L. Slater, in Radioisotopes in Biology: A Practical Approach, Vol. (ed.
R.L. Slater), IRL, Oxford, (1990)
5. O. Stern, Z. Elecktrochem, 30 508 (1924)
6. G. Gouy, Ann. Phys. (Paris), 9 457 (1910)
7. R. John, Thesis: Electrochemical Studies of Hetrocyclic Conducting
Polymers, from University of Wollongong, Chemistry Department,
Wollongong, (1992)
8. A.J. McQuillan, Advanced Materials, 13 1034 (2001)
9. J. Degenhardt, Thesis: IR Spectroscopic Studies of Adsorption on
Chromium (III) Oxide Hydroxide, from University of Otago, Department
of Chemistry, DunedinNZ, (1999)
66
Chapter 3 - Adsorption of Protein on Gold
Chapter 3
Adsorption of Protein on Gold
67
Chapter 3 - Adsorption of Protein on Gold
3.1 Introduction
3.1.1 Radiolabelling
Radioactive isotopes are widely used in chemical and biological investigations.
The study of metabolism was revolutionised by the introduction of isotopic
tracers [1, 2]. Radiolabelling with Iodine 125 is the method of choice due to it
being chemically much easier and the specific radioactivity is higher than other
common isotopes such as H and C [3]. As far back as 1960 Yallow and Berson
were successful in demonstrating for the first time the use of radioimmunoassay
in detecting endogenous insulin in human blood [4]. Cornelius and Brash [5]
used the radiolabelling technique to investigate the adsorption of glycoprotein on
various substrates. The adsorption of two plasma proteins, H S A and fibrinogen,
on Ti0 2 was investigated by Liu et al [6] using the 125I radiolabelling method.
Radiolabelling has also been used extensively as a complementary technique
with other proven techniques. A n example of this is the use of radiolabelling by
Westbrook [7] et al to complement the identification of proteome elements by
M S (Q-TOF). Many authors [8-11] have compared adsorbed protein amounts
obtained using non-radiolabelled techniques with those obtained by
radiolabelling and found the results to be similar.
3.1.2 Quartz Crystal Microbalance
In 1957 Sauerbrey showed that the piezoelectric effect of a crystal could be used
to monitor mass changes [12]. Sauerbrey for the first time was able to show a
relationship between mass loading or removal and the associated change in the
68
Chapter 3 - Adsorption of Protein on Gold
crystals resonate frequency. From his work Sauerbrey was able to quantify his
findings showing that frequency decreased linearly with mass uptake [12].
However, subsequent studies performed by Miller and Bolef [13] showed that
this linear relationship had limitations relating to the elastic nature of the
deposited films.
The modern day QCM is capable of extremely sensitive mass measurements. If
oscillates in a mechanically resonant shear mode by application of an alternating,
high frequency electric field using electrodes that are usually deposited on both
sides of the crystal [14]. Up until 20 years ago it was thought that crystal
oscillation in liquid was not possible due to excessive energy loss to the solution
from viscous effects. At that time Konash and Bastiaans as well as Nomura
demonstrated the use of the QCM in the liquid environment for the determination
of mass changes at the crystal surface [14].
When using the QCM it is important to remember that other factors, besides
mass loading or removal, affect the oscillation of a crystal. When a planar surface
that is oscillating in the shear mode is immersed into any medium, a shear wave
propagates normally away from the surface into the medium. Immersion has the
effect of dampening the oscillating frequency (f0). Kanazawa and Gordon [15]
showed that the f0 of a crystal decreased by approximately 700Hz when
transferred from vacuum to pure water at 20°C. A change in temperature of 5°C
can change the f0 by as much as 41 Hz.
69
Chapter 3 - Adsorption of Protein on Gold
Jones and Meiure [16] showed, in 1981, the use of a QCM in an electrochemical
context to determine trace metals plating onto the crystal metal surface. A QCM
used in an electrochemical context is often referred to as an Electrochemical
Quartz Crystal Microbalance (EQCM). When used as an in-situ technique for
measuring mass changes, one of the electrodes is used simultaneously to provide
for the alternating electric field that drives the oscillation of the crystal and as the
working electrode in the electrochemical cell [14]. The EQCM experiment
involves the measurement of mass change at the crystal as well as one or several
electrochemical parameters such as potential, current or charge.
The QCM technique has been shown by several investigators to be a very
sensitive tool to study protein adsorption kinetics in aqueous solutions with
sensitivity in the ng cm"2 (sub-monolayer) regime [17-19]. KoBlinger et al [20]
investigated the use of a QCM in the immunosensing of specific antibodies in
human sera, while Minunni et al [20] employed a QCM to monitor, in real time,
protein adsorption of and immunoreactions of immunoglobulin (h-lg G). Masson
et al [21] studied the use of a QCM as a bioaffinity sensor for biotin based on the
bioaffinity complex between avidin and immobilized desthiobiotin. Wang et al
[22] used an EQCM as an investigative tool to study the electrochemical
behaviour of riboflavin at gold electrodes.
The commercial QCM instrument used for this work has an internal frequency to
mass conversion calibration constant of 0.226 Hz cm"2 ng"1 for AT-cut crystals of
a base resonant frequency of lOMFIz. Therefore it is not necessary to perform a
70
Chapter 3 - Adsorption of Protein on Gold
frequency to mass calibration commonly performed for other QCM systems.
QCM/EQCM was used to investigate the adsorption behavior of human serum
albumin (HSA) at a gold electrode under conditions of open circuit potential and
applied potential.
3.1.3 Electrochemical Impedance Spectroscopy
Adsorption at metal surfaces can also be monitored using electrochemical
impedance spectroscopy (EIS). Roscoe [8, 9, 23-26] et al have published
extensively in the area of protein adsorption investigation using EIS for the food
processing industry. EIS involves the application of a DC potential with an AC
potential superimposed on top, typically with a value of lOmV. The frequency of
this AC potential is varied usually in the range from kHz to mHz which allows
for complete characterisation of the electrode surface.
The way in which EIS was employed for this work differs slightly from that
described above. A fixed AC potential frequency was chosen which allows for
the monitoring of the electrical double layer capacitance (CdL). The C<ii can be
calculated from the imaginary impedance using equation (3.1). This technique
has been used previously by Subramanian et al [27] to study the kinetics of
adsorption of alkanethiols on gold and by Bernabeu et al [28] who back in 1998
used EIS to study the adsorption of albumin on a platinum rotating disc
electrode.
Cdr'l7tfZ (3-1)
71
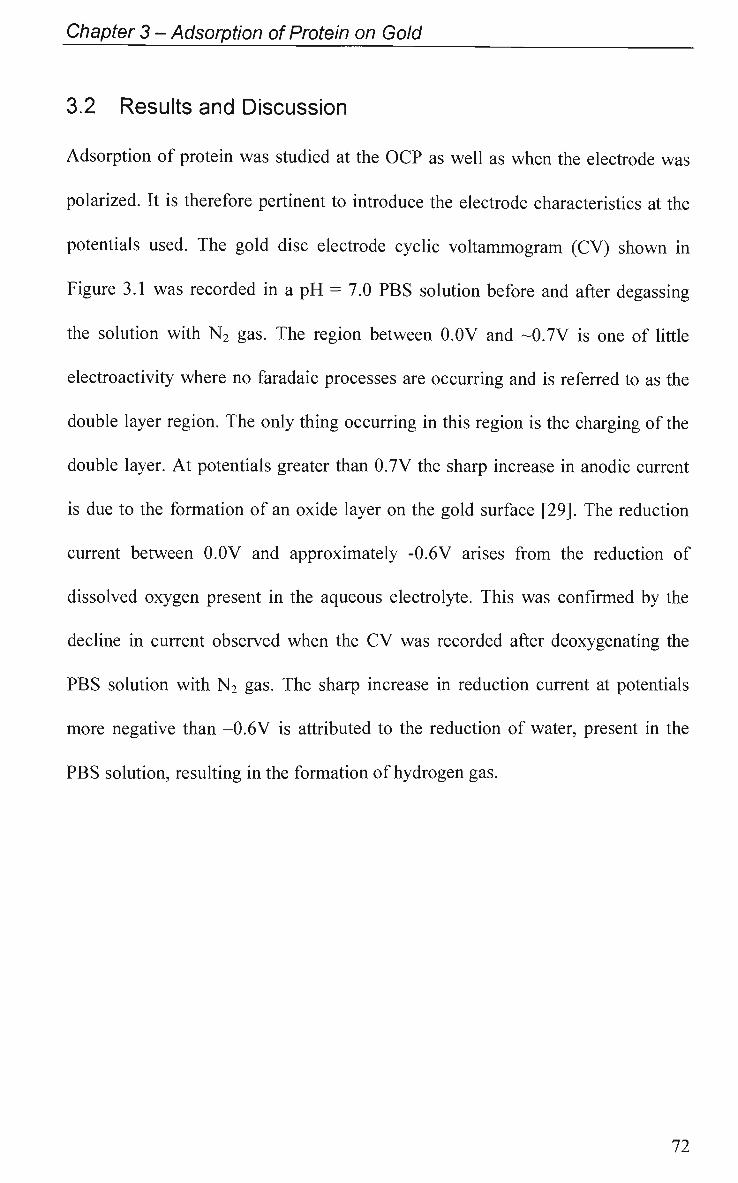
Chapter 3 - Adsorption of Protein on Gold
3.2 Results and Discussion
Adsorption of protein was studied at the OCP as well as when the electrode was
polarized. It is therefore pertinent to introduce the electrode characteristics at the
potentials used. The gold disc electrode cyclic voltammogram (CV) shown in
Figure 3.1 was recorded in a pH = 7.0 PBS solution before and after degassing
the solution with N2 gas. The region between 0.0V and -0.7V is one of little
electroactivity where no faradaic processes are occurring and is referred to as the
double layer region. The only thing occurring in this region is the charging of the
double layer. At potentials greater than 0.7V the sharp increase in anodic current
is due to the formation of an oxide layer on the gold surface [29]. The reduction
current between 0.0V and approximately -0.6V arises from the reduction of
dissolved oxygen present in the aqueous electrolyte. This was confirmed by the
decline in current observed when the CV was recorded after deoxygenating the
PBS solution with N2 gas. The sharp increase in reduction current at potentials
more negative than -0.6V is attributed to the reduction of water, present in the
PBS solution, resulting in the formation of hydrogen gas.
72
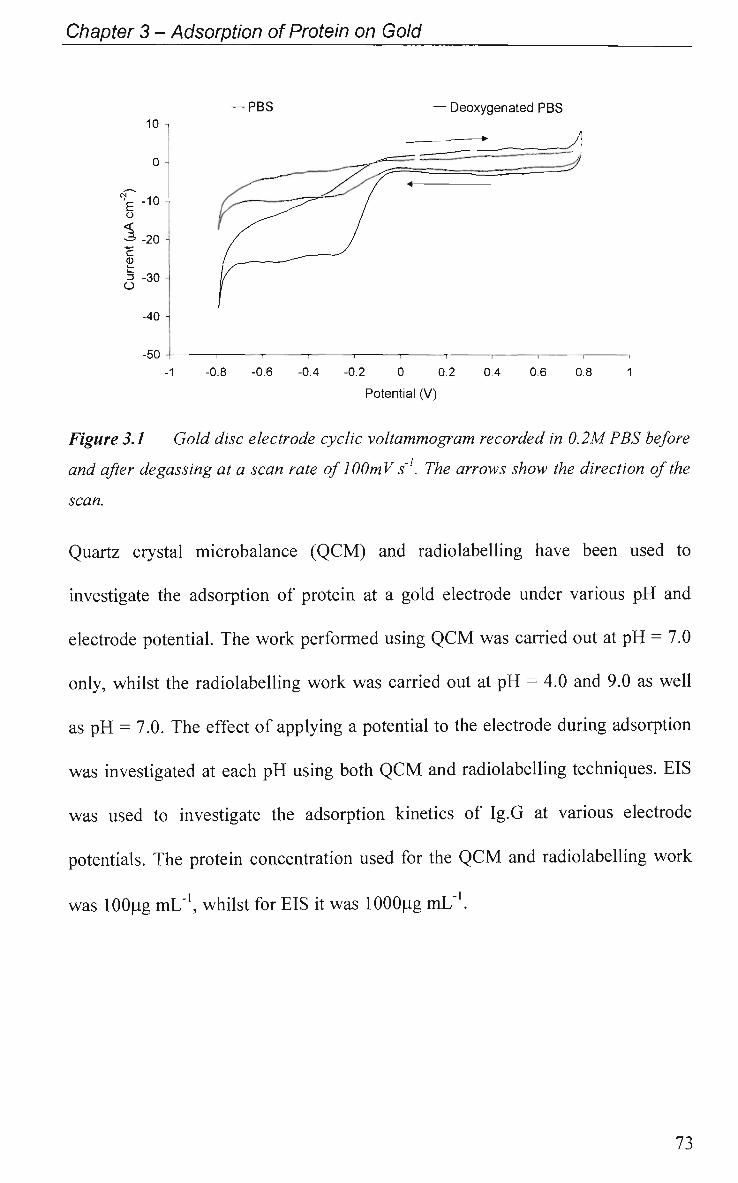
Chapter 3 - Adsorption of Protein on Gold
— PBS — Deoxygenated PBS
-1 -0.8 -0.6 -0.4 -0.2 0 0.2 0.4 0.6 0.8 1
Potential (V)
Figure 3.1 Gold disc electrode cyclic voltammogram recorded in 0.2M PBS before
and after degassing at a scan rate of lOOmV s' . The arrows show the direction of the
scan.
Quartz crystal microbalance (QCM) and radiolabelling have been used to
investigate the adsorption of protein at a gold electrode under various pH and
electrode potential. The work performed using QCM was carried out at pH = 7.0
only, whilst the radiolabelling work was carried out at pH = 4.0 and 9.0 as well
as pH = 7.0. The effect of applying a potential to the electrode during adsorption
was investigated at each pH using both QCM and radiolabelling techniques. EIS
was used to investigate the adsorption kinetics of Ig.G at various electrode
potentials. The protein concentration used for the QCM and radiolabelling work
was 100u.g mL'1, whilst for EIS it was lOOOug mL"1.
73
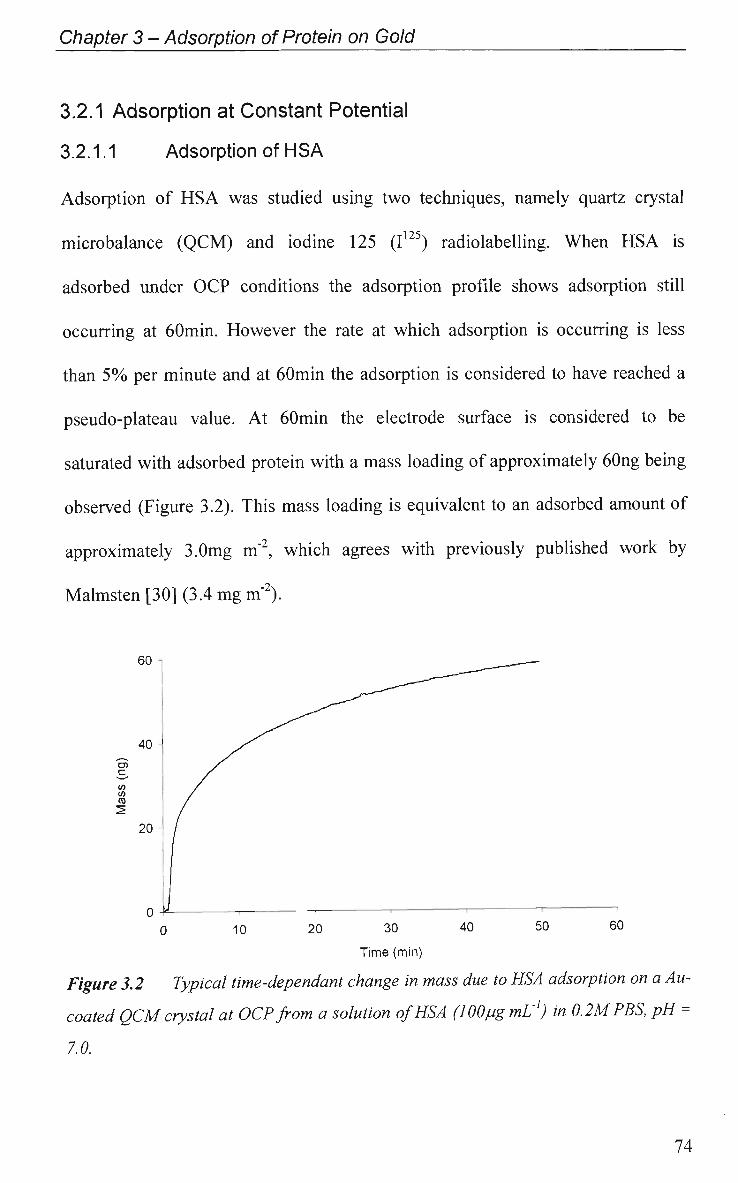
Chapter 3 - Adsorption of Protein on Gold
3.2.1 Adsorption at Constant Potential
3.2.1.1 Adsorption of HSA
Adsorption of HSA was studied using two techniques, namely quartz crystal
microbalance (QCM) and iodine 125 (I125) radiolabelling. When HSA is
adsorbed under OCP conditions the adsorption profile shows adsorption still
occurring at 60min. However the rate at which adsorption is occurring is less
than 5% per minute and at 60min the adsorption is considered to have reached a
pseudo-plateau value. At 60min the electrode surface is considered to be
saturated with adsorbed protein with a mass loading of approximately 60ng being
observed (Figure 3.2). This mass loading is equivalent to an adsorbed amount of
approximately 3.0mg m"2, which agrees with previously published work by
Malmsten [30] (3.4 mg m"2).
60 - ^_______-
40 - y^
"3 / S- / in /
m / ro / ^ /
20 - /
0 ¥ 1 1 ' ' ' — 1
0 10 20 30 40 50 60
Time (min)
Figure 3.2 Typical time-dependant change in mass due to HSA adsorption on a Au-
coated QCM crystal at OCP from a solution of HSA (lOOpg mL1) in 0.2MPBS, pH =
7.0.
1A
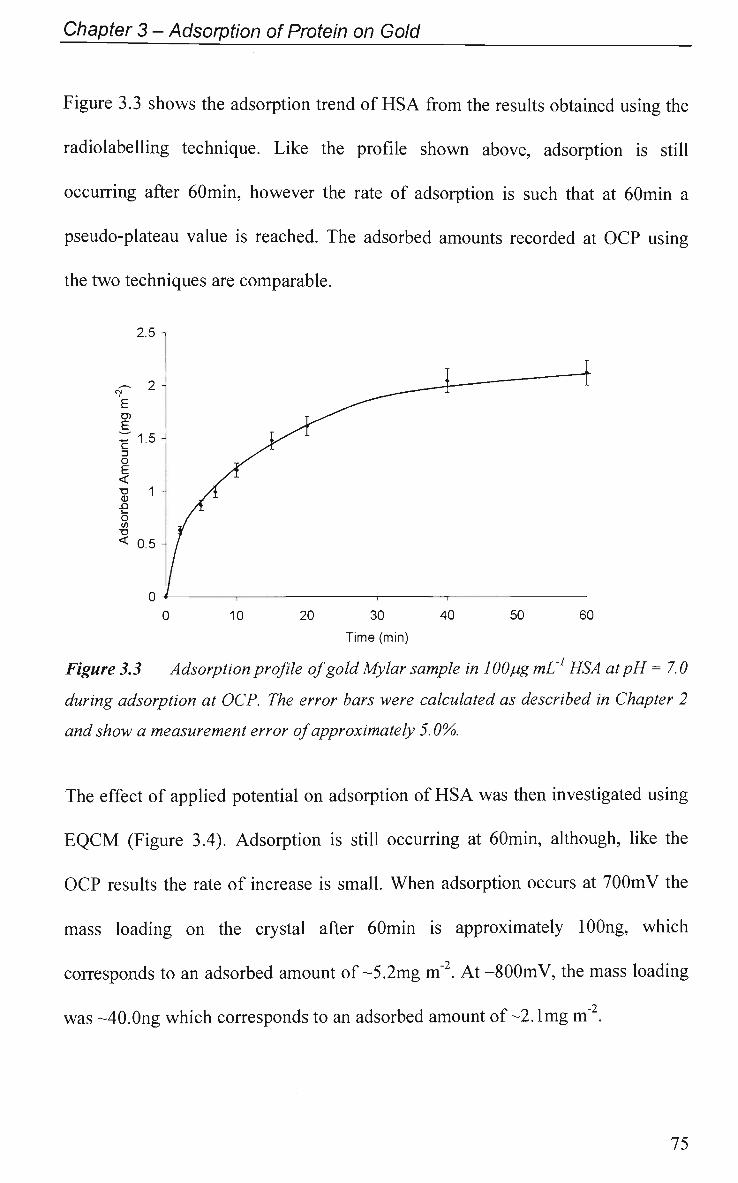
Chapter 3 - Adsorption of Protein on Gold
Figure 3.3 shows the adsorption trend of HSA from the results obtained using the
radiolabelling technique. Like the profile shown above, adsorption is still
occurring after 60min, however the rate of adsorption is such that at 60min a
pseudo-plateau value is reached. The adsorbed amounts recorded at O C P using
the two techniques are comparable.
2.5 -,
CN
E ra E
•*— <
c 3 n F < •o
0) o L_
n m "O <
2 -
1 5 -
1 -
0.5
0 10 20 30 40 50 60 Time (min)
Figure 3.3 Adsorption profile of gold Mylar sample in 100 pg mL' HSA atpH =7.0
during adsorption at OCP. The error bars were calculated as described in Chapter 2
and show a measurement error of approximately 5.0%.
The effect of applied potential on adsorption of HSA was then investigated using
E Q C M (Figure 3.4). Adsorption is still occurring at 60min, although, like the
O C P results the rate of increase is small. W h e n adsorption occurs at 700mV the
mass loading on the crystal after 60min is approximately lOOng, which
corresponds to an adsorbed amount of ~5.2mg m"2. At -800mV, the mass loading
was ~40.0ng which corresponds to an adsorbed amount of -2.1 m g m" .
75
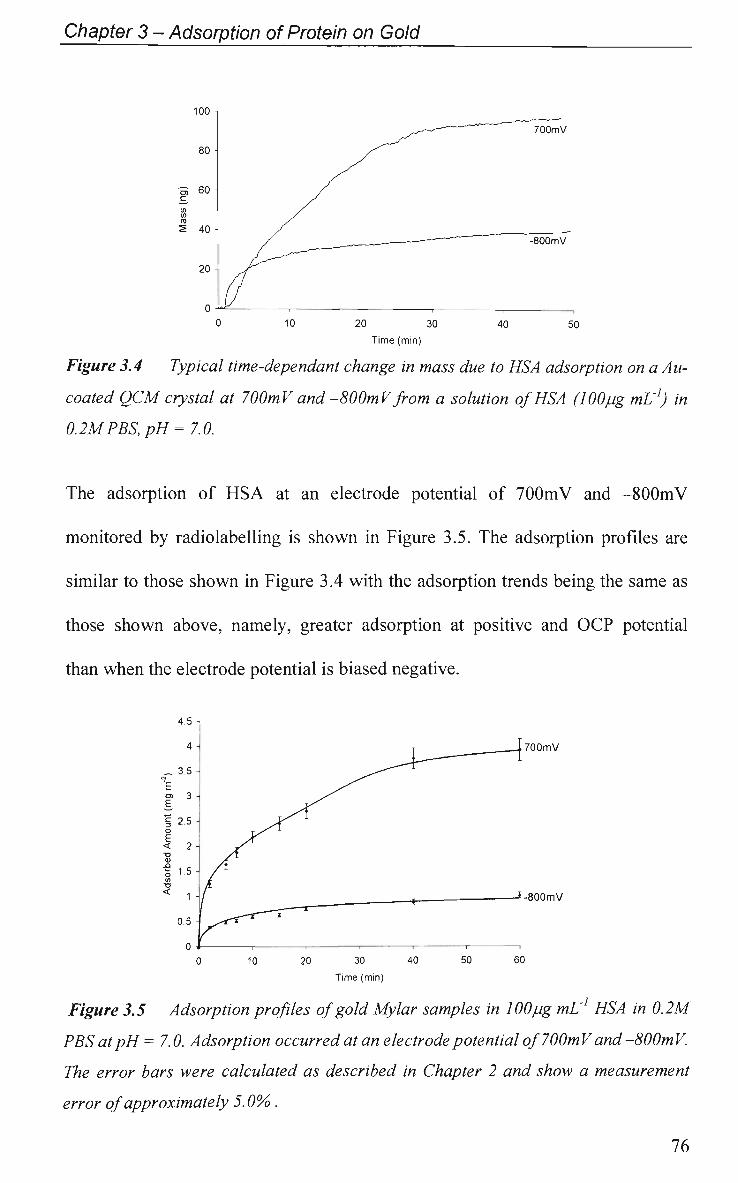
Chapter 3 - Adsorption of Protein on Gold
100 -i
0 10 20 30 40 50
Time (min)
Figure 3.4 Typical time-dependant change in mass due to HSA adsorption on a Au-
coated QCM crystal at 700mV and SOOmV from a solution of HSA (100pg mL'1) in
0.2MPBS,pH=7.0.
The adsorption of HSA at an electrode potential of 700mV and -800mV
monitored by radiolabelling is shown in Figure 3.5. The adsorption profiles are
similar to those shown in Figure 3.4 with the adsorption trends being the same as
those shown above, namely, greater adsorption at positive and OCP potential
than when the electrode potential is biased negative.
700mV
*-800mV
0 *— —i— —i— —
0 10 20 30 40 50 60
Time (min)
Figure 3.5 Adsorption profiles of gold Mylar samples in 100 pg mL HSA in 0.2M
PBS at pH = 7.0. Adsorption occurred at an electrode potential of 7 OOmV and SOOmV.
The error bars were calculated as described in Chapter 2 and show a measurement
error of approximately 5.0%.
76
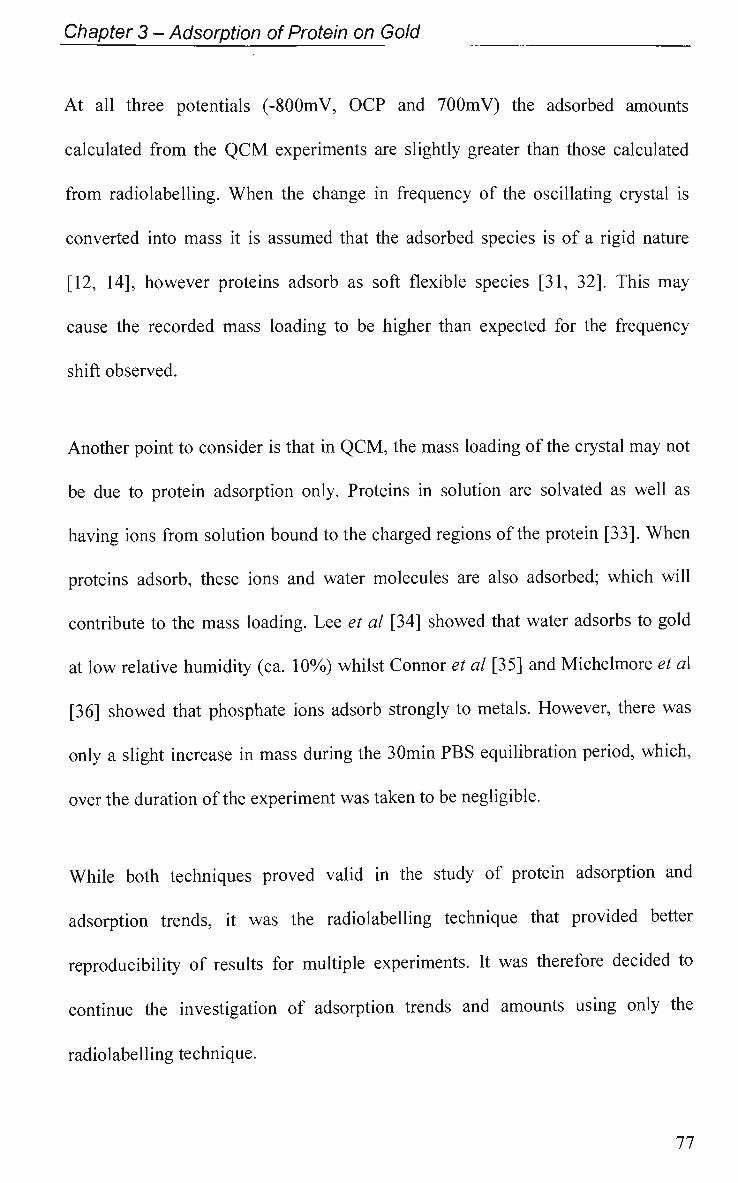
Chapter 3 - Adsorption of Protein on Gold
At all three potentials (-800mV, OCP and 700mV) the adsorbed amounts
calculated from the QCM experiments are slightly greater than those calculated
from radiolabelling. When the change in frequency of the oscillating crystal is
converted into mass it is assumed that the adsorbed species is of a rigid nature
[12, 14], however proteins adsorb as soft flexible species [31, 32]. This may
cause the recorded mass loading to be higher than expected for the frequency
shift observed.
Another point to consider is that in QCM, the mass loading of the crystal may not
be due to protein adsorption only. Proteins in solution are solvated as well as
having ions from solution bound to the charged regions of the protein [33]. When
proteins adsorb, these ions and water molecules are also adsorbed; which will
contribute to the mass loading. Lee et al [34] showed that water adsorbs to gold
at low relative humidity (ca. 10%) whilst Connor et al [35] and Michelmore et a\
[36] showed that phosphate ions adsorb strongly to metals. However, there was
only a slight increase in mass during the 30min PBS equilibration period, which,
over the duration of the experiment was taken to be negligible.
While both techniques proved valid in the study of protein adsorption and
adsorption trends, it was the radiolabelling technique that provided better
reproducibility of results for multiple experiments. It was therefore decided to
continue the investigation of adsorption trends and amounts using only the
radiolabelling technique.
77
Chapter 3 - Adsorption of Protein on Gold
3.2.1.2 125l Radiolabelling
Figure 3.6 shows the adsorption profiles of Ig.G under various applied potential,
H S A results have been included for comparison. The increase in the amount
adsorbed with time can be equated to an increase in mass at the gold Q C M
crystal. It was observed that the application of 7 0 0 m V to the electrode resulted in
the greatest adsorbed amount for both proteins while the application of-800mV
resulted in the least amount. H S A is a highly charged molecule (z = -18) [37] at
physiological p H [38], therefore, adsorption at a positively charged surface will
be favored over a negatively charged surface, as observed in Figures 3.4 and 3.5.
Based on electrostatics, the result for Ig.G agrees with the H S A results, however
the pi (discussed below) for Ig.G is not as defined as for the H S A protein. The
exact pi of the polyclonal Ig.G antibody used for this work is unknown but it is
considered to be between p H = 5 and p H = 8.0 [39], therefore at p H = 7.0 the
overall charge on the Ig.G molecule is unknown although it can be assumed to be
near neutral.
Adsorption at negative applied potentials shows that Coulombic interactions
between the H S A or Ig.G and the gold surface do not dominate the adsorption
process. Norde and co-workers [40] observed adsorption of negatively charged
protein molecules at negatively charged surfaces. The overall adsorption process
may be considered to be the result of various processes:
> redistribution of charged groups,
> Van de Waals interactions between the protein and the sorbent, and
> structural rearrangement in the adsorbing protein molecule [41].
78
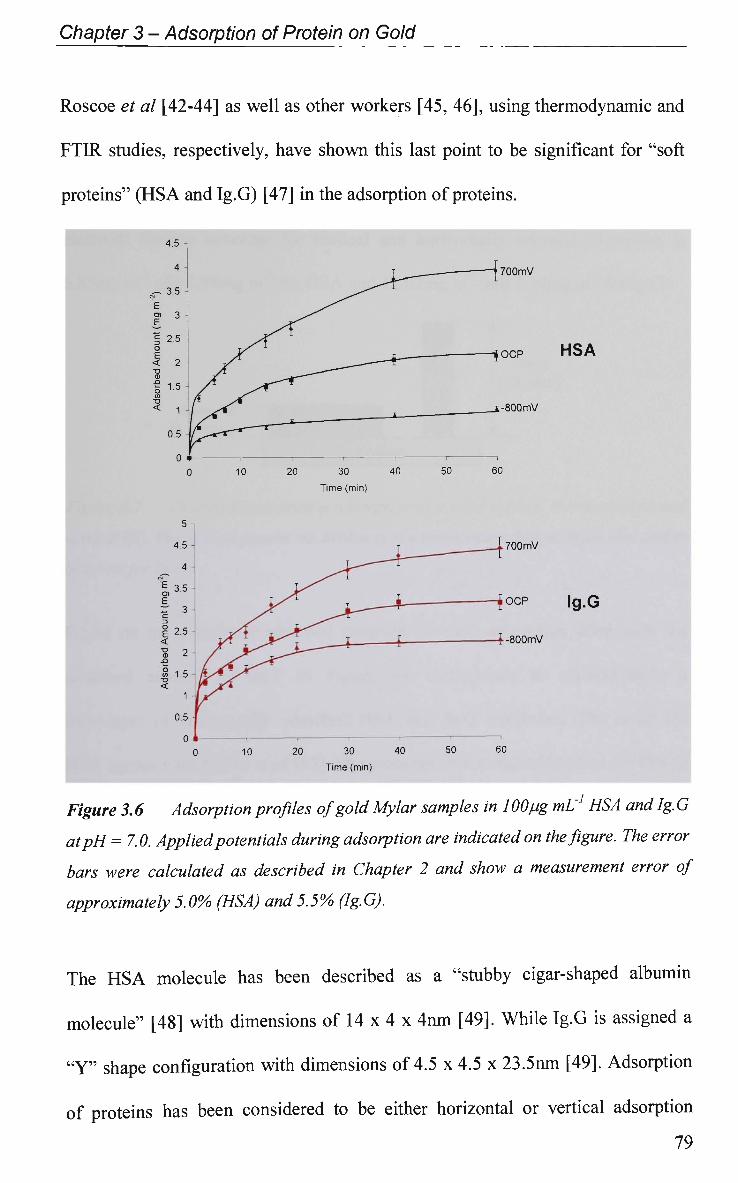
Chapter 3 - Adsorption of Protein on Gold
Roscoe et al [42-44] as well as other workers [45, 46], using thermodynamic and
FTIR studies, respectively, have shown this last point to be significant for "soft
proteins" (HSA and Ig.G) [47] in the adsorption of proteins.
Figure 3.6 Adsorption profiles of gold Mylar samples in 100pg mL HSA and lg. G
atpH = 7.0. Applied potentials during adsorption are indicated on the figure. The error
bars were calculated as described in Chapter 2 and show a measurement error of
approximately 5.0% (HSA) and5.5% (Ig.G).
The HSA molecule has been described as a "stubby cigar-shaped albumin
molecule" [48] with dimensions of 14 x 4 x 4nm [49]. While Ig.G is assigned a
"Y" shape configuration with dimensions of 4.5 x 4.5 x 23.5nm [49]. Adsorption
of proteins has been considered to be either horizontal or vertical adsorption
79
H S A
Ig.G
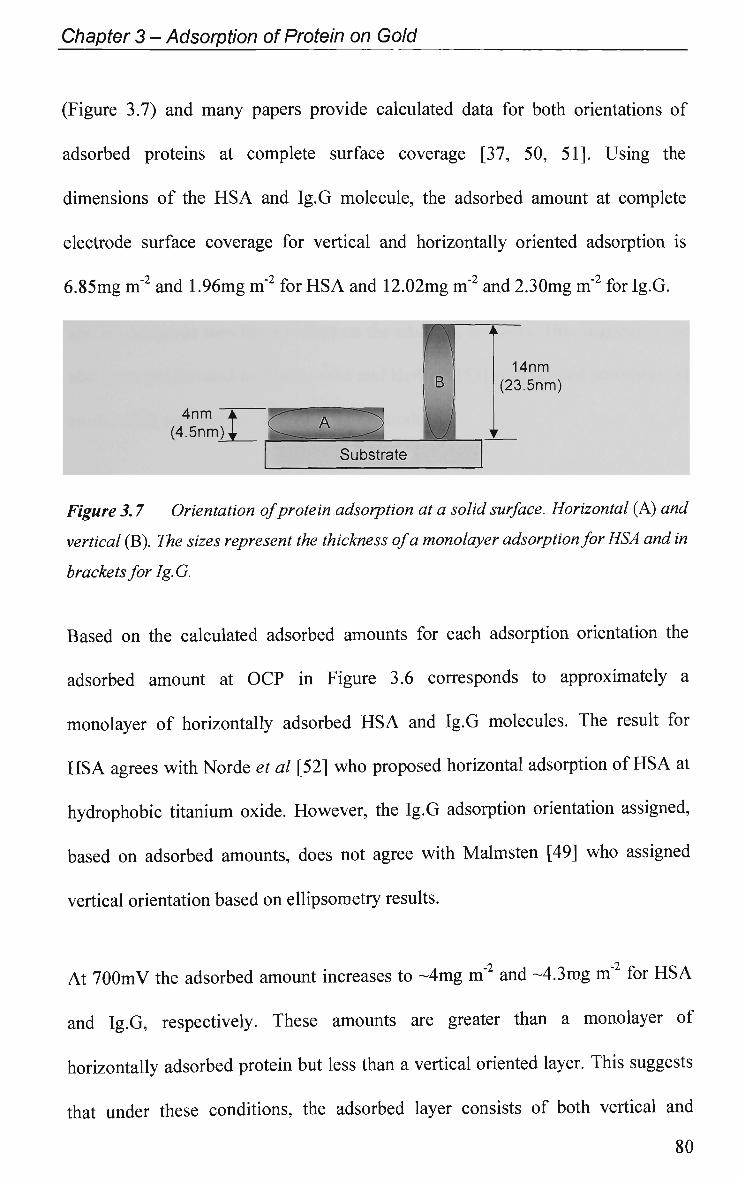
Chapter 3 - Adsorption of Protein on Gold
(Figure 3.7) and many papers provide calculated data for both orientations of
adsorbed proteins at complete surface coverage [37, 50, 51]. Using the
dimensions of the HSA and Ig.G molecule, the adsorbed amount at complete
electrode surface coverage for vertical and horizontally oriented adsorption is
6.85mg m"2 and 1.96mg m"2 for HSA and 12.02mg m"2 and 2.30mg m"2 for Ig.G.
A B
4nm ~K W~~~~~^~ (4.5
14nm (23.5nm)
Substrate
Figure 3.7 Orientation of protein adsorption at a solid surface. Horizontal (A) and
vertical (B). The sizes represent the thickness of a monolayer adsorption for HSA and in
brackets for lg. G
Based on the calculated adsorbed amounts for each adsorption orientation the
adsorbed amount at OCP in Figure 3.6 corresponds to approximately a
monolayer of horizontally adsorbed HSA and Ig.G molecules. The result for
HSA agrees with Norde et al [52] who proposed horizontal adsorption of HSA at
hydrophobic titanium oxide. However, the Ig.G adsorption orientation assigned,
based on adsorbed amounts, does not agree with Malmsten [49] who assigned
vertical orientation based on ellipsometry results.
At 7 0 0 m V the adsorbed amount increases to ~4mg m"2 and ~4.3mg m"2 for H S A
and Ig.G, respectively. These amounts are greater than a monolayer of
horizontally adsorbed protein but less than a vertical oriented layer. This suggests
that under these conditions, the adsorbed layer consists of both vertical and
80
Chapter 3 - Adsorption of Protein on Gold
horizontally adsorbed protein molecules. Finally the amount adsorbed at an
electrode potential of-800mV is less than one horizontally oriented monolayer at
~1.2mg m"2 for HSA while for Ig.G the adsorbed amount is equal to a monolayer
of horizontally adsorbed protein at ~2.4mg m"2. These results suggest that the
nature of the electrode potential has an effect on the orientation of the adsorbing
species, which in turn has an effect on the adsorbed amounts. This suggestion has
also been put forward by Slojkowska and Herbich [53] who studied adsorption of
amino acids on a polycrystalline gold electrode.
The adsorbed amount for HSA and Ig.G under OCP at a gold electrode at
pseudo-plateau saturation (ca. 60min) was found to be ~2.0mg m"2 and ~2.5mg
m , respectively. The HSA adsorbed amount is very similar to the value obtained
using QCM (Figure 3.2). Sessile drop contact angle measurements of the gold
Mylar substrate, were 64° for the polar drop and 49° for the non-polar drop,
indicating the surface to be more hydrophobic in nature than hydrophilic. Lensen
et al [54] and Malmsten [30] have studied the adsorption of HSA at hydrophobic
surfaces, with the results presented here agreeing with their findings. Malmsten
was able to calculate this adsorbed amount to equate to a mean optical film
thickness of 4 ± 2nm, which corresponds to a monolayer of horizontally adsorbed
HSA molecules. In another study Malmsten [49] showed the adsorbed amount of
Ig.G at saturation to be -3.0 mg m"2, which also agrees with the above findings.
Malmsten assigned a vertical adsorption orientation of the Ig.G molecule.
81
Chapter 3 - Adsorption of Protein on Gold
While the adsorbed layer has been considered to consist of either vertical or
horizontally adsorbed protein molecules, it is obvious that is not the case. In most
instances the adsorbed layer comprises of a mixture of both orientations,
although there is evidence to suggest that one preferred orientation dominates at
all times. To gain a better insight into the nature of the adsorbed protein the use
of a complementary technique such as ellipsometry, which provides information
on the adsorbed layer thickness, would be desirable. Ellipsometry was performed
for this work, however due to the instrument being a fixed angle system and the
substrate being gold which had a non-uniform morphology no meaningful results
were obtained.
So far only the charge on the substrate has been investigated. It is well known
that the charge on the protein has a significant effect on the adsorption processes
[10, 51, 55] and one way to vary the charge on the protein is to vary the protein
pH about its pi.
3.2.1.2.1 Effect of pH
Changing the pH of the protein had a dramatic effect on the adsorption
characteristics at OCP (Figure 3.8). The pi of HSA is at pH = 4.6, therefore at pH
= 3.0 the protein charge is positive and at pH =7.0 and 10.0 it is negative. Unlike
HSA the pi for Ig.G lies between pH = 6.0 and pH = 8.0, however by choosing
pH = 3.0 and 10.0, which is outside this range, the charge on the Ig.G molecule
will be varied in accordance with HSA. As well as changing the protein charge
by varying the solution pH, the interfacial environment between the electrode
82
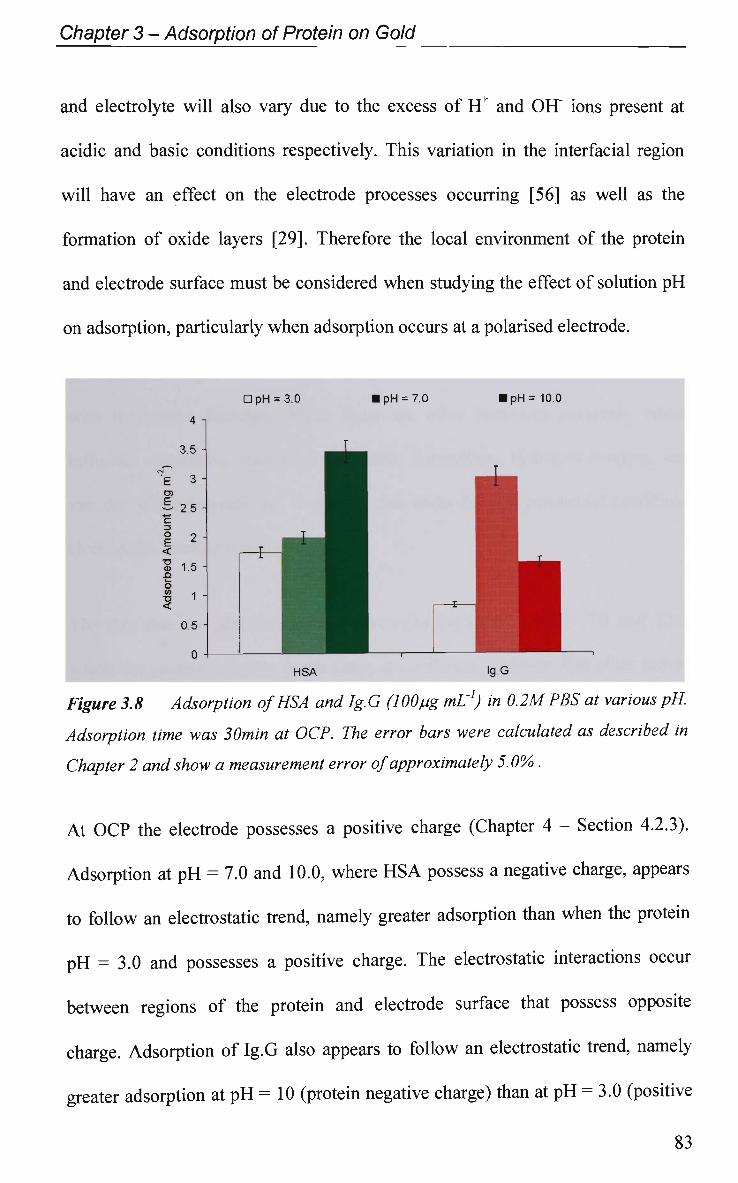
Chapter 3 - Adsorption of Protein on Gold
and electrolyte will also vary due to the excess of H+ and OH" ions present at
acidic and basic conditions respectively. This variation in the interfacial region
will have an effect on the electrode processes occurring [56] as well as the
formation of oxide layers [29]. Therefore the local environment of the protein
and electrode surface must be considered when studying the effect of solution p H
on adsorption, particularly when adsorption occurs at a polarised electrode.
Figure 3.8 Adsorption of HSA and lg G (100 pg mL1) in 0.2M PBS at various pH.
Adsorption time was 30min at OCP. The error bars were calculated as described in
Chapter 2 and show a measurement error of approximately 5.0% .
At OCP the electrode possesses a positive charge (Chapter 4 - Section 4.2.3).
Adsorption at p H = 7.0 and 10.0, where H S A possess a negative charge, appears
to follow an electrostatic trend, namely greater adsorption than when the protein
p H = 3.0 and possesses a positive charge. The electrostatic interactions occur
between regions of the protein and electrode surface that possess opposite
charge. Adsorption of Ig.G also appears to follow an electrostatic trend, namely
greater adsorption at p H = 10 (protein negative charge) than at p H = 3.0 (positive
83
Chapter 3 - Adsorption of Protein on Gold
protein charge). Adsorption at pH = 7.0 however shows greater adsorption than
at pH = 10.0 which is opposite to the HSA adsorption results at the same pH.
Several authors have observed a maximum in the amount of Ig.G adsorbed with
pH, and indicate that it is due to the decrease in conformational stability of the
Ig.Gs with increasing net charge on the molecule [39]. Galisteo-Gonzalez et al
[57] showed that as the pH increased from pH = 7.0 to 10.0 the extent of Ig.G
adsorption at a positively charges polystyrene surface decreased, which agrees
with the above findings. While there are other processes occurring which
influence adsorption, such as hydrophobic interactions, hydrogen bonding, and
van der Waals interactions, it appears that under OCP experimental conditions
electrostatic interactions dominate.
The fact that the adsorbed amounts recorded for HSA at pH = 7.0 and 10.0,
where the protein's charge is the same, are different, indicates that other factors
are involved in the adsorption process. This is also true for Ig.G. As well as
altering the protein's charge in solution, varying the pH has also been shown to
alter the level to which native-state proteins undergo structural alterations upon
adsorption to solid surfaces [58]. Norde concluded from his work that structural
rearranging upon adsorption to solid surface increase the further the protein pH is
moved from its pi. The results presented in Figure 3.8 highlights the complex
nature of protein adsorption at solid surfaces. Haynes and Norde [55] suggest that
this complex dependence of adsorbed amounts on pH arises from increased
lateral electrostatic repulsions between charged proteins on the surface
preventing the formation of close packed protein layers. This, in turn, creates
84
Chapter 3 - Adsorption of Protein on Gold
competition between protein-protein and protein-surface electrostatic
interactions. This explanation has also been backed up by experimental evidence
from Shastri and Roe [59].
3.2.1.2.2 Protein Removal
Much of the published work in the area of adsorbed protein removal comes from
the food industry, in particular the dairy industry [60-66]. The cleaning of
processing equipment is important in maintaining the high quality and sterility of
products. The cleaning and disinfection process is also crucial in avoiding cross
contamination in the medical industry. Whilst ultraviolet treatment in
conjunction with autoclaving are the preferred method for sterilisation [67] not
much has been published in the area of protein removal in the medical industry.
To evaluate the effectiveness of a cleaning procedure used in clinical trials in
conjunction with TruScan™ a range of chemically different media to remove
bound protein was investigated. For this work, only the Ig.G protein was used
due to this protein being present in cervical mucus, which contributes to the
fouling of the TruScan™ probe tip.
The removal of adsorbed protein from the gold electrode was investigated. Based
on previously published work, four cleaning solutions were chosen 8.0M HN03,
1.0M NaOH, 0.1M SDS (sodium dodecylsulphonate) and 0.6% v/v Medizyme
solution. Timperley et al [68] reported the use of nitric acid in the two stage
cleaning process used in the dairy industry, whilst Karlsson et al [61] reported
85
Chapter 3 - Adsorption of Protein on Gold
the use of sodium hydroxide and the surfactant SDS to remove |3-lactoglobulin
from stainless steel. The procedure used for the cleaning and disinfecting of
TruScan™ involves the use of the 0.6% Medizyme solution (unpublished report).
The first treatment was a chemical cleaning process that involved immersing the
protein pre-adsorbed electrodes in one of the cleaning solution for various
lengths of time. In all cases the gold sample was immersed in a solution of 1:100
hot to cold protein solution for 30min at OCP, pH = 7.0. After this time the
samples were ycounted and the adsorbed amounts calculated. These samples
were then treated for various lengths of time with the cleaning solutions
mentioned above. After the cleaning process each sample was rinsed with Milli-
Q water and allowed to dry at room temperature. The radioactivity of the samples
was then measured and the amount of protein remaining was calculated.
The cleaning and disinfecting process used for TruScan™ also involved a
mechanical cleaning step involving the use of a hard bristle brush, soaked in
Medizyme. To investigate the effectiveness of the scrubbing procedure in
removing bound protein a second cleaning treatment incorporating a mechanical
step with the chemical treatment was used. After an initial soak in the cleaning
solutions for 5min, each sample was scrubbed using the same solution for 5min.
Following the scrubbing the samples were rinsed with Milli-Q water and left to
dry at room temperature followed by measurement of radioactivity.
86
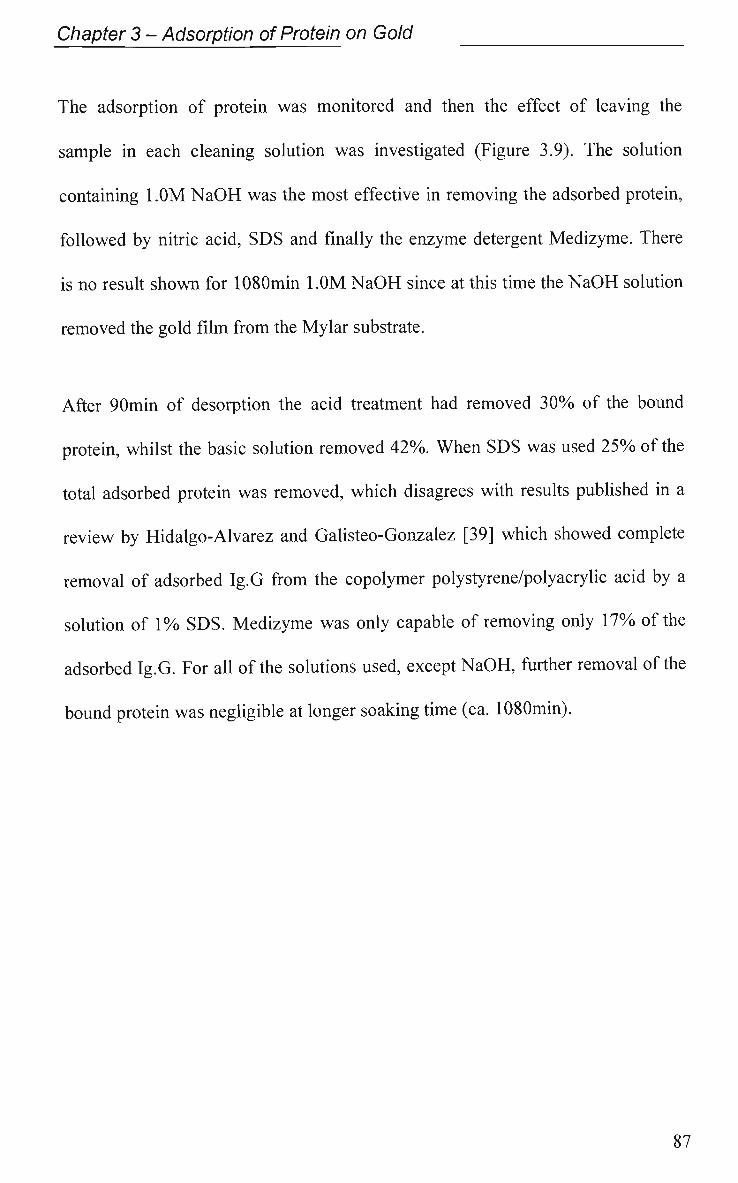
Chapter 3 - Adsorption of Protein on Gold
The adsorption of protein was monitored and then the effect of leaving the
sample in each cleaning solution was investigated (Figure 3.9). The solution
containing 1 .OM NaOH was the most effective in removing the adsorbed protein,
followed by nitric acid, SDS and finally the enzyme detergent Medizyme. There
is no result shown for 1080mm 1.0M NaOH since at this time the NaOH solution
removed the gold film from the Mylar substrate.
After 90min of desorption the acid treatment had removed 30% of the bound
protein, whilst the basic solution removed 42%. When SDS was used 25% of the
total adsorbed protein was removed, which disagrees with results published in a
review by Hidalgo-Alvarez and Galisteo-Gonzalez [39] which showed complete
removal of adsorbed Ig.G from the copolymer polystyrene/polyacrylic acid by a
solution of 1% SDS. Medizyme was only capable of removing only 17% of the
adsorbed Ig.G. For all of the solutions used, except NaOH, further removal of the
bound protein was negligible at longer soaking time (ca. 1080min).
87
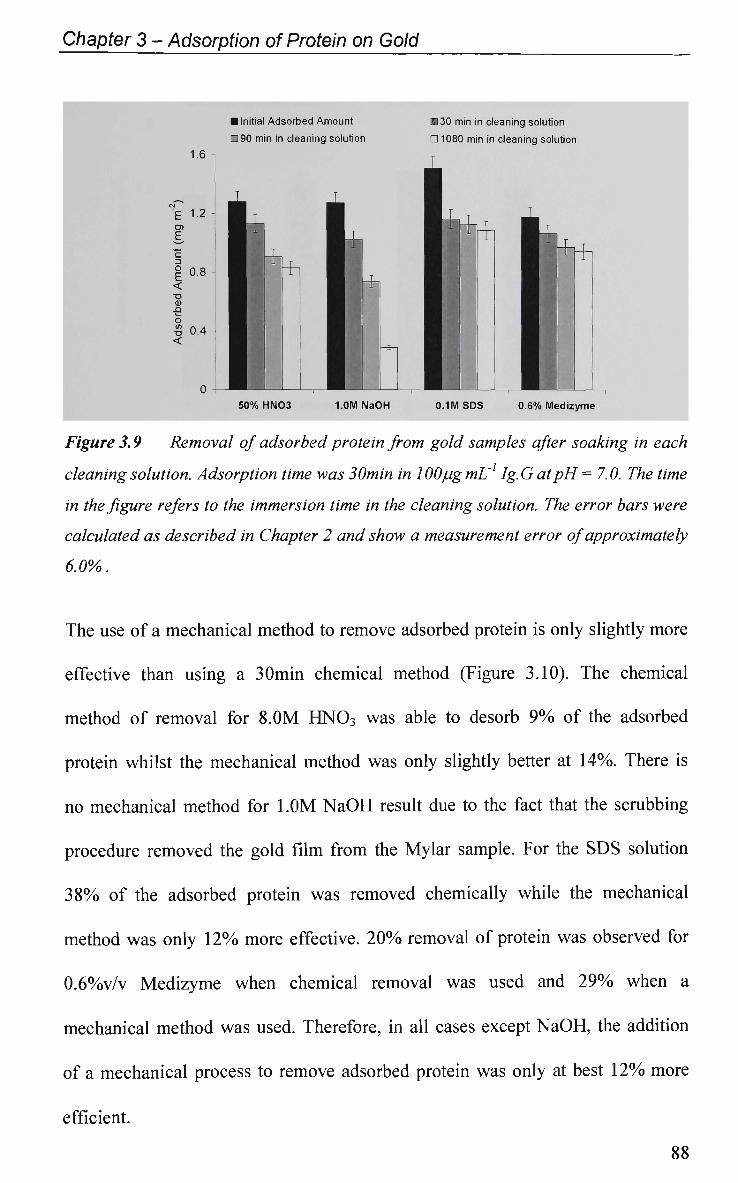
Chapter 3 - Adsorption of Protein on Gold
• Initial Adsorbed Amount
D 9 0 min in cleaning solution
•130 min in cleaning solution
Q 1 0 8 0 min in cleaning solution
1.6
u
50% HN03 1.0M NaOH 0.1MSDS 0.6% Medizyme
Figure 3.9 Removal of adsorbed protein from gold samples after soaking in each
cleaning solution. Adsorption time was 30min in lOOpgmL Ig.G at pH = 7.0. The time
in the figure refers to the immersion time in the cleaning solution. The error bars were
calculated as described in Chapter 2 and show a measurement error of approximately
6.0%.
The use of a mechanical method to remove adsorbed protein is only slightly more
effective than using a 30min chemical method (Figure 3.10). The chemical
method of removal for 8.0M H N 0 3 was able to desorb 9 % of the adsorbed
protein whilst the mechanical method was only slightly better at 14%. There is
no mechanical method for 1.0M N a O H result due to the fact that the scrubbing
procedure removed the gold film from the Mylar sample. For the S D S solution
3 8 % of the adsorbed protein was removed chemically while the mechanical
method was only 1 2 % more effective. 2 0 % removal of protein was observed for
0.6%v/v Medizyme when chemical removal was used and 2 9 % when a
mechanical method was used. Therefore, in all cases except N a O H , the addition
of a mechanical process to remove adsorbed protein was only at best 1 2 % more
efficient.
88
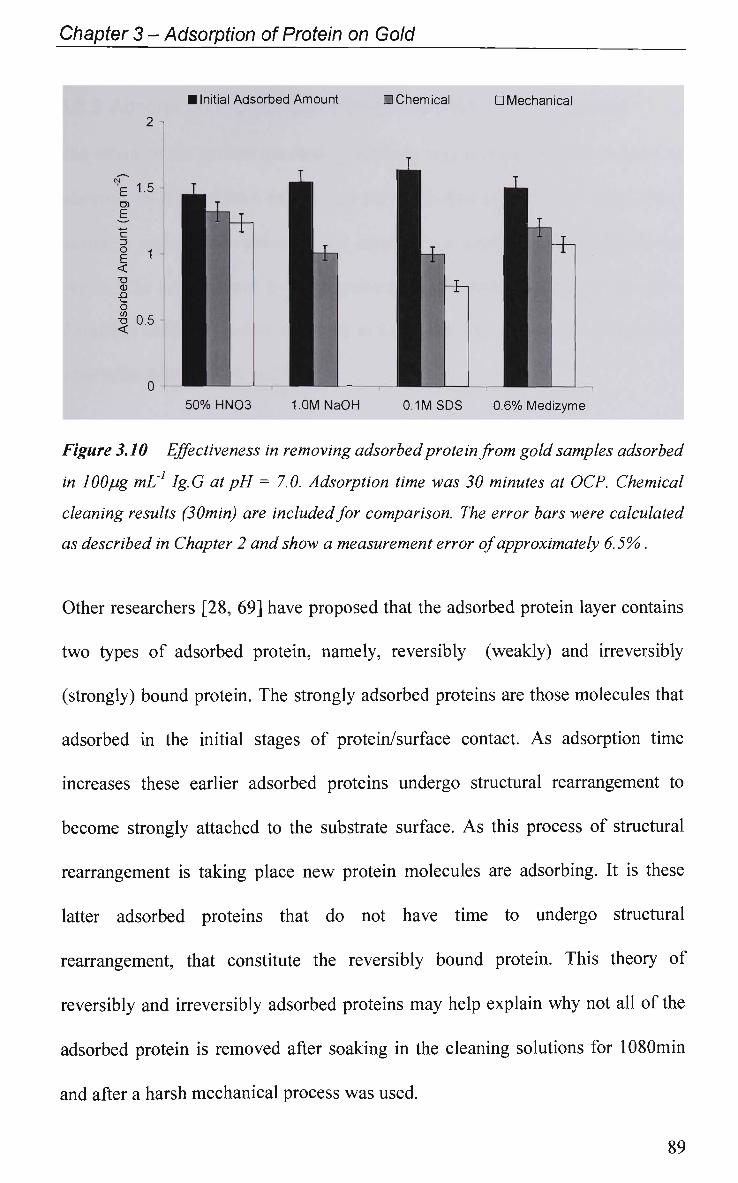
Chapter 3 - Adsorption of Protein on Gold
2 -i
CM
E 1-5
E
Amount
Adsorbed
o
en
n
• Initial Adsorbed Amount
r 1 1
50% HN03 LOMNaOH
• Chemical
•
ll
r • ~t~
0.1MSDS
D Mechanical
aL
1, |
1 l 0.6% Medizyme
Figure 3.10 Effectiveness in removing adsorbed protein from gold samples adsorbed
in 100pg mL Ig.G at pH = 7.0. Adsorption time was 30 minutes at OCP. Chemical
cleaning results (30min) are included for comparison. The error bars were calculated
as described in Chapter 2 and show a measurement error of approximately 6.5% .
Other researchers [28, 69] have proposed that the adsorbed protein layer contains
two types of adsorbed protein, namely, reversibly (weakly) and irreversibly
(strongly) bound protein. The strongly adsorbed proteins are those molecules that
adsorbed in the initial stages of protein/surface contact. A s adsorption time
increases these earlier adsorbed proteins undergo structural rearrangement to
become strongly attached to the substrate surface. A s this process of structural
rearrangement is taking place new protein molecules are adsorbing. It is these
latter adsorbed proteins that do not have time to undergo structural
rearrangement, that constitute the reversibly bound protein. This theory of
reversibly and irreversibly adsorbed proteins may help explain why not all of the
adsorbed protein is removed after soaking in the cleaning solutions for 1080min
and after a harsh mechanical process was used.
89
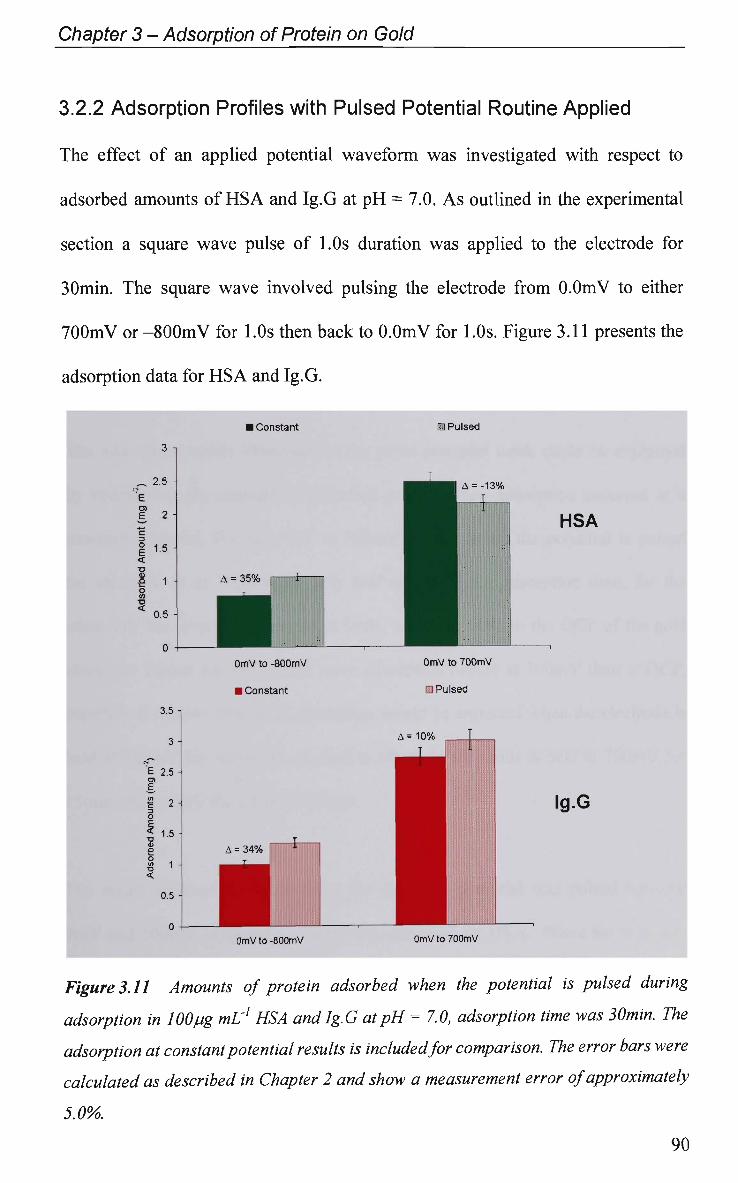
Chapter 3 - Adsorption of Protein on Gold
3.2.2 Adsorption Profiles with Pulsed Potential Routine Applied
The effect of an applied potential waveform was investigated with respect to
adsorbed amounts of H S A and Ig.G at p H = 7.0. A s outlined in the experimental
section a square wave pulse of 1.0s duration was applied to the electrode for
30min. The square wave involved pulsing the electrode from O.OmV to either
7 0 0 m V or - 8 0 0 m V for 1.0s then back to O.OmV for 1.0s. Figure 3.11 presents the
adsorption data for H S A and Ig.G.
%
HSA
Ig.G
Figure 3.11 Amounts of protein adsorbed when the potential is pulsed during
adsorption in 100pg mL1 HSA and Ig.G at pH = 7.0, adsorption time was 30min. The
adsorption at constant potential results is included for comparison. The error bars were
calculated as described in Chapter 2 and show a measurement error of approximately
5.0%.
90
I Constant ] Pulsed
3 -\
2.5 -
E
I 1-5
0.5
3.5
3 -
E 2.5 o> E
I 2
I 1-5 v
! <
0.5
A = 35%
OmV to -800mV
• Constant
OmV to 700mV
m Pulsed
•
-
A = 34%
1 1 T 1 :::
A = 10% I - I 1
OmV to -800mV OmV to 700mV
Chapter 3 - Adsorption of Protein on Gold
From the results outlined above more adsorption occurs when a positive potential
is applied to the electrode and less adsorption occurs at negative potentials. When
the electrode potential is pulsed between 0 and 700mV less adsorption of HSA
occurs than when the potential is constant at 700mV. For Ig.G this trend is
reversed. When the electrode potential is pulsed between 0 and -800mV the
adsorbed amount is greater for both HSA and Ig.G compared to when the
potential is kept constant at -800mV.
The adsorption trends observed for the pulse potential work could be explained
by considering the amount of adsorbed protein when adsorption occurred at a
constant potential. For the OmV to 700mV results, when the potential is pulsed
the electrode is at 700mV for only half of the 30min adsorption time, for the
other half the electrode potential is OmV, which is close to the OCP of the gold
electrode. Figure 3.6 shows that more adsorption occurs at 700mV than at OCP,
therefore it follows that more adsorption would be expected when the electrode is
held at 700mV for 30min as opposed to when the electrode is held at 700mV for
15min and at OmV for a further 15min.
The result obtained for Ig.G when the electrode potential was pulsed between
OmV and 700mV is opposite to what was observed for HSA. When the electrode
was pulsed between OmV and 700mV the amount of adsorbed Ig.G was greater
than when the electrode was held constant at 700mV. This result may be
explained by considering the electrode surface net charge at OmV and 700mV,
where the net positive charge at 700mV will be greater than at OmV (see
91
Chapter 3 - Adsorption of Protein on Gold
equation 4.2). Other workers have shown that the adsorption mechanism for Ig.G
is relatively unstable and is easily affected by external influences, such as sorbent
surface charge [70] and ionic strength [39, 71]. Therefore the rapid change in the
magnitude of the surface charge may influence the adsorption mechanism of Ig.G
which may account for the observed variation.
At an electrode potential of -800mV more adsorption for both HSA and Ig.G
was observed when the potential was pulsed. As above, this result can be
explained by the fact that more adsorption occurs at OCP than at -800mV for
both HSA and Ig.G (Figure 3.6). When the electrode is held at -800mV for
30min, less adsorption will occur compared to when the electrode potential is
held-800mV for 15min and OmV for the remaining 15min.
Both HSA and Ig.G are "soft" proteins, which means they have low internal
stability and generally tend to adsorb on all surfaces irrespective of electrostatic
interactions [72]. Due to this low internal stability, these proteins upon
adsorption on hydrophobic surfaces change their conformation to a great extent.
A consequence of protein structure rearrangement (unfolding) is, that the once
buried hydrophobic peptide moiety is now exposed. These hydrophobic peptides
are now free to assemble and interact with the hydrophobic regions of the
surface, resulting in a multi-point attachment with more interacting points. As
adsorption time is increased, more of the "soft" protein can unfold, in turn
creating more attachment sites. This protein unfolding and increased attachment
has been used to help explain irreversible adsorption.
92
Chapter 3 - Adsorption of Protein on Gold
3.2.3 EIS Study - Protein Adsorption Kinetics
The adsorption kinetics of the protein Ig.G was investigated using the
electrochemical impedance spectroscopy technique. Only Ig.G was used since
this protein was the main protein of interest due to its presence in cervical mucus.
To ensure that observable variations in the impedance spectra were obtained, the
concentration of the protein used for this work was increased 10 fold, from
lOOug mL"1 to lOOOug mL"1. Bernabeu et al [28, 73] have used similar protein
concentration in their work using electrochemical impedance spectroscopy to
study the adsorption of fibrinogen and albumin at conducting metal surfaces.
When the impedance was recorded at 1000Hz in a solution of lOOOug mL"1 Ig.G
(pH = 7.0) the change in Cdi could be monitored (Figure 3.12). There appears to
be two regions where the rate at which the Cdi decay varies, one for the first
lOmin of adsorption and another from lOmin to 30min adsorption. Bernabeu [28]
associated these regions with various modes of protein adsorption, namely the
formation of an irreversible layer during the first lOmin of contact followed by
the formation of a reversible layer at longer contact times. The shape of the
capacitance decay appears to be the reciprocal of protein adsorption shown in
Figure 3.6, where complete surface saturation occurs at approximately 60min.
The plateau region in Figure 3.12 has been attributed to saturation of the
electrode surface by the adsorbing protein [28]. The reason surface saturation
occurs within lOmin of adsorption, whereas in Figure 3.5 this saturation did not
93
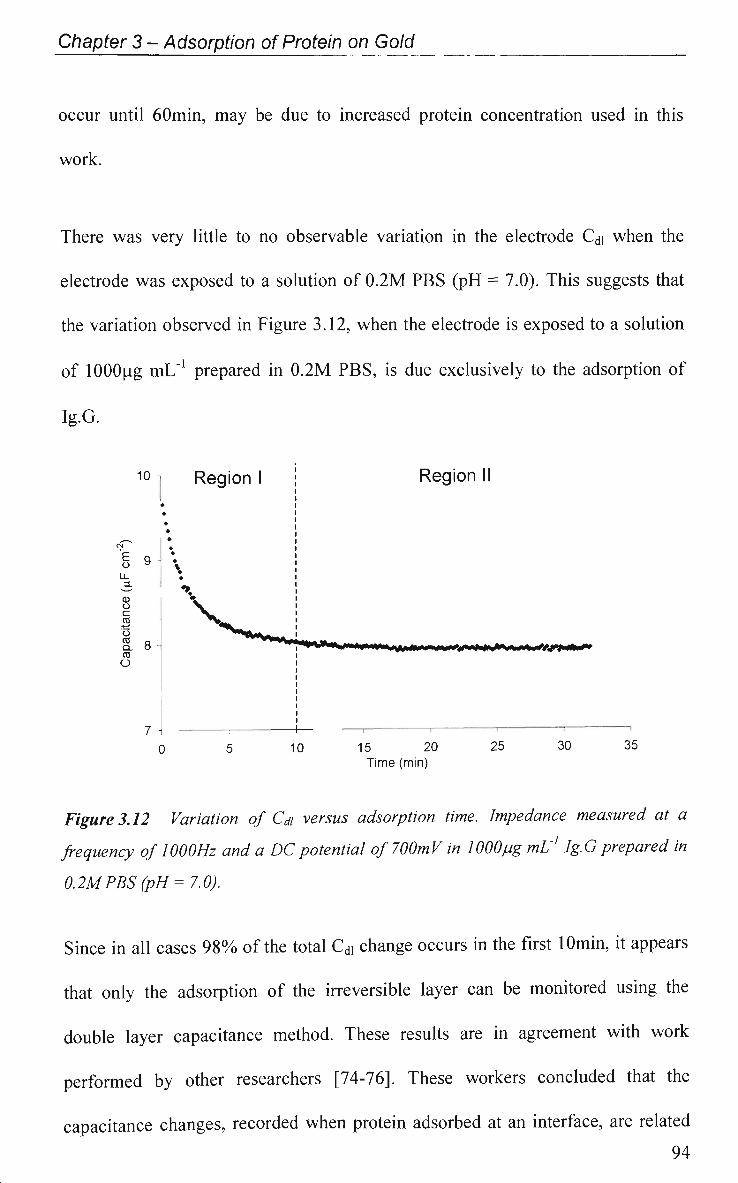
Chapter 3 - Adsorption of Protein on Gold
occur until 60min, may be due to increased protein concentration used in this
work.
There was very little to no observable variation in the electrode Cdi when the
electrode was exposed to a solution of 0.2M PBS (pH = 7.0). This suggests that
the variation observed in Figure 3.12, when the electrode is exposed to a solution
of lOOOpg mL"1 prepared in 0.2M PBS, is due exclusively to the adsorption of
Ig.G.
10 ] Region I
§ 9
O c ro o ro Q
ro O
V
10
Region II
><»»<*#»«M'«'W»»»«»V»»WW</^»I<»»II>»
15 20 Time (min)
25 30 35
Figure 3.12 Variation of Cdi versus adsorption time. Impedance measured at a
frequency of 1000Hz and a DC potential of 700mV in 1000pg mL1 Ig.G prepared in
0.2MPBS (pH = 7.0).
Since in all cases 98% of the total Cdi change occurs in the first lOmin, it appears
that only the adsorption of the irreversible layer can be monitored using the
double layer capacitance method. These results are in agreement with work
performed by other researchers [74-76]. These workers concluded that the
capacitance changes, recorded when protein adsorbed at an interface, are related
94
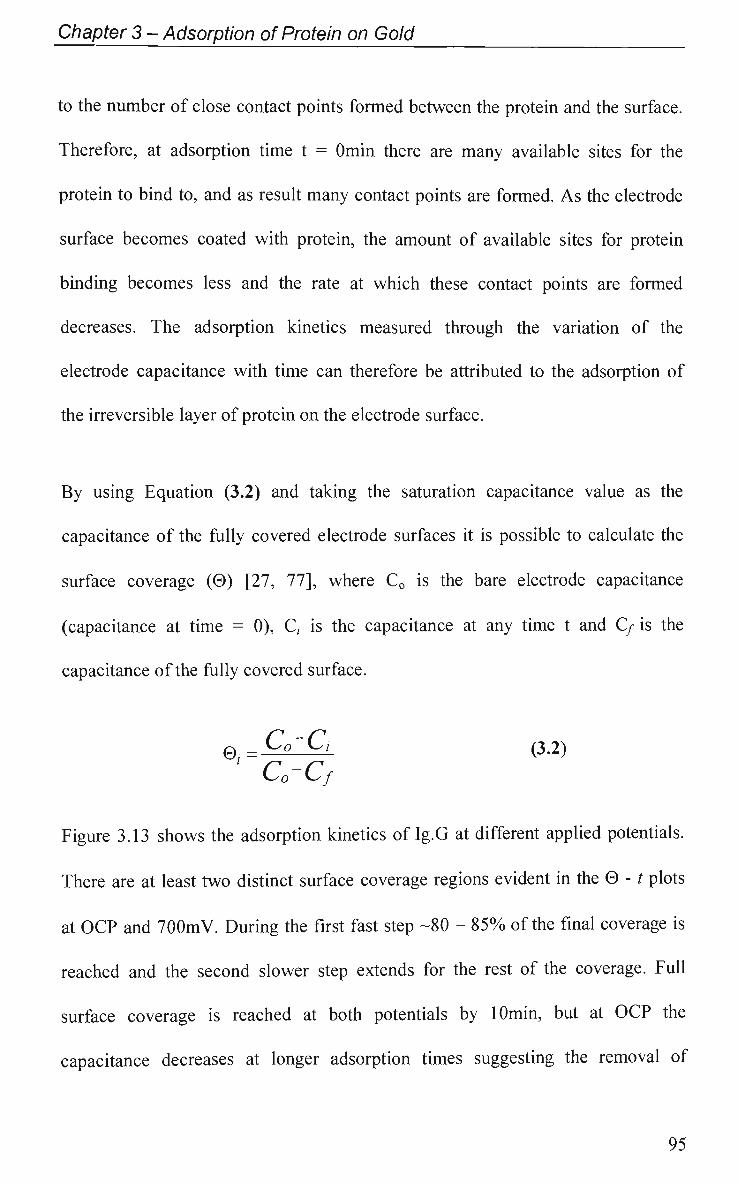
Chapter 3 - Adsorption of Protein on Gold
to the number of close contact points formed between the protein and the surface.
Therefore, at adsorption time t = Omin there are many available sites for the
protein to bind to, and as result many contact points are formed. As the electrode
surface becomes coated with protein, the amount of available sites for protein
binding becomes less and the rate at which these contact points are formed
decreases. The adsorption kinetics measured through the variation of the
electrode capacitance with time can therefore be attributed to the adsorption of
the irreversible layer of protein on the electrode surface.
By using Equation (3.2) and taking the saturation capacitance value as the
capacitance of the fully covered electrode surfaces it is possible to calculate the
surface coverage (0) [27, 77], where C0 is the bare electrode capacitance
(capacitance at time = 0), C, is the capacitance at any time t and C/ is the
capacitance of the fully covered surface.
0,. = Co~Cl (3-2)
Co'Cf
Figure 3.13 shows the adsorption kinetics of Ig.G at different applied potentials.
There are at least two distinct surface coverage regions evident in the 0 - t plots
at OCP and 700mV. During the first fast step -80 - 85% of the final coverage is
reached and the second slower step extends for the rest of the coverage. Full
surface coverage is reached at both potentials by lOmin, but at OCP the
capacitance decreases at longer adsorption times suggesting the removal of
95
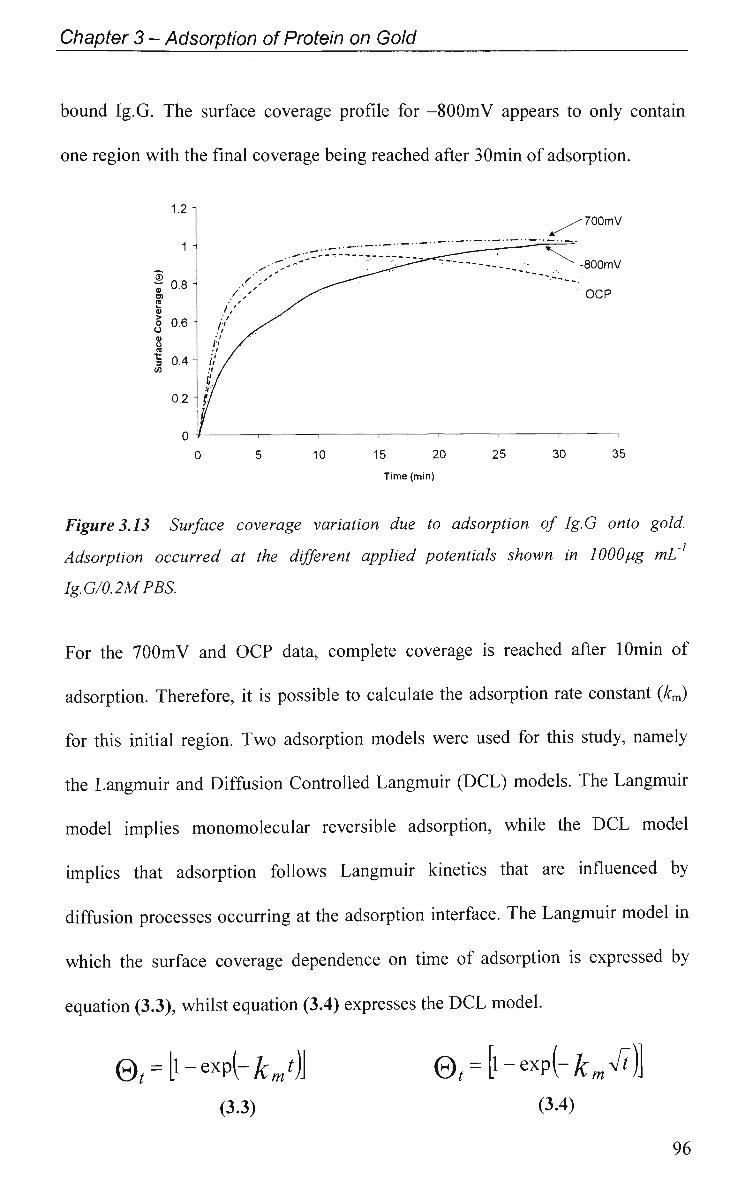
Chapter 3 - Adsorption of Protein on Gold
bound Ig.G. The surface coverage profile for -800mV appears to only contain
one region with the final coverage being reached after 30min of adsorption.
700mV
10 15 20
Time (min)
25 30 35
Figure 3.13 Surface coverage variation due to adsorption of Ig.G onto gold.
Adsorption occurred at the different applied potentials shown in 1000pg mL
Ig.G/0.2M PBS.
For the 7 0 0 m V and O C P data, complete coverage is reached after lOmin of
adsorption. Therefore, it is possible to calculate the adsorption rate constant (km)
for this initial region. T w o adsorption models were used for this study, namely
the Langmuir and Diffusion Controlled Langmuir (DCL) models. The Langmuir
model implies monomolecular reversible adsorption, while the D C L model
implies that adsorption follows Langmuir kinetics that are influenced by
diffusion processes occurring at the adsorption interface. The Langmuir model in
which the surface coverage dependence on time of adsorption is expressed by
equation (3.3), whilst equation (3.4) expresses the D C L model.
0,4-expl-£„/)J (3.3)
@,4-exp(-£mV7) (3.4)
96
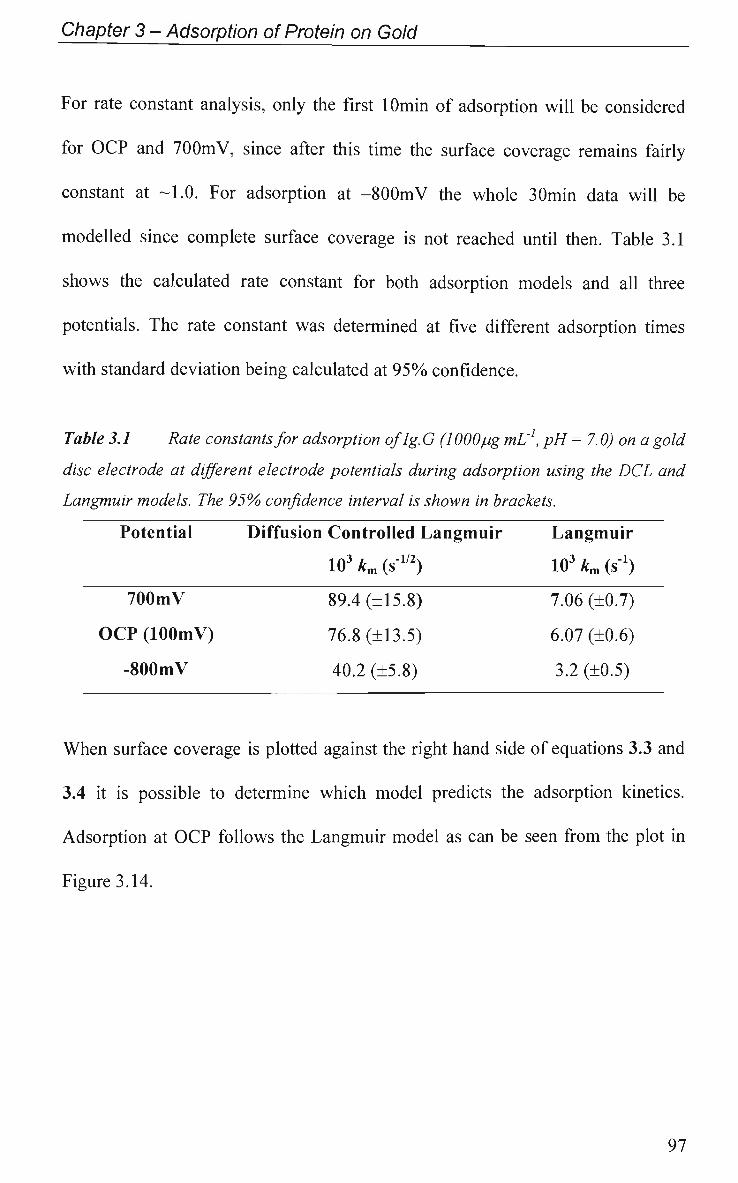
Chapter 3 - Adsorption of Protein on Gold
For rate constant analysis, only the first lOmin of adsorption will be considered
for O C P and 700mV, since after this time the surface coverage remains fairly
constant at -1.0. For adsorption at -800mV the whole 30min data will be
modelled since complete surface coverage is not reached until then. Table 3.1
shows the calculated rate constant for both adsorption models and all three
potentials. The rate constant was determined at five different adsorption times
with standard deviation being calculated at 9 5 % confidence.
Table 3.1 Rate constants for adsorption oflg. G (1000 pg mL1, pH = 7.0) on a gold
disc electrode at different electrode potentials during adsorption using the DCL and
Langmuir models. The 95% confidence interval is shown in brackets.
Potential
700mV
O C P (lOOmV)
-800mV
Diffusion Controlled Langmuir
103 km (sm)
89.4 (+15.8)
76.8 (+13.5)
40.2 (+5.8)
Langmuir
103 km (s1)
7.06 (+0.7)
6.07 (+0.6)
3.2 (+0.5)
When surface coverage is plotted against the right hand side of equations 3.3 and
3.4 it is possible to determine which model predicts the adsorption kinetics.
Adsorption at O C P follows the Langmuir model as can be seen from the plot in
Figure 3.14.
97
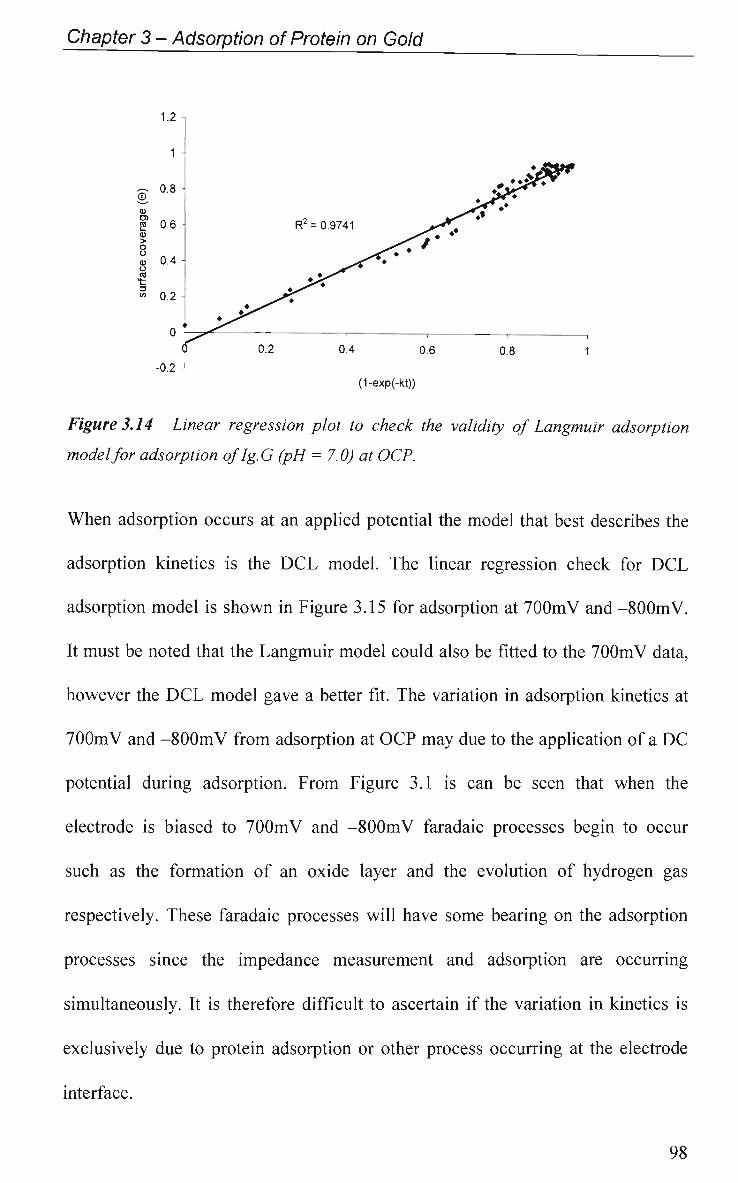
Chapter 3 - Adsorption of Protein on Gold
1.2 -,
Figure 3.14 Linear regression plot to check the validity of Langmuir adsorption
model for adsorption of Ig.G (pH = 7.0) at OCP.
When adsorption occurs at an applied potential the model that best describes the
adsorption kinetics is the DCL model. The linear regression check for DCL
adsorption model is shown in Figure 3.15 for adsorption at 700mV and -800mV.
It must be noted that the Langmuir model could also be fitted to the 700mV data,
however the DCL model gave a better fit. The variation in adsorption kinetics at
700mV and -800mV from adsorption at OCP may due to the application of a DC
potential during adsorption. From Figure 3.1 is can be seen that when the
electrode is biased to 700mV and -800mV faradaic processes begin to occur
such as the formation of an oxide layer and the evolution of hydrogen gas
respectively. These faradaic processes will have some bearing on the adsorption
processes since the impedance measurement and adsorption are occurring
simultaneously. It is therefore difficult to ascertain if the variation in kinetics is
exclusively due to protein adsorption or other process occurring at the electrode
interface.
98
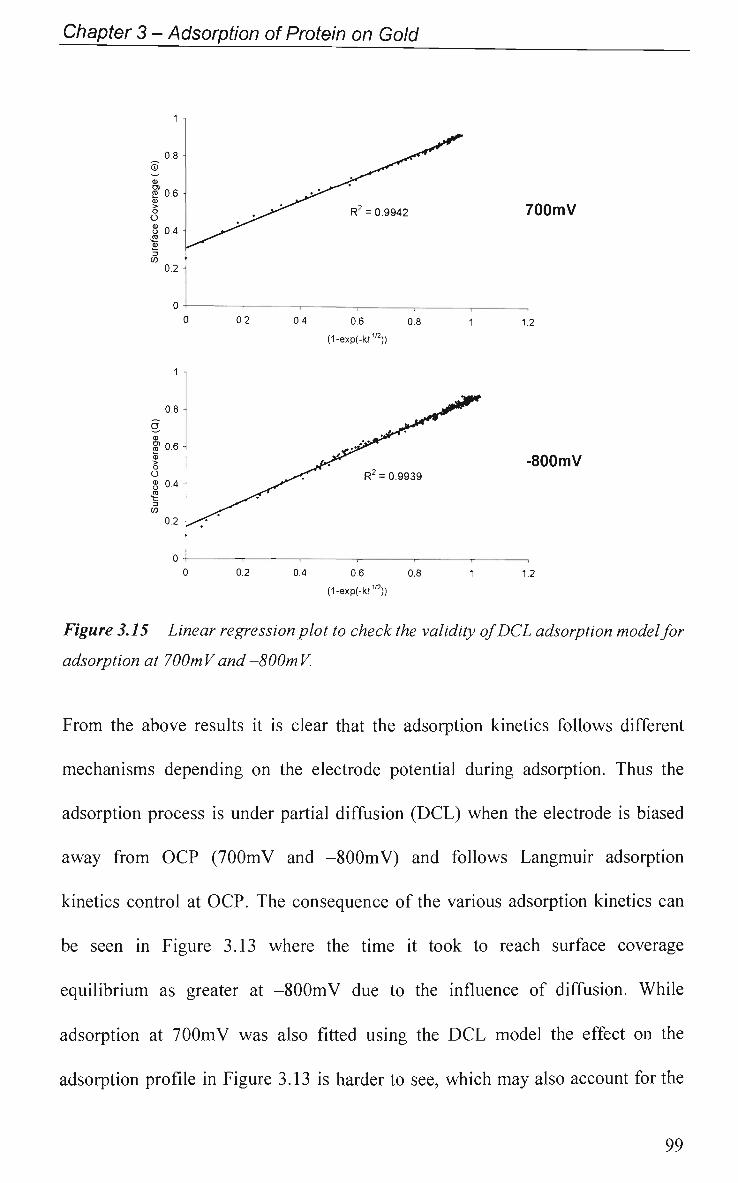
Chapter 3 - Adsorption of Protein on Gold
700mV
1.2
-800mV
1.2
Figure 3.15 Linear regression plot to check the validity of DCL adsorption model for
adsorption at 700mVand-800mV.
From the above results it is clear that the adsorption kinetics follows different
mechanisms depending on the electrode potential during adsorption. Thus the
adsorption process is under partial diffusion (DCL) when the electrode is biased
away from O C P (700mV and -800mV) and follows Langmuir adsorption
kinetics control at OCP. The consequence of the various adsorption kinetics can
be seen in Figure 3.13 where the time it took to reach surface coverage
equilibrium as greater at -800mV due to the influence of diffusion. While
adsorption at 700mV was also fitted using the D C L model the effect on the
adsorption profile in Figure 3.13 is harder to see, which may also account for the
0.8
<5 0.6
0.2
FT = 0.9942
0.2 0.4 0.6 0.1
(1-exp(-kt1/2))
1 -
0.2 0.4 0.6
(1-exp(-kf1/2))
0.8
99
Chapter 3 - Adsorption of Protein on Gold
fact that the Langmuir model could also be fitted to the 700mV data with limited
success. This may be due to the formation of the oxide layer having only a
marginal effect on adsorption kinetics. Under Langmuir adsorption kinetics Ig.G
adsorption at Au reaches surface saturation relatively quickly.
3.3 Conclusions
At physiological pH, the amount of adsorbed protein was greatest when the
electrode potential was biased positive followed by when the electrode was held
at OCP. The least amount of adsorbed protein was observed when the potential
was negative with respect to OCP. The surface coverage obtained suggests that
the orientation of the adsorbed proteins was horizontal when the electrode
potential was at OCP. When the electrode potential was positive the orientation
of the adsorbed protein appeared to be a combination of both horizontal and
vertical. When the electrode potential is negative the adsorbed amount of HSA
was less than a monolayer of horizontally adsorbed protein, while for Ig.G it was
approximately a monolayer of horizontally adsorbed protein. These results at
physiological pH suggest that the electrode potential has an effect on the extent
of adsorption, as well as the orientation of adsorption. The adsorption kinetics
also varies depending on the electrode potential. When the electrode potential
was at OCP the adsorption process followed the Langmuir type kinetics,
however, when the electrode potential was biased positive or negative adsorption
followed that defined as Diffusion Control Langmuir kinetics.
100
Chapter 3 - Adsorption of Protein on Gold
When the charge on the protein is varied, by changing the protein pH, the
adsorption characteristics varied considerably. In all cases the adsorption process
appeared to follow the rule of electrostatics, namely, maximum adsorption was
observed when the electrode surface and the protein had opposite charge and
minimum adsorption was observed when the charge was the same.
Once the protein had adsorbed it was difficult to remove via chemical or
mechanical cleaning means. Of all the solutions used for the chemical cleaning a
NaOH solution removed the most, followed by the HNO3 solution whilst the
solutions containing the surfactants SDS and Medizyme removed the least. The
use of mechanical means to remove the adsorbed protein proved to be only
marginally better than the chemical method alone with, at best, approximately
50% of bound protein being removed. These results suggested that protein
adsorbs in two modes, namely, reversible (weakly bound) and irreversible
(strongly bond).
When the applied potential waveform routine was varied the amount of adsorbed
protein also varied. When the electrode potential was held constant at 700mV the
amount adsorbed was greater for HSA than when the electrode potential was
pulsed between 700mV and OmV. Conversely, when the electrode potential was
held constant at -800mV the adsorbed amount was less than when the electrode
potential was pulsed between -800mV and OmV for both HSA and Ig.G..
101
Chapter 3 - Adsorption of Protein on Gold
References
1. R. L. Slater, in Radioisotopes in Biology: A Practical Approach, Vol. (ed.
R. L. Slater), IRL, Oxford, (1990)
2. C. H. Wang, D. L. Willis and W. D. Loveland, in Radiotracer
Methodology in the Biological, Environmental, and Physical Sciences,
Vol. (ed. C. H. Wang and D. L. Willis), Prentice-Hall, New Jersey, (1975)
3. J. J. Ramsden, Q. Rev. Biophys., 27 41 (1993)
4. T. Chad, in Laboratory Techniques in Biochemistry and Molecular
Biology 2nd Ed, Vol. 6, (ed. T. Work and E. Work), Elsevier Biomedical,
New York, (1982)
5. R. M. Cornelius and J. L. Brash, Biomaterials, 20 341 (1999)
6. F. Liu, M. Zhou and F. Zhang, Applied Radiatiation and Isotopes, 49 67
(1998)
7. J. A. Westbrook, J. X. Yan, R. Wait and M. J. Dunn, Proteomics, 1 370
(2001)
8. S. Omanovic and S. G. Roscoe, Langmuir, 8315 (1999)
9. S. Omanovic and S. G. Roscoe, Journal of Colloid and Interface Science,
227 452 (2000)
10. M. Malmsten, Journal of Colloid and Interface Science, 207 186(1998)
11. A. Caprani and F. Lacour, Journal of Electroanalytical Chemistry;
Biochemistry and Bioenergetics, 320 241 (1991)
12. K. Kanazawa and O. Melroy, IBM J. Res. Develop., 37 157 (1993)
13. J. Miller and D. Bolef, J. Appl. Phys., 39 4589 (1968)
102
Chapter 3 - Adsorption of Protein on Gold
14. D. A. Buttry, in Electroanalytical Chemistry, Vol. 11, (ed. A. J. Bard),
Marcel Dekker, New YorK, (1991)
15. K. Kanazawa and J. Gordon, Anal. Chim. Acta, 175 99 (1985)
16. L. Jones and J. Meiure, Analytical Chemistry, 41 484 (1969)
17. F. Caruso, D. Furlong and P. Kingspot, Journal of Colloid Interface and
Science, 186 349(1997)
18. F. Hook, M. Rodahl, P. Brzezinski and B. Kasemo, Langmuir, 14 729
(1998)
19. M. Murarsugu, F. Ohta, Y. Miya, T. Hosokawa, S. Kurosawa, N. Kamo
and H. Ikeda, Analytical Chemistry, 65 2933 (1993)
20. M. Minunni, P. Skladal and M. Mascini, Anal. Lett, 27 1475 (1994)
21. M. Masson, K. S. Yun, T. Haruyama, E. Kobatake and M. Aizawa,
Analytical Chemistry, 67 2212 (1995)
22. Y. Wang, B. Xu, G. Zhu and E. Wang, Electroanalysis, 9 1422 (1997)
23. A. C. Chen, J. Richer, S. G. Roscoe and J. Lipkowski, Langmuir, 13 4737
(1997)
24. H. J. Maguire and S. G. Roscoe, Langmuir, 13 5962 (1997)
25. S. M. Macdonald and S. G. Roscoe, Electrochimica Acta, 42 1189 (1997)
26. S. M. Macdonald and S. G. Roscoe, Journal of Colloid and Interface
Science, 184 449 (1996)
27. R. Subramanian and V. Lakshminarayana, Electrochimica Acta, 45 4501
(2000)
Chapter 3 - Adsorption of Protein on Gold
28. P. Bernabeu, L. Tamisier, A. De Cesare and A. Caprani, Electrochimica
Acta, 33 1129(1988)
29. A. Wieckowski, in Interfacial Electrochemistry: Therory, Experimental,
and Applications, Vol. (ed. A. Wieckowski), Marcel Dekker, Inc, New
York, (1999)
30. M. Malmsten, Journal of Colloid and Interface Science, 166 333 (1994)
31. H. Su, S. Chong and M. Thompson, Langmuir, 12 2247 (1996)
32. M. Ward and D. A. Buttry, Science, 249 1090 (1990)
33. W. Norde, Advance Colloid Interface Science, 25 267 (1986)
34. S. Lee and R. W. Staehle, Zeitschrift fur Metallkunde, 88 11 (1997)
35. P. A. Connor and A. J. McQuillan, Langmuir, 15 2916 (1999)
36. A. Michelmore, W. Q. Gong, P. Jenkins and J. Ralston, Physical
Chemistry Chemical Physics, 2 2985 (2000)
37. B. Lassen and M. Malmsten, Journal of Colloid and Interface Science,
180 339(1996)
38. D. A. Carter and J. Ho, Advanced Protein Chemistry, 45 153 (1994)
39. R. Hidalgo-Alvarez and F. Galisteo-Gonzalez, Heterogeneous Chemistry
Reviews, 2 249 (1995)
40. W. Norde and J. Lyklema, Journal of Colloid and Interface Science, 66
295 (1978)
41. W. Norde, in Polymer Science and Technology, Vol. 12B, (ed. L. Lee),
Plenum Press, New York, (1980)
42. D. R. Jackson, S. Omanovic and S. G. Roscoe, Langmuir, 16 5449 (2000)
104
Chapter 3 - Adsorption of Protein on Gold
43. N. R. Cabilio, S. Omanovic and S. G. Roscoe, Langmuir, 16 8480 (2000)
44. K. Hanrahan, S. M. Macdonald and S. G. Roscoe, Electrochimica Acta, 41
2469 (1996)
45. J. Buijs, W. Norde and J. W. Lichtenbelt, Langmuir, 12 1605 (1996)
46. S. Servagent-Noinville, M. Revault, H. Quiquampoix and M. H. Baron,
Journal of Colloid & Interface Science, 221 273 (2000)
47. E. Blomberg and P. M. Claesson, in Proteins at Interfaces, Vol. 2, (ed.
(1993)
48. T. Peters, in Advances in Protein Chemistry, Vol. 37, (ed. T. Peters),
Academic Press, New York, (1985)
49. M. Malmsten, Colloid and Surfaces B: Biointerfaces, 3 297 (1995)
50. B. Guo, J. Anzai and T. Osa, Chem. Pharm. Bull, 44 800 (1996)
51. K. Nakanishi, T. Sakiyama and K. Imamura, Journal ofBioscience and
Bioengineering, 91 233 (2001)
52. C. E. Giacomelli, M. Bremer and W. Norde, Journal of Colloid and
Interface Science, 220 13 (1999)
53. R. Slojkowska and M. Jurkiewicz-Herbich, Colloids and Surfaces A:
Physicochemical and Engineering Aspects, 178 325 (2001)
54. H. Lensen, D. Bargeman, P. Bergveld, C. Smolders and J. Feijen, Journal
of Colloid and Interface Science, 99 1 (1984)
55. C. A. Haynes and W. Norde, Colloids and Surfaces B: Biointerfaces, 2
517(1994)
105
Chapter 3 - Adsorption of Protein on Gold
56. A. J. Bard and L. R. Faulkner, in Electrochemical Methods -
Fundamentals and Applications, Vol. 2, (ed. A. J. Bard and L. R.
Faulkner), John Wiley & Sons, New york, (1980)
57. F. Galisteo-Gonzalez, A. Martin and R. Hidalgo-Alvarez, ColloidPolym.
Sci., 272 352 (1994)
58. W. Norde, Thesis: from Wageningen Agricltural University, Chemistry,
Wageningen, (1976)
59. R. A. Shastri and R. Roe, Organic Coatings and Plastics Chemistry, 40
820 (1970)
60. S. D. Changani, M. T. Behnar-Beiny and P. J. Fryer, Experimental
Thermal and Fluid Science, 14 392 (1974)
61. C. A. C. Karlsson, M. C. Wahlgren, C. O. A. Olsson and A. C. Tragardh,
Journail of Colloid and Interface Science, 220 471 (1999)
62. C. A. C. Karlsson, M. C. Wahlgren and A. C. Tragardh, Journal of Food
Engineering, 30 43 (1996)
63. K. Kim, P. Sun, V. Chen, D. E. Wiley and A. Fane, Journal of Membrane
Science, 80 241 (1993)
64. G. Reuter, International Biodeterioration & Biodegradation, 41 209
(1998)
65. T. Sakiyama, T. Toyomasu, A. Nagata, K. Imamura, T. Takahashi, T.
Nagai and K. Nakanishi, Journal of Fermentation and Bioengineering, 85
297 (1998)
106
Chapter 3 - Adsorption of Protein on Gold
66. T. Sakiyama, T. Toyomasu, A. Nagata, K. Imamura, T. Takahashi and T.
Nagai, Journal of Chemical Engineering of Japan, 31 208 (1998)
67. M. Coppleson, K. Canfell, V. Skladnev, S. C. Quek, T. Mould and A.
Singer, Annals Academy of Medicine, 27 111 (1998)
68. D. A. Timperley and C. N. M. Smeulders, J. Soc. Dairy. Techol, 40 4
(1987)
69. K. Chittur, D. Fink, R. Leininger and T. B. Hutson, Journal of Colloid and
Interface Science, 111 419 (1986)
70. A. V. Elgersma, R. L. J. Zsom, W. Norde and J. Lyklema, Colloids &
Surfaces, 54 89 (1991)
71. J. Serra, J. Puig, J. Martin, F. Galisteo-Gonzalez, J. Galisteo-Gonzalez and
R. Hidalgo-Alvarez, ColloidPolym. Sci., 270 574 (1992)
72. T. Arnebrant, K. Barton and T. Nylander, Journal of Colloid and Interface
Science, 119 383 (1996)
73. P. Bernabeu and A. Caprani, Biomaterials, 11 258 (1990)
74. T. Arnebrant, B. Ivarsson, A. Larsson, I. Lundstrom and T. Nylander,
Progress in Colloids and Polymer Science, 703 62 (1985)
75. B. Ivarsson, P. Hegg, i. Lundstrom and T. Nylander, Colloids and
Surfaces B: Biointerfaces, 13 193 (1985)
76. I. Lundstrom, Progress in Colloids and Polymer Science, 703 76 (1985)
77. B. B. Damaskin, O. A. Petrii and V. V. Batrakov, in Adsorption of
Organic Compounds on Electrodes, Vol. 1, (ed. B. B. Damaskin, O. A.
Petrii and V. V. Batrakov), Plenum Press, New York, (1971)
107
Chapter 4 - Effect of Protein Adsorption on the Electrochemical Behaviour of Gold
Chapter 4
Effect of Protein Adsorption on the
Electrochemical Behaviour of Gold
108
Chapter 4 - Effect of Protein Adsorption on the Electrochemical Behaviour of Gold
4.1 Introduction
4.1.1 Electrochemical Impedance Spectroscopy
Electrochemical Impedance Spectroscopy (EIS) has been the main tool used to
investigate processes occurring at a conducting solid/electrolyte interface,
particularly in the food processing industry as well as the medical device industry
in relation to biocompatibility. Roscoe et al [1-4] have used EIS extensively to
study numerous conducting solid/electrolyte interfaces, while Xie et al [5] have
used EIS in conjunction with Q C M to investigate B S A adsorption at modified
gold electrodes.
Electrochemical impedance spectroscopy was used to investigate the
electrode/electrolyte interface and the processes that occur at a gold electrode
surface in the presence of protein at ambient temperature. To ensure complete
characterisation of the interface and surface processes, EIS measurements were
made over several frequency decades, from 50 mHz up to 50 kHz.
Non-faradaic and faradaic processes were examined to investigate the electrical
double layer (Cdi) and electron transfer variations upon adsorption at the
electrode surface. Impedance was also measured at a fixed AC voltage frequency
since it has been demonstrated [6-8] that this experimental procedure also yields
information on the Cdi in real time.
The advantage of EIS over data measurements in the time domain (i.e., pulse or
step response measurements) is that the measured dispersion data can be
described analytically, using an electrical equivalent circuit [9] (EEC). The
109
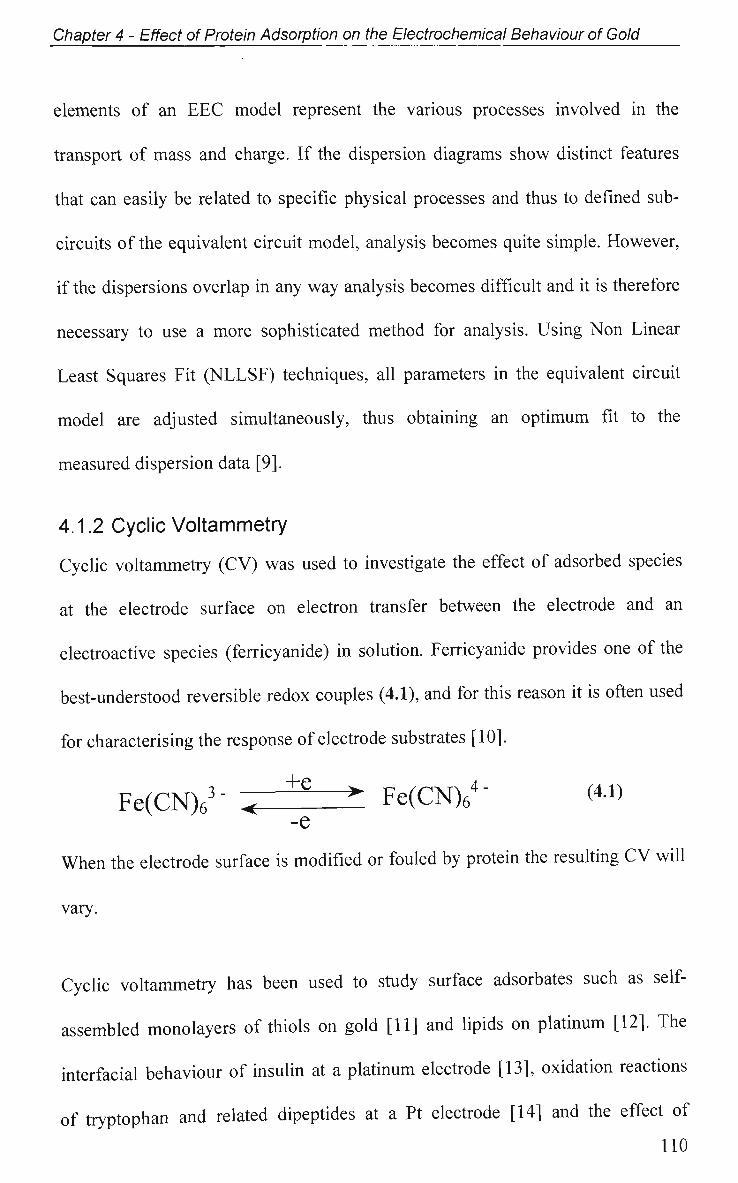
Chapter 4 - Effect of Protein Adsorption on the Electrochemical Behaviour of Gold
elements of an EEC model represent the various processes involved in the
transport of mass and charge. If the dispersion diagrams show distinct features
that can easily be related to specific physical processes and thus to defined sub-
circuits of the equivalent circuit model, analysis becomes quite simple. However,
if the dispersions overlap in any way analysis becomes difficult and it is therefore
necessary to use a more sophisticated method for analysis. Using N o n Linear
Least Squares Fit (NLLSF) techniques, all parameters in the equivalent circuit
model are adjusted simultaneously, thus obtaining an optimum fit to the
measured dispersion data [9].
4.1.2 Cyclic Voltammetry
Cyclic voltammetry (CV) was used to investigate the effect of adsorbed species
at the electrode surface on electron transfer between the electrode and an
electroactive species (ferricyanide) in solution. Ferricyanide provides one of the
best-understood reversible redox couples (4.1), and for this reason it is often used
for characterising the response of electrode substrates [10].
Fe(CN)63" < +? > Fe(CN)6
4" («> -e
W h e n the electrode surface is modified or fouled by protein the resulting C V will
vary.
Cyclic voltammetry has been used to study surface adsorbates such as self-
assembled monolayers of thiols on gold [11] and lipids on platinum [12]. The
interfacial behaviour of insulin at a platinum electrode [13], oxidation reactions
of tryptophan and related dipeptides at a Pt electrode [14] and the effect of
110
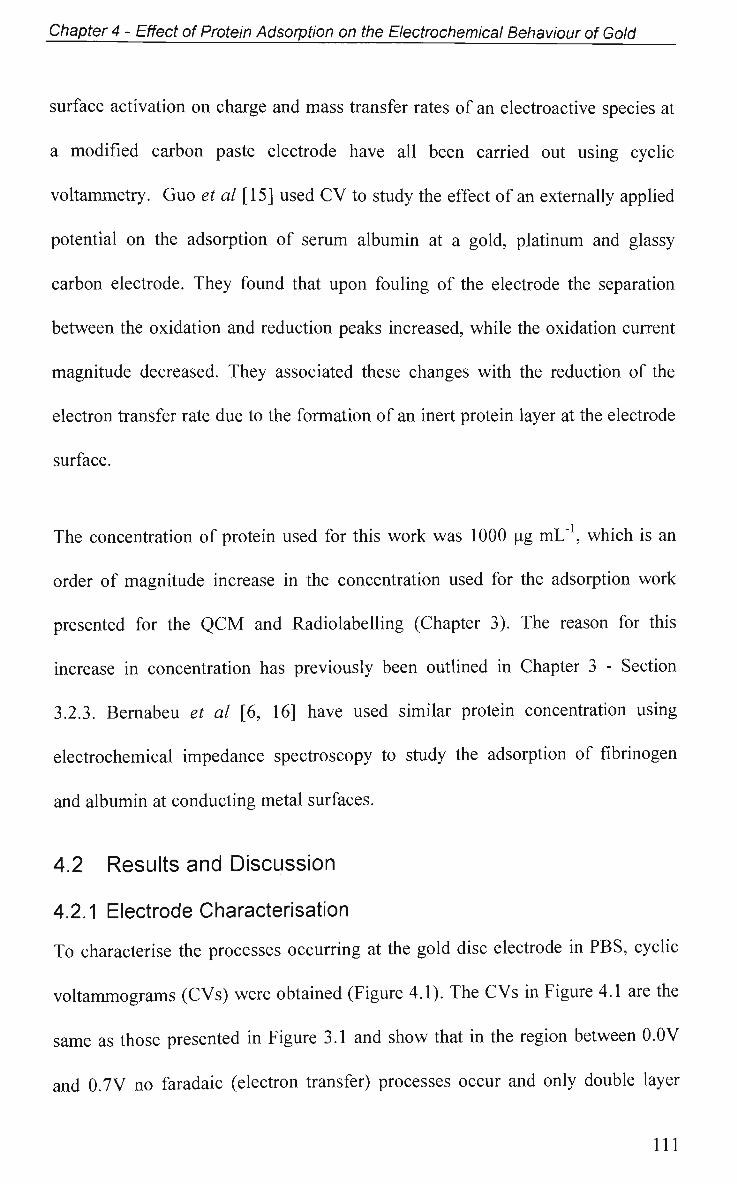
Chapter 4 - Effect of Protein Adsorption on the Electrochemical Behaviour of Gold
surface activation on charge and mass transfer rates of an electroactive species at
a modified carbon paste electrode have all been carried out using cyclic
voltammetry. Guo et al [15] used CV fo study the effect of an externally applied
potential on the adsorption of serum albumin at a gold, platinum and glassy
carbon electrode. They found that upon fouling of the electrode the separation
between the oxidation and reduction peaks increased, while the oxidation current
magnitude decreased. They associated these changes with the reduction of the
electron transfer rate due to the formation of an inert protein layer at the electrode
surface.
The concentration of protein used for this work was 1000 pg mL" , which is an
order of magnitude increase in the concentration used for the adsorption work
presented for the QCM and Radiolabelling (Chapter 3). The reason for this
increase in concentration has previously been outlined in Chapter 3 - Section
3.2.3. Bernabeu et al [6, 16] have used similar protein concentration using
electrochemical impedance spectroscopy to study the adsorption of fibrinogen
and albumin at conducting metal surfaces.
4.2 Results and Discussion
4.2.1 Electrode Characterisation
To characterise the processes occurring at the gold disc electrode in PBS, cyclic
voltammograms (CVs) were obtained (Figure 4.1). The CVs in Figure 4.1 are the
same as those presented in Figure 3.1 and show that in the region between 0.0V
and 0.7V no faradaic (electron transfer) processes occur and only double layer
111
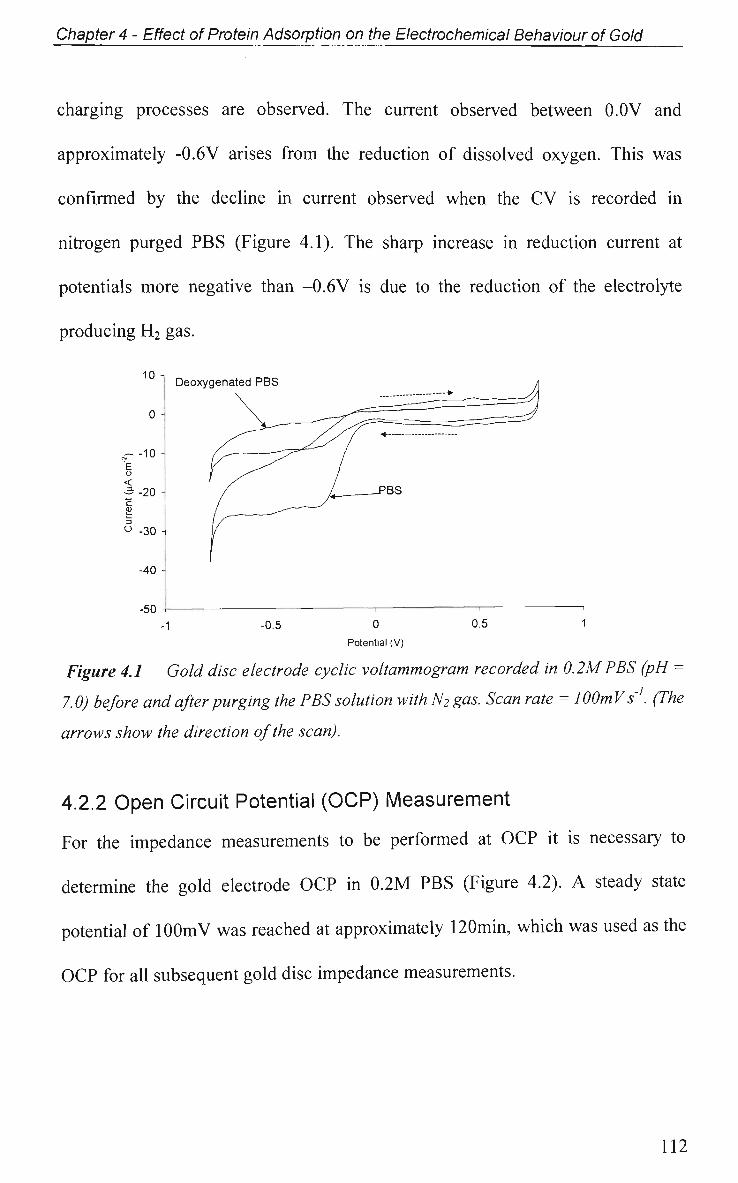
Chapter 4 - Effect of Protein Adsorption on the Electrochemical Behaviour of Gold
charging processes are observed. The current observed between 0.0V and
approximately -0.6V arises from the reduction of dissolved oxygen. This was
confirmed by the decline in current observed when the CV is recorded in
nitrogen purged PBS (Figure 4.1). The sharp increase in reduction current at
potentials more negative than -0.6V is due to the reduction of the electrolyte
producing H2 gas.
10 Deoxygenated P B S
~ -10 E o < ^=-20 (U
-30
-40
-50 -0.5 0.5
Potential (V)
Figure 4.1 Gold disc electrode cyclic voltammogram recorded in 0.2MPBS (pH =
7.0) before and after purging the PBS solution with N2 gas. Scan rate = lOOmVs'1. (The
arrows show the direction of the scan).
4.2.2 Open Circuit Potential (OCP) Measurement
For the impedance measurements to be performed at OCP it is necessary to
determine the gold electrode OCP in 0.2M PBS (Figure 4.2). A steady state
potential of lOOmV was reached at approximately 120min, which was used as the
OCP for all subsequent gold disc impedance measurements.
112
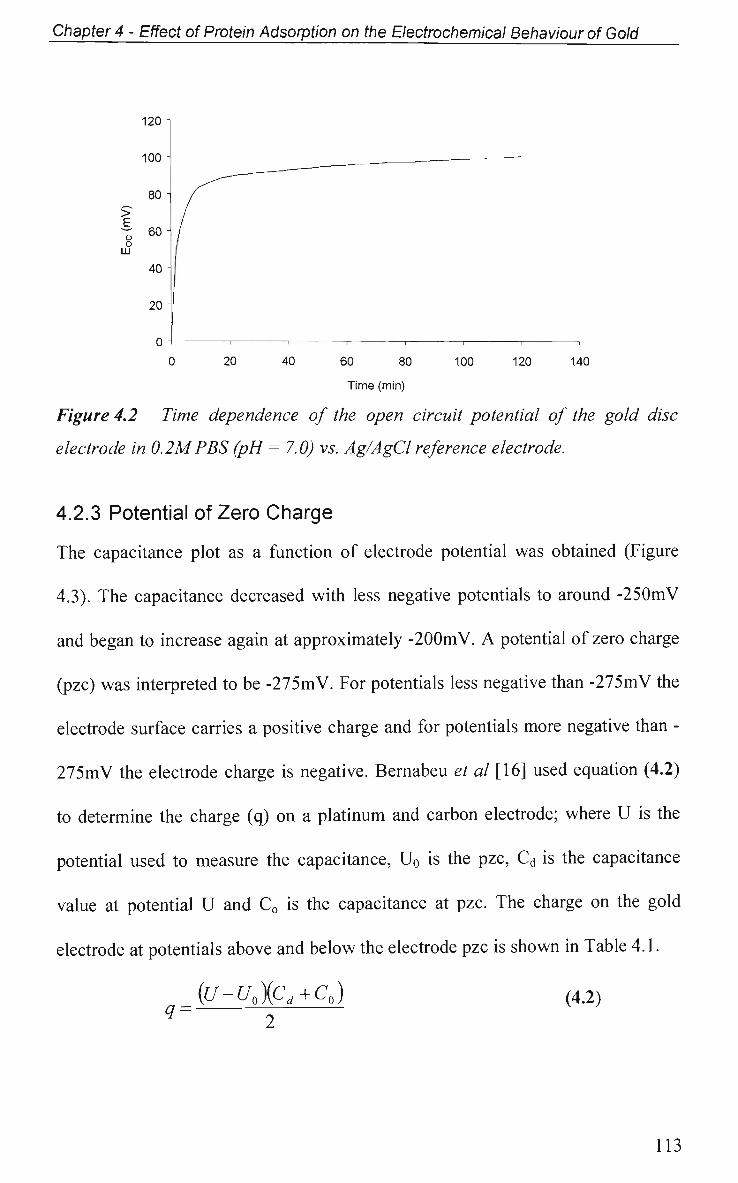
Chapter 4 - Effect of Protein Adsorption on the Electrochemical Behaviour of Gold
120-
100 -
80 - f
~ 60 - / o / LU
40 -
20 -
0 J 1 > 1 1 . 1 1
0 20 40 60 80 100 120 140
Time (min)
Figure 4.2 Time dependence of the open circuit potential of the gold disc
electrode in 0.2MPBS (pH = 7.0) vs. Ag/AgCl reference electrode.
4.2.3 Potential of Zero Charge
The capacitance plot as a function of electrode potential was obtained (Figure
4.3). The capacitance decreased with less negative potentials to around -250mV
and began to increase again at approximately -200mV. A potential of zero charge
(pzc) was interpreted to be -275mV. For potentials less negative than -275mV the
electrode surface carries a positive charge and for potentials more negative than -
275mV the electrode charge is negative. Bernabeu et al [16] used equation (4.2)
to determine the charge (q) on a platinum and carbon electrode; where U is the
potential used to measure the capacitance, U0 is the pzc, Cd is the capacitance
value at potential U and C0 is the capacitance at pzc. The charge on the gold
electrode at potentials above and below the electrode pzc is shown in Table 4.1.
_ (U-U*XCd+C0) (4.2)
113
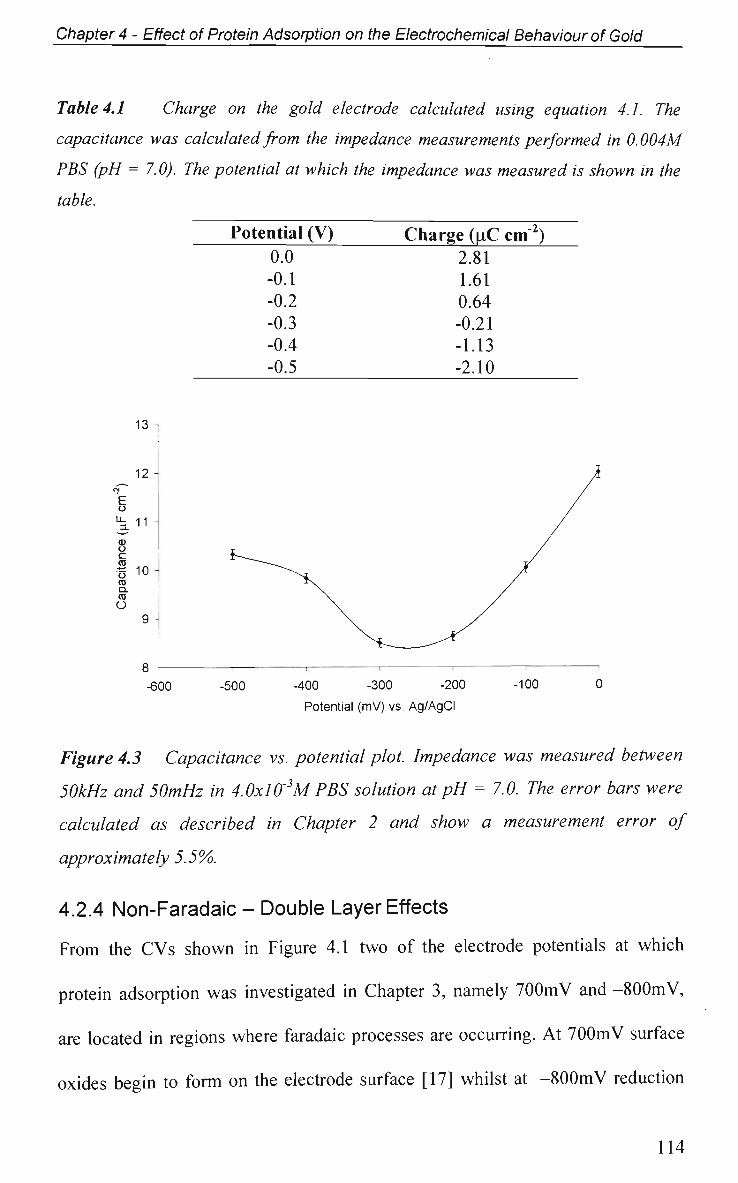
Chapter 4 - Effect of Protein Adsorption on the Electrochemical Behaviour of Gold
Table 4.1 Charge on the gold electrode calculated using equation 4.1. The
capacitance was calculated from the impedance measurements performed in 0.004M
PBS (pH = 7.0). The potential at which the impedance was measured is shown in the
table.
E o
13
12
11 03 O
I 10 ro Q.
ro O
Potential 0.0 -0.1 -0.2 -0.3 -0.4 -0.5
(V) Chs irge (p,C cm"2) 2.81 1.61 0.64 -0.21 -1.13 -2.10
9-
-600 -500 -400 -300 -200
Potential (mV) vs. Ag/AgCl
-100
Figure 4.3 Capacitance vs. potential plot. Impedance was measured between
50kHz and 50mHz in 4.0x10'3M PBS solution at pH = 7.0. The error bars were
calculated as described in Chapter 2 and show a measurement error of
approximately 5.5%.
4.2.4 Non-Faradaic - Double Layer Effects
From the C V s shown in Figure 4.1 two of the electrode potentials at which
protein adsorption was investigated in Chapter 3, namely 700mV and -800mV,
are located in regions where faradaic processes are occurring. At 700mV surface
oxides begin to form on the electrode surface [17] whilst at -800mV reduction
114
Chapter 4 - Effect of Protein Adsorption on the Electrochemical Behaviour of Gold
of dissolved oxygen and the evolution of hydrogen occurs [17]. These faradaic
processes will alter the electrode surface causing misinterpretation of impedance
spectra, with respect to spectra variation caused by protein adsorption. To avoid
these complications in interpreting the impedance spectra it was decided to
measure the impedance at intermediate potentials, such as 400mV, OCP
(lOOmV) and -400mV. Whilst there are faradaic process occurring at -400mV,
namely reduction of dissolved oxygen, this potential was chosen to allow for
comparison with the titanium dioxide impedance work presented in Chapter 7.
4.2.4.1 Adsorption at OCP and Impedance at Various Potentials
The shape of the impedance spectra are dependent on the potential applied to the
electrode during the impedance measurement (Figure 4.4). The impedance
spectra show three distinct frequency dependent regions. In the high frequency
region, the absolute impedance (Bode Z) is independent of the frequency with the
phase angle value at or near zero degrees as represented in the Bode Phase plot.
This is a typical response for resistive behaviour [2] and corresponds to a
resistance of the phosphate solution between the working and reference
electrode. In the medium frequency region a linear relationship can be observed
between the absolute impedance and the frequency. This frequency region
corresponds to the capacitive behaviour of the electrode/electrolyte interface [2].
The linear region extends further to lower frequencies for the impedance spectra
recorded at positive potentials than it does for negative potentials.
115
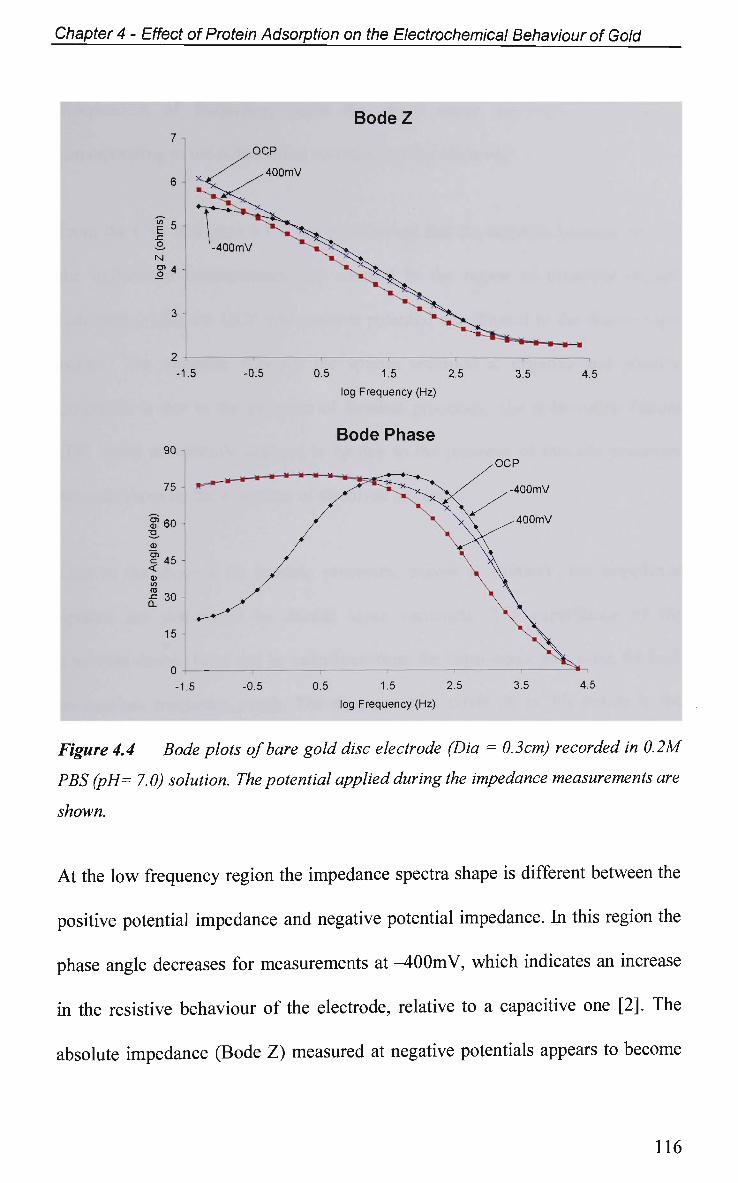
Chapter 4 - Effect of Protein Adsorption on the Electrochemical Behaviour of Gold
Figure 4.4 Bode plots of bare gold disc electrode (Dia = 0.3cm) recorded in 0.2M
PBS (pH= 7.0) solution. The potential applied during the impedance measurements are
shown.
At the low frequency region the impedance spectra shape is different between the
positive potential impedance and negative potential impedance. In this region the
phase angle decreases for measurements at -400mV, which indicates an increase
in the resistive behaviour of the electrode, relative to a capacitive one [2]. The
absolute impedance (Bode Z) measured at negative potentials appears to become
116
Chapter 4 - Effect of Protein Adsorption on the Electrochemical Behaviour of Gold
independent of frequency, while the phase angle approaches zero again,
corresponding to the polarisation resistance of the electrode.
From the CVs in Figure 4.1 it can be observed that the negative potential used in
the impedance measurements are situated in the region of dissolved oxygen
reduction whilst the OCP and positive potential are situated in the double layer
region. The variation between the spectra recorded at negative and positive
potentials is due to the presence of faradaic processes. The polarization feature
(DC limit) at -400mV appears to be due to the presence of faradaic processes
brought about by the reduction of dissolved oxygen.
Due to the absence of faradaic processes, except at -400mV, the impedance
spectra are dominated by double layer variations. The capacitance of the
electrode double layer can be calculated from the capacitance plot using the high
to medium frequency range. The diameter of a circle fit to this region is the
electrode capacitance in farads (F). The sensitivity of the EIS system is
dependent on variables such as reproducibility in electrode polishing before each
adsorption stage. It was found that the variation in electrode capacitance about
the mean value for a bare electrode was approximately 10%. This was done by
performing impedance measurements on the bare electrode after polishing a
number of times. Therefore changes in electrode capacitance were not considered
significant unless the variation was greater than 10%.
117
Chapter 4 - Effect of Protein Adsorption on the Electrochemical Behaviour of Gold
The capacitance values calculated from the capacitance plots are presented in
Figure 4.5. The impedance was measured at the applied potential shown after
exposure to solutions of 0.2M PBS, lOOOug mL"1 HSA and lOOOug mL"1 Ig.G at
OCP (pH = 7.0). To accurately observe the effect of the adsorbing protein on the
electrode capacitance, the changes due to interaction with PBS solution
(Exposure to PBS) was subtracted from the change due to protein adsorption
(Exposure to HSA or Ig.G depending on which protein used). This change is
represented as a A% value in the figures and was obtained by dividing the change
in capacitance due to protein adsorption (i.e., Exposure to Ig.G - Exposure to
PBS) by the bare electrode value capacitance.
Upon adsorption of HSA and Ig.G the electrode capacitance decreased, with the
greatest decrease being observed at the potentials 400mV and OCP. The work
presented in Chapter 3 - Section 3.2.3 showed that the change in electrode
capacitance could be related to the amount of adsorbed protein, which was also
highlighted by other workers [18-20]. Therefore the potentials at which the
greatest decrease in capacitance was observed also corresponded to the potentials
at which the greatest amount of protein adsorbed.
From the adsorbed amounts reported in Chapter 3 for HSA and Ig.G it was
possible to calculate the volume occupied by the mass of protein from the size of
each protein and their maximum adsorbed amounts. At OCP the adsorbed Ig.G
occupies twice the volume that HSA does, indicating a thicker protein layer since
the electrode surface areas were the same for both proteins. This thicker Ig.G
118
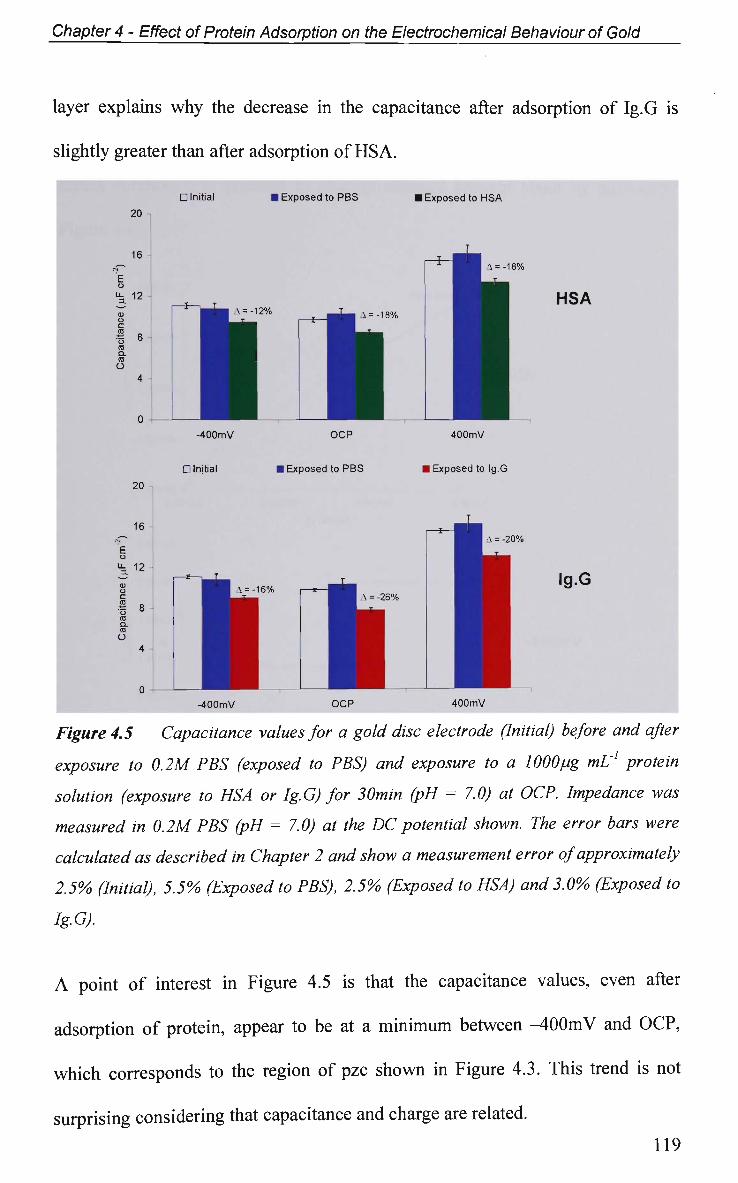
Chapter 4 - Effect of Protein Adsorption on the Electrochemical Behaviour of Gold
layer explains why the decrease in the capacitance after adsorption of Ig.G is
slightly greater than after adsorption of H S A .
Figure 4.5 Capacitance values for a gold disc electrode (Initial) before and after
exposure to 0.2M PBS (exposed to PBS) and exposure to a 1000pg mL1 protein
solution (exposure to HSA or Ig.G) for 30min (pH = 7.0) at OCP. Impedance was
measured in 0.2M PBS (pH = 7.0) at the DC potential shown. The error bars were
calculated as described in Chapter 2 and show a measurement error of approximately
2.5% (Initial), 5.5% (Exposed to PBS), 2.5% (Exposed to HSA) and 3.0% (Exposed to
Ig.G).
A point of interest in Figure 4.5 is that the capacitance values, even after
adsorption of protein, appear to be at a minimum between - 4 0 0 m V and O C P ,
which corresponds to the region of pzc shown in Figure 4.3. This trend is not
surprising considering that capacitance and charge are related.
119
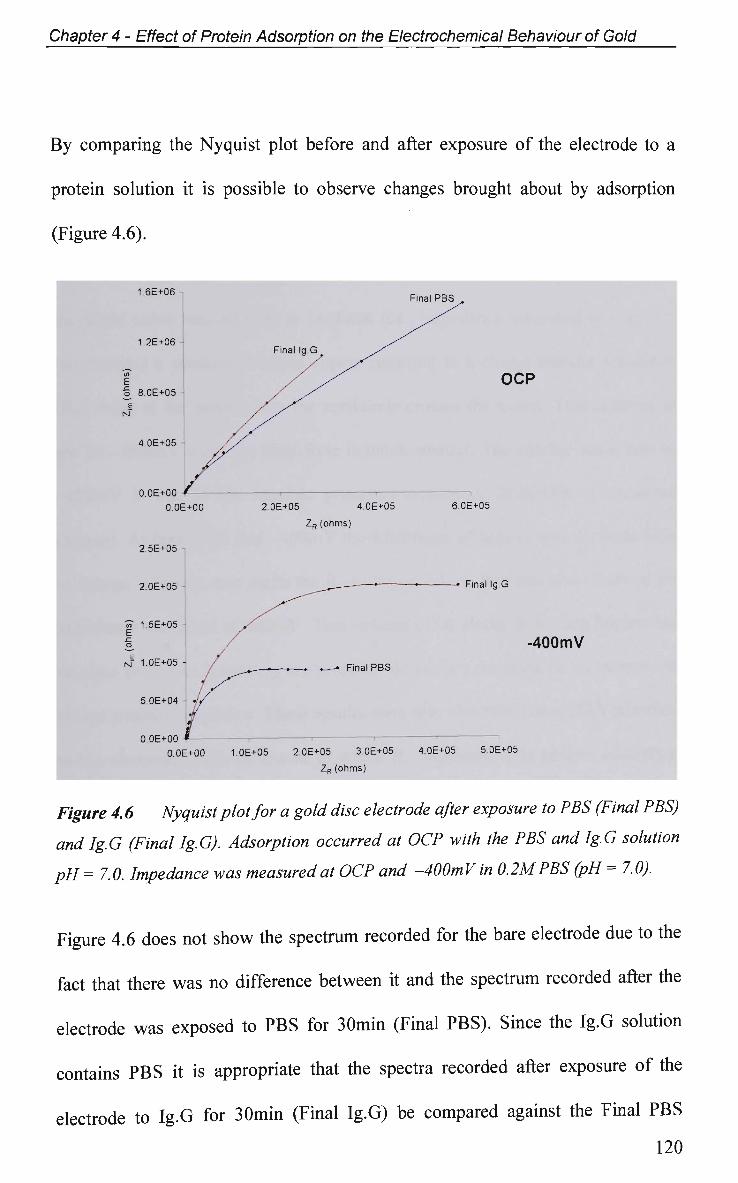
Chapter 4 - Effect of Protein Adsorption on the Electrochemical Behaviour of Gold
By comparing the Nyquist plot before and after exposure of the electrode to a
protein solution it is possible to observe changes brought about by adsorption
(Figure 4.6).
Final PBS
Final Ig.G //
/ X OCP
OE+05 4.0E+05 6.0E+05
ZR (ohms)
• • • Final Ig.G
-400mV . .—. .—* Final PBS
2.0E+05 3.0E+05 4.0E+05 5 OE+05
ZR (ohms)
Figure 4.6 Nyquist plot for a gold disc electrode after exposure to PBS (Final PBS)
and Ig.G (Final Ig.G). Adsorption occurred at OCP with the PBS and Ig.G solution
pH = 7.0. Impedance was measured at OCP and -400mV in 0.2MPBS (pH = 7.0).
Figure 4.6 does not show the spectrum recorded for the bare electrode due to the
fact that there was no difference between it and the spectrum recorded after the
electrode was exposed to P B S for 30min (Final PBS). Since the Ig.G solution
contains P B S it is appropriate that the spectra recorded after exposure of the
electrode to Ig.G for 30min (Final Ig.G) be compared against the Final P B S
120
1.6E+06
1.2E+06
o 80E+05
4 OE+05
O.OE+00 -
00E+00
2.5E+05
2.0E+05
1.5E+05
N 1.OE+05
50E+04
0.0E+00
O.OE+00 1.OE+05
Chapter 4 - Effect of Protein Adsorption on the Electrochemical Behaviour of Gold
spectra to attain a clear understanding of the effects brought about by adsorption
of Ig.G.
At OCP no faradaic processes are occurring and the impedance spectra should
show a straight line, however, this is not the case since the system is not ideal. If
the slight curve was allowed to continue (i.e., impedance measured to very low
frequencies) a semicircle would appear resulting in a charge transfer resistance
(Rct) value at the point where the semicircle crosses the x-axis. This is easier to
see for -400mV were the semicircle is much smaller. The smaller semicircle of
-400mV is due to the faradaic processes occurring, (reduction of dissolved
oxygen). At both OCP and -400mV the adsorption of Ig.G causes the semicircle
to enlarge which in turn shifts the Rct to larger values, this was also observed for
impedance measured at 400mV. This indicates that electrode fouling hinders the
faradaic processes occurring at the electrode surface resulting in an increase in
charge transfer resistance. These results were also observed when HSA adsorbed
to the electrode, with the extent to which Rct increased after protein adsorption
being almost identical for both proteins. These results were also observed when
CVs were recorded in a solution containing the electroactive species, potassium
ferricyanide, before and after exposure of the gold disc electrode to solutions of
HSA and Ig.G (Section 4.2.5).
121
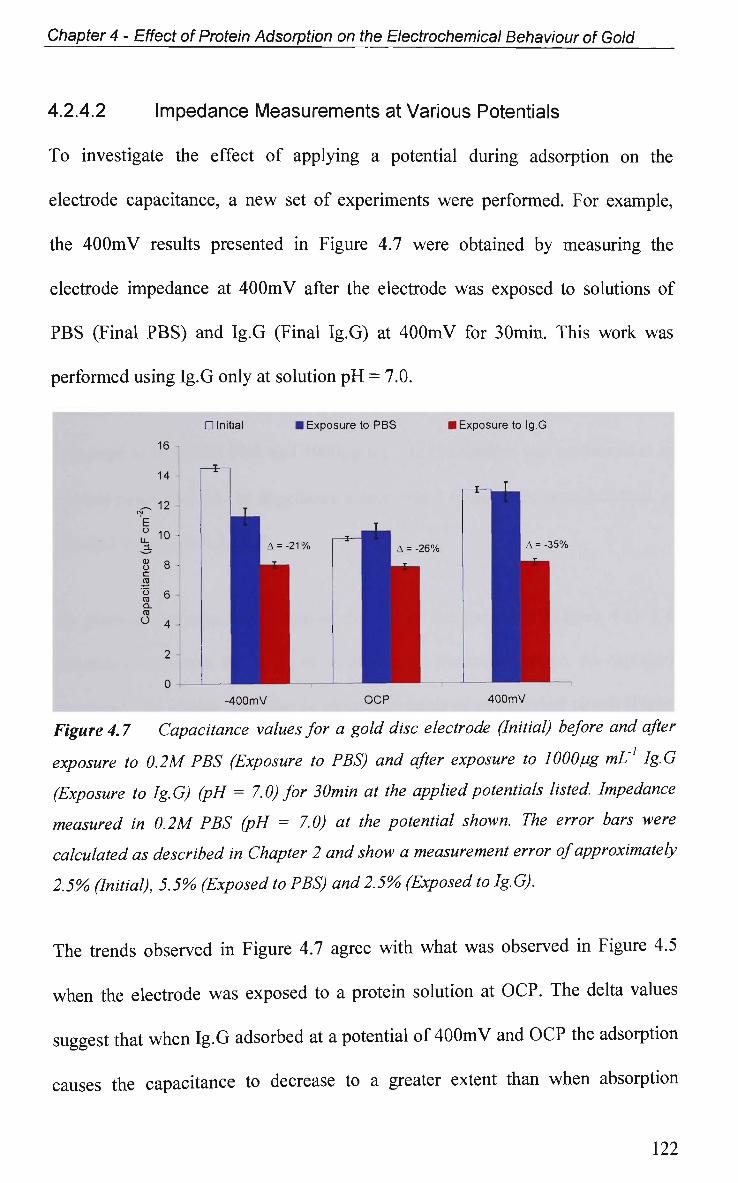
Chapter 4 - Effect of Protein Adsorption on the Electrochemical Behaviour of Gold
4.2.4.2 Impedance Measurements at Various Potentials
To investigate the effect of applying a potential during adsorption on the
electrode capacitance, a new set of experiments were performed. For example,
the 4 0 0 m V results presented in Figure 4.7 were obtained by measuring the
electrode impedance at 4 0 0 m V after the electrode was exposed to solutions of
P B S (Final PBS) and Ig.G (Final Ig.G) at 40 0 m V for 30min. This work was
performed using Ig.G only at solution p H = 7.0.
• Initial
16 1 14 -
_. 12 \
! 10.
Capacitance
-&.
CD
OO
2
T
T
i-
1 0 — -400mV
• Exposure to PBS
-21 %
I I
X A = -
OCP
• Exposure to Ig.G
26%
±
A = -35%
400mV
Figure 4.7 Capacitance values for a gold disc electrode (Initial) before and after
exposure to 0.2M PBS (Exposure to PBS) and after exposure to 1000pg mL1 Ig.G
(Exposure to Ig.G) (pH = 7.0) for 30min at the applied potentials listed. Impedance
measured in 0.2M PBS (pH = 7.0) at the potential shown. The error bars were
calculated as described in Chapter 2 and show a measurement error of approximately
2.5% (Initial), 5.5% (Exposed to PBS) and2.5% (Exposed to Ig.G).
The trends observed in Figure 4.7 agree with what was observed in Figure 4.5
when the electrode was exposed to a protein solution at OCP. The delta values
suggest that when Ig.G adsorbed at a potential of 4 0 0 m V and O C P the adsorption
causes the capacitance to decrease to a greater extent than when absorption
122
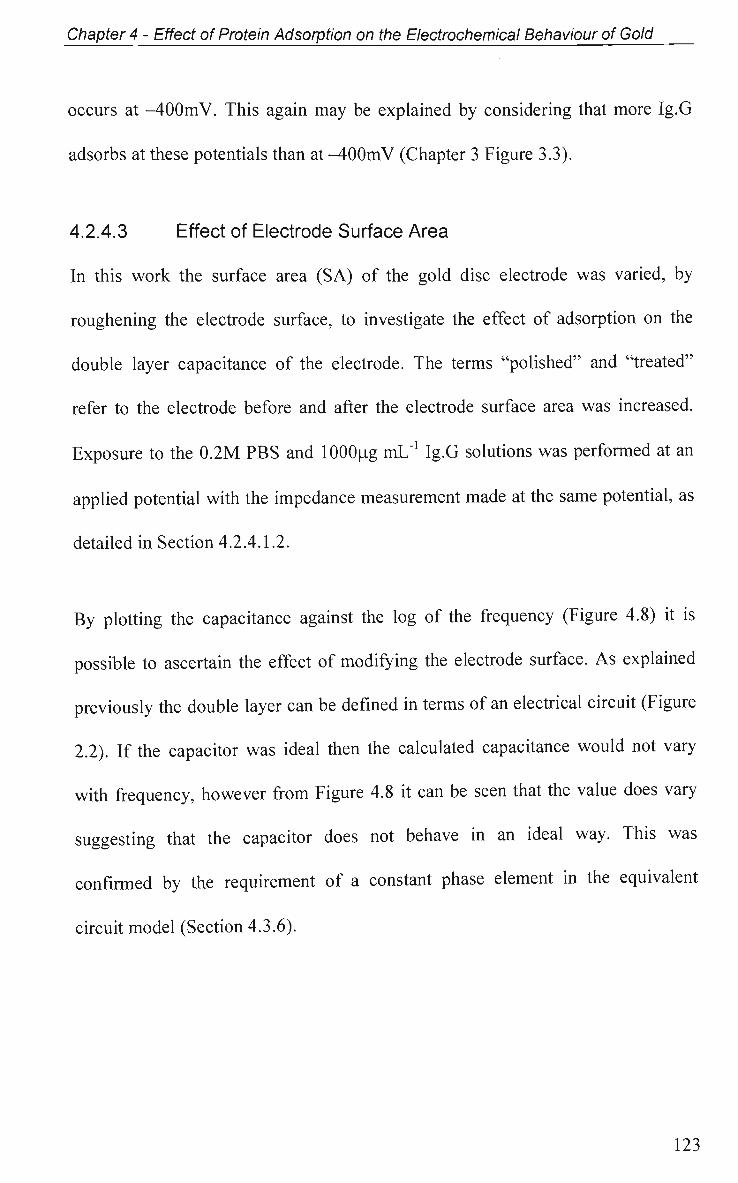
Chapter 4 - Effect of Protein Adsorption on the Electrochemical Behaviour of Gold
occurs at -400mV. This again may be explained by considering that more Ig.G
adsorbs at these potentials than at -400mV (Chapter 3 Figure 3.3).
4.2.4.3 Effect of Electrode Surface Area
In this work the surface area (SA) of the gold disc electrode was varied, by
roughening the electrode surface, to investigate the effect of adsorption on the
double layer capacitance of the electrode. The terms "polished" and "treated"
refer to the electrode before and after the electrode surface area was increased.
Exposure to the 0.2M PBS and lOOOug mL"1 Ig.G solutions was performed at an
applied potential with the impedance measurement made at the same potential, as
detailed in Section 4.2.4.1.2.
By plotting the capacitance against the log of the frequency (Figure 4.8) it is
possible to ascertain the effect of modifying the electrode surface. As explained
previously the double layer can be defined in terms of an electrical circuit (Figure
2.2). If the capacitor was ideal then the calculated capacitance would not vary
with frequency, however from Figure 4.8 it can be seen that the value does vary
suggesting that the capacitor does not behave in an ideal way. This was
confirmed by the requirement of a constant phase element in the equivalent
circuit model (Section 4.3.6).
123
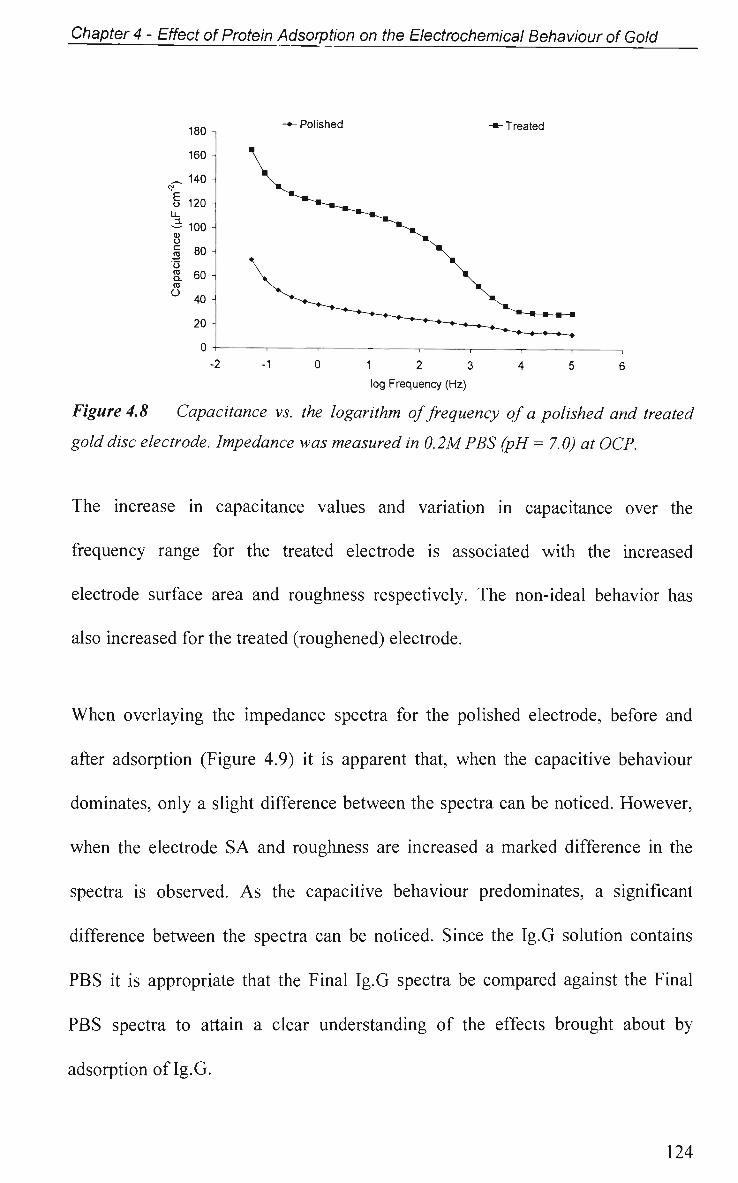
Chapter 4 - Effect of Protein Adsorption on the Electrochemical Behaviour of Gold
180 -^Polished -m- Treated
160 -
c<r- 140 "" I 120 -
Li.
~ 100 -o | 80 -o 2. 60 -co
° 40-20 -0 --2-10123456
log Frequency (Hz)
Figure 4.8 Capacitance vs. the logarithm of frequency of a polished and treated
gold disc electrode. Impedance was measured in 0.2MPBS (pH = 7.0) at OCP.
The increase in capacitance values and variation in capacitance over the
frequency range for the treated electrode is associated with the increased
electrode surface area and roughness respectively. The non-ideal behavior has
also increased for the treated (roughened) electrode.
When overlaying the impedance spectra for the polished electrode, before and
after adsorption (Figure 4.9) it is apparent that, when the capacitive behaviour
dominates, only a slight difference between the spectra can be noticed. However,
when the electrode SA and roughness are increased a marked difference in the
spectra is observed. As the capacitive behaviour predominates, a significant
difference between the spectra can be noticed. Since the Ig.G solution contains
PBS it is appropriate that the Final Ig.G spectra be compared against the Final
PBS spectra to attain a clear understanding of the effects brought about by
adsorption of Ig.G.
124
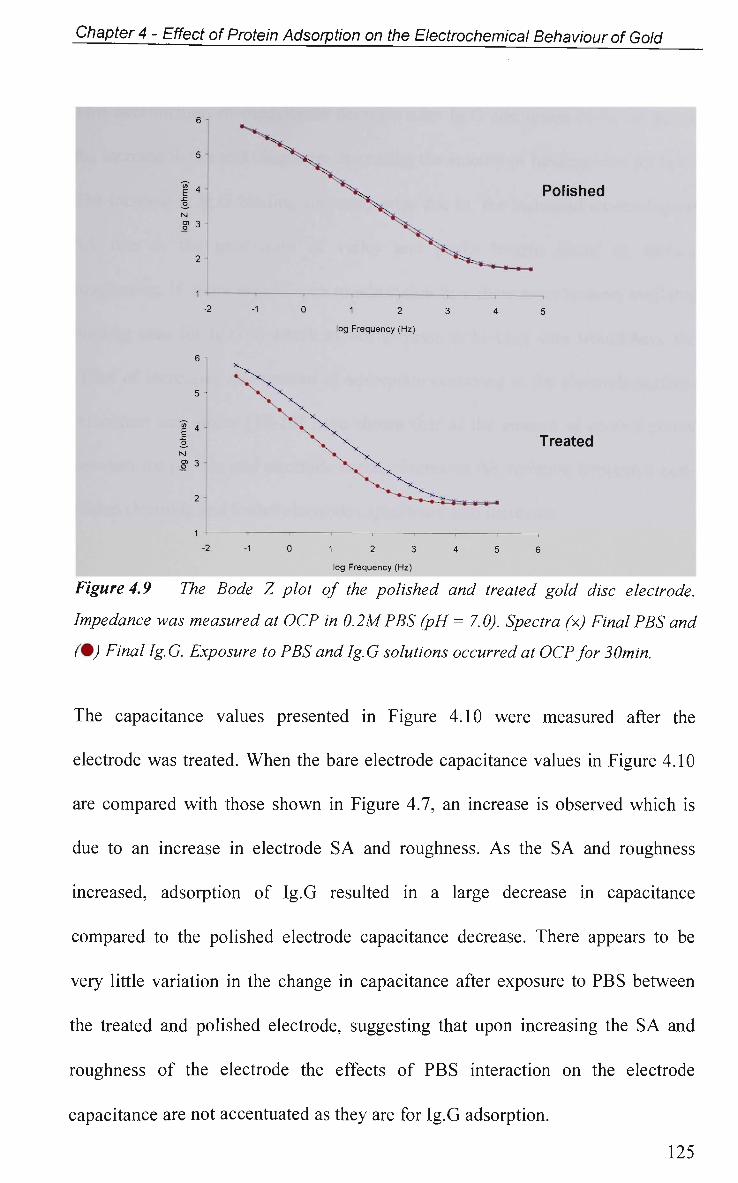
Chapter 4 - Effect of Protein Adsorption on the Electrochemical Behaviour of Gold
Figure 4.9 The Bode Z plot of the polished and treated gold disc electrode.
Impedance was measured at OCP in 0.2MPBS (pH = 7.0). Spectra (x) Final PBS and
(%) Final Ig.G Exposure to PBS and Ig.G solutions occurred at OCP for 30min.
The capacitance values presented in Figure 4.10 were measured after the
electrode was treated. W h e n the bare electrode capacitance values in Figure 4.10
are compared with those shown in Figure 4.7, an increase is observed which is
due to an increase in electrode S A and roughness. As the S A and roughness
increased, adsorption of Ig.G resulted in a large decrease in capacitance
compared to the polished electrode capacitance decrease. There appears to be
very little variation in the change in capacitance after exposure to P B S between
the treated and polished electrode, suggesting that upon increasing the S A and
roughness of the electrode the effects of P B S interaction on the electrode
capacitance are not accentuated as they are for Ig.G adsorption.
125
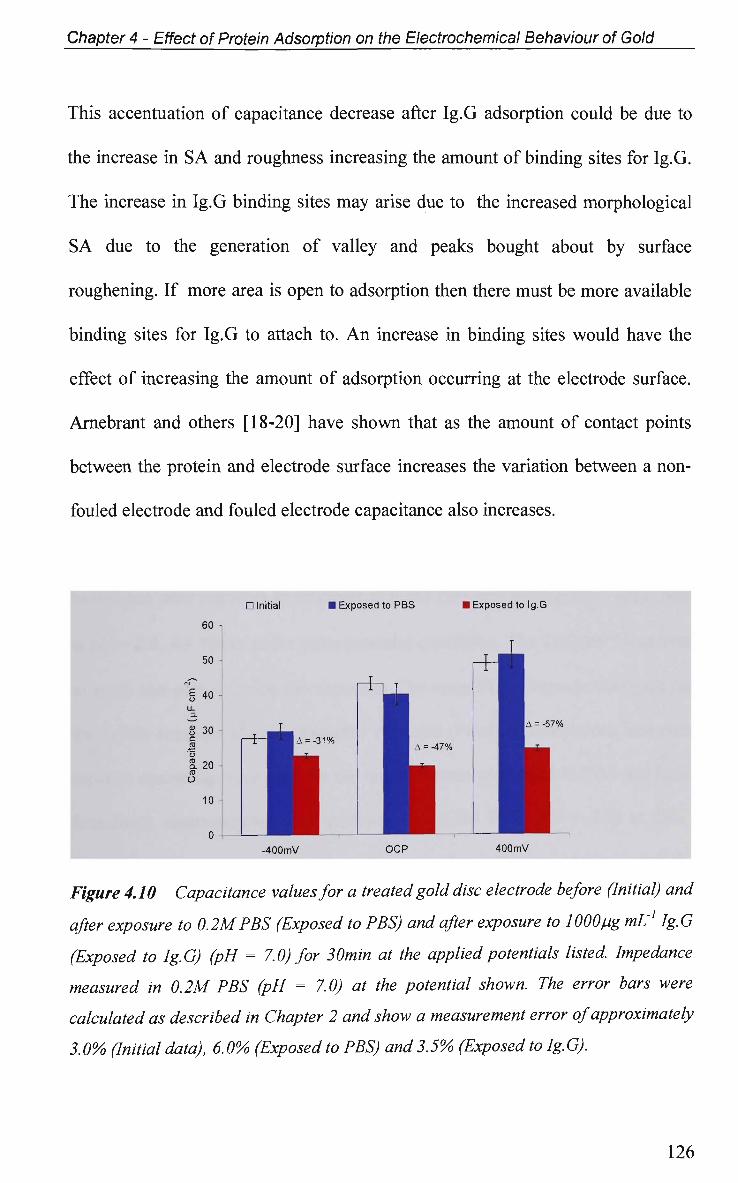
Chapter 4 - Effect of Protein Adsorption on the Electrochemical Behaviour of Gold
This accentuation of capacitance decrease after Ig.G adsorption could be due to
the increase in S A and roughness increasing the amount of binding sites for Ig.G.
The increase in Ig.G binding sites may arise due to the increased morphological
S A due to the generation of valley and peaks bought about by surface
roughening. If more area is open to adsorption then there must be more available
binding sites for Ig.G to attach to. A n increase in binding sites would have the
effect of increasing the amount of adsorption occurring at the electrode surface.
Arnebrant and others [18-20] have shown that as the amount of contact points
between the protein and electrode surface increases the variation between a non-
fouled electrode and fouled electrode capacitance also increases.
• Initial I Exposed to P B S I Exposed to Ig.G
31% -47%
A = -57%
-400mV OCP 400mV
Figure 4.10 Capacitance values for a treated gold disc electrode before (Initial) and
after exposure to 0.2MPBS (Exposed to PBS) and after exposure to 1000pg mL1 Ig.G
(Exposed to Ig.G) (pH = 7.0) for 30min at the applied potentials listed. Impedance
measured in 0.2M PBS (pH = 7.0) at the potential shown. The error bars were
calculated as described in Chapter 2 and show a measurement error of approximately
3.0% (Initial data), 6.0%> (Exposed to PBS) and 3.5% (Exposed to lg. G).
126
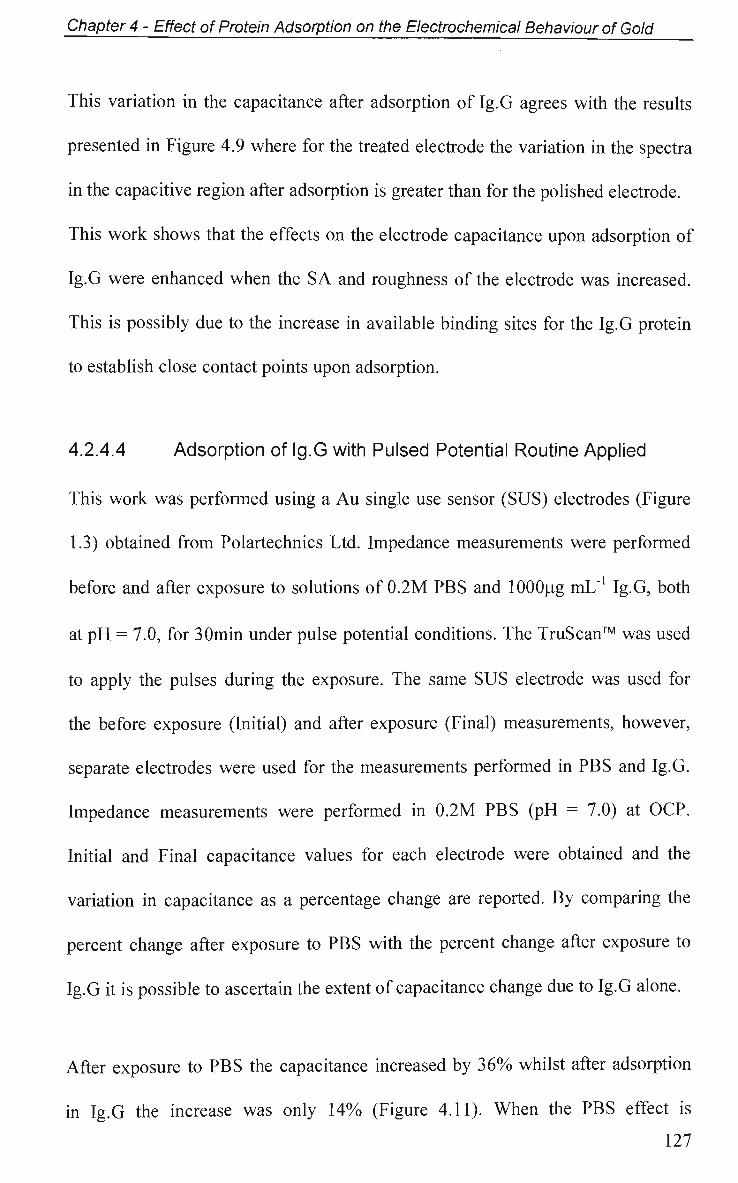
Chapter 4 - Effect of Protein Adsorption on the Electrochemical Behaviour of Gold
This variation in the capacitance after adsorption of Ig.G agrees with the results
presented in Figure 4.9 where for the treated electrode the variation in the spectra
in the capacitive region after adsorption is greater than for the polished electrode.
This work shows that the effects on the electrode capacitance upon adsorption of
Ig.G were enhanced when the S A and roughness of the electrode was increased.
This is possibly due to the increase in available binding sites for the Ig.G protein
to establish close contact points upon adsorption.
4.2.4.4 Adsorption of Ig.G with Pulsed Potential Routine Applied
This work was performed using a Au single use sensor (SUS) electrodes (Figure
1.3) obtained from Polartechnics Ltd. Impedance measurements were performed
before and after exposure to solutions of 0.2M P B S and lOOOpg mL"1 Ig.G, both
at pH = 7.0, for 30min under pulse potential conditions. The TruScan™ was used
to apply the pulses during the exposure. The same S U S electrode was used for
the before exposure (Initial) and after exposure (Final) measurements, however,
separate electrodes were used for the measurements performed in P B S and Ig.G.
Impedance measurements were performed in 0.2M P B S (pH = 7.0) at OCP.
Initial and Final capacitance values for each electrode were obtained and the
variation in capacitance as a percentage change are reported. By comparing the
percent change after exposure to P B S with the percent change after exposure to
Ig.G it is possible to ascertain the extent of capacitance change due to Ig.G alone.
After exposure to PBS the capacitance increased by 36% whilst after adsorption
in Ig.G the increase was only 1 4 % (Figure 4.11). W h e n the P B S effect is
127
Chapter 4 - Effect of Protein Adsorption on the Electrochemical Behaviour of Gold
removed from the Ig.G effect the net change in capacitance, due to Ig.G only, is a
decrease of 22%. This decrease in capacitance due to adsorption of Ig.G agrees
with the results presented above (Figure 4.7). TruScan applies a rapid 800mV
pulse to one electrode (working electrode) whilst the other two act as the counter
electrode. This pulse is applied to the next electrode whilst the other two act as
the counter. This pulsing routine is cycled around all three electrodes at a rate of
one pulse every 260p.s (see Section 1.2). Since this system is a two electrode
arrangement the 800mV is distributed between the working and counter
electrodes. Therefore when the working electrode is pulsed at 400mV the counter
electrode is poised at -400mV. This means that when the SUS electrode is pulsed
during exposure to the PBS and Ig.G solutions the electrodes are held at positive
and negative potentials. Therefore it is expected that after exposure under pulse
potential conditions the change in capacitance due to Ig.G adsorption should be
between that seen at positive and negative potential when adsorption occurs at
constant potential. The net decrease is 22%, which is between that observed for
adsorption at a constant positive (-35%) and negative (-21%) potential (see
Figure 4.7).
128
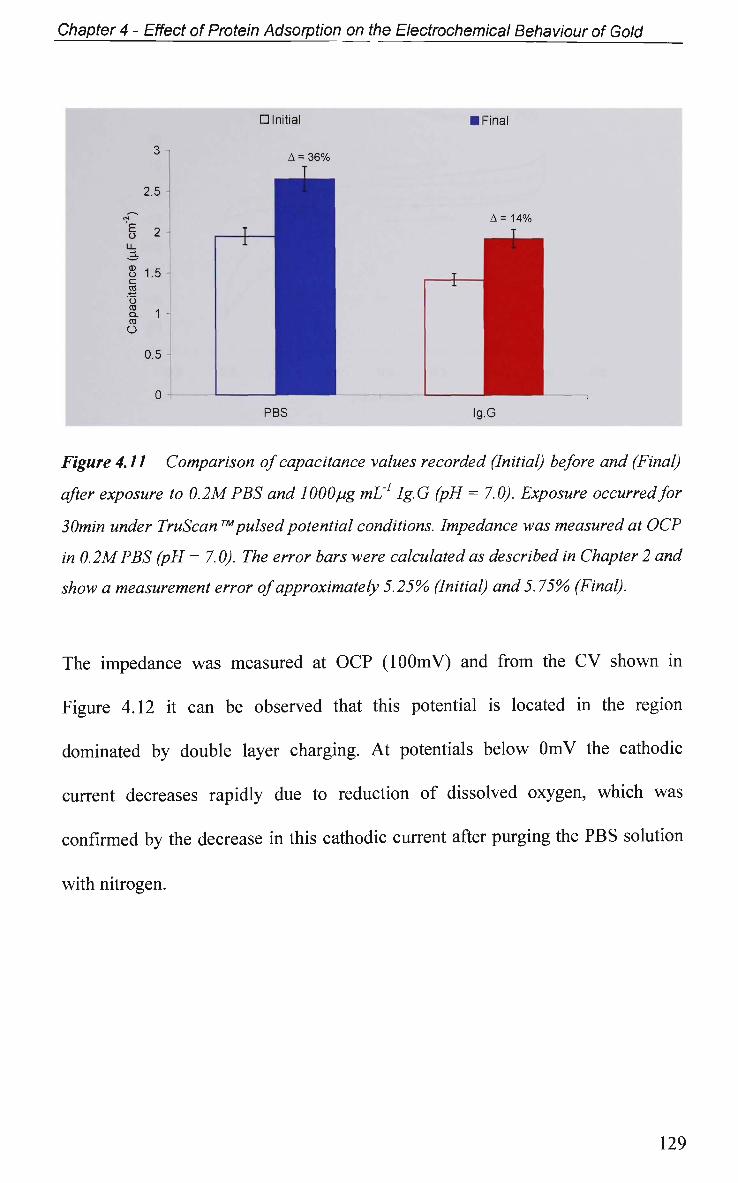
Chapter 4 - Effect of Protein Adsorption on the Electrochemical Behaviour of Gold
Figure 4.11 Comparison of capacitance values recorded (Initial) before and (Final)
after exposure to 0.2MPBS and 1000pg mL1 Ig.G (pH = 7.0). Exposure occurred for
30min under TruScan ™pulsed potential conditions. Impedance was measured at OCP
in 0.2MPBS (pH = 7.0). The error bars were calculated as described in Chapter 2 and
show a measurement error of approximately 5.25% (Initial) and 5.75% (Final).
The impedance was measured at OCP (lOOmV) and from the CV shown in
Figure 4.12 it can be observed that this potential is located in the region
dominated by double layer charging. At potentials below O m V the cathodic
current decreases rapidly due to reduction of dissolved oxygen, which was
confirmed by the decrease in this cathodic current after purging the P B S solution
with nitrogen.
129
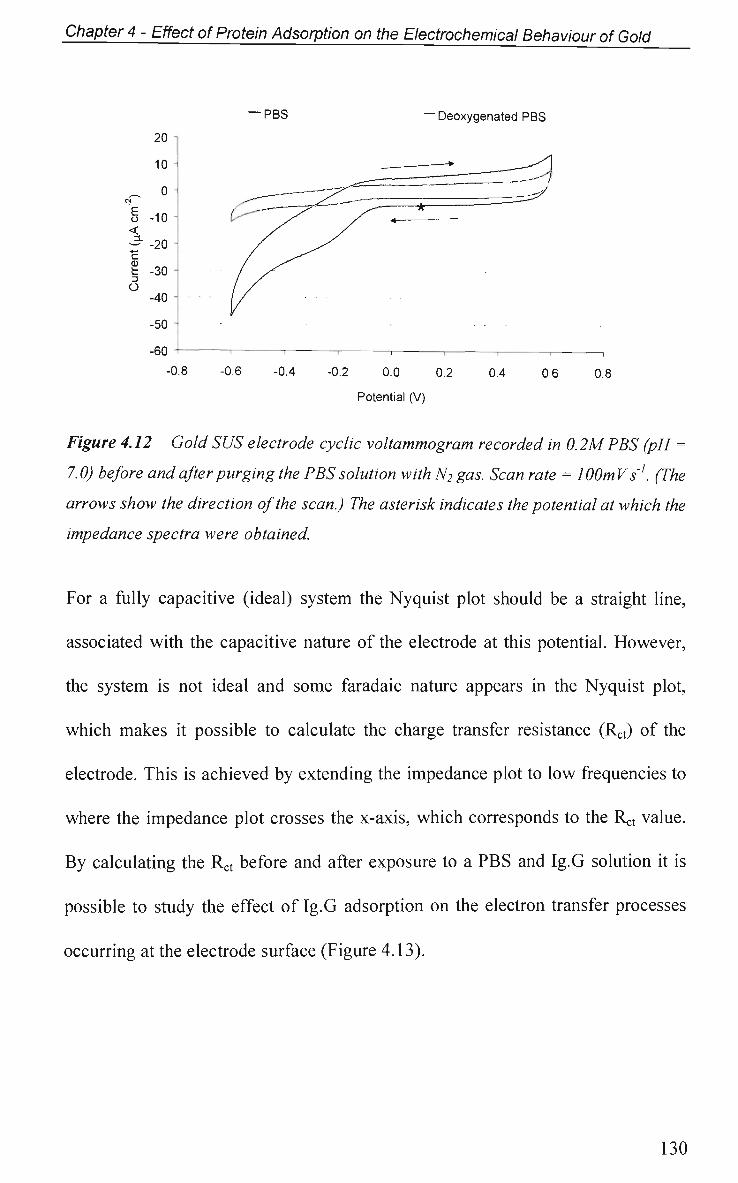
Chapter 4 - Effect of Protein Adsorption on the Electrochemical Behaviour of Gold
Potential (V)
Figure 4.12 Gold SUS electrode cyclic voltammogram recorded in 0.2M PBS (pH =
7.0) before and after purging the PBS solution with N2 gas. Scan rate = WOmVs'1. (The
arrows show the direction of the scan.) The asterisk indicates the potential at which the
impedance spectra were obtained.
For a fully capacitive (ideal) system the Nyquist plot should be a straight line,
associated with the capacitive nature of the electrode at this potential. However,
the system is not ideal and some faradaic nature appears in the Nyquist plot,
which makes it possible to calculate the charge transfer resistance (Rct) of the
electrode. This is achieved by extending the impedance plot to low frequencies to
where the impedance plot crosses the x-axis, which corresponds to the Rct value.
By calculating the Rct before and after exposure to a P B S and Ig.G solution it is
possible to study the effect of Ig.G adsorption on the electron transfer processes
occurring at the electrode surface (Figure 4.13).
130
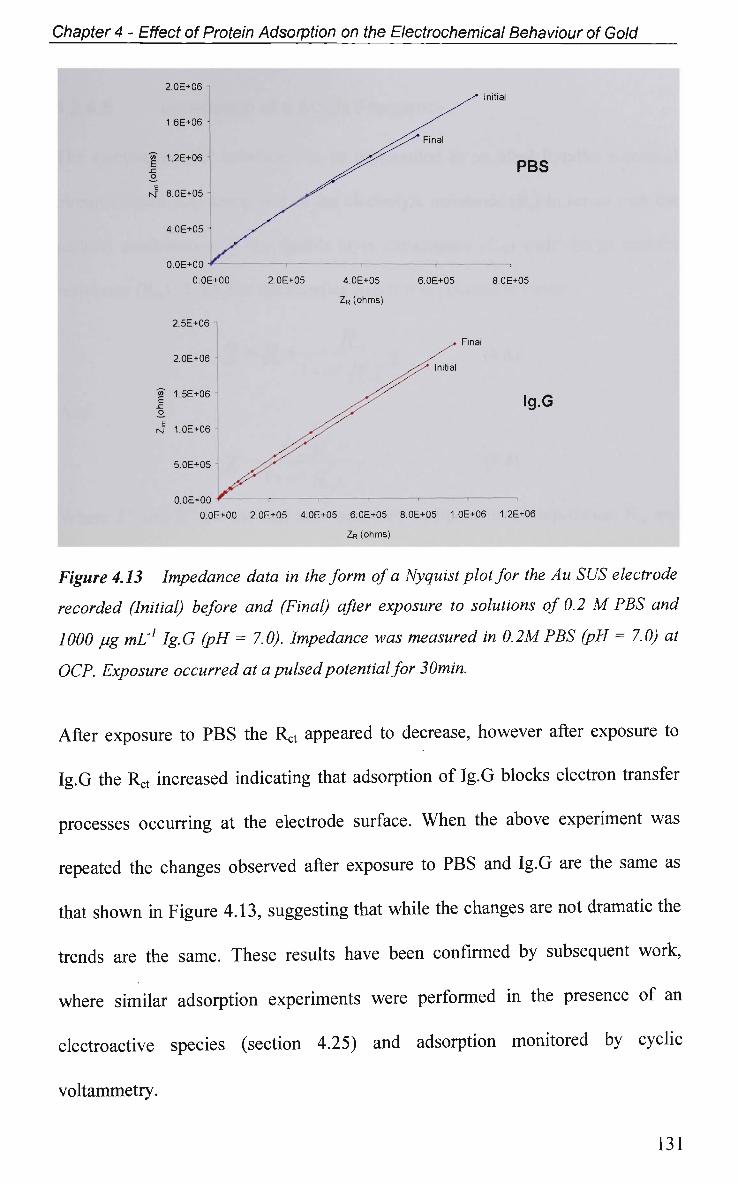
Chapter 4 - Effect of Protein Adsorption on the Electrochemical Behaviour of Gold
2.OE+05 4.0E+05 6 OE+05
ZR (ohms)
nitial
PBS
8.0E+05
5 OE+05 -
O.OE+00
Ig.G
O.OE+00 2.0E+05 4.0E+05 6.0E+05 8 OE+05 1.0E+06 1.2E+06
ZR (ohms)
Figure 4.13 Impedance data in the form of a Nyquist plot for the Au SUS electrode
recorded (Initial) before and (Final) after exposure to solutions of 0.2 M PBS and
1000 pg mL1 Ig.G (pH = 7.0). Impedance was measured in 0.2MPBS (pH = 7.0) at
OCP. Exposure occurred at a pulsed potential for 3 Omin.
After exposure to PBS the Rct appeared to decrease, however after exposure to
Ig.G the Rct increased indicating that adsorption of Ig.G blocks electron transfer
processes occurring at the electrode surface. W h e n the above experiment was
repeated the changes observed after exposure to P B S and Ig.G are the same as
that shown in Figure 4.13, suggesting that while the changes are not dramatic the
trends are the same. These results have been confirmed by subsequent work,
where similar adsorption experiments were performed in the presence of an
electroactive species (section 4.25) and adsorption monitored by cyclic
voltammetry.
131
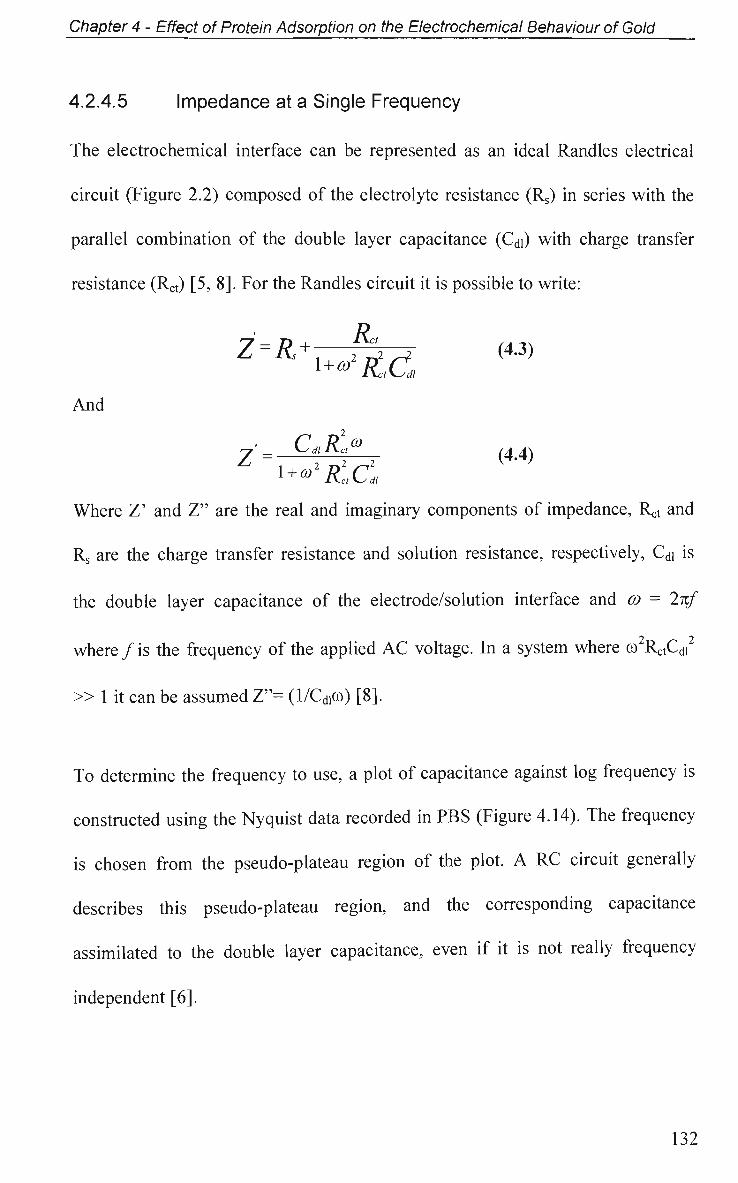
Chapter 4 - Effect of Protein Adsorption on the Electrochemical Behaviour of Gold
4.2.4.5 Impedance at a Single Frequency
The electrochemical interface can be represented as an ideal Randies electrical
circuit (Figure 2.2) composed of the electrolyte resistance (Rs) in series with the
parallel combination of the double layer capacitance (Cdi) with charge transfer
resistance (Rct) [5, 8]. For the Randies circuit it is possible to write:
Z=R+. h, (4.3) 1+<y &C*
And CnRc,"
2 CD
(4.4)
Where Z' and Z" are the real and imaginary components of impedance, Rct and
Rs are the charge transfer resistance and solution resistance, respectively, Cdi is
the double layer capacitance of the electrode/solution interface and co = 2%f
0 0
where/is the frequency of the applied A C voltage. In a system where co RctCdi
» 1 it can be assumed Z"= (l/Cdlco) [8].
To determine the frequency to use, a plot of capacitance against log frequency is
constructed using the Nyquist data recorded in PBS (Figure 4.14). The frequency
is chosen from the pseudo-plateau region of the plot. A RC circuit generally
describes this pseudo-plateau region, and the corresponding capacitance
assimilated to the double layer capacitance, even if it is not really frequency
independent [6].
132
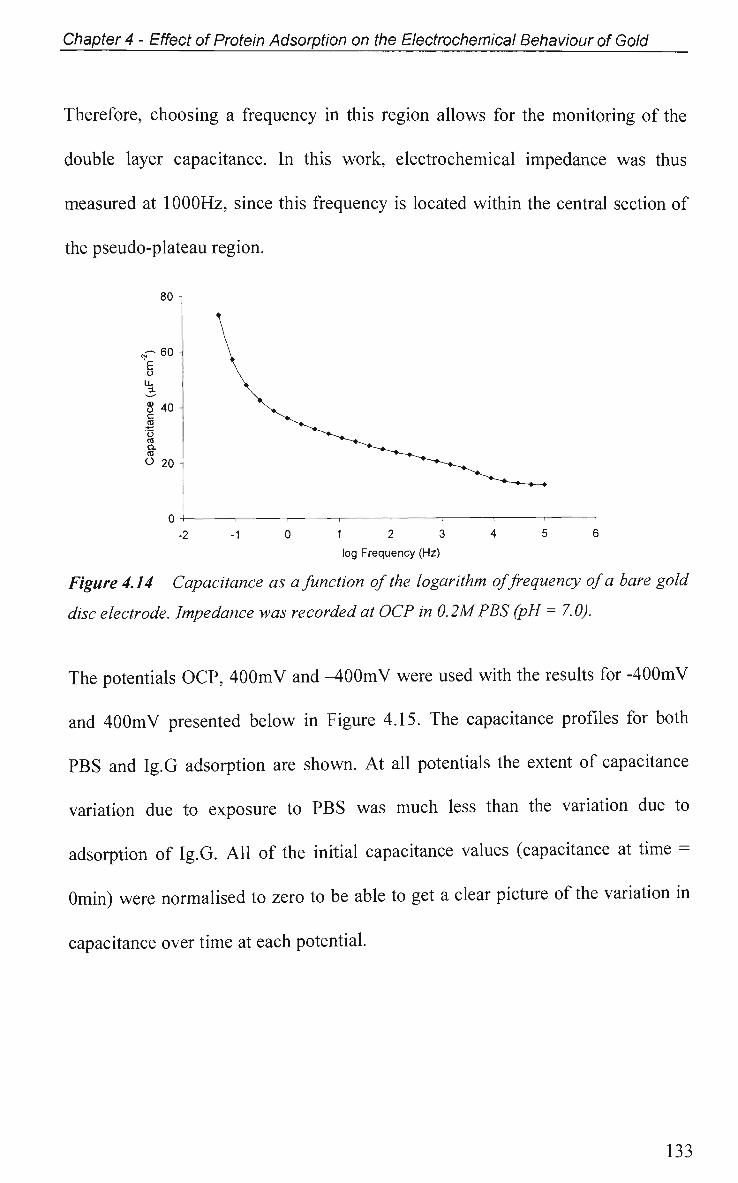
Chapter 4 - Effect of Protein Adsorption on the Electrochemical Behaviour of Gold
Therefore, choosing a frequency in this region allows for the monitoring of the
double layer capacitance. In this work, electrochemical impedance was thus
measured at 1000Hz, since this frequency is located within the central section of
the pseudo-plateau region.
80 -
rf- 60 - \
o \ LL \ 1 \
2M0 \> o ^*~^~^ to ^ ^ - ^ Q- ^^--•^_
° 20 ̂ ^ ^ ^ ~ ^ ^
0 -I , 1 1 1 1 1 1 •
- 2 - 1 0 1 2 3 4 5 6
log Frequency (Hz)
Figure 4.14 Capacitance as a function of the logarithm of frequency of a bare gold
disc electrode. Impedance was recorded at OCP in 0.2MPBS (pH = 7.0).
The potentials OCP, 400mV and -400mV were used with the results for -400mV
and 400mV presented below in Figure 4.15. The capacitance profiles for both
PBS and Ig.G adsorption are shown. At all potentials the extent of capacitance
variation due to exposure to PBS was much less than the variation due to
adsorption of Ig.G. All of the initial capacitance values (capacitance at time =
Omin) were normalised to zero to be able to get a clear picture of the variation in
capacitance over time at each potential.
133
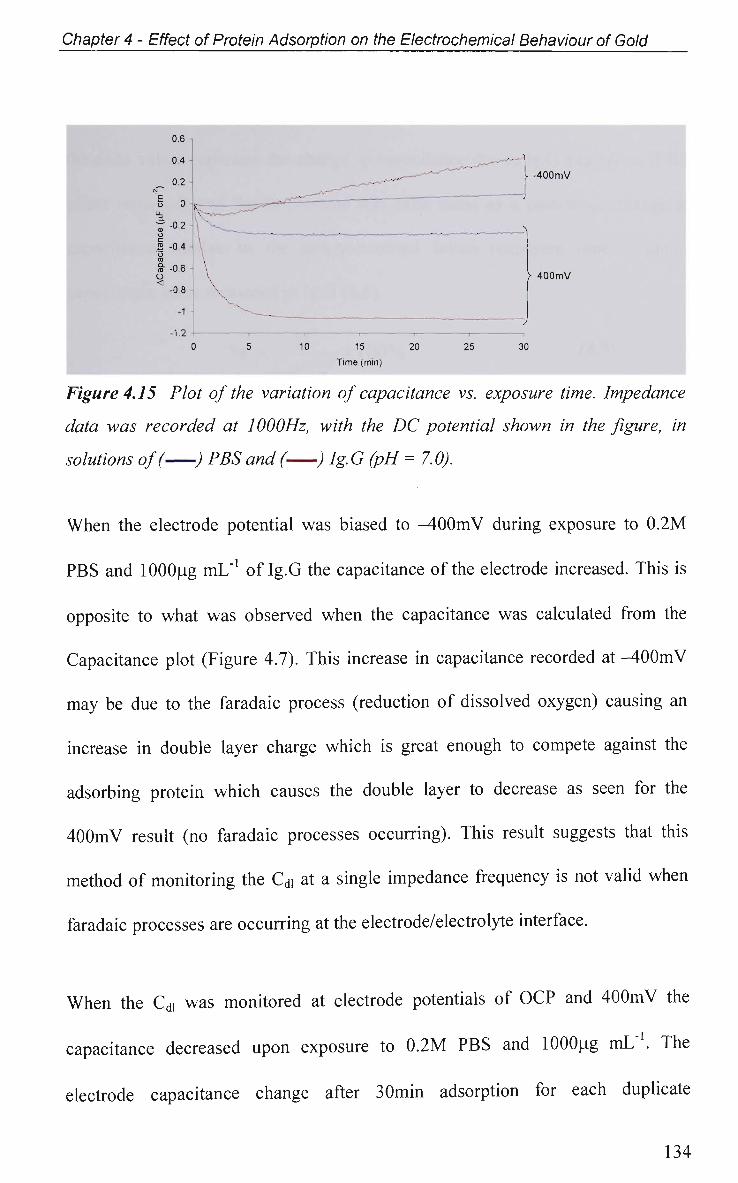
Chapter 4 - Effect of Protein Adsorption on the Electrochemical Behaviour of Gold
V 400mV
5 10 15 20 25 30
Time (min)
Figure 4.15 Plot of the variation of capacitance vs. exposure time. Impedance
data was recorded at 1000Hz, with the DC potential shown in the figure, in
solutions of( ; PBS and ( ; Ig.G (pH = 7.0).
When the electrode potential was biased to -400mV during exposure to 0.2M
PBS and lOOOug mL"1 of Ig.G the capacitance of the electrode increased. This is
opposite to what was observed when the capacitance was calculated from the
Capacitance plot (Figure 4.7). This increase in capacitance recorded at -400m V
may be due to the faradaic process (reduction of dissolved oxygen) causing an
increase in double layer charge which is great enough to compete against the
adsorbing protein which causes the double layer to decrease as seen for the
400mV result (no faradaic processes occurring). This result suggests that this
method of monitoring the Cdi at a single impedance frequency is not valid when
faradaic processes are occurring at the electrode/electrolyte interface.
When the Cdi was monitored at electrode potentials of OCP and 400mV the
capacitance decreased upon exposure to 0.2M P B S and lOOOug mL"1. The
electrode capacitance change after 30min adsorption for each duplicate
134
E u_ a cu u c ro ro CL
O <
0.6 i
0.4
0? -
0 -
-0.2 -
-0.4
-0 6
-0.8
-1
0
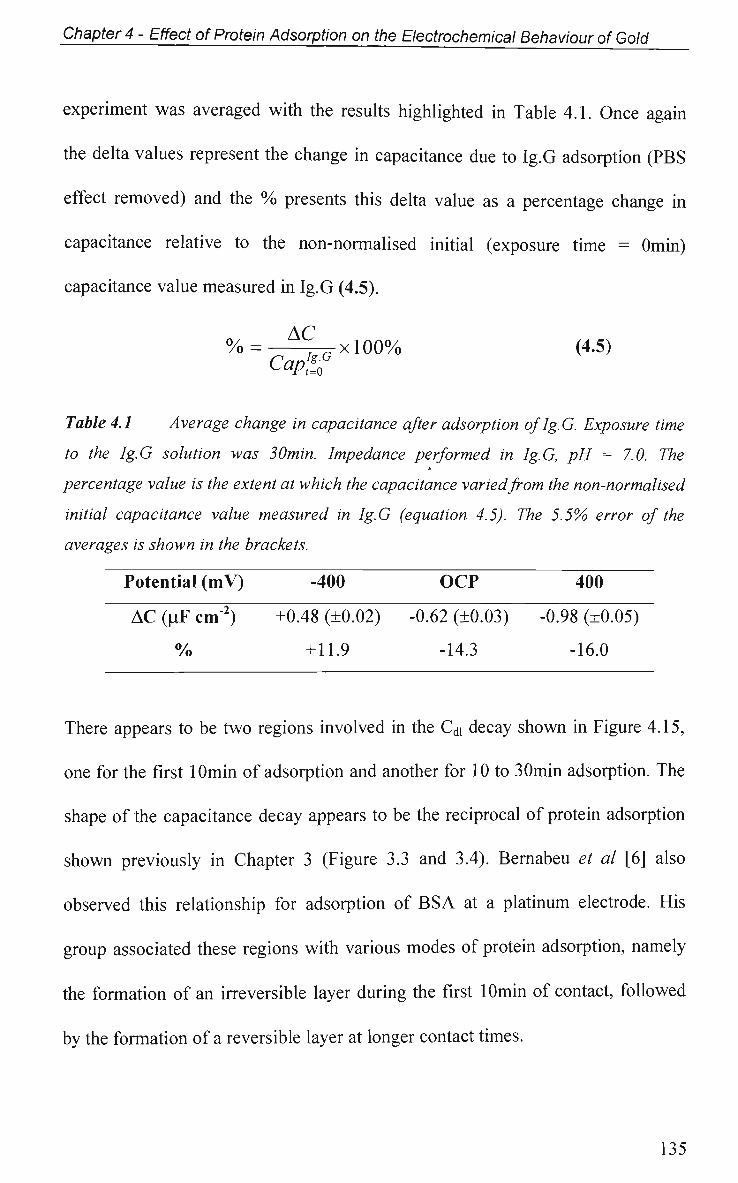
Chapter 4 - Effect of Protein Adsorption on the Electrochemical Behaviour of Gold
experiment was averaged with the results highlighted in Table 4.1. Once again
the delta values represent the change in capacitance due to Ig.G adsorption (PBS
effect removed) and the % presents this delta value as a percentage change in
capacitance relative to the non-normalised initial (exposure time = Omin)
capacitance value measured in Ig.G (4.5).
AC % = r ^ x l 0 0 % (4.5)
Capl%G
Table 4.1 Average change in capacitance after adsorption of Ig.G. Exposure time
to the Ig.G solution was 30min. Impedance performed in Ig.G, pH = 7.0. The
percentage value is the extent at which the capacitance varied from the non-normalised
initial capacitance value measured in Ig.G (equation 4.5). The 5.5% error of the
averages is shown in the brackets.
Potential (mV) -400 " OCT 400
A C (uF cm'1) +0.48 (±0.02) -0.62 (±0.03) -0.98 (±0.05)
% +11.9 -14.3 -16.0
There appears to be two regions involved in the Cdi decay shown in Figure 4.15,
one for the first lOmin of adsorption and another for 10 to 3Omin adsorption. The
shape of the capacitance decay appears to be the reciprocal of protein adsorption
shown previously in Chapter 3 (Figure 3.3 and 3.4). Bernabeu et al [6] also
observed this relationship for adsorption of B S A at a platinum electrode. His
group associated these regions with various modes of protein adsorption, namely
the formation of an irreversible layer during the first lOmin of contact, followed
by the formation of a reversible layer at longer contact times.
135
Chapter 4 - Effect of Protein Adsorption on the Electrochemical Behaviour of Gold
Since in all cases, except -400mV, 98% of the total Cdi change occurs in the first
lOmin, it appears that only the adsorption of the irreversible layer can be
monitored using the double layer capacitance method. These results are in
agreement with work performed by others [18-20]. These workers concluded that
the capacitance decrease, recorded when protein adsorbs at an interface, is related
to the number of close contact points formed between the protein and the surface.
Therefore, at adsorption time t = Omin there are many available sites for the
protein to bind to, and as a result many contact points are formed. As the
electrode surface becomes coated in protein, the amount of available sites for
protein binding become less and the rate at which these contact points are formed
decreases.
It is interesting to note that 98% of the Cdi change occurs in the first lOmin of
adsorption whilst the radiolabelling work showed only -50% of surface coverage
of Ig.G at this time. This indicates that the Ig.G adsorbing after this time has little
to no effect on the electrode capacitance variation. However, the adsorption
results are of those using an Ig.G concentration of lOOpg mL"1 whilst this work is
performed in lOOOug mL"1. It may be possible that at this concentration an
adsorption maximum may have been reach after lOmin adsorption.
136
Chapter 4 - Effect of Protein Adsorption on the Electrochemical Behaviour of Gold
4.2.5 Faradaic - Electron Transfer Effects
4.2.5.1 Cyclic Voltammetry in K3Fe(CN)6
4.2.5.1.1 Adsorption at OCP
The results presented here were obtained using a protein concentration of
lOOu-g mL" . This concentration allowed for observable and reproducible results
to be recorded and enabled the comparison of this work with the adsorption
results presented in Chapter 3. The proteins HSA and Ig.G were both used for
this work to investigate the effect of protein size on the electron transfer blocking
process. Figure 4.16 shows successive CVs in ferricyanide after adsorption in
lOOpg mL"1 HSA or Ig.G (pH = 7.0) at OCP for various lengths of time. The
anodic currents are shown as positive currents whereas the cathodic currents are
negative. All CVs were scanned in the positive direction from OCP. For all CVs
a blank in PBS was performed at all adsorption times, pH, and applied potential.
In all sets this blank CV showed very little variation from the bare electrode CV
indicating that the change in CV after contact with the protein/PBS solution is
due solely to the protein.
137
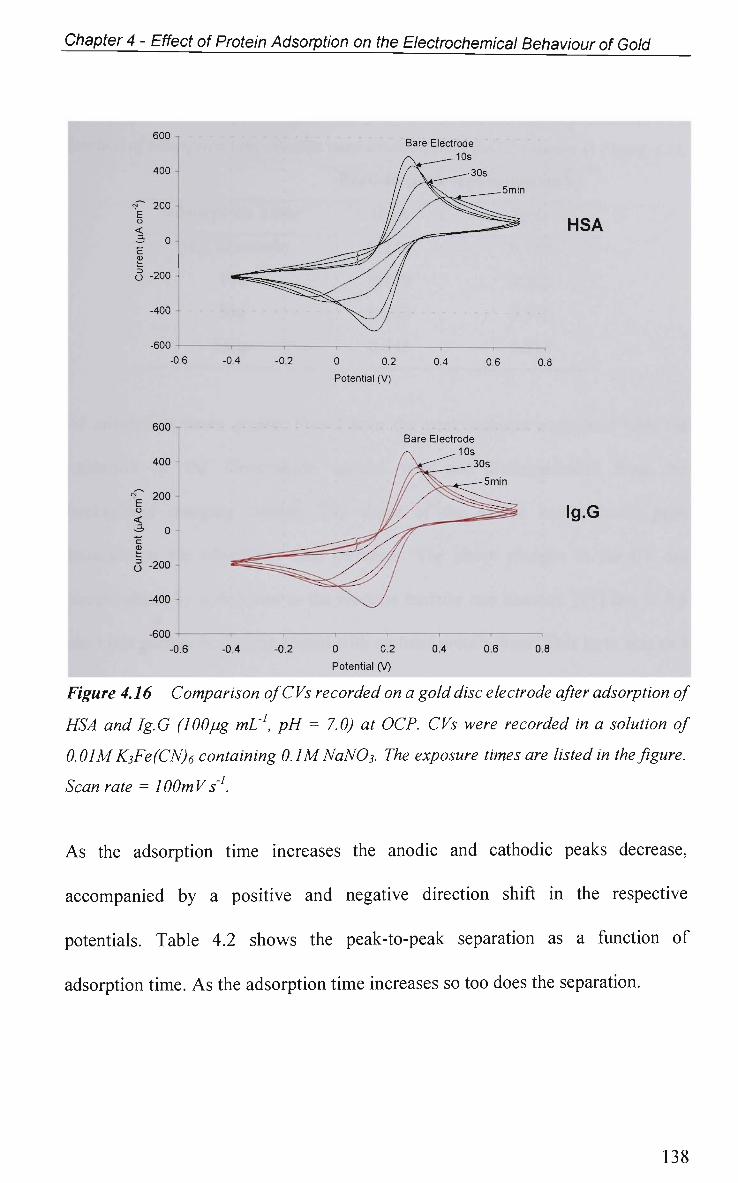
Chapter 4 - Effect of Protein Adsorption on the Electrochemical Behaviour of Gold
600 -
400
200
<
o -200
-400
-600
-0.6 -0.4 -0.2
Bare Electrode 10s
5mm
0 0.2
Potential (V)
0.4 0.6
HSA
08
O
600
400
200
0 -
-200
-400
-600
-0.6 -0.4 -0.2
Bare Electrode 10s
0 0.2
Potential (V)
0.4 0.6
Ig.G
0.8
Figure 4.16 Comparison of CVs recorded on a gold disc electrode after adsorption of
HSA and Ig.G (lOOpg mL1, pH = 7.0) at OCP. CVs were recorded in a solution of
0.0lMKiFe(CN)6 containing 0.1MNaNO3. The exposure times are listed in the figure.
Scan rate = lOOmVs'.
As the adsorption time increases the anodic and cathodic peaks decrease,
accompanied by a positive and negative direction shift in the respective
potentials. Table 4.2 shows the peak-to-peak separation as a function of
adsorption time. A s the adsorption time increases so too does the separation.
138
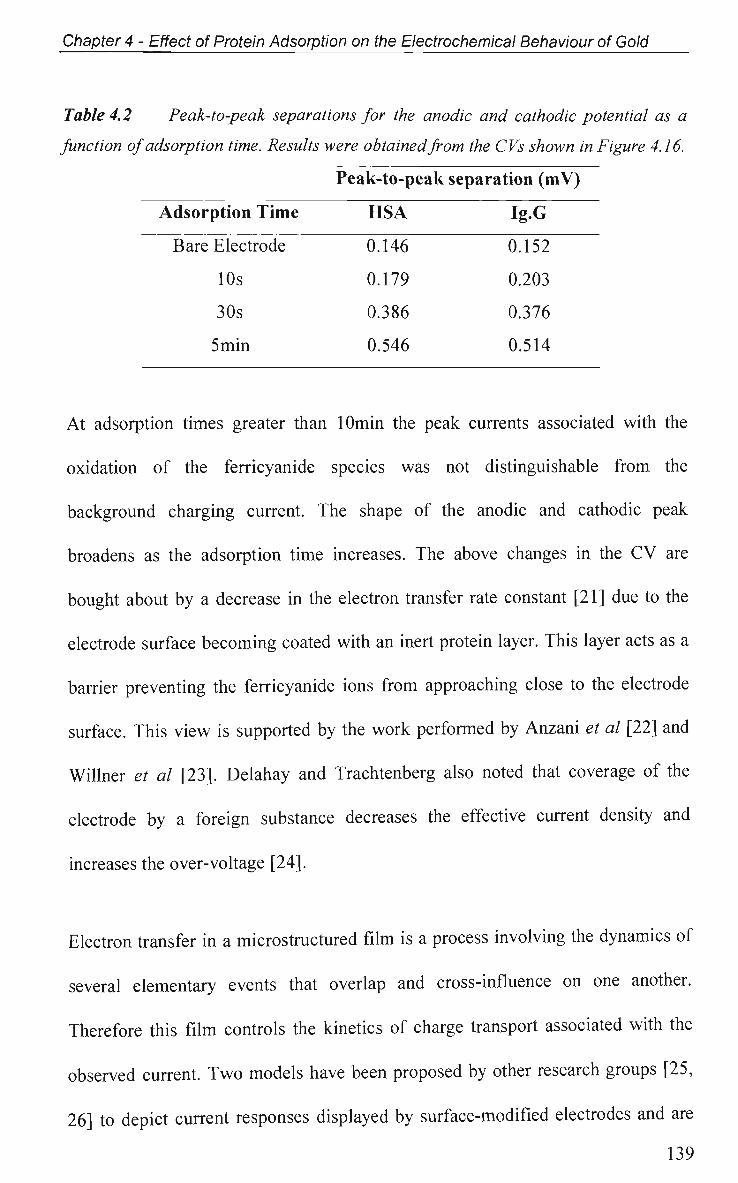
Chapter 4 - Effect of Protein Adsorption on the Electrochemical Behaviour of Gold
Table 4.2 Peak-to-peak separations for the anodic and cathodic potential as a
function of adsorption time. Results were obtained from the CVs shown in Figure 4.16.
Peak-to-peak separation (mV)
Adsorption Time H S A Ig.G
Bare Electrode 0.146 0.152
10s 0.179 0.203
30s 0.386 0.376
5min 0.546 0.514
At adsorption times greater than lOmin the peak currents associated with the
oxidation of the ferricyanide species was not distinguishable from the
background charging current. The shape of the anodic and cathodic peak
broadens as the adsorption time increases. The above changes in the C V are
bought about by a decrease in the electron transfer rate constant [21] due to the
electrode surface becoming coated with an inert protein layer. This layer acts as a
barrier preventing the ferricyanide ions from approaching close to the electrode
surface. This view is supported by the work performed by Anzani et al [22] and
Willner et al [23]. Delahay and Trachtenberg also noted that coverage of the
electrode by a foreign substance decreases the effective current density and
increases the over-voltage [24].
Electron transfer in a microstructured film is a process involving the dynamics of
several elementary events that overlap and cross-influence on one another.
Therefore this film controls the kinetics of charge transport associated with the
observed current. T w o models have been proposed by other research groups [25,
26] to depict current responses displayed by surface-modified electrodes and are
139
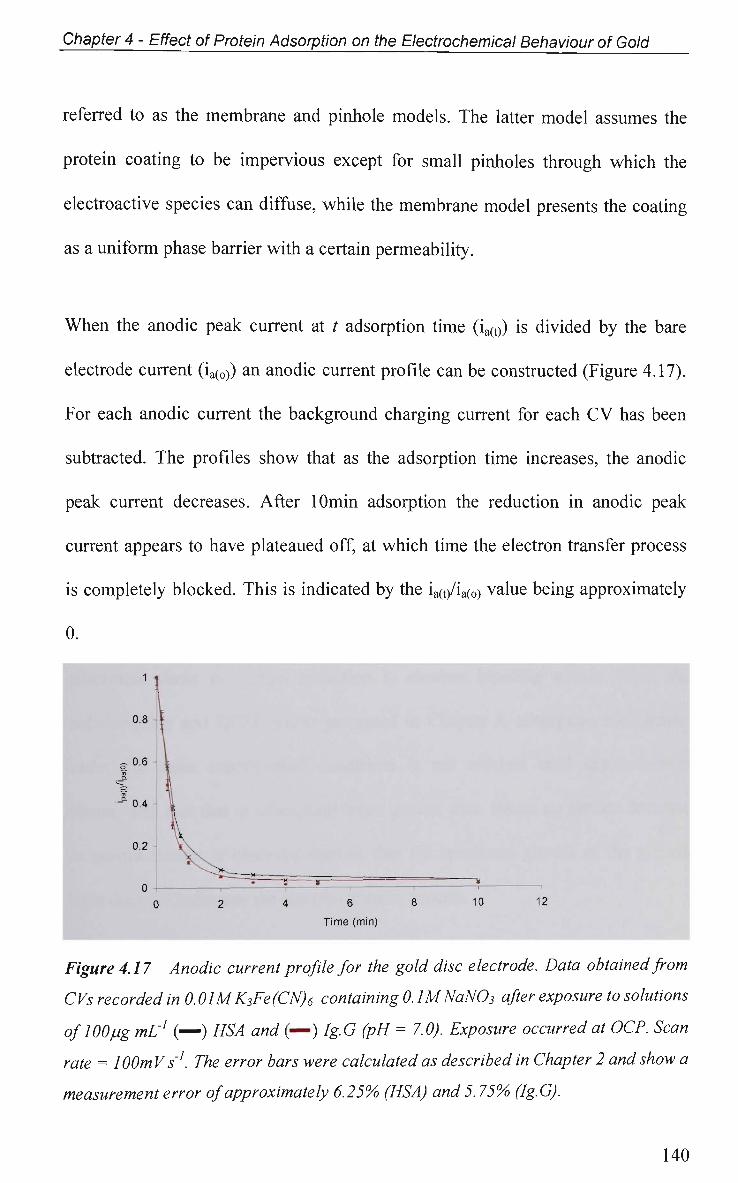
Chapter 4 - Effect of Protein Adsorption on the Electrochemical Behaviour of Gold
referred to as the membrane and pinhole models. The latter model assumes the
protein coating to be impervious except for small pinholes through which the
electroactive species can diffuse, while the membrane model presents the coating
as a uniform phase barrier with a certain permeability.
When the anodic peak current at t adsorption time (ia(t)) is divided by the bare
electrode current (ia(0)) an anodic current profile can be constructed (Figure 4.17).
For each anodic current the background charging current for each CV has been
subtracted. The profiles show that as the adsorption time increases, the anodic
peak current decreases. After lOmin adsorption the reduction in anodic peak
current appears to have plateaued off, at which time the electron transfer process
is completely blocked. This is indicated by the ia(t)/ia(o) value being approximately
0.
2 4 6 8 10 12
Time (min)
Figure 4.17 Anodic current profile for the gold disc electrode. Data obtained from
CVs recorded in 0.01MK3Fe(CN)6 containing 0. !MNaN03 after exposure to solutions
oflOOpg mL1 (—) HSA and (—) Ig.G (pH = 7.0). Exposure occurred at OCP. Scan
rate = lOOmVs'1. The error bars were calculated as described in Chapter 2 and show a
measurement error of approximately 6.25% (HSA) and 5.75% (Ig.G).
140
Chapter 4 - Effect of Protein Adsorption on the Electrochemical Behaviour of Gold
The rate and extent of electron blocking for both HSA and Ig.G appear to be the
same at all time over the lOmin adsorption period. However, when the adsorbed
amounts (adsorption at O C P ) are compared for H S A and Ig.G at lOmin (Chapter
3 - Figure 3.6) there appears to be approximately twice as much Ig.G adsorbed
compared to H S A , although, due to their different molecular mass the number of
adsorbed molecules are very similar. W h e n the number of adsorbed molecules is
converted into volume occupied it shows that the Ig.G molecules occupy
approximately twice the volume of the H S A molecules. While the volume of the
adsorbed H S A layer is smaller than that of the adsorbed Ig.G the extent of
electron blocking is the same which suggests that the H S A protein layer is more
effective in blocking the electron transfer process than Ig.G.
The appearance of the plateau region at lOmin adsorption indicates that at longer
adsorption times no further reduction in electron blocking occurs. From the
radiolabelling and Q C M results presented in Chapter 3, adsorption equilibrium
under the same experimental conditions is not reached until approximately
60min. The fact that at adsorption times greater than lOmin no further decrease
in anodic current is observed implies that the continued growth of the protein
layer does not influence the electron transfer process.
4.2.5.1.2 Effect of Applied Potential during Adsorption
In this work a potential is applied to the electrode during the adsorption of H S A
and Ig.G from solutions of p H = 7.0. At this p H the proteins carry a negative
charge. From the adsorption work presented in Chapter 3 it was found that by
141
Chapter 4 - Effect of Protein Adsorption on the Electrochemical Behaviour of Gold
applying a potential to the electrode during adsorption the amount of adsorbed
protein varied.
The anodic current profiles presented in Figure 4.18 shows the effect of varying
the applied potential during adsorption. Like the profiles shown in Figure 4.17,
the adsorption profiles have reached a plateau by lOmin adsorption. Figure 4.18
demonstrates clearly that the electron blocking nature of the protein film on a
gold electrode varies under the influence of the electrode potential applied during
adsorption.
The extent to which the ia(t)/ia(o) value decrease indicates the level of protein layer
formation. The degree of layer formation can be attributed to the amount of
adsorbed protein. Therefore, the amount of electrode coverage increases as the
ia(t/ia(o) value approaches zero. It can be seen in Figure 4.18 that for both proteins
the extent of electron transfer blocking is approximately the same at 700mV and
OCP after lOmin adsorption, whilst for -800mV it is less. The -800mV result for
both proteins show that after lOmin of adsorption the ia(t)/ia(o) value is
approximately 0.2, suggesting not all of the electron transfer is blocked. These
results indicate that for both proteins the amount of adsorbed protein is greatest
when the electrode potential is 700mV followed by OCP with the least amount
being adsorbed at -800mV. These results may be explained by considering
electrostatic influences. Since both proteins carry a negative charge adsorption at
positive surfaces (700mV and OCP) will be favoured over negative surfaces
142
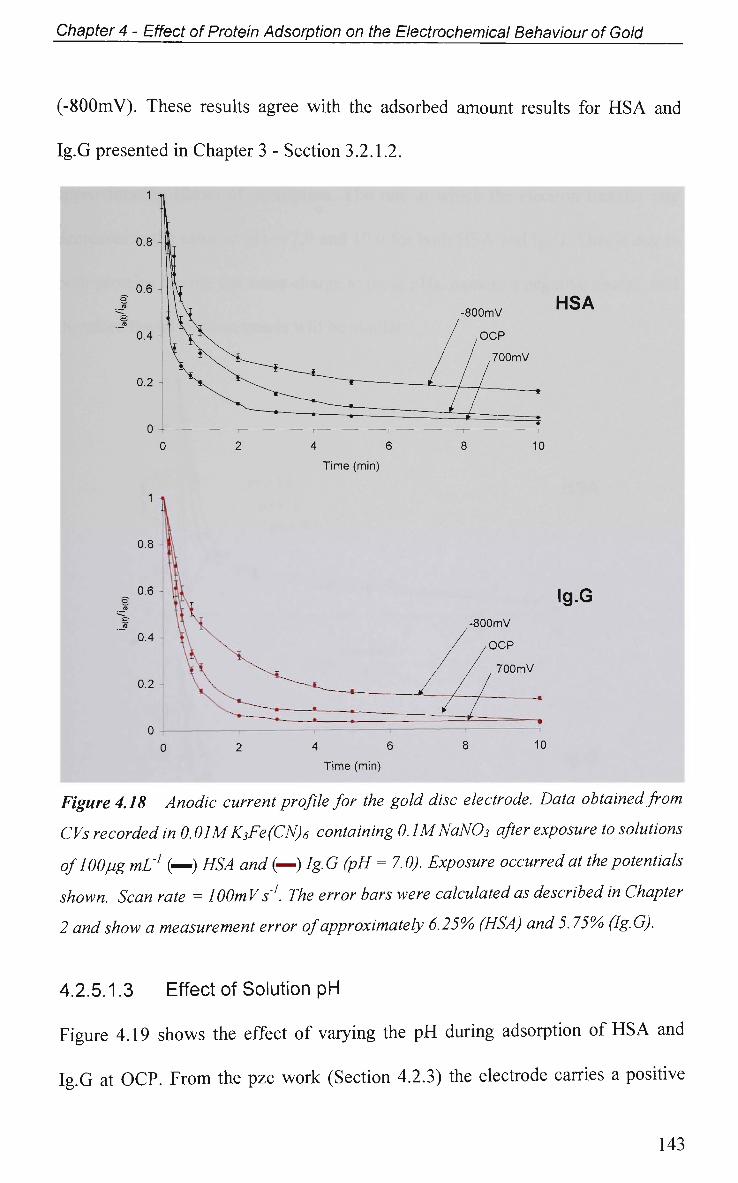
Chapter 4 - Effect of Protein Adsorption on the Electrochemical Behaviour of Gold
(-800mV). These results agree with the adsorbed amount results for H S A and
Ig.G presented in Chapter 3 - Section 3.2.1.2.
4 6
Time (min)
4 6
Time (min)
HSA
10
Ig.G
10
Figure 4.18 Anodic current profile for the gold disc electrode. Data obtained from
CVs recorded in 0.01MK3Fe(CN)6 containing 0. lMNaN03 after exposure to solutions
oflOOpg mL1 (—) HSA and (—) Ig.G (pH = 7.0). Exposure occurred at the potentials
shown. Scan rate = WOmVs'1. The error bars were calculated as described in Chapter
2 and show a measurement error of approximately 6.25% (HSA) and 5.75%> (Ig.G).
4.2.5.1.3 Effect of Solution pH
Figure 4.19 shows the effect of varying the p H during adsorption of H S A and
Ig.G at O C P . From the pzc work (Section 4.2.3) the electrode carries a positive
143
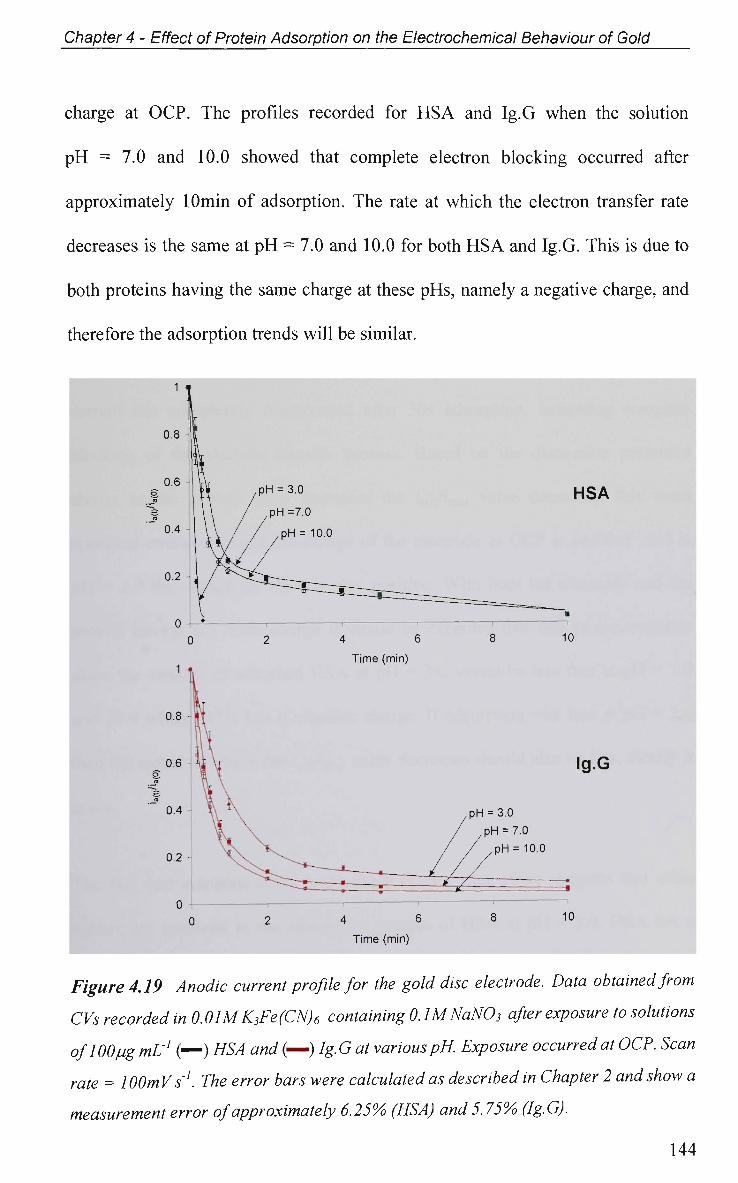
Chapter 4 - Effect of Protein Adsorption on the Electrochemical Behaviour of Gold
charge at OC P . The profiles recorded for H S A and Ig.G when the solution
p H = 7.0 and 10.0 showed that complete electron blocking occurred after
approximately lOmin of adsorption. The rate at which the electron transfer rate
decreases is the same at p H = 7.0 and 10.0 for both H S A and Ig.G. This is due to
both proteins having the same charge at these pHs, namely a negative charge, and
therefore the adsorption trends will be similar.
1 1
0.8
0.6 O
"nT
0.4 -
0.2 -
r\
o -c
1 <
0.8
0.6 O
-? "JS"
0.4
0.2
0 I
|S pH = 3.0
\\ / /PH=7-° \ V / / 7pH= 10.0
•
) 2 4 6
Time (min)
\l \T ffl 7
^^-C •—• • ^ •- »
1 i
3 2 4 6
Time (min)
8
pH = 3.0
/ pH = 7.0
/ / 7PH= 10.0
—j/~/- — *
8
HSA
•
10
Ig.G
—* — •
10
Figure 4.19 Anodic current profile for the gold disc electrode. Data obtained from
CVs recorded in 0.01MK3Fe(CN)6 containing 0. lMNaN03 after exposure to solutions
oflOOpg mL1 (—) HSA and (—) lg. G at various pH. Exposure occurred at OCP. Scan
rate = lOOmVs'1. The error bars were calculated as described in Chapter 2 and show a
measurement error of approximately 6.25% (HSA) and 5.75%> (Ig.G).
144
Chapter 4 - Effect of Protein Adsorption on the Electrochemical Behaviour of Gold
The profile for Ig.G adsorption from a solution pH = 3.0 shows that the rate and
extent of electron transfer blocking is less than pH = 7.0 and 10.0 after lOmin
adsorption. This is due to the fact that at pH = 3.0 the electrode and the protein at
have the same charge (positive) and electrostatic repulsion hinders the adsorption
process.
When adsorption of HSA occurs from a solution of pH = 3.0 the anodic peak
current has completely disappeared after 30s adsorption, indicating complete
blocking of the electron transfer process. Based on the discussion presented
above, as the protein layer increases the ia(t)/ia(o) value decreases, this trend
appeared erroneous since the charge of the electrode at OCP is positive and at
pH = 3.0 the charge on HSA is also positive. With both the electrode and the
protein having the same charge it would be expected that due to electrostatics
alone the amount of adsorbed HSA at pH = 3.0 would be less that at pH = 7.0
and 10.0 where HSA has a negative charge. If adsorption was less at pH = 3.0
then the extent at which the ia(t)/ia(0) value decreases should also be less, clearly it
is not.
The fact that complete electron blocking occurs after 30sec suggests that other
factors are involved in the adsorption process of HSA at pH = 3.0. HSA has a
relatively low native-state stability as inferred from its large conformational
adaptability to changes in its environment [27] (i.e., unfolding). Hayes and Norde
noted that since a globular protein's folded conformation in aqueous solution are
only marginally stable under the best of conditions they can usually be denatured
145
Chapter 4 - Effect of Protein Adsorption on the Electrochemical Behaviour of Gold
by a modest change in environment, such as a change in pH [28]. Add to this the
natural tendency for proteins to denature at solid surfaces then the reason for this
complete blocking of the electron transfer by the adsorption of HSA after only
30sec at pH = 3.0 is most likely due to denaturing of the protein. This denaturing
of the protein causes it to unfold its secondary structure to occupy more volume,
which in turn will block further electrode sites where ferricyanide can be
oxidised.
4.2.5.2 Electrochemical Impedance Spectroscopy in K3Fe(CN)6
Prior to examining the effect of modification of the gold disc electrode with
protein, it was necessary to confirm the CV behaviour of the Fe(CN)64"/Fe(CN)6"
species at the gold electrode. The gold disc cyclic voltammogram recorded in
0.01M potassium ferricyanide containing 0.1M NaN03 is presented in Figure
4.20. The CV shows the characteristic reversible oxidation and reduction of the
ferrocyanide/ferricyanide ion at +285mV and +135mV (vs. Ag/AgCl reference)
respectively with a peak-to-peak separation of 150mV.
The OCP of the gold disc electrode measured in 0.2M PBS was lOOmV. Since
EIS spectra are sensitive to the applied DC potential it was necessary to use this
same OCP value (even though it will be different to the OCP in K3Fe(CN)6) to
allow for comparisons to be made between spectra recorded in PBS and
K3Fe(CN)6.
146
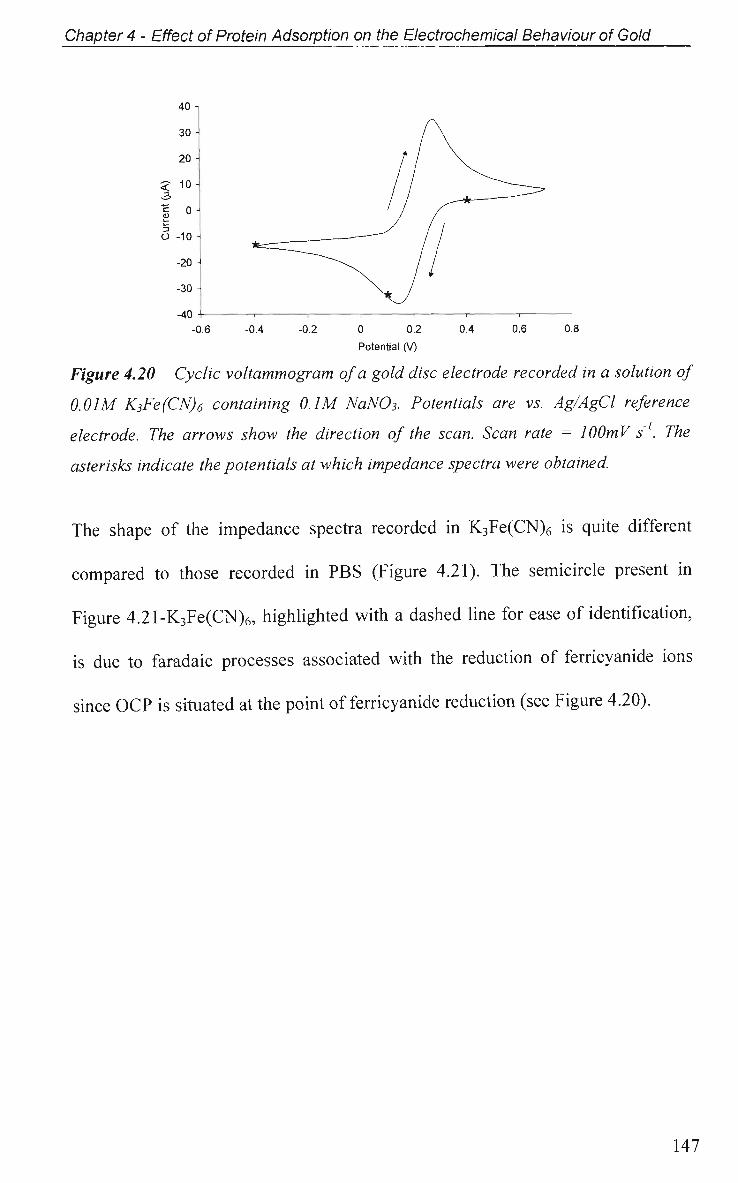
Chapter 4 - Effect of Protein Adsorption on the Electrochemical Behaviour of Gold
40
30
20
? 10
O -10
-20
-30
-40 -0.6 -0.4 -0.2 0 0.2
Potential (V)
0.4 0.6 0.8
Figure 4.20 Cyclic voltammogram of a gold disc electrode recorded in a solution of
0.01 M K3Fe(CN)6 containing 0.1M NaN03. Potentials are vs. Ag/AgCl reference
electrode. The arrows show the direction of the scan. Scan rate = WOmV s'. The
asterisks indicate the potentials at which impedance spectra were obtained.
The shape of the impedance spectra recorded in K 3 Fe(CN) 6 is quite different
compared to those recorded in P B S (Figure 4.21). The semicircle present in
Figure 4.21-K3Fe(CN)6, highlighted with a dashed line for ease of identification,
is due to faradaic processes associated with the reduction of ferricyanide ions
since O C P is situated at the point of ferricyanide reduction (see Figure 4.20).
147
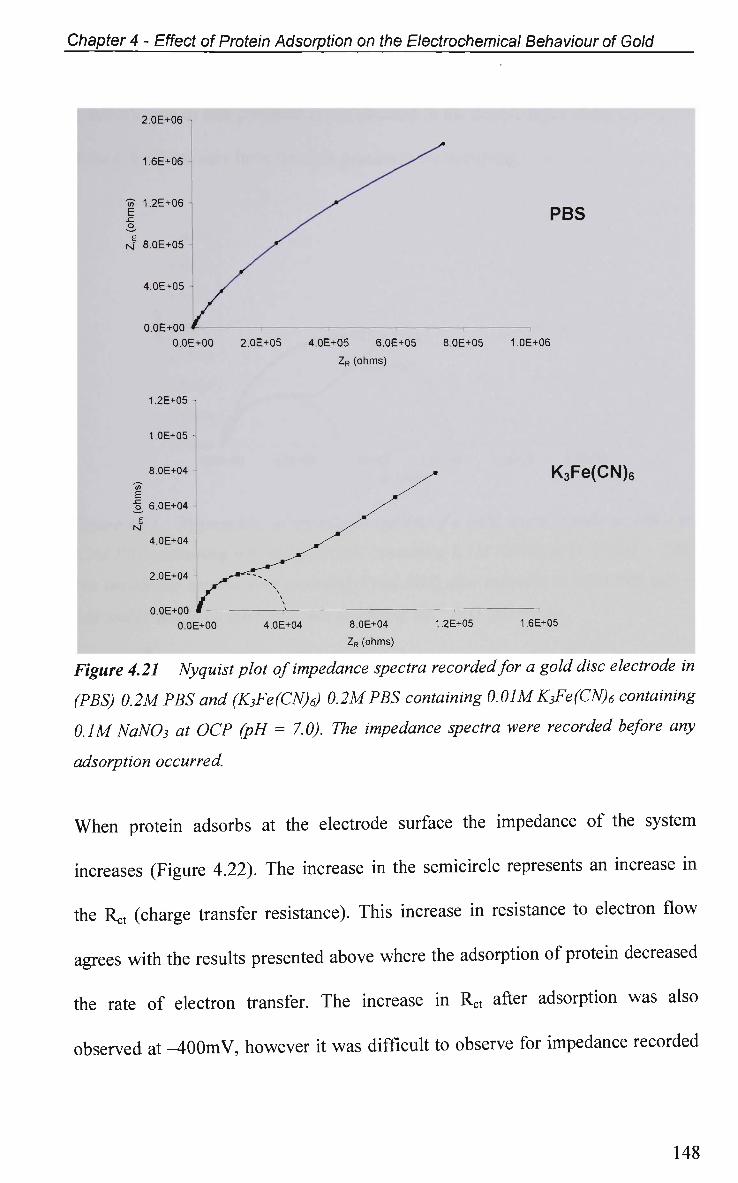
Chapter 4 - Effect of Protein Adsorption on the Electrochemical Behaviour of Gold
2.0E+06
1.6E+06
1? 1.2E+06
N 8.OE+05
4.OE+05
O.OE+00
1.2E+05
1.OE+05
8.0E+04
4.0E+04
2.0E+04
O.OE+OO
O.OE+00
PBS
O.OE+OO 2.OE+05 4.0E+05 6.0E+05
ZR (ohms)
8.0E+05 1.0E+06
K3Fe(CN)6
4.0E+04 8.0E+04
ZR (ohms)
1.2E+05 1.6E+05
Figure 4.21 Nyquist plot of impedance spectra recorded for a gold disc electrode in
(PBS) 0.2MPBS and (K3Fe(CN)6) 0.2MPBS containing 0.01MK3Fe(CN)6 containing
0.1M NaN03 at OCP (pH = 7.0). The impedance spectra were recorded before any
adsorption occurred.
W h e n protein adsorbs at the electrode surface the impedance of the system
increases (Figure 4.22). The increase in the semicircle represents an increase in
the Rct (charge transfer resistance). This increase in resistance to electron flow
agrees with the results presented above where the adsorption of protein decreased
the rate of electron transfer. The increase in Rct after adsorption was also
observed at -400mV, however it was difficult to observe for impedance recorded
148
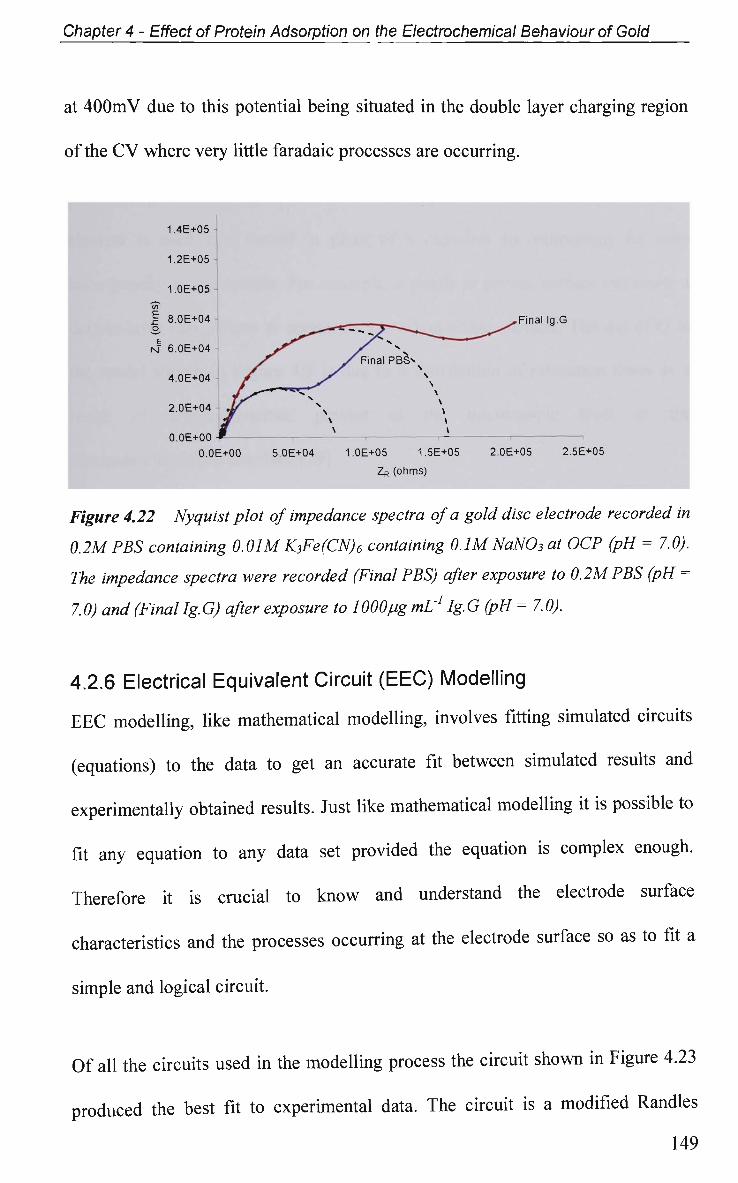
Chapter 4 - Effect of Protein Adsorption on the Electrochemical Behaviour of Gold
at 4 0 0 m V due to this potential being situated in the double layer charging region
of the C V where very little faradaic processes are occurring.
Final Ig.G
5.0E+04 1.OE+05 1.5E+05
ZR (ohms)
2.0E+05 2.5E+05
Figure 4.22 Nyquist plot of impedance spectra of a gold disc electrode recorded in
0.2MPBS containing 0.01MK3Fe(CN)6 containing 0.1MNaNO3at OCP (pH = 7.0).
The impedance spectra were recorded (Final PBS) after exposure to 0.2MPBS (pH =
7.0) and (Final lg. G) after exposure to 1000pg ml'1 lg. G (pH = 7.0).
4.2.6 Electrical Equivalent Circuit (EEC) Modelling
E E C modelling, like mathematical modelling, involves fitting simulated circuits
(equations) to the data to get an accurate fit between simulated results and
experimentally obtained results. Just like mathematical modelling if is possible to
fit any equation to any data set provided the equation is complex enough.
Therefore it is crucial to know and understand the electrode surface
characteristics and the processes occurring at the electrode surface so as to fit a
simple and logical circuit.
O f all the circuits used in the modelling process the circuit shown in Figure 4.23
produced the best fit to experimental data. The circuit is a modified Randies
149
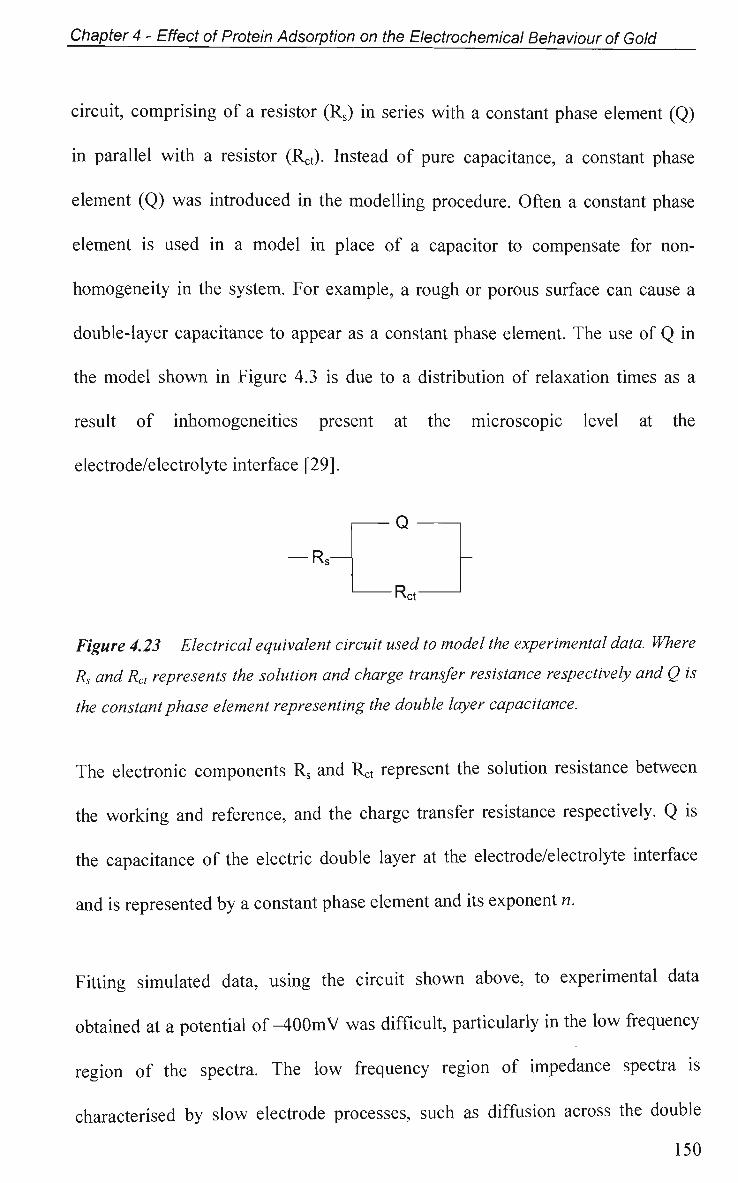
Chapter 4 - Effect of Protein Adsorption on the Electrochemical Behaviour of Gold
circuit, comprising of a resistor (Rs) in series with a constant phase element (Q)
in parallel with a resistor (R^. Instead of pure capacitance, a constant phase
element (Q) was introduced in the modelling procedure. Often a constant phase
element is used in a model in place of a capacitor to compensate for non-
homogeneity in the system. For example, a rough or porous surface can cause a
double-layer capacitance to appear as a constant phase element. The use of Q in
the model shown in Figure 4.3 is due to a distribution of relaxation times as a
result of inhomogeneities present at the microscopic level at the
electrode/electrolyte interface [29].
R s —
Figure 4.23 Electrical equivalent circuit used to model the experimental data. Where
Rs and Rct represents the solution and charge transfer resistance respectively and Q is
the constant phase element representing the double layer capacitance.
The electronic components Rs and Rct represent the solution resistance between
the working and reference, and the charge transfer resistance respectively. Q is
the capacitance of the electric double layer at the electrode/electrolyte interface
and is represented by a constant phase element and its exponent n.
Fitting simulated data, using the circuit shown above, to experimental data
obtained at a potential o f - 4 0 0 m V was difficult, particularly in the low frequency
region of the spectra. The low frequency region of impedance spectra is
characterised by slow electrode processes, such as diffusion across the double
150
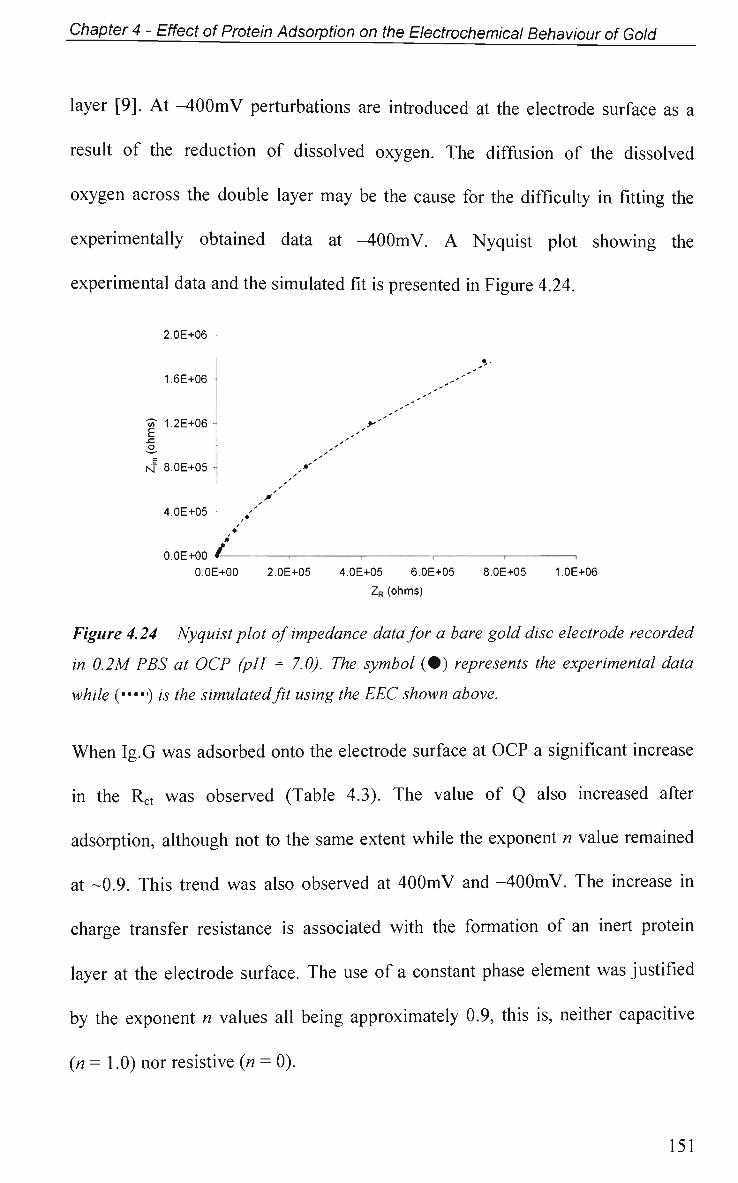
Chapter 4 - Effect of Protein Adsorption on the Electrochemical Behaviour of Gold
layer [9]. At - 4 0 0 m V perturbations are introduced at the electrode surface as a
result of the reduction of dissolved oxygen. The diffusion of the dissolved
oxygen across the double layer may be the cause for the difficulty in fitting the
experimentally obtained data at -400mV. A Nyquist plot showing the
experimental data and the simulated fit is presented in Figure 4.24.
2.0E+06
1 6E+06
1? 1.2E+06 E
isf 8. OE+05
4.0E+05
O.OE+00
O.OE+00 2.0E+05 4.0E+05 6.0E+05 8.0E+05 1.0E+06
ZR (ohms)
Figure 4.24 Nyquist plot of impedance data for a bare gold disc electrode recorded
in 0.2M PBS at OCP (pH = 7.0). The symbol (•) represents the experimental data
while (•"") is the simulated fit using the EEC shown above.
When Ig.G was adsorbed onto the electrode surface at OCP a significant increase
in the R^ was observed (Table 4.3). The value of Q also increased after
adsorption, although not to the same extent while the exponent n value remained
at -0.9. This trend was also observed at 400mV and -400mV. The increase in
charge transfer resistance is associated with the formation of an inert protein
layer at the electrode surface. The use of a constant phase element was justified
by the exponent n values all being approximately 0.9, this is, neither capacitive
(n = 1.0) nor resistive (n = 0).
151
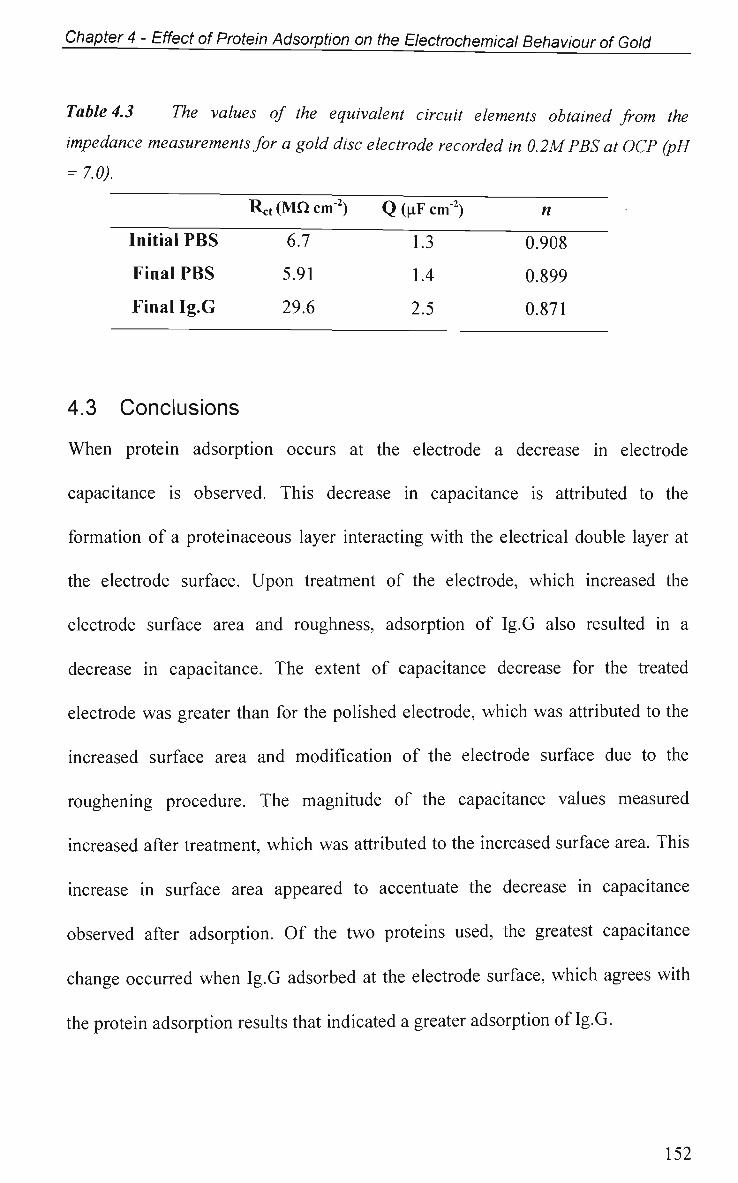
Chapter 4 - Effect of Protein Adsorption on the Electrochemical Behaviour of Gold
Table 4.3 The values of the equivalent circuit elements obtained from the
impedance measurements for a gold disc electrode recorded in 0.2M PBS at OCP (pH
= 7.0).
Initial PBS
Final PBS
Final Ig.G
Rct : (MQ cm
6.7
5.91
29.6
2) Q (uF cm2)
1.3
1.4
2.5
n
0.908
0.899
0.871
4.3 Conclusions
W h e n protein adsorption occurs at the electrode a decrease in electrode
capacitance is observed. This decrease in capacitance is attributed to the
formation of a proteinaceous layer interacting with the electrical double layer at
the electrode surface. U p o n treatment of the electrode, which increased the
electrode surface area and roughness, adsorption of Ig.G also resulted in a
decrease in capacitance. The extent of capacitance decrease for the treated
electrode was greater than for the polished electrode, which was attributed to the
increased surface area and modification of the electrode surface due to the
roughening procedure. The magnitude of the capacitance values measured
increased after treatment, which was attributed to the increased surface area. This
increase in surface area appeared to accentuate the decrease in capacitance
observed after adsorption. O f the two proteins used, the greatest capacitance
change occurred when Ig.G adsorbed at the electrode surface, which agrees with
the protein adsorption results that indicated a greater adsorption of Ig.G.
152
Chapter 4 - Effect of Protein Adsorption on the Electrochemical Behaviour of Gold
W h e n the electrode double layer capacitance was measured at a single frequency
a decrease was observed at the potentials 4 0 0 m V and O C P , while the - 4 0 0 m V
profile showed an increase in capacitance. The decrease in capacitance was rapid
within the first lOmin of adsorption and slowed down as adsorption time
increased. B y approximately lOmin of adsorption, the electrode capacitance had
reached a steady value. This equilibrium value was attributed to the formation of
an inert protein layer on the electrode surface. At times greater than lOmin,
adsorption was still occurring however it had no effect on the electrode
capacitance. It was proposed that monitoring of the double layer capacitance in
this manner only allows for monitoring effects associated with the formation of
the irreversibly bound protein layer.
Using EIS and CV it was possible to study the effects of adsorption on the
electron transfer processes at the electrode/solution interface. Under all
experimental conditions the adsorption of protein resulted in an increase in the
charge transfer resistance. This increase is attributed to the blocking of the
electron transfer process by the formation of an inert protein layer at the
electrode surface. W h e n the charge on the electrode and protein was varied
electrostatic interaction dominated the adsorption process. W h e n the protein and
electrode had similar charges the effects due to adsorption were reduced
compared to when they had opposite charges. W h e n the size of each protein is
compared, it appears that H S A is more efficient at blocking the electron transfer
process. The anodic current, associated with oxidation of the electroactive
species, was indistinguishable from the background charging current after lOmin
153
Chapter 4 - Effect of Protein Adsorption on the Electrochemical Behaviour of Gold
of adsorption, suggesting complete blocking of electron transfer. Since
adsorption continues past lOmin it was proposed that the continued formation of
the inert protein layer has no further effect on the electron transfer processes.
This result agrees with the Cji results obtained at a single frequency, where Cdi
levelled off after lOmin of protein adsorption.
It was possible to model the electrode/protein interface with a modified Randies
circuit using the EEC method. For this model to allow a best fit, it was necessary
to use a CPE in the circuit, confirming the non-ideal nature of the
electrode/protein interface.
154
Chapter 4 - Effect of Protein Adsorption on the Electrochemical Behaviour of Gold
References
1. D.R. Jackson, S. Omanovic and S.G. Roscoe, Langmuir, 16 5449 (2000)
2. S. Omanovic and S.G. Roscoe, Langmuir, 8315 (1999)
3. S. Omanovic and S.G. Roscoe, Journal of Colloid and Interface Science,
227 452 (2000)
4. R.K.R. Phillips, S. Omanovic and S.G. Roscoe, Langmuir, 17 2471 (2001)
5. Q. Xie, Y. Zhang, M. Xu, Z. Li, Y. Yuan and S. Yao, Journal of
Electroanalytical Chemistry, 478 1 (1999)
6. P. Bernabeu, L. Tamisier, A. De Cesare and A. Caprani, Electrochimica
Acta, 33 1129(1988)
7. T. Pajkossy and D.M. Kolb, Electrochimica Acta, 46 3063 (2001)
8. R. Subramanian and V. Lakshminarayana, Electrochimica Acta, 45 4501
(2000)
9. B. Boukamp, in Equivalent Circuit Users Manual, Report CT88/265/128,
from University of Twente, Department of Chemical Technology, Twente
the Netherlands, (1989)
10. J. Van Benschoten, Journal of Chemical Education, 60 772 (1983)
11. L.V. Protsailo and W.R. Fawcett, Electrochimica Acta, 45 3497 (2000)
12. H.J. Maguire and S.G. Roscoe, Langmuir, 13 5962 (1997)
13. S.M. Macdonald and S.G. Roscoe, Journal of Colloid and Interface
Science, 184 449 (1996)
14. S.M. Macdonald and S.G. Roscoe, Electrochimica Acta, 42 1189 (1997)
155
Chapter 4 - Effect of Protein Adsorption on the Electrochemical Behaviour of Gold
15. B. Guo, J. Anzai and T. Osa, Chemical and Pharmaceutical Bulletin, 44
800 (1996)
16. P. Bernabeu and A. Caprani, Biomaterials, 11 258 (1990)
17. R.N. Adams, in Electrochemistry at Solid Electrodes, Vol. 1, (ed. A.J.
Bard), Marcel Dekker, Inc, New York, (1969)
18. T. Arnebrant, B. Ivarsson, A. Larsson, I. Lundstrom and T. Nylander,
Progress in Colloids and Polymer Science, 703 62 (1985)
19. B. Ivarsson, P. Hegg, I. Lundstrom and T. Nylander, Colloids and
Surfaces B: Biointerfaces, 13 193 (1985)
20. I. Lundstrom, Progress in Colloids and Polymer Science, 703 76 (1985)
21. P.H. Rieger, in Electrochemistry, Vol. 2, (ed. P.H. Rieger), Prentice and
Hall, New York, NY, (1994)
22. J. Anzani, B. Guo and T. Osa, Chemical and Pharmaceutical Bulletin, 42
2391(1994)
23. I. Willner, S. Rubin and Y. Cohen, Journal of American Chemical Society,
115 4937(1993)
24. P. Delahay and I. Trachtenberg, 2094 (1958)
25. CP. Andrieux and J.M. Saveant, in Molecular Design of Electrode
Surfaces, Techniques of Chemistry, Vol. 22, (ed. A. Murray), Wiley
International, New York, (1992)
26. A.J. Bard, in Integrated Chemical Systems: A Chemical Approach to
Nanotechnology, Vol. (ed. A.J. Bard), Wiley International, New York,
(1994)
156
Chapter 4- Effect of Protein Adsorption on the Electrochemical Behaviour of Gold
27. J. Foster, in Albumin Structure, Function and Uses, Vol. (ed. V. Rosenoer,
M. Oratz, and M. Rothschild), Pergamon, Oxford, (1977)
28. CA. Haynes and W. Norde, Colloids and Surfaces B: Biointerfaces, 2 517
(1994)
29. S. Omanovic and M. Metikos-Hukovic, Thin Solid Films, 266 31 (1995)
157
Chapter 5 - Adsorption of Ig.G on Titanium Dioxide
Chapter 5
Adsorption of Ig.G on Titanium Dioxide
158
Chapter 5 - Adsorption of Ig.G on Titanium Dioxide
5.1 Introduction
Metallic titanium spontaneously generates an oxide surface layer when exposed
to air or aqueous media [1]. This oxide layer plays a vital role in the
biocompatibility of surgical implants since this oxide layer acts as a passive layer
protecting the implant from corrosion [2]. Protein interaction with passive films
such as titanium dioxide (Ti02) is of major concern in the medical industry as
they may have bearing on film breakdown and ultimately implant failure [2]. The
interaction of Ti02 with proteins in solution forms the basis of many studies into
the biocompatibility of this material [3-5].
Topoglidis et al [6] studied the factors that affect protein adsorption on
nanostructured titanium dioxide films and found protein immobilisation to be
remarkably stable, which they attributed to secondary binding processes
occurring as immobilisation time increased. In addition Giacomelli et al [1],
using ellipsometry to study the adsorption of BSA on Ti/Ti02 electrodes, found
that adsorption occurs in a two step process. The first step is characterised as a
fast attachment process governed by electrostatic interactions. The second step is
much slower and involves rearrangement of the adsorbed protein molecules to
find their more energetically favoured orientation with respect to the Ti02
surface. Fukuzaki et al [7] studied the adsorption of BSA onto metal oxides using
the Lowry-Folin [8] method.
Cervical mucus, the secreted membrane covering the cervix, is characterised by a
high content of macromolecules called mucins. One of the functions of cervical
159
Chapter 5 - Adsorption of Ig.G on Titanium Dioxide
mucus is to act as a protective layer between the cervical tissue and the
environment. To aid with this protection, mucins contain antibodies, one of
which is immunoglobulin G (Ig.G). Therefore the protein Ig.G is more pertinent
for this study with Chapters 5 and 6 being restricted to the investigation of Ig.G
at pH = 7.0. By maintaining a solution pH = 7.0 it is possible to compare
adsorption trends at Ti02 with that for gold, and pH = 7.0 is close to
physiological pH under which TruScan™ operates. The potentials used during
adsorption and impedance measurements were -lOOmV (OCP), 400mV and
-400mV. The reason for choosing 400mV and -400mV is due to the fact that
TruScan™ applies a positive potential of 800mV during each pulse (see Chapter
1). TruScan™ works as a two-electrode system where one Ti02 electrode is the
working and the other two are the counter electrodes. Therefore, the 800mV
pulse is distributed between the working electrode and the counter electrode
combination, effectively only applying a pulse of 400mV to the working
electrode. Whilst the working electrode is held at 400mV the counter electrode
combination is held at -400mV, which is why adsorption under an applied
potential of-400mV was also investigated.
The Ti02 electrode used for this work was fabricated at IPRI by the
electrochemical oxidation of titanium coated polycarbonate sheets (provided by
Polartechnics Ltd.) in sulfuric acid. The electrochemical oxidation process
involves cycling the potential from 0.0V to 1.6V and back to 0.0V at a scan rate
of lOOmV s"1 in a solution of 1.0M H2S04.
160
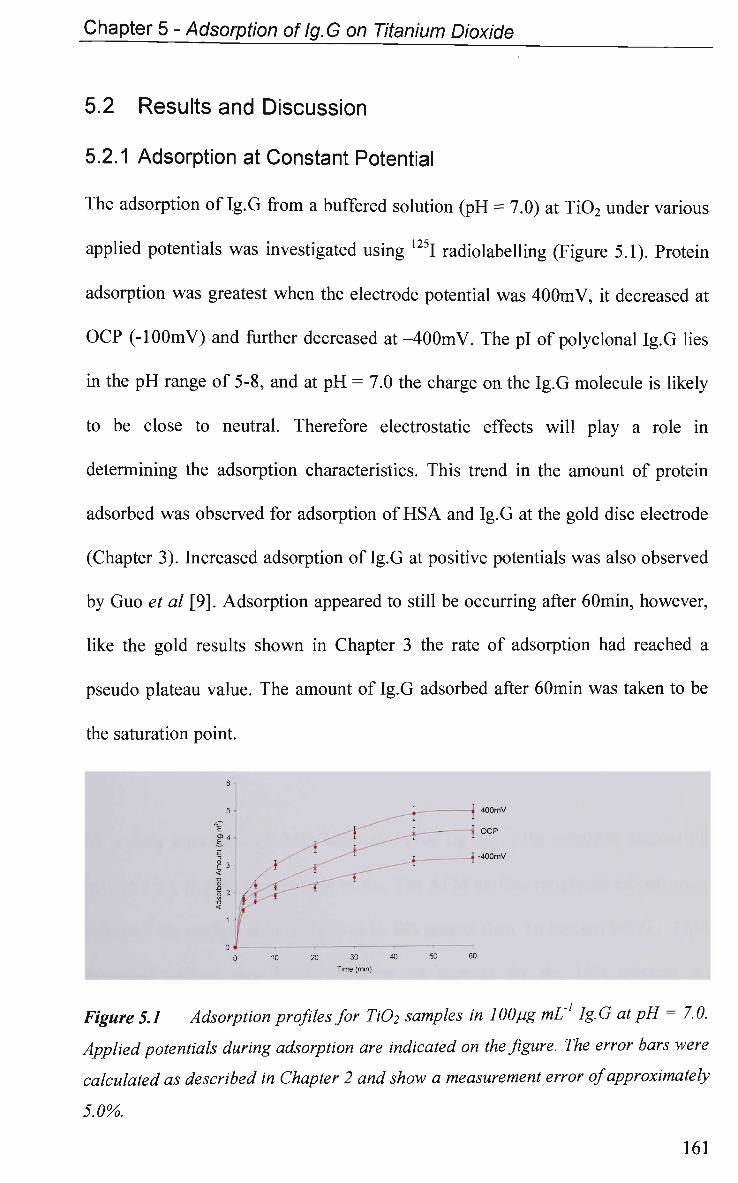
Chapter 5 - Adsorption of Ig.G on Titanium Dioxide
5.2 Results and Discussion
5.2.1 Adsorption at Constant Potential
The adsorption of Ig.G from a buffered solution (pH = 7.0) at Ti0 2 under various
applied potentials was investigated using 125I radiolabelling (Figure 5.1). Protein
adsorption was greatest when the electrode potential was 400mV, it decreased at
O C P (-lOOmV) and further decreased at -400mV. The pi of polyclonal Ig.G lies
in the p H range of 5-8, and at p H = 7.0 the charge on the Ig.G molecule is likely
to be close to neutral. Therefore electrostatic effects will play a role in
determining the adsorption characteristics. This trend in the amount of protein
adsorbed was observed for adsorption of H S A and Ig.G at the gold disc electrode
(Chapter 3). Increased adsorption of Ig.G at positive potentials was also observed
by Guo et al [9]. Adsorption appeared to still be occurring after 60min, however,
like the gold results shown in Chapter 3 the rate of adsorption had reached a
pseudo plateau value. The amount of Ig.G adsorbed after 60min was taken to be
the saturation point.
Figure 5.1 Adsorption profiles for Ti02 samples in 100 pg mL1 Ig.G at pH = 7.0.
Applied potentials during adsorption are indicated on the figure. The error bars were
calculated as described in Chapter 2 and show a measurement error of approximately
5.0%.
161
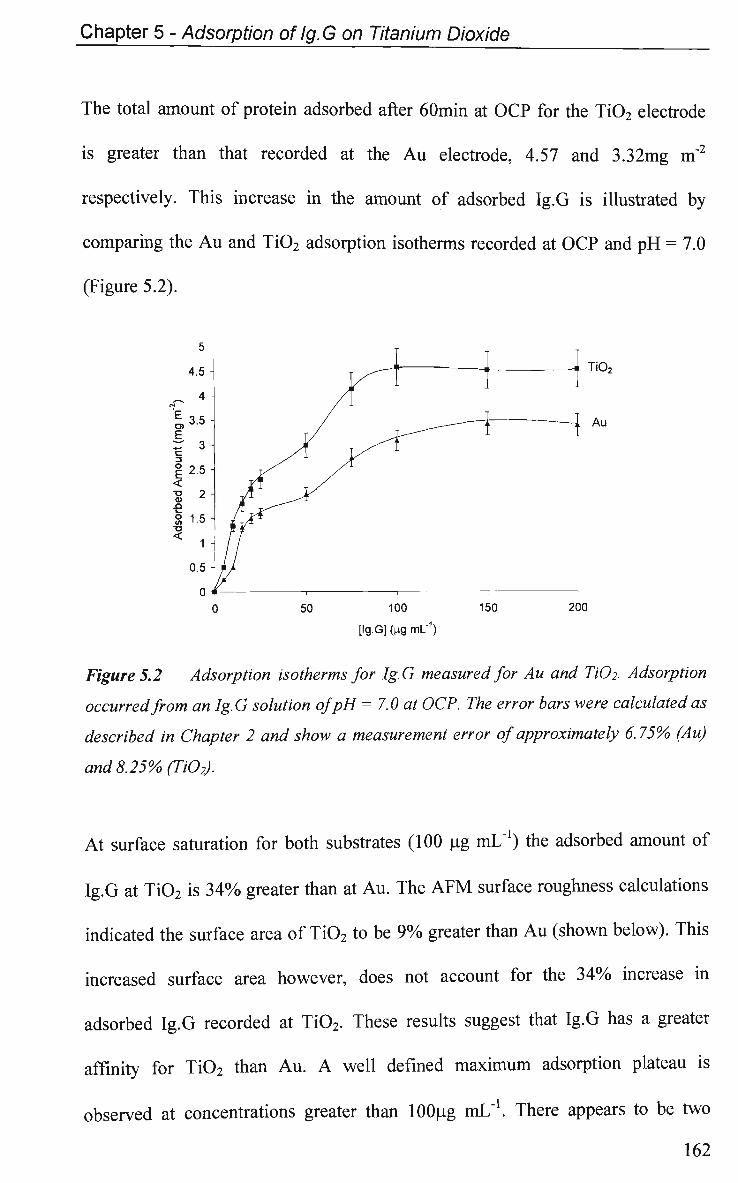
Chapter 5 - Adsorption of lg. G on Titanium Dioxide
The total amount of protein adsorbed after 60min at O C P for the Ti02 electrode
is greater than that recorded at the A u electrode, 4.57 and 3.32mg m"2
respectively. This increase in the amount of adsorbed Ig.G is illustrated by
comparing the A u and Ti02 adsorption isotherms recorded at O C P and p H = 7.0
(Figure 5.2).
50 100
[Ig.G] fog mL'1)
150
-AI Ti02
Au
200
Figure 5.2 Adsorption isotherms for Ig.G measured for Au and HO2. Adsorption
occurred from an Ig.G solution ofpH = 7.0 at OCP. The error bars were calculated as
described in Chapter 2 and show a measurement error of approximately 6.75% (Au)
and 8.25% (Ti02).
At surface saturation for both substrates (100 pg mL"1) the adsorbed amount of
Ig.G at Ti0 2 is 3 4 % greater than at Au. The A F M surface roughness calculations
indicated the surface area of Ti02 to be 9 % greater than A u (shown below). This
increased surface area however, does not account for the 3 4 % increase in
adsorbed Ig.G recorded at Ti02. These results suggest that Ig.G has a greater
affinity for Ti0 2 than Au. A well defined maximum adsorption plateau is
observed at concentrations greater than lOOug mL"1. There appears to be two
162
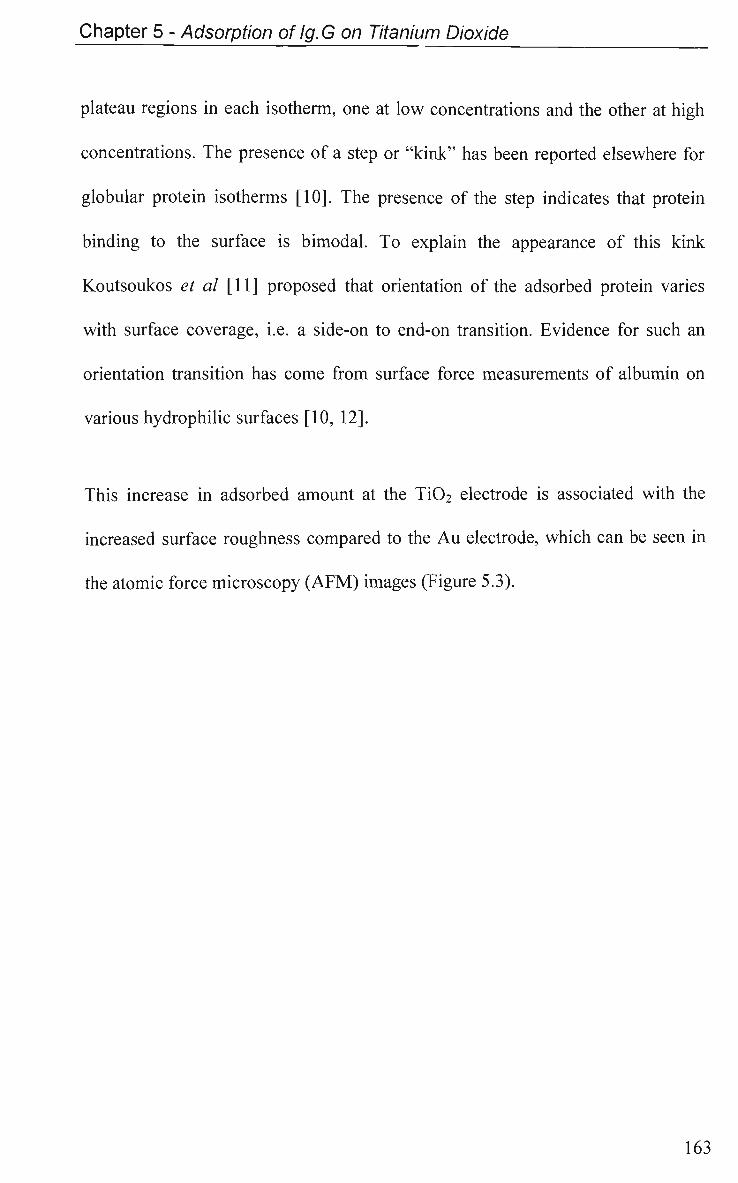
Chapter 5 - Adsorption of Ig.G on Titanium Dioxide
plateau regions in each isotherm, one at low concentrations and the other at high
concentrations. The presence of a step or "kink" has been reported elsewhere for
globular protein isotherms [10]. The presence of the step indicates that protein
binding to the surface is bimodal. To explain the appearance of this kink
Koutsoukos et al [11] proposed that orientation of the adsorbed protein varies
with surface coverage, i.e. a side-on to end-on transition. Evidence for such an
orientation transition has come from surface force measurements of albumin on
various hydrophilic surfaces [10, 12].
This increase in adsorbed amount at the Ti02 electrode is associated with the
increased surface roughness compared to the Au electrode, which can be seen in
the atomic force microscopy (AFM) images (Figure 5.3).
163
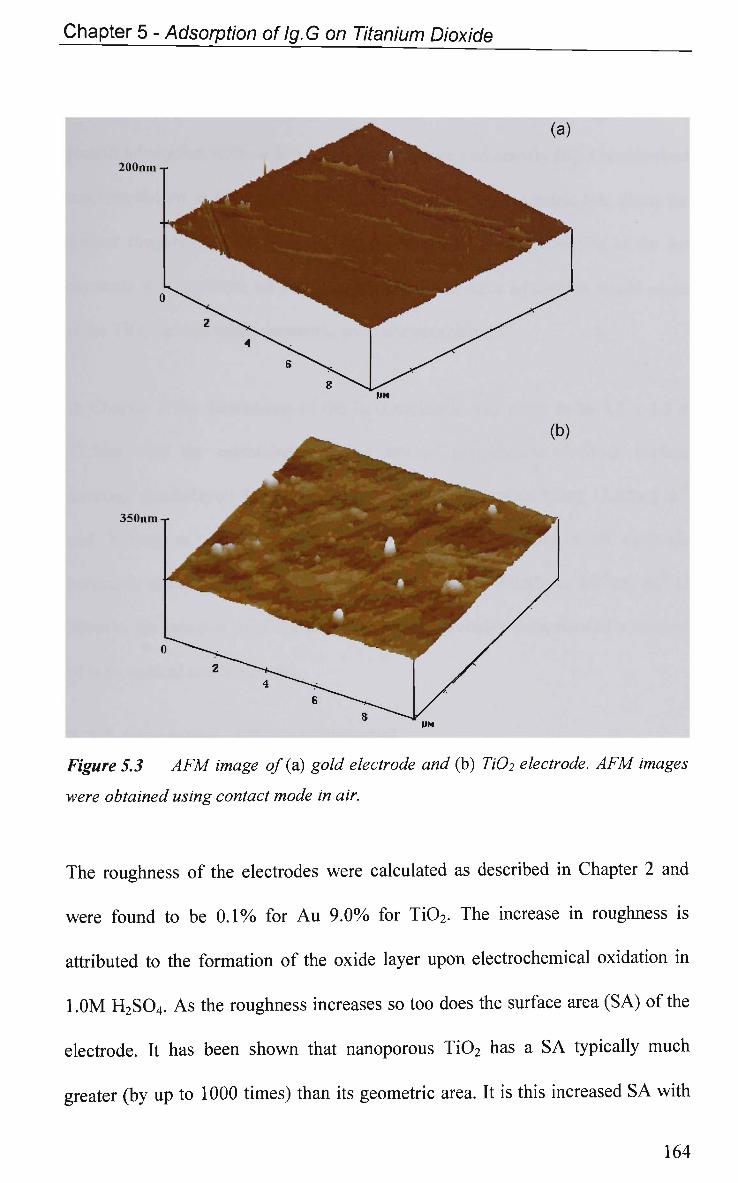
Chapter 5 - Adsorption of Ig.G on Titanium Dioxide
Figure 5.3 AFM image of (a) gold electrode and (b) HO2 electrode. AFM images
were obtained using contact mode in air.
The roughness of the electrodes were calculated as described in Chapter 2 and
were found to be 0.1% for A u 9.0% for Ti02. The increase in roughness is
attributed to the formation of the oxide layer upon electrochemical oxidation in
1.0M H 2 S 0 4 . As the roughness increases so too does the surface area (SA) of the
electrode. It has been shown that nanoporous Ti02 has a S A typically much
greater (by up to 1000 times) than its geometric area. It is this increased S A with
164
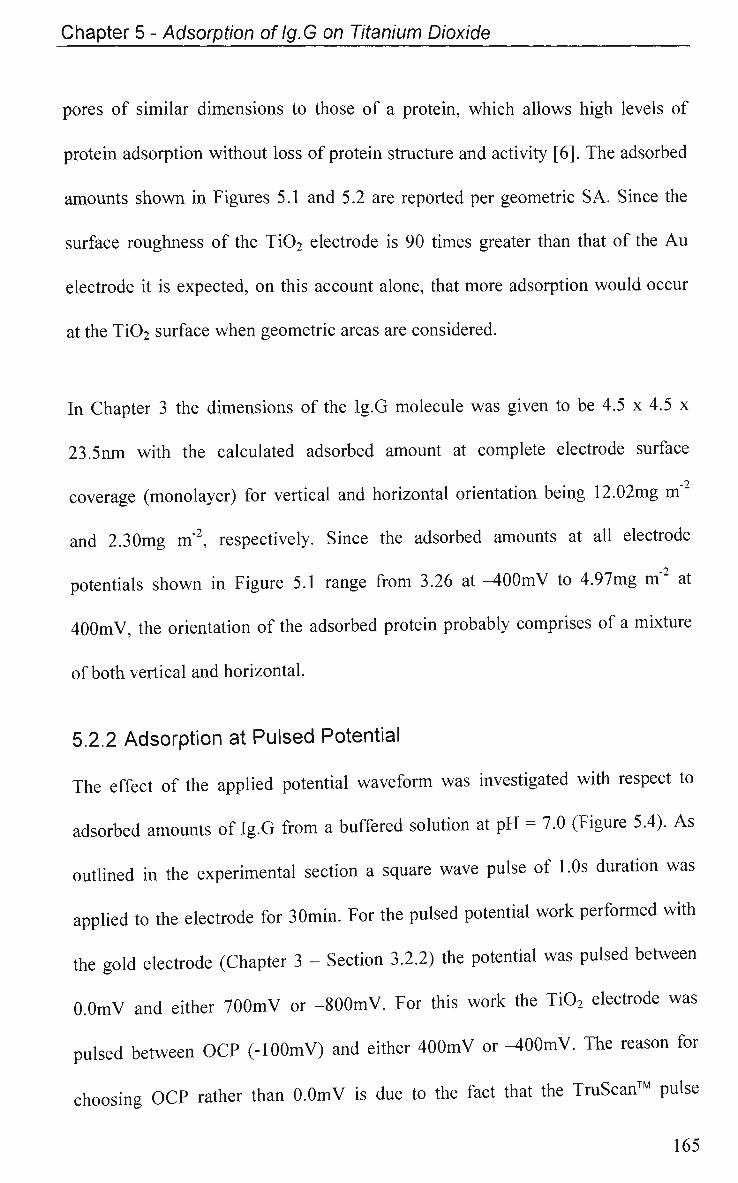
Chapter 5 - Adsorption of Ig.G on Titanium Dioxide
pores of similar dimensions to those of a protein, which allows high levels of
protein adsorption without loss of protein structure and activity [6]. The adsorbed
amounts shown in Figures 5.1 and 5.2 are reported per geometric SA. Since the
surface roughness of the Ti02 electrode is 90 times greater than that of the Au
electrode it is expected, on this account alone, that more adsorption would occur
at the Ti02 surface when geometric areas are considered.
In Chapter 3 the dimensions of the Ig.G molecule was given to be 4.5 x 4.5 x
23.5nm with the calculated adsorbed amount at complete electrode surface
coverage (monolayer) for vertical and horizontal orientation being 12.02mg m"
and 2.30mg m"2, respectively. Since the adsorbed amounts at all electrode
potentials shown in Figure 5.1 range from 3.26 at -400mV to 4.97mg m"2 at
400mV, the orientation of the adsorbed protein probably comprises of a mixture
of both vertical and horizontal.
5.2.2 Adsorption at Pulsed Potential
The effect of the applied potential waveform was investigated with respect to
adsorbed amounts of Ig.G from a buffered solution at pH = 7.0 (Figure 5.4). As
outlined in the experimental section a square wave pulse of 1.0s duration was
applied to the electrode for 30min. For the pulsed potential work performed with
the gold electrode (Chapter 3 - Section 3.2.2) the potential was pulsed between
O.OmV and either 700mV or -800mV. For this work the Ti02 electrode was
pulsed between OCP (-100mV) and either 400mV or -400mV. The reason for
choosing OCP rather than O.OmV is due to the fact that the TruScan™ pulse
165
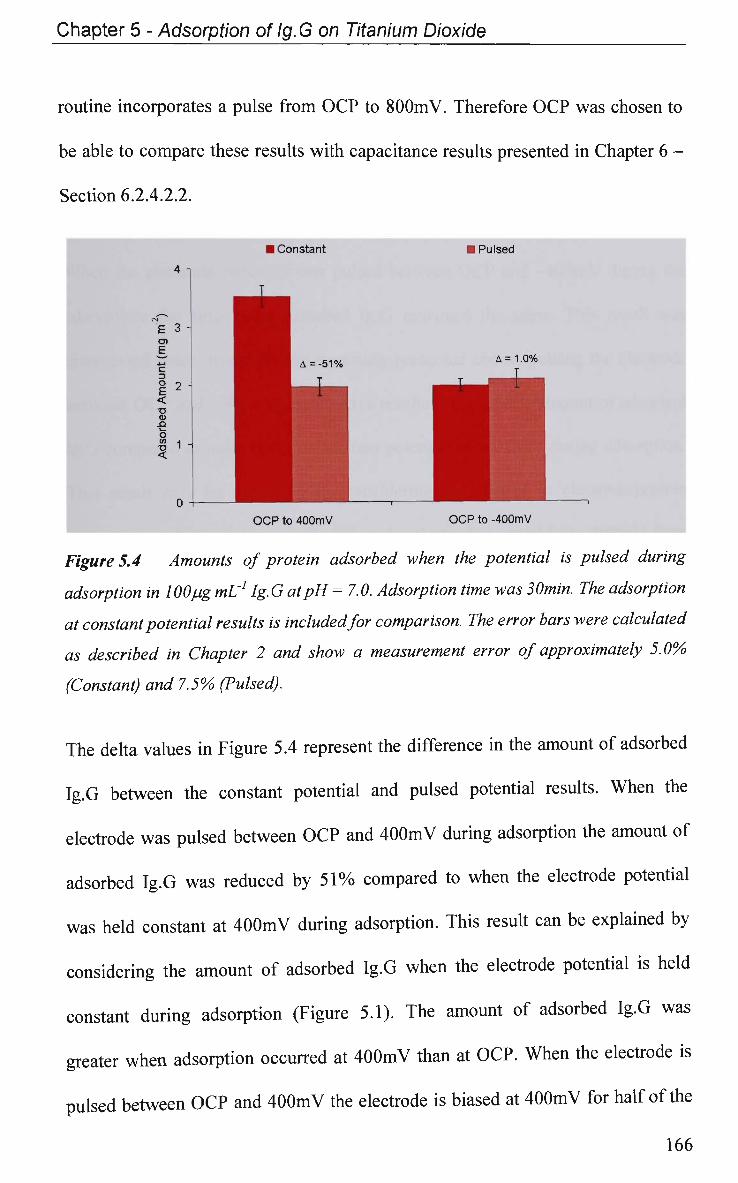
Chapter 5 - Adsorption of Ig.G on Titanium Dioxide
routine incorporates a pulse from OCP to 800mV. Therefore OCP was chosen to
be able to compare these results with capacitance results presented in Chapter 6 -
Section 6.2.4.2.2.
Figure 5.4 Amounts of protein adsorbed when the potential is pulsed during
adsorption in 100 pg mL'1 Ig.G at pH = 7.0. Adsorption time was 3 Omin. The adsorption
at constant potential results is included for comparison. The error bars were calculated
as described in Chapter 2 and show a measurement error of approximately 5.0%
(Constant) and 7.5% (Pulsed).
The delta values in Figure 5.4 represent the difference in the amount of adsorbed
Ig.G between the constant potential and pulsed potential results. W h e n the
electrode was pulsed between O C P and 4 0 0 m V during adsorption the amount of
adsorbed Ig.G was reduced by 5 1 % compared to when the electrode potential
was held constant at 4 0 0 m V during adsorption. This result can be explained by
considering the amount of adsorbed Ig.G when the electrode potential is held
constant during adsorption (Figure 5.1). The amount of adsorbed Ig.G was
greater when adsorption occurred at 4 0 0 m V than at OCP. W h e n the electrode is
pulsed between O C P and 4 0 0 m V the electrode is biased at 4 0 0 m V for half of the
166
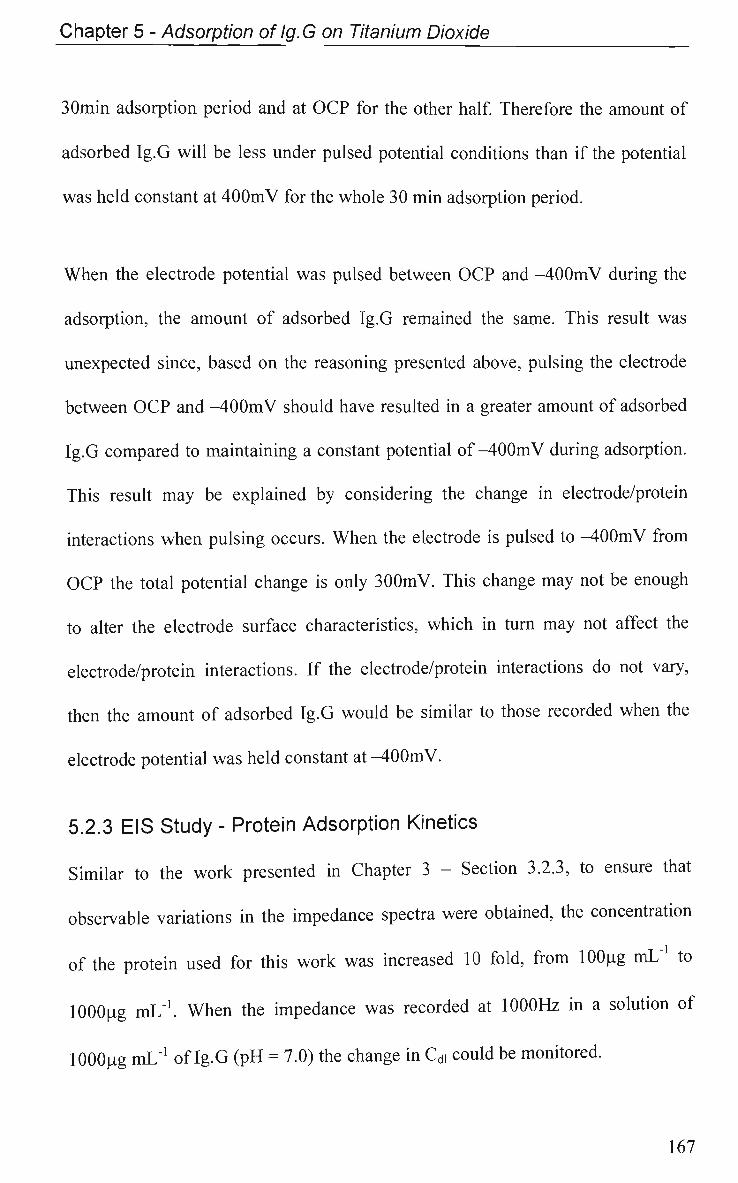
Chapter 5 - Adsorption of Ig.G on Titanium Dioxide
3 Omin adsorption period and at OCP for the other half. Therefore the amount of
adsorbed Ig.G will be less under pulsed potential conditions than if the potential
was held constant at 400mV for the whole 30 min adsorption period.
When the electrode potential was pulsed between OCP and -400mV during the
adsorption, the amount of adsorbed Ig.G remained the same. This result was
unexpected since, based on the reasoning presented above, pulsing the electrode
between OCP and -400mV should have resulted in a greater amount of adsorbed
Ig.G compared to maintaining a constant potential of-400mV during adsorption.
This result may be explained by considering the change in electrode/protein
interactions when pulsing occurs. When the electrode is pulsed to -400mV from
OCP the total potential change is only 300mV. This change may not be enough
to alter the electrode surface characteristics, which in turn may not affect the
electrode/protein interactions. If the electrode/protein interactions do not vary,
then the amount of adsorbed Ig.G would be similar to those recorded when the
electrode potential was held constant at -400mV.
5.2.3 EIS Study - Protein Adsorption Kinetics
Similar to the work presented in Chapter 3 - Section 3.2.3, to ensure that
observable variations in the impedance spectra were obtained, the concentration
of the protein used for this work was increased 10 fold, from lOOug mL"1 to
lOOOug mL"1. When the impedance was recorded at 1000Hz in a solution of
lOOOug mL"1 of Ig.G (pH = 7.0) the change in Cdi could be monitored.
167
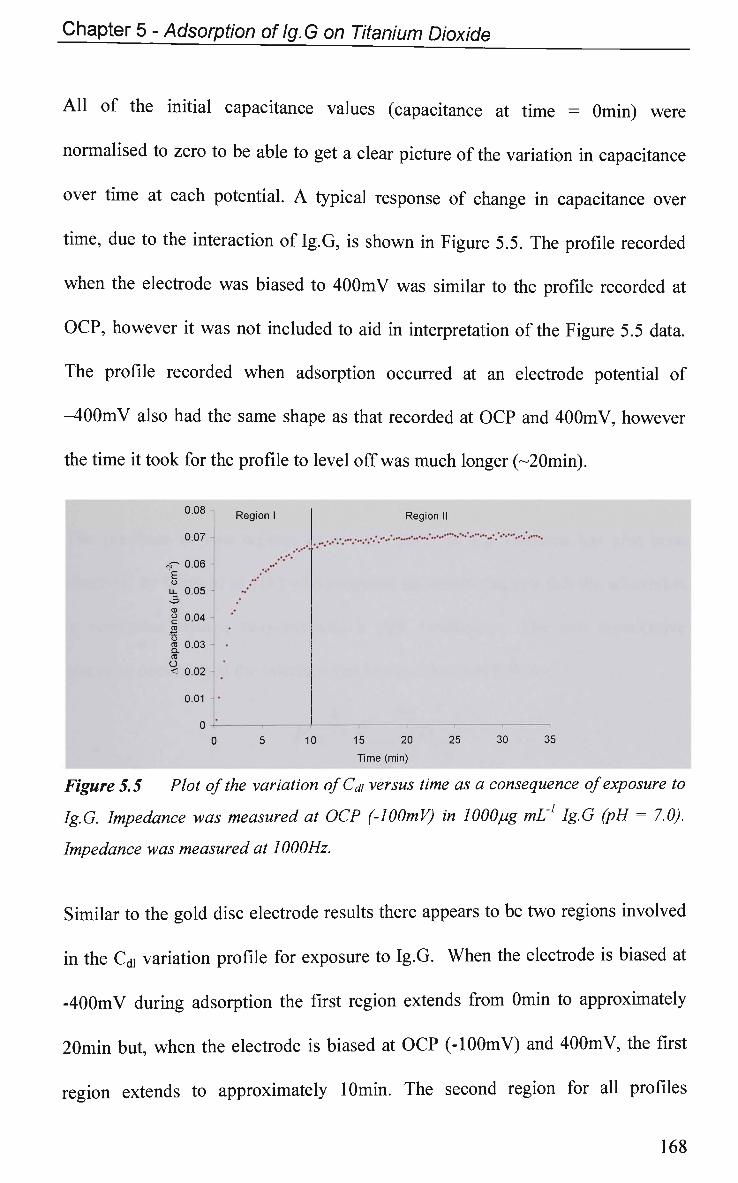
Chapter 5 - Adsorption of Ig.G on Titanium Dioxide
All of the initial capacitance values (capacitance at time = Omin) were
normalised to zero to be able to get a clear picture of the variation in capacitance
over time at each potential. A typical response of change in capacitance over
time, due to the interaction of Ig.G, is shown in Figure 5.5. The profile recorded
when the electrode was biased to 4 0 0 m V was similar to the profile recorded at
OC P , however it was not included to aid in interpretation of the Figure 5.5 data.
The profile recorded when adsorption occurred at an electrode potential of
-4 0 0 m V also had the same shape as that recorded at O C P and 400mV, however
the time it took for the profile to level off was much longer (~20min).
0.08 -
0.07
„- 0.06 -E
£ 0.05 -3> a H 0.04 -ro ro 0.03 Q. OJ (J < 0.02 -
0.01
A U
Region I
.._••
.-•*
.* •'
•
•
•
0 5
.-.-•-.••-••-
1
10
Region II
.•.•".•••.'.'•'•"••"•"'—'•'""• "'"""'''"
i
15 20 25
Time (min)
•""• * " - " . •'*""••••
30
'""
1
35
Figure 5.5 Plot of the variation of Cdi versus time as a consequence of exposure to
Ig.G. Impedance was measured at OCP (-100mV) in 1000pg mL1 Ig.G (pH = 7.0).
Impedance was measured at 1000Hz.
Similar to the gold disc electrode results there appears to be two regions involved
in the Cdi variation profile for exposure to Ig.G. W h e n the electrode is biased at
-400mV during adsorption the first region extends from Omin to approximately
20min but, when the electrode is biased at O C P (-100mV) and 400mV, the first
region extends to approximately lOmin. The second region for all profiles
168
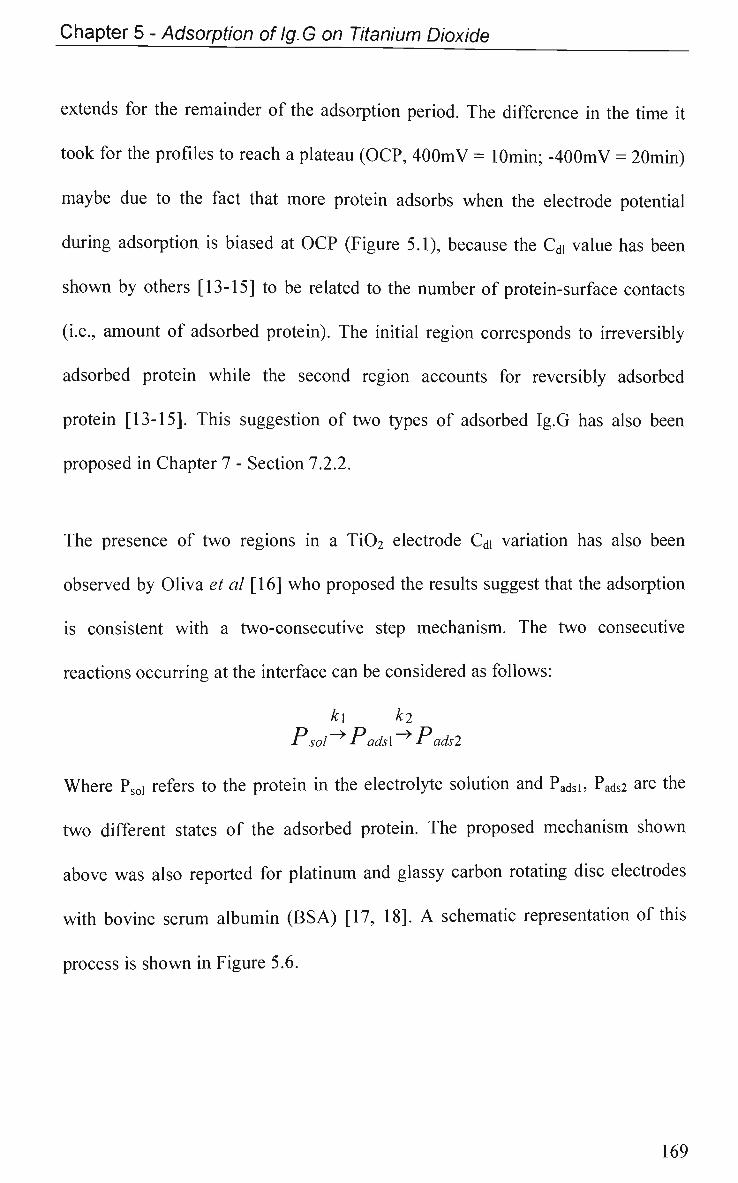
Chapter 5 - Adsorption of Ig.G on Titanium Dioxide
extends for the remainder of the adsorption period. The difference in the time it
took for the profiles to reach a plateau (OCP, 400mV = lOmin; -400mV = 20min)
maybe due to the fact that more protein adsorbs when the electrode potential
during adsorption is biased at OCP (Figure 5.1), because the Cdl value has been
shown by others [13-15] to be related to the number of protein-surface contacts
(i.e., amount of adsorbed protein). The initial region corresponds to irreversibly
adsorbed protein while the second region accounts for reversibly adsorbed
protein [13-15]. This suggestion of two types of adsorbed Ig.G has also been
proposed in Chapter 7 - Section 7.2.2.
The presence of two regions in a Ti02 electrode Cdi variation has also been
observed by Oliva et al [16] who proposed the results suggest that the adsorption
is consistent with a two-consecutive step mechanism. The two consecutive
reactions occurring at the interface can be considered as follows:
k\ ki
T sol -F adsl * adsl
Where Psoi refers to the protein in the electrolyte solution and Padsi, Pads2 are the
two different states of the adsorbed protein. The proposed mechanism shown
above was also reported for platinum and glassy carbon rotating disc electrodes
with bovine serum albumin (BSA) [17, 18]. A schematic representation of this
process is shown in Figure 5.6.
169
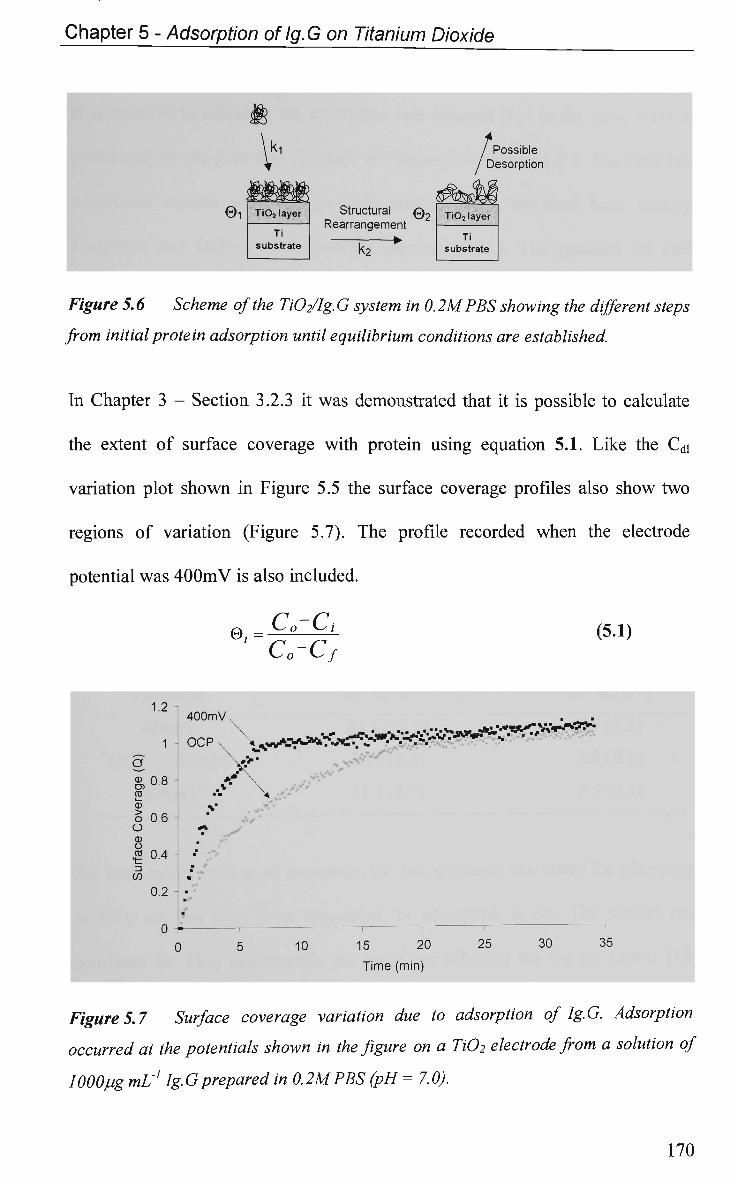
Chapter 5 - Adsorption of lg. G on Titanium Dioxide
Figure 5.6 Scheme of the Ti02/Ig. G system in 0.2M PBS showing the different steps
from initial protein adsorption until equilibrium conditions are established.
In Chapter 3 - Section 3.2.3 it was demonstrated that it is possible to calculate
the extent of surface coverage with protein using equation 5.1. Like the CdJ
variation plot shown in Figure 5.5 the surface coverage profiles also show two
regions of variation (Figure 5.7). The profile recorded when the electrode
potential was 4 0 0 m V is also included.
Figure5.7 Surface coverage variation due to adsorption of Ig.G. Adsorption
occurred at the potentials shown in the figure on a Ti02 electrode from a solution of
1000pg mL1 Ig.G prepared in 0.2 M PBS (pH = 7.0).
170
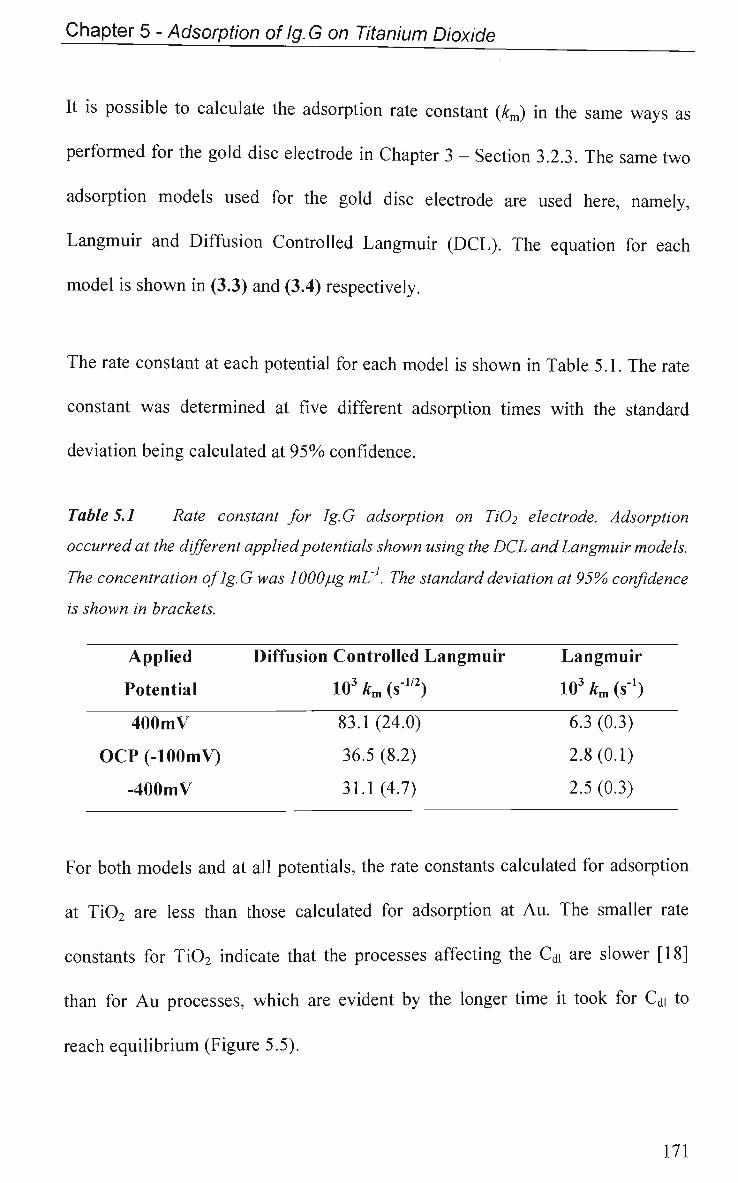
Chapter 5 - Adsorption of Ig.G on Titanium Dioxide
It is possible to calculate the adsorption rate constant (km) in the same ways as
performed for the gold disc electrode in Chapter 3 - Section 3.2.3. The same two
adsorption models used for the gold disc electrode are used here, namely,
Langmuir and Diffusion Controlled Langmuir (DCL). The equation for each
model is shown in (3.3) and (3.4) respectively.
The rate constant at each potential for each model is shown in Table 5.1. The rate
constant was determined at five different adsorption times with the standard
deviation being calculated at 9 5 % confidence.
Table 5.1 Rate constant for Ig.G adsorption on HO2 electrode. Adsorption
occurred at the different applied potentials shown using the DCL and Langmuir models.
The concentration of Ig.G was WOOpgmL1. The standard deviation at 95% confidence
is shown in brackets.
Applied
Potential
400mV
O C P (-lOOmV)
-400mV
Diffusion Controlled Langmuir
103 km (s"1/2)
83.1 (24.0)
36.5 (8.2)
31.1(4.7)
Langmuir
103 km (a"1)
6.3 (0.3)
2.8(0.1)
2.5 (0.3)
For both models and at all potentials, the rate constants calculated for adsorption
at Ti0 2 are less than those calculated for adsorption at Au. The smaller rate
constants for Ti0 2 indicate that the processes affecting the Cdi are slower [18]
than for A u processes, which are evident by the longer time it took for Cdi to
reach equilibrium (Figure 5.5).
171
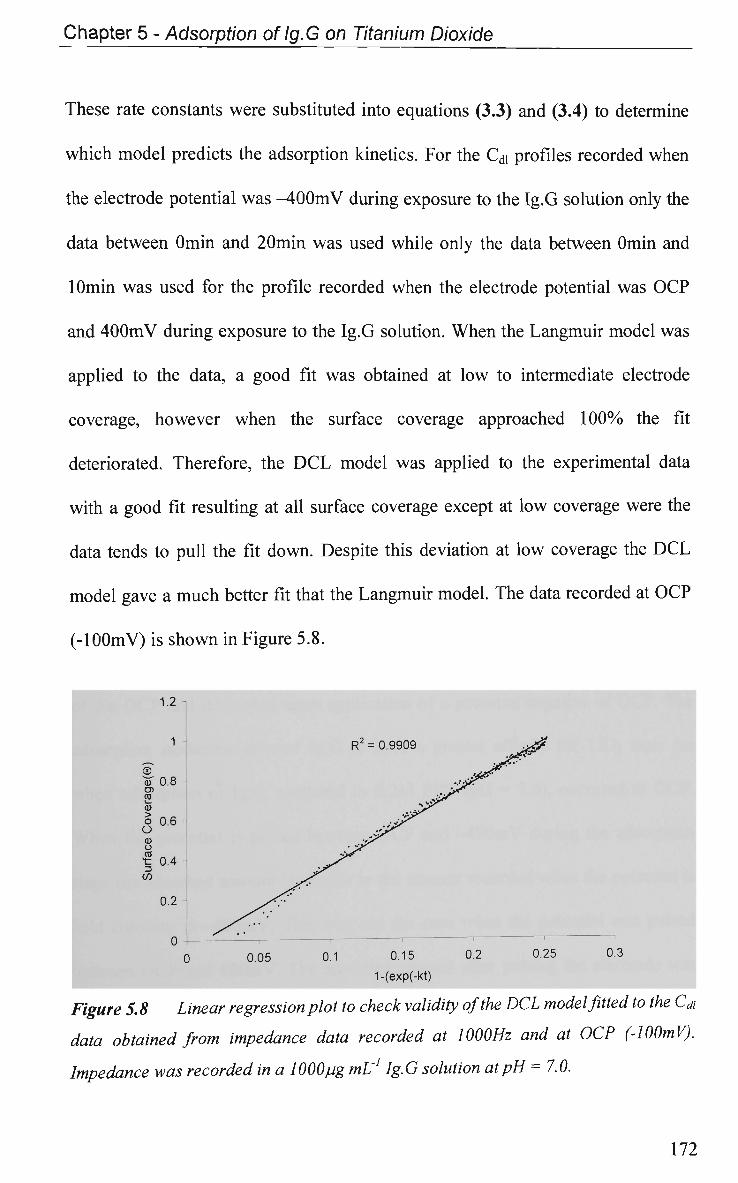
Chapter 5 - Adsorption of Ig.G on Titanium Dioxide
These rate constants were substituted into equations (3.3) and (3.4) to determine
which model predicts the adsorption kinetics. For the Cdi profiles recorded when
the electrode potential was -400mV during exposure to the Ig.G solution only the
data between Omin and 20min was used while only the data between Omin and
lOmin was used for the profile recorded when the electrode potential was O C P
and 4 0 0 m V during exposure to the Ig.G solution. W h e n the Langmuir model was
applied to the data, a good fit was obtained at low to intermediate electrode
coverage, however when the surface coverage approached 1 0 0 % the fit
deteriorated. Therefore, the D C L model was applied to the experimental data
with a good fit resulting at all surface coverage except at low coverage were the
data tends to pull the fit down. Despite this deviation at low coverage the D C L
model gave a much better fit that the Langmuir model. The data recorded at O C P
(-lOOmV) is shown in Figure 5.8.
Figure 5.8 Linear regression plot to check validity of the DCL model fitted to the Cdi
data obtained from impedance data recorded at 1000Hz and at OCP (-WOmV).
Impedance was recorded in a 1000pg mL1 Ig.G solution atpH = 7.0.
172
Chapter 5 - Adsorption of Ig.G on Titanium Dioxide
From Table 5.1 it can be seen that the rate constant is larger as adsorption occurs
when the electrode is polarized positive. This may be due to the applied potential
creating a potential gradient within the oxide layer that in turn creates diffusion
of charged species within the layer.
From the work performed by others [19-21] phosphate has been shown to
interact with Ti02. The results presented in Chapter 7 also showed that the
presence of phosphate reduced the extent of Ig.G adsorption onto Ti02.
Therefore it must be noted that the above determination of adsorption kinetics
has not considered the effect of the phosphate on Ig.G adsorption.
5.3 Conclusions
Adsorption of Ig.G at a Ti02 electrode occurs spontaneously at pH = 7.0. The
amount of adsorbed protein is increased upon application of a potential positive
of the OCP and decreased upon application of a potential negative of OCP. The
adsorption isotherms showed Ig.G to have a greater affinity for Ti02 than Au
when adsorption of Ig.G, prepared in 0.2M PBS (pH = 7.0), occurred at OCP.
When the potential is pulsed between OCP and -400mV during the adsorption
stage the adsorbed amount is similar to the amount recorded when the potential is
held constant at -400mV. This was not the case when the potential was pulsed
between OCP and 400mV. The adsorbed amount after pulsing the electrode was
much less (89%) than when the potential was held constant during the adsorption
stage.
173
Chapter 5 - Adsorption of Ig.G on Titanium Dioxide
It was possible to use EIS to monitor the Cdl as adsorption occurs. From the data
it was possible to determine the adsorption rate constant (km) for two adsorption
models, then use these constant to determine which model best describes the
adsorption kinetics. It is also possible to use this technique to investigate the
effect of various applied potentials during adsorption on the rate of adsorption
and hence the rate constant and adsorption model. The calculated rate constants
for adsorption at Ti02 are smaller than those calculated for Au, indicating that the
processes affecting the Cdi are slower for Ti02. The model which best describes
the adsorption kinetics at all electrode potentials used during exposure to the Ig.G
solution was the Diffusion Controlled Langmuir model.
174
Chapter 5 - Adsorption of Ig.G on Titanium Dioxide
References
1. C.E. Giacomelli, M.J. Esplandiu, P.I. Ortiz, M.J. Avena and CP. De
Pauli, Journal of Colloid and Interface Science, 218 404 (1999)
2. D.R. Jackson, S. Omanovic and S.G. Roscoe, Langmuir, 16 5449 (2000)
3. F. Liu, M. Zhou and F. Zhang, Applied Radiatiation and Isotopes, 49 67
(1998)
4. A.P. Serro, A.C. Fernandes, BJ. Saramago and W. Norde, Journal of
Biomedical Material Research, 47 376 (2000)
5. A.P. Serro, A.C. Fernandes, B. Saramago, J. Lima and M.A. Barbosa,
Biomaterials, 18 963 (1997)
6. E. Topoglidis, C.J. Campbell, A.E.G. Cass and J.R. Durrant, Langmuir, 17
7899 (2001)
7. S. Fukuzaki, H. Urano and K. Nagata, Journal of Fermentation and
Bioengineering, 81 163 (1995)
8. O.H. Lowry, N.J. Rosenbrough, A.L. Faar and R.J. Randall, Journal of
Biological Chemistry, 193 265 (1951)
9. B. Guo, J. Anzai and T. Osa, Chemical and Pharmaceutical Bulletin, 44
800 (1996)
10. CA. Haynes and W. Norde, Colloids and Surfaces B: Biointerfaces, 2 517
(1994)
11. P. Koutsoukos, C. Mumme-Young, W. Norde and J. Lyklema, Colloids
Surfaces, 5 93 (1982)
175
Chapter 5 - Adsorption of Ig.G on Titanium Dioxide
12. E. Blomberg, P. Claesson and C. Golander, Journal of Dispersion Science
Technology, 12 176 (1991)
13. B. Ivarsson, P. Hegg, i. Lundstrom and T. Nylander, Colloids and
Surfaces B: Biointerfaces, 13 193 (1985)
14. T. Arnebrant, B. Ivarsson, A. Larsson, I. Lundstrom and T. Nylander,
Progress in Colloids and Polymer Science, 703 62 (1985)
15. I. Lundstrom, Progress in Colloids and Polymer Science, 703 76 (1985)
16. F.Y. Oliva, L.B. Avalle, V.A. Macagno and CP. De Pauli, Biophysical
Chemistry, 91 141 (2001)
17. A. Caprani and F. Lacour, Journal of Electroanalytical Chemistry;
Biochemistry and Bioenergetics, 320 241 (1991)
18. P. Bernabeu, L. Tamisier, A. De Cesare and A. Caprani, Electrochimica
Acta, 33 1129 (1988)
19. P.A. Connor and A.J. McQuillan, Langmuir, 15 2916 (1999)
20. J. Sanchez and J. Augstynski, Journal of the Electrochemical Society, 103
423(1979)
21. V.E. Kazarinov, V.N. Andreev and R. Mayorov, Journal of the
Electrochemical Society, 130 277 (1981)
176
C h a p t e r 6 - Effects oflg.G Adsorption on the Electrochemical Behaviour of Titanium Dioxide
Chapter 6
Effect of Ig.G Adsorption on the
Electrochemical Behaviour of Titanium
Dioxide
177
Chapter 6 - Effects oflg.G Adsorption on the Electrochemical Behaviour of Titanium Dioxide
6.1 Introduction
An introduction to EIS has already been presented in Chapter 3. While there are
many papers published regarding protein adsorption and electrochemical effects
at metal electrodes [1-5], there is very little information regarding the effects of
protein adsorption on semiconductor electrochemistry. A recent paper by Oliva et
al [6] has gone some way to filling this void and provides a valuable insight into
the semiconductor-protein interface. The work presented in this section involves
the investigation of the electrochemical responses of a titanium dioxide (Ti02)
electrode upon adsorption of protein.
The Ti02 electrodes used for this work were prepared and supplied by
Polartechnics Ltd. The electrode has three kidney shaped electrodes on the tip
(Chapter 1 - Figure 1.1). The electrode is of a three-layer construction, the first
layer is the polycarbonate substrate that is sputtered with three kidney shaped
gold contacts (second layer), on top of the gold is sputtered Ti (third layer), and
the thickness of the Ti is approximately 50nm. The Ti covered electrode is
electrochemically oxidised as detailed in Chapter 5 Introduction.
All impedance measurements, except for the single frequency work performed in
the Ig.G solution and determination of the potential of zero charge, were carried
out in 0.2M PBS at pH = 7.0. Since the Ti02 electrode is a single use electrode it
was not possible to measure impedance after exposure to PBS and Ig.G on the
same electrode. Therefore, for each electrode an Initial impedance measurement
was made before exposure and a Final one after exposure. For this reason, the
178
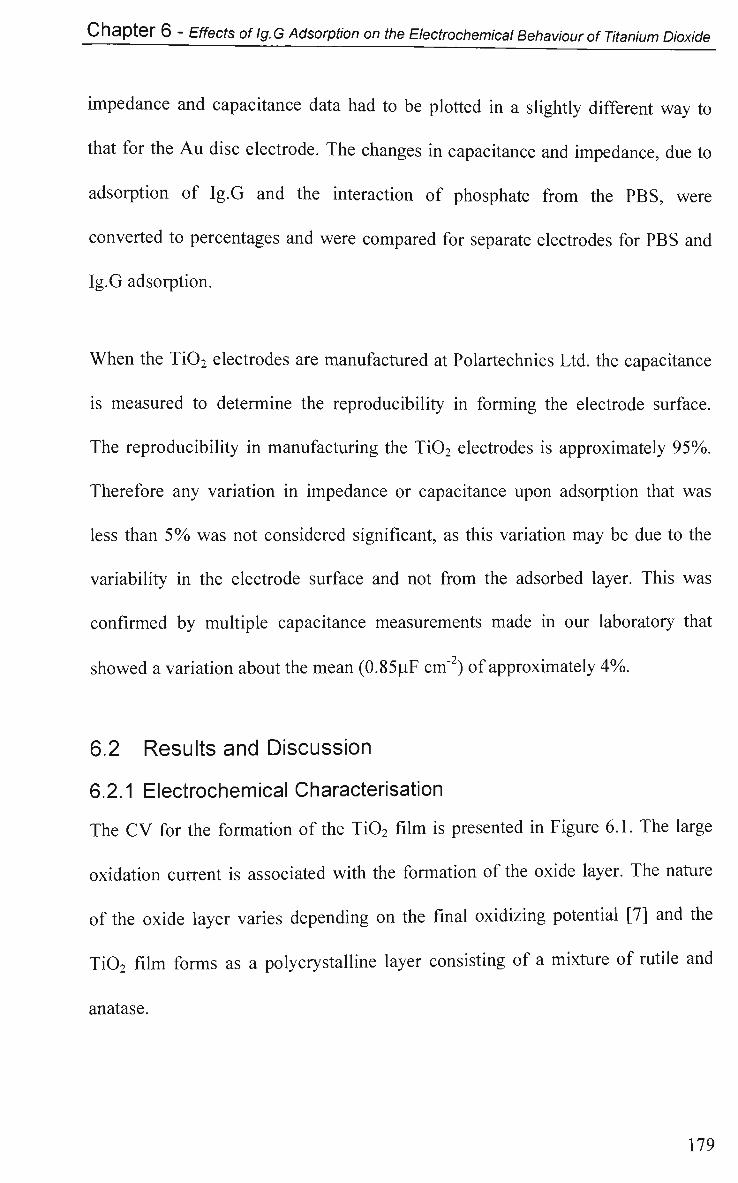
Chapter 6 - Effects of Ig.G Adsorption on the Electrochemical Behaviour of Titanium Dioxide
impedance and capacitance data had to be plotted in a slightly different way to
that for the A u disc electrode. The changes in capacitance and impedance, due to
adsorption of Ig.G and the interaction of phosphate from the PBS, were
converted to percentages and were compared for separate electrodes for P B S and
Ig.G adsorption.
When the Ti02 electrodes are manufactured at Polartechnics Ltd. the capacitance
is measured to determine the reproducibility in forming the electrode surface.
The reproducibility in manufacturing the Ti0 2 electrodes is approximately 95%.
Therefore any variation in impedance or capacitance upon adsorption that was
less than 5 % was not considered significant, as this variation may be due to the
variability in the electrode surface and not from the adsorbed layer. This was
confirmed by multiple capacitance measurements made in our laboratory that
showed a variation about the mean (0.85uF cm"2) of approximately 4%.
6.2 Results and Discussion
6.2.1 Electrochemical Characterisation
The C V for the formation of the Ti0 2 film is presented in Figure 6.1. The large
oxidation current is associated with the formation of the oxide layer. The nature
of the oxide layer varies depending on the final oxidizing potential [7] and the
Ti0 2 film forms as a polycrystalline layer consisting of a mixture of rutile and
anatase.
179
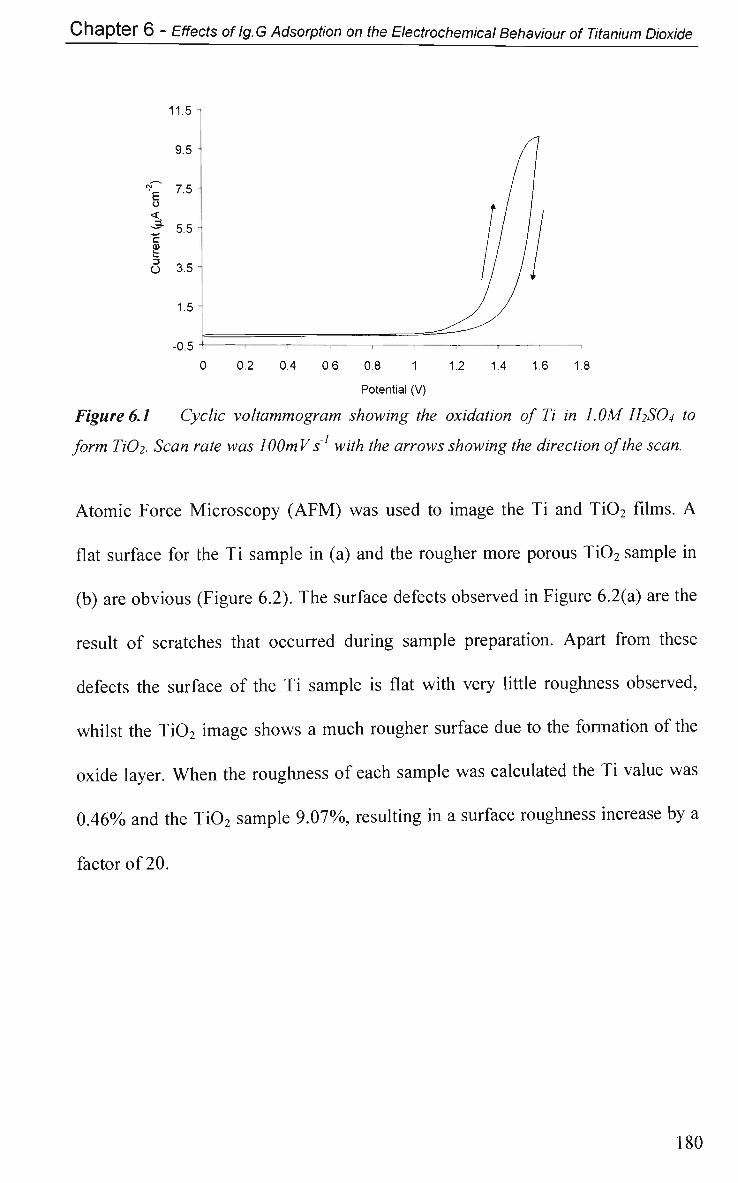
Chapter 6 - Effects of lg. G Adsorption on the Electrochemical Behaviour of Titanium Dioxide
0 0.2 0.4 0.6 0.8 1 1.2 1.4 1.6 1.8
Potential (V)
Figure 6.1 Cyclic voltammogram showing the oxidation of Ti in 1.0M H2SO4 to
form Ti02. Scan rate was lOOmV s' with the arrows showing the direction of the scan.
Atomic Force Microscopy (AFM) was used to image the Ti and Ti02 films. A
flat surface for the Ti sample in (a) and the rougher more porous Ti02 sample in
(b) are obvious (Figure 6.2). The surface defects observed in Figure 6.2(a) are the
result of scratches that occurred during sample preparation. Apart from these
defects the surface of the Ti sample is flat with very little roughness observed,
whilst the Ti02 image shows a much rougher surface due to the formation of the
oxide layer. When the roughness of each sample was calculated the Ti value was
0.46% and the Ti02 sample 9.07%, resulting in a surface roughness increase by a
factor of 20.
I I.O
9.5
^ 7.5 o
Is, c O 3.5
1.5
.n q
180
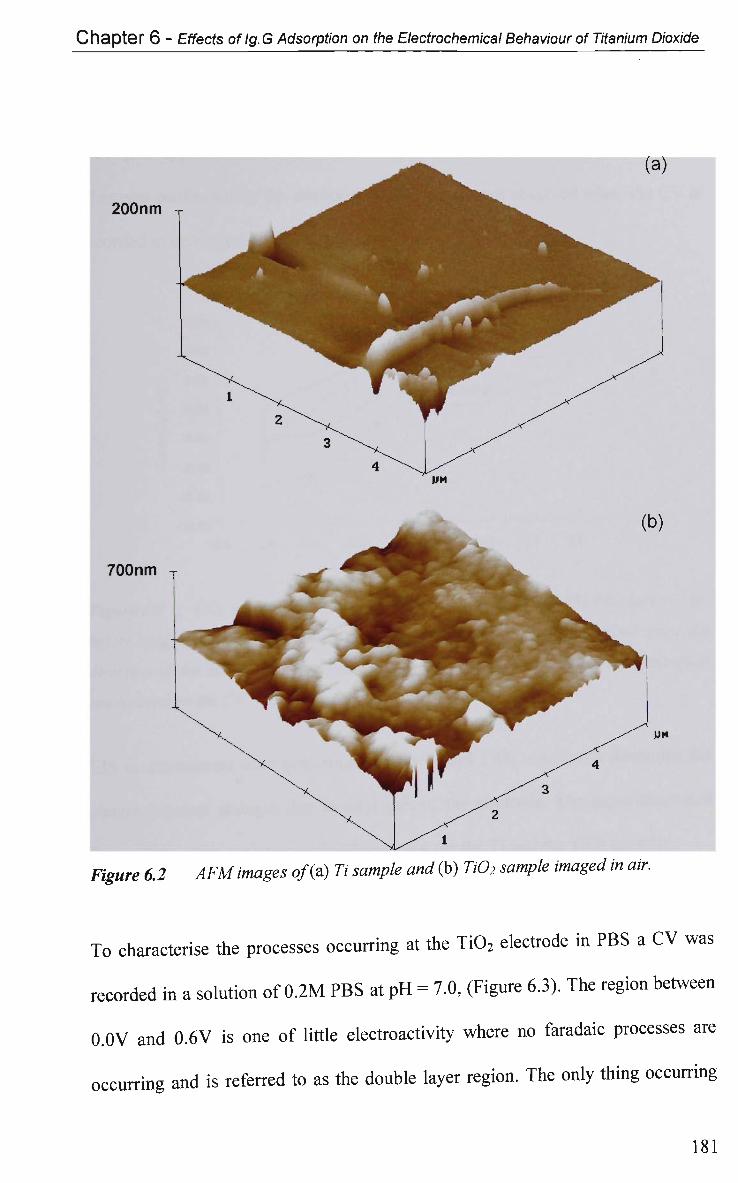
Chapter 6 - Effects oflg.G Adsorption on the Electrochemical Behaviour of Titanium Dioxide
700nm T
(a)
(b)
Figure 6.2 AFM images o/(a) Ti sample and (b) Ti02 sample imaged in air.
To characterise the processes occurring at the Ti02 electrode in PBS a CV was
recorded in a solution of 0.2M PBS at pH = 7.0, (Figure 6.3). The region between
0.0V and 0.6V is one of little electroactivity where no faradaic processes are
occurring and is referred to as the double layer region. The only thing occurring
181
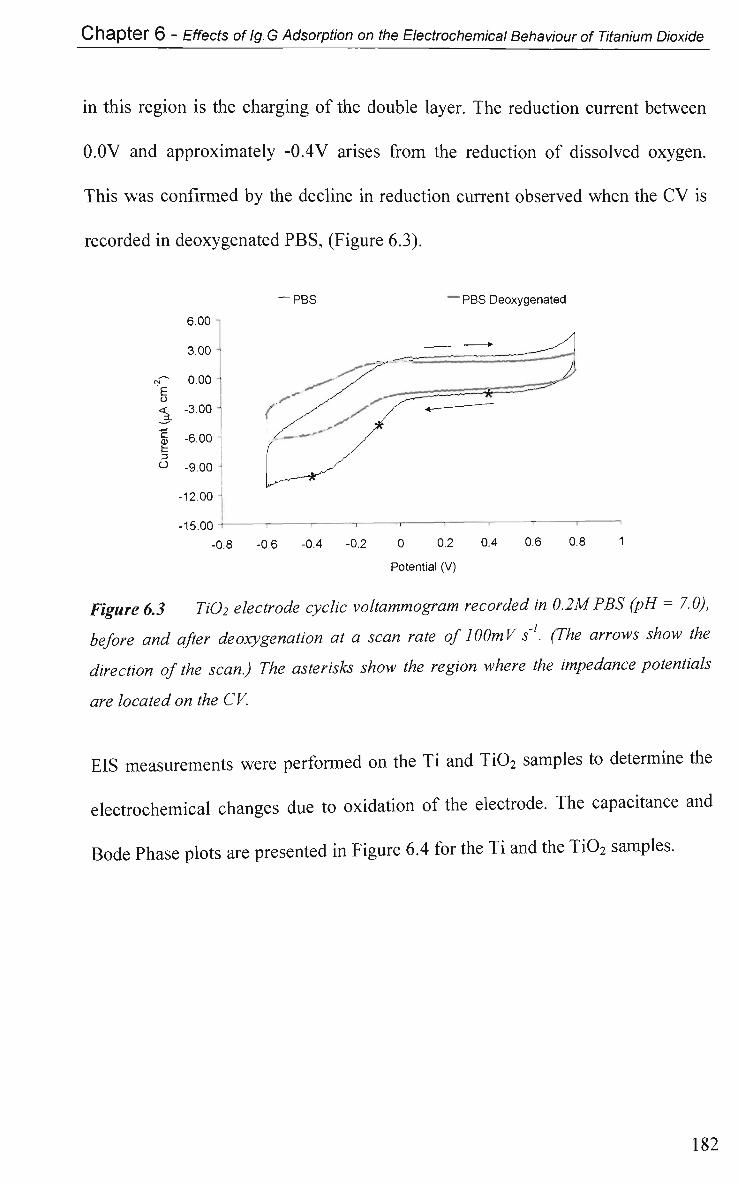
Chapter 6 - Effects of lg. G Adsorption on the Electrochemical Behaviour of Titanium Dioxide
in this region is the charging of the double layer. The reduction current between
0.0V and approximately -0.4V arises from the reduction of dissolved oxygen.
This was confirmed by the decline in reduction current observed when the C V is
recorded in deoxygenated PBS, (Figure 6.3).
— PBS ~ PBS Deoxygenated
-12.00 -
-15.00 -I 1 1 ' • ' • ' '
-0.8 -0.6 -0.4 -0.2 0 0.2 0.4 0.6 0.8 1
Potential (V)
Figure 6.3 Ti02 electrode cyclic voltammogram recorded in 0.2MPBS (pH = 7.0),
before and after deoxygenation at a scan rate of lOOmV s'1. (The arrows show the
direction of the scan.) The asterisks show the region where the impedance potentials
are located on the CV.
EIS measurements were performed on the Ti and Ti02 samples to determine the
electrochemical changes due to oxidation of the electrode. The capacitance and
Bode Phase plots are presented in Figure 6.4 for the Ti and the Ti0 2 samples.
182
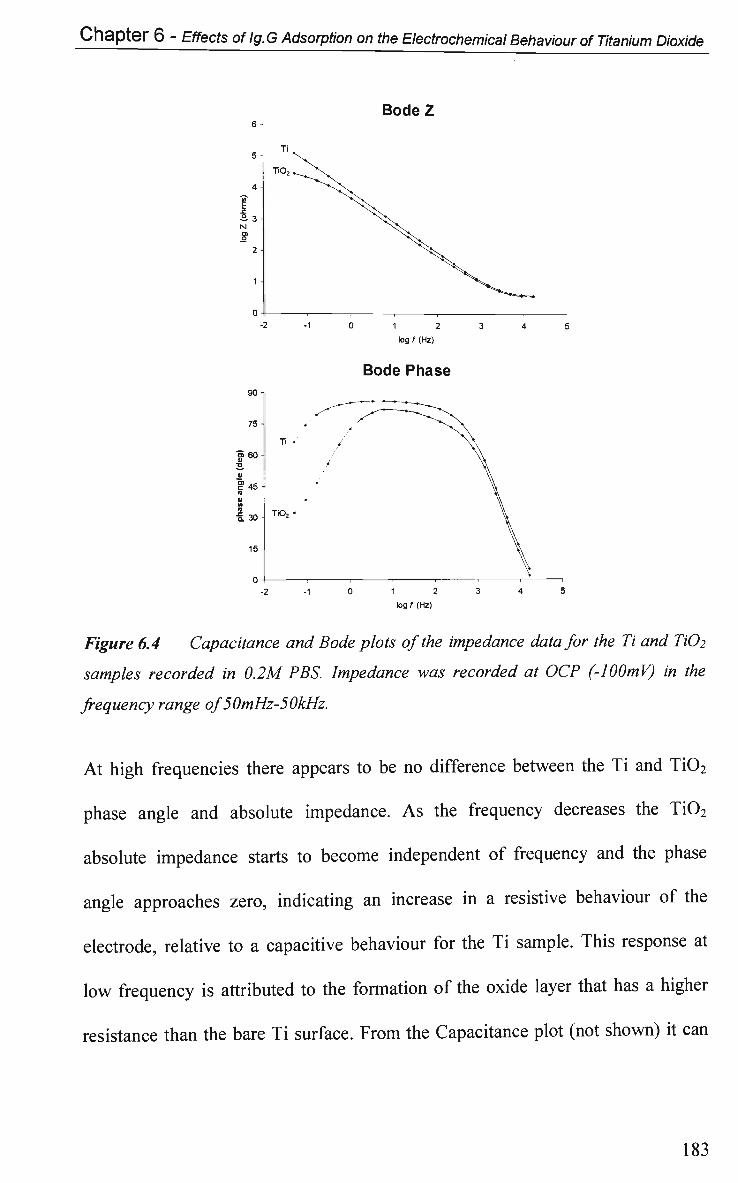
Chapter 6 - Effects of lg. G Adsorption on the Electrochemical Behaviour of Titanium Dioxide
BodeZ
1 2
log f (Hz)
Bode Phase
75
o> 60
£45
a 30
15
TiO,
1 2 3
log f (Hz)
Figure 6.4 Capacitance and Bode plots of the impedance data for the Ti and TiO2
samples recorded in 0.2M PBS. Impedance was recorded at OCP (-lOOmV) in the
frequency range of 50mHz-50kHz.
At high frequencies there appears to be no difference between the Ti and Ti02
phase angle and absolute impedance. As the frequency decreases the Ti02
absolute impedance starts to become independent of frequency and the phase
angle approaches zero, indicating an increase in a resistive behaviour of the
electrode, relative to a capacitive behaviour for the Ti sample. This response at
low frequency is attributed to the formation of the oxide layer that has a higher
resistance than the bare Ti surface. From the Capacitance plot (not shown) it can
183
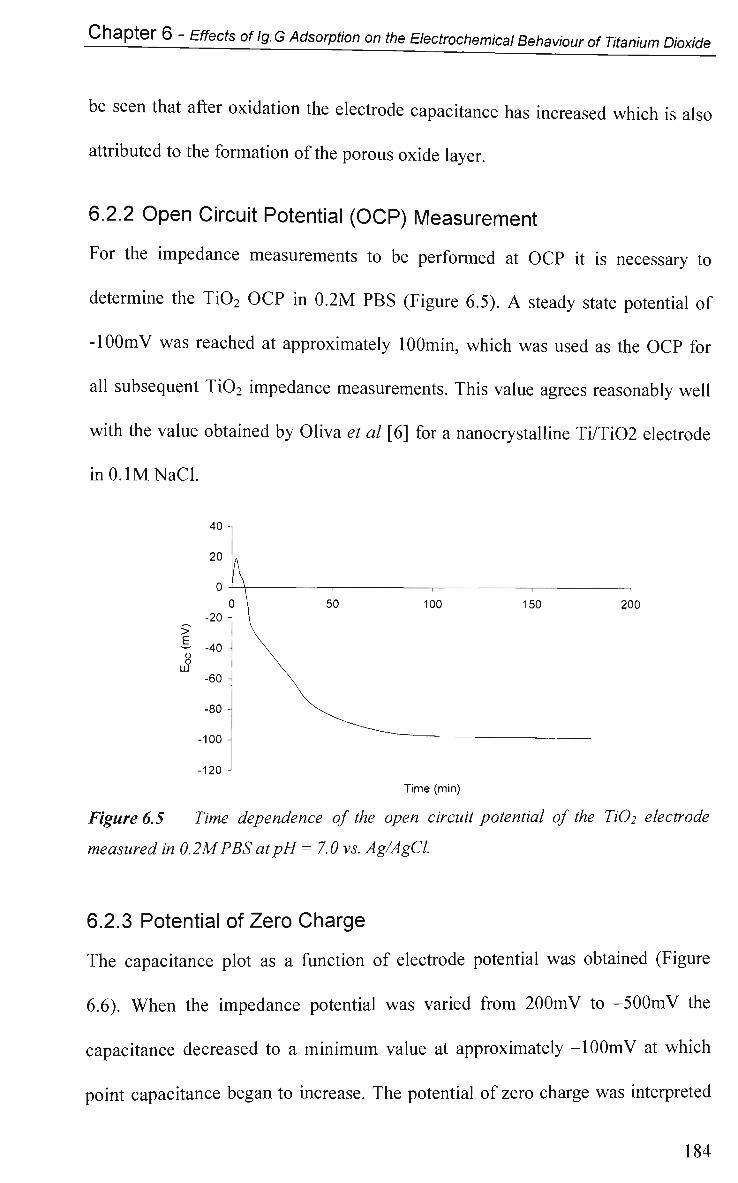
Chapter 6 - Effects oflg.G Adsorption on the Electrochemical Behaviour of Titanium Dioxide
be seen that after oxidation the electrode capacitance has increased which is also
attributed to the formation of the porous oxide layer.
6.2.2 Open Circuit Potential (OCP) Measurement
For the impedance measurements to be performed at O C P it is necessary to
determine the Ti02 O C P in 0.2M PBS (Figure 6.5). A steady state potential of
-lOOmV was reached at approximately lOOmin, which was used as the O C P for
all subsequent Ti02 impedance measurements. This value agrees reasonably well
with the value obtained by Oliva et al [6] for a nanocrystalline Ti/Ti02 electrode
inO.lMNaCl.
40 -
20 -.
o -A , , , 0 \ 50 100 150 200
f "20i V - -40 A \ ° I \ UJ \
-60 -i \ -80 - \.
-100 "~~"~" "
-120 -
Time (min)
Figure 6.5 Time dependence of the open circuit potential of the TiO2 electrode
measured in 0.2MPBSatpH = 7.0 vs. Ag/AgCl.
6.2.3 Potential of Zero Charge
The capacitance plot as a function of electrode potential was obtained (Figure
6.6). When the impedance potential was varied from 200mV to -500mV the
capacitance decreased to a minimum value at approximately -lOOmV at which
point capacitance began to increase. The potential of zero charge was interpreted
184
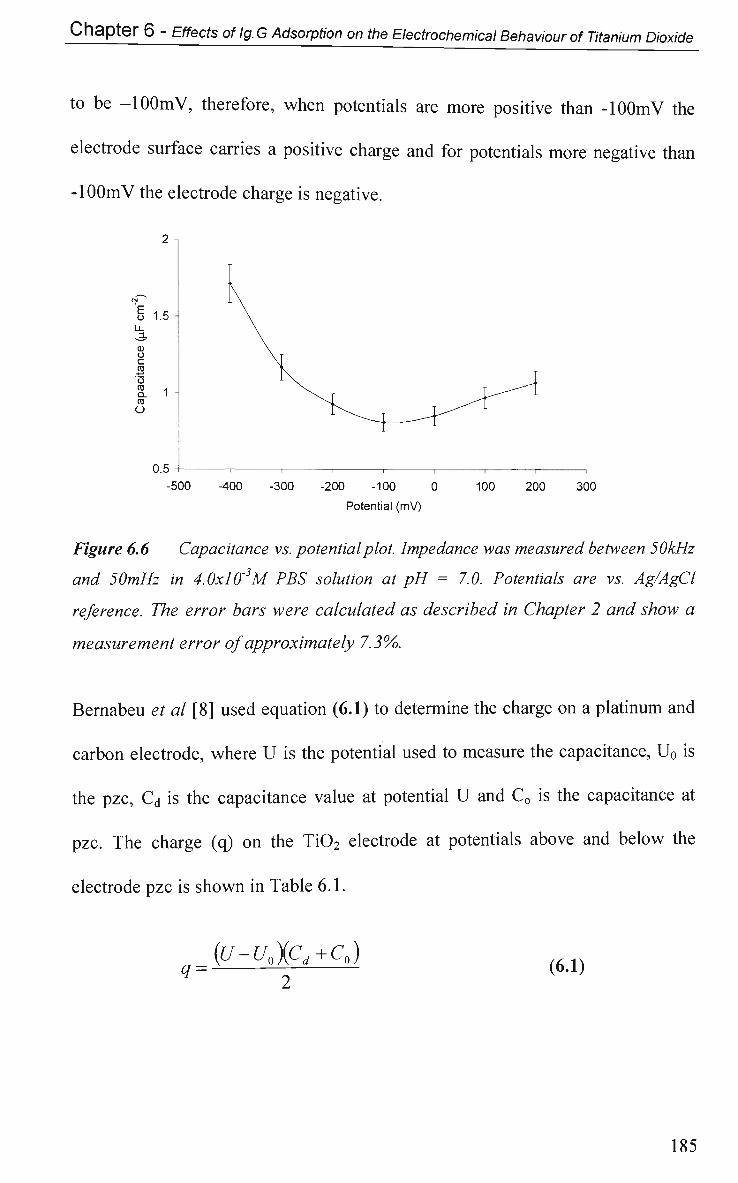
Chapter 6 - Effects of Ig.G Adsorption on the Electrochemical Behaviour of Titanium Dioxide
to be -lOOmV, therefore, when potentials are more positive than -lOOmV the
electrode surface carries a positive charge and for potentials more negative than
-lOOmV the electrode charge is negative.
2 -
o 1.5
CD O
c o Q. 1 cu O
0.5 -500 -400 -300 -200 -100 0
Potential (mV)
100 200 300
Figure 6.6 Capacitance vs. potential plot. Impedance was measured between 50kHz
and 50mHz in 4.0x10'3M PBS solution at pH = 7.0. Potentials are vs. Ag/AgCl
reference. The error bars were calculated as described in Chapter 2 and show a
measurement error of approximately 7.3%.
Bernabeu et al [8] used equation (6.1) to determine the charge on a platinum and
carbon electrode, where U is the potential used to measure the capacitance, U0 is
the pzc, Cd is the capacitance value at potential U and C0 is the capacitance at
pzc. The charge (q) on the Ti02 electrode at potentials above and below the
electrode pzc is shown in Table 6.1.
q = (u-u0Xcd+c0) (6.1)
185
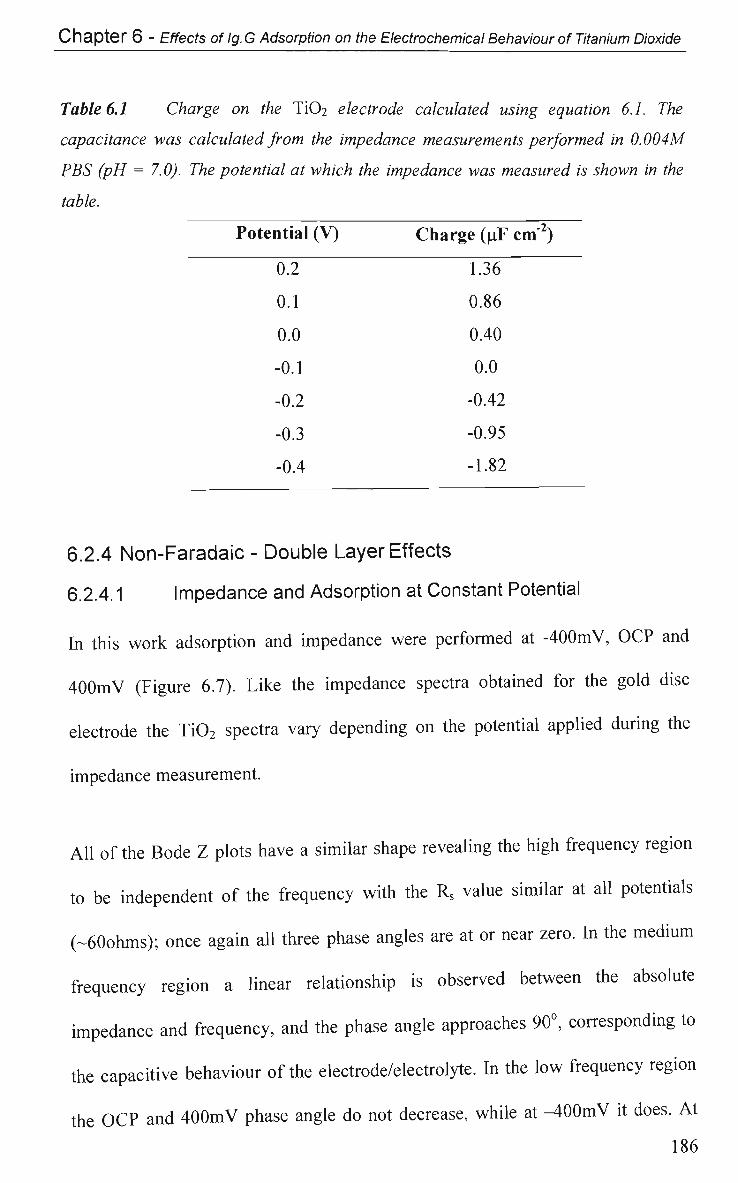
Chapter 6 - Effects of lg. G Adsorption on the Electrochemical Behaviour of Titanium Dioxide
Table 6.1 Charge on the Ti02 electrode calculated using equation 6.1. The
capacitance was calculated from the impedance measurements performed in 0.004M
PBS (pH = 7.0). The potential at which the impedance was measured is shown in the
table.
Potential (V)
0.2
0.1
0.0
-0.1
-0.2
-0.3
-0.4
Ch arge (p.F cm")
1.36
0.86
0.40
0.0
-0.42
-0.95
-1.82
6.2.4 Non-Faradaic - Double Layer Effects
6.2.4.1 Impedance and Adsorption at Constant Potential
In this work adsorption and impedance were performed at -400mV, O C P and
4 0 0 m V (Figure 6.7). Like the impedance spectra obtained for the gold disc
electrode the Ti0 2 spectra vary depending on the potential applied during the
impedance measurement.
All of the Bode Z plots have a similar shape revealing the high frequency region
to be independent of the frequency with the Rs value similar at all potentials
(~60ohms); once again all three phase angles are at or near zero. In the medium
frequency region a linear relationship is observed between the absolute
impedance and frequency, and the phase angle approaches 90°, corresponding to
the capacitive behaviour of the electrode/electrolyte. In the low frequency region
the O C P and 4 0 0 m V phase angle do not decrease, while at - 4 0 0 m V it does. At
186
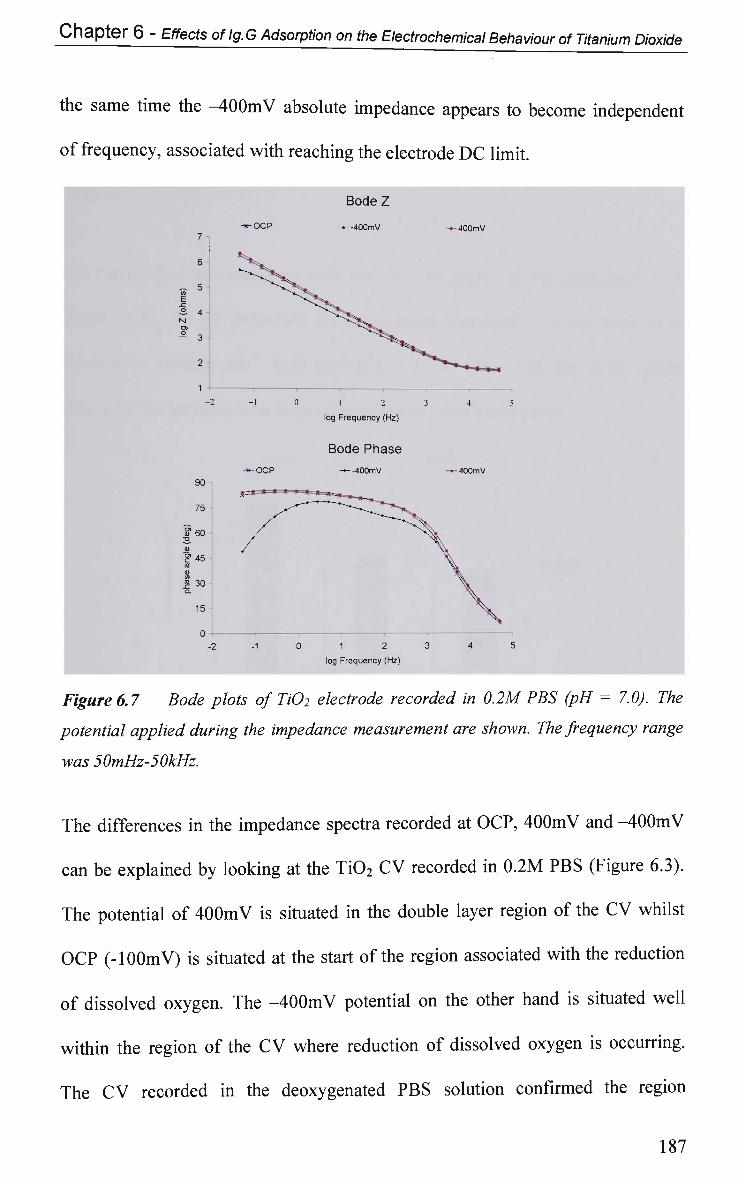
Chapter 6 - Effects oflg.G Adsorption on the Electrochemical Behaviour of Titanium Dioxide
the same time the -400mV absolute impedance appears to become independent
of frequency, associated with reaching the electrode D C limit.
Figure 6.7 Bode plots of Ti02 electrode recorded in 0.2M PBS (pH = 7.0). The
potential applied during the impedance measurement are shown. The frequency range
was 50mHz-50kHz.
The differences in the impedance spectra recorded at OCP, 400mV and -400mV
can be explained by looking at the Ti02 C V recorded in 0.2M PBS (Figure 6.3).
The potential of 4 0 0 m V is situated in the double layer region of the C V whilst
O C P (-lOOmV) is situated at the start of the region associated with the reduction
of dissolved oxygen. The -400mV potential on the other hand is situated well
within the region of the C V where reduction of dissolved oxygen is occurring.
The C V recorded in the deoxygenated P B S solution confirmed the region
187
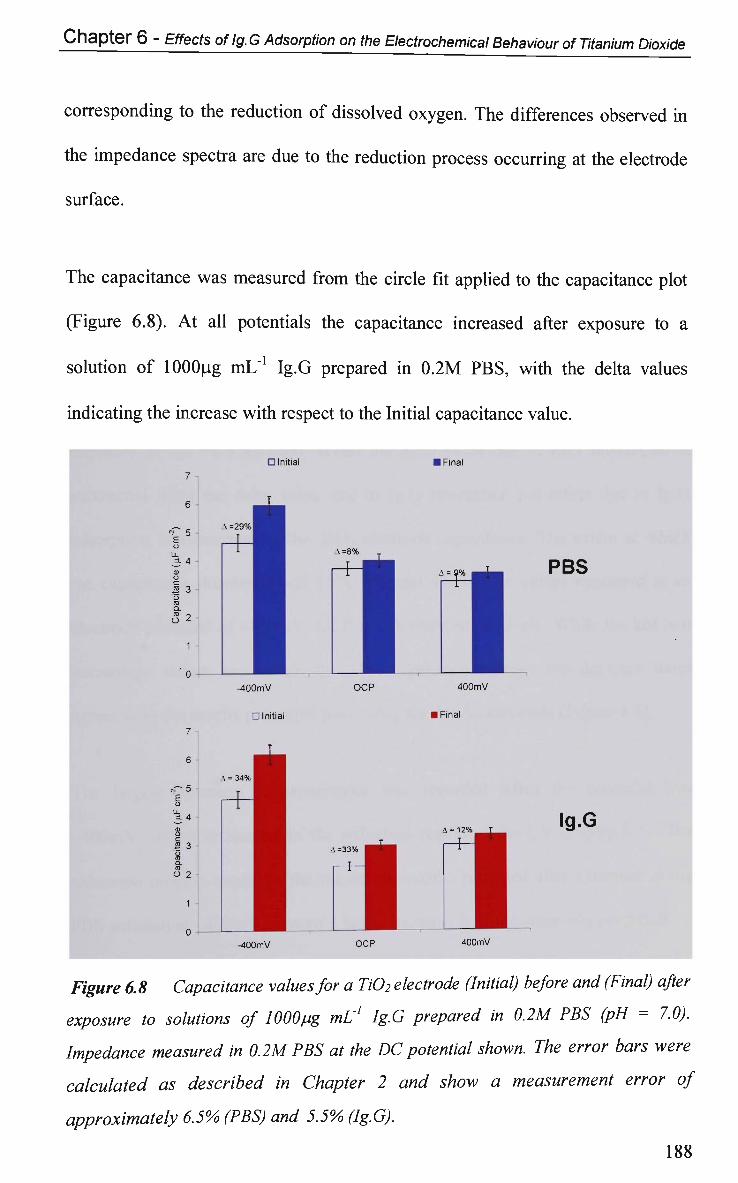
Chapter 6 - Effects of Ig.G Adsorption on the Electrochemical Behaviour of Titanium Dioxide
corresponding to the reduction of dissolved oxygen. The differences observed in
the impedance spectra are due to the reduction process occurring at the electrode
surface.
The capacitance was measured from the circle fit applied to the capacitance plot
(Figure 6.8). At all potentials the capacitance increased after exposure to a
solution of lOOOug mL"1 Ig.G prepared in 0.2M PBS, with the delta values
indicating the increase with respect to the Initial capacitance value.
• Initial
7 -|
6 -
<T 5 -E o LL
3 4 " CD O C
3 3 -o ra Q.
ra -, O 2 • ' 0 —
7-
6 -
.T* 5 -E 0 4= 4 . 0 o c JS 3 o ro a. CO
o 2 1 -0 -r—
\=29%H
-400mV
D Initial
A = 34% 1
•
1 -400 mV
• Final
\=8% T
_• Li OCP 400mV
• Final
v=33% |
1 1 OCP 400mV
Figure 6.8 Capacitance values for a Ti02 electrode (Initial) before and (Final) after
exposure to solutions of 1000pg mL1 Ig.G prepared in 0.2M PBS (pH = 7.0).
Impedance measured in 0.2MPBS at the DC potential shown. The error bars were
calculated as described in Chapter 2 and show a measurement error of
approximately 6.5% (PBS) and 5.5% (Ig.G).
188
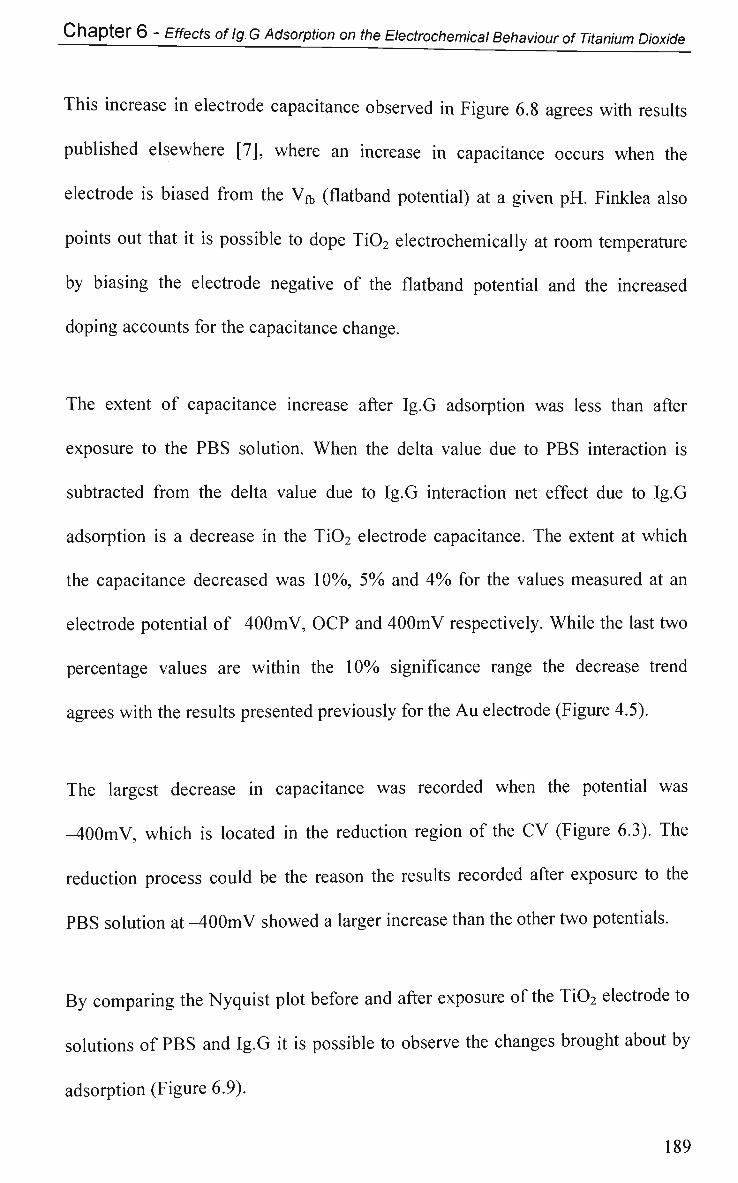
Chapter 6 - Effects of Ig.G Adsorption on the Electrochemical Behaviour of Titanium Dioxide
This increase in electrode capacitance observed in Figure 6.8 agrees with results
published elsewhere [7], where an increase in capacitance occurs when the
electrode is biased from the Vft (flatband potential) at a given pH. Finklea also
points out that it is possible to dope Ti02 electrochemically at room temperature
by biasing the electrode negative of the flatband potential and the increased
doping accounts for the capacitance change.
The extent of capacitance increase after Ig.G adsorption was less than after
exposure to the PBS solution. When the delta value due to PBS interaction is
subtracted from the delta value due to Ig.G interaction net effect due to Ig.G
adsorption is a decrease in the Ti02 electrode capacitance. The extent at which
the capacitance decreased was 10%, 5% and 4% for the values measured at an
electrode potential of -400mV, OCP and 400mV respectively. While the last two
percentage values are within the 10% significance range the decrease trend
agrees with the results presented previously for the Au electrode (Figure 4.5).
The largest decrease in capacitance was recorded when the potential was
-400mV, which is located in the reduction region of the CV (Figure 6.3). The
reduction process could be the reason the results recorded after exposure to the
PBS solution at -400mV showed a larger increase than the other two potentials.
By comparing the Nyquist plot before and after exposure of the Ti02 electrode to
solutions of PBS and Ig.G it is possible to observe the changes brought about by
adsorption (Figure 6.9).
189
Chapter 6 - Effects of lg. G Adsorption on the Electrochemical Behaviour of Titanium Dioxide
3.0E+06
5.0E+05
O.OE+OO
3.0E+06
Initial
Final PBS
O.OE+OO 1.OE+05 2 OE+05 3.0E+05 4.OE+05 5.OE+05
ZR (ohms)
2.5E+06
2.0E+06
Initial . Final
Ig.G
O.OE+00
O.OE+OO 1.OE+05 2.0E+05 3 OE+05 4.0E+05 5.OE+05
ZR (ohms)
Figure 6.9 The Nyquist plot for a TiO 2 electrode (Initial) before and (Final) after
exposure to solutions of 0.2MPBS and 1000pg mL1 Ig.G (pH = 7.0). Adsorption and
Impedance was performed at OCP in PBS (pH = 7.0).
As adsorption occurred at the electrode surface the semi-circle feature became
smaller indicating a reduction in the Rct. This reduction in Rct after adsorption is
the opposite of what was observed for the A u disc electrode, however, it was
observed when adsorption occurred at the A u S U S electrode (Chapter 4 - Section
4.2.4.2). This decrease in Rct could be due to modification of the Ti0 2 surface
during protein adsorption. The surface modification appears to activate the
surface and be associated with either doping or further oxidation of Ti02, since
the electrode is polycrystalline comprising of a mixture of rutile and anatase
forms of Ti02. Anodic oxidation results of Ti0 2 are consistent with direct
injection of electrons into the Ti0 2 conduction band [9]. This electron injection
190
Chapter 6 - Effects of lg. G Adsorption on the Electrochemical Behaviour of Titanium Dioxide
has the effect of further doping of the electrode [7]. While this anodic oxidation
doping process does not change the composition of the polycrystalline Ti02
sample it may account for the "activation" observed. Polartechnics Pty Ltd. have
observed that the Ti02 electrode dehydrates during storage, suggesting that
hydration of the electrode during adsorption may also contribute to the activation
process. This surface modification process was also observed in the work
performed in potassium ferricyanide (Section 6.2.5).
It is clear that after exposure to the solution of PBS the Rc+ value decreased more
than after Ig.G adsorption. This agrees with what was observed for the Au disc
electrode where an increase in Rc+ was observed after Ig.G adsorption but not
after PBS. If the activation of the Ti02 electrode was the same after exposure to
the PBS and Ig.G solutions then the decrease in Rct will be the same, however, if
adsorption of Ig.G causes an increase in Rct during exposure then the final Rct
value will be less than PBS. The same results were observed at OCP and 400mV,
however the extent of the Rct decrease was less.
6.2.4.2 Impedance at OCP
6.2.4.2.1 Adsorption at Constant Potential
To investigate the effect of varying the potential at which adsorption occurred,
the impedance was measured in 0.2M PBS at OCP before and after adsorption at
an electrode potential of 400mV and -400mV (Figure 6.10). The results
presented in Figure 6.8 and 6.10 show a significant variation in the electrode
capacitance after exposure to the 0.2M PBS solution suggesting adsorption of
191
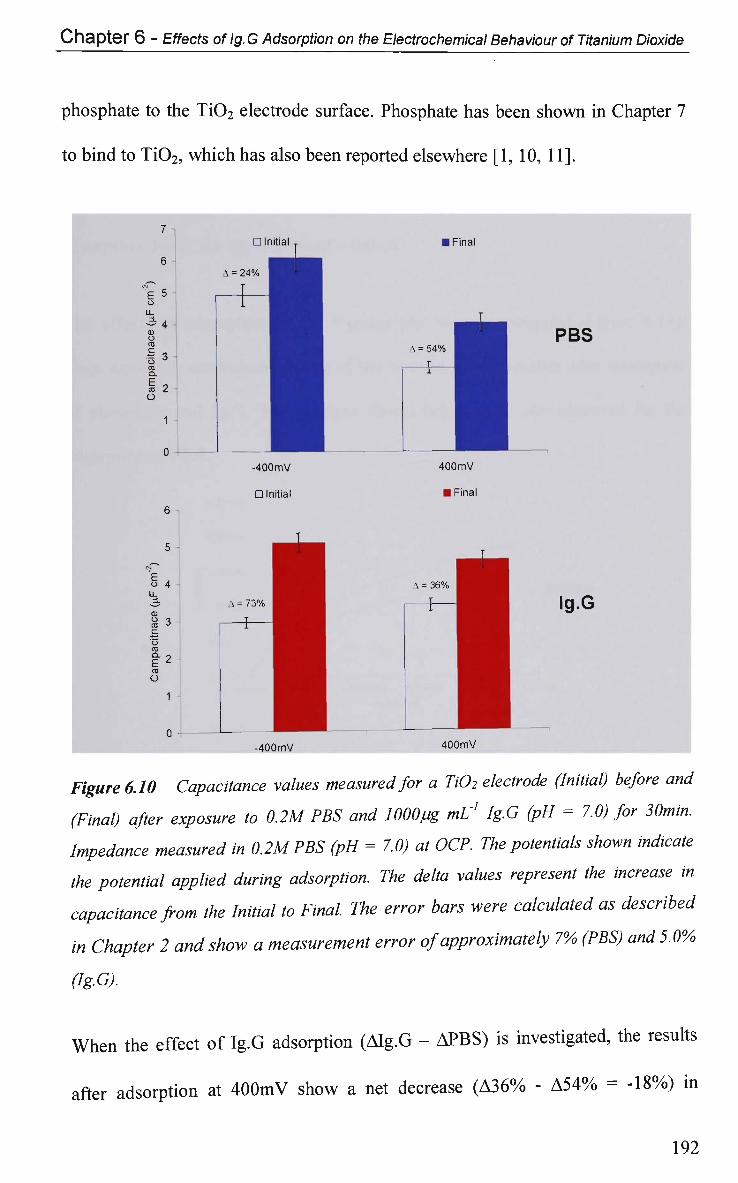
Chapter 6 - Effects of Ig.G Adsorption on the Electrochemical Behaviour of Titanium Dioxide
phosphate to the Ti0 2 electrode surface. Phosphate has been shown in Chapter 7
to bind to Ti02, which has also been reported elsewhere [1, 10, 11].
7 -,
6 -
E5 O
3A. O
is-Q.
03 2
O
1 -
• Initial T
A = 2 4 %
1 i
U -400mV
D Initial
6
5
E . o 4 -LL
3 A = 73%
° 3 -c o ro ra O
1
Q
T
1
^ _
1
1 1
• Final
A = 54%
T 1
400 mV
• Final
A = 36%
T I
PBS
Ig.G
-400mV 400mV
Figure 6.10 Capacitance values measured for a Ti02 electrode (Initial) before and
(Final) after exposure to 0.2M PBS and lOOOpg mL1 Ig.G (pH = 7.0) for 30min.
Impedance measured in 0.2MPBS (pH = 7.0) at OCP. The potentials shown indicate
the potential applied during adsorption. The delta values represent the increase in
capacitance from the Initial to Final. The error bars were calculated as described
in Chapter 2 and show a measurement error of approximately 7% (PBS) and 5.0%
(Ig.G).
W h e n the effect of Ig.G adsorption (Alg.G - APBS) is investigated, the results
after adsorption at 4 0 0 m V show a net decrease (A36% - A 5 4 % = -18%) in
192
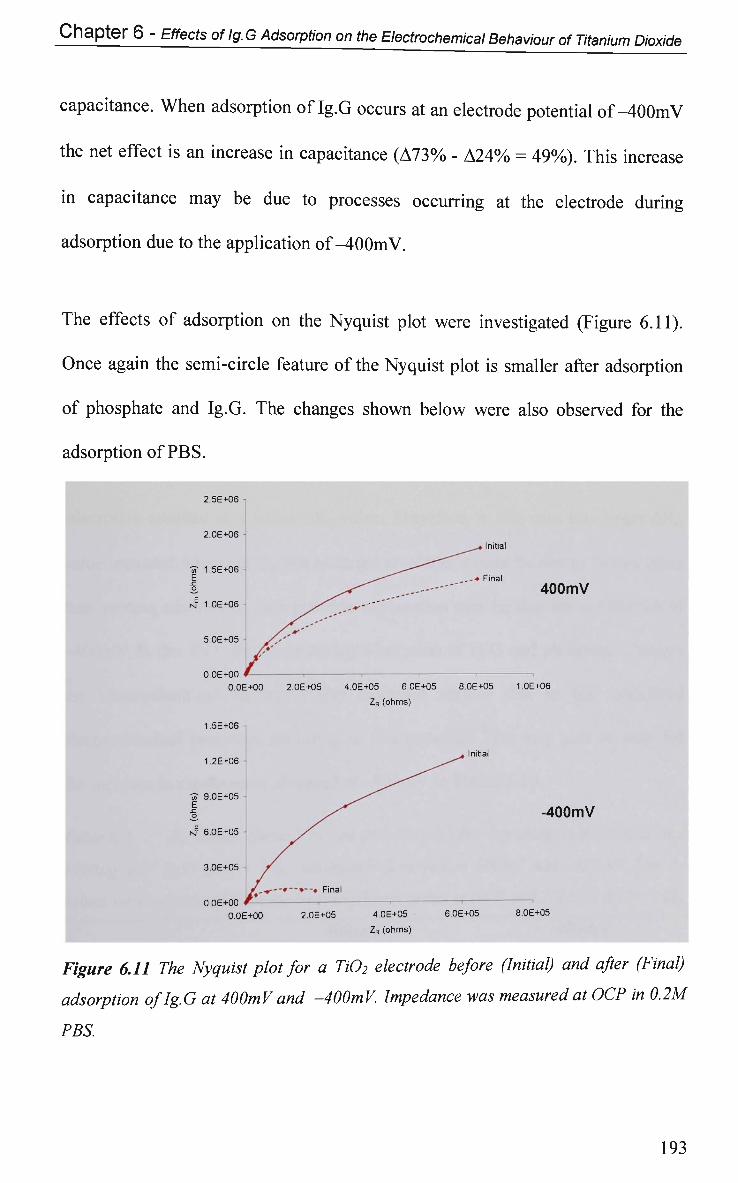
Chapter 6 - Effects of Ig.G Adsorption on the Electrochemical Behaviour of Titanium Dioxide
capacitance. When adsorption oflg.G occurs at an electrode potential of-400mV
the net effect is an increase in capacitance (A73% - A24% = 49%). This increase
in capacitance may be due to processes occurring at the electrode during
adsorption due to the application of-400mV.
The effects of adsorption on the Nyquist plot were investigated (Figure 6.11).
Once again the semi-circle feature of the Nyquist plot is smaller after adsorption
of phosphate and Ig.G. The changes shown below were also observed for the
adsorption of PBS.
400mV
1 OE+06
-400mV
8.0E+05
Figure 6.11 The Nyquist plot for a Ti02 electrode before (Initial) and after (Final)
adsorption oflg.G at 400mV and -400mV. Impedance was measured at OCP in 0.2M
PBS.
2.5E+06 i
2.0E+06
V 1.5E+06 • E o_
NS 1.0E+06 •
5.0E+05 •
O.OE+OO <
^^» Initial
^ — ___-•• Final
i i
0 OE+00 2.OE+05 4.OE+05 6.OE+05 8.OE+05
ZR (ohms)
1 5E+06 -
1.2E+06
S 9.OE+05 E
_____ rvf 6.OE+05
3.0E+05
r» r\cr j_rtA i U.Ub+UU i
0.0E
» Initial
+00 2.OE+05 40E+05 6.0E+05
ZR (ohms)
193
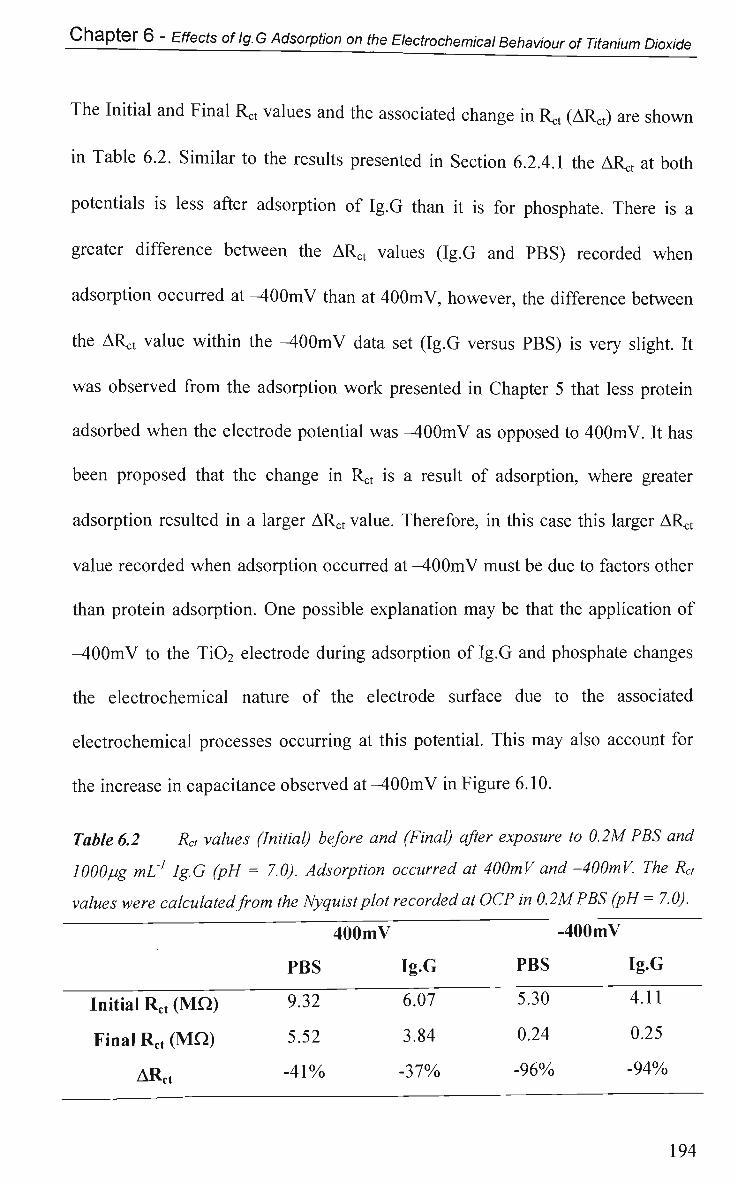
Chapter 6 - Effects oflg.G Adsorption on the Electrochemical Behaviour of Titanium Dioxide
The Initial and Final R^ values and the associated change in R^ (AR^) are shown
in Table 6.2. Similar to the results presented in Section 6.2.4.1 the ARc+ at both
potentials is less after adsorption of Ig.G than it is for phosphate. There is a
greater difference between the A R ^ values (Ig.G and PBS) recorded when
adsorption occurred at - 4 0 0 m V than at 400mV, however, the difference between
the ARct value within the - 4 0 0 m V data set (Ig.G versus PBS) is very slight. It
was observed from the adsorption work presented in Chapter 5 that less protein
adsorbed when the electrode potential was -400m V as opposed to 400mV. It has
been proposed that the change in Rc+ is a result of adsorption, where greater
adsorption resulted in a larger AR<.t value. Therefore, in this case this larger A R ^
value recorded when adsorption occurred at - 4 0 0 m V must be due to factors other
than protein adsorption. One possible explanation may be that the application of
-4 0 0 m V to the Ti0 2 electrode during adsorption of Ig.G and phosphate changes
the electrochemical nature of the electrode surface due to the associated
electrochemical processes occurring at this potential. This may also account for
the increase in capacitance observed at - 4 0 0 m V in Figure 6.10.
Table 6.2 Rct values (Initial) before and (Final) after exposure to 0.2MPBS and
lOOOpg mL1 Ig.G (pH = 7.0). Adsorption occurred at 400mV and -400mV. The Rct
values were calculated from the Nyquist plot recorded at OCP in 0.2MPBS (pH = 7.0).
Initial Rct (MQ)
Final Rct (MQ)
ARct
PBS
9.32
5.52
-41%
400mV
Ig.G
6.07
3.84
-37%
-400mV
PBS Ig.G
5.30 4.11
0.24 0.25
-96% -94%
194
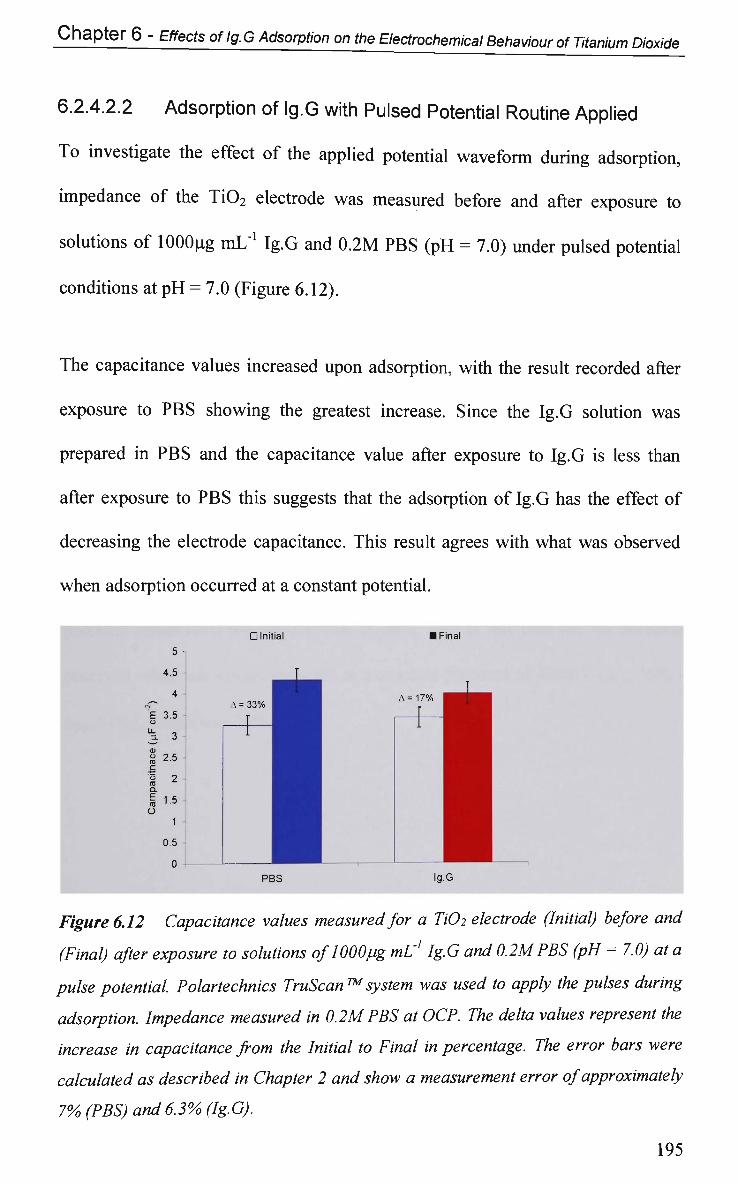
Chapter 6 - Effects oflg.G Adsorption on the Electrochemical Behaviour of Titanium Dioxide
6.2.4.2.2 Adsorption of Ig.G with Pulsed Potential Routine Applied
To investigate the effect of the applied potential waveform during adsorption,
impedance of the Ti0 2 electrode was measured before and after exposure to
solutions of lOOOpg mL'1 Ig.G and 0.2M P B S (pH = 7.0) under pulsed potential
conditions at p H = 7.0 (Figure 6.12).
The capacitance values increased upon adsorption, with the result recorded after
exposure to P B S showing the greatest increase. Since the Ig.G solution was
prepared in P B S and the capacitance value after exposure to Ig.G is less than
after exposure to P B S this suggests that the adsorption of Ig.G has the effect of
decreasing the electrode capacitance. This result agrees with what was observed
when adsorption occurred at a constant potential.
Figure 6.12 Capacitance values measured for a Ti02 electrode (Initial) before and
(Final) after exposure to solutions of 1000pg mL1 Ig.G and 0.2MPBS (pH = 7.0) at a
pulse potential. Polartechnics TruScan™system was used to apply the pulses during
adsorption. Impedance measured in 0.2M PBS at OCP. The delta values represent the
increase in capacitance from the Initial to Final in percentage. The error bars were
calculated as described in Chapter 2 and show a measurement error of approximately
7% (PBS) and 6.3%> (Ig.G).
195
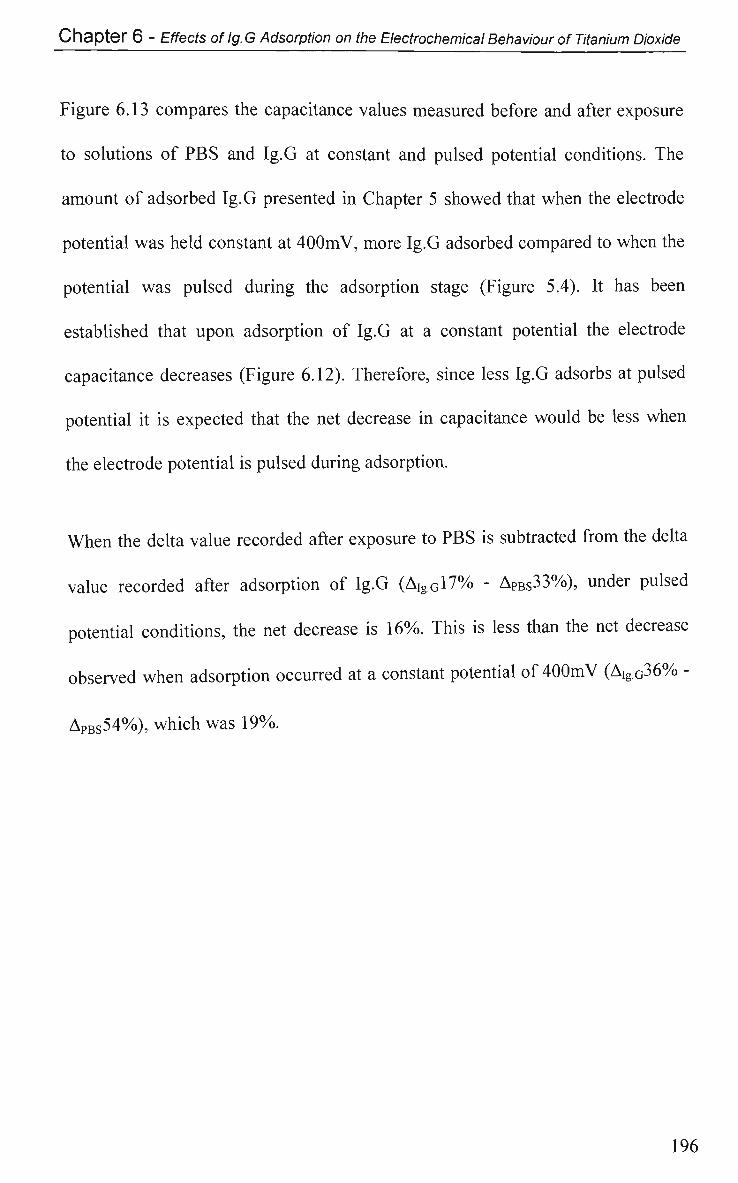
Chapter 6 - Effects of Ig.G Adsorption on the Electrochemical Behaviour of Titanium Dioxide
Figure 6.13 compares the capacitance values measured before and after exposure
to solutions of PBS and Ig.G at constant and pulsed potential conditions. The
amount of adsorbed Ig.G presented in Chapter 5 showed that when the electrode
potential was held constant at 400mV, more Ig.G adsorbed compared to when the
potential was pulsed during the adsorption stage (Figure 5.4). It has been
established that upon adsorption of Ig.G at a constant potential the electrode
capacitance decreases (Figure 6.12). Therefore, since less Ig.G adsorbs at pulsed
potential it is expected that the net decrease in capacitance would be less when
the electrode potential is pulsed during adsorption.
When the delta value recorded after exposure to PBS is subtracted from the delta
value recorded after adsorption of Ig.G (AIgG17% - APBS33%), under pulsed
potential conditions, the net decrease is 16%. This is less than the net decrease
observed when adsorption occurred at a constant potential of 400mV (AigG36% -
APBS54%), which was 19%.
196
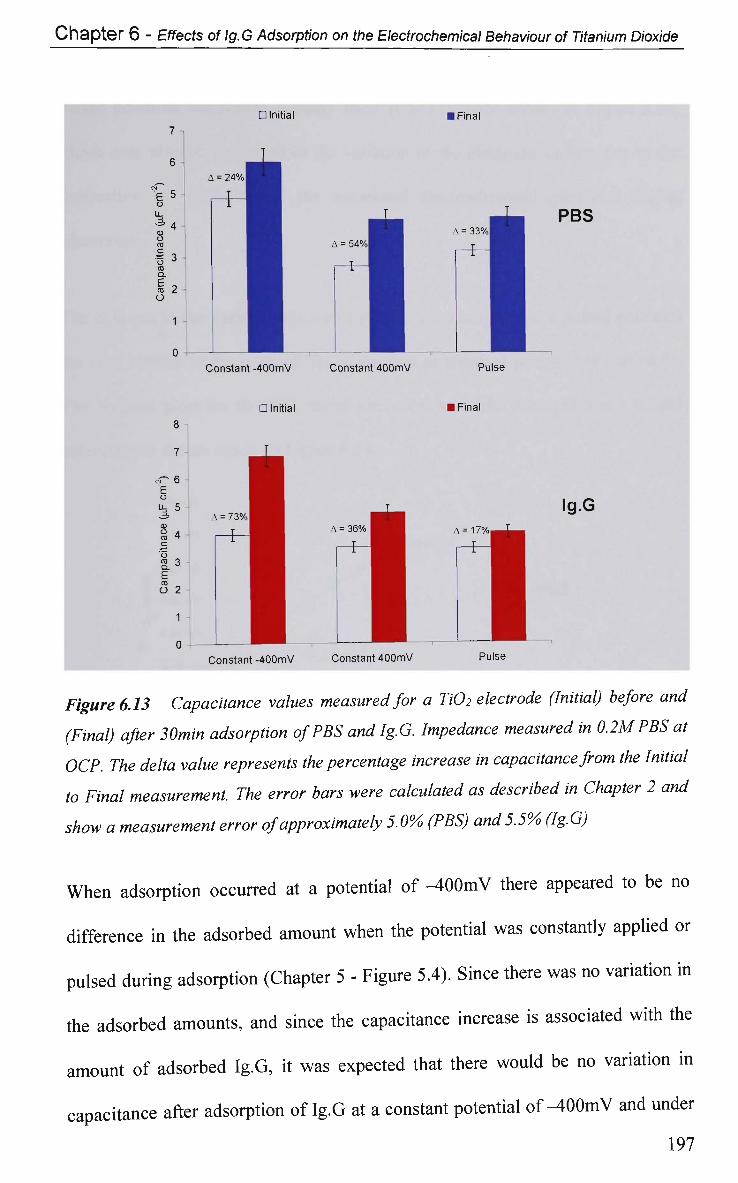
Chapter 6 - Effects of Ig.G Adsorption on the Electrochemical Behaviour of Titanium Dioxide
£5 o <* 4
8 ro ••§ 3 CD D.
f 2 o
• Initial
A = 2 4 % I
Constant -400mV
A = 54%.
Constant 400mV
I Final
A = 33%l
Pulse
PBS
• Initial I Final
OJ^ 6
'E o ^ 5
o 2.3 E O 2
A = 73% I
Constant-400mV
A = 36%
Constant 400mV
A =17%
Pulse
Ig.G
Figure 6.13 Capacitance values measured for a Ti02 electrode (Initial) before and
(Final) after 30min adsorption of PBS and Ig.G. Impedance measured in OJMPBSat
OCP. The delta value represents the percentage increase in capacitance from the Initial
to Final measurement The error bars were calculated as described in Chapter 2 and
show a measurement error of approximately 5.0% (PBS) and 5.5% (Ig.G)
When adsorption occurred at a potential of -400mV there appeared to be no
difference in the adsorbed amount when the potential was constantly applied or
pulsed during adsorption (Chapter 5 - Figure 5.4). Since there was no variation in
the adsorbed amounts, and since the capacitance increase is associated with the
amount of adsorbed Ig.G, it was expected that there would be no variation in
capacitance after adsorption oflg.G at a constant potential of-400mV and under
197
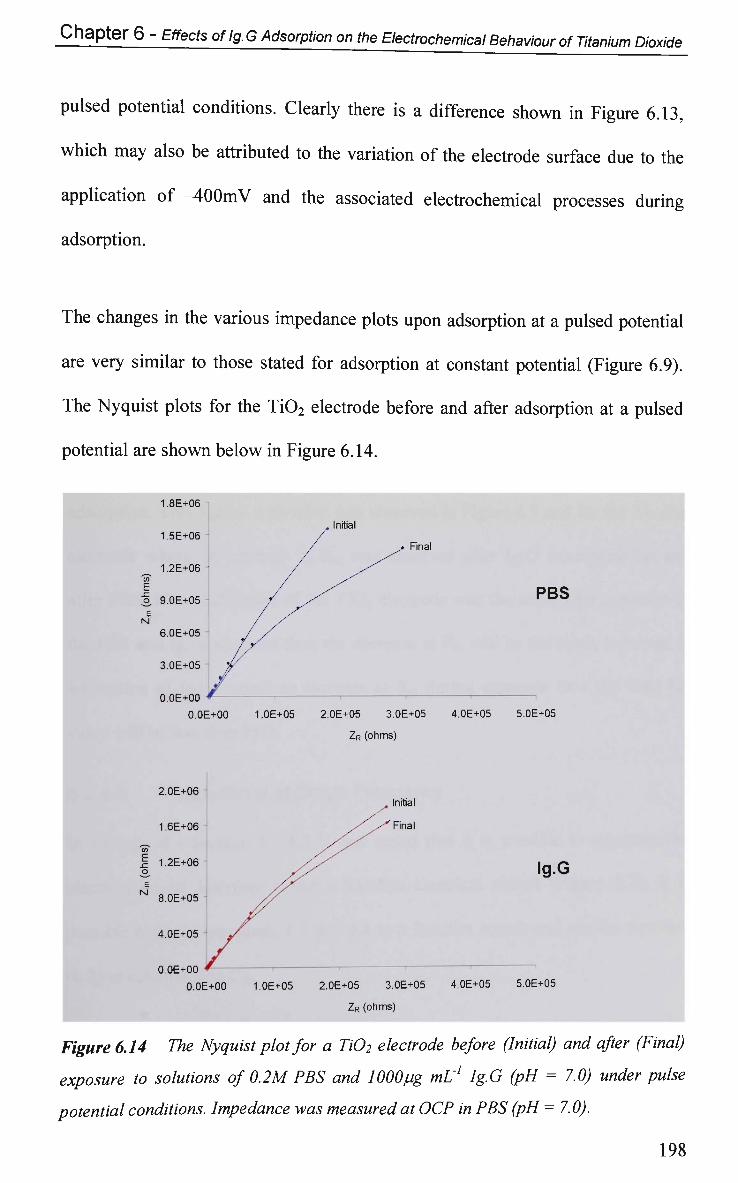
Chapter 6 - Effects of lg. G Adsorption on the Electrochemical Behaviour of Titanium Dioxide
pulsed potential conditions. Clearly there is a difference shown in Figure 6.13,
which may also be attributed to the variation of the electrode surface due to the
application of - 4 0 0 m V and the associated electrochemical processes during
adsorption.
The changes in the various impedance plots upon adsorption at a pulsed potential
are very similar to those stated for adsorption at constant potential (Figure 6.9).
The Nyquist plots for the Ti0 2 electrode before and after adsorption at a pulsed
potential are shown below in Figure 6.14.
Final
PBS
.OE+05 4.OE+05 5.0E+05
)
Initial
Final
Ig.G
OE+05 4.OE+05 5.0E+05
)
Figure 6.14 The Nyquist plot for a Ti02 electrode before (Initial) and after (Final)
exposure to solutions of 0.2M PBS and 1000pg mL1 Ig.G (pH = 7.0) under pulse
potential conditions. Impedance was measured at OCP in PBS (pH = 7.0).
198
1.8E+06
1 5E+06 -
1.2E+06 "co" E o, 9.OE+05 ^ N
6.OE+05
3.OE+05 *AV
O.OE+OO * O.OE+00
2.0E+06
1.6E+06
In | 1.2E+06 o. E
N 8.OE+05
4.OE+05
O.OE+OO *
O.OE+00
1.OE+05
1.OE+05
. Initial
2.OE+05 3
ZR (ohms
2.0E+05 3
ZR (ohms
Chapter 6 - Effects of Ig.G Adsorption on the Electrochemical Behaviour of Titanium Dioxide
PowerSine™ calculates the Rct value by applying a circle fit to the Nyquist plot
data with the diameter of the circle fit being the Rct value in ohms. Due to the
capacitive nature of the Nyquist plots shown in Figure 6.14 the PowerSine™
software was unable to apply a circle fit to the whole data set. Therefore, it was
not possible to obtain Rc+ values for Initial and Final spectra recorded before and
after adsorption. It is possible to see however, that if the spectra were allowed to
continue to much lower frequencies and pass through the x-axis, the Rct value
would decrease upon adsorption of phosphate and Ig.G. It is clear that after
exposure to the solution of PBS the Rct value decreased more than after Ig.G
adsorption. This agrees with what was observed in Figure 6.9 and for the Au disc
electrode where an increase in Rct was observed after Ig.G adsorption but not
after PBS. If the activation of the Ti02 electrode was the same after exposure to
the PBS and Ig.G solutions then the decrease in Rct will be the same, however, if
adsorption of Ig.G causes an increase in Rct during exposure then the final Rct
value will be less than PBS.
6.2.4.3 Impedance at Single Frequency
In Chapter 4 - Section 4.2.4.3 it was stated that it is possible to represent the
electrochemical interface using a Randies electrical circuit (Figure 2.2). It is
possible to apply equations 4.3 and 4.4 to a Randies circuit and use the equation
(6.2) to calculate the Cdi.
n
z = KCdimJ (6.2)
199
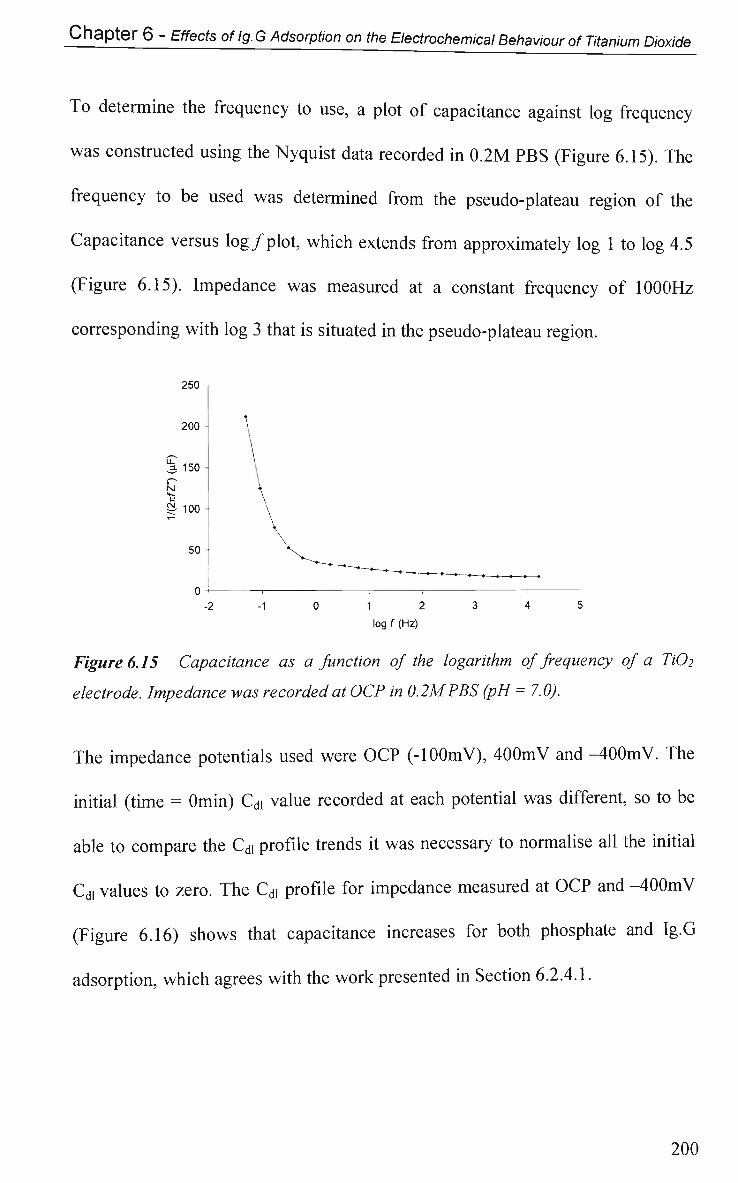
Chapter 6 - Effects of Ig.G Adsorption on the Electrochemical Behaviour of Titanium Dioxide
To determine the frequency to use, a plot of capacitance against log frequency
was constructed using the Nyquist data recorded in 0.2M PBS (Figure 6.15). The
frequency to be used was determined from the pseudo-plateau region of the
Capacitance versus log/plot, which extends from approximately log 1 to log 4.5
(Figure 6.15). Impedance was measured at a constant frequency of 1000Hz
corresponding with log 3 that is situated in the pseudo-plateau region.
250 -,
200 -
3 150 -
N
s| 100-
50
0 4-- 2 - 1 0 1 2 3 4 5
log f (Hz)
Figure 6.15 Capacitance as a function of the logarithm of frequency of a TiO2
electrode. Impedance was recorded at OCP in 0.2MPBS (pH =7.0).
The impedance potentials used were OCP (-100mV), 400mV and -400mV. The
initial (time = Omin) Cdi value recorded at each potential was different, so to be
able to compare the Cdi profile trends it was necessary to normalise all the initial
Ca values to zero. The Cdi profile for impedance measured at OCP and -400mV
(Figure 6.16) shows that capacitance increases for both phosphate and Ig.G
adsorption, which agrees with the work presented in Section 6.2.4.1.
200
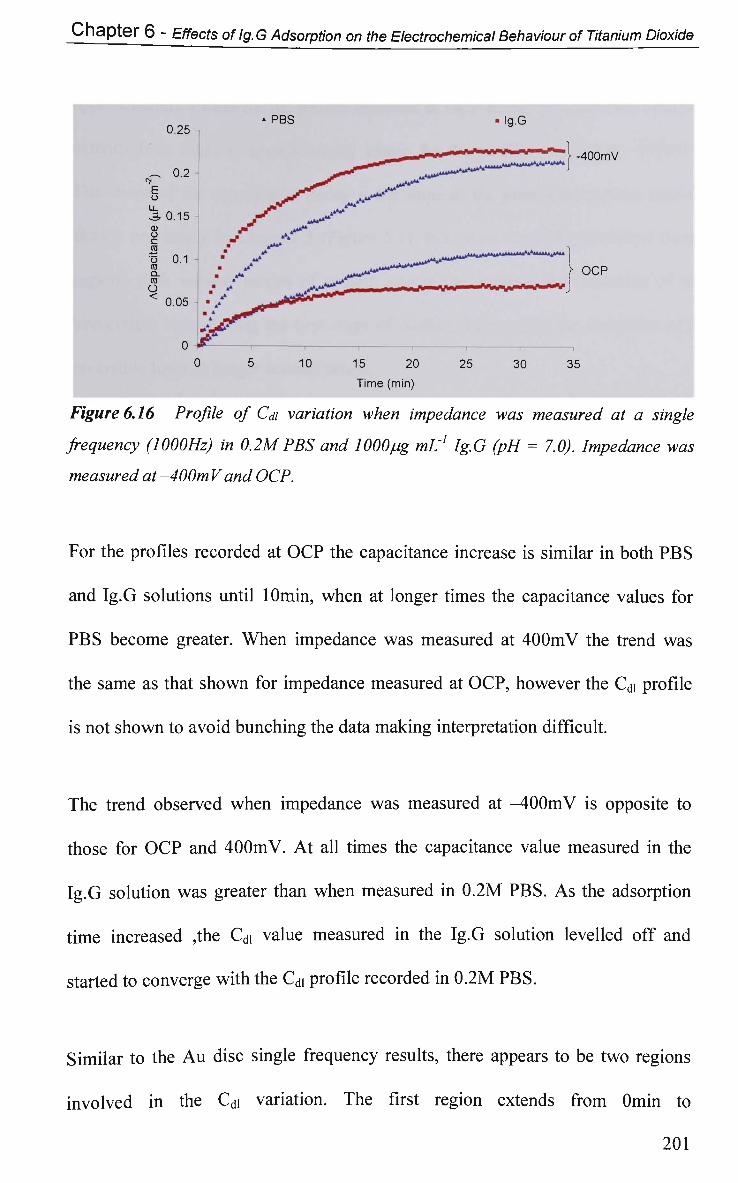
Chapter 6 - Effects oflg.G Adsorption on the Electrochemical Behaviour of Titanium Dioxide
Figure 6.16 Profile of Cdi variation when impedance was measured at a single
frequency (1000Hz) in 0.2MPBS and lOOOpg mL1 Ig.G (pH = 7.0). Impedance was
measured at -400m V and OCP.
For the profiles recorded at OCP the capacitance increase is similar in both PBS
and Ig.G solutions until lOmin, when at longer times the capacitance values for
P B S become greater. W h e n impedance was measured at 4 0 0 m V the trend was
the same as that shown for impedance measured at OCP, however the Cdi profile
is not shown to avoid bunching the data making interpretation difficult.
The trend observed when impedance was measured at -400mV is opposite to
those for O C P and 400mV. At all times the capacitance value measured in the
Ig.G solution was greater than when measured in 0.2M PBS. As the adsorption
time increased ,the C<u value measured in the Ig.G solution levelled off and
started to converge with the Cdi profile recorded in 0.2M PBS.
Similar to the Au disc single frequency results, there appears to be two regions
involved in the Cdi variation. The first region extends from Omin to
201
Chapter 6 - Effects oflg.G Adsorption on the Electrochemical Behaviour of Titanium Dioxide
approximately 15min for the profile recorded at OCP in the Ig.G solution while it
extends from Omin to approximately 25min for the profile recorded at -400mV.
The shape of the capacitance decay is the same as the protein adsorption profile
shown previously in Chapter 5 (Figure 5.1). Bernabeu et al [4] associated these
regions with various modes of protein adsorption, namely the formation of an
irreversible layer during the first stage of contact followed by the formation of a
reversible layer at longer contact times.
When the impedance was measured at OCP, 400mV and -400mV the Cdi profiles
levelled off within 25min of adsorption. Like the results presented for the Au
electrode in Chapter 5, further adsorption of protein at times greater than the time
it took for the Cdi value to level off has no effect on the electrode Cdi. However,
the adsorption results are for those using an Ig.G concentration of lOOug mL"1
and this work is performed in lOOOug mL"1. It may be possible that at this
concentration an adsorption maximum may have been reached by 25min oflg.G
adsorption.
The final Cdi values from Figure 6.16 after exposure for 3Omin are listed in Table
6.3. The Ig.G solution contains 0.2M PBS, therefore, to determine the effect of
Ig.G adsorption of the electrode Cdi the effect due to interaction of PBS must be
removed from the data recorded in the Ig.G solution. The change in Cdi due to
Ig.G only was calculated using the original (non-normalised data) and is
expressed as AC in Table 6.3. The AC value is the percentage change between
202
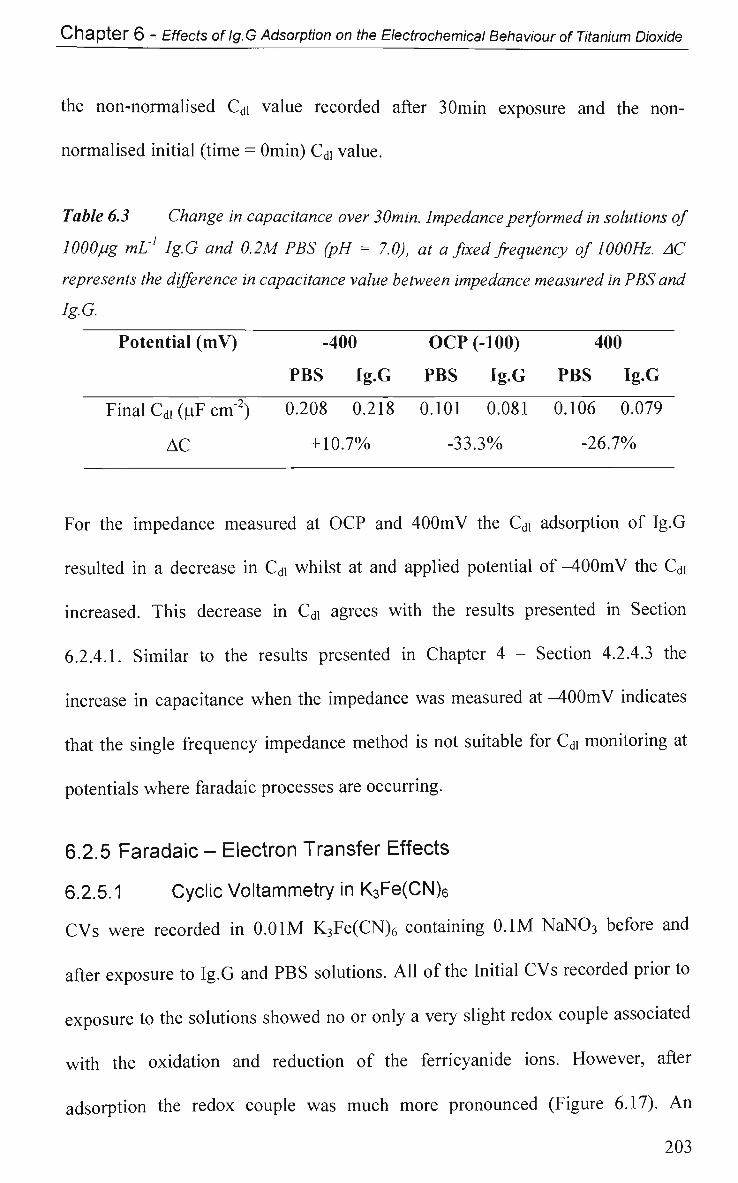
Chapter 6 - Effects oflg.G Adsorption on the Electrochemical Behaviour of Titanium Dioxide
the non-normalised Cdi value recorded after 3 Omin exposure and the non-
normalised initial (time = Omin) Cdi value.
Table 6.3 Change in capacitance over 30min. Impedance performed in solutions of
lOOOpg mL1 Ig.G and 0.2M PBS (pH = 7.0), at a fixed frequency of 1000Hz. AC
represents the difference in capacitance value between impedance measured in PBS and
Ig.G.
Potential (mV)
Final Cdi (uF cm"2)
AC
-400
PBS Ig.G
0.208 0.218
+10.7%
O C P (-100)
PBS Ig.G
0.101 0.081
-33.3%
400
PBS Ig.G
0.106 0.079
-26.7%
For the impedance measured at O C P and 4 0 0 m V the Cdl adsorption of Ig.G
resulted in a decrease in Cdi whilst at and applied potential of -400mV the Cdi
increased. This decrease in Cdi agrees with the results presented in Section
6.2.4.1. Similar to the results presented in Chapter 4 - Section 4.2.4.3 the
increase in capacitance when the impedance was measured at - 4 0 0 m V indicates
that the single frequency impedance method is not suitable for Cd! monitoring at
potentials where faradaic processes are occurring.
6.2.5 Faradaic - Electron Transfer Effects
6.2.5.1 Cyclic Voltammetry in K3Fe(CN)6
C V s were recorded in 0.01M K 3Fe(CN) 6 containing 0.1M N a N 0 3 before and
after exposure to Ig.G and P B S solutions. All of the Initial C V s recorded prior to
exposure to the solutions showed no or only a very slight redox couple associated
with the oxidation and reduction of the ferricyanide ions. However, after
adsorption the redox couple was much more pronounced (Figure 6.17). A n
203
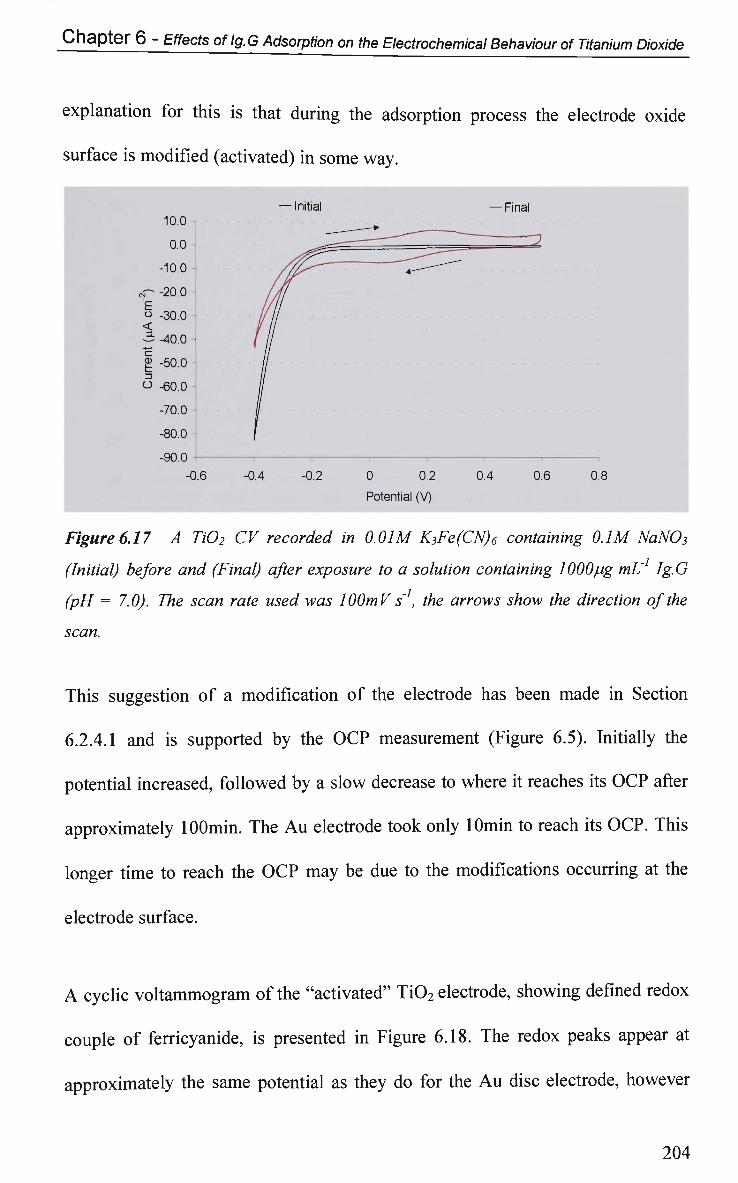
Chapter 6 - Effects oflg.G Adsorption on the Electrochemical Behaviour of Titanium Dioxide
explanation for this is that during the adsorption process the electrode oxide
surface is modified (activated) in some way.
ri- -20.0 E o -30.0 • < 3 -40.0 -§ -50.0 -
O -60.0 -
-70.0 -
-80.0 -
-90.0 -
-0.6
Figure 6.17 A Ti02 CV recorded in 0.01M K3Fe(CN)6 containing 0.1M NaN03
(Initial) before and (Final) after exposure to a solution containing lOOOpg mL Ig.G
(pH = 7.0). The scan rate used was lOOmV s'1, the arrows show the direction of the
scan.
This suggestion of a modification of the electrode has been made in Section
6.2.4.1 and is supported by the OCP measurement (Figure 6.5). Initially the
potential increased, followed by a slow decrease to where it reaches its OCP after
approximately lOOmin. The Au electrode took only lOmin to reach its OCP. This
longer time to reach the OCP may be due to the modifications occurring at the
electrode surface.
A cyclic voltammogram of the "activated" Ti02 electrode, showing defined redox
couple of ferricyanide, is presented in Figure 6.18. The redox peaks appear at
approximately the same potential as they do for the Au disc electrode, however
204
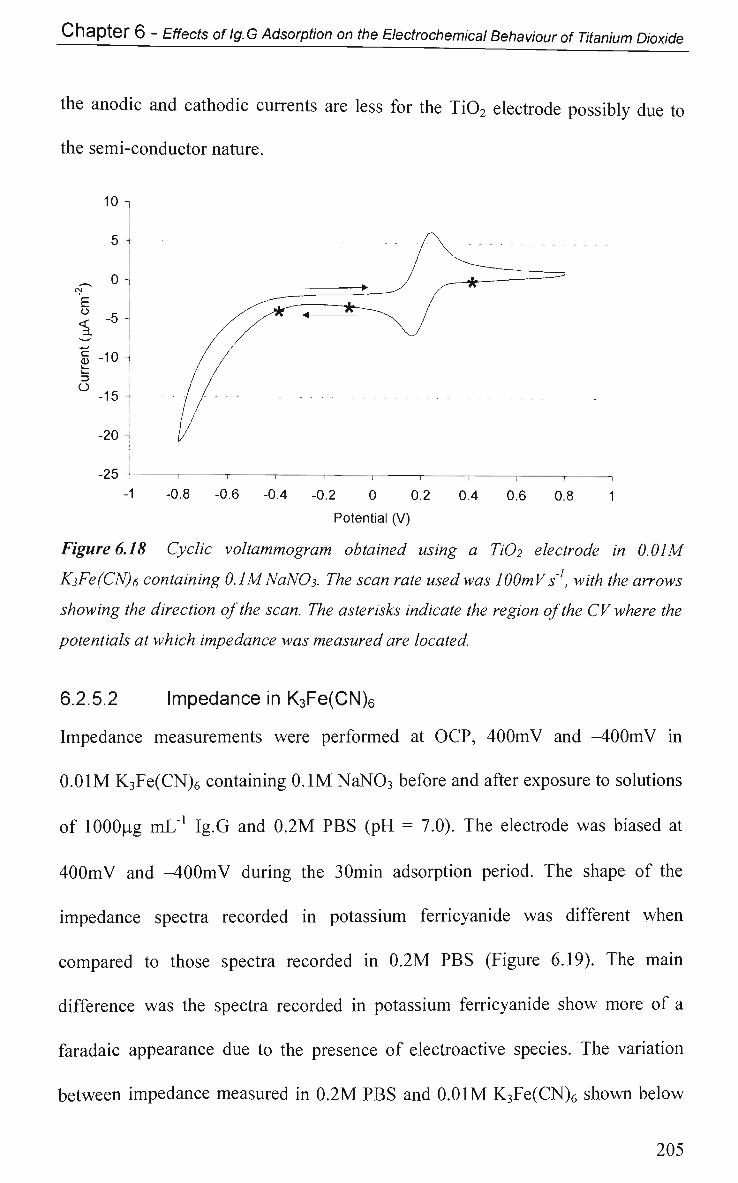
Chapter 6 - Effects of Ig.G Adsorption on the Electrochemical Behaviour of Titanium Dioxide
the anodic and cathodic currents are less for the Ti02 electrode possibly due to
the semi-conductor nature.
-25 -1 -0.8 -0.6 -0.4 -0.2 0 0.2 0.4 0.6 0.8 1
Potential (V)
Figure 6.18 Cyclic voltammogram obtained using a TiO2 electrode in 0.01M
K3Fe(CN)6 containing O.lMNaNOs. The scan rate used was lOOmVs'1, with the arrows
showing the direction of the scan. The asterisks indicate the region of the CV where the
potentials at which impedance was measured are located.
6.2.5.2 Impedance in K3Fe(CN)6
Impedance measurements were performed at O C P , 4 0 0 m V and -400m V in
0.01M K 3Fe(CN) 6 containing 0.1M N a N 0 3 before and after exposure to solutions
of lOOOug mL"1 Ig.G and 0.2M PBS (pH = 7.0). The electrode was biased at
400mV and -400mV during the 3Omin adsorption period. The shape of the
impedance spectra recorded in potassium ferricyanide was different when
compared to those spectra recorded in 0.2M P B S (Figure 6.19). The main
difference was the spectra recorded in potassium ferricyanide show more of a
faradaic appearance due to the presence of electroactive species. The variation
between impedance measured in 0.2M P B S and 0.01M K 3Fe(CN) 6 shown below
205
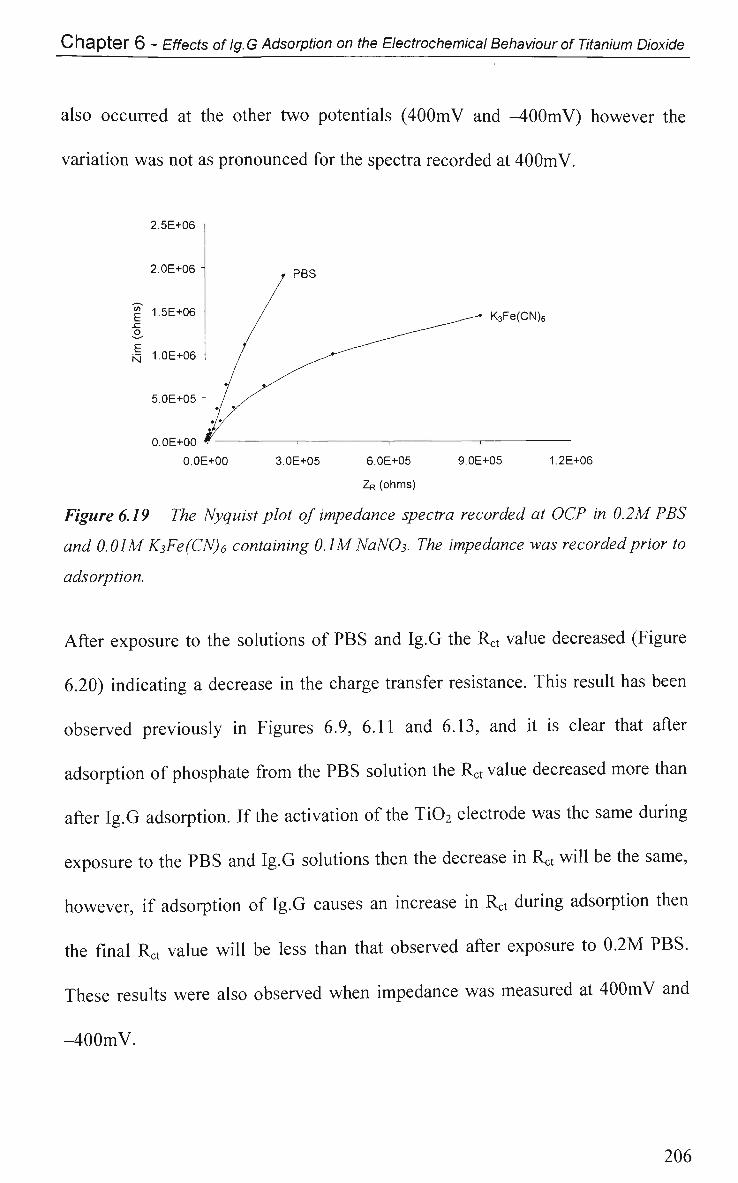
Chapter 6 - Effects of Ig.G Adsorption on the Electrochemical Behaviour of Titanium Dioxide
also occurred at the other two potentials (400mV and -400mV) however the
variation was not as pronounced for the spectra recorded at 400mV.
2.5E+06
2.0E+06
| 1.5E+06
jq 1.0E+06 -
5.0E+05
O.OE+00
1.2E+06 O.OE+00 3.0E+05 6.0E+05 9.0E+05
ZR (ohms)
Figure 6.19 The Nyquist plot of impedance spectra recorded at OCP in 0.2M PBS
and 0.01M K3Fe(CN)6 containing 0.1M NaN03. The impedance was recorded prior to
adsorption.
After exposure to the solutions of P B S and Ig.G the R* value decreased (Figure
6.20) indicating a decrease in the charge transfer resistance. This result has been
observed previously in Figures 6.9, 6.11 and 6.13, and it is clear that after
adsorption of phosphate from the PBS solution the Revalue decreased more than
after Ig.G adsorption. If the activation of the Ti02 electrode was the same during
exposure to the PBS and Ig.G solutions then the decrease in Rct will be the same,
however, if adsorption of Ig.G causes an increase in Rct during adsorption then
the final Rct value will be less than that observed after exposure to 0.2M PBS.
These results were also observed when impedance was measured at 400mV and
-400mV.
206
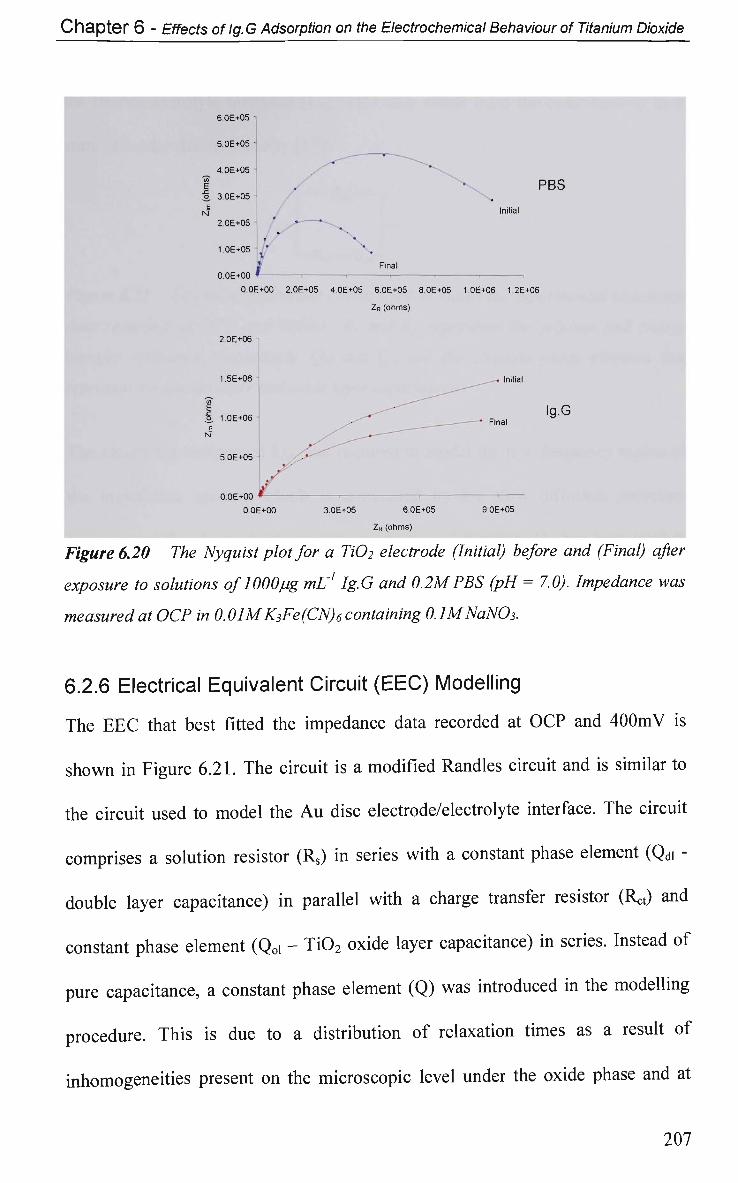
Chapter 6 - Effects oflg.G Adsorption on the Electrochemical Behaviour of Titanium Dioxide
6OE+05 -
5.0E+05 -
4.0E+05 '
o 3.0E+05
N§
2.0E+05 -
1 OE+05 "
u.Ub+UU *
O.OE+00
2.0E+06 -
1.5E+06 -
"5T E o. 1.0E+06 £ N
5.OE+05
O.OE+OO *
O.OE+00
2.0E+05 4.0E+05
^/^
30E+05
Final
1 ' 6.OE+05 8.OE+05
ZR (ohms)
6.OE+05
ZR (ohms)
\ PBS Initial
1
1.0E+06 1.2E+06
^^_—. Initial
Ig.G • Final
, 9.OE+05
Figure 6.20 The Nyquist plot for a HO2 electrode (Initial) before and (Final) after
exposure to solutions of 1000pg mL1 Ig.G and 0.2MPBS (pH = 7.0). Impedance was
measured at OCP in 0.01MK3Fe(CN)6containing 0.1MNaNO3.
6.2.6 Electrical Equivalent Circuit (EEC) Modelling
The E E C that best fitted the impedance data recorded at O C P and 4 0 0 m V is
shown in Figure 6.21. The circuit is a modified Randies circuit and is similar to
the circuit used to model the A u disc electrode/electrolyte interface. The circuit
comprises a solution resistor (Rs) in series with a constant phase element (Qdi -
double layer capacitance) in parallel with a charge transfer resistor (Rct) and
constant phase element (Qoi - Ti0 2 oxide layer capacitance) in series. Instead of
pure capacitance, a constant phase element (Q) was introduced in the modelling
procedure. This is due to a distribution of relaxation times as a result of
inhomogeneities present on the microscopic level under the oxide phase and at
207
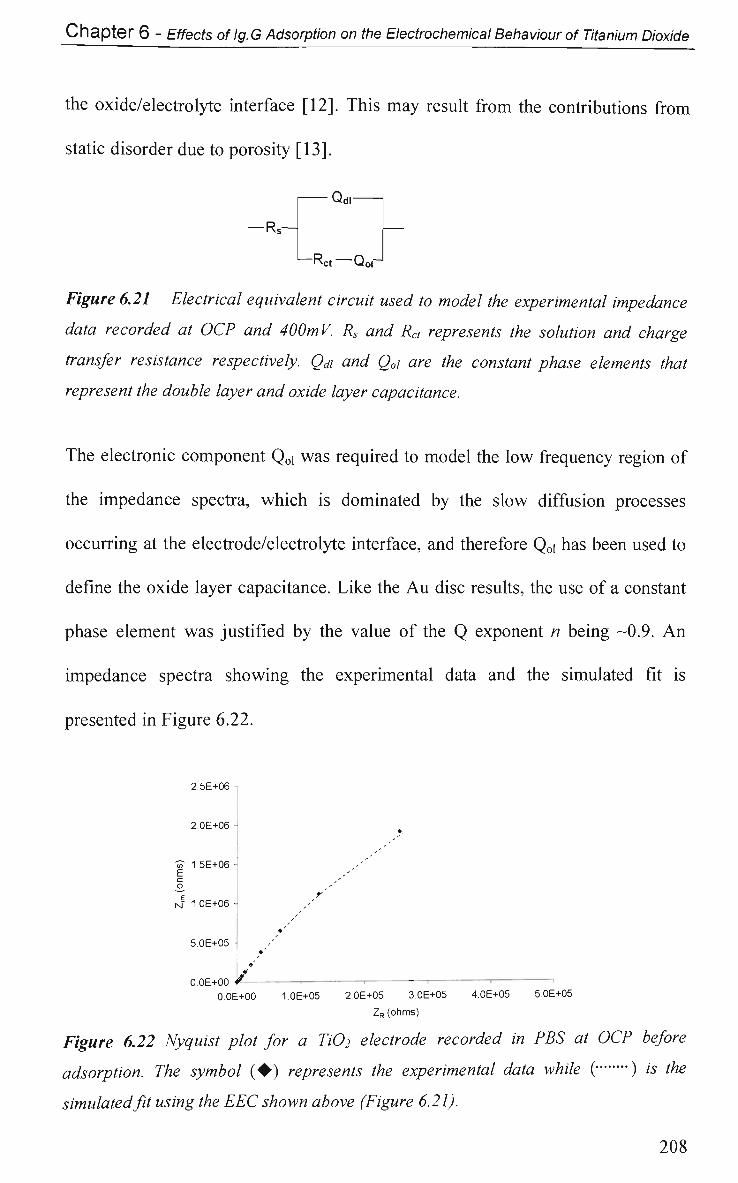
Chapter 6 - Effects of lg. G Adsorption on the Electrochemical Behaviour of Titanium Dioxide
the oxide/electrolyte interface [12]. This may result from the contributions from
static disorder due to porosity [13].
Qdi 1
—Rs— —
Rct Qoi
Figure 6.21 Electrical equivalent circuit used to model the experimental impedance
data recorded at OCP and 400mV. Rs and Rct represents the solution and charge
transfer resistance respectively. Qdi and Q0i are the constant phase elements that
represent the double layer and oxide layer capacitance.
The electronic component Q0i was required to model the low frequency region of
the impedance spectra, which is dominated by the slow diffusion processes
occurring at the electrode/electrolyte interface, and therefore Q0i has been used to
define the oxide layer capacitance. Like the Au disc results, the use of a constant
phase element was justified by the value of the Q exponent n being -0.9. An
impedance spectra showing the experimental data and the simulated fit is
presented in Figure 6.22.
2.5E+06 -
2.0E+06 - ^
•» 1.5E+06 -E
° N 10E+06 -
•'
5.0E+05 -•'
•'
0.0E+00 '/- 1 > ' ' ' ' 0.0E+00 1.OE+05 2.0E+05 3.0E+05 4.0E+05 5.0E+05
ZR (ohms)
Figure 6.22 Nyquist plot for a Ti02 electrode recorded in PBS at OCP before
adsorption. The symbol (•) represents the experimental data while ( ) is the
simulated fit using the EEC shown above (Figure 6.21).
208
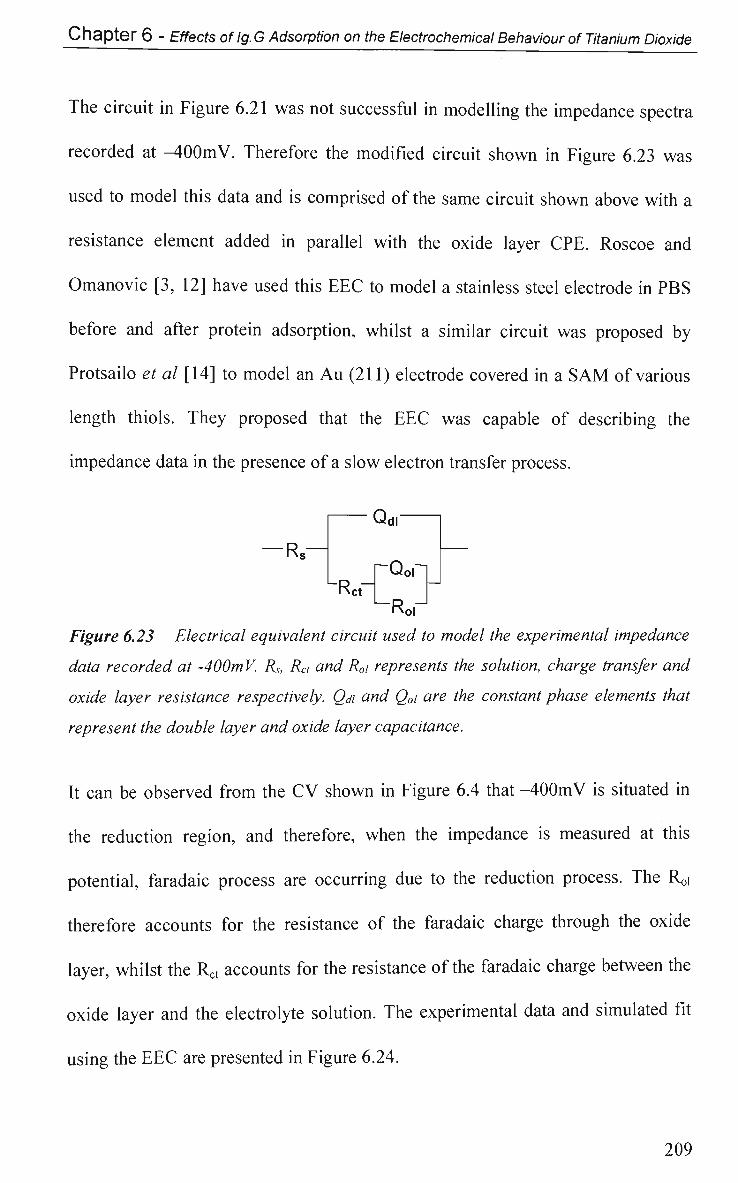
Chapter 6 - Effects of Ig.G Adsorption on the Electrochemical Behaviour of Titanium Dioxide
The circuit in Figure 6.21 was not successful in modelling the impedance spectra
recorded at -400mV. Therefore the modified circuit shown in Figure 6.23 was
used to model this data and is comprised of the same circuit shown above with a
resistance element added in parallel with the oxide layer CPE. Roscoe and
Omanovic [3, 12] have used this E E C to model a stainless steel electrode in P B S
before and after protein adsorption, whilst a similar circuit was proposed by
Protsailo et al [14] to model an A u (211) electrode covered in a S A M of various
length thiols. They proposed that the E E C was capable of describing the
impedance data in the presence of a slow electron transfer process.
FL—
Q dl
UR rQofi
ct Rof
Figure 6.23 Electrical equivalent circuit used to model the experimental impedance
data recorded at -400m V. Rs, Rct and R0i represents the solution, charge transfer and
oxide layer resistance respectively. Qdi and Q0i are the constant phase elements that
represent the double layer and oxide layer capacitance.
It can be observed from the CV shown in Figure 6.4 that -400mV is situated in
the reduction region, and therefore, when the impedance is measured at this
potential, faradaic process are occurring due to the reduction process. The Roi
therefore accounts for the resistance of the faradaic charge through the oxide
layer, whilst the Rct accounts for the resistance of the faradaic charge between the
oxide layer and the electrolyte solution. The experimental data and simulated fit
using the EEC are presented in Figure 6.24.
209
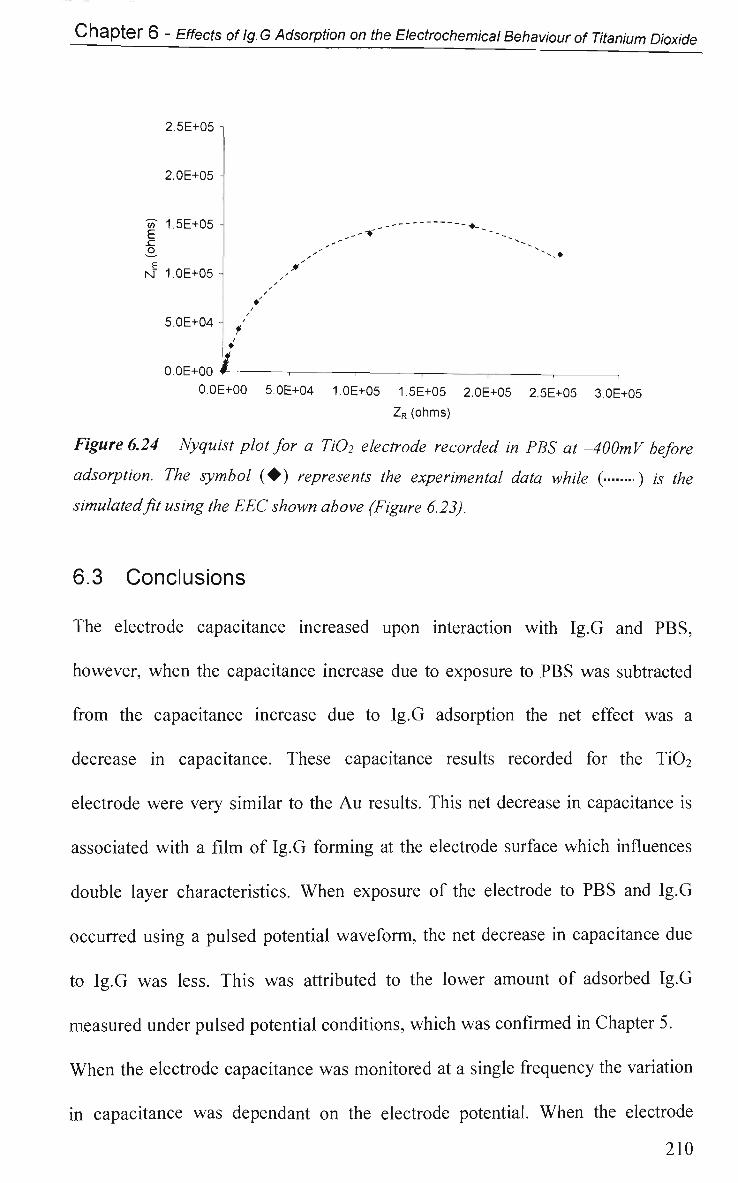
Chapter 6 - Effects of lg. G Adsorption on the Electrochemical Behaviour of Titanium Dioxide
2.5E+05 i
2. OE+05
w" 1.5E+05 E
N 1. OE+05
5.0E+04
,--*
t •
O.OE+OO I O.OE+OO 5.0E+04 1.OE+05 1.5E+05 2.0E+05 2.5E+05 3.0E+05
ZR (ohms)
Figure 6.24 Nyquist plot for a Ti02 electrode recorded in PBS at -400mV before
adsorption. The symbol (•) represents the experimental data while ( ) is the
simulated fit using the EEC shown above (Figure 6.23).
6.3 Conclusions
The electrode capacitance increased upon interaction with Ig.G and PBS,
however, when the capacitance increase due to exposure to PBS was subtracted
from the capacitance increase due to Ig.G adsorption the net effect was a
decrease in capacitance. These capacitance results recorded for the Ti02
electrode were very similar to the Au results. This net decrease in capacitance is
associated with a film of Ig.G forming at the electrode surface which influences
double layer characteristics. When exposure of the electrode to PBS and Ig.G
occurred using a pulsed potential waveform, the net decrease in capacitance due
to Ig.G was less. This was attributed to the lower amount of adsorbed Ig.G
measured under pulsed potential conditions, which was confirmed in Chapter 5.
When the electrode capacitance was monitored at a single frequency the variation
in capacitance was dependant on the electrode potential. When the electrode
210
Chapter 6 - Effects of Ig.G Adsorption on the Electrochemical Behaviour of Titanium Dioxide
potential was OCP and 400mV the capacitance increased upon adsorption, with
the adsorption of phosphate producing the greatest increase. When the effect due
to Ig.G adsorption was compared, a net decrease was observed when the
impedance and adsorption occurred at an electrode potential of OCP and 400mV.
At an electrode potential of -400mV the capacitance increased upon adsorption
of phosphate and Ig.G, with this increase being greater for Ig.G. The effect of
Ig.G adsorption, when the impedance and adsorption occurred at -400mV, was a
net increase. It was concluded that for the single frequency impedance method it
was not possible to accurately monitor the electrode capacitance at potentials
where faradaic processes occur.
Upon adsorption of Ig.G and phosphate, the charge transfer resistance decreased;
which was attributed to activation of the electrode during the adsorption stage.
When the extent of Rct decrease was compared after adsorption of Ig.G and
phosphate, it appears that the adsorption of Ig.G in fact increases the Rct, which
agrees with the work presented for the Au electrode. When impedance was
measured at OCP and adsorption occurred at an electrode potential of 400mV or
-400mV, the extent of AR^ variation was greater when the potential was
-400mV, which coincided with large changes in the Nyquist plots. These
changes in the Nyquist plots could not be explained on the basis of adsorption
and therefore it was concluded that the application of -400mV to the Ti02
electrode modified its surface to some extent.
211
Chapter 6 - Effects oflg.G Adsorption on the Electrochemical Behaviour of Titanium Dioxide
It was necessary to use two equivalent circuits to model the impedance data, one
for impedance recorded at OCP and positive potentials and another for
impedance recorded at negative potentials. The circuit used to model the OCP
and positive data was a modified Randies circuit, whilst the circuit used for
negative impedance data incorporated an extra RQ component. The RQ
component accounts for the diffusion processes occurring at the negative
potential. Like the Au electrode, for these models to provide a best fit, it was
necessary to use a CPE in the circuit, confirming the non-ideal nature of the
electrode/protein interface.
212
Chapter 6 - Effects of Ig.G Adsorption on the Electrochemical Behaviour of Titanium Dioxide
References
1. J. Sanchez and J. Augstynski, Journal of the Electrochemical Society, 103
423 (1979)
2. A. Caprani and F. Lacour, Journal of Electroanalytical Chemistry;
Biochemistry and Bioenergetics, 320 241 (1991)
3. S. Omanovic and S. G. Roscoe, Journal of Colloid and Interface Science,
227 452 (2000)
4. P. Bernabeu, L. Tamisier, A. De Cesare and A. Caprani, Electrochimica
Acta, 33 1129(1988)
5. S. Omanovic and M. Metikos-Hukovic, Thin Solid Films, 266 31 (1995)
6. F. Y. Oliva, L. B. Avalle, V. A. Macagno and C. P. De Pauli, Biophysical
Chemistry, 91 141 (2001)
7. H. O. Finklea, in Studies in Physical and Theoretical Chemistry -
Semiconductor Electrodes, Vol. 55, (ed. H. O. Finklea), Elsevier Science,
New York, (1988)
8. P. Bernabeu and A. Caprani, Biomaterials, 11 258 (1990)
9. D. W. DeBerry and A. Viehbeck, Journal of the Electochemical Society,
130 249 (1983)
10. V. E. Kazarinov, V. N. Andreev and R. Mayorov, Journal of the
Electrochemical Society, 130 277 (1981)
11. P. A. Connor and A. J. McQuillan, Langmuir, 15 2916 (1999)
12. S. Omanovic and S. G. Roscoe, Langmuir, 8315 (1999)
213
Chapter 6 - Effects oflg.G Adsorption on the Electrochemical Behaviour of Titanium Dioxide
13. M. Kramer and M. Tomkiewicz, Journal of the Electrochemical Society,
131 1283 (1984)
14. L. V. Protsailo and W. R. Fawcett, Electrochimica Acta, 45 3497 (2000)
214
Chapter 7 - ATR-IR Spectroscopic Studies oflg.G Adsorption onto Titanium Dioxide
Chapter 7
ATR-IR Spectroscopic Studies of Ig.G
Adsorption onto Titanium Dioxide
215
Chapter 7 - ATR-IR Spectroscopic Studies of Ig.G Adsorption onto Titanium Dioxide
7.1 Introduction
The study of protein layers at interfaces has previously been conducted using
various techniques such as NMR, circular dichroism, and time-resolved
fluorescence. However these techniques have some limitation and disadvantages.
Alternatively, spectra of adsorbed protein layers can accurately be obtained by using
the high sensitivity of the Fourier transform infrared (FTIR) method in combination
with attenuated total reflectance (ATR) [1].
Infrared (IR) spectroscopy of thin particle films, deposited on an attenuated total
reflection (ATR) crystal (Figure 7.1) and immersed in solution, has a high potential
for investigating the chemistry of solid-solution interfaces [2]. In principle, the
ATR-IR approach can be applied to any solid that can be formed into a particle film
and remain intact when submerged in the relevant solution. Fourier transform
attenuated total reflectance infrared (ATR-IR) spectroscopy was first developed by
Fahrenfort [3]. Shortly after Fahrenfort, Brash and Lyman [4] used ATR-IR to study
the adsorption of plasma proteins in solution to uncharged hydrophobic polymer
surfaces [5]. Work performed by research groups such as Anderson [6], Sperline
[7], Hug and Sulzberger [8], Connor, Dobson and McQuillan [9], as well as Buijs,
Norde and Lichtenbelt [1] has led to the development of ATR-IR spectroscopy as a
tool to investigate various solid-aqueous environments.
216
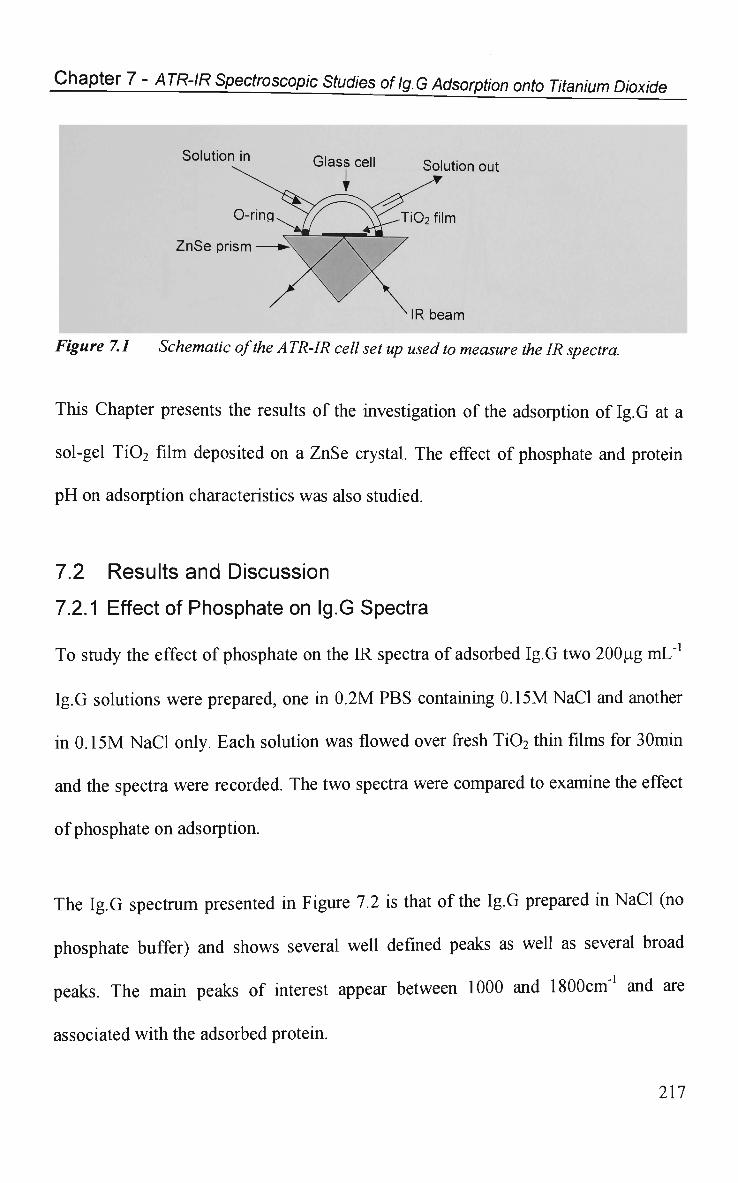
Chapter 7 - ATR-IR Spectroscopic Studies oflg.G Adsorption onto Titanium Dioxide
Solution in Glass ce|| So|utjon out
O-ring. y/ \\CTi02film
ZnSe prism
IR beam
Figure 7.1 Schematic of the A TR-IR cell set up used to measure the IR spectra.
This Chapter presents the results of the investigation of the adsorption oflg.G at a
sol-gel Ti02 film deposited on a ZnSe crystal. The effect of phosphate and protein
p H on adsorption characteristics was also studied.
7.2 Results and Discussion
7.2.1 Effect of Phosphate on Ig.G Spectra
To study the effect of phosphate on the IR spectra of adsorbed Ig.G two 200pg mL"1
Ig.G solutions were prepared, one in 0.2M PBS containing 0.15M NaCl and another
in 0.15M NaCl only. Each solution was flowed over fresh Ti02 thin films for 30min
and the spectra were recorded. The two spectra were compared to examine the effect
of phosphate on adsorption.
The Ig.G spectrum presented in Figure 7.2 is that of the Ig.G prepared in NaCl (no
phosphate buffer) and shows several well defined peaks as well as several broad
peaks. The main peaks of interest appear between 1000 and 1800cm"1 and are
associated with the adsorbed protein.
217
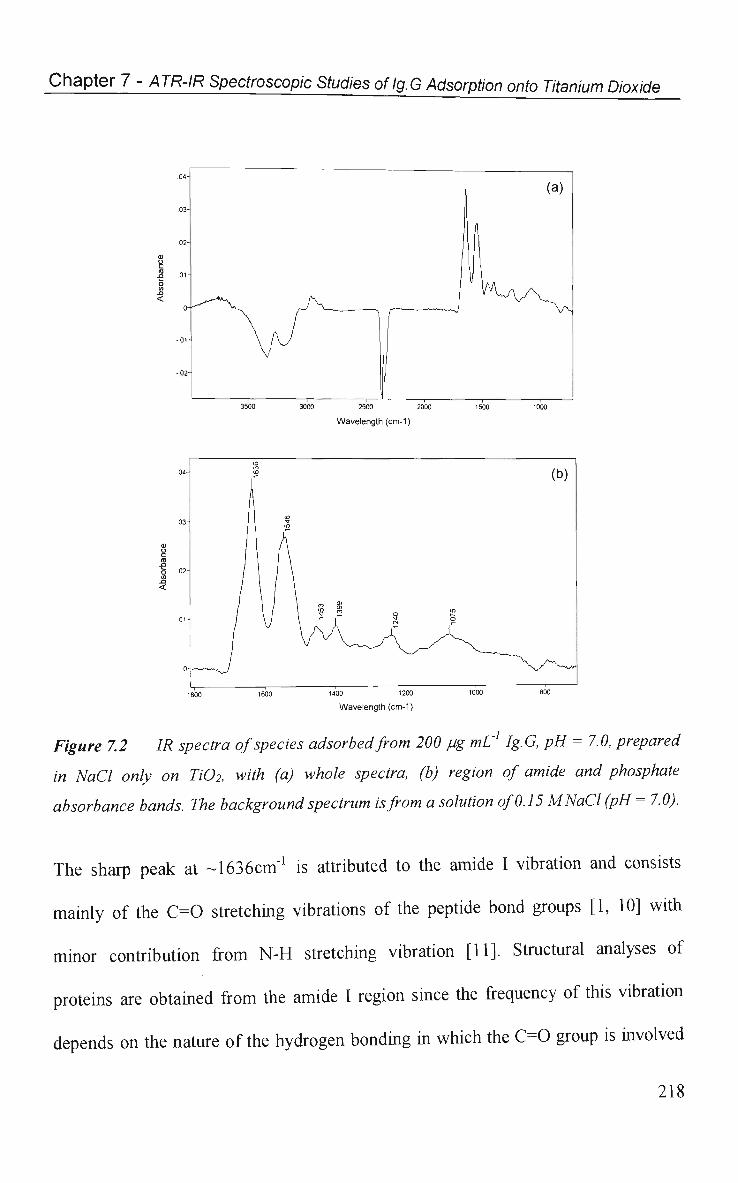
Chapter 7 - ATR-IR Spectroscopic Studies oflg.G Adsorption onto Titanium Dioxide
3000 2500 2000
Wavelength (cm-1)
1400 1200
Wavelength (cm-1)
Figure 7.2 IR spectra of species adsorbed from 200 pg mL1 Ig.G, pH = 7.0, prepared
in NaCl only on Ti02, with (a) whole spectra, (b) region of amide and phosphate
absorbance bands. The background spectrum is from a solution of 0.15 MNaCl (pH = 7.0).
The sharp peak at -1636cm"1 is attributed to the amide I vibration and consists
mainly of the C = 0 stretching vibrations of the peptide bond groups [1, 10] with
minor contribution from N - H stretching vibration [11]. Structural analyses of
proteins are obtained from the amide I region since the frequency of this vibration
depends on the nature of the hydrogen bonding in which the C = 0 group is involved
218
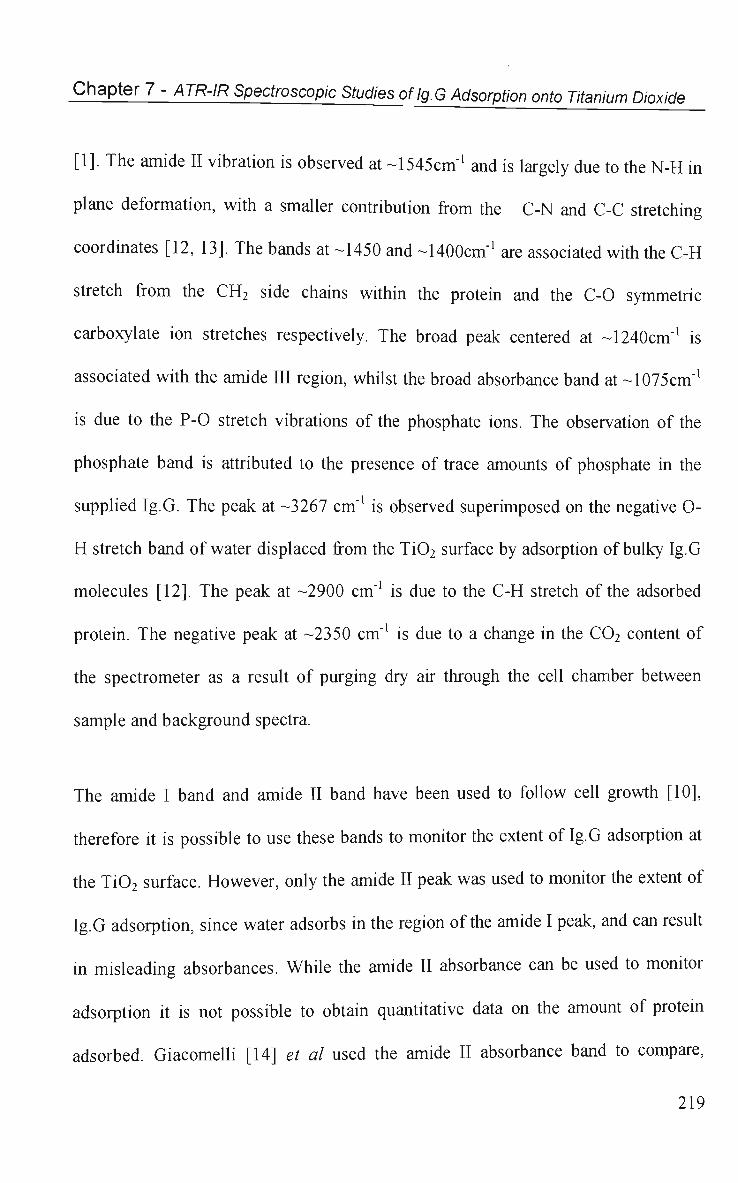
Chapter 7 - ATR-IR Spectroscopic Studies oflg.G Adsorption onto Titanium Dioxide
[1]. The amide II vibration is observed at -1545cm"1 and is largely due to the N-H in
plane deformation, with a smaller contribution from the C-N and C-C stretching
coordinates [12, 13]. The bands at -1450 and -1400cm"1 are associated with the C-H
stretch from the CH2 side chains within the protein and the C-0 symmetric
carboxylate ion stretches respectively. The broad peak centered at -1240cm"1 is
associated with the amide III region, whilst the broad absorbance band at -1075cm"1
is due to the P-0 stretch vibrations of the phosphate ions. The observation of the
phosphate band is attributed to the presence of trace amounts of phosphate in the
supplied Ig.G. The peak at -3267 cm"1 is observed superimposed on the negative O-
H stretch band of water displaced from the Ti02 surface by adsorption of bulky Ig.G
molecules [12]. The peak at -2900 cm"1 is due to the C-H stretch of the adsorbed
protein. The negative peak at -2350 cm"1 is due to a change in the C02 content of
the spectrometer as a result of purging dry air through the cell chamber between
sample and background spectra.
The amide I band and amide II band have been used to follow cell growth [10],
therefore it is possible to use these bands to monitor the extent oflg.G adsorption at
the Ti02 surface. However, only the amide II peak was used to monitor the extent of
Ig.G adsorption, since water adsorbs in the region of the amide I peak, and can result
in misleading absorbances. While the amide II absorbance can be used to monitor
adsorption it is not possible to obtain quantitative data on the amount of protein
adsorbed. Giacomelli [14] et al used the amide II absorbance band to compare,
219
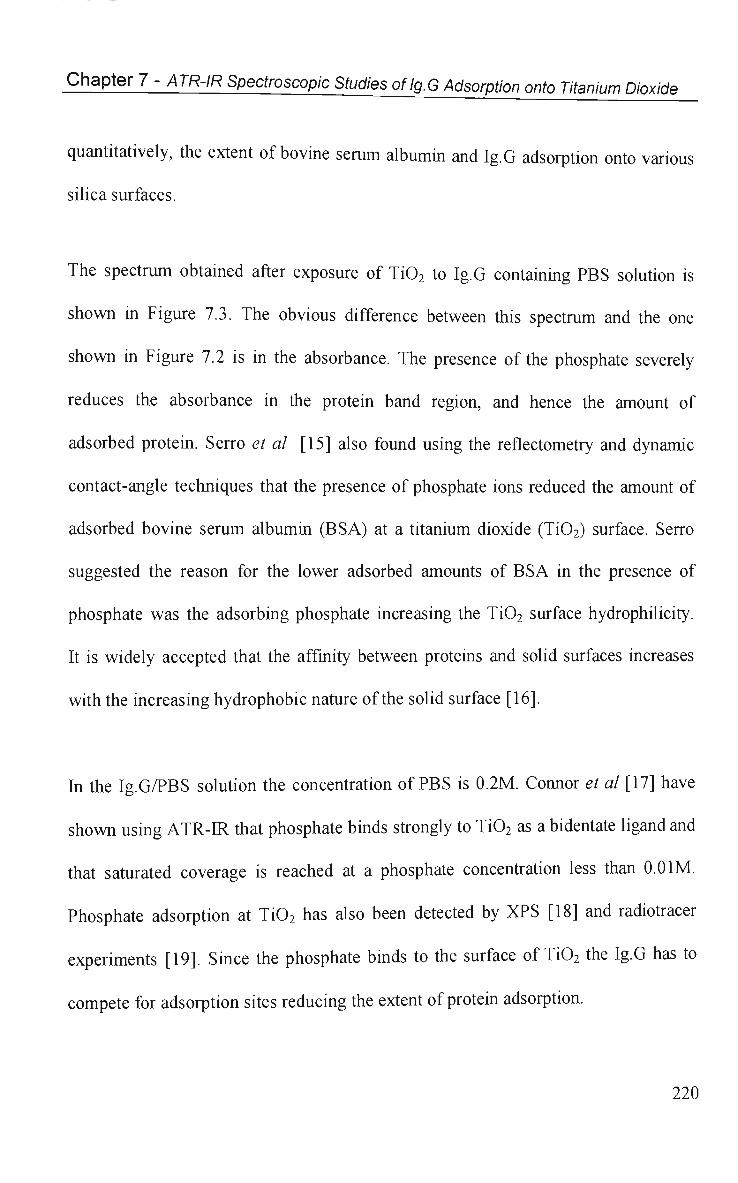
Chapter 7 - ATR-IR Spectroscopic Studies of Ig.G Adsorption onto Titanium Dioxide
quantitatively, the extent of bovine serum albumin and Ig.G adsorption onto various
silica surfaces.
The spectrum obtained after exposure of Ti02 to Ig.G containing PBS solution is
shown in Figure 7.3. The obvious difference between this spectrum and the one
shown in Figure 7.2 is in the absorbance. The presence of the phosphate severely
reduces the absorbance in the protein band region, and hence the amount of
adsorbed protein. Serro et al [15] also found using the reflectometry and dynamic
contact-angle techniques that the presence of phosphate ions reduced the amount of
adsorbed bovine serum albumin (BSA) at a titanium dioxide (Ti02) surface. Serro
suggested the reason for the lower adsorbed amounts of BSA in the presence of
phosphate was the adsorbing phosphate increasing the Ti02 surface hydrophilicity.
It is widely accepted that the affinity between proteins and solid surfaces increases
with the increasing hydrophobic nature of the solid surface [16].
In the Ig.G/PBS solution the concentration of PBS is 0.2M. Connor et al [17] have
shown using ATR-IR that phosphate binds strongly to Ti02 as a bidentate ligand and
that saturated coverage is reached at a phosphate concentration less than 0.01M.
Phosphate adsorption at Ti02 has also been detected by XPS [18] and radiotracer
experiments [19]. Since the phosphate binds to the surface of Ti02 the Ig.G has to
compete for adsorption sites reducing the extent of protein adsorption.
220
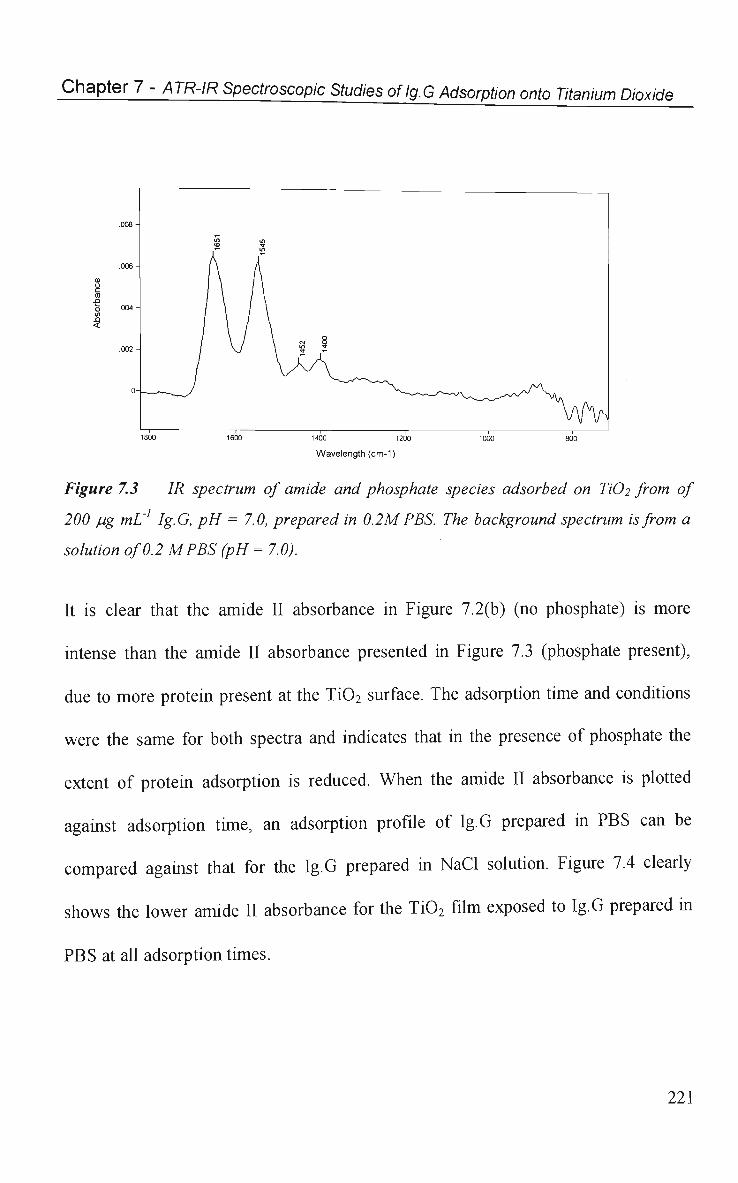
Chapter 7 - ATR-IR Spectroscopic Studies oflg.G Adsorption onto Titanium Dioxide
o 004
in
in
TT
O
Wavelength (cm-1)
Figure 7.3 IR spectrum of amide and phosphate species adsorbed on T1O2 from of
200 pg mL' Ig.G, pH = 7.0, prepared in 0.2 M PBS. The background spectrum is from a
solution of 0.2 MPBS (pH = 7.0).
It is clear that the amide II absorbance in Figure 7.2(b) (no phosphate) is more
intense than the amide II absorbance presented in Figure 7.3 (phosphate present),
due to more protein present at the Ti0 2 surface. The adsorption time and conditions
were the same for both spectra and indicates that in the presence of phosphate the
extent of protein adsorption is reduced. W h e n the amide II absorbance is plotted
against adsorption time, an adsorption profile of Ig.G prepared in P B S can be
compared against that for the Ig.G prepared in NaCl solution. Figure 7.4 clearly
shows the lower amide II absorbance for the Ti0 2 film exposed to Ig.G prepared in
P B S at all adsorption times.
221
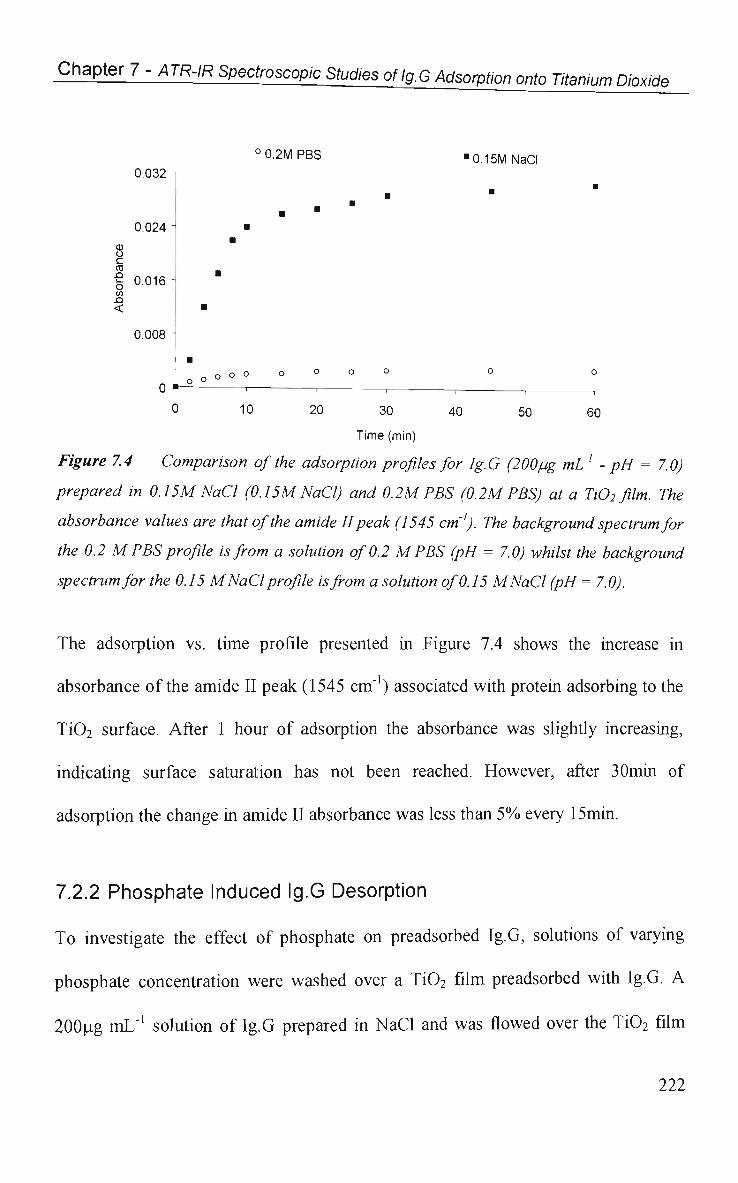
Chapter 7 - ATR-IR Spectroscopic Studies oflg.G Adsorption onto Titanium Dioxide
°0.2MPBS "O.ISMNaCI 0.032 -i
. - " 0.024 - •
• (B O
c £ 0.016^ '
to .Q < •
0.008 -•
O o o ° o o O o
0-^ r- -r- _ , ,
0 10 20 30 40 50 60
Time (min)
Figure 7.4 Comparison of the adsorption profiles for Ig.G (200pg mL1 - pH = 7.0)
prepared in 0.15M NaCl (0.15M NaCl) and 0.2M PBS (0.2M PBS) at a TiO2 film. The
absorbance values are that of the amide IIpeak (1545 cm'1). The background spectrum for
the 0.2 M PBS profile is from a solution of 0.2 M PBS (pH = 7.0) whilst the background
spectrum for the 0.15 M NaCl profile is from a solution of 0.15 MNaCl (pH = 7.0).
The adsorption vs. time profile presented in Figure 7.4 shows the increase in
absorbance of the amide II peak (1545 cm"1) associated with protein adsorbing to the
Ti02 surface. After 1 hour of adsorption the absorbance was slightly increasing,
indicating surface saturation has not been reached. However, after 30min of
adsorption the change in amide II absorbance was less than 5% every 15min.
7.2.2 Phosphate Induced Ig.G Desorption
To investigate the effect of phosphate on preadsorbed Ig.G, solutions of varying
phosphate concentration were washed over a Ti02 film preadsorbed with Ig.G. A
200ug mL"1 solution of Ig.G prepared in NaCl and was flowed over the Ti02 film
222
Chapter 7 - ATR-IR Spectroscopic Studies oflg.G Adsorption onto Titanium Dioxide
for 30min with the spectra recorded upon completion. The amide II (1545cm"1) and
the phosphate (1080cm"1) peak absorbance were recorded. After 30min adsorption
of Ig.G, the PBS solutions (0.0002M, 0.002M, 0.02M and 0.2M) were introduced
into the cell starting with the lowest concentration. Each PBS solution was flowed
through the cell and an IR spectrum was recorded after 5min flow. The 5min of
washing by each of the phosphate solutions was sufficient to establish the threshold
phosphate concentration producing significant displacement of the adsorbed protein.
After the spectra were recorded the PBS solution was changed to the higher
concentration. The change in amide II (1545cm"1) and phosphate (1080cm"1)
absorbance were recorded from each spectrum.
The phosphate absorbance band at 1080cm"1 was also monitored. The change in the
amide II and phosphate absorbance from those initially measured after preadsorption
oflg.G for 3 Omin are presented in Figure 7.5
223
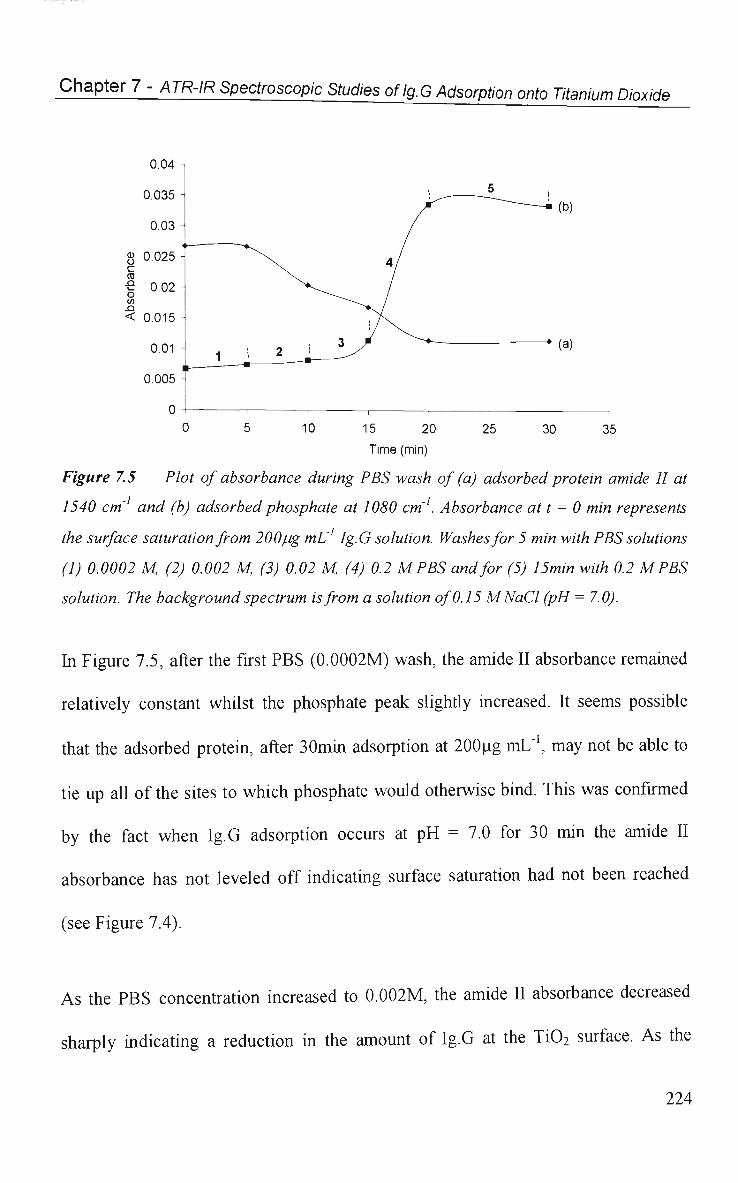
Chapter 7 - ATR-IR Spectroscopic Studies oflg.G Adsorption onto Titanium Dioxide
15 20
Time (min)
25 30 35
Figure 7.5 Plot of absorbance during PBS wash of (a) adsorbed protein amide II at
1540 cm' and (b) adsorbed phosphate at 1080 cm'1. Absorbance at t = 0 min represents
the surface saturation from 200pg mL Ig.G solution. Washes for 5 min with PBS solutions
(1) 0.0002 M, (2) 0.002 M, (3) 0.02 M, (4) 0.2 M PBS and for (5) 15min with 0.2 MPBS
solution. The background spectrum is from a solution of 0.15 MNaCl (pH = 7.0).
In Figure 7.5, after the first PBS (0.0002M) wash, the amide II absorbance remained
relatively constant whilst the phosphate peak slightly increased. It seems possible
that the adsorbed protein, after 30min adsorption at 200ug mL"1, may not be able to
tie up all of the sites to which phosphate would otherwise bind. This was confirmed
by the fact when Ig.G adsorption occurs at p H = 7.0 for 30 min the amide II
absorbance has not leveled off indicating surface saturation had not been reached
(see Figure 7.4).
As the P B S concentration increased to 0.002M, the amide II absorbance decreased
sharply indicating a reduction in the amount of Ig.G at the Ti0 2 surface. As the
224
Chapter 7 - ATR-IR Spectroscopic Studies of Ig.G Adsorption onto Titanium Dioxide
amide II peak decreased the phosphate peak increased indicative of accumulation of
phosphate ions at the Ti02 surface. Adsorption of phosphate ions at pH = 7.0, where
the Ti02 film is marginally negatively charged, has also been observed by Connor
[17] et al. The amide II absorbance continues to decrease during the third wash (#3,
0.02M - 15 min total wash time) while an increase in phosphate was observed. The
increased phosphate absorbance at #4 is probably due mainly to the increasing
solution contribution to the absorbance, since saturated coverage is expected at
phosphate concentrations in excess of 0.01M [17]. However, the amide II
absorbance decreases during wash #4 indicating displacement oflg.G by phosphate
ions, suggesting phosphate ions are accumulating at the Ti02 surface, which also
contribute to the phosphate absorbance. The phosphate absorbance at wash #5 is due
to the solution contribution since no further reduction in the amide II absorbance is
observed, suggesting no displacement of the bound Ig.G by phosphate ions. The
above result is clear evidence of protein displacement by phosphate in a substitution
type exchange at the Ti02 surface, possibly influenced by the negative charge of the
adsorbing phosphate.
The presence of amide II band after wash #5 shows that not all of the adsorbed Ig.G
is removed and suggests two types of adsorbed Ig.G, weakly and strongly bound.
This suggestion of weakly and strongly bound protein has also been proposed by
Hidalgo-Alvarez and Galisteo-Gonzalez [5] based on work performed by other
researchers [20, 21]. The exchange oflg.G with phosphate may only occur at sites
225
Chapter 7 - ATR-IR Spectroscopic Studies oflg.G Adsorption onto Titanium Dioxide
of weakly bound Ig.G while the strongly bound Ig.G remains at the Ti02 surface,
even at phosphate concentration greater than those for surface saturation.
7.2.3 pH Studies
The isoelectric (pi) point for a polyclonal Ig.G is a range of pH, namely between
p H = 6 and 8 [22]. At p H = 7 the exact charge on the Ig.G molecule is not known.
Dobson et al [23] using the STIRS technique showed that the point of zero charge
for an amorphous Ti02 film is at p H = 5.0 while for P25 it is at p H = 6.0 [24]. This
suggests that as the p H decreased from 10.0 to 4.0 the charge on the Ti02 film
becomes more positive.
Adsorption from 200ug mL"1 Ig.G/NaCl solutions (pH = 4.0 or 10.0) and subsequent
P B S wash at the same p H as used for the adsorption was investigated (Figure 7.6).
At p H = 4.0 and 10.0 the amide II absorbance after 30 min adsorption oflg.G (time
= 0 min) is less than that observed at p H = 7.0, which is attributed to lower amounts
of adsorbed protein at the Ti02 surface. At p H = 4.0 and 10.0 the Ti02 film and Ig.G
molecule posses the same charge, that being positive at p H = 4.0 and negative at p H
= 10.0. Lower amounts of adsorbed protein have been reported by other researches
when the substrate and protein possess the same charge [25-27],
Displacement of adsorbed Ig.G by adsorbed phosphate occurred when solutions of
p H 10.0 or 7.0 where used. With a solutions of p H = 4.0 little protein displacement
was observed. In the p H = 4.0, 7.0 and 10.0 profiles the absorbance of the phosphate
226
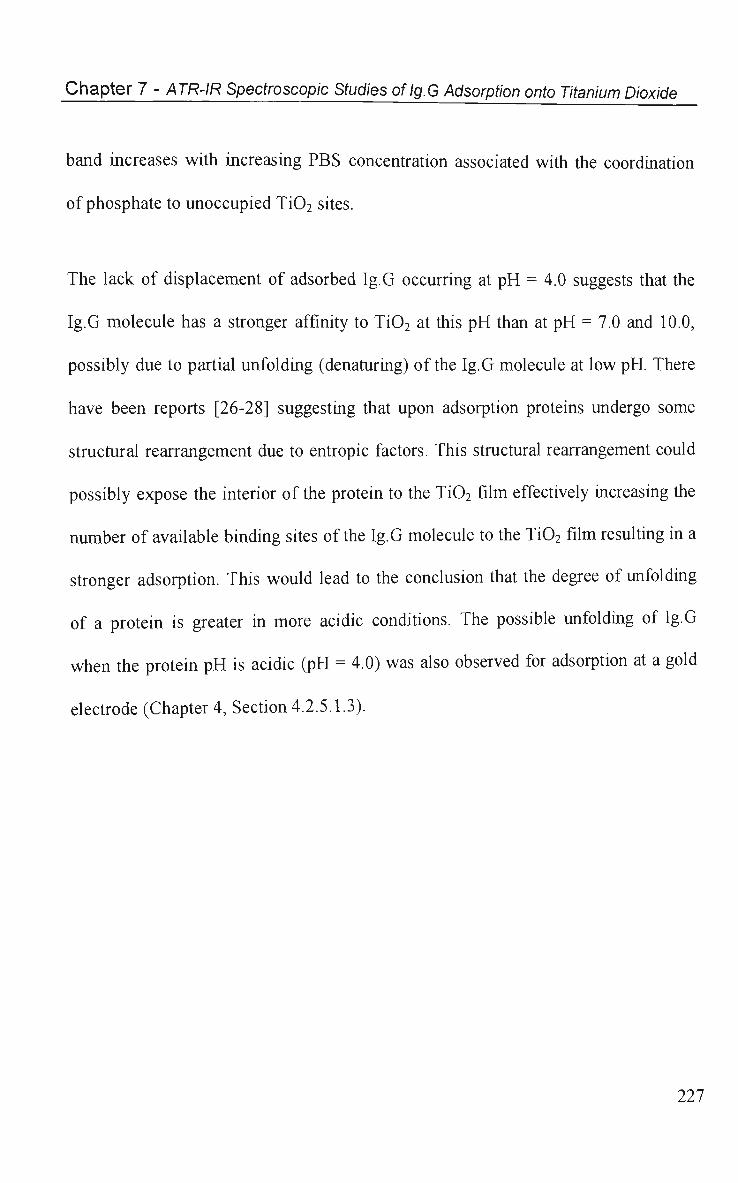
Chapter 7 - ATR-IR Spectroscopic Studies oflg.G Adsorption onto Titanium Dioxide
band increases with increasing PBS concentration associated with the coordination
of phosphate to unoccupied Ti02 sites.
The lack of displacement of adsorbed Ig.G occurring at pH = 4.0 suggests that the
Ig.G molecule has a stronger affinity to Ti02 at this pH than at pH = 7.0 and 10.0,
possibly due to partial unfolding (denaturing) of the Ig.G molecule at low pH. There
have been reports [26-28] suggesting that upon adsorption proteins undergo some
structural rearrangement due to entropic factors. This structural rearrangement could
possibly expose the interior of the protein to the Ti02 film effectively increasing the
number of available binding sites of the Ig.G molecule to the Ti02 film resulting in a
stronger adsorption. This would lead to the conclusion that the degree of unfolding
of a protein is greater in more acidic conditions. The possible unfolding of Ig.G
when the protein pH is acidic (pH = 4.0) was also observed for adsorption at a gold
electrode (Chapter 4, Section 4.2.5.1.3).
227
Chapter 7 - ATR-IR Spectroscopic Studies oflg.G Adsorption onto Titanium Dioxide
pH = 4.0 0.025
Time (min)
Figure 7.6 Plot of absorbance during PBS wash for (a) amide II and (b) phosphate at
pH = 4, 7, and 10. Absorbance at t = 0 min represents the surface saturation from 200 pg
mL1 Ig.G solution. PBS wash with (1) 0.0002M, (2) 0.002M, (3) 0.02Mand(4) 0.2M. The
background spectrum is from a solution of 0.15 M NaCl at the various pH indicated
in each graph.
228
Chapter 7 - ATR-IR Spectroscopic Studies oflg.G Adsorption onto Titanium Dioxide
7.3 Conclusions
It is clear from the results that the presence of phosphate in the Ig.G solution reduces
the extent of Ig.G adsorption at Ti02 films. The phosphate is able to displace
adsorbed Ig.G at relatively low phosphate concentrations, however, not all of the
adsorbed Ig.G can be displaced, even at high phosphate concentrations. Adsorption
kinetics showed the presence of Ig.G weakly and strongly bound to Ti02. The
displacement of adsorbed Ig.G by phosphate did not occur at pH = 4.0, possibly due
to stronger binding arising from partial structural rearrangement oflg.G at the Ti02
surface. This is the first time that ATR-IR spectroscopy has been used to monitor the
effect of phosphate on the adsorption and displacement of Ig.G on a Ti02 film at
various pH.
229
Chapter 7 - ATR-IR Spectroscopic Studies oflg.G Adsorption onto Titanium Dioxide
References
1. J. Buijs, W. Norde and J.W. Lichtenbelt, Langmuir, 12 1605 (1996)
2. A.J. McQuillan, Advanced Materials, 13 1034 (2001)
3. J. Fahrenfort, Spectrochimica Acta, 17 698 (1961)
4. J.L. Brash and D. Lyman, Journal of Biomedical Material Research, 3 175
(1969)
5. R. Hidalgo-Alvarez and F. Galisteo-Gonzalez, Heterogeneous Chemistry
Reviews, 2 249 (1995)
6. M.I. Tejedor-Tejedor and M.A. Anderson, Langmuir, 2 203 (1986)
7. R.P. Sperline, Y. Song and H. Freiser, Langmuir, 8 2183 (1992)
8. S.J. Hug and B. Sulzberger, Langmuir, 10 3587 (1994)
9. P.A. Connor, K.D. Dobson and A.J. McQuillan, Langmuir, 11 4193 (1995)
10. J. Le Gal, M. Manfait and T. Theophanides, Journal of Molecular Structure,
242 397(1991)
11. E. Goormaghtigh, V. Cabiaux and J. Ruysschaert, in Determination of
Soluble and Membrane Protein Structure by Fourier Transform Infrared
Spectrsocopy in Subcellular Biochemistry - Physicochemical Methods in the
Study of Biomemebranes, Vol. 23, (ed. H.J. Hilderson and G.B. Ralston),
Plenum Press, New York, (1994)
12. K.D. Dobson, A.D. Roddick-Lanzilotta and A.J. McQuillan, Vibrational
Spectroscopy, 24 287 (2000)
230
Chapter 7 - ATR-IR Spectroscopic Studies oflg.G Adsorption onto Titanium Dioxide
13. T. Spiro, R. Rava, P. Fodor, S. Dasgupta and R. Copeland, in Time Resolved
Vibrational Spectroscopy, Vol. 3, (ed. G. Atkinson), Gordon & Breach
Science, New York, (1987)
14. C.E. Giacomelli, M. Bremer and W. Norde, Journal of Colloid and Interface
Science, 220 13 (1999)
15. A.P. Serro, A.C. Fernandes, B.J. Saramago and W. Norde, Journal of
Biomedical Material Research, 47 376 (2000)
16. J.D. Andrade, in Surface and Interfacial Aspects of Biomedical Polymers -
Surface Chemistry and Physics, Vol. 2, (ed. J.D. Andrade), Plenum Press,
New York, (1985)
17. P.A. Connor and A.J. McQuillan, Langmuir, 15 2916 (1999)
18. J. Sanchez and J. Augstynski, Journal of the Electrochemical Society, 103
423 (1979)
19. V.E. Kazarinov, V.N. Andreev and R. Mayorov, Journal of the
Electrochemical Society, 130 277 (1981)
20. T.P. Burghardt and D. Axelrod, Biophysical Journal, 33 455 (1981)
21. J.L. Bohnert and T.A. Horbett, Journal of Colloidal Interface Science, 111
363 (1986)
22. R.G. Hamilton, in The Human Ig.G Subclasses, Vol. (ed. C. Mohan),
Calbiochem-Novabiochem Corporation Technical Notes, (1996)
23. K.D. Dobson, P.A. Connor and A.J. McQuillan, Langmuir, 13 2614 (1997)
231
Chapter 7 - ATR-IR Spectroscopic Studies oflg.G Adsorption onto Titanium Dioxide
24. C. Contescu, V.T. Popa and J.A. Schwartz, Journal of Colloid and Interface
Science, 180 149 (1996)
25. K. Nakanishi, T. Sakiyama and K. Imamura, Journal of Bioscience and
Bioengineering, 91 233 (2001)
26. M. Malmsten, Journal of Colloid and Interface Science, 207 186 (1998)
27. CA. Haynes and W. Norde, Colloids and Surfaces B: Biointerfaces, 2 517
(1994)
28. B. Lassen and M. Malmsten, Journal of Colloid and Interface Science, 180
339 (1996)
232

Chapter 8 - Conclusions and Future Work
Chapter 8
Conclusions
233
Chapter 8 - Conclusions and Future Work
Using a variety of experimental techniques it was possible to monitor the
adsorption of proteins at metal electrodes and to study the effect this had on the
electrochemical responses of the metal electrodes.
Adsorption trends were successfully studied using the iodine 125 radiolabelling
technique. These results revealed that the adsorption of proteins at metal
electrodes is not a straightforward process; rather, it is a complex system with
numerous factors combining together to affect adsorption. The results also
showed that the equilibrium between the protein in solution and the electrode
surface can easily be shifted by subtle changes in either the protein pH or the
charge on the electrode surface. The use of two proteins enabled the study of
protein size and structure to be considered with respect to adsorption, and the
results indicated that the larger the protein the greater the adsorbed mass.
Whilst the adsorption process of proteins is sensitive to changes in the system,
the desorption results indicated that once the protein had adsorbed it was resistant
to removal. The desorption results suggest that while some of the adsorbed
protein is removed there still remains bound protein even after the harshest
cleaning process was applied. These results indicate the possibility of two types
of adsorbed protein, (i) weakly and (ii) strongly bound. This hypothesis was
further strengthened from the results presented in Chapter 7. In this Chapter it
was also reported that the presence of phosphate, from the PBS, severely reduced
the extent of Ig.G adsorption. In the absence of phosphate the amount of Ig.G
adsorption was increased by a factor of 10. Not only did phosphate suppress Ig.G
Chapter 8 - Conclusions and Future Work
adsorption it was capable of removing pre-adsorbed Ig.G from a Ti02 film
simply by washing with PBS, however, phosphate was not able to remove all of
the bound Ig.G.
EIS proved to be a very powerful technique for the investigation of the effect of
adsorbed protein on the electrochemical behaviour of the metal electrodes. By
combining EIS with the CV technique it was possible to obtain a clear
understanding of the changes taking place at the electrode surface upon fouling
with adsorbed protein. Similar to the adsorption trends, the trends in the change
of electrochemical behaviour were dependent on the electrode potential and to a
lesser extent on the protein size and structure.
For both electrode material, Au and Ti02, adsorption of protein caused a decrease
in electrode capacitance and was associated with the formation of a protein layer
on the electrode surface. The extent of capacitance decrease was dependent on
the extent of adsorption (adsorbed amounts). This decrease was enhanced upon
increasing the Au electrode surface area by increasing the surface roughness.
When impedance was measured at a single frequency it was possible to monitor
the change in Cdi due to protein adsorption. However, this technique had its
limitations when the potential used to measure impedance created faradaic
processes at the electrode/electrolyte interface.
The electron transfer properties of both Au and Ti02 electrodes were affected by
the formation of the protein layer. For the Au electrode, adsorption of protein
235
Chapter 8 - Conclusions and Future Work
increased the charge transfer resistance indicating a reduction in the electron
transfer capability of the electrode surface. The behaviour of the Ti0 2 electrode
varied somewhat to that of the Au, where upon exposure to P B S and protein the
charge transfer resistance decreased. W h e n the decrease associated with
phosphate adsorption was compared to the decrease associated with Ig.G
adsorption, it appeared that the adsorption oflg.G resulted in a net increase in the
charge transfers resistance. This was attributed to activation of the Ti0 2 electrode
during adsorption.
The consequence of these findings in relation to the operation of TruScan™ are
two fold. It has been shown that adsorption of protein occurs instantaneously
when the electrode surface comes in contact with proteinaceous solutions. It was
also shown that the amount of adsorbed protein is dependant of the local
environment p H and the potential at the electrode surface is biased. Since
TruScan™ operates in an environment where local p H can vary and the system
employs the pulsing of an applied potential to the electrode surface it must be
concluded that TruScan™ does encounter biofouling during the screening of the
cervix.
The biofouling of electrode surfaces has been shown to influence the
electrochemical behaviour of the electrode in such ways that the measured
electrode capacitance decreases. The fact that capacitance is one of the main
parameters used to detect changes in the cervical tissue this finding has
consequences in the further development of the TruScan™ technology.
236
Chapter 8 - Conclusions and Future Work
It has been shown that the adsorption characteristics of two proteins vary
depending on the electrode surface composition, surface morphology, protein pH
and the electrode surface charge. The nature of protein adsorption is a dynamic
one and as a result a variety of experimental techniques is required to gain a
detailed understanding of the processes involved.
To help elucidate these processes further, future work might involve a step
backwards to investigate the adsorption of smaller simpler amino acids. The use
of other techniques such as ellipsometry, electrochemical surface enhanced
resonance Raman scattering (EC SERRS), scanning tunnelling and atomic force
microscopy (also in the electrochemical mode) (STM and AFM/ECAFM) would
complement the work presented here.
Ellipsometry may provide valuable information on the thickness of the adsorbed
protein layer, which provides additional information to the radiolabelling results.
This would enable the researcher to gain a better insight into the nature of the
adsorbed protein. EC SERRS would provide a means of being able to obtain
spectroscopic information whilst performing various electrochemical procedures
to the sample. The advantage of this technique is that it is performed in-situ and
data is acquired in real time, thus allowing spectroscopic studies of the electron
transfer reactions of proteins on electrode surfaces. This technique may provide
information on possible protein rearrangement at the electrode surface to
accommodate a change in the charge on the electrode surface.
237
Chapter 8 - Conclusions and Future Work
STM and AFM, while prone to complications due to image artefacts due to
probe-induced sample movement and image vibration, may provide a means of
performing structural studies of proteins and amino acids. Similar to EC SERRS,
the ECAFM technique may provide a means to image the protein or amino acid
and study any conformational changes due to varying the charge on the electrode
surface.
238