Embed Size (px)
Citation preview
2000 Warmwater Fish Surveyof Tanwax Lake, Pierce County
by
Stephen J. Caromileand
Chad S. Jackson
Department of Fish and WildlifeFish Program
Fish Management DivisionWarmwater Fish Enhancement Program
June 2002

Acknowledgments
We would like to thank those who helped in the field; Chad Jackson, John Pahutski, and SteveJackson. We also thank two of the regional biologist staff, Jay Hunter and Chuck Baranski, forreviewing the initial drafts of this document and providing comments.
2000 Warmwater Fish Survey of Tanwax Lake, Pierce County June 2002i
Abstract
Tanwax Lake was surveyed by a three-person crew from May 15-21, 2000. Multiple gear types(electrofishing, gill nets, and trap nets) were utilized to reduce any sampling bias associated witheach sampling method. A total of 1,387 fish, representing eight species and the family Cottidae(i.e., sculpins), were sampled from Tanwax Lake. Of those, yellow perch (Perca flavescens),rainbow trout (Oncorhynchus mykiss), and largemouth bass (Micropterus salmoides) are themost abundant, numerically, at 77.4%, 7.4% and 6.7%, respectively. Together, these threespecies accounted for 95% of the total biomass of the sample. Other species sampled during thesurvey include: black crappie (Pomoxis nigromaculatis); brown bullhead (Ameiurus nebulosus);bluegill (Lepomis macrochirus); cutthroat trout (Oncorhynchus clarki); sculpin (familyCottidae); and pumpkinseed (Lepomis gibbosus). Stock density indices indicate a balancedpredator-prey community, though sample sizes for most panfish species were low. Yellowperch, largemouth bass and black crappie will provide the most opportunity for the warmwaterangling public. Recommendations for Tanwax Lake include: 1.) An angler creel survey toestimate angler preference, effort, and harvest; and 2.) Continued fish community surveys duringboth spring and fall seasons.
2000 Warmwater Fish Survey of Tanwax Lake, Pierce County June 2002ii
Table of Contents
Abstract . . . . . . . . . . . . . . . . . . . . . . . . . . . . . . . . . . . . . . . . . . . . . . . . . . . . . . . . . . . . . . . . . . . . . i
List of Tables . . . . . . . . . . . . . . . . . . . . . . . . . . . . . . . . . . . . . . . . . . . . . . . . . . . . . . . . . . . . . . . . iv
List of Figures . . . . . . . . . . . . . . . . . . . . . . . . . . . . . . . . . . . . . . . . . . . . . . . . . . . . . . . . . . . . . . . . v
Introduction and Background . . . . . . . . . . . . . . . . . . . . . . . . . . . . . . . . . . . . . . . . . . . . . . . . . . . . 1
Materials and Methods . . . . . . . . . . . . . . . . . . . . . . . . . . . . . . . . . . . . . . . . . . . . . . . . . . . . . . . . . . 2Data Collection . . . . . . . . . . . . . . . . . . . . . . . . . . . . . . . . . . . . . . . . . . . . . . . . . . . . . . . . . 2Data Analysis . . . . . . . . . . . . . . . . . . . . . . . . . . . . . . . . . . . . . . . . . . . . . . . . . . . . . . . . . . . 3
Species Composition . . . . . . . . . . . . . . . . . . . . . . . . . . . . . . . . . . . . . . . . . . . . . . . 3Catch Per Unit of Effort . . . . . . . . . . . . . . . . . . . . . . . . . . . . . . . . . . . . . . . . . . . . . 3Length-Frequency . . . . . . . . . . . . . . . . . . . . . . . . . . . . . . . . . . . . . . . . . . . . . . . . . 3Stock Density Indices . . . . . . . . . . . . . . . . . . . . . . . . . . . . . . . . . . . . . . . . . . . . . . 4Relative Weight . . . . . . . . . . . . . . . . . . . . . . . . . . . . . . . . . . . . . . . . . . . . . . . . . . . 4Age and Growth . . . . . . . . . . . . . . . . . . . . . . . . . . . . . . . . . . . . . . . . . . . . . . . . . . . 4
Results and Discussion . . . . . . . . . . . . . . . . . . . . . . . . . . . . . . . . . . . . . . . . . . . . . . . . . . . . . . . . . 5Water Quality and Habitat . . . . . . . . . . . . . . . . . . . . . . . . . . . . . . . . . . . . . . . . . . . . . . . . . 5Species Composition and Relative Abundance . . . . . . . . . . . . . . . . . . . . . . . . . . . . . . . . . 5Summary by Species . . . . . . . . . . . . . . . . . . . . . . . . . . . . . . . . . . . . . . . . . . . . . . . . . . . . . 7
Micropterus salmoides, largemouth bass . . . . . . . . . . . . . . . . . . . . . . . . . . . . . . . . 7Perca flavescens, yellow perch . . . . . . . . . . . . . . . . . . . . . . . . . . . . . . . . . . . . . . . 9Onchorynchus mykiss, rainbow trout . . . . . . . . . . . . . . . . . . . . . . . . . . . . . . . . . 11Pomoxis nigromaculatus, black crappie . . . . . . . . . . . . . . . . . . . . . . . . . . . . . . . 11Ameiurus nebulosus, brown bullhead . . . . . . . . . . . . . . . . . . . . . . . . . . . . . . . . . 12Lepomis macrochirus, bluegill . . . . . . . . . . . . . . . . . . . . . . . . . . . . . . . . . . . . . . 12Onchorynchus clarki, cutthroat trout . . . . . . . . . . . . . . . . . . . . . . . . . . . . . . . . . . 14Cottidae, unidentified sculpin . . . . . . . . . . . . . . . . . . . . . . . . . . . . . . . . . . . . . . . 14Lepomis gibbosus, pumpkinseed . . . . . . . . . . . . . . . . . . . . . . . . . . . . . . . . . . . . . 14
Discussion and Management Options . . . . . . . . . . . . . . . . . . . . . . . . . . . . . . . . . . . . . . . . . . . . . 15
Literature Cited . . . . . . . . . . . . . . . . . . . . . . . . . . . . . . . . . . . . . . . . . . . . . . . . . . . . . . . . . . . . . . 17
Appendix A . . . . . . . . . . . . . . . . . . . . . . . . . . . . . . . . . . . . . . . . . . . . . . . . . . . . . . . . . . . . . . . . . 19

2000 Warmwater Fish Survey of Tanwax Lake, Pierce County June 2002iii
List of Tables
Table 1. Water chemistry parameters collected from Tanwax Lake, fall 2000 . . . . . . . . . . . . . 5
Table 2. Species composition by weight (kg), and number of fish captured at Tanwax Lake(Pierce County) during May 2000 . . . . . . . . . . . . . . . . . . . . . . . . . . . . . . . . . . . . . . . . 6
Table 3. Catch-per-unit-of-effort (# fish/hour for electrofishing and # fish/net night) for theMay 2000 warmwater fish sample at Tanwax Lake, Pierce County . . . . . . . . . . . . . . 6
Table 4. Stock density indices by gear type and species, accompanied by an 80% confidenceinterval, for fish sampled during the May 2000 warmwater fish survey at TanwaxLake, Pierce County . . . . . . . . . . . . . . . . . . . . . . . . . . . . . . . . . . . . . . . . . . . . . . . . . . . 7
Table 5. Back calculated length at age (Fraser-Lee) for largemouth bass during the fall 2000survey of Tanwax Lake . . . . . . . . . . . . . . . . . . . . . . . . . . . . . . . . . . . . . . . . . . . . . . . . 9
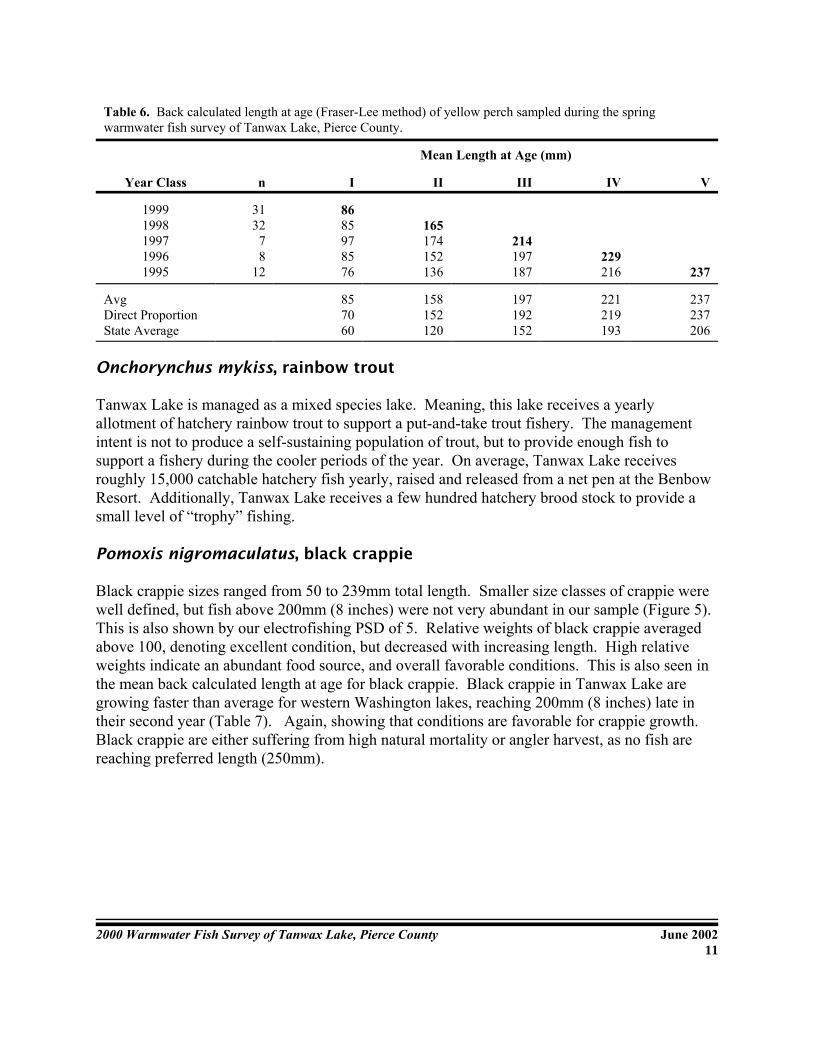
Table 6. Back calculated length at age (Fraser-Lee method) of yellow perch sampled during the spring warmwater fish survey of Tanwax Lake, Pierce County . . . . . . . 11
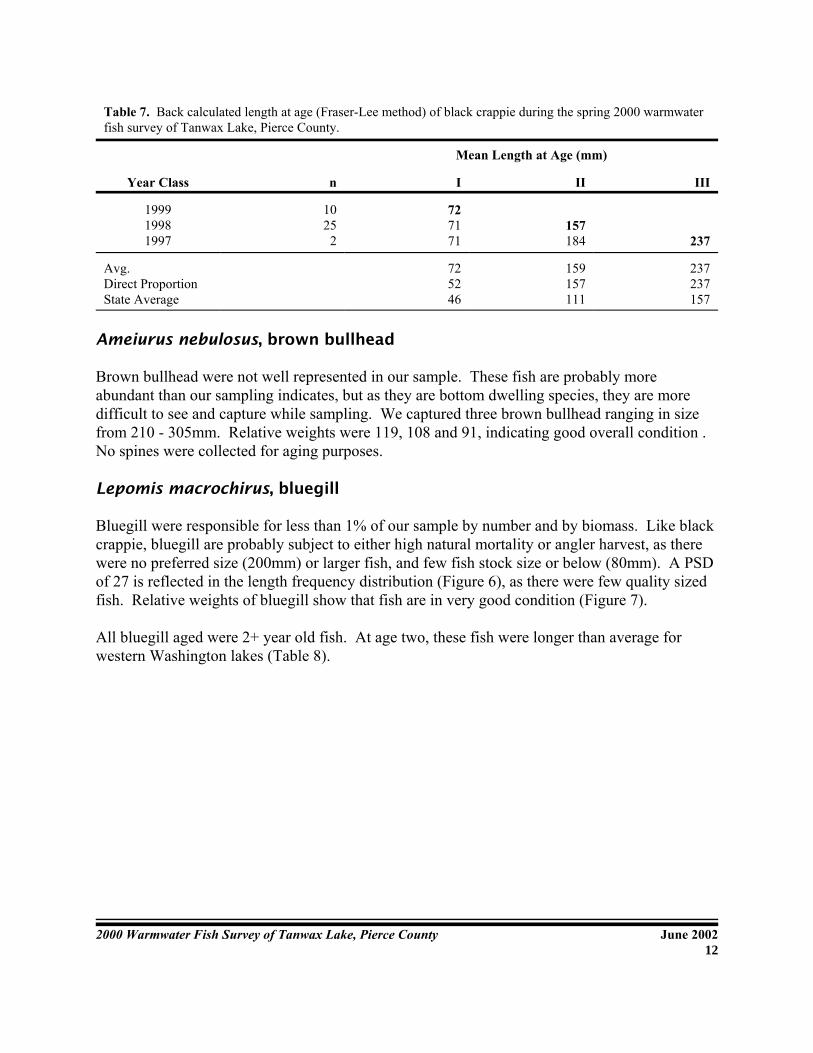
Table 7. Back calculated length at age (Fraser-Lee method) of black crappie during the spring 2000 warmwater fish survey of Tanwax Lake, Pierce County . . . . . . . . . . . . 12
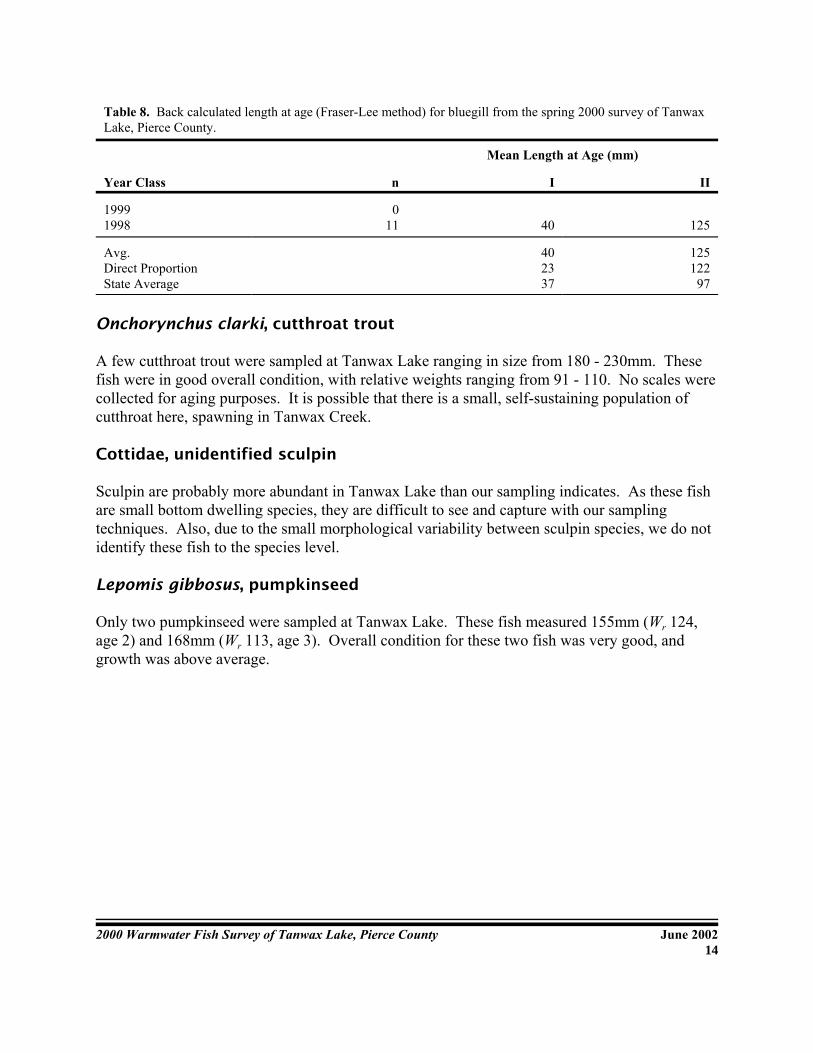
Table 8. Back calculated length at age (Fraser-Lee method) for bluegill from the spring 2000 survey of Tanwax Lake, Pierce County . . . . . . . . . . . . . . . . . . . . . . . . . . . . . . 14
2000 Warmwater Fish Survey of Tanwax Lake, Pierce County June 2002iv
List of Figures
Figure 1. Length frequency distribution of largemouth bass sampled from Tanwax Lake, fall2000 . . . . . . . . . . . . . . . . . . . . . . . . . . . . . . . . . . . . . . . . . . . . . . . . . . . . . . . . . . . . . . . 8
Figure 2. Relative weight distribution of largemouth bass sampled from Tanwax Lake during the fall of 2000 . . . . . . . . . . . . . . . . . . . . . . . . . . . . . . . . . . . . . . . . . . . . . . . . . 8
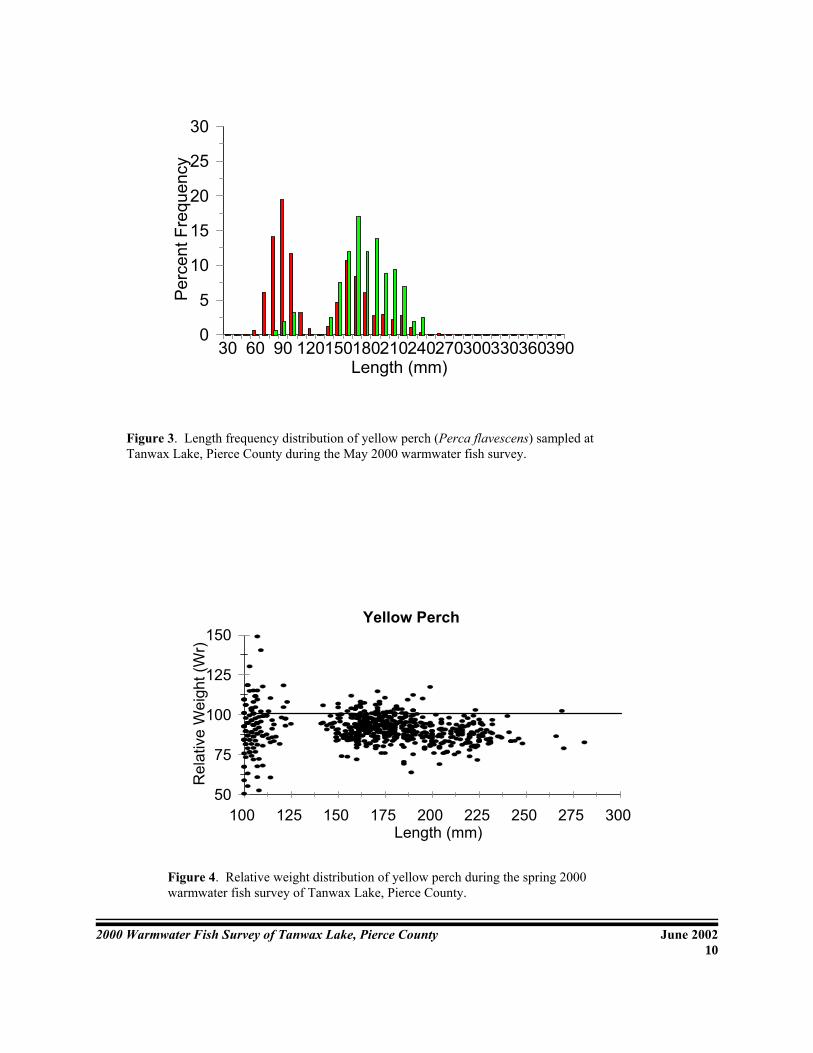
Figure 3. Length frequency distribution of yellow perch (Perca flavescens) sampled at Tanwax Lake, Pierce County during the May 2000 warmwater fish survey . . . . . . 10
Figure 4. Relative weight distribution of yellow perch during the spring 2000 warmwater fish survey of Tanwax Lake, Pierce County . . . . . . . . . . . . . . . . . . . . . . . . . . . . . . . 10
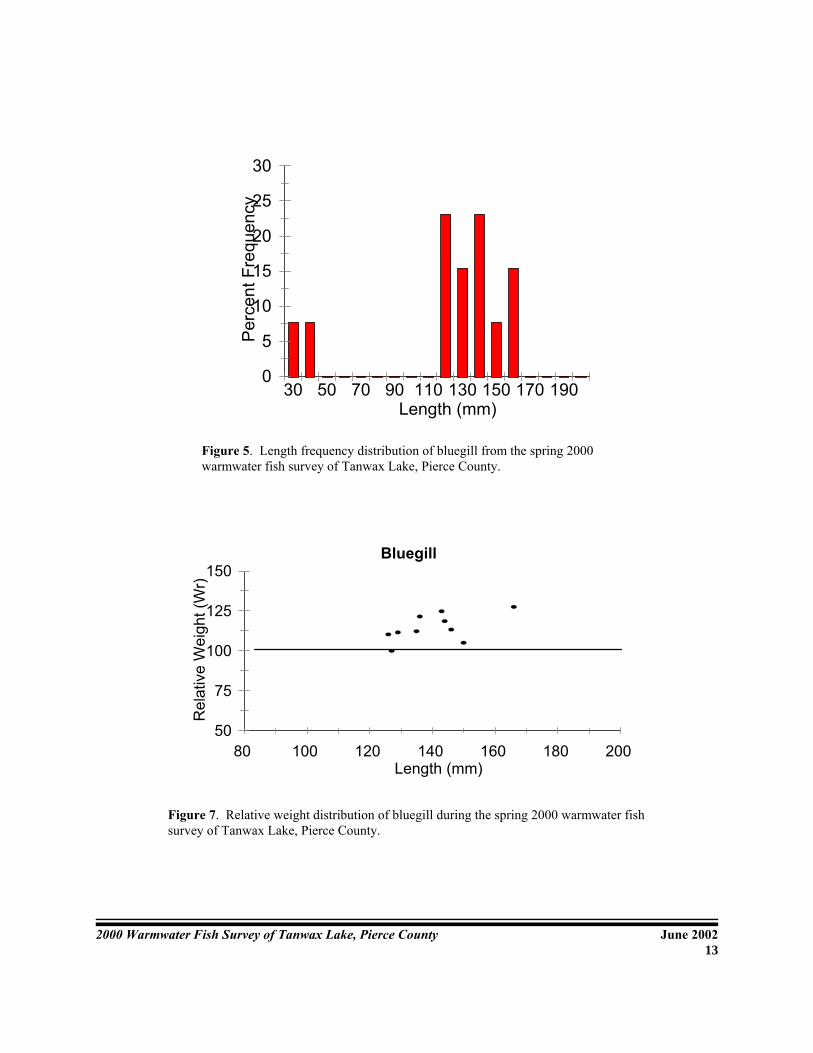
Figure 5. Length frequency distribution of bluegill from the spring 2000 warmwater fish survey of Tanwax Lake, Pierce County . . . . . . . . . . . . . . . . . . . . . . . . . . . . . . . . . . . 13
Figure 6. Relative weight distribution of bluegill during the spring 2000 warmwater fish survey of Tanwax Lake, Pierce County . . . . . . . . . . . . . . . . . . . . . . . . . . . . . . . . . . . 13
2000 Warmwater Fish Survey of Tanwax Lake, Pierce County June 20021
Introduction and Background
Tanwax Lake is a small lake, approximately170 acres in area, with a maximum depth ofapproximately 9 m (30 ft). Tanwax Lake is fed and drained by Tanwax Creek, eventuallydraining into the Puyallup River. The lake has a resort at either end and is surrounded by houses. There has been an Agency owned access area at the south end since 1948.
Tanwax Lake has been managed as a mixed species lake since the early 1930's, with moremanagement emphasis on trout. Largemouth bass were first stocked into Tanwax Lake by theWashington Department of Game in August,1936. A total of 1,700 largemouth bass, 50-75mm(2-3 inch) in length were taken from the Columbia River sloughs near Vancouver, WA, andtransferred to Tanwax Lake. Two years later, in October, 1939, 300 bass at 75-100mm (3-4 in)were planted. Those were the only two recorded introductions of warmwater fish into TanwaxLake by a State agency. Since that time, rainbow trout have been stocked yearly to support aput-and-take fishery. Currently, 15,000 rainbow trout fingerlings are raised in a net pen at thelake, and released prior to opening day. Records show that the lake was rehabilitated withrotenone on September 29, 1954.
In order to generate greater interest in fishing, many lakes, including Tanwax Lake, were onceagain put on an opening day schedule. The lake is now closed to all fishing between October31st and the last Saturday in April.
2000 Warmwater Fish Survey of Tanwax Lake, Pierce County June 20022
Materials and Methods
Data Collection
Tanwax Lake was surveyed by a three-person team during May15-21, 2000. Fish were capturedusing three sampling techniques: electrofishing, gill netting, and fyke netting. The electrofishingunit consisted of a Smith-Root SR-16s electrofishing boat, with a 5.0GPP pulsator unit. Theboat was fished using a pulsed DC current of 60 Hz at 4-6 amps power. Experimental gill nets,45.7 meters (m) long x 2.4 m deep, were constructed of four sinking panels (two each at 7.6 mand 15.2 m long) of variable-size (1.3, 1.9, 2.5, and 5.1 cm stretch) monofilament mesh. Fyke(modified hoop) nets were constructed of five 1.2 m diameter hoops with two funnels, and a 2.4m cod end (6 mm nylon delta mesh). Attached to the mouth of the net were two 7.6 m wings, anda 30.5 m lead.
In order to reduce the gear induced bias in the data, the sampling time for each gear wasstandardized so that the ratio of electrofishing to gill netting to fyke netting was 1:1:1. Thestandardized sample is 1800 sec of electrofishing (3 sections), 2 gill net nights, and 2 fyke netnights. Sampling occurred during the evening hours to maximize the type and number of fishcaptured. Sampling locations were selected from a map by dividing the entire shoreline into 400m sections, and numbering them consecutively. Nightly sampling locations were randomlychosen without replication. While electrofishing, the boat was maneuvered through the shallowsat a slow rate of speed for a total of 600 seconds of “pedal-down” time or until the end of thesection was reached, whichever came first. Nighttime electrofishing occurred along nearly100% of the available shoreline. Gill nets were fished perpendicular to the shoreline; the small-mesh end was tied off to shore, and the large- mesh end was anchored off shore. Fyke nets werefished perpendicular to the shoreline as well with the lead tied off to shore, the cod-end anchored away from shore, and the wings anchored at approximately a 45E angle from the netlead. We tried to set fyke nets so that the hoops were 0.3 - 0.5 m below the water surface, thissometimes would require shortening the lead. Gill nets and fyke nets were both set overnight(roughly 12 hours per set) at two locations around the lake.
With the exception of the family Cottidae (sculpin), all fish captured were identified to thespecies level. Each fish was measured to the nearest millimeter (mm) and assigned to a 10 mmsize class based on total length (TL). For example, a fish measuring 156 mm TL was assigned tothe 150 mm size class for that species, and a fish measuring 113 mm TL was assigned to the 110mm size class, and so on. However, if a sample included several hundred young-of-year (YOY)or small juveniles (<100 mm TL) of a given species, then a sub-sample (N ~100 fish) weremeasured, and the remainder were just counted. The frequency distribution of the sub-samplewas then applied to the total number collected. Scales were taken from five individuals per size
2000 Warmwater Fish Survey of Tanwax Lake, Pierce County June 20023
class, mounted, pressed, and aged using the Fraser-Lee method. Very few scale or spine samplesare taken from non-game fish for aging purposes.
Water quality data was collected during midday from the deepest part of the lake on May 15,2000. Using a Hydrolab® probe and digital recorder, dissolved oxygen (mg/l), temperature (CE),pH, turbidity (NTU), and conductivity (F siemens/cm) data was gathered in the deepest sectionof the lake at 1 m intervals through the water column. Secchi disk readings, used to measuretransparency, were taken by the methods outlined by Wetzel (1983).
Data Analysis
Species Composition
The species composition by number of fish captured, was determined using procedures outlinedby Fletcher et al.(1993). Species composition by weight (kg) of fish captured, was determinedusing procedures adapted from Swingle (1950). Only fish estimated to be at least one year oldwere used to determine species composition. These were inferred from the length-frequencydistributions described below, in conjunction with the results of the aging process. Young ofyear or small juveniles were not considered in biomass and species composition estimatesbecause large fluctuations in their numbers may cause distorted results (Fletcher et al. 1993). Also, most of these fish would be subject to natural attrition during their first winter, resulting ina different size distribution by the following year.
Catch Per Unit of Effort
The catch per unit of effort (CPUE) of electrofishing for each species was determined bydividing the total number in all size classes equal or greater than stock size (defined in AppendixA), by the total electrofishing time (seconds). The CPUE for gill nets and fyke nets wasdetermined similarly, except the number equal or greater than stock size was divided by thenumber of net-nights for each net (usually one). An average CPUE (across sample sections)with 80% confidence interval was calculated for each species and gear type.
For fishes in which there is no published stock size (i.e., sculpins, suckers, etc.), CPUE iscalculated using all individuals captured. Furthermore, since it is standardized, the CPUE isuseful for comparing stocks between lakes.
Length-Frequency
A length-frequency histogram was calculated for each species and gear type in the sample. Length-frequency histograms are constructed using individuals that are age one and older(determined by the aging process), and calculated as the number of individuals of a species in agiven size class, divided by the total individuals of that species sampled. Plotting the histogram
2000 Warmwater Fish Survey of Tanwax Lake, Pierce County June 20024
this way tends to flatten out large peaks created by an abundant size class, and makes the graph alittle easier to read.
Stock Density Indices
Stock density indices, used to assess the size structure of fish populations. Proportional stockdensity (PSD and relative stock density RSD) are calculated as proportions of various size-classes of fish in a sample. The size classes are referred to as minimum stock (S), quality (Q),preferred (P), memorable (M), and trophy (T). Lengths have been published to represent thesesize classes for each species, and were developed to represent a percentage of world-recordlengths as listed by the International Game Fish Association (Gablehouse 1984). These lengthsare presented in Appendix A.
The indices calculated here are described by Gablehouse (1984) as the traditional approach. Theindices are accompanied by a 80% confidence interval (Gustafson 1988) to provide an estimateof statistical precision.
Relative Weight
A relative weight index (Wr) was used to evaluate the condition (plumpness or robustness) offish in the lake. A Wr value of 1.0 generally indicates a fish in good condition when compared tothe national average for that species and size. Furthermore, relative weights are useful forcomparing the condition of different size groups within a single population to determine if allsizes are finding adequate forage or food (ODFW 1997). Following Murphy and Willis (1991),the index was calculated as Wr = W/Ws x 100, where W is the weight (g) for an individual fishfrom the sample and Ws is the standard weight of a fish of the same total length (mm). Ws iscalculated from a standard log weight - log length relationship defined for the species of interest. The parameters for the Ws equations of many fish species, including the minimum lengthrecommendations for their application, are listed in Anderson and Neumann (1996).
Age and Growth
Age and growth of warmwater fishes were evaluated according to Fletcher et al. (1993). Totallength at annulus formation, Ln, was back-calculated using the Fraser-Lee method. Intercepts forthe y axis for each species were taken from Carlander (1982). Mean back-calculated lengths ateach age for each species were presented in tabular form for easy comparison between yearclasses. Mean back-calculated lengths at each age for each species were compared to averagescalculated from scale samples gathered at lakes sampled by the warmwater enhancement teams.
2000 Warmwater Fish Survey of Tanwax Lake, Pierce County June 20025
Results and Discussion
Water Quality and Habitat
Water quality parameters were collected in the deepest section of Tanwax Lake on May 15,2000. Dissolved oxygen levels (Table 1) drop off below 4 meters to levels barely suitable forwarmwater fish and not suitable for trout. Temperature declines steadily with increasing depth,but the lake is not stratified thermally.
Tanwax Lake lies in the Nisqually River drainage basin. The lake is fed by the outflow ofBenbow Lake, and water exits through Tanwax Creek.
Table 1. Water chemistry parameters collected from Tanwax Lake, fall 2000.
Depth (m) Temp (C) pH 02 mg/l Turbidity NTU Conductivity Fsiemens/cm
0123456
6.8
18.3617.7514.1013.5612.8710.90
9.639.32
7.237.297.146.906.656.326.095.97
10.1810.08
9.738.447.523.322.021.37
48.633.431.628.029.328.928.028.2
64.063.762.862.763.764.866.267.5
Species Composition and Relative Abundance
A total of nine fish species were encountered while sampling Tanwax Lake (Table 2):largemouth bass (Micropterus salmoides), yellow perch (Perca flavescens), rainbow trout(Onchorynchus mykiss), black crappie (Pomoxis nigromaculatus), brown bullhead (Ameiurusnebulosus), bluegill (Lepomis macrochirus), cutthroat trout (O. clarki), sculpin (familyCottidae), and pumpkinseed (L. gibbosus). Of those, yellow perch and stocked rainbow troutwere most abundant numerically at 77.4% and 7.4% respectively. Largemouth bass and stockedrainbow trout represented 42.5% and 39.9% of the total biomass, respectively.
2000 Warmwater Fish Survey of Tanwax Lake, Pierce County June 20026
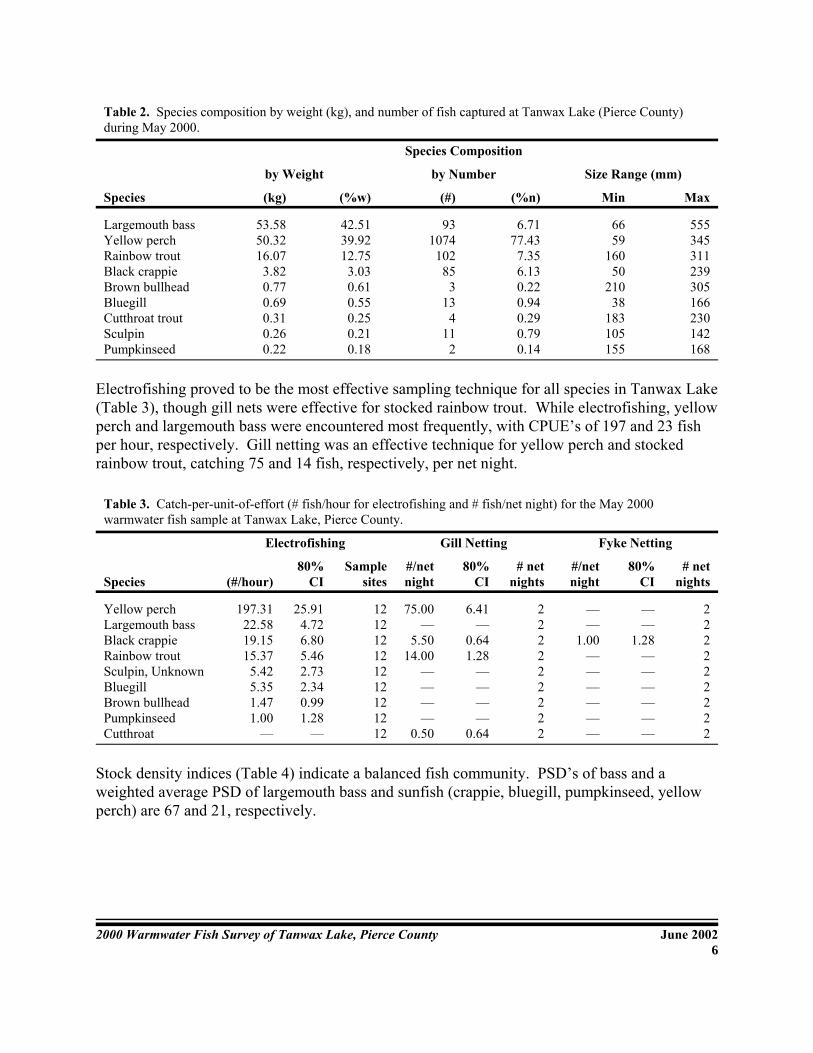
Table 2. Species composition by weight (kg), and number of fish captured at Tanwax Lake (Pierce County)during May 2000.
Species Composition
by Weight by Number Size Range (mm)
Species (kg) (%w) (#) (%n) Min Max
Largemouth bassYellow perchRainbow troutBlack crappieBrown bullheadBluegillCutthroat troutSculpinPumpkinseed
53.5850.3216.07
3.820.770.690.310.260.22
42.5139.9212.75
3.030.610.550.250.210.18
931074
10285
313
411
2
6.7177.43
7.356.130.220.940.290.790.14
6659
16050
21038
183105155
555345311239305166230142168
Electrofishing proved to be the most effective sampling technique for all species in Tanwax Lake(Table 3), though gill nets were effective for stocked rainbow trout. While electrofishing, yellowperch and largemouth bass were encountered most frequently, with CPUE’s of 197 and 23 fishper hour, respectively. Gill netting was an effective technique for yellow perch and stockedrainbow trout, catching 75 and 14 fish, respectively, per net night.
Table 3. Catch-per-unit-of-effort (# fish/hour for electrofishing and # fish/net night) for the May 2000warmwater fish sample at Tanwax Lake, Pierce County.
Electrofishing Gill Netting Fyke Netting
Species (#/hour)80%
CISample
sites#/netnight
80%CI
# netnights
#/netnight
80%CI
# netnights
Yellow perchLargemouth bassBlack crappieRainbow troutSculpin, UnknownBluegillBrown bullheadPumpkinseedCutthroat
197.3122.5819.1515.37
5.425.351.471.00
—
25.914.726.805.462.732.340.991.28
—
121212121212121212
75.00—
5.5014.00
————
0.50
6.41—
0.641.28
————
0.64
222222222
——
1.00——————
——
1.28——————
222222222
Stock density indices (Table 4) indicate a balanced fish community. PSD’s of bass and aweighted average PSD of largemouth bass and sunfish (crappie, bluegill, pumpkinseed, yellowperch) are 67 and 21, respectively.
2000 Warmwater Fish Survey of Tanwax Lake, Pierce County June 20027
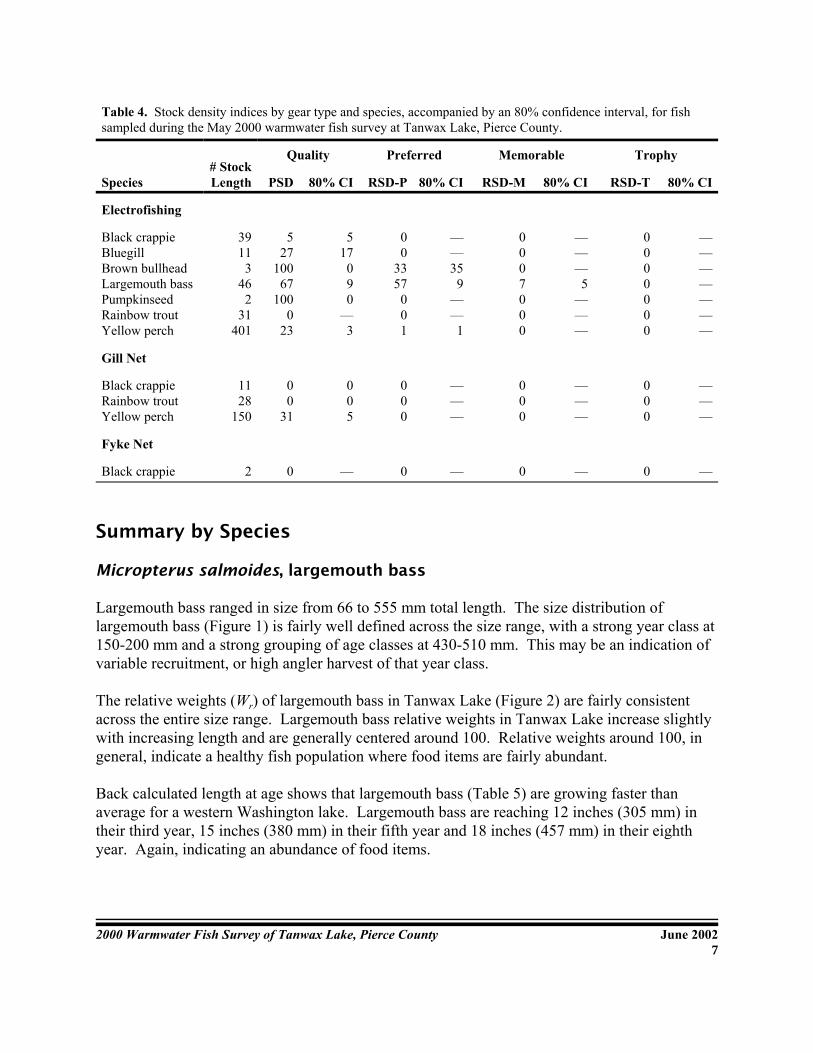
Table 4. Stock density indices by gear type and species, accompanied by an 80% confidence interval, for fishsampled during the May 2000 warmwater fish survey at Tanwax Lake, Pierce County.
Species# StockLength
Quality Preferred Memorable Trophy
PSD 80% CI RSD-P 80% CI RSD-M 80% CI RSD-T 80% CI
Electrofishing
Black crappieBluegillBrown bullheadLargemouth bassPumpkinseedRainbow troutYellow perch
3911
346
231
401
527
10067
1000
23
517
090
—3
00
3357
001
——35
9——1
0007000
———5
———
0000000
———————
Gill Net
Black crappieRainbow troutYellow perch
1128
150
00
31
005
000
———
000
———
000
———
Fyke Net
Black crappie 2 0 — 0 — 0 — 0 —
Summary by Species
Micropterus salmoides, largemouth bass
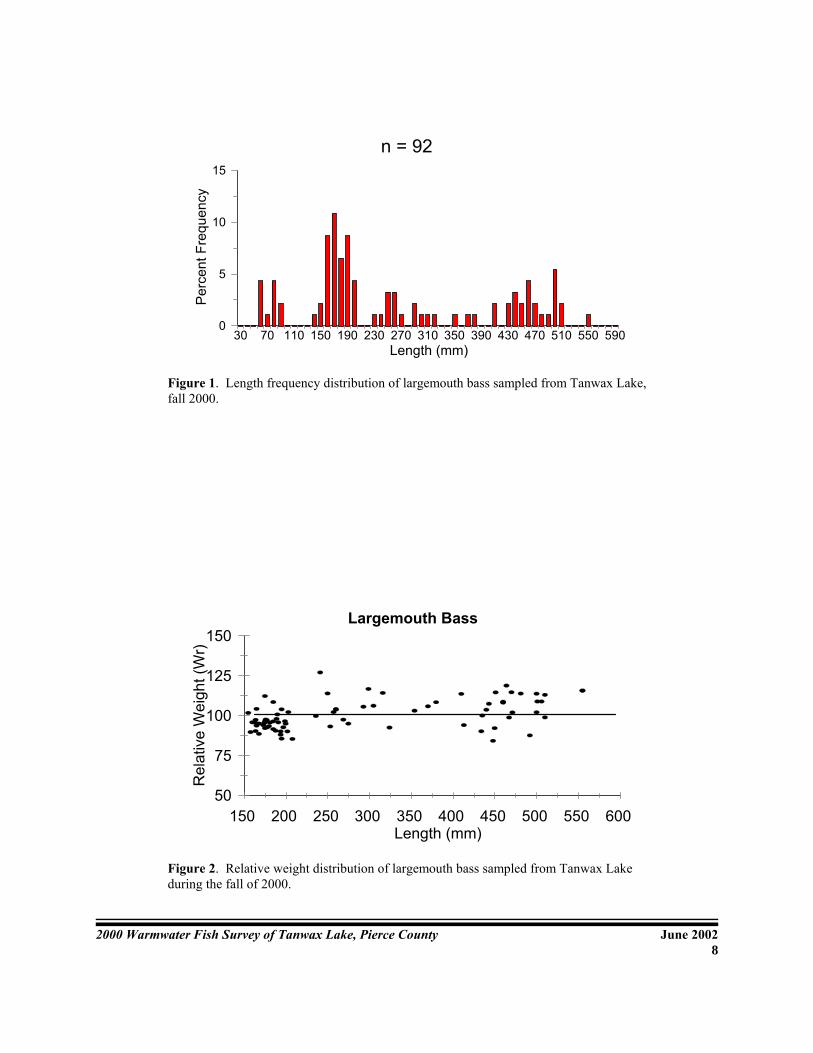
Largemouth bass ranged in size from 66 to 555 mm total length. The size distribution oflargemouth bass (Figure 1) is fairly well defined across the size range, with a strong year class at150-200 mm and a strong grouping of age classes at 430-510 mm. This may be an indication ofvariable recruitment, or high angler harvest of that year class.
The relative weights (Wr) of largemouth bass in Tanwax Lake (Figure 2) are fairly consistentacross the entire size range. Largemouth bass relative weights in Tanwax Lake increase slightlywith increasing length and are generally centered around 100. Relative weights around 100, ingeneral, indicate a healthy fish population where food items are fairly abundant.
Back calculated length at age shows that largemouth bass (Table 5) are growing faster thanaverage for a western Washington lake. Largemouth bass are reaching 12 inches (305 mm) intheir third year, 15 inches (380 mm) in their fifth year and 18 inches (457 mm) in their eighthyear. Again, indicating an abundance of food items.
2000 Warmwater Fish Survey of Tanwax Lake, Pierce County June 20028
0
5
10
15
Perc
ent F
requ
ency
30 70 110 150 190 230 270 310 350 390 430 470 510 550 590Length (mm)
n = 92
Figure 1. Length frequency distribution of largemouth bass sampled from Tanwax Lake,fall 2000.
50
75
100
125
150
Rel
ativ
e W
eigh
t (W
r)
150 200 250 300 350 400 450 500 550 600 Length (mm)
Largemouth Bass
Figure 2. Relative weight distribution of largemouth bass sampled from Tanwax Lakeduring the fall of 2000.
2000 Warmwater Fish Survey of Tanwax Lake, Pierce County June 20029
Table 5. Back calculated length at age (Fraser-Lee) for largemouth bass during the fall 2000 survey of TanwaxLake. Direct proportion and state average (also direct proportion) figures added for comparison.
Year class n
Mean Length at Age (mm)
I II III IV V VI VII VIII IX X XI XII XIII
1999199819971996199519941993199219911990198919881987
42810
1017310101
7782
10177
7189
10568
61
62
178208226
157168202262
119
144
265309
244252307262
230
219
354
275334370325
287
278
312387402370
362
308
371432430387
413
347
453448401
442
373
468434
464
396
450
483
429
496
453
510
467 482 492
AvgDirect PropState avg
57 867360
182177146
267259222
331326261
376373289
417415319
441440368
449448396
454453440
475474485
488488472
482481496
492492
Perca flavescens, yellow perch
Yellow perch sizes ranged from 59mm to 345mm. Yellow perch sizes are fairly well definedacross the lower end of its size range (Figure 3). Though yellow perch attain sizes up to 345mm,very few yellow perch above 200mm (8 inches) were represented in our sample. This is alsoreflected by the PSD of 23.
Relative weights of yellow perch average below 100 (Figure 4), decreasing slightly withincreasing length. This is pretty typical for yellow perch populations in western Washingtonlakes. Low relative weights are an indicator of inefficient foraging or a lack of available preyitems.
Back calculated length at age (Table 6) of yellow perch shows that, on average, yellow perchgrowth in Tanwax Lake is slightly above what is considered average for western Washington. Increasing our gill net saturation would help to determine if there are larger individuals in thepopulation.
2000 Warmwater Fish Survey of Tanwax Lake, Pierce County June 200210
0
5
10
15
20
25
30
Perc
ent F
requ
ency
30 60 90 120150180210240270300330360390Length (mm)
Figure 3. Length frequency distribution of yellow perch (Perca flavescens) sampled atTanwax Lake, Pierce County during the May 2000 warmwater fish survey.
50
75
100
125
150
Rel
ativ
e W
eigh
t (W
r)
100 125 150 175 200 225 250 275 300 Length (mm)
Yellow Perch
Figure 4. Relative weight distribution of yellow perch during the spring 2000warmwater fish survey of Tanwax Lake, Pierce County.
2000 Warmwater Fish Survey of Tanwax Lake, Pierce County June 200211
Table 6. Back calculated length at age (Fraser-Lee method) of yellow perch sampled during the springwarmwater fish survey of Tanwax Lake, Pierce County.
Mean Length at Age (mm)
Year Class n I II III IV V
19991998199719961995
3132
78
12
8685978576
165174152136
214197187
229216 237
AvgDirect ProportionState Average
857060
158152120
197192152
221219193
237237206
Onchorynchus mykiss, rainbow trout
Tanwax Lake is managed as a mixed species lake. Meaning, this lake receives a yearlyallotment of hatchery rainbow trout to support a put-and-take trout fishery. The managementintent is not to produce a self-sustaining population of trout, but to provide enough fish tosupport a fishery during the cooler periods of the year. On average, Tanwax Lake receivesroughly 15,000 catchable hatchery fish yearly, raised and released from a net pen at the BenbowResort. Additionally, Tanwax Lake receives a few hundred hatchery brood stock to provide asmall level of “trophy” fishing.
Pomoxis nigromaculatus, black crappie
Black crappie sizes ranged from 50 to 239mm total length. Smaller size classes of crappie werewell defined, but fish above 200mm (8 inches) were not very abundant in our sample (Figure 5). This is also shown by our electrofishing PSD of 5. Relative weights of black crappie averagedabove 100, denoting excellent condition, but decreased with increasing length. High relativeweights indicate an abundant food source, and overall favorable conditions. This is also seen inthe mean back calculated length at age for black crappie. Black crappie in Tanwax Lake aregrowing faster than average for western Washington lakes, reaching 200mm (8 inches) late intheir second year (Table 7). Again, showing that conditions are favorable for crappie growth. Black crappie are either suffering from high natural mortality or angler harvest, as no fish arereaching preferred length (250mm).
2000 Warmwater Fish Survey of Tanwax Lake, Pierce County June 200212
Table 7. Back calculated length at age (Fraser-Lee method) of black crappie during the spring 2000 warmwaterfish survey of Tanwax Lake, Pierce County.
Mean Length at Age (mm)
Year Class n I II III
199919981997
1025
2
727171
157184 237
Avg.Direct ProportionState Average
725246
159157111
237237157
Ameiurus nebulosus, brown bullhead
Brown bullhead were not well represented in our sample. These fish are probably moreabundant than our sampling indicates, but as they are bottom dwelling species, they are moredifficult to see and capture while sampling. We captured three brown bullhead ranging in sizefrom 210 - 305mm. Relative weights were 119, 108 and 91, indicating good overall condition . No spines were collected for aging purposes.
Lepomis macrochirus, bluegill
Bluegill were responsible for less than 1% of our sample by number and by biomass. Like blackcrappie, bluegill are probably subject to either high natural mortality or angler harvest, as therewere no preferred size (200mm) or larger fish, and few fish stock size or below (80mm). A PSDof 27 is reflected in the length frequency distribution (Figure 6), as there were few quality sizedfish. Relative weights of bluegill show that fish are in very good condition (Figure 7).
All bluegill aged were 2+ year old fish. At age two, these fish were longer than average forwestern Washington lakes (Table 8).
2000 Warmwater Fish Survey of Tanwax Lake, Pierce County June 200213
0
5
10
15
20
25
30
Perc
ent F
requ
ency
30 50 70 90 110 130 150 170 190Length (mm)
Figure 5. Length frequency distribution of bluegill from the spring 2000warmwater fish survey of Tanwax Lake, Pierce County.
50
75
100
125
150
Rel
ativ
e W
eigh
t (W
r)
80 100 120 140 160 180 200 Length (mm)
Bluegill
Figure 7. Relative weight distribution of bluegill during the spring 2000 warmwater fishsurvey of Tanwax Lake, Pierce County.
2000 Warmwater Fish Survey of Tanwax Lake, Pierce County June 200214
Table 8. Back calculated length at age (Fraser-Lee method) for bluegill from the spring 2000 survey of TanwaxLake, Pierce County.
Mean Length at Age (mm)
Year Class n I II
19991998
011 40 125
Avg.Direct ProportionState Average
402337
125122
97
Onchorynchus clarki, cutthroat trout
A few cutthroat trout were sampled at Tanwax Lake ranging in size from 180 - 230mm. Thesefish were in good overall condition, with relative weights ranging from 91 - 110. No scales werecollected for aging purposes. It is possible that there is a small, self-sustaining population ofcutthroat here, spawning in Tanwax Creek.
Cottidae, unidentified sculpin
Sculpin are probably more abundant in Tanwax Lake than our sampling indicates. As these fishare small bottom dwelling species, they are difficult to see and capture with our samplingtechniques. Also, due to the small morphological variability between sculpin species, we do notidentify these fish to the species level.
Lepomis gibbosus, pumpkinseed
Only two pumpkinseed were sampled at Tanwax Lake. These fish measured 155mm (Wr 124,age 2) and 168mm (Wr 113, age 3). Overall condition for these two fish was very good, andgrowth was above average.
2000 Warmwater Fish Survey of Tanwax Lake, Pierce County June 200215
Discussion and Management Options
Tanwax Lake has always been managed as a mixed species lake. Stocking records show thatlargemouth bass were originally planted by the State Department of Game in 1933 and again in1937. Since that time, the fishery has been maintained solely by yearly plants of hatcheryrainbow trout and naturally produced warmwater fish. A slot limit regulation was placed onlargemouth bass in 2000 to help protect some of the larger fish from harvest.
In 1976, an angler creel survey was completed on Tanwax Lake and two other neighboring lakes(Cummins 1977). This survey determined that during 1976, rainbow trout accounted for 75% ofthe harvest (10,365 trout harvested), and warmwater fish account for about 25% of the totalharvest (yellow perch 14%, bass 5%, crappie 5% and sunfish 1%) for a total of 3,471 warmwaterfish harvested. Also in 1976, 55% of the anglers fished for trout, while 9% fished for warmwaterfish and 36% reported to fish for anything. As our management strategy on this lake has notchanged much in the past 25 years, it is most likely the case that rainbow trout still account forthe highest percentage of the total harvest at Tanwax Lake. Though the management strategyhas not changed much over the years, angler preferences and attitudes have changed. Anupdated angler creel survey would help us estimate current angler effort, preferences, andharvest. These three pieces of information are essential to management, and may help usdetermine if sunfish are being harvested at a high rate, and will help us determine how to moreeffectively manage this fishery.
Beginning with the 2001 lowland lake trout fishing season, Tanwax Lake was converted back toan opening day schedule. This means that the lake is closed to all fishing from October 31,through last Saturday in April. This closing may have a limited impact on fall, winter, andspring fisheries for crappie and perch.
Relatively few sunfish were encountered while sampling. It is unclear as to whether there ishigh natural mortality, high angler harvest, poor spawning success, or if these species were justunder represented in our sampling. The fact that the water conductivity was low (~65 Fs/cm)may have led to poor electrofishing efficiency. Continued standardized surveys should beconducted on a fall/following spring basis to help us gain an idea of initial recruitment, and moredirected sampling for yellow perch and black crappie will help us better determine the sizestructure of these populations. Continued on a rotating basis roughly every three years, we cangradually build a data set to get an idea of recruitment variability, especially for the highlyvariable species like black crappie.
Overall growth rates for all species in our sample were above our current averages for westernWashington lakes. Furthermore, generally high relative weights for most species do not indicatethat there is any bottleneck in growth (i.e. low prey availability, temperature problems, excessive

2000 Warmwater Fish Survey of Tanwax Lake, Pierce County June 200216
competition). An assessment of primary and secondary productivity in the lake may bebeneficial to understanding the growth and abundance of certain fishes.
2000 Warmwater Fish Survey of Tanwax Lake, Pierce County June 200217
Literature Cited
Anderson, R. O., and R. M. Neumann. 1996. Length, weight, and associated structural indices. Pages 447-482 in Murphy, B. R., and D. W. Willis (eds.), Fisheries Techniques, 2nd
edition. American Fisheries Society, Bethesda, MD.
Bennett, G. W. 1962. Management of Artificial Lakes and Ponds. Reinhold PublishingCorporation, New York, NY.
Bortleson, G. C., N. P. Dion, and J. B. McConnell. 1976. Reconnaissance Data on Lakes inWashington, Volume 3, Kitsap, Mason, and Pierce Counties. State of WashingtonDepartment of Ecology, Water-Supply Bulletin 43, Vol. 3.
Carlander, K.D., 1982. Standard Intercepts for Calculating Lengths from Scale Measurementsfor Some Centrarchid and Percid Fishes. Transactions of the American Fisheries Society111:332-336.
Cummins, James L. 1977. Tanwax, Rapjohn, and Kapowsin Lakes Creel Sensus, 1976. Unpublished manuscript. Washington Department of Game.
DeVries, D., and R. Frie. 1996. Determination of Age and Growth. Pages 483-512 in Murphy,B. R., and D. W. Willis (eds.), Fisheries Techniques, 2nd edition. American FisheriesSociety, Bethesda, MD.
Fletcher, D., S. Bonar, B. Bolding, A. Bradbury, and S. Zeylmaker. 1993. AnalyzingWarmwater Fish Populations in Washington State. Washington Department of Fish andWildlife, Warmwater Fish Survey Manual, 173 p.
Gablehouse, D. W. 1984. A Length-Categorization System to Assess Fish Stocks. NorthAmerican Journal of Fisheries Management 4:273-285.
Gablehouse, D. W. 1991. Seasonal Changes in Body Condition of White Crappies andRelations to Length and Growth in Melvern Reservoir, Kansas. North American Journalof Fisheries Management 11:50-56.
Gustafson, K. A. 1988. Approximating confidence intervals for indices of fish population sizestructure. North American Journal of Fisheries Management 8:139-141.
2000 Warmwater Fish Survey of Tanwax Lake, Pierce County June 200218
Guy, C. S., and D. W. Willis. 1991. Evaluation of Largemouth Bass - Yellow PerchCommunities in Small South Dakota Impoundments. North American Journal ofFisheries Management 11:43-49.
Murphy, B. R., and D. W. Willis. 1991. Application of relative weight (Wr) to westernwarmwater fisheries. Pages 243-248 in Proceedings of the Warmwater FisheriesSymposium I, June 4-8, 1991, Scottsdale, Arizona. USDA Forest Service, GeneralTechnical Report RM-207.
Ricker, W. E. 1975. Computation and Interpretation of Biological Statistics of FishPopulations Fisheries Research Board of Canada Bulletin 191.
Swingle, H. S. 1950. Relationships and dynamics of balanced and unbalanced fish populations. Auburn University, Alabama Agricultural Experiment Station Bulletin No 274, 74 p.
Westerdahl , H. E., K. D. Getsinger, eds. 1988. Aquatic Plant Identification and Herbicide UseGuide; Volume 1: Aquatic Herbicides and Application Equipment. Technical ReportA-88-9, US Army Engineer Waterways Experiment Station, Vicksburg, MS.
Wetzel, R. G. 1983. Limnology, 2nd edition. Saunders College Publishing, Philadelphia, PA.
Willis, D. W., B. R. Murphy, C. S. Guy. 1993. Stock Density Indices: Development, Use, andLimitations. Reviews in Fisheries Science, 1(3):203-222.
Zar, J. H. 1984. Biostatistical Analysis, 2nd edition. Prentice-Hall, Englewood Cliffs, NJ.
2000 Warmwater Fish Survey of Tanwax Lake, Pierce County June 200219
Appendix A
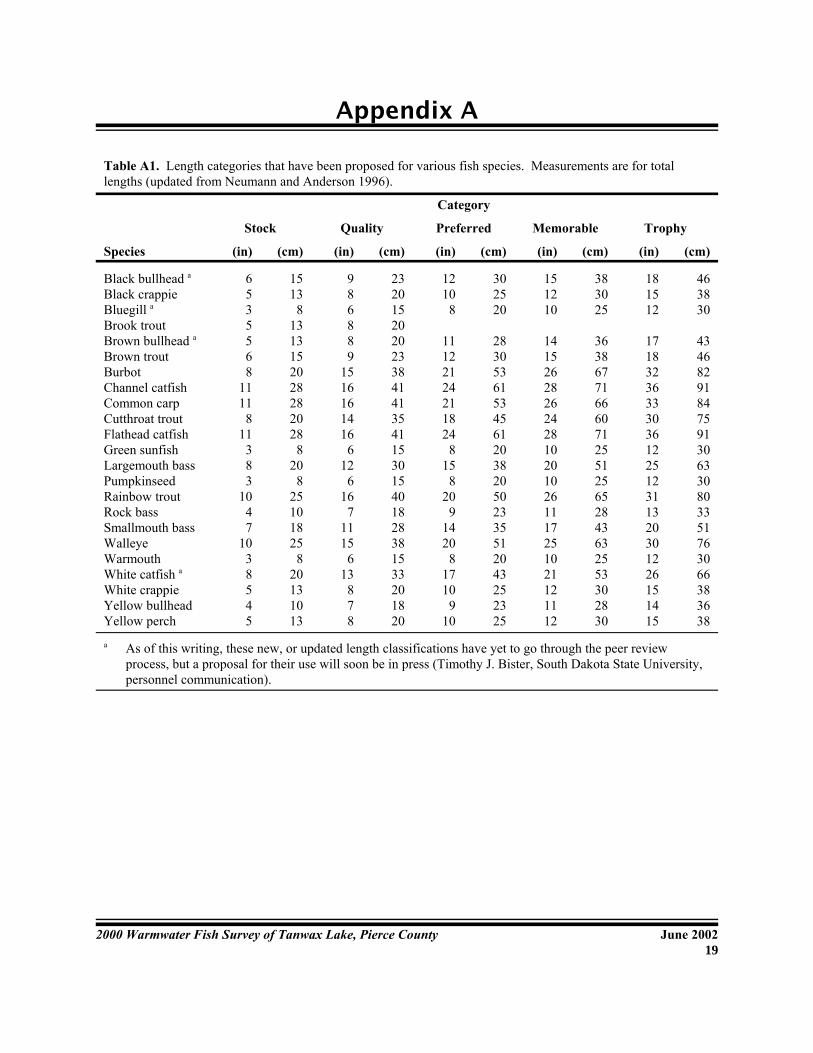
Table A1. Length categories that have been proposed for various fish species. Measurements are for totallengths (updated from Neumann and Anderson 1996).
Category
Stock Quality Preferred Memorable Trophy
Species (in) (cm) (in) (cm) (in) (cm) (in) (cm) (in) (cm)
Black bullhead aBlack crappieBluegill a
Brook troutBrown bullhead a
Brown troutBurbotChannel catfishCommon carpCutthroat troutFlathead catfishGreen sunfishLargemouth bassPumpkinseedRainbow troutRock bassSmallmouth bassWalleyeWarmouthWhite catfish aWhite crappieYellow bullheadYellow perch
6535568
1111
811
383
1047
1038545
1513
81313152028282028
820
825101825
820131013
986889
1516161416
612
616
71115
613
878
2320152020233841413541153015401828381533201820
1210
8
11122124211824
815
820
91420
81710
910
302520
28305361534561203820502335512043252325
151210
14152628262428102010261117251021121112
383025
36386771666071255125652843632553302830
181512
17183236333036122512311320301226151415
463830
43468291847591306330803351763066383638
a As of this writing, these new, or updated length classifications have yet to go through the peer reviewprocess, but a proposal for their use will soon be in press (Timothy J. Bister, South Dakota State University,personnel communication).
This program receives Federal financial assistance from the U.S. Fish and WildlifeService Title VI of the Civil Rights Act of 1964, Section 504 of the RehabilitationAct of 1973, Title II of the Americans with Disabilities Act of 1990, the AgeDiscrimination Act of 1975, and Title IX of the Education Amendments of 1972.The U.S. Department of the Interior and its bureaus prohibit discrimination on thebases of race, color, national origin, age, disability and sex (in educationalprograms). If you believe that you have been discriminated against in anyprogram, activity or facility, please write to:
U.S. Fish and Wildlife ServiceOffice of External Programs4040 N. Fairfax Drive, Suite 130Arlington, VA 22203


![Field Year 2015 State Resource Water Assessment Monitoring€¦ · Performance expectations for the basic aquatic life uses (Warmwater Habitat [WWH], Exceptional Warmwater Habitat](https://img.pdfslide.us/doc/110x75/5fdce4d7afdd7562064e5f97/field-year-2015-state-resource-water-assessment-performance-expectations-for-the.jpg)