Embed Size (px)
Citation preview

7/30/2019 2000 _ val verde county _ comstock isd _ 2000 texas school survey of drug and alcohol use _ elementary report
http://slidepdf.com/reader/full/2000-val-verde-county-comstock-isd-2000-texas-school-survey-of-drug-and 1/48

7/30/2019 2000 _ val verde county _ comstock isd _ 2000 texas school survey of drug and alcohol use _ elementary report
http://slidepdf.com/reader/full/2000-val-verde-county-comstock-isd-2000-texas-school-survey-of-drug-and 2/48
ComstockSpring 2000
______________________________________________________________________________________________
Table T-1: How recently, if ever, have you used...
Ever School Not Past NeverUsed Year Year Used
_____________________________________________________________________________________Any tobacco product All 15.8% 2.6% 13.2% 84.2%_____________________________________________________________________________________Cigarettes All 12.9% 2.6% 10.2% 87.1%_____________________________________________________________________________________Smokeless tobacco All 3.0% * % 3.0% 97.0%
______________________________________________________________________________________________
Table T-2: Average number of times selected tobacco products were used by thosewho reported use of ...
Any tobacco product
School LifetimeYear
All * 3.2
Cigarettes
School LifetimeYear
All * 3.5
Smokeless tobacco
School LifetimeYear
All * *
______________________________________________________________________________________________
Table T-3: Average age of first use of tobacco:
All
Tobacco *
______________________________________________________________________________________________
Table T-4: Average age of first use of tobacco by family situation:
Two Parent Family
Never 7 or Under 8 9 10 11 12 or Over
All 78.1% 5.9% 6.3% 3.1% 3.5% * % 3.1%
Other Family Situation
Never 7 or Under 8 9 10 11 12 or Over
All * % * % * % * % * % * % * %
7/30/2019 2000 _ val verde county _ comstock isd _ 2000 texas school survey of drug and alcohol use _ elementary report
http://slidepdf.com/reader/full/2000-val-verde-county-comstock-isd-2000-texas-school-survey-of-drug-and 3/48
ComstockSpring 2000
______________________________________________________________________________________________
Table T-5: About how many of your close friends use ...
Any tobacco product?
NeverHeard of None Some Most
All * % 71.0% 29.0% * %
Cigarettes?
NeverHeard of None Some Most
All * % 73.4% 26.6% * %
Smokeless tobacco?
NeverHeard of None Some Most
All 3.0% 89.4% 7.6% * %
______________________________________________________________________________________________
Table T-6: Have you ever been offered ...
Any tobacco product?
NeverHeard of Yes No
All * % 24.0% 76.0%
Cigarettes?
NeverHeard of Yes No
All * % 22.1% 77.9%
Smokeless tobacco?
NeverHeard of Yes No
All 3.0% 5.1% 91.9%
______________________________________________________________________________________________
Table T-7: How dangerous do you think it is for kids your age to use ...
Any tobacco product?
Never Very Not at All Do Not
Heard of Dangerous Dangerous Dangerous Know
All * % 79.1% 18.3% 2.6% * %
Cigarettes?
Never Very Not at All Do NotHeard of Dangerous Dangerous Dangerous Know
All * % 68.1% 29.3% 2.6% * %
7/30/2019 2000 _ val verde county _ comstock isd _ 2000 texas school survey of drug and alcohol use _ elementary report
http://slidepdf.com/reader/full/2000-val-verde-county-comstock-isd-2000-texas-school-survey-of-drug-and 4/48
ComstockSpring 2000
______________________________________________________________________________________________
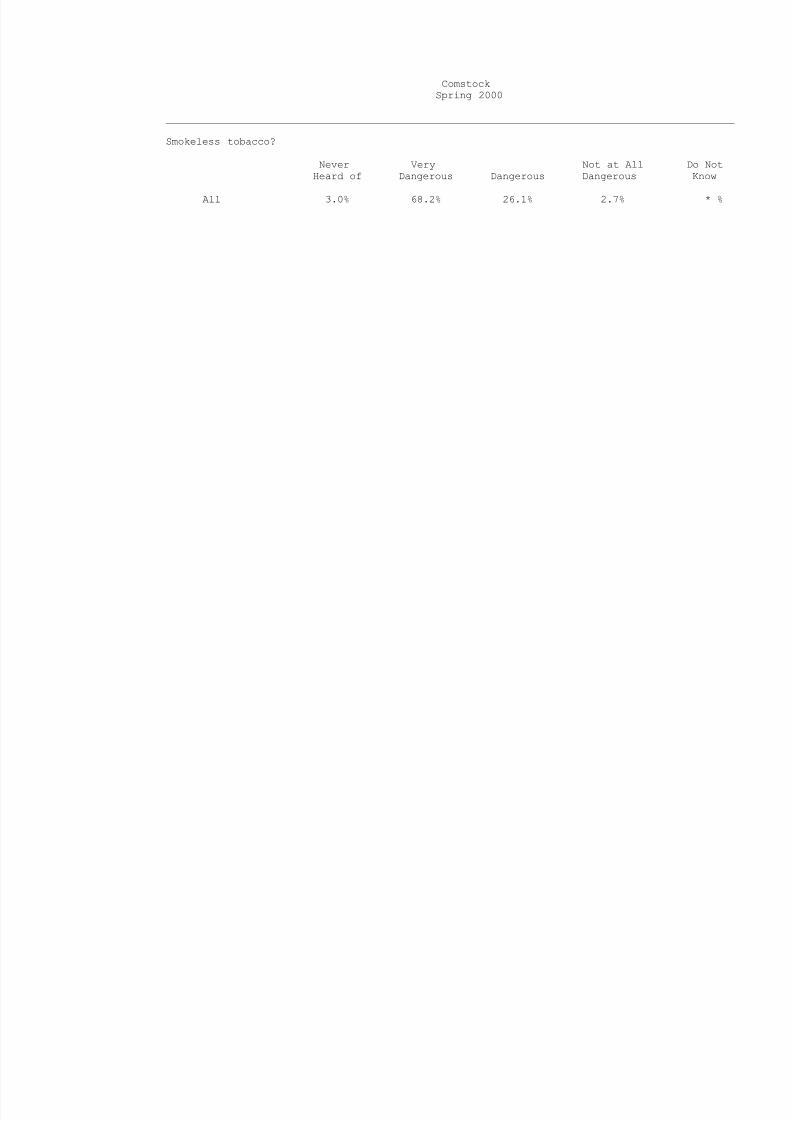
Smokeless tobacco?
Never Very Not at All Do NotHeard of Dangerous Dangerous Dangerous Know
All 3.0% 68.2% 26.1% 2.7% * %

7/30/2019 2000 _ val verde county _ comstock isd _ 2000 texas school survey of drug and alcohol use _ elementary report
http://slidepdf.com/reader/full/2000-val-verde-county-comstock-isd-2000-texas-school-survey-of-drug-and 5/48
7/30/2019 2000 _ val verde county _ comstock isd _ 2000 texas school survey of drug and alcohol use _ elementary report
http://slidepdf.com/reader/full/2000-val-verde-county-comstock-isd-2000-texas-school-survey-of-drug-and 6/48
ComstockSpring 2000
______________________________________________________________________________________________
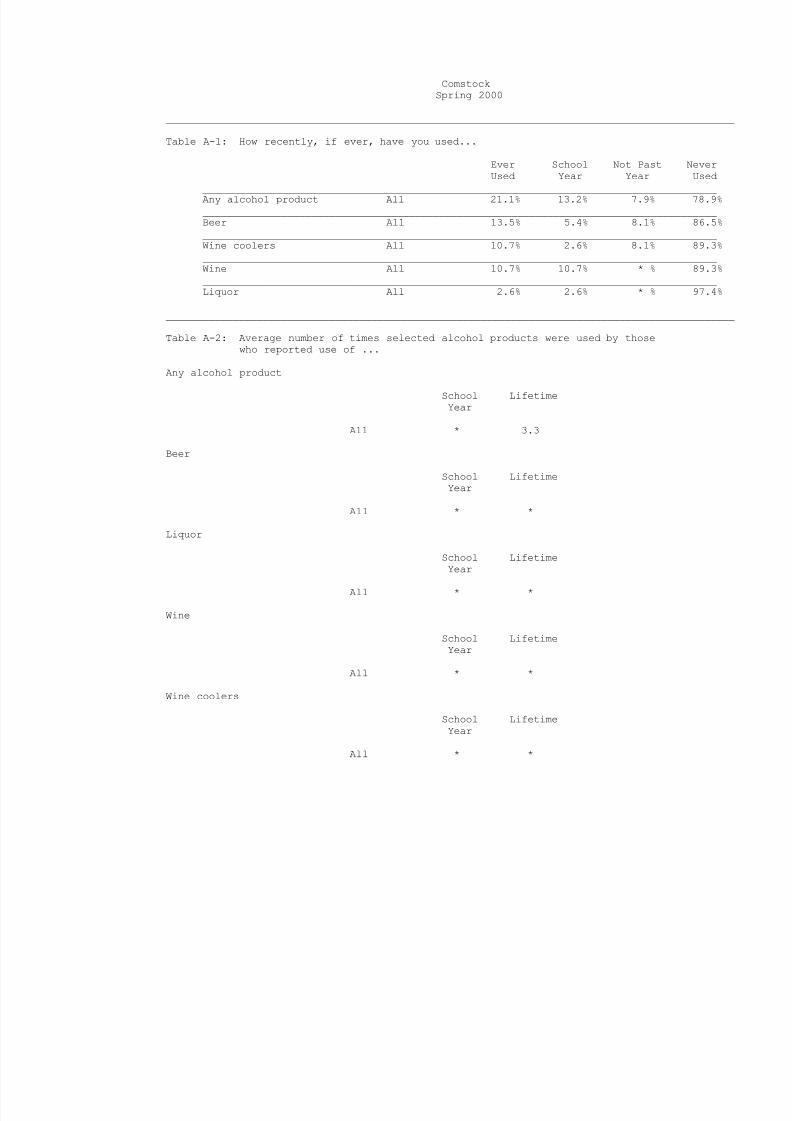
Table A-1: How recently, if ever, have you used...
Ever School Not Past NeverUsed Year Year Used
_____________________________________________________________________________________Any alcohol product All 21.1% 13.2% 7.9% 78.9%_____________________________________________________________________________________Beer All 13.5% 5.4% 8.1% 86.5%_____________________________________________________________________________________Wine coolers All 10.7% 2.6% 8.1% 89.3%_____________________________________________________________________________________Wine All 10.7% 10.7% * % 89.3%_____________________________________________________________________________________Liquor All 2.6% 2.6% * % 97.4%
______________________________________________________________________________________________
Table A-2: Average number of times selected alcohol products were used by thosewho reported use of ...
Any alcohol product
School LifetimeYear
All * 3.3
Beer
School LifetimeYear
All * *
Liquor
School LifetimeYear
All * *
Wine
School LifetimeYear
All * *
Wine coolers
School LifetimeYear
All * *
7/30/2019 2000 _ val verde county _ comstock isd _ 2000 texas school survey of drug and alcohol use _ elementary report
http://slidepdf.com/reader/full/2000-val-verde-county-comstock-isd-2000-texas-school-survey-of-drug-and 7/48
ComstockSpring 2000
______________________________________________________________________________________________
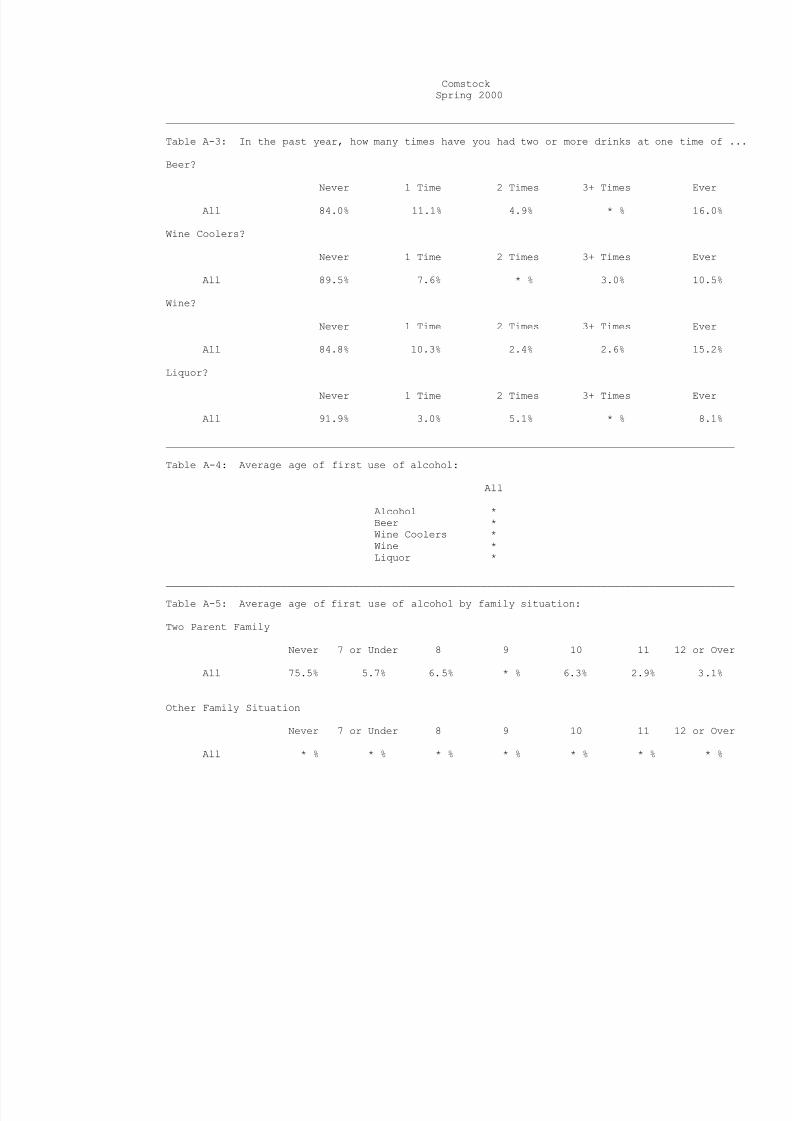
Table A-3: In the past year, how many times have you had two or more drinks at one time of .
Beer?
Never 1 Time 2 Times 3+ Times Ever
All 84.0% 11.1% 4.9% * % 16.0%
Wine Coolers?
Never 1 Time 2 Times 3+ Times Ever
All 89.5% 7.6% * % 3.0% 10.5%
Wine?
Never 1 Time 2 Times 3+ Times Ever
All 84.8% 10.3% 2.4% 2.6% 15.2%
Liquor?
Never 1 Time 2 Times 3+ Times Ever
All 91.9% 3.0% 5.1% * % 8.1%
______________________________________________________________________________________________
Table A-4: Average age of first use of alcohol:
All
Alcohol *Beer *Wine Coolers *Wine *Liquor *
______________________________________________________________________________________________
Table A-5: Average age of first use of alcohol by family situation:
Two Parent Family
Never 7 or Under 8 9 10 11 12 or Over
All 75.5% 5.7% 6.5% * % 6.3% 2.9% 3.1%
Other Family Situation
Never 7 or Under 8 9 10 11 12 or Over
All * % * % * % * % * % * % * %
7/30/2019 2000 _ val verde county _ comstock isd _ 2000 texas school survey of drug and alcohol use _ elementary report
http://slidepdf.com/reader/full/2000-val-verde-county-comstock-isd-2000-texas-school-survey-of-drug-and 8/48
ComstockSpring 2000
______________________________________________________________________________________________
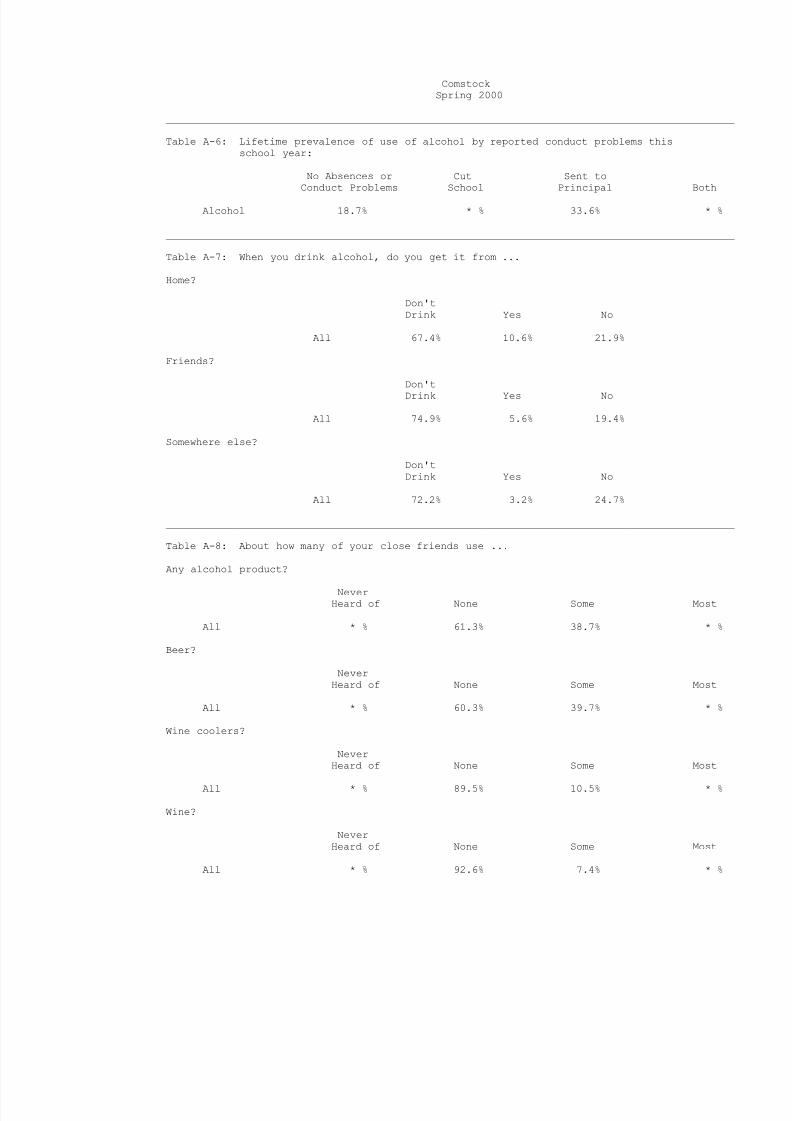
Table A-6: Lifetime prevalence of use of alcohol by reported conduct problems thisschool year:
No Absences or Cut Sent toConduct Problems School Principal Both
Alcohol 18.7% * % 33.6% * %
______________________________________________________________________________________________
Table A-7: When you drink alcohol, do you get it from ...
Home?
Don'tDrink Yes No
All 67.4% 10.6% 21.9%
Friends?
Don'tDrink Yes No
All 74.9% 5.6% 19.4%
Somewhere else?
Don'tDrink Yes No
All 72.2% 3.2% 24.7%
______________________________________________________________________________________________
Table A-8: About how many of your close friends use ...
Any alcohol product?
NeverHeard of None Some Most
All * % 61.3% 38.7% * %
Beer?
NeverHeard of None Some Most
All * % 60.3% 39.7% * %
Wine coolers?
NeverHeard of None Some Most
All * % 89.5% 10.5% * %
Wine?
NeverHeard of None Some Most
All * % 92.6% 7.4% * %
7/30/2019 2000 _ val verde county _ comstock isd _ 2000 texas school survey of drug and alcohol use _ elementary report
http://slidepdf.com/reader/full/2000-val-verde-county-comstock-isd-2000-texas-school-survey-of-drug-and 9/48
ComstockSpring 2000
______________________________________________________________________________________________
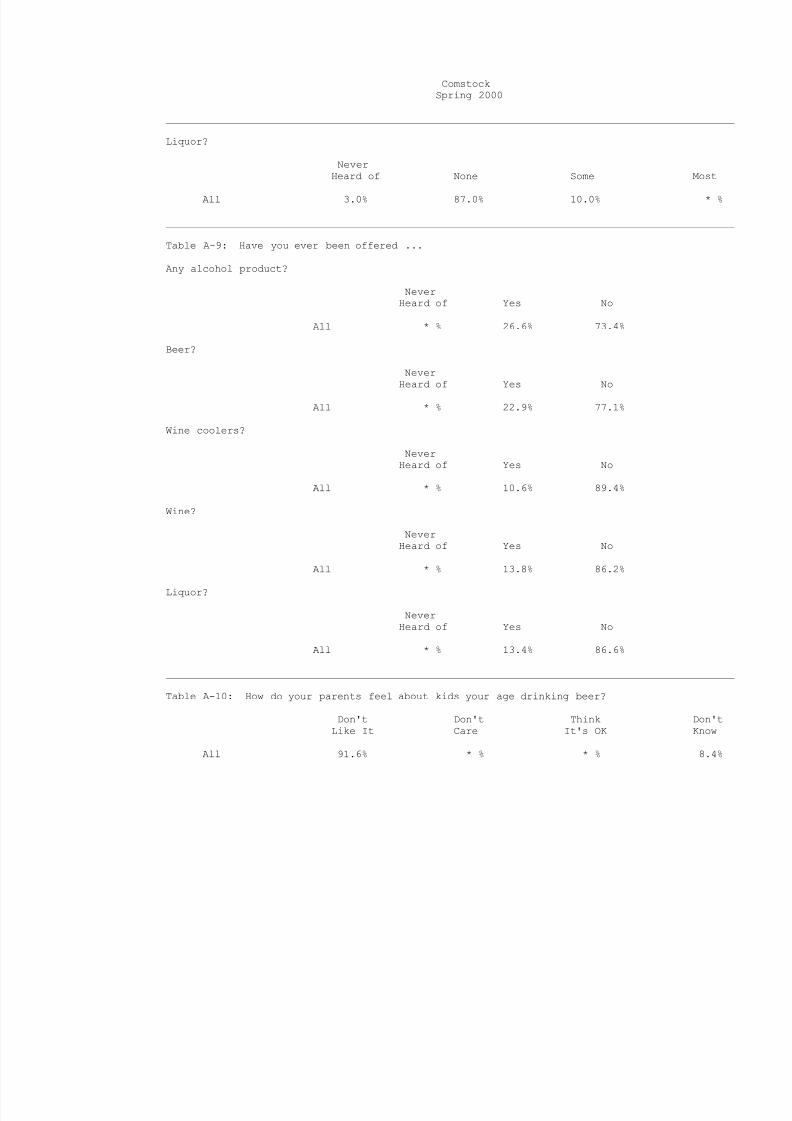
Liquor?
NeverHeard of None Some Most
All 3.0% 87.0% 10.0% * %
______________________________________________________________________________________________
Table A-9: Have you ever been offered ...
Any alcohol product?
NeverHeard of Yes No
All * % 26.6% 73.4%
Beer?
NeverHeard of Yes No
All * % 22.9% 77.1%
Wine coolers?
NeverHeard of Yes No
All * % 10.6% 89.4%
Wine?
NeverHeard of Yes No
All * % 13.8% 86.2%
Liquor?
NeverHeard of Yes No
All * % 13.4% 86.6%
______________________________________________________________________________________________
Table A-10: How do your parents feel about kids your age drinking beer?
Don't Don't Think Don'tLike It Care It's OK Know
All 91.6% * % * % 8.4%
7/30/2019 2000 _ val verde county _ comstock isd _ 2000 texas school survey of drug and alcohol use _ elementary report
http://slidepdf.com/reader/full/2000-val-verde-county-comstock-isd-2000-texas-school-survey-of-drug-and 10/48
ComstockSpring 2000
______________________________________________________________________________________________
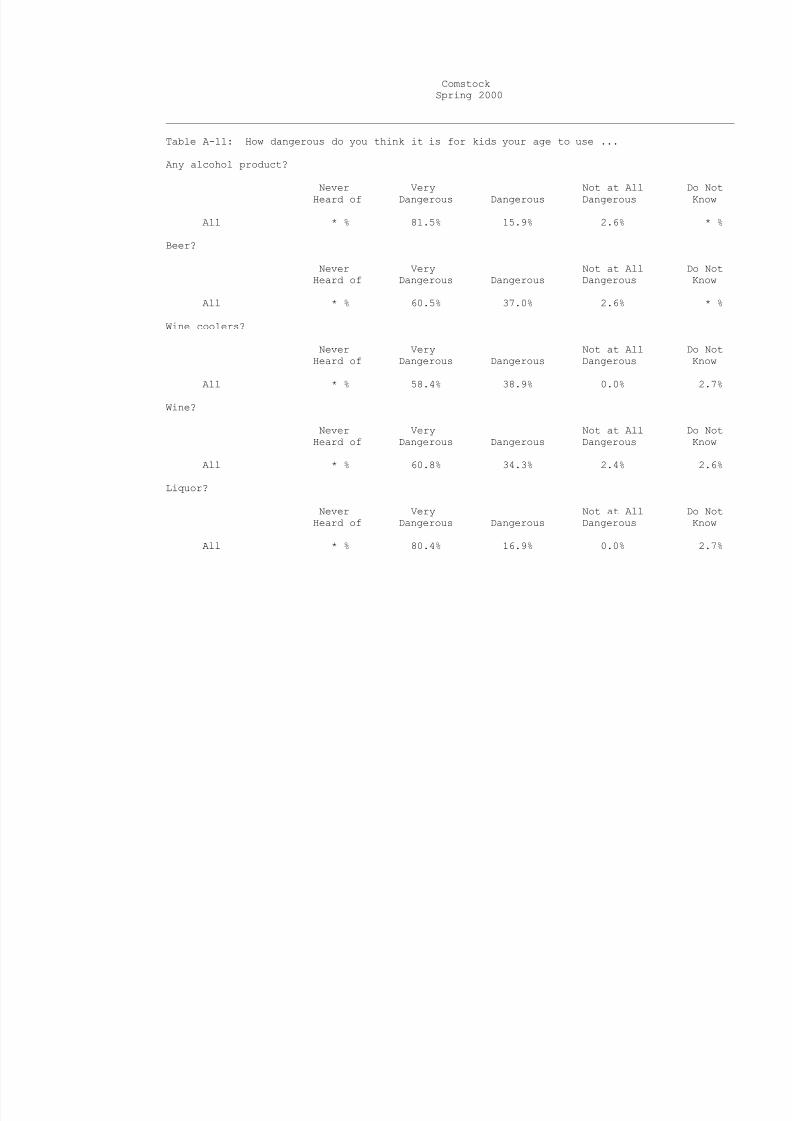
Table A-11: How dangerous do you think it is for kids your age to use ...
Any alcohol product?
Never Very Not at All Do NotHeard of Dangerous Dangerous Dangerous Know
All * % 81.5% 15.9% 2.6% * %
Beer?
Never Very Not at All Do NotHeard of Dangerous Dangerous Dangerous Know
All * % 60.5% 37.0% 2.6% * %
Wine coolers?
Never Very Not at All Do NotHeard of Dangerous Dangerous Dangerous Know
All * % 58.4% 38.9% 0.0% 2.7%
Wine?
Never Very Not at All Do NotHeard of Dangerous Dangerous Dangerous Know
All * % 60.8% 34.3% 2.4% 2.6%
Liquor?
Never Very Not at All Do NotHeard of Dangerous Dangerous Dangerous Know
All * % 80.4% 16.9% 0.0% 2.7%

7/30/2019 2000 _ val verde county _ comstock isd _ 2000 texas school survey of drug and alcohol use _ elementary report
http://slidepdf.com/reader/full/2000-val-verde-county-comstock-isd-2000-texas-school-survey-of-drug-and 11/48
7/30/2019 2000 _ val verde county _ comstock isd _ 2000 texas school survey of drug and alcohol use _ elementary report
http://slidepdf.com/reader/full/2000-val-verde-county-comstock-isd-2000-texas-school-survey-of-drug-and 12/48
ComstockSpring 2000
______________________________________________________________________________________________
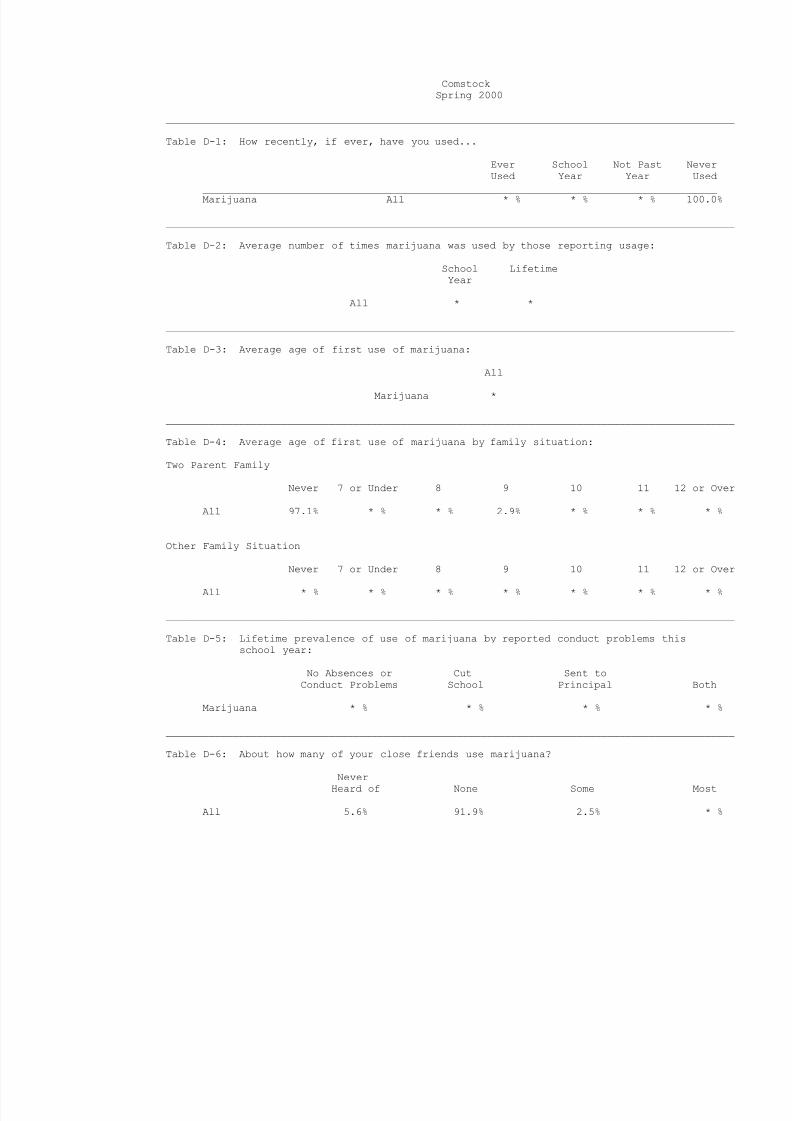
Table D-1: How recently, if ever, have you used...
Ever School Not Past NeverUsed Year Year Used
_____________________________________________________________________________________Marijuana All * % * % * % 100.0%
______________________________________________________________________________________________
Table D-2: Average number of times marijuana was used by those reporting usage:
School LifetimeYear
All * *
______________________________________________________________________________________________
Table D-3: Average age of first use of marijuana:
All
Marijuana *
______________________________________________________________________________________________
Table D-4: Average age of first use of marijuana by family situation:
Two Parent Family
Never 7 or Under 8 9 10 11 12 or Over
All 97.1% * % * % 2.9% * % * % * %
Other Family Situation
Never 7 or Under 8 9 10 11 12 or Over
All * % * % * % * % * % * % * %
______________________________________________________________________________________________
Table D-5: Lifetime prevalence of use of marijuana by reported conduct problems thisschool year:
No Absences or Cut Sent toConduct Problems School Principal Both
Marijuana * % * % * % * %
______________________________________________________________________________________________
Table D-6: About how many of your close friends use marijuana?
NeverHeard of None Some Most
All 5.6% 91.9% 2.5% * %
7/30/2019 2000 _ val verde county _ comstock isd _ 2000 texas school survey of drug and alcohol use _ elementary report
http://slidepdf.com/reader/full/2000-val-verde-county-comstock-isd-2000-texas-school-survey-of-drug-and 13/48
ComstockSpring 2000
______________________________________________________________________________________________
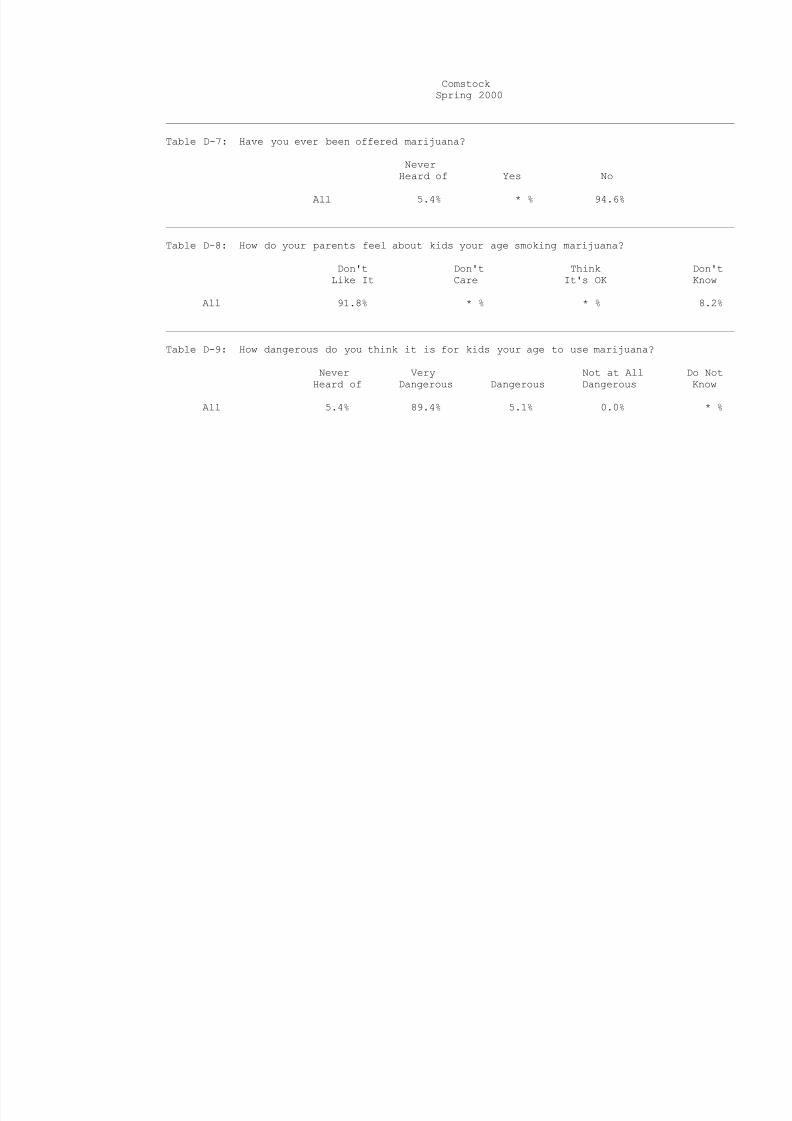
Table D-7: Have you ever been offered marijuana?
NeverHeard of Yes No
All 5.4% * % 94.6%
______________________________________________________________________________________________
Table D-8: How do your parents feel about kids your age smoking marijuana?
Don't Don't Think Don'tLike It Care It's OK Know
All 91.8% * % * % 8.2%
______________________________________________________________________________________________
Table D-9: How dangerous do you think it is for kids your age to use marijuana?
Never Very Not at All Do NotHeard of Dangerous Dangerous Dangerous Know
All 5.4% 89.4% 5.1% 0.0% * %
7/30/2019 2000 _ val verde county _ comstock isd _ 2000 texas school survey of drug and alcohol use _ elementary report
http://slidepdf.com/reader/full/2000-val-verde-county-comstock-isd-2000-texas-school-survey-of-drug-and 14/48
ComstockSpring 2000
______________________________________________________________________________________________
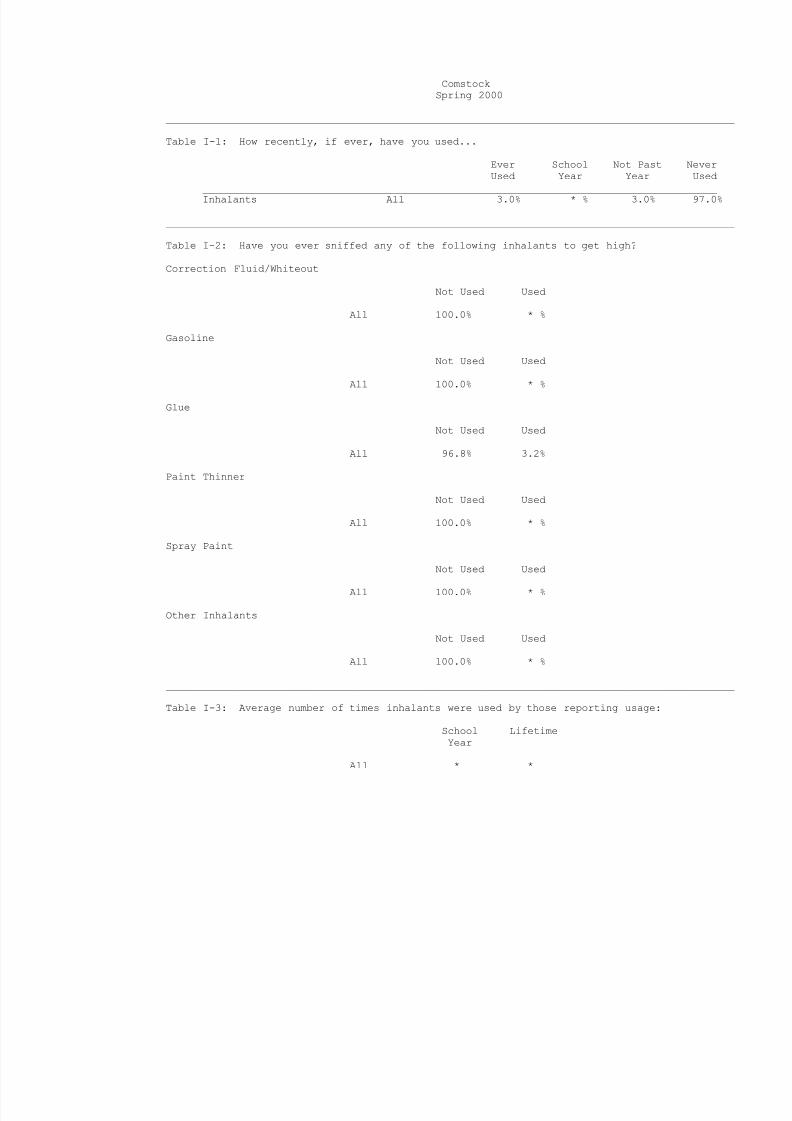
Table I-1: How recently, if ever, have you used...
Ever School Not Past NeverUsed Year Year Used
_____________________________________________________________________________________Inhalants All 3.0% * % 3.0% 97.0%
______________________________________________________________________________________________
Table I-2: Have you ever sniffed any of the following inhalants to get high?
Correction Fluid/Whiteout
Not Used Used
All 100.0% * %
Gasoline
Not Used Used
All 100.0% * %
Glue
Not Used Used
All 96.8% 3.2%
Paint Thinner
Not Used Used
All 100.0% * %
Spray Paint
Not Used Used
All 100.0% * %
Other Inhalants
Not Used Used
All 100.0% * %
______________________________________________________________________________________________
Table I-3: Average number of times inhalants were used by those reporting usage:
School LifetimeYear
All * *
7/30/2019 2000 _ val verde county _ comstock isd _ 2000 texas school survey of drug and alcohol use _ elementary report
http://slidepdf.com/reader/full/2000-val-verde-county-comstock-isd-2000-texas-school-survey-of-drug-and 15/48
ComstockSpring 2000
______________________________________________________________________________________________
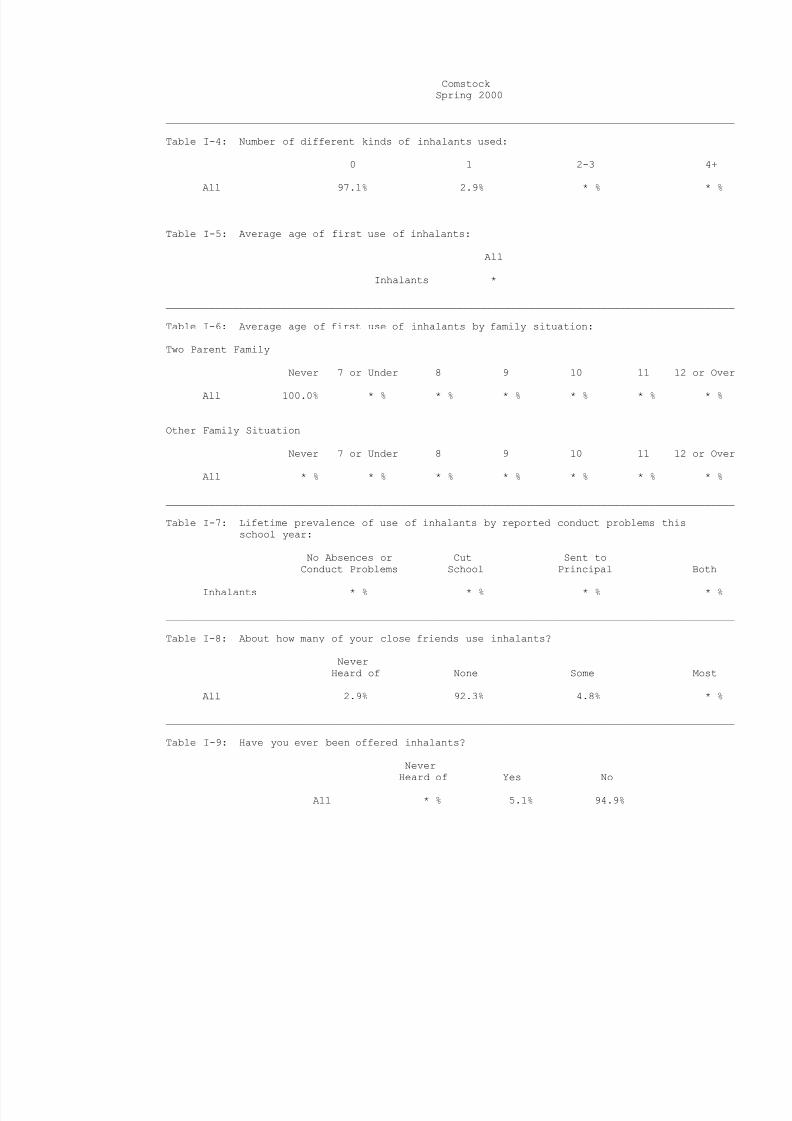
Table I-4: Number of different kinds of inhalants used:
0 1 2-3 4+
All 97.1% 2.9% * % * %
______________________________________________________________________________________________
Table I-5: Average age of first use of inhalants:
All
Inhalants *
______________________________________________________________________________________________
Table I-6: Average age of first use of inhalants by family situation:
Two Parent Family
Never 7 or Under 8 9 10 11 12 or Over
All 100.0% * % * % * % * % * % * %
Other Family Situation
Never 7 or Under 8 9 10 11 12 or Over
All * % * % * % * % * % * % * %
______________________________________________________________________________________________
Table I-7: Lifetime prevalence of use of inhalants by reported conduct problems thisschool year:
No Absences or Cut Sent toConduct Problems School Principal Both
Inhalants * % * % * % * %
______________________________________________________________________________________________
Table I-8: About how many of your close friends use inhalants?
NeverHeard of None Some Most
All 2.9% 92.3% 4.8% * %
______________________________________________________________________________________________
Table I-9: Have you ever been offered inhalants?
Never
Heard of Yes No
All * % 5.1% 94.9%
7/30/2019 2000 _ val verde county _ comstock isd _ 2000 texas school survey of drug and alcohol use _ elementary report
http://slidepdf.com/reader/full/2000-val-verde-county-comstock-isd-2000-texas-school-survey-of-drug-and 16/48
ComstockSpring 2000
______________________________________________________________________________________________
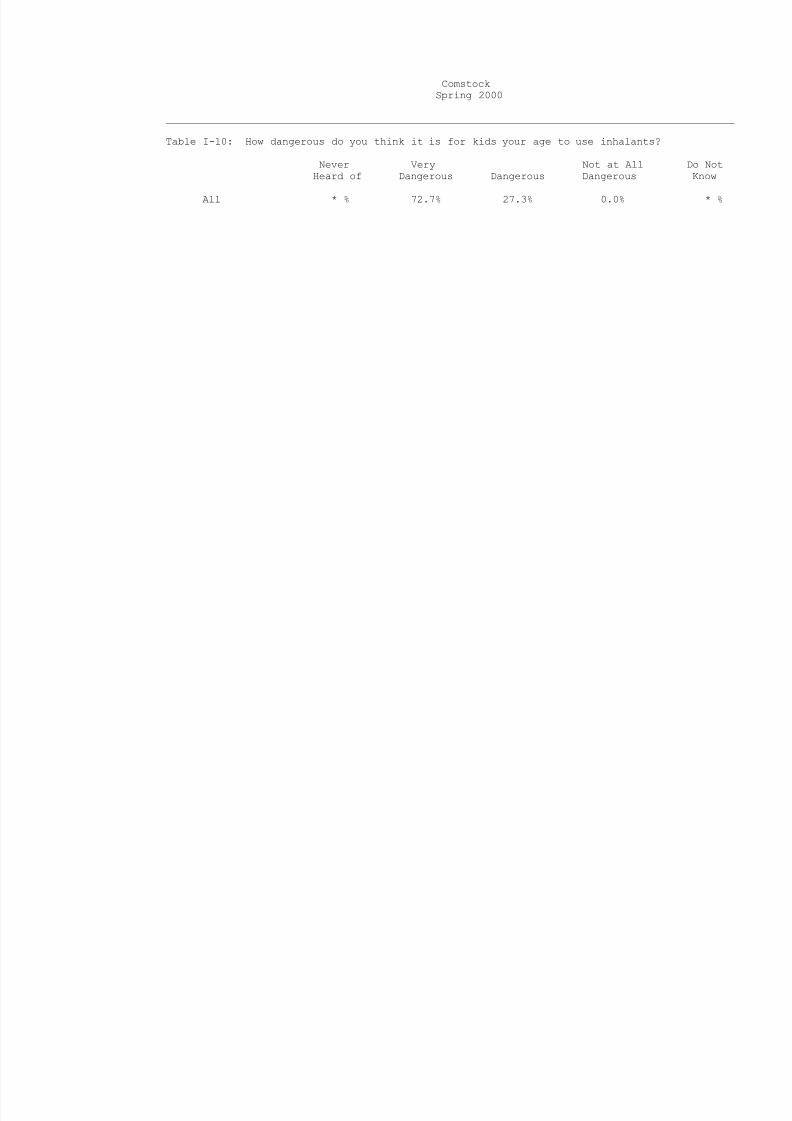
Table I-10: How dangerous do you think it is for kids your age to use inhalants?
Never Very Not at All Do NotHeard of Dangerous Dangerous Dangerous Know
All * % 72.7% 27.3% 0.0% * %

7/30/2019 2000 _ val verde county _ comstock isd _ 2000 texas school survey of drug and alcohol use _ elementary report
http://slidepdf.com/reader/full/2000-val-verde-county-comstock-isd-2000-texas-school-survey-of-drug-and 17/48
7/30/2019 2000 _ val verde county _ comstock isd _ 2000 texas school survey of drug and alcohol use _ elementary report
http://slidepdf.com/reader/full/2000-val-verde-county-comstock-isd-2000-texas-school-survey-of-drug-and 18/48
ComstockSpring 2000
______________________________________________________________________________________________
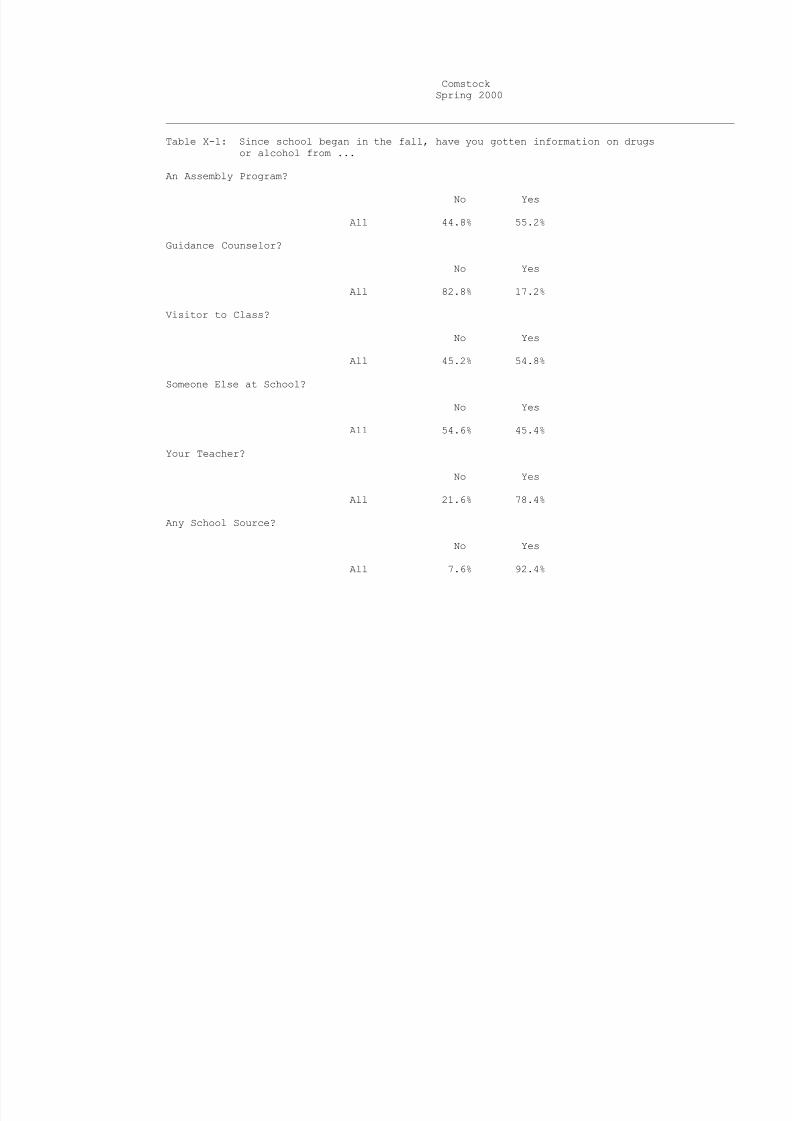
Table X-1: Since school began in the fall, have you gotten information on drugsor alcohol from ...
An Assembly Program?
No Yes
All 44.8% 55.2%
Guidance Counselor?
No Yes
All 82.8% 17.2%
Visitor to Class?
No Yes
All 45.2% 54.8%
Someone Else at School?
No Yes
All 54.6% 45.4%
Your Teacher?
No Yes
All 21.6% 78.4%
Any School Source?
No Yes
All 7.6% 92.4%

7/30/2019 2000 _ val verde county _ comstock isd _ 2000 texas school survey of drug and alcohol use _ elementary report
http://slidepdf.com/reader/full/2000-val-verde-county-comstock-isd-2000-texas-school-survey-of-drug-and 19/48
7/30/2019 2000 _ val verde county _ comstock isd _ 2000 texas school survey of drug and alcohol use _ elementary report
http://slidepdf.com/reader/full/2000-val-verde-county-comstock-isd-2000-texas-school-survey-of-drug-and 20/48
ComstockSpring 2000
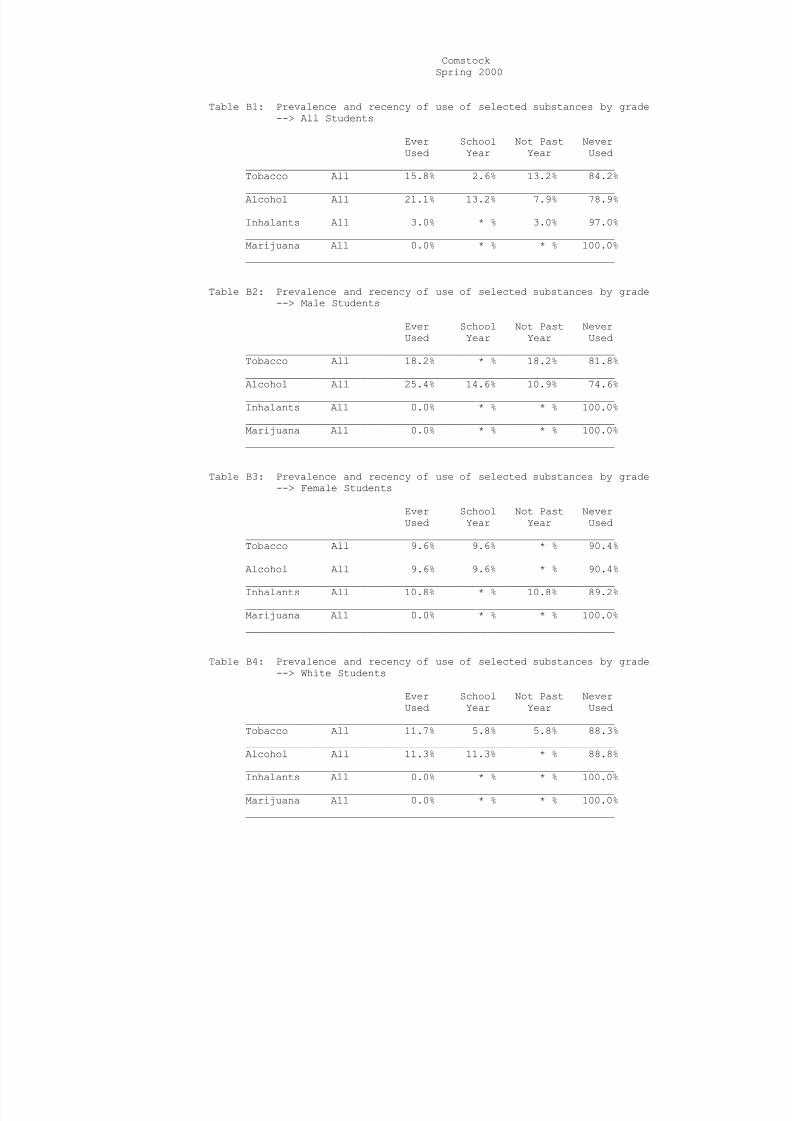
Table B1: Prevalence and recency of use of selected substances by grade--> All Students
Ever School Not Past NeverUsed Year Year Used
_____________________________________________________________Tobacco All 15.8% 2.6% 13.2% 84.2%_____________________________________________________________Alcohol All 21.1% 13.2% 7.9% 78.9%_____________________________________________________________Inhalants All 3.0% * % 3.0% 97.0%_____________________________________________________________Marijuana All 0.0% * % * % 100.0%_____________________________________________________________
Table B2: Prevalence and recency of use of selected substances by grade--> Male Students
Ever School Not Past NeverUsed Year Year Used
_____________________________________________________________Tobacco All 18.2% * % 18.2% 81.8%_____________________________________________________________Alcohol All 25.4% 14.6% 10.9% 74.6%_____________________________________________________________Inhalants All 0.0% * % * % 100.0%_____________________________________________________________Marijuana All 0.0% * % * % 100.0%_____________________________________________________________
Table B3: Prevalence and recency of use of selected substances by grade--> Female Students
Ever School Not Past NeverUsed Year Year Used
_____________________________________________________________Tobacco All 9.6% 9.6% * % 90.4%_____________________________________________________________Alcohol All 9.6% 9.6% * % 90.4%
_____________________________________________________________Inhalants All 10.8% * % 10.8% 89.2%_____________________________________________________________Marijuana All 0.0% * % * % 100.0%_____________________________________________________________
Table B4: Prevalence and recency of use of selected substances by grade--> White Students
Ever School Not Past NeverUsed Year Year Used
_____________________________________________________________Tobacco All 11.7% 5.8% 5.8% 88.3%_____________________________________________________________Alcohol All 11.3% 11.3% * % 88.8%_____________________________________________________________
Inhalants All 0.0% * % * % 100.0%_____________________________________________________________Marijuana All 0.0% * % * % 100.0%_____________________________________________________________
7/30/2019 2000 _ val verde county _ comstock isd _ 2000 texas school survey of drug and alcohol use _ elementary report
http://slidepdf.com/reader/full/2000-val-verde-county-comstock-isd-2000-texas-school-survey-of-drug-and 21/48
ComstockSpring 2000
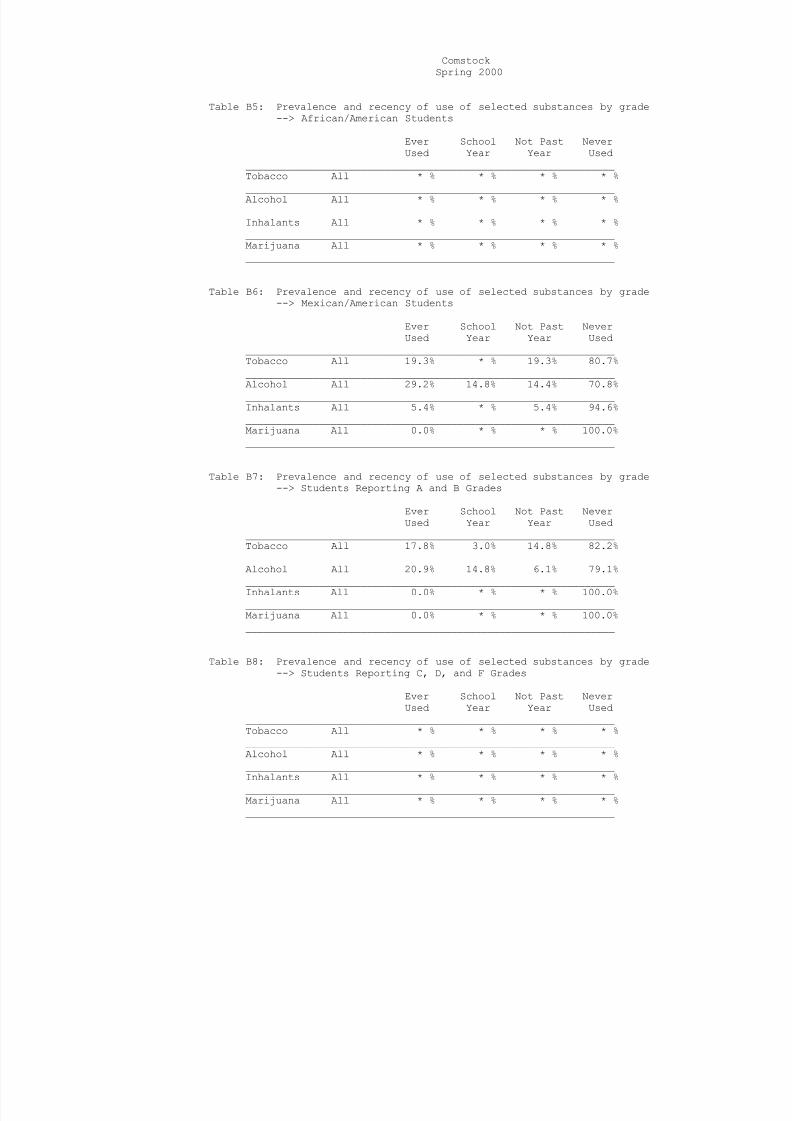
Table B5: Prevalence and recency of use of selected substances by grade--> African/American Students
Ever School Not Past NeverUsed Year Year Used
_____________________________________________________________Tobacco All * % * % * % * %_____________________________________________________________Alcohol All * % * % * % * %_____________________________________________________________Inhalants All * % * % * % * %_____________________________________________________________Marijuana All * % * % * % * %_____________________________________________________________
Table B6: Prevalence and recency of use of selected substances by grade--> Mexican/American Students
Ever School Not Past NeverUsed Year Year Used
_____________________________________________________________Tobacco All 19.3% * % 19.3% 80.7%_____________________________________________________________Alcohol All 29.2% 14.8% 14.4% 70.8%_____________________________________________________________Inhalants All 5.4% * % 5.4% 94.6%_____________________________________________________________Marijuana All 0.0% * % * % 100.0%_____________________________________________________________
Table B7: Prevalence and recency of use of selected substances by grade--> Students Reporting A and B Grades
Ever School Not Past NeverUsed Year Year Used
_____________________________________________________________Tobacco All 17.8% 3.0% 14.8% 82.2%_____________________________________________________________Alcohol All 20.9% 14.8% 6.1% 79.1%
_____________________________________________________________Inhalants All 0.0% * % * % 100.0%_____________________________________________________________Marijuana All 0.0% * % * % 100.0%_____________________________________________________________
Table B8: Prevalence and recency of use of selected substances by grade--> Students Reporting C, D, and F Grades
Ever School Not Past NeverUsed Year Year Used
_____________________________________________________________Tobacco All * % * % * % * %_____________________________________________________________Alcohol All * % * % * % * %_____________________________________________________________
Inhalants All * % * % * % * %_____________________________________________________________Marijuana All * % * % * % * %_____________________________________________________________
7/30/2019 2000 _ val verde county _ comstock isd _ 2000 texas school survey of drug and alcohol use _ elementary report
http://slidepdf.com/reader/full/2000-val-verde-county-comstock-isd-2000-texas-school-survey-of-drug-and 22/48
ComstockSpring 2000
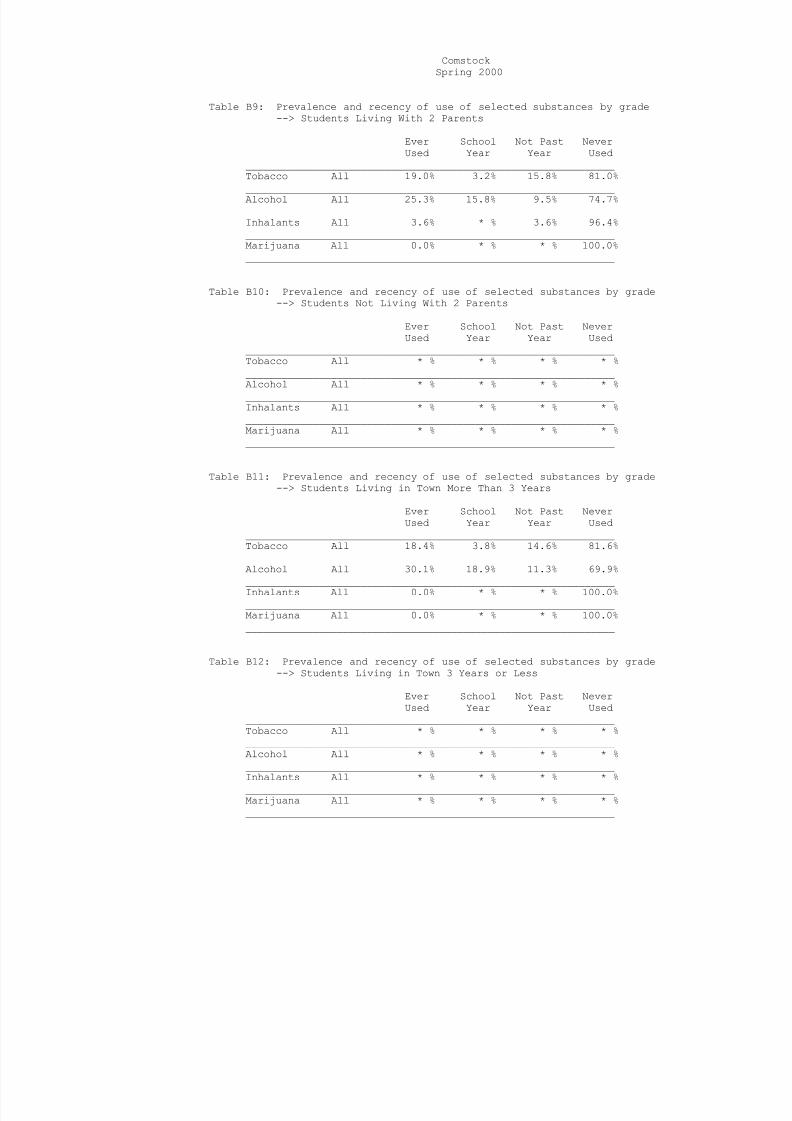
Table B9: Prevalence and recency of use of selected substances by grade--> Students Living With 2 Parents
Ever School Not Past NeverUsed Year Year Used
_____________________________________________________________Tobacco All 19.0% 3.2% 15.8% 81.0%_____________________________________________________________Alcohol All 25.3% 15.8% 9.5% 74.7%_____________________________________________________________Inhalants All 3.6% * % 3.6% 96.4%_____________________________________________________________Marijuana All 0.0% * % * % 100.0%_____________________________________________________________
Table B10: Prevalence and recency of use of selected substances by grade--> Students Not Living With 2 Parents
Ever School Not Past NeverUsed Year Year Used
_____________________________________________________________Tobacco All * % * % * % * %_____________________________________________________________Alcohol All * % * % * % * %_____________________________________________________________Inhalants All * % * % * % * %_____________________________________________________________Marijuana All * % * % * % * %_____________________________________________________________
Table B11: Prevalence and recency of use of selected substances by grade--> Students Living in Town More Than 3 Years
Ever School Not Past NeverUsed Year Year Used
_____________________________________________________________Tobacco All 18.4% 3.8% 14.6% 81.6%_____________________________________________________________Alcohol All 30.1% 18.9% 11.3% 69.9%
_____________________________________________________________Inhalants All 0.0% * % * % 100.0%_____________________________________________________________Marijuana All 0.0% * % * % 100.0%_____________________________________________________________
Table B12: Prevalence and recency of use of selected substances by grade--> Students Living in Town 3 Years or Less
Ever School Not Past NeverUsed Year Year Used
_____________________________________________________________Tobacco All * % * % * % * %_____________________________________________________________Alcohol All * % * % * % * %_____________________________________________________________
Inhalants All * % * % * % * %_____________________________________________________________Marijuana All * % * % * % * %_____________________________________________________________
7/30/2019 2000 _ val verde county _ comstock isd _ 2000 texas school survey of drug and alcohol use _ elementary report
http://slidepdf.com/reader/full/2000-val-verde-county-comstock-isd-2000-texas-school-survey-of-drug-and 23/48
ComstockSpring 2000
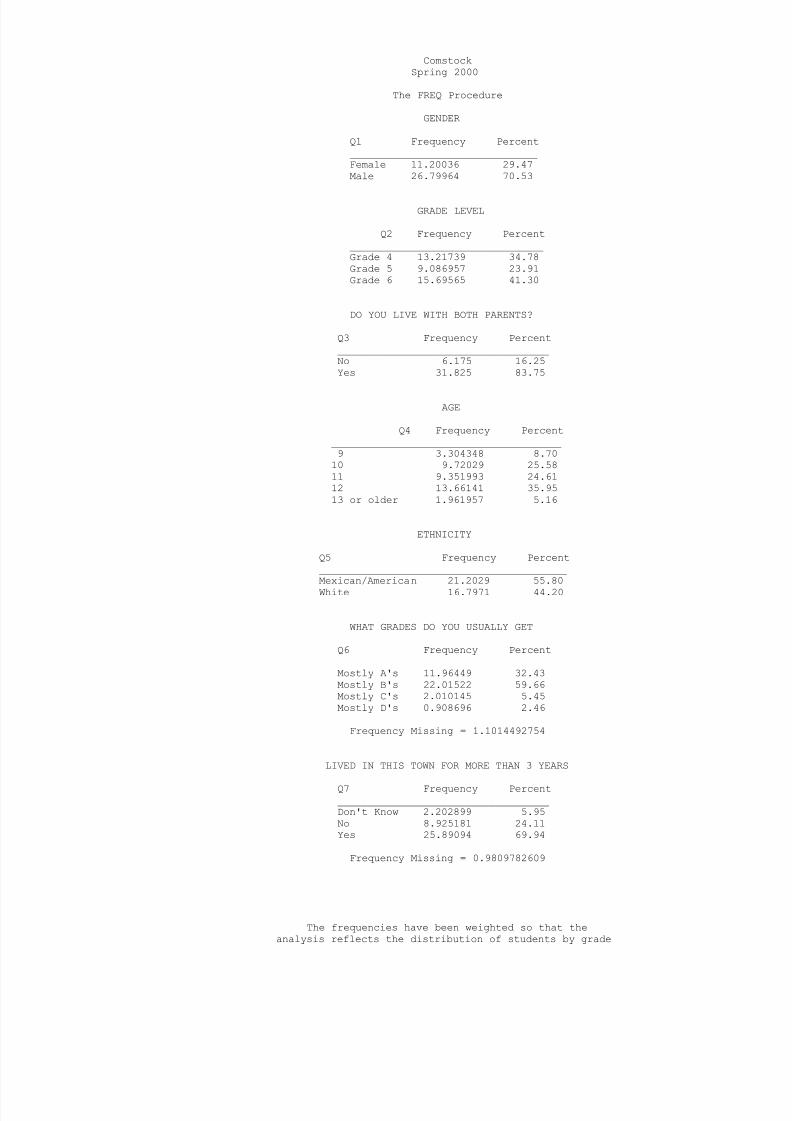
The FREQ Procedure
GENDER
Q1 Frequency Percent_______________________________Female 11.20036 29.47Male 26.79964 70.53
GRADE LEVEL
Q2 Frequency Percent________________________________Grade 4 13.21739 34.78Grade 5 9.086957 23.91Grade 6 15.69565 41.30
DO YOU LIVE WITH BOTH PARENTS?
Q3 Frequency Percent___________________________________No 6.175 16.25Yes 31.825 83.75
AGE
Q4 Frequency Percent______________________________________9 3.304348 8.7010 9.72029 25.5811 9.351993 24.6112 13.66141 35.9513 or older 1.961957 5.16
ETHNICITY
Q5 Frequency Percent_________________________________________
Mexican/American 21.2029 55.80White 16.7971 44.20
WHAT GRADES DO YOU USUALLY GET
Q6 Frequency Percent___________________________________Mostly A's 11.96449 32.43Mostly B's 22.01522 59.66Mostly C's 2.010145 5.45Mostly D's 0.908696 2.46
Frequency Missing = 1.1014492754
LIVED IN THIS TOWN FOR MORE THAN 3 YEARS
Q7 Frequency Percent___________________________________Don't Know 2.202899 5.95No 8.925181 24.11Yes 25.89094 69.94
Frequency Missing = 0.9809782609
The frequencies have been weighted so that theanalysis reflects the distribution of students by grade

7/30/2019 2000 _ val verde county _ comstock isd _ 2000 texas school survey of drug and alcohol use _ elementary report
http://slidepdf.com/reader/full/2000-val-verde-county-comstock-isd-2000-texas-school-survey-of-drug-and 24/48
level in the district
7/30/2019 2000 _ val verde county _ comstock isd _ 2000 texas school survey of drug and alcohol use _ elementary report
http://slidepdf.com/reader/full/2000-val-verde-county-comstock-isd-2000-texas-school-survey-of-drug-and 25/48
ComstockSpring 2000
The FREQ Procedure
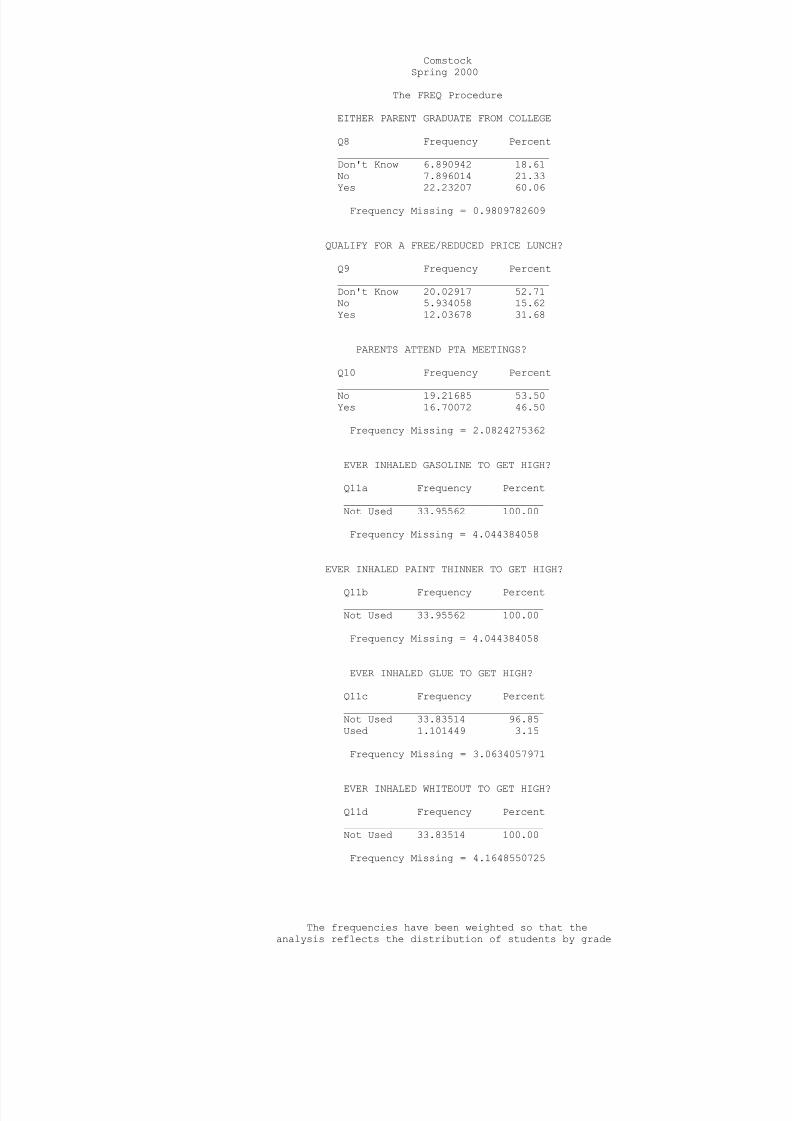
EITHER PARENT GRADUATE FROM COLLEGE
Q8 Frequency Percent___________________________________Don't Know 6.890942 18.61No 7.896014 21.33Yes 22.23207 60.06
Frequency Missing = 0.9809782609
QUALIFY FOR A FREE/REDUCED PRICE LUNCH?
Q9 Frequency Percent___________________________________Don't Know 20.02917 52.71No 5.934058 15.62Yes 12.03678 31.68
PARENTS ATTEND PTA MEETINGS?
Q10 Frequency Percent___________________________________No 19.21685 53.50Yes 16.70072 46.50
Frequency Missing = 2.0824275362
EVER INHALED GASOLINE TO GET HIGH?
Q11a Frequency Percent_________________________________Not Used 33.95562 100.00
Frequency Missing = 4.044384058
EVER INHALED PAINT THINNER TO GET HIGH?
Q11b Frequency Percent_________________________________Not Used 33.95562 100.00
Frequency Missing = 4.044384058
EVER INHALED GLUE TO GET HIGH?
Q11c Frequency Percent_________________________________Not Used 33.83514 96.85Used 1.101449 3.15
Frequency Missing = 3.0634057971
EVER INHALED WHITEOUT TO GET HIGH?
Q11d Frequency Percent_________________________________Not Used 33.83514 100.00
Frequency Missing = 4.1648550725
The frequencies have been weighted so that theanalysis reflects the distribution of students by grade

7/30/2019 2000 _ val verde county _ comstock isd _ 2000 texas school survey of drug and alcohol use _ elementary report
http://slidepdf.com/reader/full/2000-val-verde-county-comstock-isd-2000-texas-school-survey-of-drug-and 26/48
level in the district
7/30/2019 2000 _ val verde county _ comstock isd _ 2000 texas school survey of drug and alcohol use _ elementary report
http://slidepdf.com/reader/full/2000-val-verde-county-comstock-isd-2000-texas-school-survey-of-drug-and 27/48
ComstockSpring 2000
The FREQ Procedure
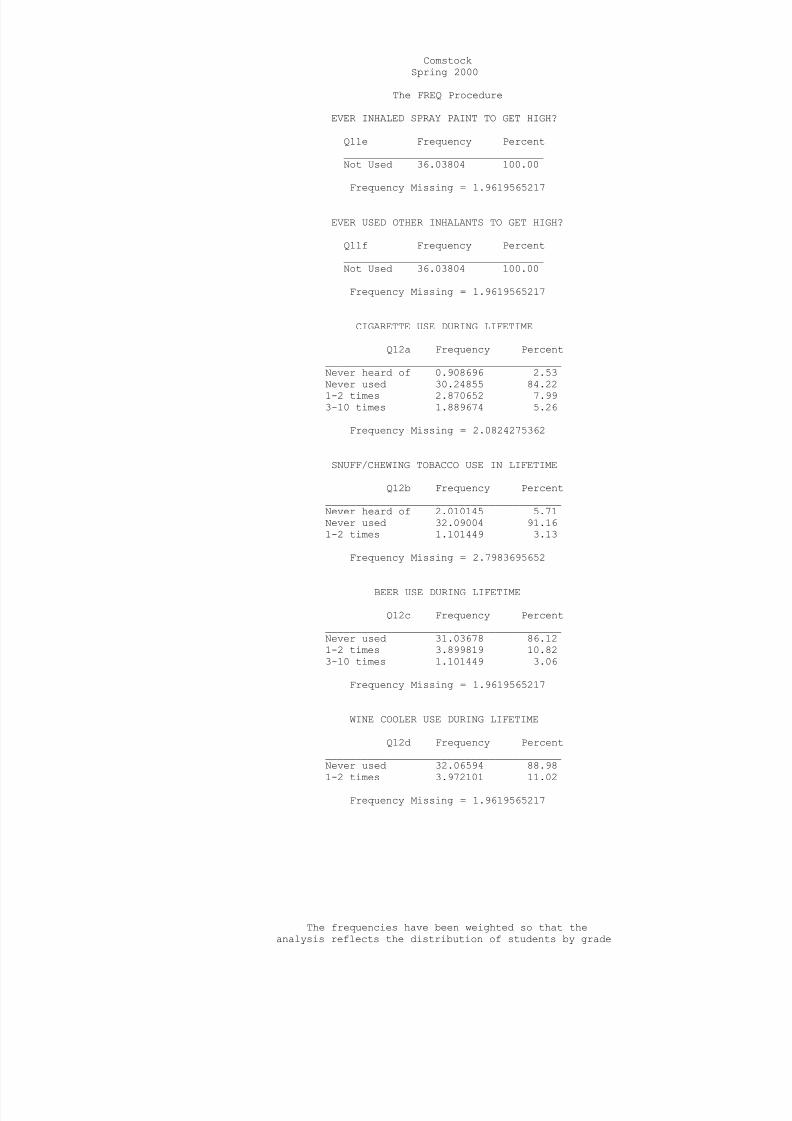
EVER INHALED SPRAY PAINT TO GET HIGH?
Q11e Frequency Percent_________________________________Not Used 36.03804 100.00
Frequency Missing = 1.9619565217
EVER USED OTHER INHALANTS TO GET HIGH?
Q11f Frequency Percent_________________________________Not Used 36.03804 100.00
Frequency Missing = 1.9619565217
CIGARETTE USE DURING LIFETIME
Q12a Frequency Percent_______________________________________Never heard of 0.908696 2.53Never used 30.24855 84.221-2 times 2.870652 7.993-10 times 1.889674 5.26
Frequency Missing = 2.0824275362
SNUFF/CHEWING TOBACCO USE IN LIFETIME
Q12b Frequency Percent_______________________________________Never heard of 2.010145 5.71Never used 32.09004 91.161-2 times 1.101449 3.13
Frequency Missing = 2.7983695652
BEER USE DURING LIFETIME
Q12c Frequency Percent_______________________________________Never used 31.03678 86.121-2 times 3.899819 10.823-10 times 1.101449 3.06
Frequency Missing = 1.9619565217
WINE COOLER USE DURING LIFETIME
Q12d Frequency Percent_______________________________________Never used 32.06594 88.98
1-2 times 3.972101 11.02
Frequency Missing = 1.9619565217
The frequencies have been weighted so that theanalysis reflects the distribution of students by grade

7/30/2019 2000 _ val verde county _ comstock isd _ 2000 texas school survey of drug and alcohol use _ elementary report
http://slidepdf.com/reader/full/2000-val-verde-county-comstock-isd-2000-texas-school-survey-of-drug-and 28/48
level in the district
7/30/2019 2000 _ val verde county _ comstock isd _ 2000 texas school survey of drug and alcohol use _ elementary report
http://slidepdf.com/reader/full/2000-val-verde-county-comstock-isd-2000-texas-school-survey-of-drug-and 29/48
ComstockSpring 2000
The FREQ Procedure
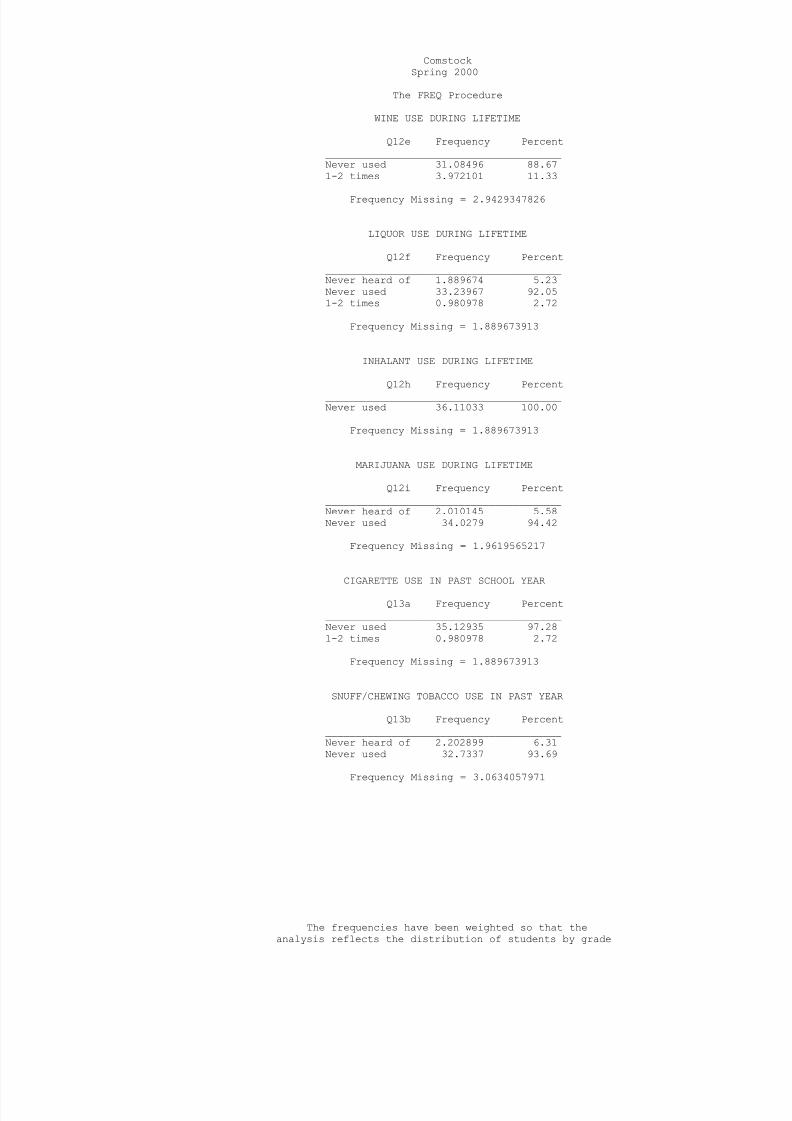
WINE USE DURING LIFETIME
Q12e Frequency Percent_______________________________________Never used 31.08496 88.671-2 times 3.972101 11.33
Frequency Missing = 2.9429347826
LIQUOR USE DURING LIFETIME
Q12f Frequency Percent_______________________________________Never heard of 1.889674 5.23Never used 33.23967 92.051-2 times 0.980978 2.72
Frequency Missing = 1.889673913
INHALANT USE DURING LIFETIME
Q12h Frequency Percent_______________________________________Never used 36.11033 100.00
Frequency Missing = 1.889673913
MARIJUANA USE DURING LIFETIME
Q12i Frequency Percent_______________________________________Never heard of 2.010145 5.58Never used 34.0279 94.42
Frequency Missing = 1.9619565217
CIGARETTE USE IN PAST SCHOOL YEAR Q13a Frequency Percent
_______________________________________Never used 35.12935 97.281-2 times 0.980978 2.72
Frequency Missing = 1.889673913
SNUFF/CHEWING TOBACCO USE IN PAST YEAR
Q13b Frequency Percent_______________________________________Never heard of 2.202899 6.31Never used 32.7337 93.69
Frequency Missing = 3.0634057971
The frequencies have been weighted so that theanalysis reflects the distribution of students by grade

7/30/2019 2000 _ val verde county _ comstock isd _ 2000 texas school survey of drug and alcohol use _ elementary report
http://slidepdf.com/reader/full/2000-val-verde-county-comstock-isd-2000-texas-school-survey-of-drug-and 30/48
level in the district
7/30/2019 2000 _ val verde county _ comstock isd _ 2000 texas school survey of drug and alcohol use _ elementary report
http://slidepdf.com/reader/full/2000-val-verde-county-comstock-isd-2000-texas-school-survey-of-drug-and 31/48
ComstockSpring 2000
The FREQ Procedure
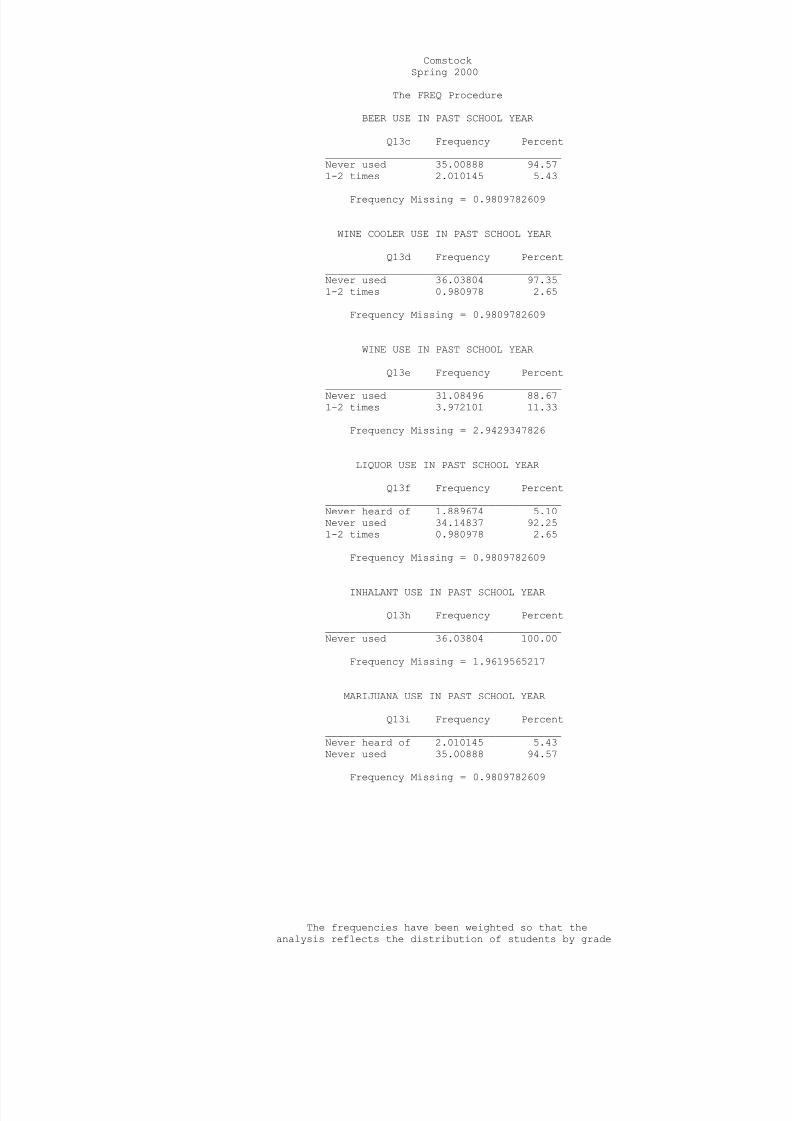
BEER USE IN PAST SCHOOL YEAR
Q13c Frequency Percent_______________________________________Never used 35.00888 94.571-2 times 2.010145 5.43
Frequency Missing = 0.9809782609
WINE COOLER USE IN PAST SCHOOL YEAR
Q13d Frequency Percent_______________________________________Never used 36.03804 97.351-2 times 0.980978 2.65
Frequency Missing = 0.9809782609
WINE USE IN PAST SCHOOL YEAR
Q13e Frequency Percent_______________________________________Never used 31.08496 88.671-2 times 3.972101 11.33
Frequency Missing = 2.9429347826
LIQUOR USE IN PAST SCHOOL YEAR
Q13f Frequency Percent_______________________________________Never heard of 1.889674 5.10Never used 34.14837 92.251-2 times 0.980978 2.65
Frequency Missing = 0.9809782609
INHALANT USE IN PAST SCHOOL YEAR
Q13h Frequency Percent_______________________________________Never used 36.03804 100.00
Frequency Missing = 1.9619565217
MARIJUANA USE IN PAST SCHOOL YEAR
Q13i Frequency Percent_______________________________________Never heard of 2.010145 5.43Never used 35.00888 94.57
Frequency Missing = 0.9809782609
The frequencies have been weighted so that theanalysis reflects the distribution of students by grade

7/30/2019 2000 _ val verde county _ comstock isd _ 2000 texas school survey of drug and alcohol use _ elementary report
http://slidepdf.com/reader/full/2000-val-verde-county-comstock-isd-2000-texas-school-survey-of-drug-and 32/48
level in the district
7/30/2019 2000 _ val verde county _ comstock isd _ 2000 texas school survey of drug and alcohol use _ elementary report
http://slidepdf.com/reader/full/2000-val-verde-county-comstock-isd-2000-texas-school-survey-of-drug-and 33/48
ComstockSpring 2000
The FREQ Procedure
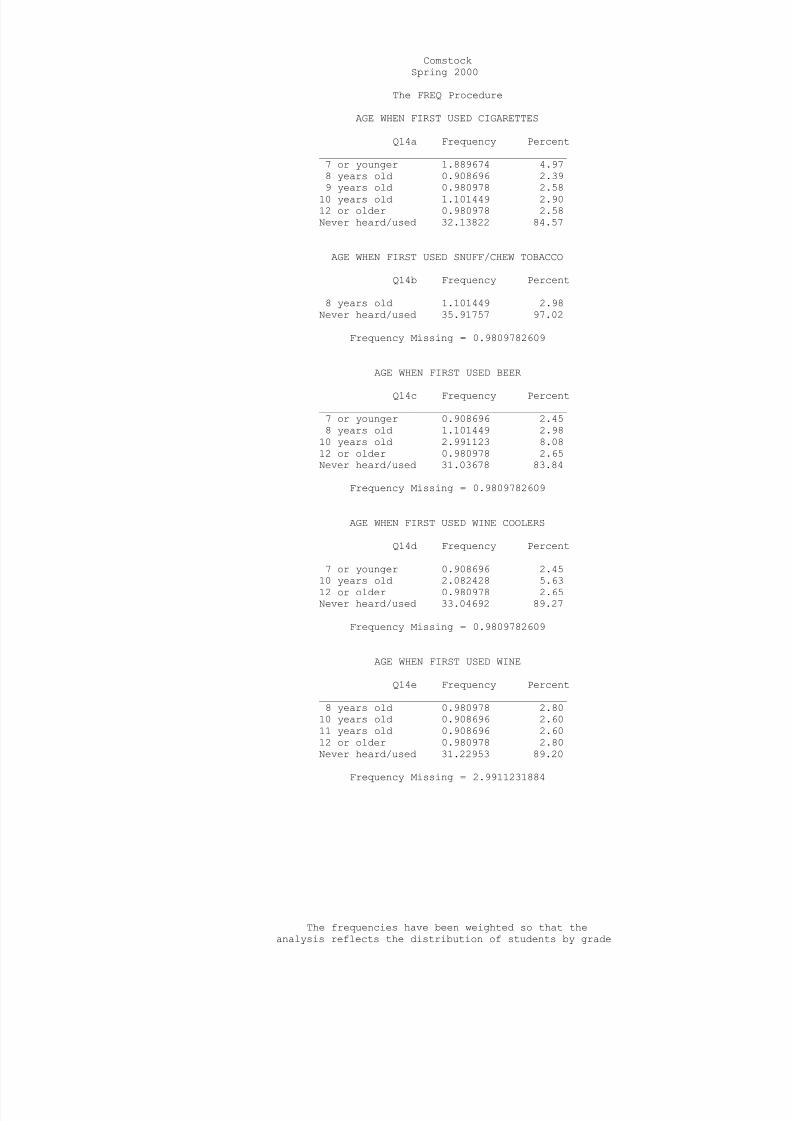
AGE WHEN FIRST USED CIGARETTES
Q14a Frequency Percent_________________________________________7 or younger 1.889674 4.978 years old 0.908696 2.399 years old 0.980978 2.58
10 years old 1.101449 2.9012 or older 0.980978 2.58Never heard/used 32.13822 84.57
AGE WHEN FIRST USED SNUFF/CHEW TOBACCO
Q14b Frequency Percent_________________________________________8 years old 1.101449 2.98
Never heard/used 35.91757 97.02
Frequency Missing = 0.9809782609
AGE WHEN FIRST USED BEER
Q14c Frequency Percent_________________________________________7 or younger 0.908696 2.458 years old 1.101449 2.98
10 years old 2.991123 8.0812 or older 0.980978 2.65Never heard/used 31.03678 83.84
Frequency Missing = 0.9809782609
AGE WHEN FIRST USED WINE COOLERS
Q14d Frequency Percent_________________________________________7 or younger 0.908696 2.45
10 years old 2.082428 5.6312 or older 0.980978 2.65Never heard/used 33.04692 89.27
Frequency Missing = 0.9809782609
AGE WHEN FIRST USED WINE
Q14e Frequency Percent_________________________________________8 years old 0.980978 2.80
10 years old 0.908696 2.6011 years old 0.908696 2.6012 or older 0.980978 2.80Never heard/used 31.22953 89.20
Frequency Missing = 2.9911231884
The frequencies have been weighted so that theanalysis reflects the distribution of students by grade

7/30/2019 2000 _ val verde county _ comstock isd _ 2000 texas school survey of drug and alcohol use _ elementary report
http://slidepdf.com/reader/full/2000-val-verde-county-comstock-isd-2000-texas-school-survey-of-drug-and 34/48
level in the district
7/30/2019 2000 _ val verde county _ comstock isd _ 2000 texas school survey of drug and alcohol use _ elementary report
http://slidepdf.com/reader/full/2000-val-verde-county-comstock-isd-2000-texas-school-survey-of-drug-and 35/48
ComstockSpring 2000
The FREQ Procedure
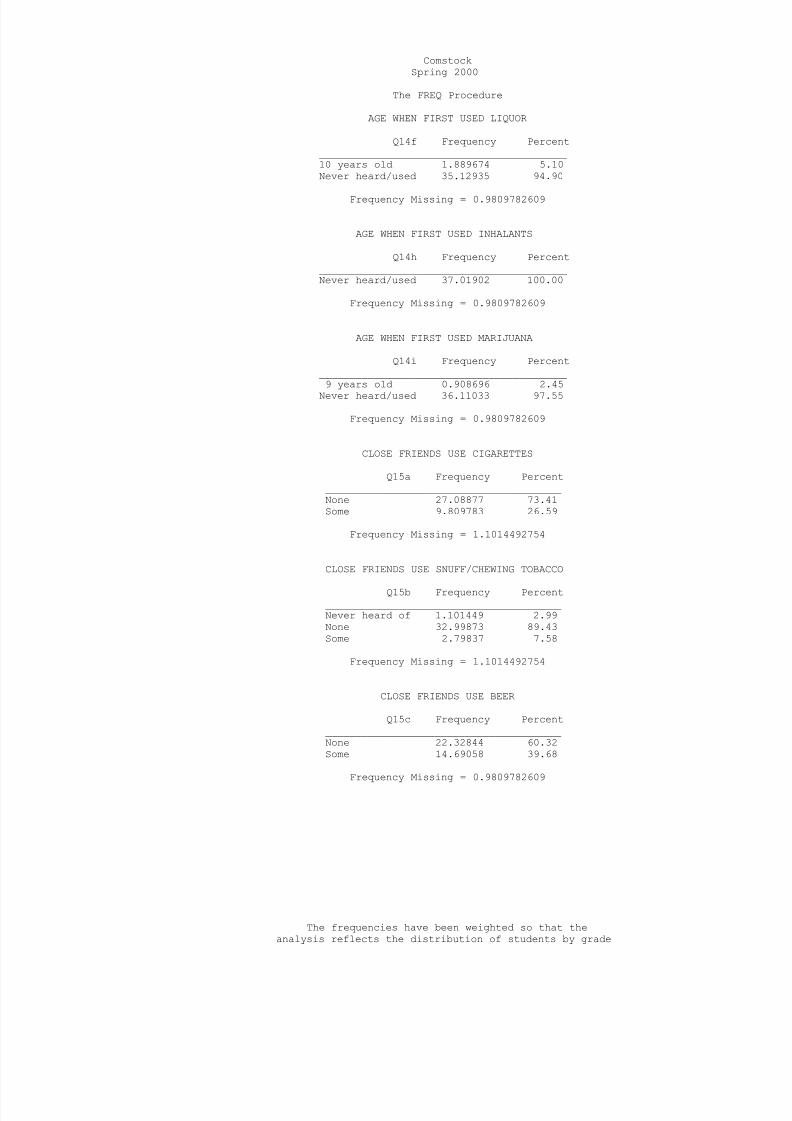
AGE WHEN FIRST USED LIQUOR
Q14f Frequency Percent_________________________________________10 years old 1.889674 5.10Never heard/used 35.12935 94.90
Frequency Missing = 0.9809782609
AGE WHEN FIRST USED INHALANTS
Q14h Frequency Percent_________________________________________Never heard/used 37.01902 100.00
Frequency Missing = 0.9809782609
AGE WHEN FIRST USED MARIJUANA
Q14i Frequency Percent_________________________________________9 years old 0.908696 2.45
Never heard/used 36.11033 97.55
Frequency Missing = 0.9809782609
CLOSE FRIENDS USE CIGARETTES
Q15a Frequency Percent_______________________________________None 27.08877 73.41Some 9.809783 26.59
Frequency Missing = 1.1014492754
CLOSE FRIENDS USE SNUFF/CHEWING TOBACCO
Q15b Frequency Percent_______________________________________Never heard of 1.101449 2.99None 32.99873 89.43Some 2.79837 7.58
Frequency Missing = 1.1014492754
CLOSE FRIENDS USE BEER
Q15c Frequency Percent_______________________________________None 22.32844 60.32Some 14.69058 39.68
Frequency Missing = 0.9809782609
The frequencies have been weighted so that theanalysis reflects the distribution of students by grade

7/30/2019 2000 _ val verde county _ comstock isd _ 2000 texas school survey of drug and alcohol use _ elementary report
http://slidepdf.com/reader/full/2000-val-verde-county-comstock-isd-2000-texas-school-survey-of-drug-and 36/48
level in the district
7/30/2019 2000 _ val verde county _ comstock isd _ 2000 texas school survey of drug and alcohol use _ elementary report
http://slidepdf.com/reader/full/2000-val-verde-county-comstock-isd-2000-texas-school-survey-of-drug-and 37/48
ComstockSpring 2000
The FREQ Procedure
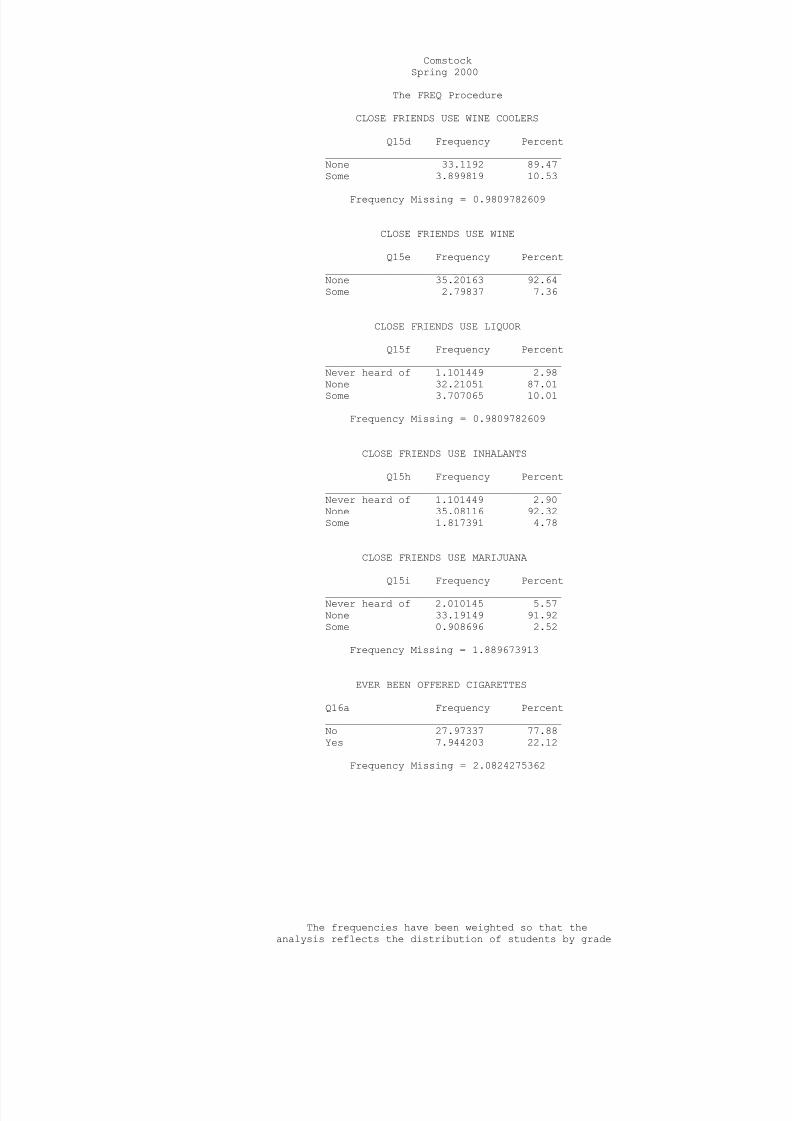
CLOSE FRIENDS USE WINE COOLERS
Q15d Frequency Percent_______________________________________None 33.1192 89.47Some 3.899819 10.53
Frequency Missing = 0.9809782609
CLOSE FRIENDS USE WINE
Q15e Frequency Percent_______________________________________None 35.20163 92.64Some 2.79837 7.36
CLOSE FRIENDS USE LIQUOR
Q15f Frequency Percent_______________________________________Never heard of 1.101449 2.98None 32.21051 87.01Some 3.707065 10.01
Frequency Missing = 0.9809782609
CLOSE FRIENDS USE INHALANTS
Q15h Frequency Percent_______________________________________Never heard of 1.101449 2.90None 35.08116 92.32Some 1.817391 4.78
CLOSE FRIENDS USE MARIJUANA
Q15i Frequency Percent_______________________________________Never heard of 2.010145 5.57None 33.19149 91.92Some 0.908696 2.52
Frequency Missing = 1.889673913
EVER BEEN OFFERED CIGARETTES
Q16a Frequency Percent_______________________________________No 27.97337 77.88Yes 7.944203 22.12
Frequency Missing = 2.0824275362
The frequencies have been weighted so that theanalysis reflects the distribution of students by grade

7/30/2019 2000 _ val verde county _ comstock isd _ 2000 texas school survey of drug and alcohol use _ elementary report
http://slidepdf.com/reader/full/2000-val-verde-county-comstock-isd-2000-texas-school-survey-of-drug-and 38/48
level in the district
7/30/2019 2000 _ val verde county _ comstock isd _ 2000 texas school survey of drug and alcohol use _ elementary report
http://slidepdf.com/reader/full/2000-val-verde-county-comstock-isd-2000-texas-school-survey-of-drug-and 39/48
ComstockSpring 2000
The FREQ Procedure
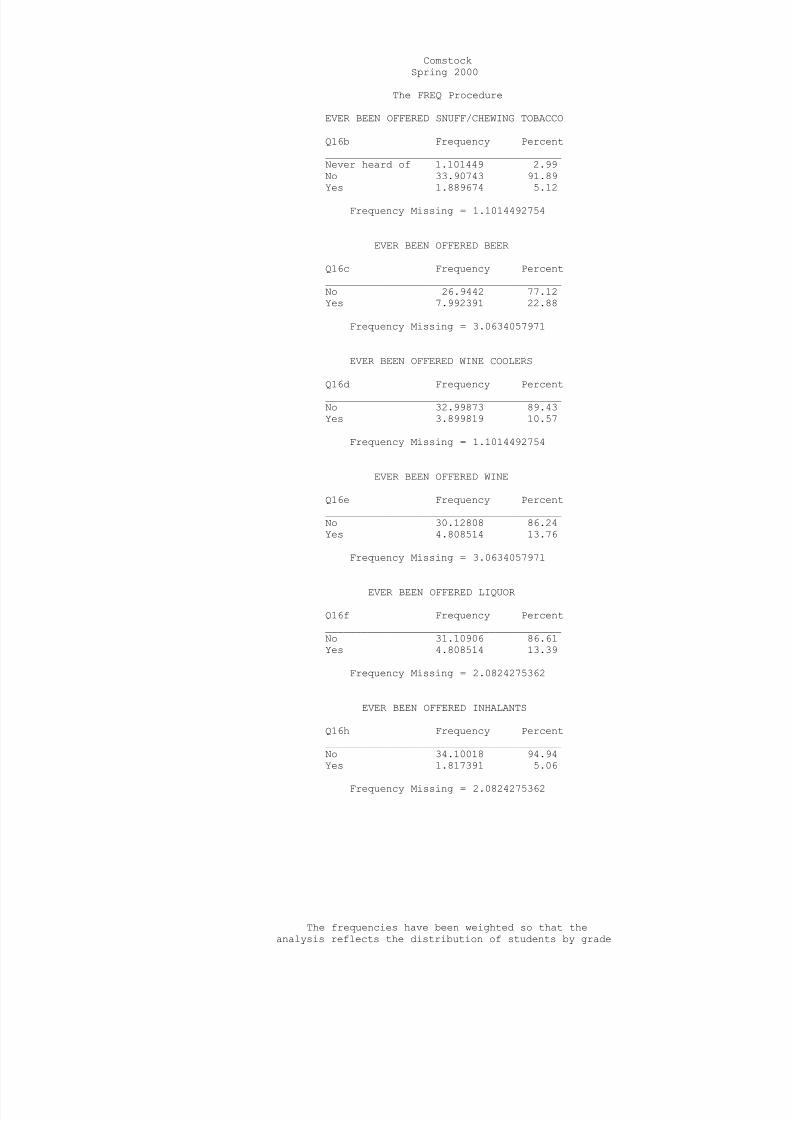
EVER BEEN OFFERED SNUFF/CHEWING TOBACCO
Q16b Frequency Percent_______________________________________Never heard of 1.101449 2.99No 33.90743 91.89Yes 1.889674 5.12
Frequency Missing = 1.1014492754
EVER BEEN OFFERED BEER
Q16c Frequency Percent_______________________________________No 26.9442 77.12Yes 7.992391 22.88
Frequency Missing = 3.0634057971
EVER BEEN OFFERED WINE COOLERS
Q16d Frequency Percent_______________________________________No 32.99873 89.43Yes 3.899819 10.57
Frequency Missing = 1.1014492754
EVER BEEN OFFERED WINE
Q16e Frequency Percent_______________________________________No 30.12808 86.24Yes 4.808514 13.76
Frequency Missing = 3.0634057971
EVER BEEN OFFERED LIQUOR
Q16f Frequency Percent_______________________________________No 31.10906 86.61Yes 4.808514 13.39
Frequency Missing = 2.0824275362
EVER BEEN OFFERED INHALANTS
Q16h Frequency Percent_______________________________________No 34.10018 94.94Yes 1.817391 5.06
Frequency Missing = 2.0824275362
The frequencies have been weighted so that theanalysis reflects the distribution of students by grade

7/30/2019 2000 _ val verde county _ comstock isd _ 2000 texas school survey of drug and alcohol use _ elementary report
http://slidepdf.com/reader/full/2000-val-verde-county-comstock-isd-2000-texas-school-survey-of-drug-and 40/48
level in the district
7/30/2019 2000 _ val verde county _ comstock isd _ 2000 texas school survey of drug and alcohol use _ elementary report
http://slidepdf.com/reader/full/2000-val-verde-county-comstock-isd-2000-texas-school-survey-of-drug-and 41/48
ComstockSpring 2000
The FREQ Procedure
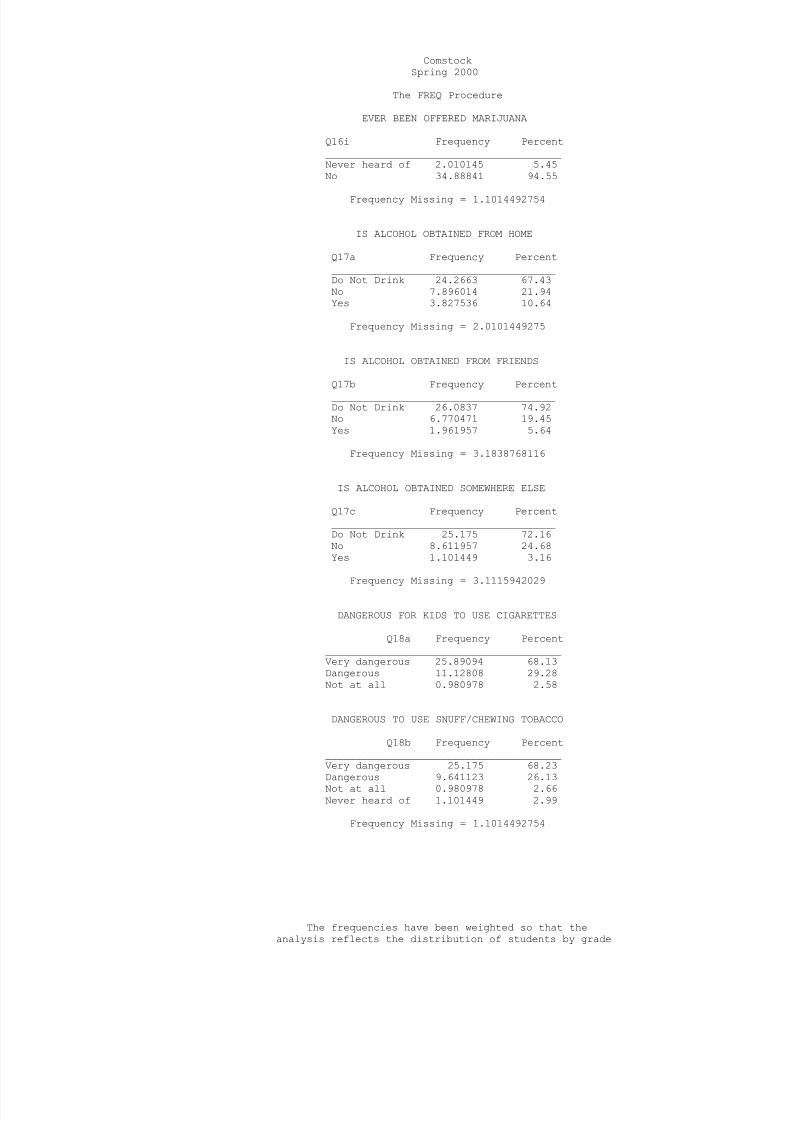
EVER BEEN OFFERED MARIJUANA
Q16i Frequency Percent_______________________________________Never heard of 2.010145 5.45No 34.88841 94.55
Frequency Missing = 1.1014492754
IS ALCOHOL OBTAINED FROM HOME
Q17a Frequency Percent_____________________________________Do Not Drink 24.2663 67.43No 7.896014 21.94Yes 3.827536 10.64
Frequency Missing = 2.0101449275
IS ALCOHOL OBTAINED FROM FRIENDS
Q17b Frequency Percent_____________________________________Do Not Drink 26.0837 74.92No 6.770471 19.45Yes 1.961957 5.64
Frequency Missing = 3.1838768116
IS ALCOHOL OBTAINED SOMEWHERE ELSE
Q17c Frequency Percent_____________________________________Do Not Drink 25.175 72.16No 8.611957 24.68Yes 1.101449 3.16
Frequency Missing = 3.1115942029
DANGEROUS FOR KIDS TO USE CIGARETTES
Q18a Frequency Percent_______________________________________Very dangerous 25.89094 68.13Dangerous 11.12808 29.28Not at all 0.980978 2.58
DANGEROUS TO USE SNUFF/CHEWING TOBACCO
Q18b Frequency Percent_______________________________________Very dangerous 25.175 68.23
Dangerous 9.641123 26.13Not at all 0.980978 2.66Never heard of 1.101449 2.99
Frequency Missing = 1.1014492754
The frequencies have been weighted so that theanalysis reflects the distribution of students by grade

7/30/2019 2000 _ val verde county _ comstock isd _ 2000 texas school survey of drug and alcohol use _ elementary report
http://slidepdf.com/reader/full/2000-val-verde-county-comstock-isd-2000-texas-school-survey-of-drug-and 42/48
level in the district
7/30/2019 2000 _ val verde county _ comstock isd _ 2000 texas school survey of drug and alcohol use _ elementary report
http://slidepdf.com/reader/full/2000-val-verde-county-comstock-isd-2000-texas-school-survey-of-drug-and 43/48
ComstockSpring 2000
The FREQ Procedure
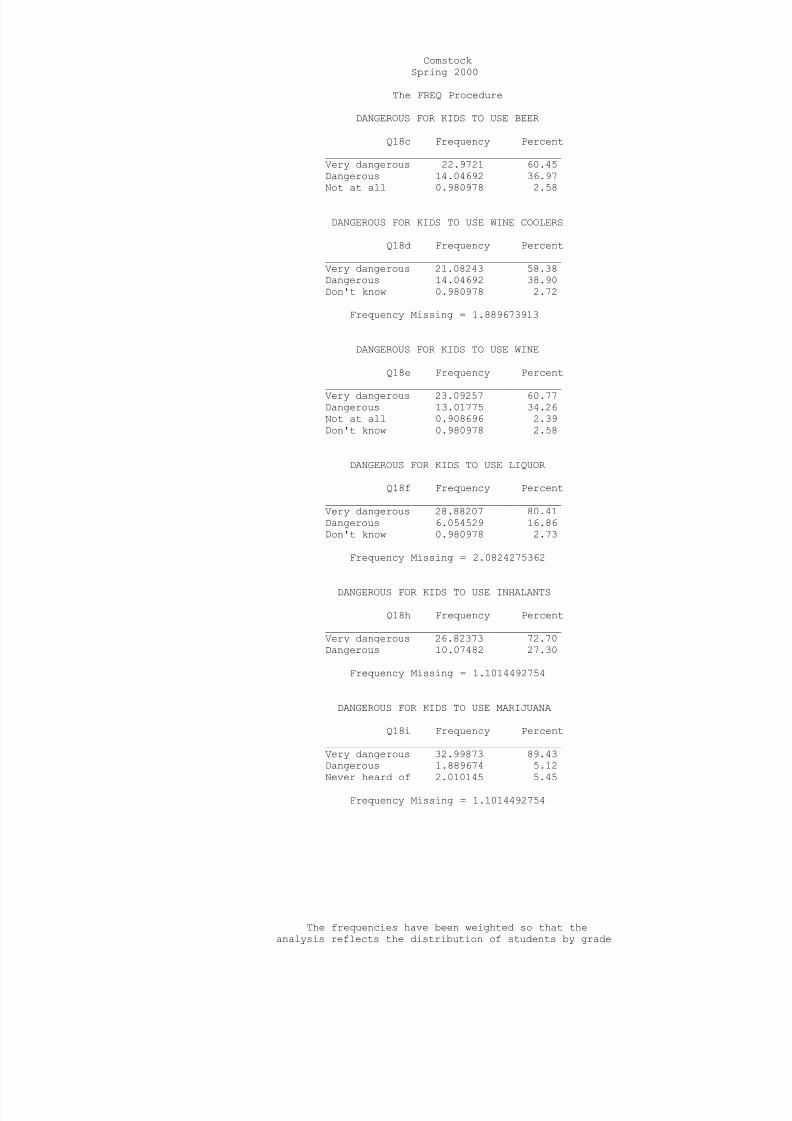
DANGEROUS FOR KIDS TO USE BEER
Q18c Frequency Percent_______________________________________Very dangerous 22.9721 60.45Dangerous 14.04692 36.97Not at all 0.980978 2.58
DANGEROUS FOR KIDS TO USE WINE COOLERS
Q18d Frequency Percent_______________________________________Very dangerous 21.08243 58.38Dangerous 14.04692 38.90Don't know 0.980978 2.72
Frequency Missing = 1.889673913
DANGEROUS FOR KIDS TO USE WINE
Q18e Frequency Percent_______________________________________Very dangerous 23.09257 60.77Dangerous 13.01775 34.26Not at all 0.908696 2.39Don't know 0.980978 2.58
DANGEROUS FOR KIDS TO USE LIQUOR
Q18f Frequency Percent_______________________________________Very dangerous 28.88207 80.41Dangerous 6.054529 16.86Don't know 0.980978 2.73
Frequency Missing = 2.0824275362
DANGEROUS FOR KIDS TO USE INHALANTS
Q18h Frequency Percent_______________________________________Very dangerous 26.82373 72.70Dangerous 10.07482 27.30
Frequency Missing = 1.1014492754
DANGEROUS FOR KIDS TO USE MARIJUANA
Q18i Frequency Percent_______________________________________Very dangerous 32.99873 89.43Dangerous 1.889674 5.12
Never heard of 2.010145 5.45
Frequency Missing = 1.1014492754
The frequencies have been weighted so that theanalysis reflects the distribution of students by grade

7/30/2019 2000 _ val verde county _ comstock isd _ 2000 texas school survey of drug and alcohol use _ elementary report
http://slidepdf.com/reader/full/2000-val-verde-county-comstock-isd-2000-texas-school-survey-of-drug-and 44/48
level in the district

7/30/2019 2000 _ val verde county _ comstock isd _ 2000 texas school survey of drug and alcohol use _ elementary report
http://slidepdf.com/reader/full/2000-val-verde-county-comstock-isd-2000-texas-school-survey-of-drug-and 45/48
ComstockSpring 2000
The FREQ Procedure
DRUG/ALCOHOL INFO FROM TEACHER
Q19a Frequency Percent___________________________________No 7.751449 21.58Yes 28.16612 78.42
Frequency Missing = 2.0824275362
DRUG/ALC INFO FROM VISITOR TO CLASS
Q19b Frequency Percent___________________________________No 16.67663 45.20Yes 20.22192 54.80
Frequency Missing = 1.1014492754
DRUG/ALC INFO FROM ASSEMBLY PROGRAM
Q19c Frequency Percent___________________________________No 15.14837 44.77Yes 18.68678 55.23
Frequency Missing = 4.1648550725
DRUG/ALC INFO FROM GUIDE COUNSELOR
Q19d Frequency Percent___________________________________No 27.92518 82.83Yes 5.789493 17.17
Frequency Missing = 4.285326087
DRUG/ALC INF FROM SOMEONE ELSE AT SCHOOL Q19e Frequency Percent___________________________________No 19.54728 54.61Yes 16.24982 45.39
Frequency Missing = 2.2028985507
BEER, TWO OR MORE AT ONE TIME
Q20a Frequency Percent_________________________________Never 31.10906 84.041 time 4.092572 11.062 times 1.817391 4.91
Frequency Missing = 0.9809782609
The frequencies have been weighted so that theanalysis reflects the distribution of students by grade

7/30/2019 2000 _ val verde county _ comstock isd _ 2000 texas school survey of drug and alcohol use _ elementary report
http://slidepdf.com/reader/full/2000-val-verde-county-comstock-isd-2000-texas-school-survey-of-drug-and 46/48
level in the district
7/30/2019 2000 _ val verde county _ comstock isd _ 2000 texas school survey of drug and alcohol use _ elementary report
http://slidepdf.com/reader/full/2000-val-verde-county-comstock-isd-2000-texas-school-survey-of-drug-and 47/48
ComstockSpring 2000
The FREQ Procedure
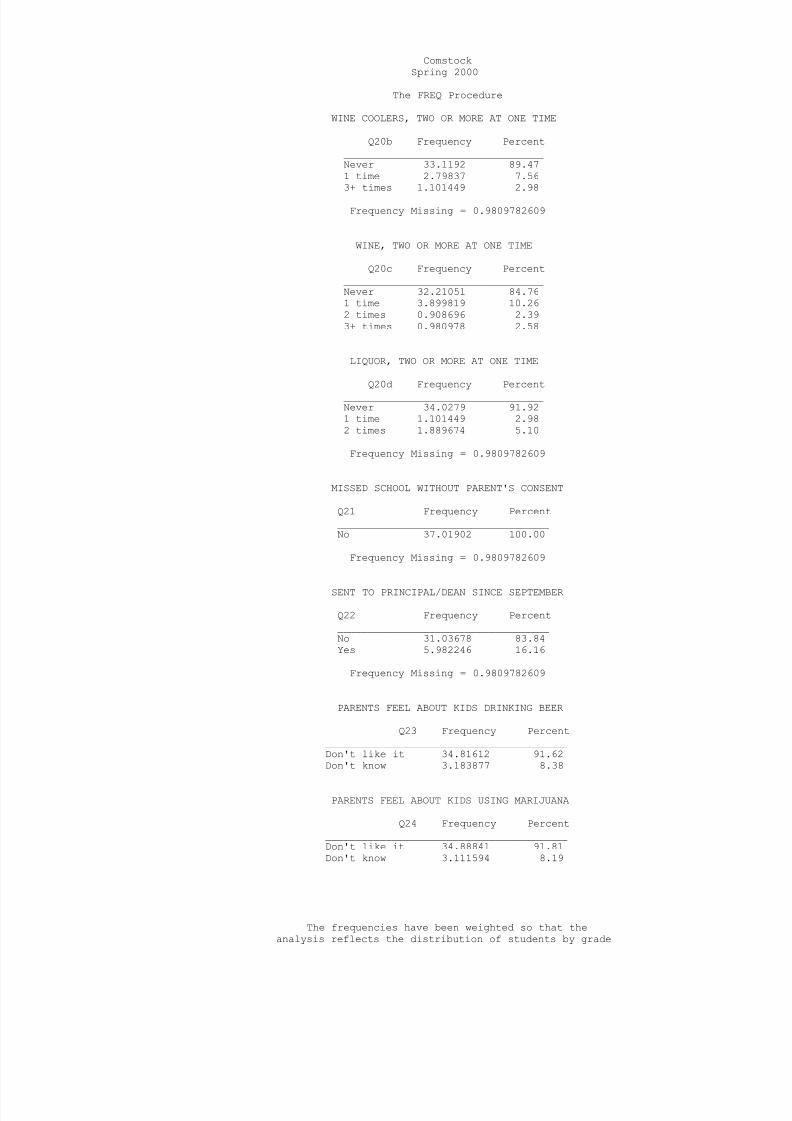
WINE COOLERS, TWO OR MORE AT ONE TIME
Q20b Frequency Percent_________________________________Never 33.1192 89.471 time 2.79837 7.563+ times 1.101449 2.98
Frequency Missing = 0.9809782609
WINE, TWO OR MORE AT ONE TIME
Q20c Frequency Percent_________________________________Never 32.21051 84.761 time 3.899819 10.262 times 0.908696 2.393+ times 0.980978 2.58
LIQUOR, TWO OR MORE AT ONE TIME
Q20d Frequency Percent_________________________________Never 34.0279 91.921 time 1.101449 2.982 times 1.889674 5.10
Frequency Missing = 0.9809782609
MISSED SCHOOL WITHOUT PARENT'S CONSENT
Q21 Frequency Percent___________________________________No 37.01902 100.00
Frequency Missing = 0.9809782609
SENT TO PRINCIPAL/DEAN SINCE SEPTEMBER
Q22 Frequency Percent___________________________________No 31.03678 83.84Yes 5.982246 16.16
Frequency Missing = 0.9809782609
PARENTS FEEL ABOUT KIDS DRINKING BEER
Q23 Frequency Percent________________________________________Don't like it 34.81612 91.62Don't know 3.183877 8.38
PARENTS FEEL ABOUT KIDS USING MARIJUANA
Q24 Frequency Percent________________________________________Don't like it 34.88841 91.81Don't know 3.111594 8.19
The frequencies have been weighted so that theanalysis reflects the distribution of students by grade

7/30/2019 2000 _ val verde county _ comstock isd _ 2000 texas school survey of drug and alcohol use _ elementary report
http://slidepdf.com/reader/full/2000-val-verde-county-comstock-isd-2000-texas-school-survey-of-drug-and 48/48
level in the district
![RocksDB and MongoRocks - Percona · PDF filefile format (data block) aaaaaaa : val aaaaaab : val aaaaaac : val aabaaaa : val aabaaax : val aaaaaaa : val [6]b : val [6]c : val [2]baaaa](https://img.pdfslide.us/doc/110x75/5a78a2407f8b9a87198e3d9a/rocksdb-and-mongorocks-percona-format-data-block-aaaaaaa-val-aaaaaab-val.jpg)