Embed Size (px)
Citation preview
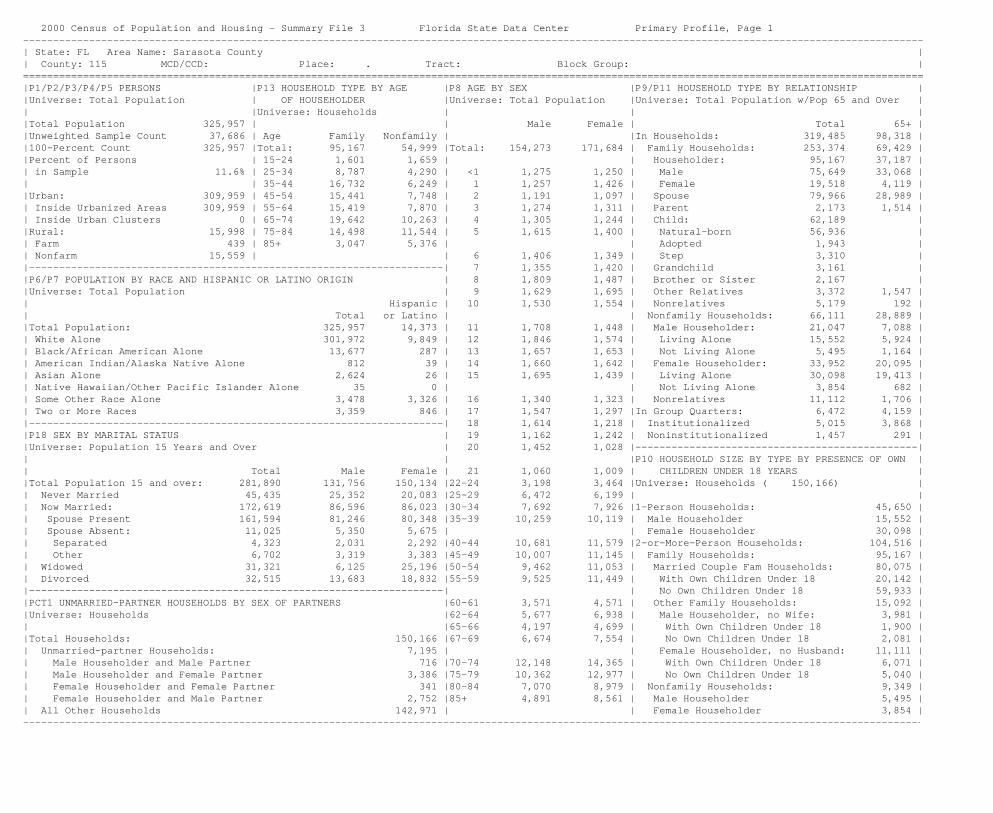
2000 Census of Population and Housing - Summary File 3 Florida State Data Center Primary Profile, Page 1------------------------------------------------------------------------------------------------------------------------------------------------------| State: FL Area Name: Sarasota County || County: 115 MCD/CCD: Place: . Tract: Block Group: |======================================================================================================================================================|P1/P2/P3/P4/P5 PERSONS |P13 HOUSEHOLD TYPE BY AGE |P8 AGE BY SEX |P9/P11 HOUSEHOLD TYPE BY RELATIONSHIP ||Universe: Total Population | OF HOUSEHOLDER |Universe: Total Population |Universe: Total Population w/Pop 65 and Over || |Universe: Households | | ||Total Population 325,957 | | Male Female | Total 65+ ||Unweighted Sample Count 37,686 | Age Family Nonfamily | |In Households: 319,485 98,318 ||100-Percent Count 325,957 |Total: 95,167 54,999 |Total: 154,273 171,684 | Family Households: 253,374 69,429 ||Percent of Persons | 15-24 1,601 1,659 | | Householder: 95,167 37,187 || in Sample 11.6% | 25-34 8,787 4,290 | <1 1,275 1,250 | Male 75,649 33,068 || | 35-44 16,732 6,249 | 1 1,257 1,426 | Female 19,518 4,119 ||Urban: 309,959 | 45-54 15,441 7,748 | 2 1,191 1,097 | Spouse 79,966 28,989 || Inside Urbanized Areas 309,959 | 55-64 15,419 7,870 | 3 1,274 1,311 | Parent 2,173 1,514 || Inside Urban Clusters 0 | 65-74 19,642 10,263 | 4 1,305 1,244 | Child: 62,189 ||Rural: 15,998 | 75-84 14,498 11,544 | 5 1,615 1,400 | Natural-born 56,936 || Farm 439 | 85+ 3,047 5,376 | | Adopted 1,943 || Nonfarm 15,559 | | 6 1,406 1,349 | Step 3,310 ||---------------------------------------------------------------------| 7 1,355 1,420 | Grandchild 3,161 ||P6/P7 POPULATION BY RACE AND HISPANIC OR LATINO ORIGIN | 8 1,809 1,487 | Brother or Sister 2,167 ||Universe: Total Population | 9 1,629 1,695 | Other Relatives 3,372 1,547 || Hispanic | 10 1,530 1,554 | Nonrelatives 5,179 192 || Total or Latino | | Nonfamily Households: 66,111 28,889 ||Total Population: 325,957 14,373 | 11 1,708 1,448 | Male Householder: 21,047 7,088 || White Alone 301,972 9,849 | 12 1,846 1,574 | Living Alone 15,552 5,924 || Black/African American Alone 13,677 287 | 13 1,657 1,653 | Not Living Alone 5,495 1,164 || American Indian/Alaska Native Alone 812 39 | 14 1,660 1,642 | Female Householder: 33,952 20,095 || Asian Alone 2,624 26 | 15 1,695 1,439 | Living Alone 30,098 19,413 || Native Hawaiian/Other Pacific Islander Alone 35 0 | | Not Living Alone 3,854 682 || Some Other Race Alone 3,478 3,326 | 16 1,340 1,323 | Nonrelatives 11,112 1,706 || Two or More Races 3,359 846 | 17 1,547 1,297 |In Group Quarters: 6,472 4,159 ||---------------------------------------------------------------------| 18 1,614 1,218 | Institutionalized 5,015 3,868 ||P18 SEX BY MARITAL STATUS | 19 1,162 1,242 | Noninstitutionalized 1,457 291 ||Universe: Population 15 Years and Over | 20 1,452 1,028 |-----------------------------------------------|| | |P10 HOUSEHOLD SIZE BY TYPE BY PRESENCE OF OWN || Total Male Female | 21 1,060 1,009 | CHILDREN UNDER 18 YEARS ||Total Population 15 and over: 281,890 131,756 150,134 |22-24 3,198 3,464 |Universe: Households ( 150,166) || Never Married 45,435 25,352 20,083 |25-29 6,472 6,199 | || Now Married: 172,619 86,596 86,023 |30-34 7,692 7,926 |1-Person Households: 45,650 || Spouse Present 161,594 81,246 80,348 |35-39 10,259 10,119 | Male Householder 15,552 || Spouse Absent: 11,025 5,350 5,675 | | Female Householder 30,098 || Separated 4,323 2,031 2,292 |40-44 10,681 11,579 |2-or-More-Person Households: 104,516 || Other 6,702 3,319 3,383 |45-49 10,007 11,145 | Family Households: 95,167 || Widowed 31,321 6,125 25,196 |50-54 9,462 11,053 | Married Couple Fam Households: 80,075 || Divorced 32,515 13,683 18,832 |55-59 9,525 11,449 | With Own Children Under 18 20,142 ||---------------------------------------------------------------------| | No Own Children Under 18 59,933 ||PCT1 UNMARRIED-PARTNER HOUSEHOLDS BY SEX OF PARTNERS |60-61 3,571 4,571 | Other Family Households: 15,092 ||Universe: Households |62-64 5,677 6,938 | Male Householder, no Wife: 3,981 || |65-66 4,197 4,699 | With Own Children Under 18 1,900 ||Total Households: 150,166 |67-69 6,674 7,554 | No Own Children Under 18 2,081 || Unmarried-partner Households: 7,195 | | Female Householder, no Husband: 11,111 || Male Householder and Male Partner 716 |70-74 12,148 14,365 | With Own Children Under 18 6,071 || Male Householder and Female Partner 3,386 |75-79 10,362 12,977 | No Own Children Under 18 5,040 || Female Householder and Female Partner 341 |80-84 7,070 8,979 | Nonfamily Households: 9,349 || Female Householder and Male Partner 2,752 |85+ 4,891 8,561 | Male Householder 5,495 || All Other Households 142,971 | | Female Householder 3,854 |------------------------------------------------------------------------------------------------------------------------------------------------------

2000 Census of Population and Housing - Summary File 3 Florida State Data Center Primary Profile, Page 2------------------------------------------------------------------------------------------------------------------------------------------------------| State: FL Area Name: Sarasota County || County: 115 MCD/CCD: Place: . Tract: Block Group: |======================================================================================================================================================|PCT8 GRANDPARENTS BY LENGTH OF TIME RESPONSIBLE | P15 FAMILY TYPE BY PRESENCE OF OWN CHILDREN | P21 PLACE OF BIRTH BY CITIZENSHIP STATUS || FOR GRANDCHILDREN UNDER 18 YEARS | UNDER 18 YEARS BY AGE OF OWN CHILDREN | Universe: Total Population ||Universe: Population 30 Years and Over in | Universe: Families | || Households | | Total Population: 325,957 || | Total Families: 95,167 | ||Total Pop. 30 & Over in Households: 238,921 | | Native: 295,541 || | Married Couple Families: 80,075 | Born in State of Residence 62,414 || Living with Own Grandchildren Und. 18: 3,848 | With Own Children Under 18: 20,142 | Born in Other State in the || Grandparents Responsible for | Under 6 Years Only 4,555 | United States: 229,629 || Own Grandchildren Under 18 Years: 1,723 | Under 6 and 6 to 17 Years 4,065 | Northeast 99,167 || Length of Time -- | 6 to 17 Years Only 11,522 | Midwest 87,516 || Less Than 6 Months 228 | No Own Children Under 18 59,933 | South 35,279 || 6 to 11 Months 174 | | West 7,667 || 1 to 2 Years 360 | Other Families: 15,092 | Born Outside the United States: 3,498 || 3 to 4 Years 265 | Male Householder, | Puerto Rico 955 || 5 Years or More 696 | No Wife Present: 3,981 | U.S. Island Areas 185 || | With Own Children Under 18: 1,900 | Born abroad of American || Grandparents Not Responsible For | Under 6 Years Only 561 | Parent(s) 2,358 || Own Grandchildren Under 18 Years 2,125 | Under 6 and 6 to 17 Years 232 | || | 6 to 17 Years Only 1,107 | Foreign Born: 30,416 || Not Living with Own Grandchildren | No Own Children Under 18 2,081 | Naturalized Citizen 14,642 || Under 18 Years 235,073 | | Not a Citizen 15,774 || | Female Householder, | ||----------------------------------------------------| No Husband Present: 11,111 |------------------------------------------------||PCT9 HOUSEHOLD RELATIONSHIP BY GRANDPARENTS LIVING | With Own Children Under 18: 6,071 | P19 LANGUAGE SPOKEN AT HOME BY ABILITY TO || WITH OWN GRANDCHILDREN UNDER 18 YEARS BY | Under 6 Years Only 1,088 | SPEAK ENGLISH BY AGE || RESPONSIBILITY FOR OWN GRANDCHILDREN | Under 6 and 6 to 17 Years 870 | Universe: Pop. 5 Years and Over ( 313,327) ||Universe: Population 30 Years and Over in | 6 to 17 Years Only 4,113 | || Households | No Own Children Under 18 5,040 | Speak Only English 280,340 || |----------------------------------------------| ||Total Pop. 30 & Over in Households: 238,921 | P23 YEAR OF ENTRY BY CITIZENSHIP STATUS | Speak Spanish: 13,751 || | Universe: Foreign-born Population | Speak English "Very Well" 7,025 || Householder or Spouse: 217,353 | | Speak English "Well" 2,895 || Living w/own Grandchild Under 18: 2,882 | Naturalized Not a | Speak English "Not Well" 2,637 || Responsible for Own Grandchild 1,661 | Year of Entry Citizen Citizen | Speak English "Not at All" 1,194 || Not Responsible for Own Grandchild 1,221 | | || Not Living w/Own Grandchild Under 18 214,471 | Total For. Born Pop.: 14,642 15,774 | Speak Other Indo-European Lang.: 15,966 || | 1990 to March 2000 1,055 10,164 | Speak English "Very Well" 10,974 || Parent or Parent-in-Law of | 1980 to 1989 2,079 2,712 | Speak English "Well" 3,559 || Householder: 3,031 | Before 1980 11,508 2,898 | Speak English "Not Well" 1,254 || Living w/Own Grandchild Under 18: 868 |----------------------------------------------| Speak English "Not at All" 179 || Responsible for Own Grandchild 55 | P22 YEAR OF ENTRY | || Not Responsible for Own Grandchild 813 | Universe: Foreign-born Population | Speak Asian/Pacific Island Lang.: 1,830 || Not Living w/Own Grandchild Under 18 2,163 | | Speak English "Very Well" 839 || | Total Foreign Born Population: 30,416 | Speak English "Well" 534 || Other Relatives or Nonrelatives of | | Speak English "Not Well" 390 || Householder: 18,537 | 1995 to March 2000 6,662 | Speak English "Not at All" 67 || Living w/Own Grandchild Under 18: 98 | 1990 to 1994 4,557 | || Responsible for Own Grandchild 7 | 1985 to 1989 2,480 | Speak Other Languages: 1,440 || Not Responsible for Own Grandchild 91 | 1980 to 1984 2,311 | Speak English "Very Well" 938 || Not Living w/Own Grandchild Under 18 18,439 | 1975 to 1979 1,460 | Speak English "Well" 353 || | 1970 to 1974 1,476 | Speak English "Not Well" 107 || | 1965 to 1969 1,901 | Speak English "Not at All" 42 || | Before 1965 9,569 | |------------------------------------------------------------------------------------------------------------------------------------------------------

2000 Census of Population and Housing - Summary File 3 Florida State Data Center Primary Profile, Page 3------------------------------------------------------------------------------------------------------------------------------------------------------| State: FL Area Name: Sarasota County || County: 115 MCD/CCD: Place: . Tract: Block Group: |======================================================================================================================================================|PCT16/PCT18 ANCESTRY ||Two Universes: PCT16-Persons; PCT18-Total Ancestry Categories Reported || || First Total First Total First Total ||First Ancestry 268,225 N/A Reported Reported Reported Reported ||Total Specified Ancestries N/A 357,937 || || Acadian/Cajun 29 29 Israeli 66 66 West Indian (Exc Hisp Grp): 1,091 1,190 || Afghan 0 0 Italian 21,595 25,082 Bahamian 35 40 || Albanian 33 110 Latvian 202 224 Barbadian 23 23 || Alsatian 28 65 Lithuanian 884 1,307 Belizean 11 17 || Arab: 1,047 1,229 Luxemburger 131 131 Bermudan 0 0 || Egyptian 58 58 Macedonian 50 50 British West Indian 65 65 || Iraqi 8 8 Maltese 25 45 Dutch West Indian 0 0 || Jordanian 23 23 New Zealander 0 17 Haitian 167 197 || Lebanese 509 608 Northern European 189 189 Jamaican 618 639 || Moroccan 150 167 Norwegian 2,660 3,592 Trinidadian & Tobagonian 50 50 || Palestinian 118 118 Pennsylvania German 212 329 U.S. Virgin Islander 32 32 || Syrian 73 94 Polish 10,244 14,054 West Indian 90 127 || Arab/Arabic 82 118 Portuguese 719 1,037 Other West Indian 0 0 || Other Arab 26 35 Romanian 541 744 Yugoslavian 489 553 || Armenian 286 347 Russian 4,374 5,463 Other Groups 33,645 39,262 || Assyrian/Chaldean/Syriac 9 9 Scandinavian 369 507 Unclassified or || Australian 130 153 Scotch-Irish 5,594 7,267 Not Reported 57,732 N/A || Austrian 1,181 1,776 Scottish 6,448 9,610 +-------------------------------------------------|| Basque 26 26 Serbian 275 324 |PCT21 RESIDENCE IN 1995 || Belgian 383 550 Slavic 77 143 |Universe: Population 5 Years and Over || Brazilian 301 301 Slovak 959 1,190 | || British 2,115 2,386 Slovene 131 194 |Total Population 5 Years and Over: 313,327 || Bulgarian 84 99 Soviet Union 0 0 | || Canadian 1,632 1,981 Subsaharan African: 776 819 | Same House in 1995 160,973 || Carpatho Rusyn 0 0 Cape Verdean 15 15 | Different House in 1995: 152,354 || Celtic 22 45 Ethiopian 28 28 | In United States in 1995: 144,489 || Croatian 279 358 Ghanian 0 0 | Same City or Town: 17,271 || Cypriot 15 15 Kenyan 0 0 | Same County 17,075 || Czech 1,150 1,738 Liberian 0 0 | Different County (Same State) 196 || Czechoslovakian 541 716 Nigerian 20 20 | Not Same City or Town: 127,218 || Danish 951 1,531 Senegalese 0 0 | Same County 52,860 || Dutch 4,083 7,065 Sierra Leonean 0 0 | Different County: 74,358 || Eastern European 205 214 Somalian 0 0 | Same State 20,961 || English 34,471 48,073 South African 77 84 | Different State: 53,397 || Estonian 70 70 Sudanese 0 0 | Northeast 21,573 || European 1,515 1,546 Ugandan 0 0 | Midwest 16,665 || Finnish 568 846 Zairian 0 0 | South 11,054 || French (Except Basque) 8,341 14,157 Zimbabwean 0 0 | West 4,105 || French Canadian 3,407 4,033 African 636 672 | In Puerto Rico in 1995: 281 || German 46,188 65,642 Other Subsaharan Af. 0 0 | Same City or Town 0 || German Russian 0 0 Swedish 4,264 6,218 | Not Same City or Town 0 || Greek 1,569 1,822 Swiss 1,230 1,962 | Same Municipio 0 || Guyanese 55 63 Turkish 108 108 | Different Municipio 0 || Hungarian 2,687 3,649 Ukranian 1,719 2,102 | Elsewhere in 1995: 7,584 || Icelander 19 38 United States/American 23,253 23,253 | U.S. Island Areas 208 || Iranian 60 60 Welsh 1,775 3,346 | Foreign Country or at Sea 7,376 || Irish 30,650 46,817 | |------------------------------------------------------------------------------------------------------------------------------------------------------
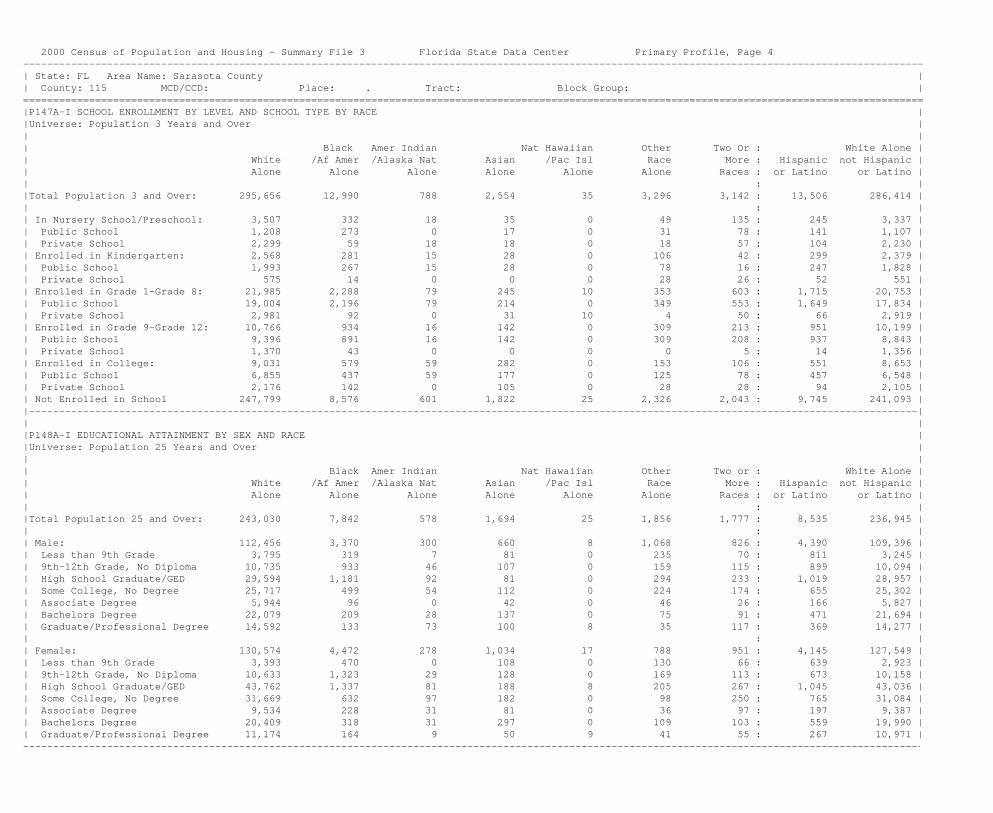
2000 Census of Population and Housing - Summary File 3 Florida State Data Center Primary Profile, Page 4------------------------------------------------------------------------------------------------------------------------------------------------------| State: FL Area Name: Sarasota County || County: 115 MCD/CCD: Place: . Tract: Block Group: |======================================================================================================================================================|P147A-I SCHOOL ENROLLMENT BY LEVEL AND SCHOOL TYPE BY RACE ||Universe: Population 3 Years and Over || || Black Amer Indian Nat Hawaiian Other Two Or : White Alone || White /Af Amer /Alaska Nat Asian /Pac Isl Race More : Hispanic not Hispanic || Alone Alone Alone Alone Alone Alone Races : or Latino or Latino || : ||Total Population 3 and Over: 295,656 12,990 788 2,554 35 3,296 3,142 : 13,506 286,414 || : || In Nursery School/Preschool: 3,507 332 18 35 0 49 135 : 245 3,337 || Public School 1,208 273 0 17 0 31 78 : 141 1,107 || Private School 2,299 59 18 18 0 18 57 : 104 2,230 || Enrolled in Kindergarten: 2,568 281 15 28 0 106 42 : 299 2,379 || Public School 1,993 267 15 28 0 78 16 : 247 1,828 || Private School 575 14 0 0 0 28 26 : 52 551 || Enrolled in Grade 1-Grade 8: 21,985 2,288 79 245 10 353 603 : 1,715 20,753 || Public School 19,004 2,196 79 214 0 349 553 : 1,649 17,834 || Private School 2,981 92 0 31 10 4 50 : 66 2,919 || Enrolled in Grade 9-Grade 12: 10,766 934 16 142 0 309 213 : 951 10,199 || Public School 9,396 891 16 142 0 309 208 : 937 8,843 || Private School 1,370 43 0 0 0 0 5 : 14 1,356 || Enrolled in College: 9,031 579 59 282 0 153 106 : 551 8,653 || Public School 6,855 437 59 177 0 125 78 : 457 6,548 || Private School 2,176 142 0 105 0 28 28 : 94 2,105 || Not Enrolled in School 247,799 8,576 601 1,822 25 2,326 2,043 : 9,745 241,093 ||----------------------------------------------------------------------------------------------------------------------------------------------------|| ||P148A-I EDUCATIONAL ATTAINMENT BY SEX AND RACE ||Universe: Population 25 Years and Over || || Black Amer Indian Nat Hawaiian Other Two or : White Alone || White /Af Amer /Alaska Nat Asian /Pac Isl Race More : Hispanic not Hispanic || Alone Alone Alone Alone Alone Alone Races : or Latino or Latino || : ||Total Population 25 and Over: 243,030 7,842 578 1,694 25 1,856 1,777 : 8,535 236,945 || : || Male: 112,456 3,370 300 660 8 1,068 826 : 4,390 109,396 || Less than 9th Grade 3,795 319 7 81 0 235 70 : 811 3,245 || 9th-12th Grade, No Diploma 10,735 933 46 107 0 159 115 : 899 10,094 || High School Graduate/GED 29,594 1,181 92 81 0 294 233 : 1,019 28,957 || Some College, No Degree 25,717 499 54 112 0 224 174 : 655 25,302 || Associate Degree 5,944 96 0 42 0 46 26 : 166 5,827 || Bachelors Degree 22,079 209 28 137 0 75 91 : 471 21,694 || Graduate/Professional Degree 14,592 133 73 100 8 35 117 : 369 14,277 || : || Female: 130,574 4,472 278 1,034 17 788 951 : 4,145 127,549 || Less than 9th Grade 3,393 470 0 108 0 130 66 : 639 2,923 || 9th-12th Grade, No Diploma 10,633 1,323 29 128 0 169 113 : 673 10,158 || High School Graduate/GED 43,762 1,337 81 188 8 205 267 : 1,045 43,036 || Some College, No Degree 31,669 632 97 182 0 98 250 : 765 31,084 || Associate Degree 9,534 228 31 81 0 36 97 : 197 9,387 || Bachelors Degree 20,409 318 31 297 0 109 103 : 559 19,990 || Graduate/Professional Degree 11,174 164 9 50 9 41 55 : 267 10,971 |------------------------------------------------------------------------------------------------------------------------------------------------------

2000 Census of Population and Housing - Summary File 3 Florida State Data Center Primary Profile, Page 5------------------------------------------------------------------------------------------------------------------------------------------------------| State: FL Area Name: Sarasota County || County: 115 MCD/CCD: Place: . Tract: Block Group: |======================================================================================================================================================|P36 SCHOOL ENROLLMENT BY LEVEL AND SCHOOL TYPE |P37 EDUCATIONAL ATTAINMENT BY SEX |P44 FAMILY TYPE BY EMPLOYMENT ||Universe: Population 3 Years and Over |Universe: Population 25 Years and Over | STATUS || | |Universe: Families || Male Female | Total Male Female | ||Total Pop. 3 and Over: 150,550 167,911 |Total Pop. 25 and over: 256,802 118,688 138,114 |Total Families: 95,167 || In Nursery/Preschool: 2,113 1,963 | No School Completed 1,199 638 561 | Married Couple Families: 80,075 || Public School 803 804 | Nursery to 4th Grade 368 149 219 | Husband in Labor Force: 42,023 || Private School 1,310 1,159 | 5th and 6th Grade 1,680 919 761 | Husband Employed or || In Kindergarten: 1,622 1,418 | 7th and 8th Grade 5,427 2,801 2,626 | in Armed Forces: 41,181 || Public School 1,332 1,065 | 9th Grade 4,070 2,251 1,819 | Wife in Labor Force: 28,391 || Private School 290 353 | 10th Grade 6,253 3,058 3,195 | Wife Employed or In || In Grade 1 - Grade 4: 6,200 6,128 | 11th Grade 5,305 2,381 2,924 | Armed Forces 27,823 || Public School 5,467 5,344 | 12th Grade, No Diploma 8,862 4,405 4,457 | Wife Unemployed 568 || Private School 733 784 | High School Graduate/GED 77,323 31,475 45,848 | Wife Not in Labor || In Grade 5 - Grade 8: 7,030 6,205 | Some College: < 1 Year 18,534 7,787 10,747 | Force 12,790 || Public School 6,139 5,445 | Some College: 1 Year | || Private School 891 760 | or More, No Degree 41,174 18,993 22,181 | Husband Unemployed: 842 || In Grade 9 - Grade 12: 6,359 6,021 | Associate Degree 16,161 6,154 10,007 | Wife in Labor Force: 535 || Public School 5,654 5,308 | Bachelors Degree 43,886 22,619 21,267 | Wife Employed or in || Private School 705 713 | Masters Degree 16,229 8,028 8,201 | Armed Forces 457 || College: Undergraduate: 3,490 4,690 | Professional Degree 7,552 5,075 2,477 | Wife Unemployed 78 || Public School 2,760 3,634 | Doctorate Degree 2,779 1,955 824 | Wife Not in Labor || Private School 730 1,056 | | Force 307 || Graduate/Professional: 811 1,219 |-------------------------------------------------------------| || Public School 546 791 |P45 EMPLOYMENT STATUS OF WOMEN BY PRESENCE OF OWN CHILDREN | Husband Not in || Private School 265 428 | UNDER 18 YEARS BY AGE OF OWN CHILDREN | Labor Force: 38,052 || Not Enrolled in School 122,925 140,267 |Universe: Females 16 Years and Over | Wife in Labor Force: 5,395 ||------------------------------------------------| | Wife Employed or in ||P38 EMPLOYMENT STATUS BY SCHOOL ENROLLMENT |Total Females 16 and Over: 148,695 | Armed Forces 5,310 ||Universe: Population 16 to 19 Years | | Wife Unemployed 85 || | With Own Children Under 18 Years: 27,219 | Wife Not in Labor ||Total Population 16 to 19: 10,743 | Under 6 Years Only: 6,113 | Force 32,657 || In Armed Forces: 0 | In Labor Force: 3,982 | || Enrolled in School: 0 | Employed or in Armed Forces 3,833 | Other Families: 15,092 || High School Graduate 0 | Unemployed 149 | Male Householder, || Not High School Graduate 0 | Not in Labor Force 2,131 | no Wife Present: 3,981 || Not Enrolled in School: 0 | Under 6 and 6 to 17 Years: 5,026 | In Labor Force: 3,014 || High School Graduate 0 | In Labor Force: 3,226 | Employed or In || Not High School Graduate 0 | Employed or in Armed Forces 3,112 | Armed Forces 2,851 || Civilian: 10,743 | Unemployed 114 | Unemployed 163 || Enrolled in School: 8,249 | Not in Labor Force 1,800 | Not in Labor Force 967 || Employed 4,013 | 6 to 17 Years Only: 16,080 | || Unemployed 606 | In Labor Force: 12,631 | Female Householder, || Not in Labor Force 3,630 | Employed or in Armed Forces 12,327 | no Husband Present: 11,111 || Not Enrolled in School: 2,494 | Unemployed 304 | In Labor Force: 7,560 || High School Graduate: 1,217 | Not in Labor Force 3,449 | Employed or In || Employed 954 | | Armed Forces 7,293 || Unemployed 45 | No Own Children Under 18 Years: 121,476 | Unemployed 267 || Not in Labor Force 218 | In Labor Force: 47,297 | Not in Labor Force 3,551 || Not High School Graduate: 1,277 | Employed or in Armed Forces 45,576 | || Employed 838 | Unemployed 1,721 | || Unemployed 170 | Not in Labor Force 74,179 | || Not in Labor Force 269 | | |------------------------------------------------------------------------------------------------------------------------------------------------------
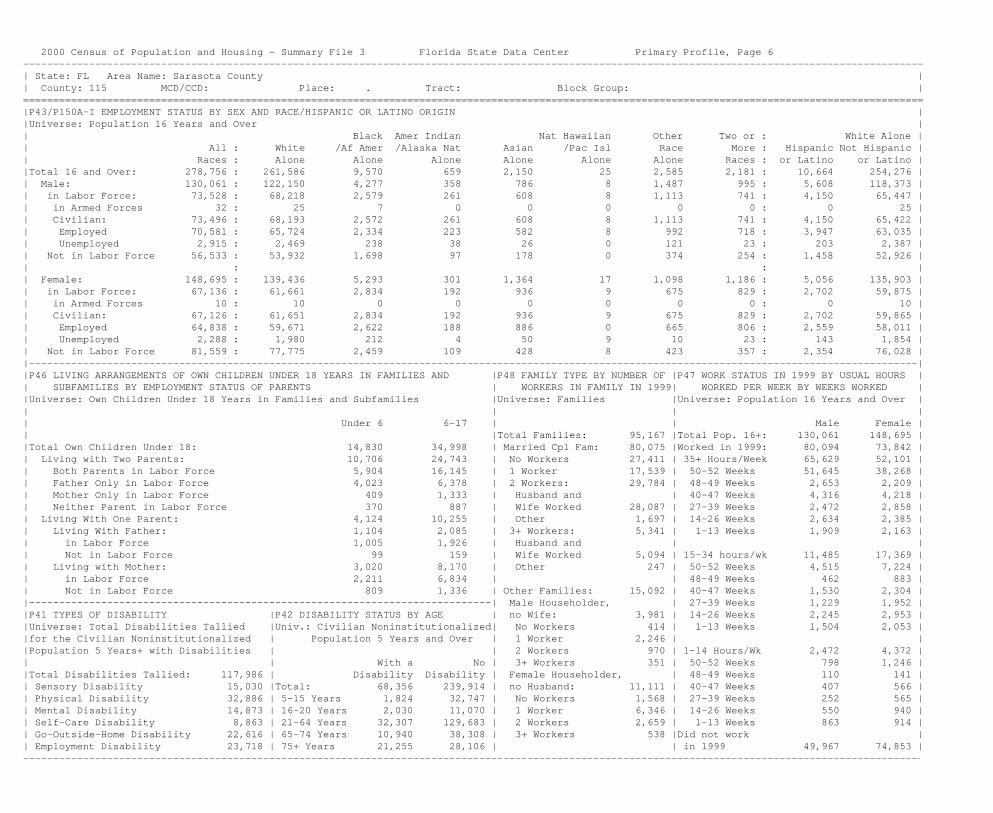
2000 Census of Population and Housing - Summary File 3 Florida State Data Center Primary Profile, Page 6------------------------------------------------------------------------------------------------------------------------------------------------------| State: FL Area Name: Sarasota County || County: 115 MCD/CCD: Place: . Tract: Block Group: |======================================================================================================================================================|P43/P150A-I EMPLOYMENT STATUS BY SEX AND RACE/HISPANIC OR LATINO ORIGIN ||Universe: Population 16 Years and Over || Black Amer Indian Nat Hawaiian Other Two or : White Alone || All : White /Af Amer /Alaska Nat Asian /Pac Isl Race More : Hispanic Not Hispanic || Races : Alone Alone Alone Alone Alone Alone Races : or Latino or Latino ||Total 16 and Over: 278,756 : 261,586 9,570 659 2,150 25 2,585 2,181 : 10,664 254,276 || Male: 130,061 : 122,150 4,277 358 786 8 1,487 995 : 5,608 118,373 || in Labor Force: 73,528 : 68,218 2,579 261 608 8 1,113 741 : 4,150 65,447 || in Armed Forces 32 : 25 7 0 0 0 0 0 : 0 25 || Civilian: 73,496 : 68,193 2,572 261 608 8 1,113 741 : 4,150 65,422 || Employed 70,581 : 65,724 2,334 223 582 8 992 718 : 3,947 63,035 || Unemployed 2,915 : 2,469 238 38 26 0 121 23 : 203 2,387 || Not in Labor Force 56,533 : 53,932 1,698 97 178 0 374 254 : 1,458 52,926 || : : || Female: 148,695 : 139,436 5,293 301 1,364 17 1,098 1,186 : 5,056 135,903 || in Labor Force: 67,136 : 61,661 2,834 192 936 9 675 829 : 2,702 59,875 || in Armed Forces 10 : 10 0 0 0 0 0 0 : 0 10 || Civilian: 67,126 : 61,651 2,834 192 936 9 675 829 : 2,702 59,865 || Employed 64,838 : 59,671 2,622 188 886 0 665 806 : 2,559 58,011 || Unemployed 2,288 : 1,980 212 4 50 9 10 23 : 143 1,854 || Not in Labor Force 81,559 : 77,775 2,459 109 428 8 423 357 : 2,354 76,028 ||----------------------------------------------------------------------------------------------------------------------------------------------------||P46 LIVING ARRANGEMENTS OF OWN CHILDREN UNDER 18 YEARS IN FAMILIES AND |P48 FAMILY TYPE BY NUMBER OF |P47 WORK STATUS IN 1999 BY USUAL HOURS || SUBFAMILIES BY EMPLOYMENT STATUS OF PARENTS | WORKERS IN FAMILY IN 1999| WORKED PER WEEK BY WEEKS WORKED ||Universe: Own Children Under 18 Years in Families and Subfamilies |Universe: Families |Universe: Population 16 Years and Over || | | || Under 6 6-17 | | Male Female || |Total Families: 95,167 |Total Pop. 16+: 130,061 148,695 ||Total Own Children Under 18: 14,830 34,998 | Married Cpl Fam: 80,075 |Worked in 1999: 80,094 73,842 || Living with Two Parents: 10,706 24,743 | No Workers 27,411 | 35+ Hours/Week 65,629 52,101 || Both Parents in Labor Force 5,904 16,145 | 1 Worker 17,539 | 50-52 Weeks 51,645 38,268 || Father Only in Labor Force 4,023 6,378 | 2 Workers: 29,784 | 48-49 Weeks 2,653 2,209 || Mother Only in Labor Force 409 1,333 | Husband and | 40-47 Weeks 4,316 4,218 || Neither Parent in Labor Force 370 887 | Wife Worked 28,087 | 27-39 Weeks 2,472 2,858 || Living With One Parent: 4,124 10,255 | Other 1,697 | 14-26 Weeks 2,634 2,385 || Living With Father: 1,104 2,085 | 3+ Workers: 5,341 | 1-13 Weeks 1,909 2,163 || in Labor Force 1,005 1,926 | Husband and | || Not in Labor Force 99 159 | Wife Worked 5,094 | 15-34 hours/wk 11,485 17,369 || Living with Mother: 3,020 8,170 | Other 247 | 50-52 Weeks 4,515 7,224 || in Labor Force 2,211 6,834 | | 48-49 Weeks 462 883 || Not in Labor Force 809 1,336 | Other Families: 15,092 | 40-47 Weeks 1,530 2,304 ||-----------------------------------------------------------------------------| Male Householder, | 27-39 Weeks 1,229 1,952 ||P41 TYPES OF DISABILITY |P42 DISABILITY STATUS BY AGE | no Wife: 3,981 | 14-26 Weeks 2,245 2,953 ||Universe: Total Disabilities Tallied |Univ.: Civilian Noninstitutionalized| No Workers 414 | 1-13 Weeks 1,504 2,053 ||for the Civilian Noninstitutionalized | Population 5 Years and Over | 1 Worker 2,246 | ||Population 5 Years+ with Disabilities | | 2 Workers 970 | 1-14 Hours/Wk 2,472 4,372 || | With a No | 3+ Workers 351 | 50-52 Weeks 798 1,246 ||Total Disabilities Tallied: 117,986 | Disability Disability | Female Householder, | 48-49 Weeks 110 141 || Sensory Disability 15,030 |Total: 68,356 239,914 | no Husband: 11,111 | 40-47 Weeks 407 566 || Physical Disability 32,886 | 5-15 Years 1,824 32,747 | No Workers 1,568 | 27-39 Weeks 252 565 || Mental Disability 14,873 | 16-20 Years 2,030 11,070 | 1 Worker 6,346 | 14-26 Weeks 550 940 || Self-Care Disability 8,863 | 21-64 Years 32,307 129,683 | 2 Workers 2,659 | 1-13 Weeks 863 914 || Go-Outside-Home Disability 22,616 | 65-74 Years 10,940 38,308 | 3+ Workers 538 |Did not work || Employment Disability 23,718 | 75+ Years 21,255 28,106 | | in 1999 49,967 74,853 |------------------------------------------------------------------------------------------------------------------------------------------------------

2000 Census of Population and Housing - Summary File 3 Florida State Data Center Primary Profile, Page 7------------------------------------------------------------------------------------------------------------------------------------------------------| State: FL Area Name: Sarasota County || County: 115 MCD/CCD: Place: . Tract: Block Group: |======================================================================================================================================================|P50 OCCUPATION |P51 INDUSTRY BY CLASS OF WORKER ||Universe: Employed Civilians 16 and Over |Universe: Employed Civilians 16 & Over || | ||Total Employed Civilians 16 and Over: 135,419 |Total Emp. Civ. 16+: 135,419 || Management, Professional & Related Occ: 42,912 Transportation & Material Moving: 5,766| All Industries except || Management, Business, Financial Operations: 17,990 Supervisors, Transportation & Material | Agriculture, Forestry, || Management (except Farmers/Farm Managers) 12,257 Moving Workers 80| Fishing, Hunting, Mining: 134,798 || Farmers and Farm Managers 161 Aircraft & Traffic Control 164| Private For-profit Wage || Business & Financial Operations: 5,572 Motor Vehicle Operators 3,078| & Salary workers: 99,036 || Business Operations Specialists 2,441 Rail, Water & Other Transportation 301| Employee of Private || Financial Specialists 3,131 Material Moving Workers 2,143| Company 89,433 || Professional & Related Occupations: 24,922|---------------------------------------------------| Self-employed in Own || Computer & Mathematical Occupations 1,662|P49 INDUSTRY | Incorporated Business 9,603 || Architecture & Engineering Occupations: 1,748|Universe: Employed Civilians 16 and Over | Private Not-for-profit || Architects, Surveyors, Cartographers, | | Wage & Salary workers 9,142 || & Engineers 1,164|Total Employed Civilians 16 and Over: 135,419| Local Government Workers 9,994 || Drafters, Engineering & Map Technicians 584| Agriculture, Forestry, Fishing, | State Government Workers 2,212 || Life, Physical & Social Science Occup. 852| Hunting & Mining: 621| Federal Govt Workers 1,320 || Community & Social Services 1,704| Agric, Forestry, Fishing, & Hunting 566| Self-Employed in Own || Legal Occupations 1,771| Mining 55| Not Incorporated Bus 12,651 || Education, Training & Library Occupations 5,128| | Unpaid Family Workers 443 || Arts, Design, Entertainment, Sports, | Construction 12,246| || & Media Occupations 3,561| Manufacturing 8,726| Agriculture, Forestry, || Healthcare Practitioners & Technical Occ: 8,496| Wholesale Trade 3,541| Fishing, Hunting, Mining: 621 || Health Diagnosing, Treating Practitioners | Retail Trade 21,594| Agriculture, Forestry, || & Technical Occupations 5,793| | Fishing & Hunting: 566 || Health Technologists & Technicians 2,703| Transportation, Warehousing | Private For-profit Wage || | & Utilities: 4,032| & Salary Workers: 401 || Service Occupations: 25,927| Transportation & Warehousing 3,244| Employee of Private || Healthcare Support Occupations 3,771| Utilities 788| Company 320 || Protective Service Occupations: 2,383| | Self-employed in Own || Fire Fighting, Prevention, & Law | Information 3,352| Incorporated Business 81 || Enforcement Workers, inc Supervisors 1,445| | Private Not-for-profit || Other Protective Services inc Supervisors 938| Finance, Insurance, Real Estate, | Wage & Salary Workers 0 || Food Preparation & Serving 9,082| Rental & Leasing: 12,092| Local Govt Workers 0 || Building & Grounds Cleaning & Maintenance 6,591| Finance & Insurance 6,736| State Govt Workers 0 || Personal Care & Service 4,100| Real Estate & Rental & Leasing 5,356| Federal Govt Workers 0 || | | Self-employed in Own || Sales & Office Occupations: 40,269| Professional, Scientific, Management, | Not Incorporated Bus 157 || Sales & Related Occupations 21,088| Administrative & Waste Management: 15,894| Unpaid Family Workers 8 || Office & Administrative Support 19,181| Professional, Scientific & Tech Serv 9,107| || | Management of Companies & Enterprises 37| Mining: 55 || Farming, Fishing & Forestry 408| Admin, Support, Waste Management Serv 6,750| Private For-profit Wage || | | & Salary Workers: 55 || Construction, Extraction & Maintenance Occ: 13,866| Educational, Health & Social Services: 25,534| Employee-Private Comp 55 || Construction & Extraction Occupations: 9,130| Educational Services 7,277| Self-employed in Own || Supervisors, Construction & | Health Care & Social Assistance 18,257| Incorporated Business 0 || Extraction Workers 918| | Private Not-for-profit || Construction Trade Workers 8,172| Arts, Entertainment, Recreation, | Wage & Salary workers 0 || Extraction Workers 40| Accommodation & Food Services: 15,114| Local Govt Workers 0 || Installation, Maintenance & Repair Occ 4,736| Arts, Entertainment & Recreation 4,229| State Govt Workers 0 || | Accommodation & Food Services 10,885| Federal Govt Workers 0 || Production, Transportation & Material | | Self-employed in Own || Moving Occupations: 12,037| Other Services (except Public Admin) 7,926| Not Incorporated Bus 0 || Production Occupations 6,271| Public Administration 4,747| Unpaid Family Workers 0 |------------------------------------------------------------------------------------------------------------------------------------------------------
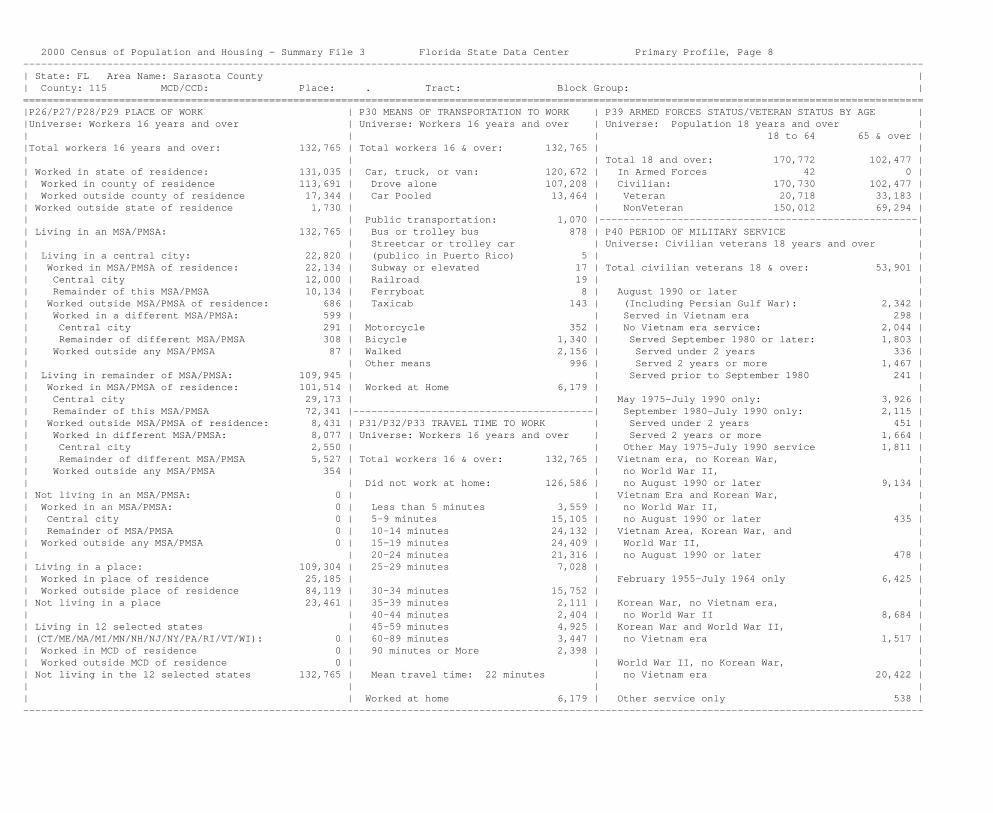
2000 Census of Population and Housing - Summary File 3 Florida State Data Center Primary Profile, Page 8------------------------------------------------------------------------------------------------------------------------------------------------------| State: FL Area Name: Sarasota County || County: 115 MCD/CCD: Place: . Tract: Block Group: |======================================================================================================================================================|P26/P27/P28/P29 PLACE OF WORK | P30 MEANS OF TRANSPORTATION TO WORK | P39 ARMED FORCES STATUS/VETERAN STATUS BY AGE ||Universe: Workers 16 years and over | Universe: Workers 16 years and over | Universe: Population 18 years and over || | | 18 to 64 65 & over ||Total workers 16 years and over: 132,765 | Total workers 16 & over: 132,765 | || | | Total 18 and over: 170,772 102,477 || Worked in state of residence: 131,035 | Car, truck, or van: 120,672 | In Armed Forces 42 0 || Worked in county of residence 113,691 | Drove alone 107,208 | Civilian: 170,730 102,477 || Worked outside county of residence 17,344 | Car Pooled 13,464 | Veteran 20,718 33,183 || Worked outside state of residence 1,730 | | NonVeteran 150,012 69,294 || | Public transportation: 1,070 |-----------------------------------------------------|| Living in an MSA/PMSA: 132,765 | Bus or trolley bus 878 | P40 PERIOD OF MILITARY SERVICE || | Streetcar or trolley car | Universe: Civilian veterans 18 years and over || Living in a central city: 22,820 | (publico in Puerto Rico) 5 | || Worked in MSA/PMSA of residence: 22,134 | Subway or elevated 17 | Total civilian veterans 18 & over: 53,901 || Central city 12,000 | Railroad 19 | || Remainder of this MSA/PMSA 10,134 | Ferryboat 8 | August 1990 or later || Worked outside MSA/PMSA of residence: 686 | Taxicab 143 | (Including Persian Gulf War): 2,342 || Worked in a different MSA/PMSA: 599 | | Served in Vietnam era 298 || Central city 291 | Motorcycle 352 | No Vietnam era service: 2,044 || Remainder of different MSA/PMSA 308 | Bicycle 1,340 | Served September 1980 or later: 1,803 || Worked outside any MSA/PMSA 87 | Walked 2,156 | Served under 2 years 336 || | Other means 996 | Served 2 years or more 1,467 || Living in remainder of MSA/PMSA: 109,945 | | Served prior to September 1980 241 || Worked in MSA/PMSA of residence: 101,514 | Worked at Home 6,179 | || Central city 29,173 | | May 1975-July 1990 only: 3,926 || Remainder of this MSA/PMSA 72,341 |----------------------------------------| September 1980-July 1990 only: 2,115 || Worked outside MSA/PMSA of residence: 8,431 | P31/P32/P33 TRAVEL TIME TO WORK | Served under 2 years 451 || Worked in different MSA/PMSA: 8,077 | Universe: Workers 16 years and over | Served 2 years or more 1,664 || Central city 2,550 | | Other May 1975-July 1990 service 1,811 || Remainder of different MSA/PMSA 5,527 | Total workers 16 & over: 132,765 | Vietnam era, no Korean War, || Worked outside any MSA/PMSA 354 | | no World War II, || | Did not work at home: 126,586 | no August 1990 or later 9,134 || Not living in an MSA/PMSA: 0 | | Vietnam Era and Korean War, || Worked in an MSA/PMSA: 0 | Less than 5 minutes 3,559 | no World War II, || Central city 0 | 5-9 minutes 15,105 | no August 1990 or later 435 || Remainder of MSA/PMSA 0 | 10-14 minutes 24,132 | Vietnam Area, Korean War, and || Worked outside any MSA/PMSA 0 | 15-19 minutes 24,409 | World War II, || | 20-24 minutes 21,316 | no August 1990 or later 478 || Living in a place: 109,304 | 25-29 minutes 7,028 | || Worked in place of residence 25,185 | | February 1955-July 1964 only 6,425 || Worked outside place of residence 84,119 | 30-34 minutes 15,752 | || Not living in a place 23,461 | 35-39 minutes 2,111 | Korean War, no Vietnam era, || | 40-44 minutes 2,404 | no World War II 8,684 || Living in 12 selected states | 45-59 minutes 4,925 | Korean War and World War II, || (CT/ME/MA/MI/MN/NH/NJ/NY/PA/RI/VT/WI): 0 | 60-89 minutes 3,447 | no Vietnam era 1,517 || Worked in MCD of residence 0 | 90 minutes or More 2,398 | || Worked outside MCD of residence 0 | | World War II, no Korean War, || Not living in the 12 selected states 132,765 | Mean travel time: 22 minutes | no Vietnam era 20,422 || | | || | Worked at home 6,179 | Other service only 538 |------------------------------------------------------------------------------------------------------------------------------------------------------

2000 Census of Population and Housing - Summary File 3 Florida State Data Center Primary Profile, Page 9------------------------------------------------------------------------------------------------------------------------------------------------------| State: FL Area Name: Sarasota County || County: 115 MCD/CCD: Place: . Tract: Block Group: |======================================================================================================================================================|P52/P53/P54/P151A-I/P152A-I/P153A-I HOUSEHOLD INCOME IN 1999 BY RACE AND HISPANIC/LATINO ORIGIN OF HOUSEHOLDER ||Universe: Households || Black Amer Indian Nat Hawaiian Other Two or : White Alone || All : White /Af Amer /Alaska Nat Asian /Pac Isl Race More : Hispanic not Hisp. || Races : Alone Alone Alone Alone Alone Alone Races : or Latino or Latino ||Total Households: 150,166 : 142,250 4,845 380 726 17 887 1,061 : 4,329 139,172 || Less Than $10,000 10,039 : 8,631 1,165 35 65 0 40 103 : 292 8,400 || $10,000 - $14,999 8,276 : 7,731 409 25 9 0 59 43 : 389 7,411 || $15,000 - $19,999 10,465 : 9,485 642 40 79 8 95 116 : 469 9,182 || $20,000 - $24,999 10,846 : 10,278 358 34 22 0 68 86 : 339 10,036 || $25,000 - $29,999 10,429 : 9,932 202 27 83 0 56 129 : 346 9,715 || $30,000 - $34,999 11,034 : 10,501 328 35 37 0 88 45 : 304 10,303 || $35,000 - $39,999 9,667 : 9,166 310 17 42 0 81 51 : 339 8,918 || $40,000 - $44,999 9,386 : 9,040 249 0 40 0 8 49 : 175 8,889 || $45,000 - $49,999 8,378 : 7,972 197 21 11 0 111 66 : 298 7,809 || $50,000 - $59,999 14,617 : 13,900 384 20 103 0 117 93 : 428 13,618 || $60,000 - $74,999 14,576 : 13,987 279 33 82 0 70 125 : 345 13,731 || $75,000 - $99,999 13,395 : 12,960 179 39 59 0 51 107 : 275 12,777 || $100,000 - $124,999 6,944 : 6,807 50 27 16 0 23 21 : 112 6,718 || $125,000 - $149,999 3,563 : 3,463 41 24 30 0 0 5 : 49 3,414 || $150,000 - $199,999 3,145 : 3,078 24 0 27 0 8 8 : 56 3,030 || $200,000 or More 5,406 : 5,319 28 3 21 9 12 14 : 113 5,221 || : : || Median $41,957 : $42,568 $22,368 $32,071 $42,813 $200,001 $36,616 $35,607 : $35,285 $42,775 || Mean $60,665 : $61,846 $32,605 $52,617 $57,563 $114,924 $48,889 $44,478 : $49,903 $62,083 ||----------------------------------------------------------------------------------------------------------------------------------------------------||P76-P82/P154a-I/P155A-I/P156A-I/P157A-I FAMILY AND NONFAMILY INCOME IN 1999 BY RACE OF HOUSEHOLDER; PER CAPITA INCOME IN 1999 BY INDIVIDUAL RACE ||Three Universes: Families, Nonfamily Households, All Persons || Native ............|| : Black Amer Ind/ Hawaiian Other Two or : White Alone | || All : White /Af Amer Alaska Nat Asian /Pac Isl Race More : Hispanic not Hispanic | Nonfamily || Races : Alone Alone Alone Alone Alone Alone Races : or Latino or Latino |Households ||Total Families: 95,167 : 89,660 3,329 239 602 9 640 688 : 3,287 87,298 | 54,999 || Less than $10,000 3,386 : 2,649 594 0 51 0 43 49 : 216 2,513 | 7,030 || $10,000 - $14,999 2,685 : 2,351 269 20 8 0 29 8 : 234 2,146 | 5,727 || $15,000 - $19,999 4,460 : 3,782 441 19 56 0 84 78 : 386 3,514 | 6,209 || $20,000 - $24,999 5,577 : 5,160 262 17 15 0 67 56 : 299 4,957 | 5,581 || $25,000 - $29,999 5,856 : 5,467 165 27 83 0 54 60 : 311 5,264 | 4,743 || $30,000 - $34,999 6,835 : 6,440 243 11 36 0 60 45 : 254 6,267 | 4,445 || $35,000 - $39,999 6,178 : 5,787 222 17 23 0 81 48 : 260 5,618 | 3,414 || $40,000 - $44,999 6,436 : 6,189 190 0 36 0 12 9 : 132 6,078 | 2,827 || $45,000 - $49,999 6,026 : 5,779 130 12 21 0 35 49 : 171 5,674 | 2,361 || $50,000 - $59,999 10,605 : 10,086 296 21 84 0 43 75 : 271 9,881 | 3,629 || $60,000 - $74,999 11,097 : 10,629 253 24 63 0 49 79 : 288 10,401 | 3,175 || $75,000 - $99,999 10,408 : 10,051 169 20 39 0 40 89 : 223 9,894 | 2,657 || $100,000 - $124,999 5,499 : 5,377 35 27 16 0 23 21 : 82 5,318 | 1,388 || $125,000 - $149,999 2,872 : 2,788 30 24 30 0 0 0 : 27 2,761 | 620 || $150,000 - $199,999 2,667 : 2,600 24 0 27 0 8 8 : 43 2,565 | 468 || $200,000 or More 4,580 : 4,525 6 0 14 9 12 14 : 90 4,447 | 725 || : : | || Family Median $50,111 : $51,009 $27,813 $46,771 $43,906 $200,001 $34,076 $40,000 : $33,655 $51,376 | N/A || Family Mean $71,762 : N/A N/A N/A N/A N/A N/A N/A : N/A N/A | N/A || NonFamily Median N/A : $28,361 $15,434 $23,558 $35,263 $18,750 $31,588 $25,245 : $25,917 $28,421 | $27,855 || NonFamily Mean N/A : N/A N/A N/A N/A N/A N/A N/A : N/A N/A | $39,751 || Per Capita-All Pers $28,326 : $29,467 $12,392 $23,207 $19,140 $50,420 $13,286 $14,394 : $15,097 $29,921 | N/A |------------------------------------------------------------------------------------------------------------------------------------------------------
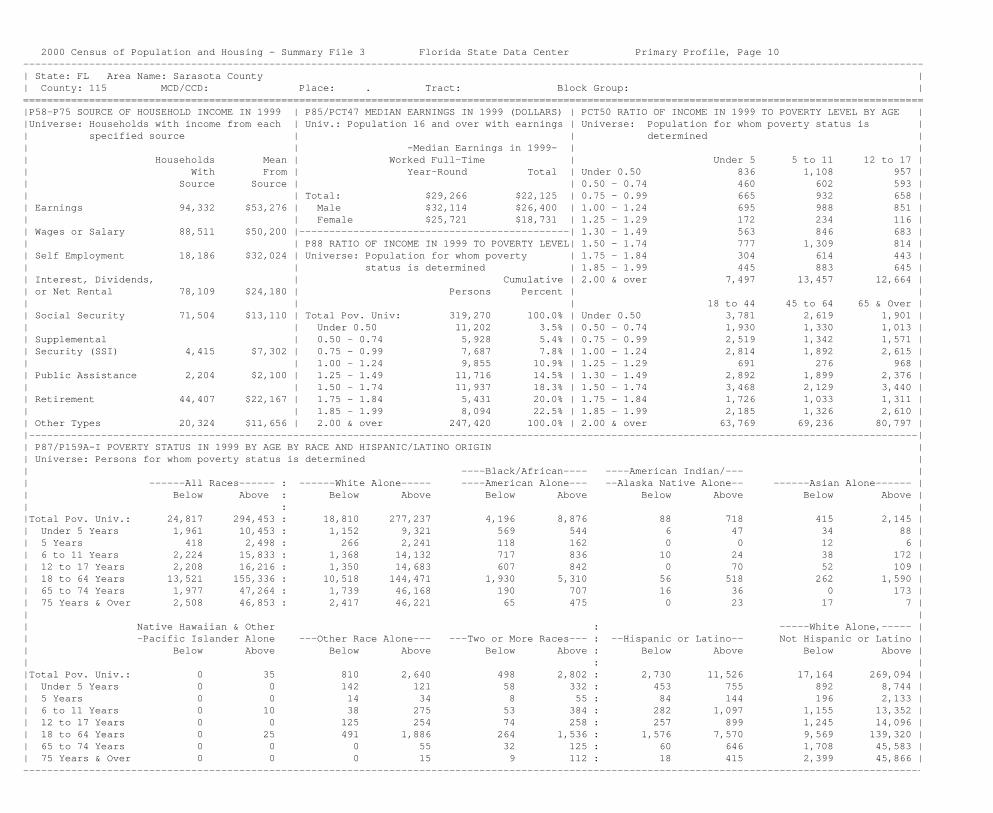
2000 Census of Population and Housing - Summary File 3 Florida State Data Center Primary Profile, Page 10------------------------------------------------------------------------------------------------------------------------------------------------------| State: FL Area Name: Sarasota County || County: 115 MCD/CCD: Place: . Tract: Block Group: |======================================================================================================================================================|P58-P75 SOURCE OF HOUSEHOLD INCOME IN 1999 | P85/PCT47 MEDIAN EARNINGS IN 1999 (DOLLARS) | PCT50 RATIO OF INCOME IN 1999 TO POVERTY LEVEL BY AGE ||Universe: Households with income from each | Univ.: Population 16 and over with earnings | Universe: Population for whom poverty status is || specified source | | determined || | -Median Earnings in 1999- | || Households Mean | Worked Full-Time | Under 5 5 to 11 12 to 17 || With From | Year-Round Total | Under 0.50 836 1,108 957 || Source Source | | 0.50 - 0.74 460 602 593 || | Total: $29,266 $22,125 | 0.75 - 0.99 665 932 658 || Earnings 94,332 $53,276 | Male $32,114 $26,400 | 1.00 - 1.24 695 988 851 || | Female $25,721 $18,731 | 1.25 - 1.29 172 234 116 || Wages or Salary 88,511 $50,200 |---------------------------------------------| 1.30 - 1.49 563 846 683 || | P88 RATIO OF INCOME IN 1999 TO POVERTY LEVEL| 1.50 - 1.74 777 1,309 814 || Self Employment 18,186 $32,024 | Universe: Population for whom poverty | 1.75 - 1.84 304 614 443 || | status is determined | 1.85 - 1.99 445 883 645 || Interest, Dividends, | Cumulative | 2.00 & over 7,497 13,457 12,664 || or Net Rental 78,109 $24,180 | Persons Percent | || | | 18 to 44 45 to 64 65 & Over || Social Security 71,504 $13,110 | Total Pov. Univ: 319,270 100.0% | Under 0.50 3,781 2,619 1,901 || | Under 0.50 11,202 3.5% | 0.50 - 0.74 1,930 1,330 1,013 || Supplemental | 0.50 - 0.74 5,928 5.4% | 0.75 - 0.99 2,519 1,342 1,571 || Security (SSI) 4,415 $7,302 | 0.75 - 0.99 7,687 7.8% | 1.00 - 1.24 2,814 1,892 2,615 || | 1.00 - 1.24 9,855 10.9% | 1.25 - 1.29 691 276 968 || Public Assistance 2,204 $2,100 | 1.25 - 1.49 11,716 14.5% | 1.30 - 1.49 2,892 1,899 2,376 || | 1.50 - 1.74 11,937 18.3% | 1.50 - 1.74 3,468 2,129 3,440 || Retirement 44,407 $22,167 | 1.75 - 1.84 5,431 20.0% | 1.75 - 1.84 1,726 1,033 1,311 || | 1.85 - 1.99 8,094 22.5% | 1.85 - 1.99 2,185 1,326 2,610 || Other Types 20,324 $11,656 | 2.00 & over 247,420 100.0% | 2.00 & over 63,769 69,236 80,797 ||----------------------------------------------------------------------------------------------------------------------------------------------------|| P87/P159A-I POVERTY STATUS IN 1999 BY AGE BY RACE AND HISPANIC/LATINO ORIGIN || Universe: Persons for whom poverty status is determined || ----Black/African---- ----American Indian/--- || ------All Races------ : ------White Alone----- ----American Alone--- --Alaska Native Alone-- ------Asian Alone------ || Below Above : Below Above Below Above Below Above Below Above || : ||Total Pov. Univ.: 24,817 294,453 : 18,810 277,237 4,196 8,876 88 718 415 2,145 || Under 5 Years 1,961 10,453 : 1,152 9,321 569 544 6 47 34 88 || 5 Years 418 2,498 : 266 2,241 118 162 0 0 12 6 || 6 to 11 Years 2,224 15,833 : 1,368 14,132 717 836 10 24 38 172 || 12 to 17 Years 2,208 16,216 : 1,350 14,683 607 842 0 70 52 109 || 18 to 64 Years 13,521 155,336 : 10,518 144,471 1,930 5,310 56 518 262 1,590 || 65 to 74 Years 1,977 47,264 : 1,739 46,168 190 707 16 36 0 173 || 75 Years & Over 2,508 46,853 : 2,417 46,221 65 475 0 23 17 7 || || Native Hawaiian & Other : -----White Alone,----- || -Pacific Islander Alone ---Other Race Alone--- ---Two or More Races--- : --Hispanic or Latino-- Not Hispanic or Latino || Below Above Below Above Below Above : Below Above Below Above || : ||Total Pov. Univ.: 0 35 810 2,640 498 2,802 : 2,730 11,526 17,164 269,094 || Under 5 Years 0 0 142 121 58 332 : 453 755 892 8,744 || 5 Years 0 0 14 34 8 55 : 84 144 196 2,133 || 6 to 11 Years 0 10 38 275 53 384 : 282 1,097 1,155 13,352 || 12 to 17 Years 0 0 125 254 74 258 : 257 899 1,245 14,096 || 18 to 64 Years 0 25 491 1,886 264 1,536 : 1,576 7,570 9,569 139,320 || 65 to 74 Years 0 0 0 55 32 125 : 60 646 1,708 45,583 || 75 Years & Over 0 0 0 15 9 112 : 18 415 2,399 45,866 |------------------------------------------------------------------------------------------------------------------------------------------------------
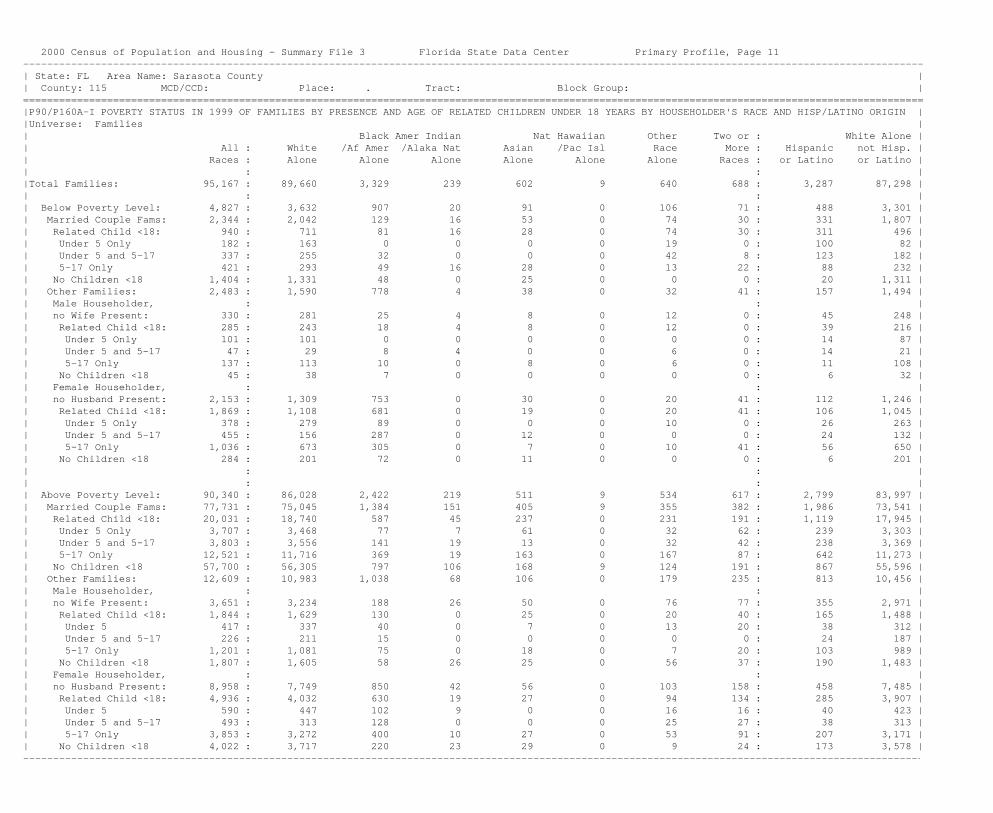
2000 Census of Population and Housing - Summary File 3 Florida State Data Center Primary Profile, Page 11------------------------------------------------------------------------------------------------------------------------------------------------------| State: FL Area Name: Sarasota County || County: 115 MCD/CCD: Place: . Tract: Block Group: |======================================================================================================================================================|P90/P160A-I POVERTY STATUS IN 1999 OF FAMILIES BY PRESENCE AND AGE OF RELATED CHILDREN UNDER 18 YEARS BY HOUSEHOLDER'S RACE AND HISP/LATINO ORIGIN ||Universe: Families || Black Amer Indian Nat Hawaiian Other Two or : White Alone || All : White /Af Amer /Alaka Nat Asian /Pac Isl Race More : Hispanic not Hisp. || Races : Alone Alone Alone Alone Alone Alone Races : or Latino or Latino || : : ||Total Families: 95,167 : 89,660 3,329 239 602 9 640 688 : 3,287 87,298 || : : || Below Poverty Level: 4,827 : 3,632 907 20 91 0 106 71 : 488 3,301 || Married Couple Fams: 2,344 : 2,042 129 16 53 0 74 30 : 331 1,807 || Related Child <18: 940 : 711 81 16 28 0 74 30 : 311 496 || Under 5 Only 182 : 163 0 0 0 0 19 0 : 100 82 || Under 5 and 5-17 337 : 255 32 0 0 0 42 8 : 123 182 || 5-17 Only 421 : 293 49 16 28 0 13 22 : 88 232 || No Children <18 1,404 : 1,331 48 0 25 0 0 0 : 20 1,311 || Other Families: 2,483 : 1,590 778 4 38 0 32 41 : 157 1,494 || Male Householder, : : || no Wife Present: 330 : 281 25 4 8 0 12 0 : 45 248 || Related Child <18: 285 : 243 18 4 8 0 12 0 : 39 216 || Under 5 Only 101 : 101 0 0 0 0 0 0 : 14 87 || Under 5 and 5-17 47 : 29 8 4 0 0 6 0 : 14 21 || 5-17 Only 137 : 113 10 0 8 0 6 0 : 11 108 || No Children <18 45 : 38 7 0 0 0 0 0 : 6 32 || Female Householder, : : || no Husband Present: 2,153 : 1,309 753 0 30 0 20 41 : 112 1,246 || Related Child <18: 1,869 : 1,108 681 0 19 0 20 41 : 106 1,045 || Under 5 Only 378 : 279 89 0 0 0 10 0 : 26 263 || Under 5 and 5-17 455 : 156 287 0 12 0 0 0 : 24 132 || 5-17 Only 1,036 : 673 305 0 7 0 10 41 : 56 650 || No Children <18 284 : 201 72 0 11 0 0 0 : 6 201 || : : || : : || Above Poverty Level: 90,340 : 86,028 2,422 219 511 9 534 617 : 2,799 83,997 || Married Couple Fams: 77,731 : 75,045 1,384 151 405 9 355 382 : 1,986 73,541 || Related Child <18: 20,031 : 18,740 587 45 237 0 231 191 : 1,119 17,945 || Under 5 Only 3,707 : 3,468 77 7 61 0 32 62 : 239 3,303 || Under 5 and 5-17 3,803 : 3,556 141 19 13 0 32 42 : 238 3,369 || 5-17 Only 12,521 : 11,716 369 19 163 0 167 87 : 642 11,273 || No Children <18 57,700 : 56,305 797 106 168 9 124 191 : 867 55,596 || Other Families: 12,609 : 10,983 1,038 68 106 0 179 235 : 813 10,456 || Male Householder, : : || no Wife Present: 3,651 : 3,234 188 26 50 0 76 77 : 355 2,971 || Related Child <18: 1,844 : 1,629 130 0 25 0 20 40 : 165 1,488 || Under 5 417 : 337 40 0 7 0 13 20 : 38 312 || Under 5 and 5-17 226 : 211 15 0 0 0 0 0 : 24 187 || 5-17 Only 1,201 : 1,081 75 0 18 0 7 20 : 103 989 || No Children <18 1,807 : 1,605 58 26 25 0 56 37 : 190 1,483 || Female Householder, : : || no Husband Present: 8,958 : 7,749 850 42 56 0 103 158 : 458 7,485 || Related Child <18: 4,936 : 4,032 630 19 27 0 94 134 : 285 3,907 || Under 5 590 : 447 102 9 0 0 16 16 : 40 423 || Under 5 and 5-17 493 : 313 128 0 0 0 25 27 : 38 313 || 5-17 Only 3,853 : 3,272 400 10 27 0 53 91 : 207 3,171 || No Children <18 4,022 : 3,717 220 23 29 0 9 24 : 173 3,578 |------------------------------------------------------------------------------------------------------------------------------------------------------
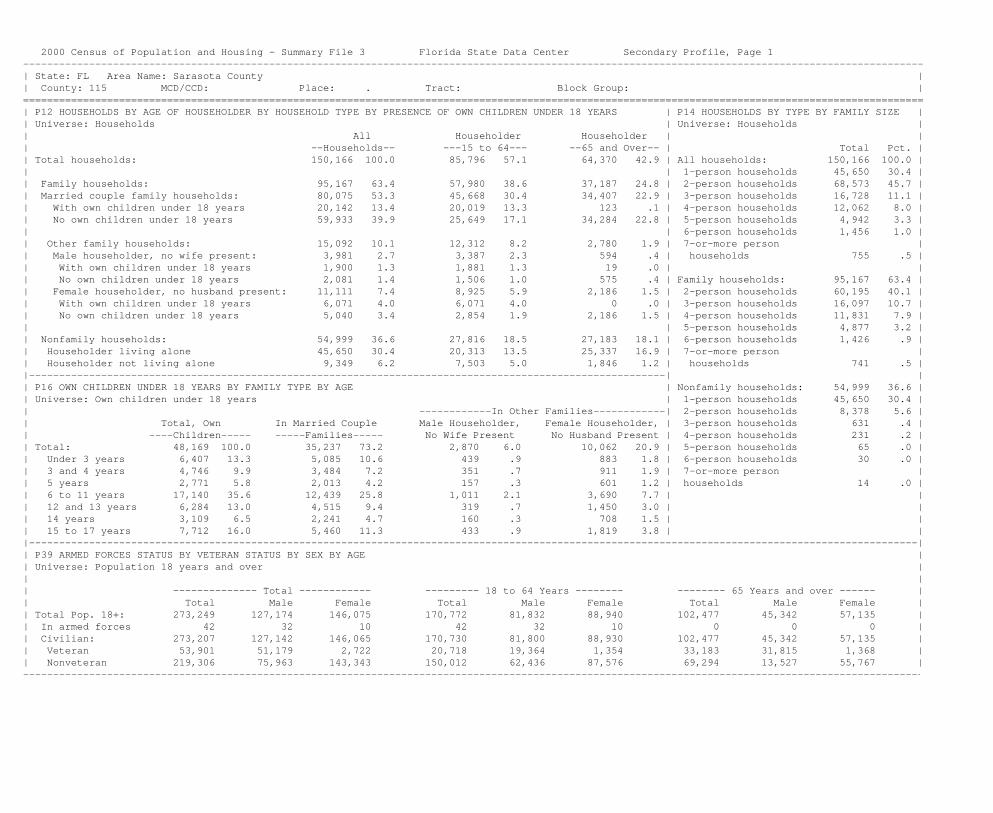
2000 Census of Population and Housing - Summary File 3 Florida State Data Center Secondary Profile, Page 1------------------------------------------------------------------------------------------------------------------------------------------------------| State: FL Area Name: Sarasota County || County: 115 MCD/CCD: Place: . Tract: Block Group: |======================================================================================================================================================| P12 HOUSEHOLDS BY AGE OF HOUSEHOLDER BY HOUSEHOLD TYPE BY PRESENCE OF OWN CHILDREN UNDER 18 YEARS | P14 HOUSEHOLDS BY TYPE BY FAMILY SIZE || Universe: Households | Universe: Households || All Householder Householder | || --Households-- ---15 to 64--- --65 and Over-- | Total Pct. || Total households: 150,166 100.0 85,796 57.1 64,370 42.9 | All households: 150,166 100.0 || | 1-person households 45,650 30.4 || Family households: 95,167 63.4 57,980 38.6 37,187 24.8 | 2-person households 68,573 45.7 || Married couple family households: 80,075 53.3 45,668 30.4 34,407 22.9 | 3-person households 16,728 11.1 || With own children under 18 years 20,142 13.4 20,019 13.3 123 .1 | 4-person households 12,062 8.0 || No own children under 18 years 59,933 39.9 25,649 17.1 34,284 22.8 | 5-person households 4,942 3.3 || | 6-person households 1,456 1.0 || Other family households: 15,092 10.1 12,312 8.2 2,780 1.9 | 7-or-more person || Male householder, no wife present: 3,981 2.7 3,387 2.3 594 .4 | households 755 .5 || With own children under 18 years 1,900 1.3 1,881 1.3 19 .0 | || No own children under 18 years 2,081 1.4 1,506 1.0 575 .4 | Family households: 95,167 63.4 || Female householder, no husband present: 11,111 7.4 8,925 5.9 2,186 1.5 | 2-person households 60,195 40.1 || With own children under 18 years 6,071 4.0 6,071 4.0 0 .0 | 3-person households 16,097 10.7 || No own children under 18 years 5,040 3.4 2,854 1.9 2,186 1.5 | 4-person households 11,831 7.9 || | 5-person households 4,877 3.2 || Nonfamily households: 54,999 36.6 27,816 18.5 27,183 18.1 | 6-person households 1,426 .9 || Householder living alone 45,650 30.4 20,313 13.5 25,337 16.9 | 7-or-more person || Householder not living alone 9,349 6.2 7,503 5.0 1,846 1.2 | households 741 .5 ||----------------------------------------------------------------------------------------------------------| || P16 OWN CHILDREN UNDER 18 YEARS BY FAMILY TYPE BY AGE | Nonfamily households: 54,999 36.6 || Universe: Own children under 18 years | 1-person households 45,650 30.4 || ------------In Other Families------------| 2-person households 8,378 5.6 || Total, Own In Married Couple Male Householder, Female Householder, | 3-person households 631 .4 || ----Children----- -----Families----- No Wife Present No Husband Present | 4-person households 231 .2 || Total: 48,169 100.0 35,237 73.2 2,870 6.0 10,062 20.9 | 5-person households 65 .0 || Under 3 years 6,407 13.3 5,085 10.6 439 .9 883 1.8 | 6-person households 30 .0 || 3 and 4 years 4,746 9.9 3,484 7.2 351 .7 911 1.9 | 7-or-more person || 5 years 2,771 5.8 2,013 4.2 157 .3 601 1.2 | households 14 .0 || 6 to 11 years 17,140 35.6 12,439 25.8 1,011 2.1 3,690 7.7 | || 12 and 13 years 6,284 13.0 4,515 9.4 319 .7 1,450 3.0 | || 14 years 3,109 6.5 2,241 4.7 160 .3 708 1.5 | || 15 to 17 years 7,712 16.0 5,460 11.3 433 .9 1,819 3.8 | ||----------------------------------------------------------------------------------------------------------------------------------------------------|| P39 ARMED FORCES STATUS BY VETERAN STATUS BY SEX BY AGE || Universe: Population 18 years and over || || -------------- Total ------------ --------- 18 to 64 Years -------- -------- 65 Years and over ------ || Total Male Female Total Male Female Total Male Female || Total Pop. 18+: 273,249 127,174 146,075 170,772 81,832 88,940 102,477 45,342 57,135 || In armed forces 42 32 10 42 32 10 0 0 0 || Civilian: 273,207 127,142 146,065 170,730 81,800 88,930 102,477 45,342 57,135 || Veteran 53,901 51,179 2,722 20,718 19,364 1,354 33,183 31,815 1,368 || Nonveteran 219,306 75,963 143,343 150,012 62,436 87,576 69,294 13,527 55,767 |------------------------------------------------------------------------------------------------------------------------------------------------------

2000 Census of Population and Housing - Summary File 3 Florida State Data Center Secondary Profile, Page 2------------------------------------------------------------------------------------------------------------------------------------------------------| State: FL Area Name: Sarasota County || County: 115 MCD/CCD: Place: . Tract: Block Group: |======================================================================================================================================================| P19 LANGUAGE SPOKEN AT HOME AND ABILITY TO SPEAK ENGLISH BY AGE || Universe: Population 5 years old and over || || Total Pct. 5 to 17 Pct. 18 to 64 Pct. 65 & Over Pct. || || Total population 5 years old & over: 313,327 100.0 40,078 12.8 170,772 54.5 102,477 32.7 || || Speak only English 280,340 89.5 35,761 11.4 150,461 48.0 94,118 30.0 || || Speak Spanish: 13,751 4.4 2,657 .8 9,732 3.1 1,362 .4 || Speak English "very well" 7,025 2.2 1,659 .5 4,618 1.5 748 .2 || Speak English "well" 2,895 .9 458 .1 2,141 .7 296 .1 || Speak English "not well" 2,637 .8 384 .1 2,068 .7 185 .1 || Speak English "not at all" 1,194 .4 156 .0 905 .3 133 .0 || || Speak other Indo-European lang.: 15,966 5.1 1,347 .4 8,283 2.6 6,336 2.0 || Speak English "very well" 10,974 3.5 908 .3 5,880 1.9 4,186 1.3 || Speak English "well" 3,559 1.1 343 .1 1,722 .5 1,494 .5 || Speak English "not well" 1,254 .4 96 .0 606 .2 552 .2 || Speak English "not at all" 179 .1 0 .0 75 .0 104 .0 || || Speak Asian & Pacific Isl. lang.: 1,830 .6 232 .1 1,400 .4 198 .1 || Speak English "very well" 839 .3 109 .0 670 .2 60 .0 || Speak English "well" 534 .2 51 .0 396 .1 87 .0 || Speak English "not well" 390 .1 72 .0 297 .1 21 .0 || Speak English "not at all" 67 .0 0 .0 37 .0 30 .0 || || Speak other language: 1,440 .5 81 .0 896 .3 463 .1 || Speak English "very well" 938 .3 78 .0 604 .2 256 .1 || Speak English "well" 353 .1 3 .0 192 .1 158 .1 || Speak English "not well" 107 .0 0 .0 58 .0 49 .0 || Speak English "not at all" 42 .0 0 .0 42 .0 0 .0 ||----------------------------------------------------------------------------------------------------------------------------------------------------|| P20 HOUSEHOLD LANGUAGE BY LINGUISTIC ISOLATION | P22 YEAR OF ENTRY FOR THE FOREIGN BORN | P23 YEAR OF ENTRY BY CITIZENSHIP STATUS FOR THE || Universe: Households | POPULATION | FOREIGN-BORN POPULATION || | Universe: Foreign-born population | Universe: Foreign-born population || | | || Pct. | | Pct. || Total households: 150,166 100.0 | Pct. | Total foreign-born pop.: 30,416 100.0 || English 131,245 87.4 |Total foreign-born pop: 30,416 100.0 | Year of entry 1990 || Spanish: 6,569 4.4 | 1995 to March 2000 6,662 21.9 | to March 2000: 11,219 36.9 || Linguistically isolated 1,490 1.0 | 1990 to 1994 4,557 15.0 | Naturalized citizen 1,055 3.5 || Not linguistically isolated 5,079 3.4 | 1985 to 1989 2,480 8.2 | Not a citizen 10,164 33.4 || Other Indo-European language 10,611 7.1 | 1980 to 1984 2,311 7.6 | Year of entry 1980 || Linguistically isolated: 1,788 1.2 | 1975 to 1979 1,460 4.8 | to 1989: 4,791 15.8 || Not linguistically isolated 8,823 5.9 | 1970 to 1974 1,476 4.9 | Naturalized citizen 2,079 6.8 || Asian or Pacific Island lang.: 846 .6 | 1965 to 1969 1,901 6.3 | Not a citizen 2,712 8.9 || Linguistically isolated 215 .1 | Before 1965 9,569 31.5 | || Not linguistically isolated 631 .4 | | Year of entry before 1980: 14,406 47.4 || Other languages: 895 .6 | | Naturalized citizen 11,508 37.8 || Linguistically isolated 178 .1 | | Not a citizen 2,898 9.5 || Not linguistically isolated 717 .5 | | || | | |------------------------------------------------------------------------------------------------------------------------------------------------------

2000 Census of Population and Housing - Summary File 3 Florida State Data Center Secondary Profile, Page 3------------------------------------------------------------------------------------------------------------------------------------------------------| State: FL Area Name: Sarasota County || County: 115 MCD/CCD: Place: . Tract: Block Group: |======================================================================================================================================================| P32/P33 TRAVEL TIME TO WORK BY MEANS OF TRANSPORTATION TO WORK | P34 TIME LEAVING HOME TO GO TO WORK || Universe: Workers 16 years old and over who did not work at home | Universe: Workers 16 years old and over Pct. || | Total workers 16 years old & over: 132,765 100.0 || Public Other | Did not work at home: 126,586 95.3 || Total Pct. Transp. Pct. Means Pct. | 12:00 a.m. to 4:59 a.m. 2,956 2.2 ||Total out-of-home workers: 126,586 100.0 1,070 .8 125,516 99.2 | 5:00 a.m. to 5:29 a.m. 2,347 1.8 || Less than 30 min. 95,549 75.5 437 .3 95,112 75.1 | 5:30 a.m. to 5:59 a.m. 3,468 2.6 || 30 to 44 min. 20,267 16.0 287 .2 19,980 15.8 | 6:00 a.m. to 6:29 a.m. 7,824 5.9 || 45 to 59 min. 4,925 3.9 127 .1 4,798 3.8 | 6:30 a.m. to 6:59 a.m. 11,806 8.9 || 60 or more min. 5,845 4.6 219 .2 5,626 4.4 | 7:00 a.m. to 7:29 a.m. 17,912 13.5 ||Mean travel time to work 22 minutes 37 minutes 22 minutes | 7:30 a.m. to 7:59 a.m. 22,508 17.0 ||---------------------------------------------------------------------------------------| 8:00 a.m. to 8:29 a.m. 18,745 14.1 || P25 RESIDENCE IN 1995 - MSA/PMSA LEVEL | 8:30 a.m. to 8:59 a.m. 9,558 7.2 || Universe: Population 5 years old and over | 9:00 a.m. to 9:59 a.m. 9,777 7.4 || | 10:00 a.m. to 10:59 a.m. 3,903 2.9 || Total population 5 years old & over: 313,327 100.0 | 11:00 a.m. to 11:59 a.m. 1,547 1.2 || Living in an MSA/PMSA in 2000: 313,327 100.0 | 12:00 p.m. to 3:59 p.m. 7,188 5.4 || Same house in 1995 160,973 51.4 | 4:00 p.m. to 11:59 p.m. 7,047 5.3 || Different house in 1995: 152,354 48.6 | Worked at home 6,179 4.7 || In United States in 1995: 144,489 46.1 |------------------------------------------------------------|| Same MSA/PMSA in 1995: 74,423 23.8 | P35 PRIVATE VEHICLE OCCUPANCY || Central city 36,858 11.8 | Universe: Workers 16 years old and over Pct. || Remainder of this MSA/PMSA 37,565 12.0 | Total workers 16 years old & over: 132,765 100.0 || Different MSA/PMSA in 1995: 62,111 19.8 | Car, truck, or van: 120,672 90.9 || Central city 21,010 6.7 | Drove alone 107,208 80.8 || Remainder of different MSA/PMSA 41,101 13.1 | Carpooled: 13,464 10.1 || Not in an MSA/PMSA in 1995 7,955 2.5 | 2-person carpool 11,183 8.4 || In Puerto Rico in 1995: 281 .1 | 3-person carpool 1,622 1.2 || Same MSA/PMSA: 0 .0 | 4-person carpool 419 .3 || Central city 0 .0 | 5- or 6-person carpool 183 .1 || Remainder of this MSA/PMSA 0 .0 | 7- or more person carpool 57 .0 || Different MSA/PMSA in 1995: 0 .0 | Other means (incl. worked at home) 12,093 9.1 || Central city 0 .0 |------------------------------------------------------------|| Remainder of different MSA/PMSA 0 .0 | P24 RESIDENCE IN 1995 - STATE AND COUNTY LEVEL || Not in an MSA/PMSA in 1995 0 .0 | Universe: Population 5 years old and over || Elsewhere in 1995 7,584 2.4 | Total Population 5 Years Old & Over: 313,327 100.0 || | Same house in 1995 160,973 51.4 || Not living in an MSA/PMSA in 2000: 0 .0 | Different house in 1995: 152,354 48.6 || Same house in 1995 0 .0 | In United States in 1995 144,489 46.1 || Different house in 1995: 0 .0 | Same county 69,935 22.3 || In United States in 1995: 0 .0 | Different county: 74,554 23.8 || In an MSA/PMSA in 1995: 0 .0 | Same state 21,157 6.8 || Central city 0 .0 | Different state: 53,397 17.0 || Remainder of MSA/PMSA 0 .0 | Northeast 21,573 6.9 || Not in an MSA/PMSA in 1995 0 .0 | Midwest 16,665 5.3 || In Puerto Rico in 1995: 0 .0 | South 11,054 3.5 || In an MSA/PMSA in 1995: 0 .0 | West 4,105 1.3 || Central city 0 .0 | In Puerto Rico in 1995: 281 .1 || Remainder of MSA/PMSA 0 .0 | Same municipio 0 .0 || Not in an MSA/PMSA 0 .0 | Different municipio 0 .0 || Elsewhere in 1995 0 .0 | Elsewhere in 1995: 7,584 2.4 || | U.S. Island Areas 208 .1 || | Foreign country 7,376 2.4 |------------------------------------------------------------------------------------------------------------------------------------------------------

2000 Census of Population and Housing - Summary File 3 Florida State Data Center Secondary Profile, Page 4------------------------------------------------------------------------------------------------------------------------------------------------------| State: FL Area Name: Sarasota County || County: 115 MCD/CCD: Place: . Tract: Block Group: |======================================================================================================================================================| P42 DISABILITY STATUS BY EMPLOYMENT STATUS BY SEX BY AGE | P41 TYPES OF DISABILITY FOR THE CIVILIAN NONINSTITUTIONALIZED || Universe: Civilian noninstitutionalized population 5 years old and over | POPULATION BY AGE || | Universe: Total disabilities tallied for the civilian || Total Pct. Male Pct. Female Pct. | noninstitutionalized population 5 years and over with disabilities|| Total: 308,270 100.0 146,184 47.4 162,086 52.6 | || With a disability: 68,356 22.2 33,771 11.0 34,585 11.2 | Pct. || Employed* 21,515 7.0 11,382 3.7 10,133 3.3 | Total disabilities tallied for all age groups: 117,986 100.0 || Not employed* 12,822 4.2 6,672 2.2 6,150 2.0 | Sensory disability 15,030 12.7 || No disability: 239,914 77.8 112,413 36.5 127,501 41.4 | Physical disability 32,886 27.9 || Employed* 102,790 33.3 52,925 17.2 49,865 16.2 | Mental disability 14,873 12.6 || Not employed* 37,963 12.3 12,827 4.2 25,136 8.2 | Self-care disability 8,863 7.5 || 5 to 15 years: 34,571 11.2 17,910 5.8 16,661 5.4 | Go-outside-home disability** 22,616 19.2 || With a disability 1,824 .6 1,204 .4 620 .2 | Employment disability* 23,718 20.1 || No disability 32,747 10.6 16,706 5.4 16,041 5.2 | Total disabilities tallied for 5 to 15 years: 2,300 1.9 || 16 to 20 years: 13,100 4.2 6,992 2.3 6,108 2.0 | Sensory disability 305 .3 || With a disability: 2,030 .7 1,273 .4 757 .2 | Physical disability 233 .2 || Employed 1,218 .4 763 .2 455 .1 | Mental disability 1,555 1.3 || Not employed 812 .3 510 .2 302 .1 | Self-care disability 207 .2 || No disability: 11,070 3.6 5,719 1.9 5,351 1.7 | Total disabilities tallied for 16 to 64 years: 56,756 48.1 || Employed 6,209 2.0 3,279 1.1 2,930 1.0 | Sensory disability 3,486 3.0 || Not employed 4,861 1.6 2,440 .8 2,421 .8 | Physical disability 11,716 9.9 || 21 to 64 years: 161,990 52.5 76,814 24.9 85,176 27.6 | Mental disability 6,459 5.5 || With a disability: 32,307 10.5 16,781 5.4 15,526 5.0 | Self-care disability 2,850 2.4 || Employed 20,297 6.6 10,619 3.4 9,678 3.1 | Go-outside-home disability 8,527 7.2 || Not employed 12,010 3.9 6,162 2.0 5,848 1.9 | Employment disability 23,718 20.1 || No disability: 129,683 42.1 60,033 19.5 69,650 22.6 | Total disabilities tallied for 65+ years: 58,930 49.9 || Employed 96,581 31.3 49,646 16.1 46,935 15.2 | Sensory disability 11,239 9.5 || Not employed 33,102 10.7 10,387 3.4 22,715 7.4 | Physical disability 20,937 17.7 || 65 to 74 years: 49,248 16.0 22,928 7.4 26,320 8.5 | Mental disability 6,859 5.8 || With a disability 10,940 3.5 5,440 1.8 5,500 1.8 | Self-care disability 5,806 4.9 || No disability 38,308 12.4 17,488 5.7 20,820 6.8 | Go-outside-home disability 14,089 11.9 || 75 years and over: 49,361 16.0 21,540 7.0 27,821 9.0 | || With a disability 21,255 6.9 9,073 2.9 12,182 4.0 | || No disability 28,106 9.1 12,467 4.0 15,639 5.1 | ||----------------------------------------------------------------------------------------------------------------------------------------------------|| P40 PERIOD OF MILITARY SERVICE FOR VETERAN CIVILIANS || Universe: Civilian veterans 18 years old and over || || Total civilian veterans 18 years old & over 53,901 100.0 | || August 1990 or later: 2,342 4.3 | Vietnam era, no Korean War, no World War II, || Served in Vietnam era 298 .6 | no August 1990 or later 9,134 16.9 || No Vietnam era service: 2,044 3.8 | Vietnam era and Korean War, no World War II, || Served Sept. 1980 or later only: 1,803 3.3 | no August 1990 or later 435 .8 || Served under 2 years 336 .6 | Vietnam era, Korean War, and World War II, || Served 2 or more years 1,467 2.7 | no August 1990 or later 478 .9 || Served prior to Sept. 1980 241 .4 | February 1955 to July 1964 only 6,425 11.9 || May 1975 to July 1990 only: 3,926 7.3 | Korean War, no Vietnam era, no World War II 8,684 16.1 || September 1980 to July 1990 only: 2,115 3.9 | Korean War and World War II, no Vietnam era 1,517 2.8 || Served under 2 years 451 .8 | World War II, no Korean War, no Vietnam era 20,422 37.9 || Served 2 or more years 1,664 3.1 | Other service only 538 1.0 || Other May 1975 to July 1990 service 1,811 3.4 | ||----------------------------------------------------------------------------------------------------------------------------------------------------||* Employment status by disability status was determined only for the 16 to 64 year old population. ||** Go-outside-home disability status was determined only for the 16 year old and over population. |------------------------------------------------------------------------------------------------------------------------------------------------------

2000 Census of Population and Housing - Summary File 3 Florida State Data Center Ancestry Profile, Page 1----------------------------------------------------------------------------------------------------------------------------------------------------| State: FL Area Name: Sarasota County || County: 115 MCD/CCD: Place: . Tract: Block Group: |===================================================================================================================================================|| PCT15 ANCESTRY SUMMARY || Universe: Total Population ( 325,957) || Pct. Pct. || Total persons reporting a classifiable ancestry: 268,225 82.3 : Total persons not reporting a classifiable ancestry: 57,732 17.7 || Reporting a single ancestry 178,513 54.8 : Ancestry not classifiable by the Census Bureau 2,480 .8 || Reporting multiple ancestries 89,712 27.5 : No ancestry reported by the respondent 55,252 17.0 ||--------------------------------------------------------------------------------------------------------------------------------------------------|| PCT16/PCT17. ANCESTRY || Universe: Total population || || First Second First Second First Second || Ancestry Ancestry Ancestry Ancestry Ancestry Ancestry || Reported Reported Reported Reported Reported Reported || Ancestry reported: 268,225 89,712 || Acadian/Cajun 29 0 French (except Basque) 8,341 5,816 Kenyan 0 0 || Afghan 0 0 French Canadian 3,407 626 Liberian 0 0 || Albanian 33 77 German 46,188 19,454 Nigerian 20 0 || Alsatian 28 37 German Russian 0 0 Senegalese 0 0 || Arab: 1,047 182 Greek 1,569 253 Sierra Leonean 0 0 || Egyptian 58 0 Guyanese 55 8 Somalian 0 0 || Iraqi 8 0 Hungarian 2,687 962 South African 77 7 || Jordanian 23 0 Icelander 19 19 Sudanese 0 0 || Lebanese 509 99 Iranian 60 0 Ugandan 0 0 || Moroccan 150 17 Irish 30,650 16,167 Zairian 0 0 || Palestinian 118 0 Israeli 66 0 Zimbabwean 0 0 || Syrian 73 21 Italian 21,595 3,487 African 636 36 || Arab/Arabic 82 36 Latvian 202 22 Other Subsaharan African 0 0 || Other Arab 26 9 Lithuanian 884 423 Swedish 4,264 1,954 || Armenian 286 61 Luxemburger 131 0 Swiss 1,230 732 || Assyrian/Chaldean/Syriac 9 0 Macedonian 50 0 Turkish 108 0 || Australian 130 23 Maltese 25 20 Ukrainian 1,719 383 || Austrian 1,181 595 New Zealander 0 17 United States or American* 23,253 0 || Basque 26 0 Northern European 189 0 Welsh 1,775 1,571 || Belgian 383 167 Norwegian 2,660 932 West Indian (excluding || Brazilian 301 0 Pennsylvania German 212 117 Hispanic groups): 1,091 99 || British 2,115 271 Polish 10,244 3,810 Bahamian 35 5 || Bulgarian 84 15 Portuguese 719 318 Barbadian 23 0 || Canadian 1,632 349 Romanian 541 203 Belizean 11 6 || Carpatho Rusyn 0 0 Russian 4,374 1,089 Bermudan 0 0 || Celtic 22 23 Scandinavian 369 138 British West Indian 65 0 || Croatian 279 79 Scotch-Irish 5,594 1,673 Dutch West Indian 0 0 || Cypriot 15 0 Scottish 6,448 3,162 Haitian 167 30 || Czech 1,150 588 Serbian 275 49 Jamaican 618 21 || Czechoslovakian 541 175 Slavic 77 66 Trinidadian & Tobagonian 50 0 || Danish 951 580 Slovak 959 231 U.S. Virgin Islander 32 0 || Dutch 4,083 2,982 Slovene 131 63 West Indian 90 37 || Eastern European 205 9 Soviet Union 0 0 Other West Indian 0 0 || English 34,471 13,602 Subsaharan African: 776 43 Yugoslavian 489 64 || Estonian 70 0 Cape Verdean 15 0 Other groups** 33,645 5,617 || European 1,515 31 Ethiopian 28 0 Unclassified or not || Finnish 568 278 Ghanian 0 0 reported 57,732 236,245 || || * Includes only people reporting "U.S." or "American" as their sole ancestry. For example, "Irish-American" is tallied as "Irish." || ** Includes most reported ancestries which are equivalent to race & Hispanic/Latino origin groups, such as Cree, Thai, Samoan, & Cuban. ||__________________________________________________________________________________________________________________________________________________|

2000 Census of Population and Housing - Summary File 3 Florida State Data Center Ancestry Profile, Page 2------------------------------------------------------------------------------------------------------------------------------------------| State: FL Area Name: Sarasota County || County: 115 MCD/CCD: Place: . Tract: Block Group: |=========================================================================================================================================|| || PCT18. ANCESTRY (TOTAL CATEGORIES TALLIED***) || Universe: Total ancestry categories tallied for people with one or more ancestry categories reported || || Specified Pct. Specified Pct. Specified Pct. || Ancestries of Ancestries of Ancestries of || Tallied Pop. Tallied Pop. Tallied Pop. || Total population 325,957 100.00 || Total ancestries tallied: 357,937 109.81 || Acadian/Cajun 29 .01 French (except Basque) 14,157 4.34 Kenyan 0 .00 || Afghan 0 .00 French Canadian 4,033 1.24 Liberian 0 .00 || Albanian 110 .03 German 65,642 20.14 Nigerian 20 .01 || Alsatian 65 .02 German Russian 0 .00 Senegalese 0 .00 || Arab: 1,229 .38 Greek 1,822 .56 Sierra Leonean 0 .00 || Egyptian 58 .02 Guyanese 63 .02 Somalian 0 .00 || Iraqi 8 .00 Hungarian 3,649 1.12 South African 84 .03 || Jordanian 23 .01 Icelander 38 .01 Sudanese 0 .00 || Lebanese 608 .19 Iranian 60 .02 Ugandan 0 .00 || Moroccan 167 .05 Irish 46,817 14.36 Zairian 0 .00 || Palestinian 118 .04 Israeli 66 .02 Zimbabwean 0 .00 || Syrian 94 .03 Italian 25,082 7.69 African 672 .21 || Arab/Arabic 118 .04 Latvian 224 .07 Other Subsaharan African 0 .00 || Other Arab 35 .01 Lithuanian 1,307 .40 Swedish 6,218 1.91 || Armenian 347 .11 Luxemburger 131 .04 Swiss 1,962 .60 || Assyrian/Chaldean/Syriac 9 .00 Macedonian 50 .02 Turkish 108 .03 || Australian 153 .05 Maltese 45 .01 Ukrainian 2,102 .64 || Austrian 1,776 .54 New Zealander 17 .01 United States or American* 23,253 7.13 || Basque 26 .01 Northern European 189 .06 Welsh 3,346 1.03 || Belgian 550 .17 Norwegian 3,592 1.10 West Indian (excluding || Brazilian 301 .09 Pennsylvania German 329 .10 Hispanic groups): 1,190 .37 || British 2,386 .73 Polish 14,054 4.31 Bahamian 40 .01 || Bulgarian 99 .03 Portuguese 1,037 .32 Barbadian 23 .01 || Canadian 1,981 .61 Romanian 744 .23 Belizean 17 .01 || Carpatho Rusyn 0 .00 Russian 5,463 1.68 Bermudan 0 .00 || Celtic 45 .01 Scandinavian 507 .16 British West Indian 65 .02 || Croatian 358 .11 Scotch-Irish 7,267 2.23 Dutch West Indian 0 .00 || Cypriot 15 .00 Scottish 9,610 2.95 Haitian 197 .06 || Czech 1,738 .53 Serbian 324 .10 Jamaican 639 .20 || Czechoslovakian 716 .22 Slavic 143 .04 Trinidadian & Tobagonian 50 .02 || Danish 1,531 .47 Slovak 1,190 .37 U.S. Virgin Islander 32 .01 || Dutch 7,065 2.17 Slovene 194 .06 West Indian 127 .04 || Eastern European 214 .07 Soviet Union 0 .00 Other West Indian 0 .00 || English 48,073 14.75 Subsaharan African: 819 .25 Yugoslavian 553 .17 || Estonian 70 .02 Cape Verdean 15 .00 Other groups** 39,262 12.05 || European 1,546 .47 Ethiopian 28 .01 || Finnish 846 .26 Ghanian 0 .00 || || * Includes only people reporting "U.S." or "American" as their sole ancestry. For example, "Irish-American" is tallied as "Irish." || ** Includes reported ancestries which are considered the same as names of race or Latino origin groups, such as Cree, Thai, Samoan, || and Cuban. || *** Total ancestries tallied is the total number of people reporting each specific ancestry either first or second in their response || to the ancestry question. For example, someone responding "Irish-German-Dutch" is counted in both the Irish and German ancestry || groups, but the third response is not tallied. Total tallies can be greater than the total population, even though many people || left this question unanswered. This is the only question the Census Bureau did not impute answers to for non-respondents. ||________________________________________________________________________________________________________________________________________|

2000 Census of Population and Housing - Summary File 3 Florida State Data Center Ancestry Profile, Page 3----------------------------------------------------------------------------------------------------------------------------------------------------| State: FL Area Name: Sarasota County || County: 115 MCD/CCD: Place: . Tract: Block Group: |===================================================================================================================================================|| || || PCT19. PLACE OF BIRTH FOR THE FOREIGN-BORN POPULATION || Universe: Foreign-born population ( 30,416 or 9.3% of Total population: 325,957 ) || || || || Europe: 14,145 Asia: 2,605 Africa: 407 Americas: 13,086|| Northern Europe: 3,424 Eastern Asia: 597 Eastern Africa: 47 Latin America 9,533|| United Kingdom 2,740 China: 303 Ethiopia 0 Caribbean: 2,457|| Ireland 265 China, excluding Hong Kong Other Eastern Africa 47 Barbados 31|| Sweden 250 & Taiwan 214 Middle Africa 21 Cuba 1,323|| Other Northern Europe 169 Hong Kong 35 Northern Africa: 180 Dominican Republic 220|| Western Europe: 4,155 Taiwan 54 Egypt 57 Haiti 117|| Austria 192 Japan 157 Other Northern Africa 123 Jamaica 485|| France 488 Korea 137 Southern Africa: 128 Trinidad & Tobago 115|| Germany 2,995 Other Eastern Asia 0 South Africa 128 Other Caribbean 166|| Netherlands 275 South Central Asia: 287 Other Southern Africa 0 Central America: 4,699|| Other Western Europe 205 Afghanistan 0 Western Africa: 31 Mexico 4,078|| Southern Europe: 1,189 Bangladesh 7 Ghana 0 Other Central America: 621|| Greece 219 India 226 Nigeria 15 Costa Rica 95|| Italy 830 Iran 19 Sierra Leone 0 El Salvador 110|| Portugal 47 Pakistan 10 Other Western Africa 16 Guatemala 42|| Spain 77 Other S. Central Asia 25 Africa, n.e.c.(1) 0 Honduras 157|| Other Southern Europe 16 South Eastern Asia: 1,320 Nicaragua 110|| Eastern Europe: 5,377 Cambodia 29 Oceania: 173 Panama 98|| Czechoslovakia 505 Indonesia 111 Australia & New Zealand Other C. America 9|| Hungary 787 Laos 40 Subregion: 133 South America: 2,377|| Poland 1,018 Malaysia 28 Australia 103 Argentina 202|| Romania 213 Philippines 452 Other Australian Bolivia 29|| Belarus 126 Thailand 116 & New Zealand Subregion 30 Brazil 330|| Russia 589 Vietnam 535 Melanesia 9 Chile 123|| Ukraine 1,000 Other S. Eastern Asia 9 Micronesia 31 Colombia 799|| Bosnia & Herzegovina 100 Western Asia: 361 Polynesia 0 Ecuador 99|| Yugoslavia 550 Iraq 0 Oceania, n.e.c.(1) 0 Guyana 64|| Other Eastern Europe 489 Israel 119 Peru 436|| Europe, n.e.c.(1) 0 Jordan 34 Venezuela 220|| Lebanon 99 Other South America 75|| Syria 0 Northern America: 3,553|| Turkey 91 Canada 3,553|| Armenia 0 Other N. America 0|| Other Western Asia 18 || Asia, n.e.c.(1) 40 Born at sea 0|| || || || || 1. Not elsewhere classified ||__________________________________________________________________________________________________________________________________________________|

2000 Census of Population and Housing - Summary File 3 Florida State Data Center Disability Profile Page 1------------------------------------------------------------------------------------------------------------------------------------------------------| State: FL Area Name: Sarasota County || County: 115 MCD/CCD: Place: . Tract: Block Group: |======================================================================================================================================================| P41. TYPES OF DISABILITY BY AGE FOR THE CIVILIAN NON-INSTITUTIONAL POPULATION 5 YEARS AND OVER WITH DISABILITIES || Universe: Total Disabilities Tallied for the Civilian Non-Institutionalized Population 5 Years and Over with Disabilities || || Total 5 to 15 16 to 64 65 & over || || Total disabilities: 117,986 2,300 56,756 58,930 || Sensory disability 15,030 305 3,486 11,239 || Physical disability 32,886 233 11,716 20,937 || Mental disability 14,873 1,555 6,459 6,859 || Self-care disability 8,863 207 2,850 5,806 || Go-outside-home disability** 22,616 8,527 14,089 || Employment disability* 23,718 23,718 || ||----------------------------------------------------------------------------------------------------------------------------------------------------|| P42 DISABILITY STATUS BY EMPLOYMENT STATUS BY SEX BY AGE FOR THE CIVILIAN NON-INSTITUTIONAL POPULATION 5 YEARS AND OVER || Universe: Civilian Non-Institutionalized Population 5 Years and over || || ------------------------- Male ------------------------- ------------------------- Female ---------------------- || Total 5 to 15 16 to 20 21 to 64 65 to 74 75 & over 5 to 15 16 to 20 21 to 64 65 to 74 75 & over || || With a disability: 68,356 1,204 1,273 16,781 5,440 9,073 620 757 15,526 5,500 12,182 || Employed* 21,515 763 10,619 455 9,678 || Not employed* 12,822 510 6,162 302 5,848 || No disability: 239,914 16,706 5,719 60,033 17,488 12,467 16,041 5,351 69,650 20,820 15,639 || Employed* 102,790 3,279 49,646 2,930 46,935 || Not employed* 37,963 2,440 10,387 2,421 22,715 || ||----------------------------------------------------------------------------------------------------------------------------------------------------|| PCT26. TYPES OF DISABILITY BY SEX BY AGE FOR THE CIVILIAN NON-INSTITUTIONALIZED POPULATION 5 YEARS AND OVER || Universe: Civilian Non-Institutionalized Population 5 Years and over || || --------------------- Male ------------------ --------------------- Female ---------------- || Total 5 to 15 16 to 20 21 to 64 65 & over 5 to 15 16 to 20 21 to 64 65 & over || || With one type of disability: 40,035 1,002 944 10,142 8,661 487 490 9,171 9,138 || Sensory disability 5,806 74 58 939 2,455 63 12 592 1,613 || Physical disability 12,297 61 19 1,592 3,896 16 5 1,865 4,843 || Mental disability 3,500 841 243 656 414 379 94 523 350 || Self-care disability 141 26 0 8 21 29 0 18 39 || Go-outside-home disability** 5,164 92 386 1,875 88 430 2,293 || Employment disability* 13,127 532 6,561 291 5,743 || || With two or more types of disability: 28,321 202 329 6,639 5,852 133 267 6,355 8,544 || Includes self-care disability 8,722 83 70 1,136 2,026 69 19 1,599 3,720 || Doesn't include self-care disability: 19,599 119 259 5,503 3,826 64 248 4,756 4,824 || Go-outside-home** & employment only* 3,150 117 1,559 126 1,348 || Other combination 7,616 142 3,944 122 3,408 || No disability 239,914 16,706 5,719 60,033 29,955 16,041 5,351 69,650 36,459 || ||----------------------------------------------------------------------------------------------------------------------------------------------------||* Employment status by disability status was determined only for the 16 to 64 year old population. ||** Go-outside-home disability status was determined only for the 16 year old and over population. ||----------------------------------------------------------------------------------------------------------------------------------------------------|
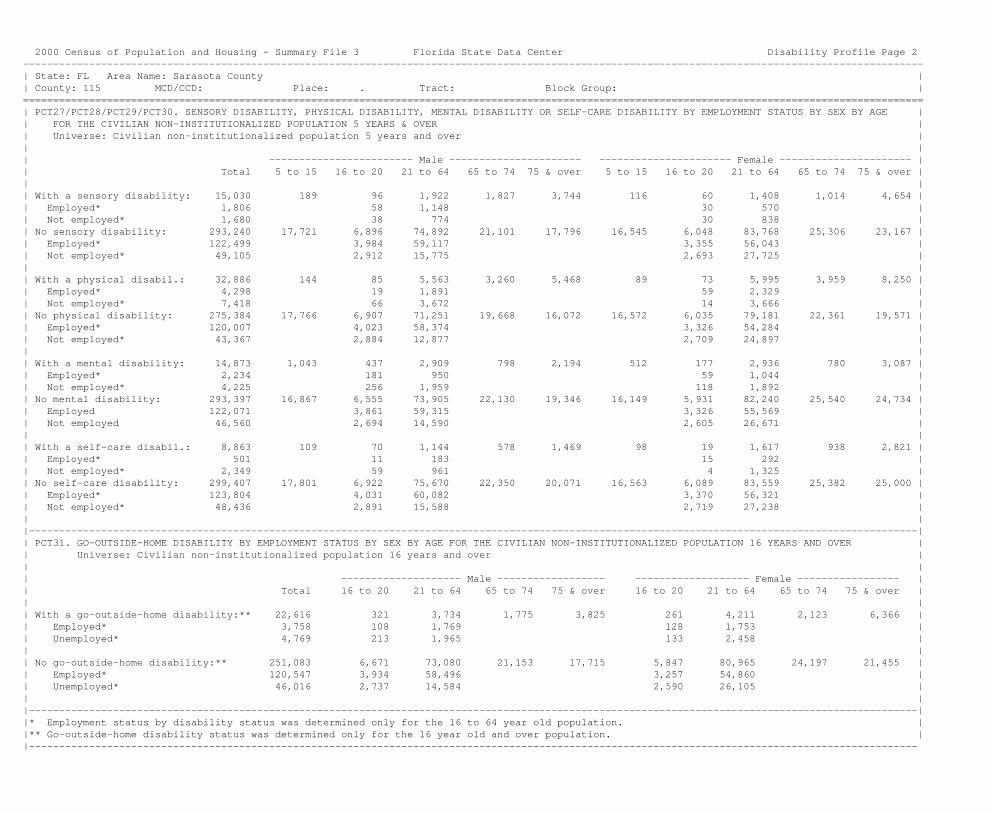
2000 Census of Population and Housing - Summary File 3 Florida State Data Center Disability Profile Page 2------------------------------------------------------------------------------------------------------------------------------------------------------| State: FL Area Name: Sarasota County || County: 115 MCD/CCD: Place: . Tract: Block Group: |======================================================================================================================================================| PCT27/PCT28/PCT29/PCT30. SENSORY DISABILITY, PHYSICAL DISABILITY, MENTAL DISABILITY OR SELF-CARE DISABILITY BY EMPLOYMENT STATUS BY SEX BY AGE || FOR THE CIVILIAN NON-INSTITUTIONALIZED POPULATION 5 YEARS & OVER || Universe: Civilian non-institutionalized population 5 years and over || || ------------------------ Male ---------------------- ---------------------- Female ---------------------- || Total 5 to 15 16 to 20 21 to 64 65 to 74 75 & over 5 to 15 16 to 20 21 to 64 65 to 74 75 & over || || With a sensory disability: 15,030 189 96 1,922 1,827 3,744 116 60 1,408 1,014 4,654 || Employed* 1,806 58 1,148 30 570 || Not employed* 1,680 38 774 30 838 || No sensory disability: 293,240 17,721 6,896 74,892 21,101 17,796 16,545 6,048 83,768 25,306 23,167 || Employed* 122,499 3,984 59,117 3,355 56,043 || Not employed* 49,105 2,912 15,775 2,693 27,725 || || With a physical disabil.: 32,886 144 85 5,563 3,260 5,468 89 73 5,995 3,959 8,250 || Employed* 4,298 19 1,891 59 2,329 || Not employed* 7,418 66 3,672 14 3,666 || No physical disability: 275,384 17,766 6,907 71,251 19,668 16,072 16,572 6,035 79,181 22,361 19,571 || Employed* 120,007 4,023 58,374 3,326 54,284 || Not employed* 43,367 2,884 12,877 2,709 24,897 || || With a mental disability: 14,873 1,043 437 2,909 798 2,194 512 177 2,936 780 3,087 || Employed* 2,234 181 950 59 1,044 || Not employed* 4,225 256 1,959 118 1,892 || No mental disability: 293,397 16,867 6,555 73,905 22,130 19,346 16,149 5,931 82,240 25,540 24,734 || Employed 122,071 3,861 59,315 3,326 55,569 || Not employed 46,560 2,694 14,590 2,605 26,671 || || With a self-care disabil.: 8,863 109 70 1,144 578 1,469 98 19 1,617 938 2,821 || Employed* 501 11 183 15 292 || Not employed* 2,349 59 961 4 1,325 || No self-care disability: 299,407 17,801 6,922 75,670 22,350 20,071 16,563 6,089 83,559 25,382 25,000 || Employed* 123,804 4,031 60,082 3,370 56,321 || Not employed* 48,436 2,891 15,588 2,719 27,238 || ||----------------------------------------------------------------------------------------------------------------------------------------------------|| PCT31. GO-OUTSIDE-HOME DISABILITY BY EMPLOYMENT STATUS BY SEX BY AGE FOR THE CIVILIAN NON-INSTITUTIONALIZED POPULATION 16 YEARS AND OVER || Universe: Civilian non-institutionalized population 16 years and over || || -------------------- Male ------------------ ------------------- Female ----------------- || Total 16 to 20 21 to 64 65 to 74 75 & over 16 to 20 21 to 64 65 to 74 75 & over || || With a go-outside-home disability:** 22,616 321 3,734 1,775 3,825 261 4,211 2,123 6,366 || Employed* 3,758 108 1,769 128 1,753 || Unemployed* 4,769 213 1,965 133 2,458 || || No go-outside-home disability:** 251,083 6,671 73,080 21,153 17,715 5,847 80,965 24,197 21,455 || Employed* 120,547 3,934 58,496 3,257 54,860 || Unemployed* 46,016 2,737 14,584 2,590 26,105 || ||----------------------------------------------------------------------------------------------------------------------------------------------------||* Employment status by disability status was determined only for the 16 to 64 year old population. ||** Go-outside-home disability status was determined only for the 16 year old and over population. ||----------------------------------------------------------------------------------------------------------------------------------------------------|

2000 Census of Population and Housing - Summary File 3 Florida State Data Center Disability Profile Page 3------------------------------------------------------------------------------------------------------------------------------------------------------| State: FL Area Name: Sarasota County || County: 115 MCD/CCD: Place: . Tract: Block Group: |======================================================================================================================================================| PCT32. EMPLOYMENT DISABILITY BY EMPLOYMENT STATUS BY SEX BY AGE FOR THE CIVILIAN NON-INSTITUTIONALIZED POPULATION 16 TO 64 YEARS* || Universe: Civilian non-institutionalized population 16 to 64 years || || --------- Male --------- -------- Female -------- || Total 16 to 20 21 to 64 16 to 20 21 to 64 || || With an employment disability: 23,718 793 11,801 492 10,632 || Employed 16,600 592 8,171 364 7,473 || Unemployed 7,118 201 3,630 128 3,159 || || No employment disability: 151,372 6,199 65,013 5,616 74,544 || Employed 107,705 3,450 52,094 3,021 49,140 || Unemployed 43,667 2,749 12,919 2,595 25,404 || ||----------------------------------------------------------------------------------------------------------------------------------------------------|| PCT33. DISABILITY STATUS BY SCHOOL ENROLLMENT BY EDUCATIONAL ATTAINMENT BY SEX FOR THE CIVILIAN NON-INSTITUTIONALIZED POPULATION 18 TO 34 YEARS || Universe: Civilian non-institutionalized population 18 to 34 Years || || Total Male Female Total Male Female || With a disability: 7,646 4,255 3,391 No disability: 36,579 17,915 18,664 || Enrolled in school: 1,275 783 492 Enrolled in school: 7,553 3,360 4,193 || Below college 439 269 170 Below college 2,108 1,178 930 || College or graduate school 836 514 322 College or graduate school 5,445 2,182 3,263 || Not enrolled in school: 6,371 3,472 2,899 Not enrolled in school: 29,026 14,555 14,471 || Not high school graduate 1,867 1,169 698 Not high school graduate 5,160 2,996 2,164 || High school graduate High school graduate || (includes equivalency) 2,357 1,181 1,176 (includes equivalency) 10,041 5,290 4,751 || Some college, no degree 1,215 627 588 Some college, no degree 5,873 2,885 2,988 || Associate degree 298 206 92 Associate degree 2,013 900 1,113 || Bachelor's degree 499 221 278 Bachelor's degree 4,609 1,899 2,710 || Graduate or professional degree 135 68 67 Graduate or professional degree 1,330 585 745 || ||----------------------------------------------------------------------------------------------------------------------------------------------------|| PCT34. DISABILITY STATUS BY POVERTY STATUS BY SEX BY AGE FOR THE CIVILIAN NON-INSTITUTIONALIZED POPULATION 5 AND OVER IN THE POVERTY UNIVERSE** || Universe: Civilian non-institutionalized population 5 years and over for whom poverty status is determined || || ------------------ Male ------------------- ------------------- Female --------------- || Total 5 to 15 16 to 20 21 to 64 65 & over 5 to 15 16 to 20 21 to 64 65 & over || || With a disability: 68,164 1,148 1,222 16,750 14,513 590 757 15,502 17,682 || Income in 1999 below poverty level 6,747 92 134 1,982 672 118 197 2,236 1,316 || Income in 1999 at or above poverty level 61,417 1,056 1,088 14,768 13,841 472 560 13,266 16,366 || || No disability: 238,650 16,377 5,481 59,958 29,955 15,799 5,103 69,525 36,452 || Income in 1999 below poverty level 16,109 2,044 651 3,313 921 1,942 840 4,822 1,576 || Income in 1999 at or above poverty level 222,541 14,333 4,830 56,645 29,034 13,857 4,263 64,703 34,876 || ||----------------------------------------------------------------------------------------------------------------------------------------------------||* Employment status by disability status was determined only for the 16 to 64 year old population. ||** Persons for whom poverty was determined includes everyone EXCEPT (1) persons in institutions, military group quarters, and college dormitories || and (2) unrelated individuals under 15 years old (children who are not related family members). ||----------------------------------------------------------------------------------------------------------------------------------------------------|

2000 Census of Population and Housing - Summary File 3 Florida State Data Center Disability Profile Page 4------------------------------------------------------------------------------------------------------------------------------------------------------| State: FL Area Name: Sarasota County || County: 115 MCD/CCD: Place: . Tract: Block Group: |======================================================================================================================================================| PCT67 A-I. TYPES OF DISABILITY BY AGE BY RACE (*) AND HISPANIC/LATINO ORIGIN (**) || Universe: Total disabilities tallied for the civilian non-institutionalized population 5 years and over with disabilities || || Native : || American Hawaiian : || Black or Indian & Other : White || African & Alaska Pacific Some Two : Alone, Not || White American Native Asian Islander Other Race or More : Hispanic Hispanic || Alone Alone Alone Alone Alone Alone Races : or Latino or Latino || Age 5 to 15 years -- : || Total disabilities: 1,918 218 6 0 10 62 86 : 123 1,849 || Sensory disability 259 26 0 0 0 6 14 : 10 255 || Physical disability 184 21 0 0 0 26 2 : 29 181 || Mental disability 1,310 131 6 0 10 30 68 : 73 1,259 || Self-care disability 165 40 0 0 0 0 2 : 11 154 || : || Age 16 to 64 years -- : || Total disabilities: 50,272 4,169 261 413 8 785 848 : 3,362 47,987 || Sensory disability 3,210 197 27 0 0 22 30 : 127 3,100 || Physical disability 10,420 979 70 20 0 66 161 : 249 10,231 || Mental disability 5,752 458 25 24 0 55 145 : 285 5,543 || Self-care disability 2,507 279 10 0 0 19 35 : 150 2,374 || Go-outside-home disability*** 7,316 776 21 103 0 181 130 : 757 6,828 || Employment disability**** 21,067 1,480 108 266 8 442 347 : 1,794 19,911 || : || Age 65 years and over -- : || Total disabilities: 57,087 1,440 59 96 0 31 217 : 829 56,359 || Sensory disability 10,956 232 17 18 0 0 16 : 71 10,885 || Physical disability 20,310 469 33 41 0 8 76 : 248 20,076 || Mental disability 6,641 168 9 14 0 0 27 : 119 6,537 || Self-care disability 5,553 220 0 14 0 0 19 : 72 5,497 || Go-outside-home disability*** 13,627 351 0 9 0 23 79 : 319 13,364 ||....................................................................................................................................................|| Age 5 years and over -- || Total disabilities: 109,277 5,827 326 509 18 878 1,151 : 4,314 106,195 || Sensory disability 14,425 455 44 18 0 28 60 : 208 14,240 || Physical disability 30,914 1,469 103 61 0 100 239 : 526 30,488 || Mental disability 13,703 757 40 38 10 85 240 : 477 13,339 || Self-care disability 8,225 539 10 14 0 19 56 : 233 8,025 || : || Age 5 years and over : || Total disabilities: 100.0% 100.0% 100.0% 100.0% 100.0% 100.0% 100.0% : 100.0% 100.0% || Sensory disability 13.2% 7.8% 13.5% 3.5% .0% 3.2% 5.2% : 4.8% 13.4% || Physical disability 28.3% 25.2% 31.6% 12.0% .0% 11.4% 20.8% : 12.2% 28.7% || Mental disability 12.5% 13.0% 12.3% 7.5% 55.6% 9.7% 20.9% : 11.1% 12.6% || Self-care disability 7.5% 9.3% 3.1% 2.8% .0% 2.2% 4.9% : 5.4% 7.6% || ||----------------------------------------------------------------------------------------------------------------------------------------------------||* For Census 2000, persons could report more than one race, but the seven racial categories shown are mutually exclusive and include everyone. ||** Hispanic or Latino origin is NOT considered a race. People who reported themselves as Hispanic or Latino are also counted in the seven racial || categories. ||*** Go-outside-home disability status was determined only for the 16 year old and over population. ||**** Employment status by disability status was determined only for the 16 to 64 year old population. |------------------------------------------------------------------------------------------------------------------------------------------------------

2000 Census of Population and Housing - Summary File 3 Florida State Data Center Disability Profile Page 5------------------------------------------------------------------------------------------------------------------------------------------------------| State: FL Area Name: Sarasota County || County: 115 MCD/CCD: Place: . Tract: Block Group: |======================================================================================================================================================| PCT68 A-I. DISABILITY STATUS BY EMPLOYMENT STATUS (*) BY AGE FOR NON-INSTITUTIONALIZED MALES 5 AND OVER BY RACE (**) & HISPANIC ORIGIN (***) || Universe: Civilian non-institutionalized population 5 years and over [PART 1 OF 2 - MALES] || : White || African American Hawaiian/ Some Two : Alone, Not || White American Indian & Asian Oth Pacific Other Race or More : Hispanic Hispanic || Alone Alone Alaska Alone Alone Isl. Alone Alone Races : or Latino or Latino || MALE: : || Age 5 to 15 years: 15,473 1,419 63 211 10 327 407 : 1,339 14,511 || With a disability 1,015 68 6 0 10 52 53 : 84 975 || No disability 14,458 1,351 57 211 0 275 354 : 1,255 13,536 || : || Age 16 to 20 years: 6,099 507 16 101 0 180 89 : 680 5,640 || With a disability 1,061 95 6 28 0 40 43 : 153 981 || Employed 613 46 0 21 0 40 43 : 119 567 || Not employed 448 49 6 7 0 0 0 : 34 414 || No disability 5,038 412 10 73 0 140 46 : 527 4,659 || Employed 3,036 112 0 36 0 53 42 : 330 2,776 || Not employed 2,002 300 10 37 0 87 4 : 197 1,883 || : || Age 21 to 64 years: 70,936 2,910 292 621 8 1,266 781 : 4,443 68,049 || With a disability 15,134 861 100 147 0 353 186 : 1,210 14,355 || Employed 9,666 458 65 103 0 200 127 : 847 9,066 || Not employed 5,468 403 35 44 0 153 59 : 363 5,289 || No disability 55,802 2,049 192 474 8 913 595 : 3,233 53,694 || Employed 46,351 1,584 149 404 8 667 483 : 2,516 44,676 || Not employed 9,451 465 43 70 0 246 112 : 717 9,018 || : || Age 65 to 74 years: 22,396 336 44 64 0 41 47 : 288 22,139 || With a disability 5,230 151 34 10 0 0 15 : 63 5,167 || No disability 17,166 185 10 54 0 41 32 : 225 16,972 || : || Age 75 years and over: 21,265 191 6 0 0 0 78 : 191 21,097 || With a disability 8,895 131 0 0 0 0 47 : 80 8,827 || No disability 12,370 60 6 0 0 0 31 : 111 12,270 ||....................................................................................................................................................|| Age 5 and over: || With a disability 31,335 1,306 146 185 10 445 344 : 1,590 30,305 || No disability 104,834 4,057 275 812 8 1,369 1,058 : 5,351 101,131 || : || Age 16 to 64 years: : || With a disability 16,195 956 106 175 0 393 229 : 1,363 15,336 || Employed 10,279 504 65 124 0 240 170 : 966 9,633 || Not employed 5,916 452 41 51 0 153 59 : 397 5,703 || No disability 60,840 2,461 202 547 8 1,053 641 : 3,760 58,353 || Employed 49,387 1,696 149 440 8 720 525 : 2,846 47,452 || Not employed 11,453 765 53 107 0 333 116 : 914 10,901 || : || Age 65 years and over: : || With a disability 14,125 282 34 10 0 0 62 : 143 13,994 || No disability 29,536 245 16 54 0 41 63 : 336 29,242 ||----------------------------------------------------------------------------------------------------------------------------------------------------||* Employment status by disability status was determined only for the 16 to 64 year old population. ||** For Census 2000, persons could report more than one race, but the seven racial categories shown are mutually exclusive and include everyone. ||*** Hispanic or Latino origin is NOT considered a race. People who reported themselves as Hispanic or Latino are also counted in the seven racial || categories. |------------------------------------------------------------------------------------------------------------------------------------------------------
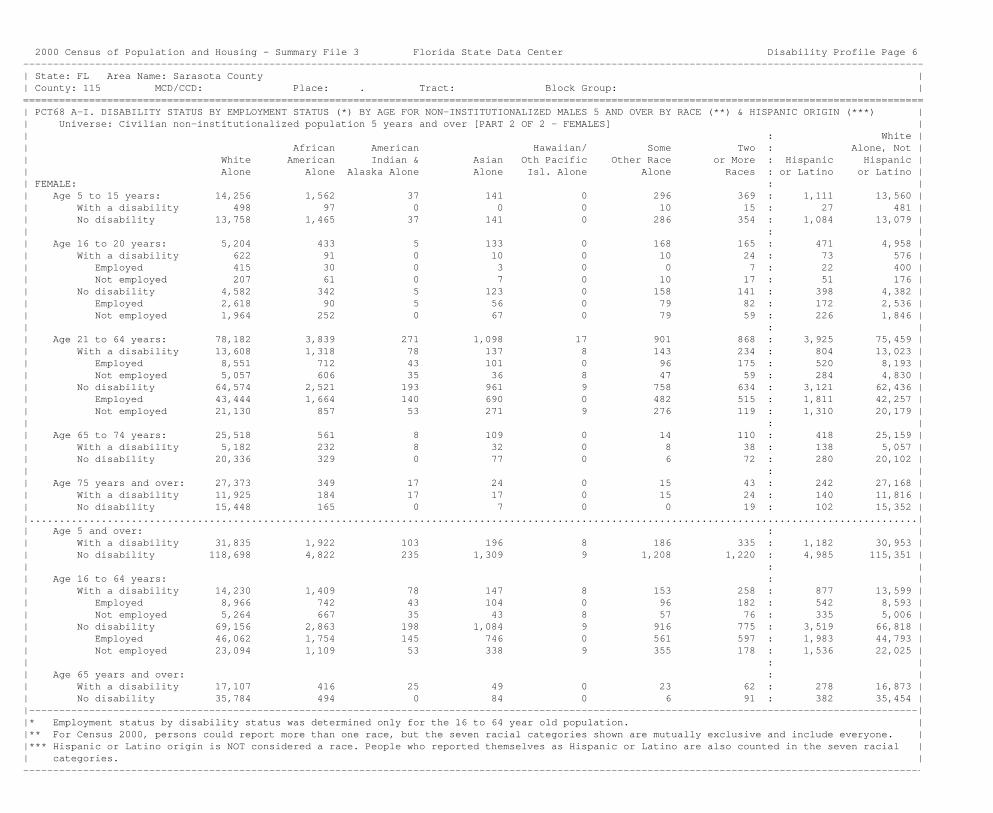
2000 Census of Population and Housing - Summary File 3 Florida State Data Center Disability Profile Page 6------------------------------------------------------------------------------------------------------------------------------------------------------| State: FL Area Name: Sarasota County || County: 115 MCD/CCD: Place: . Tract: Block Group: |======================================================================================================================================================| PCT68 A-I. DISABILITY STATUS BY EMPLOYMENT STATUS (*) BY AGE FOR NON-INSTITUTIONALIZED MALES 5 AND OVER BY RACE (**) & HISPANIC ORIGIN (***) || Universe: Civilian non-institutionalized population 5 years and over [PART 2 OF 2 - FEMALES] || : White || African American Hawaiian/ Some Two : Alone, Not || White American Indian & Asian Oth Pacific Other Race or More : Hispanic Hispanic || Alone Alone Alaska Alone Alone Isl. Alone Alone Races : or Latino or Latino || FEMALE: : || Age 5 to 15 years: 14,256 1,562 37 141 0 296 369 : 1,111 13,560 || With a disability 498 97 0 0 0 10 15 : 27 481 || No disability 13,758 1,465 37 141 0 286 354 : 1,084 13,079 || : || Age 16 to 20 years: 5,204 433 5 133 0 168 165 : 471 4,958 || With a disability 622 91 0 10 0 10 24 : 73 576 || Employed 415 30 0 3 0 0 7 : 22 400 || Not employed 207 61 0 7 0 10 17 : 51 176 || No disability 4,582 342 5 123 0 158 141 : 398 4,382 || Employed 2,618 90 5 56 0 79 82 : 172 2,536 || Not employed 1,964 252 0 67 0 79 59 : 226 1,846 || : || Age 21 to 64 years: 78,182 3,839 271 1,098 17 901 868 : 3,925 75,459 || With a disability 13,608 1,318 78 137 8 143 234 : 804 13,023 || Employed 8,551 712 43 101 0 96 175 : 520 8,193 || Not employed 5,057 606 35 36 8 47 59 : 284 4,830 || No disability 64,574 2,521 193 961 9 758 634 : 3,121 62,436 || Employed 43,444 1,664 140 690 0 482 515 : 1,811 42,257 || Not employed 21,130 857 53 271 9 276 119 : 1,310 20,179 || : || Age 65 to 74 years: 25,518 561 8 109 0 14 110 : 418 25,159 || With a disability 5,182 232 8 32 0 8 38 : 138 5,057 || No disability 20,336 329 0 77 0 6 72 : 280 20,102 || : || Age 75 years and over: 27,373 349 17 24 0 15 43 : 242 27,168 || With a disability 11,925 184 17 17 0 15 24 : 140 11,816 || No disability 15,448 165 0 7 0 0 19 : 102 15,352 ||....................................................................................................................................................|| Age 5 and over: : || With a disability 31,835 1,922 103 196 8 186 335 : 1,182 30,953 || No disability 118,698 4,822 235 1,309 9 1,208 1,220 : 4,985 115,351 || : || Age 16 to 64 years: : || With a disability 14,230 1,409 78 147 8 153 258 : 877 13,599 || Employed 8,966 742 43 104 0 96 182 : 542 8,593 || Not employed 5,264 667 35 43 8 57 76 : 335 5,006 || No disability 69,156 2,863 198 1,084 9 916 775 : 3,519 66,818 || Employed 46,062 1,754 145 746 0 561 597 : 1,983 44,793 || Not employed 23,094 1,109 53 338 9 355 178 : 1,536 22,025 || : || Age 65 years and over: : || With a disability 17,107 416 25 49 0 23 62 : 278 16,873 || No disability 35,784 494 0 84 0 6 91 : 382 35,454 ||----------------------------------------------------------------------------------------------------------------------------------------------------||* Employment status by disability status was determined only for the 16 to 64 year old population. ||** For Census 2000, persons could report more than one race, but the seven racial categories shown are mutually exclusive and include everyone. ||*** Hispanic or Latino origin is NOT considered a race. People who reported themselves as Hispanic or Latino are also counted in the seven racial || categories. |------------------------------------------------------------------------------------------------------------------------------------------------------

2000 Census of Population and Housing - Summary File 3 Florida State Data Center Education Profile, Page 1----------------------------------------------------------------------------------------------------------------------------------------------------| State: FL Area Name: Sarasota County || County: 115 MCD/CCD: Place: . Tract: Block Group: |===================================================================================================================================================|| P37 EDUCATIONAL ATTAINMENT | P38 ARMED FORCES STATUS BY SCHOOL ENROLLMENT || Universe: Population 25 years old and over | BY EDUCATIONAL ATTAINMENT BY EMPLOYMENT STATUS|| | Universe: Population 16 to 19 years || | Total Pct.|| Total Pct. Males Pct. Females Pct. | Total population 16 to 19: 10,743 100.0 ||Total population 25 and over: 256,802 100.0 118,688 100.0 138,114 100.0 | In armed forces: 0 .0 || No schooling completed 1,199 .5 638 .5 561 .4 | Enrolled in school: 0 .0 || Nursery to 4th grade 368 .1 149 .1 219 .2 | High school graduate 0 .0 || 5th and 6th grade 1,680 .7 919 .8 761 .6 | Not high school graduate 0 .0 || 7th and 8th grade 5,427 2.1 2,801 2.4 2,626 1.9 | Not enrolled in school: 0 .0 || 9th grade 4,070 1.6 2,251 1.9 1,819 1.3 | High school graduate 0 .0 || 10th grade 6,253 2.4 3,058 2.6 3,195 2.3 | Not high school graduate 0 .0 || 11th grade 5,305 2.1 2,381 2.0 2,924 2.1 | || 12th grade, no diploma 8,862 3.5 4,405 3.7 4,457 3.2 | Civilian: 10,743 100.0 || High school graduate | Enrolled in school: 8,249 76.8 || (includes equivalency) 77,323 30.1 31,475 26.5 45,848 33.2 | Employed 4,013 37.4 || Some college, | Unemployed 606 5.6 || less than 1 year 18,534 7.2 7,787 6.6 10,747 7.8 | Not in labor force 3,630 33.8 || Some college, 1 or more | Not enrolled in school: 2,494 23.2 || years, no degree 41,174 16.0 18,993 16.0 22,181 16.1 | High school graduate: 1,217 11.3 || Associate degree 16,161 6.3 6,154 5.2 10,007 7.2 | Employed 954 8.9 || Bachelor's degree 43,886 17.1 22,619 19.1 21,267 15.4 | Unemployed 45 .4 || Master's degree 16,229 6.3 8,028 6.8 8,201 5.9 | Not high school graduate: 1,277 11.9 || Professional school degree 7,552 2.9 5,075 4.3 2,477 1.8 | Employed 838 7.8 || Doctorate degree 2,779 1.1 1,955 1.6 824 .6 | Unemployed 170 1.6 || | ||--------------------------------------------------------------------------------------------------------------------------------------------------|| PCT23 SCHOOL ENROLLMENT || Universe: Population 3 years old and over || -----------------Total----------- -----------------Males--------------- ----------------Females--------------- || Not Not Not || Total Enrolled Enrolled Total Enrolled Enrolled Total Enrolled Enrolled ||Total pop 3 and over: 318,461 55,269 263,192 150,550 27,625 122,925 167,911 27,644 140,267 || 3 and 4 years 5,134 2,888 2,246 2,579 1,412 1,167 2,555 1,476 1,079 || 5 to 9 years 15,165 14,661 504 7,814 7,538 276 7,351 7,123 228 || 10 to 14 years 16,272 16,121 151 8,401 8,301 100 7,871 7,820 51 || 15 to 17 years 8,641 8,083 558 4,582 4,239 343 4,059 3,844 215 || 18 and 19 years 5,236 3,279 1,957 2,776 1,762 1,014 2,460 1,517 943 || 20 to 24 years 11,211 2,934 8,277 5,710 1,302 4,408 5,501 1,632 3,869 || 25 to 34 years 40,159 14,553 25,606 26,034 1,147 13,017 14,125 1,536 12,589 || 35 years and over 329,189 105,296 223,893 205,200 1,924 102,600 123,989 2,696 121,293 || ||--------------------------------------------------------------------------------------------------------------------------------------------------|| PCT24 COLLEGE OR GRADUATE SCHOOL ENROLLMENT || Universe: Population 15 years old and over || ----------------Total---------------- -----------------Males----------------- ----------------Females---------------- || Not Not Not || Total Enrolled Enrolled Total Enrolled Enrolled Total Enrolled Enrolled ||Total pop 15 and over: 281,890 10,210 271,680 131,756 4,301 127,455 150,134 5,909 144,225 || 15 to 17 years 8,641 10 8,631 4,582 0 4,582 4,059 10 4,049 || 18 to 24 years 16,447 3,859 12,588 8,486 1,679 6,807 7,961 2,180 5,781 || 25 to 34 years 28,289 2,422 25,867 14,164 1,017 13,147 14,125 1,405 12,720 || 35 years and over 228,513 3,919 224,594 104,524 1,605 102,919 123,989 2,314 121,675 || ||--------------------------------------------------------------------------------------------------------------------------------------------------|
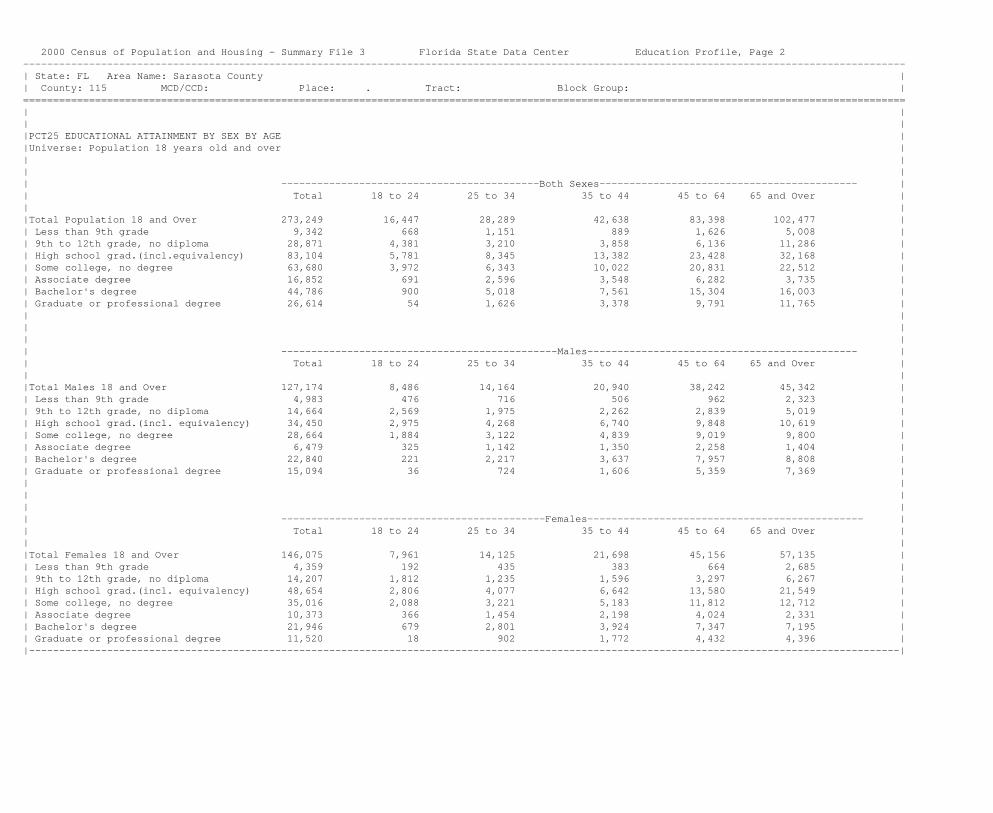
2000 Census of Population and Housing - Summary File 3 Florida State Data Center Education Profile, Page 2---------------------------------------------------------------------------------------------------------------------------------------------------| State: FL Area Name: Sarasota County || County: 115 MCD/CCD: Place: . Tract: Block Group: |===================================================================================================================================================| || ||PCT25 EDUCATIONAL ATTAINMENT BY SEX BY AGE ||Universe: Population 18 years old and over || || || -------------------------------------------Both Sexes------------------------------------------- || Total 18 to 24 25 to 34 35 to 44 45 to 64 65 and Over || ||Total Population 18 and Over 273,249 16,447 28,289 42,638 83,398 102,477 || Less than 9th grade 9,342 668 1,151 889 1,626 5,008 || 9th to 12th grade, no diploma 28,871 4,381 3,210 3,858 6,136 11,286 || High school grad.(incl.equivalency) 83,104 5,781 8,345 13,382 23,428 32,168 || Some college, no degree 63,680 3,972 6,343 10,022 20,831 22,512 || Associate degree 16,852 691 2,596 3,548 6,282 3,735 || Bachelor's degree 44,786 900 5,018 7,561 15,304 16,003 || Graduate or professional degree 26,614 54 1,626 3,378 9,791 11,765 || || || || ----------------------------------------------Males--------------------------------------------- || Total 18 to 24 25 to 34 35 to 44 45 to 64 65 and Over || ||Total Males 18 and Over 127,174 8,486 14,164 20,940 38,242 45,342 || Less than 9th grade 4,983 476 716 506 962 2,323 || 9th to 12th grade, no diploma 14,664 2,569 1,975 2,262 2,839 5,019 || High school grad.(incl. equivalency) 34,450 2,975 4,268 6,740 9,848 10,619 || Some college, no degree 28,664 1,884 3,122 4,839 9,019 9,800 || Associate degree 6,479 325 1,142 1,350 2,258 1,404 || Bachelor's degree 22,840 221 2,217 3,637 7,957 8,808 || Graduate or professional degree 15,094 36 724 1,606 5,359 7,369 || || || || --------------------------------------------Females---------------------------------------------- || Total 18 to 24 25 to 34 35 to 44 45 to 64 65 and Over || ||Total Females 18 and Over 146,075 7,961 14,125 21,698 45,156 57,135 || Less than 9th grade 4,359 192 435 383 664 2,685 || 9th to 12th grade, no diploma 14,207 1,812 1,235 1,596 3,297 6,267 || High school grad.(incl. equivalency) 48,654 2,806 4,077 6,642 13,580 21,549 || Some college, no degree 35,016 2,088 3,221 5,183 11,812 12,712 || Associate degree 10,373 366 1,454 2,198 4,024 2,331 || Bachelor's degree 21,946 679 2,801 3,924 7,347 7,195 || Graduate or professional degree 11,520 18 902 1,772 4,432 4,396 ||-------------------------------------------------------------------------------------------------------------------------------------------------|
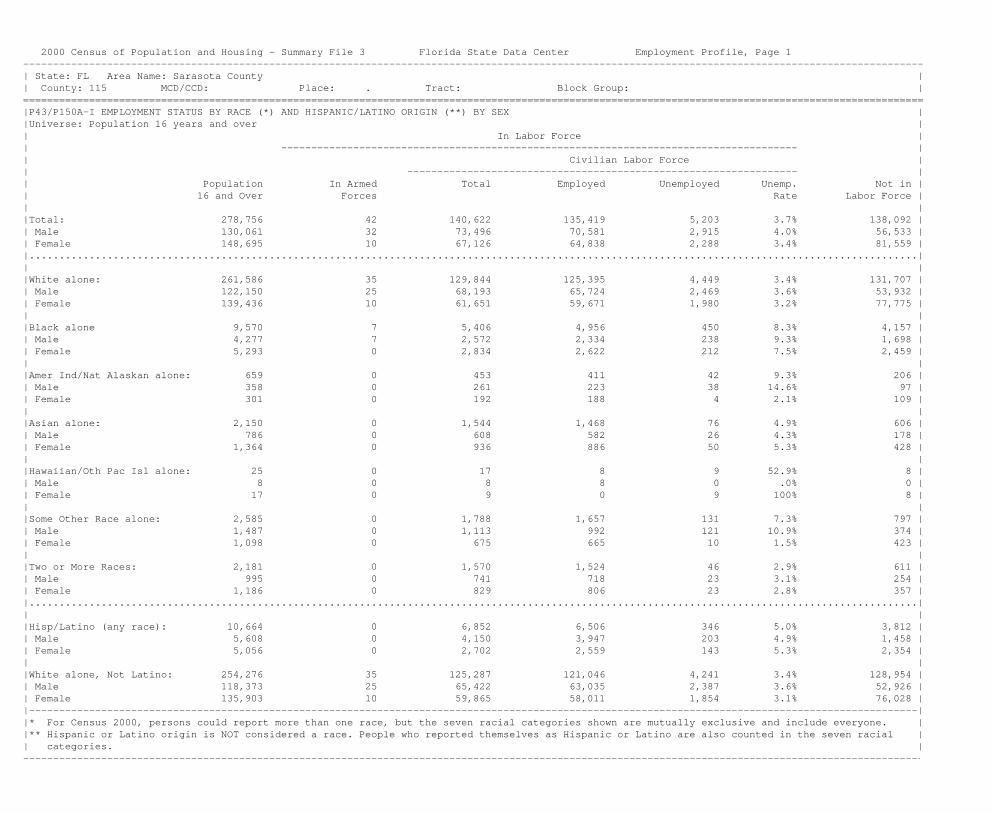
2000 Census of Population and Housing - Summary File 3 Florida State Data Center Employment Profile, Page 1------------------------------------------------------------------------------------------------------------------------------------------------------| State: FL Area Name: Sarasota County || County: 115 MCD/CCD: Place: . Tract: Block Group: |======================================================================================================================================================|P43/P150A-I EMPLOYMENT STATUS BY RACE (*) AND HISPANIC/LATINO ORIGIN (**) BY SEX ||Universe: Population 16 years and over || In Labor Force || -------------------------------------------------------------------------------------- || Civilian Labor Force || ----------------------------------------------------------------- || Population In Armed Total Employed Unemployed Unemp. Not in || 16 and Over Forces Rate Labor Force || ||Total: 278,756 42 140,622 135,419 5,203 3.7% 138,092 || Male 130,061 32 73,496 70,581 2,915 4.0% 56,533 || Female 148,695 10 67,126 64,838 2,288 3.4% 81,559 ||....................................................................................................................................................|| ||White alone: 261,586 35 129,844 125,395 4,449 3.4% 131,707 || Male 122,150 25 68,193 65,724 2,469 3.6% 53,932 || Female 139,436 10 61,651 59,671 1,980 3.2% 77,775 || ||Black alone 9,570 7 5,406 4,956 450 8.3% 4,157 || Male 4,277 7 2,572 2,334 238 9.3% 1,698 || Female 5,293 0 2,834 2,622 212 7.5% 2,459 || ||Amer Ind/Nat Alaskan alone: 659 0 453 411 42 9.3% 206 || Male 358 0 261 223 38 14.6% 97 || Female 301 0 192 188 4 2.1% 109 || ||Asian alone: 2,150 0 1,544 1,468 76 4.9% 606 || Male 786 0 608 582 26 4.3% 178 || Female 1,364 0 936 886 50 5.3% 428 || ||Hawaiian/Oth Pac Isl alone: 25 0 17 8 9 52.9% 8 || Male 8 0 8 8 0 .0% 0 || Female 17 0 9 0 9 100% 8 || ||Some Other Race alone: 2,585 0 1,788 1,657 131 7.3% 797 || Male 1,487 0 1,113 992 121 10.9% 374 || Female 1,098 0 675 665 10 1.5% 423 || ||Two or More Races: 2,181 0 1,570 1,524 46 2.9% 611 || Male 995 0 741 718 23 3.1% 254 || Female 1,186 0 829 806 23 2.8% 357 ||....................................................................................................................................................|| ||Hisp/Latino (any race): 10,664 0 6,852 6,506 346 5.0% 3,812 || Male 5,608 0 4,150 3,947 203 4.9% 1,458 || Female 5,056 0 2,702 2,559 143 5.3% 2,354 || ||White alone, Not Latino: 254,276 35 125,287 121,046 4,241 3.4% 128,954 || Male 118,373 25 65,422 63,035 2,387 3.6% 52,926 || Female 135,903 10 59,865 58,011 1,854 3.1% 76,028 ||----------------------------------------------------------------------------------------------------------------------------------------------------||* For Census 2000, persons could report more than one race, but the seven racial categories shown are mutually exclusive and include everyone. ||** Hispanic or Latino origin is NOT considered a race. People who reported themselves as Hispanic or Latino are also counted in the seven racial || categories. |------------------------------------------------------------------------------------------------------------------------------------------------------

2000 Census of Population and Housing - Summary File 3 Florida State Data Center Employment Profile, Page 2------------------------------------------------------------------------------------------------------------------------------------------------------| State: FL Area Name: Sarasota County || County: 115 MCD/CCD: Place: . Tract: Block Group: |======================================================================================================================================================| P50 OCCUPATION [PART 1 OF 2 - MALES] || Universe: Employed civilians 16 years and over || Males || Total Males: 70,581 || Management, professional and related occupations: 20,854 Transportation and material moving occupations: 5,021 || Management, business, financial operations occupations: 10,783 Supervisors, transportation and material || Management (except farmers and farm managers) 7,634 moving workers 43 || Farmers and farm managers 116 Aircraft and traffic control occupations 158 || Business and financial operations occupations: 3,033 Motor vehicle operators 2,809 || Business operations specialists 1,366 Rail, water and other transportation occupations 233 || Financial specialists 1,667 Material moving workers 1,778 || Professional and related occupations: 10,071 +-----------------------------------------------------------------------|| Computer and mathematical occupations 1,219 | P49 INDUSTRY [PART 1 OF 2 - MALES] || Architecture and engineering occupations: 1,495 | Universe: Employed civilians 16 years and over || Architects, surveyors, cartographers, and engineers 998 | Males || Drafters, engineering and mapping technicians 497 | Total Males: 70,581 || Life, physical and social science occupations 463 | Agriculture, forestry, fishing, hunting and mining: 453 || Community and social services occupations 740 | Agriculture, forestry, fishing, and hunting 409 || Legal occupations 862 | Mining 44 || Education, training and library occupations 1,061 | || Arts, design, entertainment, sports, and | Construction 10,904 || media occupations 1,950 | Manufacturing 6,054 || Healthcare practitioners and technical occupations: 2,281 | Wholesale Trade 2,501 || Health diagnosing, treating practitioners | Retail Trade 11,241 || and technical occupations 1,935 | || Health technologists and technicians 346 | Transportation, warehousing and utilities: 3,088 || | Transportation and warehousing 2,476 || Service occupations: 12,312 | Utilities 612 || Healthcare support occupations 635 | || Protective service occupations: 2,020 | Information 1,656 || Fire fighting, prevention, and law | || enforcement workers, including supervisors 1,217 | Finance, insurance, real estate and rental || Other protective services including supervisors 803 | and leasing: 5,408 || Food Preparation and serving related occupations 4,309 | Finance and Insurance 2,713 || Building and grounds cleaning and maintenance occupations 4,214 | Real Estate and rental and leasing 2,695 || Personal care and service occupations 1,134 | || | Professional, scientific, management, || Sales and office occupations: 14,618 | administrative and waste management services: 8,814 || Sales and related occupations 10,617 | Professional, scientific and technical service 4,637 || Office and administrative support occupations 4,001 | Management of companies and enterprises 29 || | Administrative, support, waste management service 4,148 || Farming, fishing and forestry occupations 300 | || | Educational, health and social services: 6,053 || Construction, extraction and maintenance occupations: 13,319 | Educational services 1,867 || Construction and extraction occupations: 8,902 | Health care and social assistance 4,186 || Supervisors, construction and extraction workers 887 | || Construction trade workers 7,975 | Arts, entertainment, recreation, accommodation || Extraction workers 40 | and food services: 8,064 || Installation, maintenance and repair occupations 4,417 | Arts, entertainment and recreation 2,673 || | Accommodation and food services 5,391 || Production, transportation and material | || moving occupations: 9,178 | Other services (except public administration) 3,655 || Production occupations 4,157 | Public administration 2,690 |------------------------------------------------------------------------------------------------------------------------------------------------------

2000 Census of Population and Housing - Summary File 3 Florida State Data Center Employment Profile, Page 3------------------------------------------------------------------------------------------------------------------------------------------------------| State: FL Area Name: Sarasota County || County: 115 MCD/CCD: Place: . Tract: Block Group: |======================================================================================================================================================| P50 OCCUPATION [PART 2 OF 2 - FEMALES] || Universe: Employed civilians 16 years and over || Females || Total Females: 64,838 || Management, professional and related occupations: 22,058 Transportation and material moving occupations: 745 || Management, business, financial operations occupations: 7,207 Supervisors, transportation and material || Management (except farmers and farm managers) 4,623 moving workers 37 || Farmers and farm managers 45 Aircraft and traffic control occupations 6 || Business and financial operations occupations: 2,539 Motor vehicle operators 269 || Business operations specialists 1,075 Rail, water and other transportation occupations 68 || Financial specialists 1,464 Material moving workers 365 || Professional and related occupations: 14,851 +-----------------------------------------------------------------------|| Computer and mathematical occupations 443 | P49 INDUSTRY [PART 2 OF 2 - FEMALES] || Architecture and engineering occupations: 253 | Universe: Employed civilians 16 years and over || Architects, surveyors, cartographers, and engineers 166 | Females || Drafters, engineering and mapping technicians 87 | Total Females: 64,838 || Life, physical and social science occupations 389 | Agriculture, forestry, fishing, hunting and mining: 168 || Community and social services occupations 964 | Agriculture, forestry, fishing, and hunting 157 || Legal occupations 909 | Mining 11 || Education, training and library occupations 4,067 | || Arts, design, entertainment, sports, and | Construction 1,342 || media occupations 1,611 | Manufacturing 2,672 || Healthcare practitioners and technical occupations: 6,215 | Wholesale Trade 1,040 || Health diagnosing, treating practitioners | Retail Trade 10,353 || and technical occupations 3,858 | || Health technologists and technicians 2,357 | Transportation, warehousing and utilities: 944 || | Transportation and warehousing 768 || Service occupations: 13,615 | Utilities 176 || Healthcare support occupations 3,136 | || Protective service occupations: 363 | Information 1,696 || Fire fighting, prevention, and law | || enforcement workers, including supervisors 228 | Finance, insurance, real estate and rental || Other protective services including supervisors 135 | and leasing: 6,684 || Food Preparation and serving related occupations 4,773 | Finance and Insurance 4,023 || Building and grounds cleaning and maintenance occupations 2,377 | Real Estate and rental and leasing 2,661 || Personal care and service occupations 2,966 | || | Professional, scientific, management, || Sales and office occupations: 25,651 | administrative and waste management services: 7,080 || Sales and related occupations 10,471 | Professional, scientific and technical service 4,470 || Office and administrative support occupations 15,180 | Management of companies and enterprises 8 || | Administrative, support, waste management service 2,602 || Farming, fishing and forestry occupations 108 | || | Educational, health and social services: 19,481 || Construction, extraction and maintenance occupations: 547 | Educational services 5,410 || Construction and extraction occupations: 228 | Health care and social assistance 14,071 || Supervisors, construction and extraction workers 31 | || Construction trade workers 197 | Arts, entertainment, recreation, accommodation || Extraction workers 0 | and food services: 7,050 || Installation, maintenance and repair occupations 319 | Arts, entertainment and recreation 1,556 || | Accommodation and food services 5,494 || Production, transportation and material | || moving occupations: 2,859 | Other services (except public administration) 4,271 || Production occupations 2,114 | Public administration 2,057 |------------------------------------------------------------------------------------------------------------------------------------------------------

2000 Census of Population and Housing - Summary File 3 Florida State Data Center Household and Family Profile--------------------------------------------------------------------------------------------------------------------------------------------------| State: FL Area Name: Sarasota County || County: 115 MCD/CCD: Place: . Tract: Block Group: |==================================================================================================================================================| | || PCT7. MARITAL STATUS BY SEX BY AGE | PCT3. FAMILY TYPE BY AGE OF HOUSEHOLDER || Universe: Population 15 and over ( 281,890 ) | Universe: Families || | || --------- Now Married ------- | - Other Families -|| Never Spouse -- Spouse Absent -- | Married (No Spouse Present)|| Married Present Separated Other Widowed Divorced| Age of Couple Male Female|| | Householder Total Families Hseholder Hseholder|| Total pop 15+: 45,435 161,594 4,323 6,702 31,321 32,515| || | All ages: 95,167 80,075 3,981 11,111|| Male: 25,352 81,246 2,031 3,319 6,125 13,683| 15 to 24 1,601 754 268 579|| 15 to 17 years 4,500 6 0 56 15 5| 25 to 34 8,787 6,384 745 1,658|| 18 to 19 years 2,625 36 59 40 8 8| 35 to 44 16,732 12,218 1,157 3,357|| 20 to 24 years 4,544 668 117 279 0 102| 45 to 54 15,441 12,409 815 2,217|| 25 to 29 years 3,054 2,536 185 223 76 398| 55 to 59 7,676 6,776 260 640|| 30 to 34 years 2,340 3,952 241 288 59 812| 60 to 64 7,743 7,127 142 474|| 35 to 44 years 4,231 12,308 567 547 163 3,124| 65 to 74 19,642 18,576 199 867|| 45 to 54 years 2,056 12,459 332 354 177 4,091| 75 & over 17,545 15,831 395 1,319|| 55 to 59 years 522 6,852 161 126 181 1,683|-----------------------------------------------------------------|| 60 to 64 years 286 7,228 46 186 255 1,247| || 65 to 74 years 742 18,791 195 315 1,372 1,604| PCT2. NONFAMILY HOUSEHOLDS BY HOUSEHOLDERS SEX AND AGE || 75 to 84 years 390 13,695 64 498 2,241 544| Universe: Nonfamily households || 85 & over 62 2,715 64 407 1,578 65| || | --- Householder ---|| Female: 20,083 80,348 2,292 3,383 25,196 18,832| Total Male Female|| 15 to 17 years 3,980 42 8 29 0 0| || 18 and 19 years 2,180 130 0 131 19 0| Total nonfamily households: 54,999 21,047 33,952|| 20 to 24 years 3,772 1,227 92 130 39 241| || 25 to 29 years 2,328 3,007 227 114 26 497| Living alone: 45,650 15,552 30,098|| 30 to 34 years 1,506 4,785 249 190 76 1,120| Householder 15 to 64 years 20,313 9,628 10,685|| 35 to 44 years 2,572 13,374 680 345 299 4,428| Householder 65 years & over 25,337 5,924 19,413|| 45 to 54 years 1,592 13,815 472 272 817 5,230| || 55 to 59 years 417 7,582 171 188 748 2,343| Not living alone: 9,349 5,495 3,854|| 60 to 64 years 355 7,925 111 130 1,453 1,535| Householder 15 to 64 years 7,503 4,331 3,172|| 65 to 74 years 596 17,199 176 343 6,039 2,265| Householder 65 years & over 1,846 1,164 682|| 75 to 84 years 590 9,998 91 605 9,647 1,025| || 85 & over 195 1,264 15 906 6,033 148| || | || -----------------------------------------------------------------------------------------------------------------------------------------------|| | || PCT4. SUBFAMILY TYPE BY PRESENCE OF OWN CHILDREN| PCT5. POPULATION IN SUBFAMILIES BY SUBFAMILY TYPE BY RELATIONSHIP || UNDER 18 | Universe: Population in subfamilies || Universe: Subfamilies | || | Total population in subfamilies: 4,370 : || Total subfamilies: 1,906 | In married-couple subfamilies: 1,765 : In mother-child subfamilies: 1,993|| Married-couple subfamilies: 748 | Husband-wife in a childless subfamily 1,276 : Parent 865|| With own children under 18 years 138 | Husband-wife in a subfam. with children 277 : Child 1,128|| No own children under 18 years 610 | Child 212 : In father-child subfamilies: 612|| Mother-child subfamilies 865 | : Parent 293|| Father-child subfamilies 293 | : Child 319||________________________________________________________________________________________________________________________________________________|
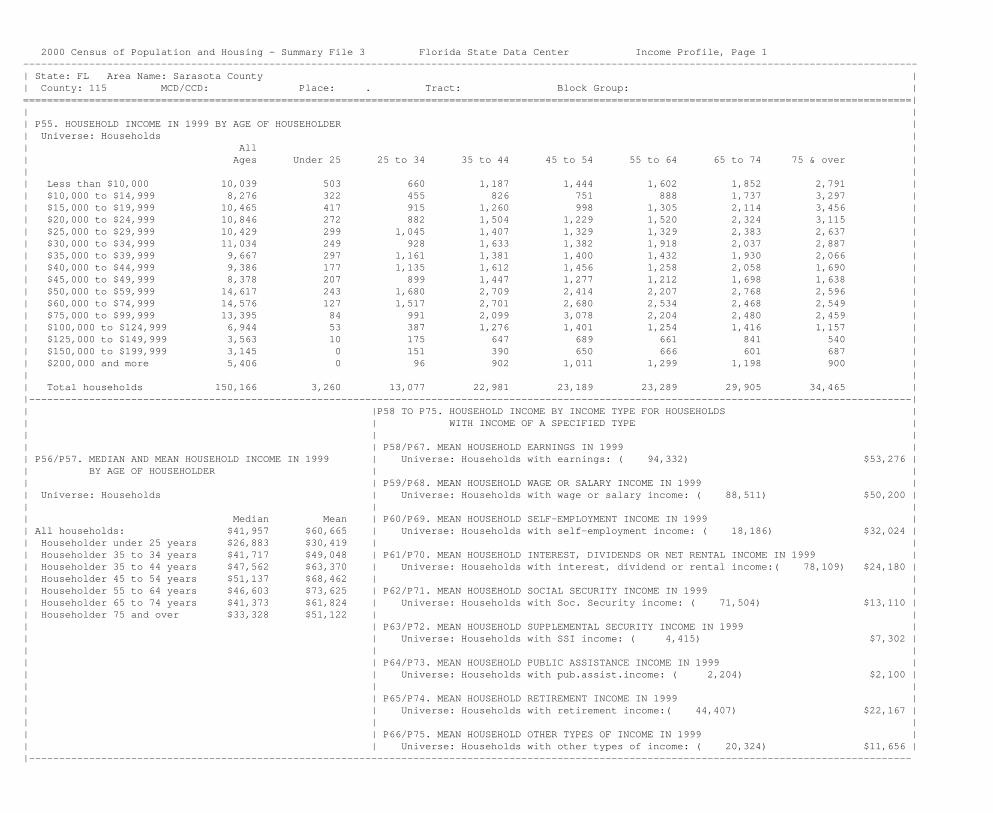
2000 Census of Population and Housing - Summary File 3 Florida State Data Center Income Profile, Page 1-----------------------------------------------------------------------------------------------------------------------------------------------------| State: FL Area Name: Sarasota County || County: 115 MCD/CCD: Place: . Tract: Block Group: |====================================================================================================================================================|| || P55. HOUSEHOLD INCOME IN 1999 BY AGE OF HOUSEHOLDER || Universe: Households || All || Ages Under 25 25 to 34 35 to 44 45 to 54 55 to 64 65 to 74 75 & over || || Less than $10,000 10,039 503 660 1,187 1,444 1,602 1,852 2,791 || $10,000 to $14,999 8,276 322 455 826 751 888 1,737 3,297 || $15,000 to $19,999 10,465 417 915 1,260 998 1,305 2,114 3,456 || $20,000 to $24,999 10,846 272 882 1,504 1,229 1,520 2,324 3,115 || $25,000 to $29,999 10,429 299 1,045 1,407 1,329 1,329 2,383 2,637 || $30,000 to $34,999 11,034 249 928 1,633 1,382 1,918 2,037 2,887 || $35,000 to $39,999 9,667 297 1,161 1,381 1,400 1,432 1,930 2,066 || $40,000 to $44,999 9,386 177 1,135 1,612 1,456 1,258 2,058 1,690 || $45,000 to $49,999 8,378 207 899 1,447 1,277 1,212 1,698 1,638 || $50,000 to $59,999 14,617 243 1,680 2,709 2,414 2,207 2,768 2,596 || $60,000 to $74,999 14,576 127 1,517 2,701 2,680 2,534 2,468 2,549 || $75,000 to $99,999 13,395 84 991 2,099 3,078 2,204 2,480 2,459 || $100,000 to $124,999 6,944 53 387 1,276 1,401 1,254 1,416 1,157 || $125,000 to $149,999 3,563 10 175 647 689 661 841 540 || $150,000 to $199,999 3,145 0 151 390 650 666 601 687 || $200,000 and more 5,406 0 96 902 1,011 1,299 1,198 900 || || Total households 150,166 3,260 13,077 22,981 23,189 23,289 29,905 34,465 ||---------------------------------------------------------------------------------------------------------------------------------------------------|| |P58 TO P75. HOUSEHOLD INCOME BY INCOME TYPE FOR HOUSEHOLDS || | WITH INCOME OF A SPECIFIED TYPE || | || | P58/P67. MEAN HOUSEHOLD EARNINGS IN 1999 || P56/P57. MEDIAN AND MEAN HOUSEHOLD INCOME IN 1999 | Universe: Households with earnings: ( 94,332) $53,276 || BY AGE OF HOUSEHOLDER | || | P59/P68. MEAN HOUSEHOLD WAGE OR SALARY INCOME IN 1999 || Universe: Households | Universe: Households with wage or salary income: ( 88,511) $50,200 || | || Median Mean | P60/P69. MEAN HOUSEHOLD SELF-EMPLOYMENT INCOME IN 1999 || All households: $41,957 $60,665 | Universe: Households with self-employment income: ( 18,186) $32,024 || Householder under 25 years $26,883 $30,419 | || Householder 35 to 34 years $41,717 $49,048 | P61/P70. MEAN HOUSEHOLD INTEREST, DIVIDENDS OR NET RENTAL INCOME IN 1999 || Householder 35 to 44 years $47,562 $63,370 | Universe: Households with interest, dividend or rental income:( 78,109) $24,180 || Householder 45 to 54 years $51,137 $68,462 | || Householder 55 to 64 years $46,603 $73,625 | P62/P71. MEAN HOUSEHOLD SOCIAL SECURITY INCOME IN 1999 || Householder 65 to 74 years $41,373 $61,824 | Universe: Households with Soc. Security income: ( 71,504) $13,110 || Householder 75 and over $33,328 $51,122 | || | P63/P72. MEAN HOUSEHOLD SUPPLEMENTAL SECURITY INCOME IN 1999 || | Universe: Households with SSI income: ( 4,415) $7,302 || | || | P64/P73. MEAN HOUSEHOLD PUBLIC ASSISTANCE INCOME IN 1999 || | Universe: Households with pub.assist.income: ( 2,204) $2,100 || | || | P65/P74. MEAN HOUSEHOLD RETIREMENT INCOME IN 1999 || | Universe: Households with retirement income:( 44,407) $22,167 || | || | P66/P75. MEAN HOUSEHOLD OTHER TYPES OF INCOME IN 1999 || | Universe: Households with other types of income: ( 20,324) $11,656 ||---------------------------------------------------------------------------------------------------------------------------------------------------|

2000 Census of Population and Housing - Summary File 3 Florida State Data Center Income Profile, Page 2------------------------------------------------------------------------------------------------------------------------------------------------------| State: FL Area Name: Sarasota County || County: 115 MCD/CCD: Place: . Tract: Block Group: |=====================================================================================================================================================|| | || P84/P85/P86. EARNINGS IN 1999 FOR THE POPULATION 16 YEARS AND OVER WITH EARNINGS BY SEX | || Universe: Population 16 years and over with earnings | || | || Total Male Female | || $1 to $2,499 or loss 9,494 3,876 5,618 | P82. PER CAPITA INCOME IN 1999 || $2,500 to $4,999 8,011 3,019 4,992 | Universe: Total population $28,326 || $5,000 to $7,499 8,634 3,550 5,084 | || $7,500 to $9,999 7,088 2,931 4,157 | || $10,000 to $12,499 10,545 4,261 6,284 | || $12,500 to $14,999 6,449 2,895 3,554 | P83. MEAN INCOME IN 1999 FOR THE || $15,000 to $17,499 9,680 4,499 5,181 | POPULATION 15 YEARS AND OVER || $17,500 to $19,999 7,279 3,236 4,043 | Universe: Population 15 years and over $32,754 || $20,000 to $22,499 11,426 5,797 5,629 | || $22,500 to $24,999 6,627 3,380 3,247 | || $25,000 to $29,999 14,393 7,418 6,975 | || $30,000 to $34,999 11,603 6,385 5,218 | || $35,000 to $39,999 8,361 5,014 3,347 | || $40,000 to $44,999 7,175 4,173 3,002 | || $45,000 to $49,999 4,232 2,524 1,708 | || $50,000 to $54,999 4,915 3,247 1,668 | || $55,000 to $64,999 4,400 3,066 1,334 | || $65,000 to $74,999 2,905 2,237 668 | || $75,000 to $99,999 3,572 2,650 922 | || $100,000 and more 6,997 5,905 1,092 | || Total pop 16+ with earnings 153,786 80,063 73,723 | || | || Median $22,125 $26,400 $18,731 | || Mean $32,897 $41,696 $23,341 | || | || | ||----------------------------------------------------------------------------------------------------------------------------------------------------|| PCT42/PCT43. MEDIAN AND MEAN NONFAMILY HOUSEHOLD INCOME IN 1999 BY SEX OF HOUSEHOLDER BY LIVING ALONE BY AGE OF HOUSEHOLDER || Universe: Nonfamily households || || --------------------- Median --------------------- ---------------------- Mean ----------------------- || Total Male householder Female householder Total Male householder Female householder || || Total nonfamily households: $27,855 $32,424 $24,993 $39,751 $46,984 $35,267 || || Living alone total: $27,394 $22,773 $40,271 $33,217 || Householder 15 to 64 years $28,132 $25,848 $38,946 $32,896 || Householder 65 years and over $26,423 $21,484 $42,425 $33,394 || || Not living alone total: $50,831 $43,758 $65,981 $51,276 || Householder 15 to 64 years $50,525 $44,050 $62,482 $51,292 || Householder 65 years and over $57,500 $41,618 $79,002 $51,202 || || ||----------------------------------------------------------------------------------------------------------------------------------------------------|

2000 Census of Population and Housing - Summary File 3 Florida State Data Center Income Profile, Page 3-----------------------------------------------------------------------------------------------------------------------------------------------------| State: FL Area Name: Sarasota County || County: 115 MCD/CCD: Place: . Tract: Block Group: |=====================================================================================================================================================|| | || P48/PCT36. FAMILIES AND MEAN FAMILY INCOME IN 1999 | PCT37. MEAN FAMILY INCOME IN 1999 BY FAMILY TYPE BY AGE OF HOUSEHOLDER || BY NUMBER OF WORKERS IN FAMILY | Universe: Families || Universe: Families | ------------- Other families ------------- || | Married-couple Male householder, Female householder, || Families Mean | families No wife present No husband present || No workers 29,393 $62,402 | Householder 15 to 24 years $38,954 $39,228 $14,870 || 1 worker 26,131 $71,089 | Householder 25 to 34 years $58,463 $39,281 $25,301 || 2 workers, husband | Householder 35 to 44 years $79,896 $46,232 $35,658 || and wife worked 28,087 $81,977 | Householder 45 to 54 years $88,171 $50,441 $39,051 || 2 workers, other 5,326 $55,399 | Householder 55 to 59 years $102,851 $39,647 $47,616 || 3 or more workers, | Householder 60 to 64 years $85,768 $136,357 $40,679 || husband and wife worked 5,094 $88,060 | Householder 65 to 74 years $75,030 $41,313 $39,524 || 3 or more workers, other 1,136 $80,506 | Householder 75 and over $66,002 $56,344 $56,326 || | ||----------------------------------------------------------------------------------------------------------------------------------------------------|| || PCT38. FAMILY INCOME IN 1999 BY FAMILY TYPE BY PRESENCE OF OWN CHILDREN UNDER 18 YEARS || Universe: Families || ------ Married-couple families------- ------------------------------- Other families-------------------------------- || With own children No own children Male householder, No wife present Female householder, No husband present || under 18 years under 18 years With own children No own children With own children No own children || under 18 years under 18 years under 18 years under 18 years || Less than $10,000 366 1,280 186 61 1,153 340 || $10,000 to $14,999 280 1,323 72 42 654 314 || $15,000 to $19,999 594 2,429 232 127 825 253 || $20,000 to $24,999 721 3,359 291 155 693 358 || $25,000 to $29,999 999 3,456 200 117 609 475 || $30,000 to $34,999 1,161 4,247 222 246 491 468 || $35,000 to $39,999 1,099 3,908 119 180 356 516 || $40,000 to $44,999 1,418 4,037 125 80 340 436 || $45,000 to $49,999 1,293 3,768 76 196 293 400 || $50,000 to $59,999 2,561 6,740 148 206 310 640 || $60,000 to $74,999 3,097 7,271 76 255 133 265 || $75,000 to $99,999 2,750 6,978 89 175 107 309 || $100,000 to $124,999 1,342 3,855 26 143 39 94 || $125,000 to $149,999 665 2,099 5 38 4 61 || $150,000 to $199,999 618 1,925 0 35 28 61 || $200,000 and more 1,178 3,258 33 25 36 50 || Total families 20,142 59,933 1,900 2,081 6,071 5,040 ||----------------------------------------------------------------------------------------------------------------------------------------------------|| || PCT39/PCT40/PCT41. MEDIAN AND MEAN FAMILY INCOME IN 1999 BY PRESENCE OF OWN CHILDREN UNDER 18 YEARS || Universe: Families || || ------------ Total ------------ --- Married-couple families --- --------------------------- Other families----------------------------- || Male householder, no wife present Female hseholder, no husbnd present || With own No own With own No own With own No own With own No own || children children children children children children children children || Total under 18 under 18 Total under 18 under 18 Total under 18 under 18 Total under 18 under 18 || || Median $50,111 $47,452 $51,033 $54,055 $58,083 $52,600 $35,978 $29,289 $46,401 $29,394 $22,745 $37,713 || Mean $71,762 $65,990 $74,182 $77,674 $79,508 $77,057 $48,864 $38,931 $57,932 $37,365 $29,613 $46,702 ||----------------------------------------------------------------------------------------------------------------------------------------------------|

2000 Census of Population and Housing - Summary File 3 Florida State Data Center Income Profile, Page 4-----------------------------------------------------------------------------------------------------------------------------------------------------| State: FL Area Name: Sarasota County || County: 115 MCD/CCD: Place: . Tract: Block Group: |=====================================================================================================================================================| || PCT72A. HOUSEHOLD INCOME IN 1999 BY AGE OF HOUSEHOLDER (WHITE ALONE HOUSEHOLDER) || Universe: Households with a householder who is White alone || All || Ages Under 25 25 to 34 35 to 44 45 to 54 55 to 64 65 to 74 75 & over || || Less than $10,000 8,631 298 468 947 1,193 1,382 1,663 2,680 || $10,000 to $14,999 7,731 232 362 777 636 828 1,634 3,262 || $15,000 to $19,999 9,485 343 747 994 807 1,205 2,004 3,385 || $20,000 to $24,999 10,278 215 738 1,356 1,162 1,455 2,272 3,080 || $25,000 to $29,999 9,932 280 966 1,258 1,208 1,269 2,323 2,628 || $30,000 to $34,999 10,501 239 848 1,469 1,249 1,838 2,006 2,852 || $35,000 to $39,999 9,166 225 1,037 1,317 1,351 1,370 1,869 1,997 || $40,000 to $44,999 9,040 166 1,068 1,507 1,368 1,226 2,023 1,682 || $45,000 to $49,999 7,972 188 817 1,319 1,233 1,147 1,654 1,614 || $50,000 to $59,999 13,900 204 1,546 2,448 2,277 2,144 2,731 2,550 || $60,000 to $74,999 13,987 127 1,428 2,541 2,540 2,397 2,446 2,508 || $75,000 to $99,999 12,960 62 933 2,027 2,912 2,119 2,458 2,449 || $100,000 to $124,999 6,807 53 377 1,217 1,375 1,227 1,401 1,157 || $125,000 to $149,999 3,463 10 175 602 659 652 825 540 || $150,000 to $199,999 3,078 0 151 366 636 642 596 687 || $200,000 and more 5,319 0 89 870 1,002 1,278 1,198 882 || || Total 142,250 2,642 11,750 21,015 21,608 22,179 29,103 33,953 || ||---------------------------------------------------------------------------------------------------------------------------------------------------|| || PCT72B. HOUSEHOLD INCOME IN 1999 BY AGE OF HOUSEHOLDER (BLACK OR AFRICAN AMERICAN ALONE HOUSEHOLDER) || Universe: Households with a householder who is Black or African American alone || All || Ages Under 25 25 to 34 35 to 44 45 to 54 55 to 64 65 to 74 75 & over || || Less than $10,000 1,165 176 155 173 197 196 175 93 || $10,000 to $14,999 409 66 84 49 63 60 68 19 || $15,000 to $19,999 642 31 132 161 116 63 86 53 || $20,000 to $24,999 358 34 85 93 39 50 47 10 || $25,000 to $29,999 202 19 29 46 50 22 27 9 || $30,000 to $34,999 328 10 41 76 69 66 31 35 || $35,000 to $39,999 310 13 52 47 42 48 39 69 || $40,000 to $44,999 249 2 46 65 74 28 26 8 || $45,000 to $49,999 197 0 31 64 18 41 19 24 || $50,000 to $59,999 384 11 65 145 81 22 24 36 || $60,000 to $74,999 279 0 70 65 63 59 22 0 || $75,000 to $99,999 179 0 7 31 81 36 14 10 || $100,000 to $124,999 50 0 10 16 18 6 0 0 || $125,000 to $149,999 41 0 0 17 8 0 16 0 || $150,000 to $199,999 24 0 0 0 0 19 5 0 || $200,000 and more 28 0 0 6 0 11 0 11 || || Total 4,845 362 807 1,054 919 727 599 377 || ||---------------------------------------------------------------------------------------------------------------------------------------------------|

2000 Census of Population and Housing - Summary File 3 Florida State Data Center Income Profile, Page 5------------------------------------------------------------------------------------------------------------------------------------------------------| State: FL Area Name: Sarasota County || County: 115 MCD/CCD: Place: . Tract: Block Group: |======================================================================================================================================================| || PCT72C. HOUSEHOLD INCOME IN 1999 BY AGE OF HOUSEHOLDER (AMERICAN INDIAN AND ALASKA NATIVE ALONE HOUSEHOLDER) || Universe: Households with a householder who is American Indian and Alaska Native alone || All || Ages Under 25 25 to 34 35 to 44 45 to 54 55 to 64 65 to 74 75 & over || || Less than $10,000 35 0 0 0 35 0 0 0 || $10,000 to $14,999 25 0 0 0 0 0 25 0 || $15,000 to $19,999 40 0 0 0 10 12 9 9 || $20,000 to $24,999 34 0 13 13 0 8 0 0 || $25,000 to $29,999 27 0 0 7 0 20 0 0 || $30,000 to $34,999 35 0 0 10 11 14 0 0 || $35,000 to $39,999 17 17 0 0 0 0 0 0 || $40,000 to $44,999 0 0 0 0 0 0 0 0 || $45,000 to $49,999 21 0 0 0 9 12 0 0 || $50,000 to $59,999 20 0 0 20 0 0 0 0 || $60,000 to $74,999 33 0 0 9 9 9 0 6 || $75,000 to $99,999 39 10 0 15 5 9 0 0 || $100,000 to $124,999 27 0 0 7 0 10 10 0 || $125,000 to $149,999 24 0 0 14 10 0 0 0 || $150,000 to $199,999 0 0 0 0 0 0 0 0 || $200,000 and more 3 0 0 0 0 3 0 0 || || Total 380 27 13 95 89 97 44 15 || ||----------------------------------------------------------------------------------------------------------------------------------------------------|| || PCT72D. HOUSEHOLD INCOME IN 1999 BY AGE OF HOUSEHOLDER (ASIAN ALONE HOUSEHOLDER) || Universe: Households with a householder who is Asian alone || All || Ages Under 25 25 to 34 35 to 44 45 to 54 55 to 64 65 to 74 75 & over || || Less than $10,000 65 12 10 23 11 0 0 9 || $10,000 to $14,999 9 9 0 0 0 0 0 0 || $15,000 to $19,999 79 8 0 42 16 7 6 0 || $20,000 to $24,999 22 0 11 4 0 7 0 0 || $25,000 to $29,999 83 0 8 26 31 0 18 0 || $30,000 to $34,999 37 0 0 37 0 0 0 0 || $35,000 to $39,999 42 22 0 5 7 8 0 0 || $40,000 to $44,999 40 0 8 14 14 4 0 0 || $45,000 to $49,999 11 0 0 6 5 0 0 0 || $50,000 to $59,999 103 5 33 26 18 21 0 0 || $60,000 to $74,999 82 0 12 12 24 34 0 0 || $75,000 to $99,999 59 0 9 7 20 15 8 0 || $100,000 to $124,999 16 0 0 0 0 11 5 0 || $125,000 to $149,999 30 0 0 9 12 9 0 0 || $150,000 to $199,999 27 0 0 8 14 5 0 0 || $200,000 and more 21 0 7 14 0 0 0 0 || || Total 726 56 98 233 172 121 37 9 || ||----------------------------------------------------------------------------------------------------------------------------------------------------|

2000 Census of Population and Housing - Summary File 3 Florida State Data Center Income Profile, Page 6------------------------------------------------------------------------------------------------------------------------------------------------------| State: FL Area Name: Sarasota County || County: 115 MCD/CCD: Place: . Tract: Block Group: |======================================================================================================================================================| || PCT72E. HOUSEHOLD INCOME IN 1999 BY AGE OF HOUSEHOLDER (NATIVE HAWAIIAN AND OTHER PACIFIC ISLANDER ALONE HOUSEHOLDER) || Universe: Households with a householder who is Native Hawaiian and Other Pacific Islander alone || All || Ages Under 25 25 to 34 35 to 44 45 to 54 55 to 64 65 to 74 75 & over || || Less than $10,000 0 0 0 0 0 0 0 0 || $10,000 to $14,999 0 0 0 0 0 0 0 0 || $15,000 to $19,999 8 0 8 0 0 0 0 0 || $20,000 to $24,999 0 0 0 0 0 0 0 0 || $25,000 to $29,999 0 0 0 0 0 0 0 0 || $30,000 to $34,999 0 0 0 0 0 0 0 0 || $35,000 to $39,999 0 0 0 0 0 0 0 0 || $40,000 to $44,999 0 0 0 0 0 0 0 0 || $45,000 to $49,999 0 0 0 0 0 0 0 0 || $50,000 to $59,999 0 0 0 0 0 0 0 0 || $60,000 to $74,999 0 0 0 0 0 0 0 0 || $75,000 to $99,999 0 0 0 0 0 0 0 0 || $100,000 to $124,999 0 0 0 0 0 0 0 0 || $125,000 to $149,999 0 0 0 0 0 0 0 0 || $150,000 to $199,999 0 0 0 0 0 0 0 0 || $200,000 and more 9 0 0 0 9 0 0 0 || || Total 17 0 8 0 9 0 0 0 || ||----------------------------------------------------------------------------------------------------------------------------------------------------|| || PCT72F. HOUSEHOLD INCOME IN 1999 BY AGE OF HOUSEHOLDER (SOME OTHER RACE ALONE HOUSEHOLDER) || Universe: Households with a householder who is some other race alone || All || Ages Under 25 25 to 34 35 to 44 45 to 54 55 to 64 65 to 74 75 & over || || Less than $10,000 40 10 21 9 0 0 0 0 || $10,000 to $14,999 59 10 9 0 34 0 0 6 || $15,000 to $19,999 95 16 9 40 19 11 0 0 || $20,000 to $24,999 68 14 25 29 0 0 0 0 || $25,000 to $29,999 56 0 16 11 21 8 0 0 || $30,000 to $34,999 88 0 30 5 53 0 0 0 || $35,000 to $39,999 81 0 59 7 0 0 15 0 || $40,000 to $44,999 8 0 0 8 0 0 0 0 || $45,000 to $49,999 111 19 42 34 0 7 9 0 || $50,000 to $59,999 117 10 27 29 22 16 13 0 || $60,000 to $74,999 70 0 0 49 6 15 0 0 || $75,000 to $99,999 51 12 8 0 15 16 0 0 || $100,000 to $124,999 23 0 0 23 0 0 0 0 || $125,000 to $149,999 0 0 0 0 0 0 0 0 || $150,000 to $199,999 8 0 0 8 0 0 0 0 || $200,000 and more 12 0 0 12 0 0 0 0 || || Total 887 91 246 264 170 73 37 6 || ||----------------------------------------------------------------------------------------------------------------------------------------------------|
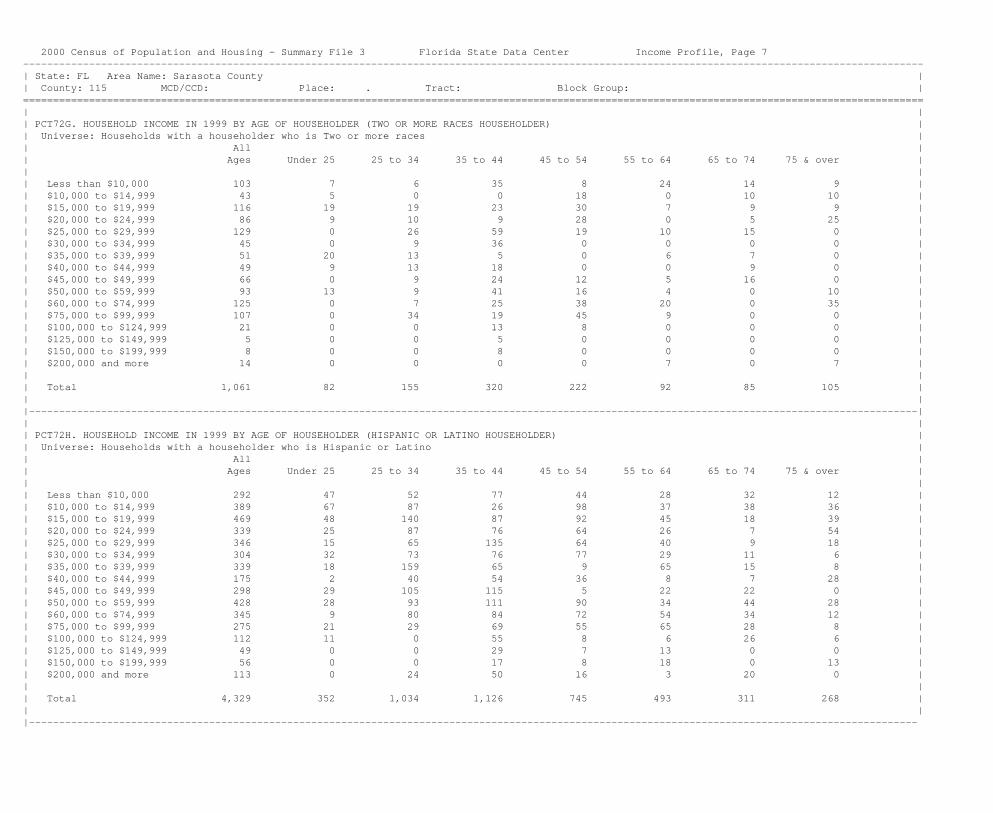
2000 Census of Population and Housing - Summary File 3 Florida State Data Center Income Profile, Page 7------------------------------------------------------------------------------------------------------------------------------------------------------| State: FL Area Name: Sarasota County || County: 115 MCD/CCD: Place: . Tract: Block Group: |======================================================================================================================================================| || PCT72G. HOUSEHOLD INCOME IN 1999 BY AGE OF HOUSEHOLDER (TWO OR MORE RACES HOUSEHOLDER) || Universe: Households with a householder who is Two or more races || All || Ages Under 25 25 to 34 35 to 44 45 to 54 55 to 64 65 to 74 75 & over || || Less than $10,000 103 7 6 35 8 24 14 9 || $10,000 to $14,999 43 5 0 0 18 0 10 10 || $15,000 to $19,999 116 19 19 23 30 7 9 9 || $20,000 to $24,999 86 9 10 9 28 0 5 25 || $25,000 to $29,999 129 0 26 59 19 10 15 0 || $30,000 to $34,999 45 0 9 36 0 0 0 0 || $35,000 to $39,999 51 20 13 5 0 6 7 0 || $40,000 to $44,999 49 9 13 18 0 0 9 0 || $45,000 to $49,999 66 0 9 24 12 5 16 0 || $50,000 to $59,999 93 13 9 41 16 4 0 10 || $60,000 to $74,999 125 0 7 25 38 20 0 35 || $75,000 to $99,999 107 0 34 19 45 9 0 0 || $100,000 to $124,999 21 0 0 13 8 0 0 0 || $125,000 to $149,999 5 0 0 5 0 0 0 0 || $150,000 to $199,999 8 0 0 8 0 0 0 0 || $200,000 and more 14 0 0 0 0 7 0 7 || || Total 1,061 82 155 320 222 92 85 105 || ||----------------------------------------------------------------------------------------------------------------------------------------------------|| || PCT72H. HOUSEHOLD INCOME IN 1999 BY AGE OF HOUSEHOLDER (HISPANIC OR LATINO HOUSEHOLDER) || Universe: Households with a householder who is Hispanic or Latino || All || Ages Under 25 25 to 34 35 to 44 45 to 54 55 to 64 65 to 74 75 & over || || Less than $10,000 292 47 52 77 44 28 32 12 || $10,000 to $14,999 389 67 87 26 98 37 38 36 || $15,000 to $19,999 469 48 140 87 92 45 18 39 || $20,000 to $24,999 339 25 87 76 64 26 7 54 || $25,000 to $29,999 346 15 65 135 64 40 9 18 || $30,000 to $34,999 304 32 73 76 77 29 11 6 || $35,000 to $39,999 339 18 159 65 9 65 15 8 || $40,000 to $44,999 175 2 40 54 36 8 7 28 || $45,000 to $49,999 298 29 105 115 5 22 22 0 || $50,000 to $59,999 428 28 93 111 90 34 44 28 || $60,000 to $74,999 345 9 80 84 72 54 34 12 || $75,000 to $99,999 275 21 29 69 55 65 28 8 || $100,000 to $124,999 112 11 0 55 8 6 26 6 || $125,000 to $149,999 49 0 0 29 7 13 0 0 || $150,000 to $199,999 56 0 0 17 8 18 0 13 || $200,000 and more 113 0 24 50 16 3 20 0 || || Total 4,329 352 1,034 1,126 745 493 311 268 || ||----------------------------------------------------------------------------------------------------------------------------------------------------|

2000 Census of Population and Housing - Summary File 3 Florida State Data Center Income Profile, Page 8---------------------------------------------------------------------------------------------------------------------------------------------------| State: FL Area Name: Sarasota County || County: 115 MCD/CCD: Place: . Tract: Block Group: |===================================================================================================================================================| || PCT72I. HOUSEHOLD INCOME IN 1999 BY AGE OF HOUSEHOLDER (WHITE ALONE, NOT HISPANIC OR LATINO HOUSEHOLDER) || Universe: Households with a householder who is White alone, not Hispanic or Latino || All || Ages Under 25 25 to 34 35 to 44 45 to 54 55 to 64 65 to 74 75 & over || || Less than $10,000 8,400 271 437 879 1,149 1,354 1,642 2,668 || $10,000 to $14,999 7,411 175 284 751 572 791 1,596 3,242 || $15,000 to $19,999 9,182 322 635 959 752 1,182 1,986 3,346 || $20,000 to $24,999 10,036 204 680 1,309 1,118 1,429 2,265 3,031 || $25,000 to $29,999 9,715 265 930 1,190 1,169 1,237 2,314 2,610 || $30,000 to $34,999 10,303 217 813 1,398 1,225 1,809 1,995 2,846 || $35,000 to $39,999 8,918 217 937 1,259 1,342 1,305 1,869 1,989 || $40,000 to $44,999 8,889 166 1,041 1,461 1,332 1,218 2,017 1,654 || $45,000 to $49,999 7,809 178 754 1,262 1,228 1,132 1,641 1,614 || $50,000 to $59,999 13,618 186 1,480 2,378 2,224 2,126 2,690 2,534 || $60,000 to $74,999 13,731 118 1,355 2,507 2,474 2,357 2,412 2,508 || $75,000 to $99,999 12,777 53 918 1,974 2,883 2,078 2,430 2,441 || $100,000 to $124,999 6,718 42 377 1,185 1,367 1,221 1,375 1,151 || $125,000 to $149,999 3,414 10 175 573 652 639 825 540 || $150,000 to $199,999 3,030 0 151 357 628 624 596 674 || $200,000 and more 5,221 0 65 832 986 1,278 1,178 882 || || Total 139,172 2,424 11,032 20,274 21,101 21,780 28,831 33,730 || ||-------------------------------------------------------------------------------------------------------------------------------------------------|

2000 Census of Population and Housing - Summary File 3 Florida State Data Center Language Profile Page 1------------------------------------------------------------------------------------------------------------------------------------------------------| State: FL Area Name: Sarasota County || County: 115 MCD/CCD: Place: . Tract: Block Group: ||====================================================================================================================================================|| P23/PCT20. PLACE OF BIRTH BY YEAR OF ENTRY BY CITIZENSHIP STATUS || Universe: Foreign-born population || Year of entry 1990 to March 2000 Year of entry 1980 to 1989 Year of entry before 1980 || Naturalized Not a citizen Naturalized Not a citizen Naturalized Not a citizen || Total citizen Number Pct.* citizen Number Pct.* citizen Number Pct.* || ||Total Foreign-born pop: 30,416 1,055 10,164 90.6 2,079 2,712 56.6 11,508 2,898 20.1 || Europe 14,145 491 2,975 85.8 638 925 59.2 7,666 1,450 15.9 || Asia 2,605 108 922 89.5 497 161 24.5 743 174 19.0 || Africa 407 33 122 78.7 81 56 40.9 77 38 33.0 || Oceania 173 0 62 100.0 8 30 78.9 33 40 54.8 || Americas: 13,086 423 6,083 93.5 855 1,540 64.3 2,989 1,196 28.6 || Latin America: 9,533 397 5,056 92.7 780 1,104 58.6 1,830 366 16.7 || Caribbean 2,457 167 791 82.6 231 148 39.1 961 159 14.2 || Central America: 4,699 151 2,977 95.2 381 754 66.4 316 120 27.5 || Mexico 4,078 127 2,821 95.7 242 635 72.4 172 81 32.0 || Other Cent. America 621 24 156 86.7 139 119 46.1 144 39 21.3 || South America 2,377 79 1,288 94.2 168 202 54.6 553 87 13.6 || Northern America 3,553 26 1,027 97.5 75 436 85.3 1,159 830 41.7 || Born at sea 0 0 0 .0 0 0 .0 0 0 .0 || ||*This is the percent of people born in a given area entering the US during the specified time period who are not US citizens. ||----------------------------------------------------------------------------------------------------------------------------------------------------|| PCT12. NATIVITY BY LANGUAGE SPOKEN AT HOME BY ABILITY TO SPEAK ENGLISH | PCT20(SUMMARY). PLACE OF BIRTH BY CITIZENSHIP STATUS || Universe: Population 5 years and over | Universe: Foreign-born population || | Naturalized Not a || Total Native Foreign born | citizen citizen || | || Total Population 5 and over: 313,327 283,224 30,103 | Total Foreign-born population 14,642 15,774 || | Europe 8,795 5,350 || Speak only English 280,340 269,983 10,357 | Asia 1,348 1,257 || Speak Spanish: 13,751 6,137 7,614 | Africa 191 216 || Speak English “very well” 7,025 4,892 2,133 | Oceania 41 132 || Speak English “well” 2,895 662 2,233 | Americas: 4,267 8,819 || Speak English “not well” 2,637 523 2,114 | Latin America: 3,007 6,526 || Speak English “not at all” 1,194 60 1,134 | Caribbean 1,359 1,098 || Speak other Indo-European languages: 15,966 6,378 9,588 | Central America: 848 3,851 || Speak English “very well” 10,974 5,272 5,702 | Mexico 541 3,537 || Speak English “well” 3,559 746 2,813 | Other Central America 307 314 || Speak English “not well” 1,254 331 923 | Southern America 800 1,577 || Speak English “not at all” 179 29 150 | Northern America 1,260 2,293 || Speak Asian or Pacific Island languages: 1,830 309 1,521 | Born at Sea 0 0 || Speak English “very well” 839 228 611 |-------------------------------------------------------------------|| Speak English “well” 534 23 511 | PCT11. LANGUAGE SPOKEN AT HOME BY ABILITY TO SPEAK ENGLISH || Speak English “not well” 390 58 332 | Universe: Hispanic or Latino population 5 years and over || Speak English “not at all” 67 0 67 | || Speak other languages: 1,440 417 1,023 | Total Hispanic/Latino pop 5 and over: 13,114 || Speak English “very well” 938 352 586 | Speak only English 2,733 || Speak English “well” 353 16 337 | Speak Spanish: 10,197 || Speak English “not well” 107 7 100 | Speak English "very well" 4,137 || Speak English “not at all” 42 42 0 | Speak English "well" 2,545 || | Speak English "not at well" 2,329 || | Speak English "not at all" 1,186 || | Speak other language 184 ||----------------------------------------------------------------------------------------------------------------------------------------------------|
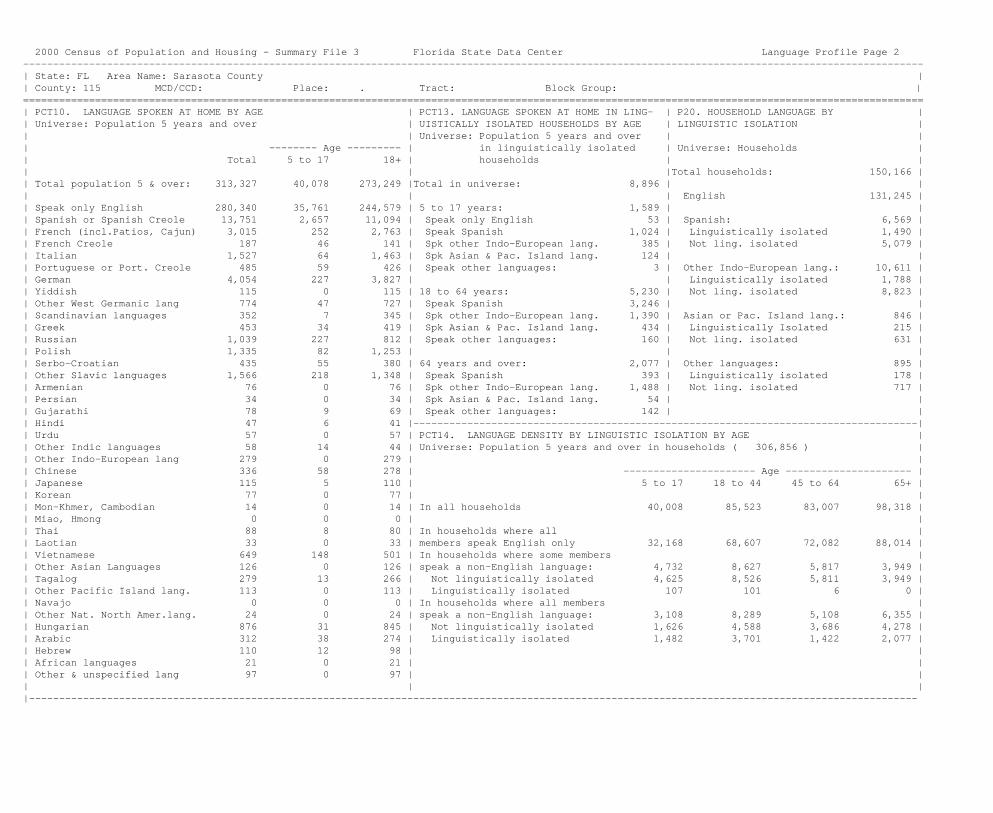
2000 Census of Population and Housing - Summary File 3 Florida State Data Center Language Profile Page 2------------------------------------------------------------------------------------------------------------------------------------------------------| State: FL Area Name: Sarasota County || County: 115 MCD/CCD: Place: . Tract: Block Group: |======================================================================================================================================================| PCT10. LANGUAGE SPOKEN AT HOME BY AGE | PCT13. LANGUAGE SPOKEN AT HOME IN LING- | P20. HOUSEHOLD LANGUAGE BY || Universe: Population 5 years and over | UISTICALLY ISOLATED HOUSEHOLDS BY AGE | LINGUISTIC ISOLATION || | Universe: Population 5 years and over | || -------- Age --------- | in linguistically isolated | Universe: Households || Total 5 to 17 18+ | households | || | |Total households: 150,166 || Total population 5 & over: 313,327 40,078 273,249 |Total in universe: 8,896 | || | | English 131,245 || Speak only English 280,340 35,761 244,579 | 5 to 17 years: 1,589 | || Spanish or Spanish Creole 13,751 2,657 11,094 | Speak only English 53 | Spanish: 6,569 || French (incl.Patios, Cajun) 3,015 252 2,763 | Speak Spanish 1,024 | Linguistically isolated 1,490 || French Creole 187 46 141 | Spk other Indo-European lang. 385 | Not ling. isolated 5,079 || Italian 1,527 64 1,463 | Spk Asian & Pac. Island lang. 124 | || Portuguese or Port. Creole 485 59 426 | Speak other languages: 3 | Other Indo-European lang.: 10,611 || German 4,054 227 3,827 | | Linguistically isolated 1,788 || Yiddish 115 0 115 | 18 to 64 years: 5,230 | Not ling. isolated 8,823 || Other West Germanic lang 774 47 727 | Speak Spanish 3,246 | || Scandinavian languages 352 7 345 | Spk other Indo-European lang. 1,390 | Asian or Pac. Island lang.: 846 || Greek 453 34 419 | Spk Asian & Pac. Island lang. 434 | Linguistically Isolated 215 || Russian 1,039 227 812 | Speak other languages: 160 | Not ling. isolated 631 || Polish 1,335 82 1,253 | | || Serbo-Croatian 435 55 380 | 64 years and over: 2,077 | Other languages: 895 || Other Slavic languages 1,566 218 1,348 | Speak Spanish 393 | Linguistically isolated 178 || Armenian 76 0 76 | Spk other Indo-European lang. 1,488 | Not ling. isolated 717 || Persian 34 0 34 | Spk Asian & Pac. Island lang. 54 | || Gujarathi 78 9 69 | Speak other languages: 142 | || Hindi 47 6 41 |------------------------------------------------------------------------------------|| Urdu 57 0 57 | PCT14. LANGUAGE DENSITY BY LINGUISTIC ISOLATION BY AGE || Other Indic languages 58 14 44 | Universe: Population 5 years and over in households ( 306,856 ) || Other Indo-European lang 279 0 279 | || Chinese 336 58 278 | ---------------------- Age --------------------- || Japanese 115 5 110 | 5 to 17 18 to 44 45 to 64 65+ || Korean 77 0 77 | || Mon-Khmer, Cambodian 14 0 14 | In all households 40,008 85,523 83,007 98,318 || Miao, Hmong 0 0 0 | || Thai 88 8 80 | In households where all || Laotian 33 0 33 | members speak English only 32,168 68,607 72,082 88,014 || Vietnamese 649 148 501 | In households where some members || Other Asian Languages 126 0 126 | speak a non-English language: 4,732 8,627 5,817 3,949 || Tagalog 279 13 266 | Not linguistically isolated 4,625 8,526 5,811 3,949 || Other Pacific Island lang. 113 0 113 | Linguistically isolated 107 101 6 0 || Navajo 0 0 0 | In households where all members || Other Nat. North Amer.lang. 24 0 24 | speak a non-English language: 3,108 8,289 5,108 6,355 || Hungarian 876 31 845 | Not linguistically isolated 1,626 4,588 3,686 4,278 || Arabic 312 38 274 | Linguistically isolated 1,482 3,701 1,422 2,077 || Hebrew 110 12 98 | || African languages 21 0 21 | || Other & unspecified lang 97 0 97 | || | ||----------------------------------------------------------------------------------------------------------------------------------------------------|

2000 Census of Population and Housing - Summary File 3 Florida State Data Center Language Profile Page 3------------------------------------------------------------------------------------------------------------------------------------------------------| State: FL Area Name: Sarasota County || County: 115 MCD/CCD: Place: . Tract: Block Group: |======================================================================================================================================================| P19/PCT62A-I LANGUAGE SPOKEN AT HOME BY ABILITY TO SPEAK ENGLISH BY AGE BY RACE AND HISPANIC/LATINO ORIGIN || Universe: Population 5 years and over || || :-------------------------------- Race* --------------------------------------- : ------ Hispanic** ----- || : Native : || : American Hawaiian : || : Black or Incian & Other Some : White || : African & Alaska Pacific Other Two : Alone, not || All : White American Native Asian Islander Race or More : Hispanic Hispanic || Races : Alone Alone Alone Alone Alone Alone Races : or Latino or Latino || : : || Total population 5 & over: 313,327 : 291,315 12,551 759 2,502 35 3,208 2,957 : 13,114 282,347 || Speak only English 280,340 : 264,854 11,794 715 698 27 315 1,937 : 2,733 262,690 || Speak other languages: 32,987 : 26,461 757 44 1,804 8 2,893 1,020 : 10,381 19,657 || Speak English "very well" 19,776 : 16,854 574 34 838 0 977 499 : 4,280 13,817 || Speak English "well" 7,341 : 5,606 118 10 523 0 882 202 : 2,579 4,061 || Speak English "not well" 4,388 : 2,959 49 0 376 8 758 238 : 2,336 1,550 || Speak English "not at all" 1,482 : 1,042 16 0 67 0 276 81 : 1,186 229 || : : || 5 to 17 years: 40,078 : 34,556 3,375 110 393 10 755 879 : 2,817 32,683 || Speak only English 35,761 : 31,493 3,218 110 182 10 81 667 : 868 30,773 || Speak other languages: 4,317 : 3,063 157 0 211 0 674 212 : 1,949 1,910 || Speak English "very well" 2,754 : 2,082 139 0 92 0 351 90 : 1,124 1,374 || Speak English "well" 855 : 534 10 0 57 0 197 57 : 414 339 || Speak English "not well" 552 : 356 8 0 62 0 71 55 : 255 197 || Speak English "not at all" 156 : 91 0 0 0 0 55 10 : 156 0 || : : || 18 to 64 years: 170,772 : 156,421 7,657 574 1,912 25 2,383 1,800 : 9,152 150,321 || Speak only English 150,461 : 140,992 7,128 530 499 17 205 1,090 : 1,590 139,800 || Speak other languages: 20,311 : 15,429 529 44 1,413 8 2,178 710 : 7,562 10,521 || Speak English "very well" 11,772 : 9,650 402 34 707 0 617 362 : 2,801 7,629 || Speak English "well" 4,451 : 3,192 70 10 381 0 662 136 : 1,951 2,020 || Speak English "not well" 3,029 : 1,846 41 0 288 8 687 159 : 1,913 747 || Speak English "not at all" 1,059 : 741 16 0 37 0 212 53 : 897 125 || : : || 65 years & over: 102,477 : 100,338 1,519 75 197 0 70 278 : 1,145 99,343 || Speak only English 94,118 : 92,369 1,448 75 17 0 29 180 : 275 92,117 || Speak other languages: 8,359 : 7,969 71 0 180 0 41 98 : 870 7,226 || Speak English "very well" 5,250 : 5,122 33 0 39 0 9 47 : 355 4,814 || Speak English "well" 2,035 : 1,880 38 0 85 0 23 9 : 214 1,702 || Speak English "not well" 807 : 757 0 0 26 0 0 24 : 168 606 || Speak English "not at all" 267 : 210 0 0 30 0 9 18 : 133 104 || ||----------------------------------------------------------------------------------------------------------------------------------------------------||* For Census 2000, persons could report more than one race, but the seven racial categories shown are mutually exclusive and include everyone. ||** Hispanic or Latino origin is NOT considered a race. People who reported themselves as Hispanic or Latino are also counted in the seven racial || categories. |------------------------------------------------------------------------------------------------------------------------------------------------------

2000 Census of Population and Housing - Summary File 3 Florida State Data Center Migration Profile Page 1------------------------------------------------------------------------------------------------------------------------------------------------------| State: FL Area Name: Sarasota County || County: 115 MCD/CCD: Place: . Tract: Block Group: |======================================================================================================================================================| P24. RESIDENCE IN 1995 FOR THE POPULATION 5 YEARS AND OVER--STATE AND COUNTY | 21. PLACE OF BIRTH BY CITIZENSHIP STATUS || LEVEL | Universe: Total Population || Universe: Population 5 Years and Over | || | Total Population: 325,957 || Total: 313,327 | Native 295,541 || Same house in 1995 160,973 | Born in state of residence 62,414 || Different house in 1995: 152,354 | Born in other state in the United States: 229,629 || In United States in 1995: 144,489 | Northeast 99,167 || Same county 69,935 | Midwest 87,516 || Different county: 74,554 | South 35,279 || Same state 21,157 | West 7,667 || Different State 53,397 | Born outside the United States: 3,498 || Northeast 21,573 | Puerto Rico 955 || Midwest 16,665 | U.S. Islands 185 || South 11,054 | Born abroad of American parents 2,358 || West 4,105 | Foreign born: 30,416 || In Puerto Rico in 1995: 281 | Naturalized citizen 14,642 || Same municipio 0 | Not a citizen 15,774 || Different municipio 0 | || Elsewhere in 1995: 7,584 |----------------------------------------------------------------|| U.S. Island Areas 208 | || Foreign country or at sea 7,376 | P22. YEAR OF ENTRY FOR FOREIGN BORN POPULATION || | Universe: Foreign-born population ||-----------------------------------------------------------------------------------| || | Total Foreign-born: 30,416 || P25. RESIDENCE IN 1995 FOR THE POPULATION 5 YEARS AND OVER--MSA/PMSA LEVEL | 1995 to March 2000 6,662 || Universe: Population 5 years and over | 1990 to 1994 4,557 || | 1985 to 1989 2,480 || Total: 313,327 | 1980 to 1984 2,311 || Living in an MSA/PMSA in 2000: 313,327 | 1975 to 1979 1,460 || Same house in 1995 160,973 | 1970 to 1974 1,476 || Different house in 1995: 152,354 | 1965 to 1969 1,901 || In United States in 1995: 144,489 | Before 1965 9,569 || Same MSA/PMSA in 1995: 74,423 | || Central city 36,858 |----------------------------------------------------------------|| Remainder of this MSA/PMSA 37,565 | || Different MSA/PMSA in 1995 62,111 | P23. YEAR OF ENTRY BY CITIZEN STATUS FOR THE FOREIGN-BORN || Central city 21,010 | POPULATON || Remainder of different MSA/PMSA 41,101 | Universe: Foreign-born population || Not in an MSA/PMSA in 1995 7,955 | || Puerto Rico or Elsewhere in 1995 281 | Total Foreign-born: 30,416 || Not living in an MSA/PMSA in 2000: 0 | Year of entry 1990 to Marth 2000: 11,219 || Same house in 1995 0 | Naturalized citizen 1,055 || Different house in 1995: 0 | Not a citizen 10,164 || In the United States in 1995: 0 | Year of entry 1980 to 1989: 4,791 || In an MSA/PMSA in 1995: 0 | Naturalized citizen 2,079 || Central City 0 | Not a citizen 2,712 || Remainder of this MSA/PMSA 0 | Year of entry before 1980: 14,406 || Not in an MSA/PMSA in 1995 0 | Naturalized citizen 11,508 || Puerto Rico or Elsewhere in 1995 0 | Not a citizen 2,898 || | ||----------------------------------------------------------------------------------------------------------------------------------------------------|

2000 Census of Population and Housing - Summary File 3 Florida State Data Center Migration Profile Page 2----------------------------------------------------------------------------------------------------------------------------------------------------| State: FL Area Name: Sarasota County || County: 115 MCD/CCD: Place: . Tract: Block Group: |====================================================================================================================================================| P21/PCT63A-I PLACE OF BIRTH BY CITIZENSHIP STATUS BY RACE AND HISPANIC/LATINO ORIGIN || Universe: Total Population || || : ---------------------------------------- Race (1) ---------------------------------------- || : Black or American || : African Indian and || All : White American Alaskan Native Asian || races : Alone Alone Alone Alone || : || Total: 325,957 : 301,972 13,677 812 2,624 || Native: 295,541 : 277,718 12,698 805 704 || Born in state of residence 62,414 : 51,390 9,211 156 240 || Born in other state in U.S.: 229,629 : 223,331 3,363 641 368 || Northeast 99,167 : 97,204 839 232 144 || Midwest 87,516 : 86,442 272 233 43 || South 35,279 : 32,492 2,148 156 54 || West 7,667 : 7,193 104 20 127 || Born outside the U.S.: 3,498 : 2,997 124 8 96 || Puerto Rico 955 : 776 25 0 0 || U.S. Island Areas 185 : 111 30 0 31 || Born abroad of American parent(s) 2,358 : 2,110 69 8 65 || Foreign Born: 30,416 : 24,254 979 7 1,920 || Naturalized citizen 14,642 : 12,503 548 0 918 || Not a citizen 15,774 : 11,751 431 7 1,002 || || ---------------------- Race (1) ---------------------- ------------- Hispanic (2) ------------ || Native : || Hawaiian & : || Other Pacific Some : White Alone, || Islander Other race Two or : Hispanic or Not Hispanic || Alone Alone More Races : Latino or Latino || : || Total: 35 3,478 3,359 : 14,373 292,123 || Native: 27 1,121 2,468 : 6,243 273,127 || Born in state of residence 27 432 958 : 2,529 49,538 || Born in other state in U.S.: 0 509 1,417 : 2,542 221,505 || Northeast 0 194 554 : 1,059 96,440 || Midwest 0 112 414 : 615 85,975 || South 0 118 311 : 554 32,101 || West 0 85 138 : 314 6,989 || Born outside the U.S.: 0 180 93 : 1,172 2,084 || Puerto Rico 0 126 28 : 849 106 || U.S. Island Areas 0 4 9 : 13 102 || Born abroad of American parent(s) 0 50 56 : 310 1,876 || Foreign Born: 8 2,357 891 : 8,130 18,996 || Naturalized citizen 0 319 354 : 2,233 10,742 || Not a citizen 8 2,038 537 : 5,897 8,254 || ||--------------------------------------------------------------------------------------------------------------------------------------------------|| (1) For Census 2000, persons could report more than one race, but the seven racial categories shown are mutually exclusive and include everyone. || (2) Hispanic or Latino origin is NOT considered a race. People who reported themselves as Hispanic or Latino are also counted in the seven || racial categories. ||--------------------------------------------------------------------------------------------------------------------------------------------------|

2000 Census of Population and Housing - Summary File 3 Florida State Data Center Migration Profile Page 3-----------------------------------------------------------------------------------------------------------------------------------------------------| State: FL Area Name: Sarasota County || County: 115 MCD/CCD: Place: . Tract: Block Group: |=====================================================================================================================================================| P24/PCT64A-I RESIDENCE IN 1995 BY RACE AND HISPANIC/LATINO ORIGIN - STATE AND COUNTY LEVEL || Universe: Population 5 Years and Over : --------------------------------------- Race (1) --------------------------------------|| : Black or American || : African Indian and || All : White American Alaskan Native Asian || Races : Alone Alone Alone Alone || : || Total Population 5 Years & Over: 313,327 : 291,315 12,551 759 2,502 || Same house in 1995 160,973 : 151,970 5,811 378 1,107 || Different house in 1995: 152,354 : 139,345 6,740 381 1,395 || In United States in 1995: 144,489 : 133,371 6,481 381 970 || Same county 69,935 : 63,599 4,145 150 374 || Different county: 74,554 : 69,772 2,336 231 596 || Same State 21,157 : 18,688 1,394 147 131 || Different State: 53,397 : 51,084 942 84 465 || Northeast 21,573 : 20,791 417 0 77 || Midwest 16,665 : 16,385 119 52 31 || South 11,054 : 10,339 350 29 122 || West 4,105 : 3,569 56 3 235 || In Puerto Rico in 1995: 281 : 160 77 0 0 || Same municipio 0 : 0 0 0 0 || Different municipio 0 : 0 0 0 0 || Elsewhere in 1995: 7,584 : 5,814 182 0 425 || U.S. Island Areas 208 : 169 0 0 39 || Foreign country or at sea 7,376 : 5,645 182 0 386 || || ------------------------- Race (1) ----------------------- ------------- Hispanic (2) ----------- || Native : || Hawaiian & : || Other Pacific Some : White Alone, || Islander Other Race Two or : Hispanic or Not Hispanic || Alone Alone More Races : Latino or Latino || : || Total Population 5 Years & Over: 35 3,208 2,957 : 13,114 282,347 || Same house in 1995 17 560 1,130 : 4,368 148,446 || Different house in 1995: 18 2,648 1,827 : 8,746 133,901 || In United States in 1995: 10 1,634 1,642 : 6,079 129,465 || Same county 0 815 852 : 3,274 61,536 || Different county: 10 819 790 : 2,805 67,929 || Same State 10 381 406 : 1,181 17,991 || Different State: 0 438 384 : 1,624 49,938 || Northeast 0 141 147 : 669 20,263 || Midwest 0 21 57 : 204 16,229 || South 0 125 89 : 534 9,939 || West 0 151 91 : 217 3,507 || In Puertorico in 1995: 0 44 0 : 182 30 || Same municipio 0 0 0 : 0 0 || Different municipio 0 0 0 : 0 0 || Elsewhere in 1995: 8 970 185 : 2,485 4,406 || U.S. Island Areas 0 0 0 : 0 169 || Foreign country or at sea 8 970 185 : 2,485 4,237 || ------------------------------------------------------------------------------------------------------------------------------------------------- || (1) For Census 2000, persons could report more than one race, but the seven racial categories shown are mutually exclusive and include everyone || (2) Hispanic or Latino origin is NOT considered a race. People who reported themselves as Hispanic or Latino are also counted in the seven racial || categories. ||---------------------------------------------------------------------------------------------------------------------------------------------------|

2000 Census of Population and Housing - Summary File 3 Florida State Data Center Poverty Profile, Page 1------------------------------------------------------------------------------------------------------------------------------------------------------| State: FL Area Name: Sarasota County || County: 115 MCD/CCD: Place: . Tract: Block Group: |======================================================================================================================================================| P89. POVERTY STATUS IN 1999 BY AGE BY HOUSEHOLD TYPE || Universe: Population for whom poverty status is determined (*) || P91/PCT54. INCOME DEFICIT IN 1999 FOR FAMILIES BY FAMILY TYPE AND UNRELATED INDIVIDUALS || Two Universes: Families and unrelated individuals with income in 1999 below the poverty level || Population With || ---Population With Income In 1999 Below Poverty Level--- |-Income In 1999 At or Above Poverty Level-- || Mean | || --All Ages-- Income | || Total Number Pct. Under 65 65 To 74 75 & Over : Deficit | All Ages Under 65 65 To 74 75 & Over || || Total In Poverty Universe: 319,270 24,817 7.8 20,332 1,977 2,508 : $3,241 | 294,453 200,336 47,264 46,853 || In Married-Couple Families 209,046 7,699 3.7 6,316 784 599 : $2,111 | 201,347 137,655 35,471 28,221 || In Other Families: 43,817 8,484 19.4 8,251 160 73 : $1,986 | 35,333 31,212 1,566 2,555 || Male Householder, No Wife 11,782 1,347 11.4 1,278 29 40 : $1,627 | 10,435 9,303 422 710 || Female Householder, No Husband 32,035 7,137 22.3 6,973 131 33 : $2,054 | 24,898 21,909 1,144 1,845 || Unrelated Individuals 66,407 8,634 13.0 5,765 1,033 1,836 : $5,482 | 57,773 31,469 10,227 16,077 || ||----------------------------------------------------------------------------------------------------------------------------------------------------|| P92. POVERTY STATUS IN 1999 OF HOUSEHOLDS BY HOUSEHOLD TYPE BY AGE OF HOUSEHOLDER || Universe: Households (**) || Households With Households With || ---------Income In 1999 Below Poverty Level--------- -----Income In 1999 At or Above Poverty Level----- || --All Ages-- || Total Number Pct. Under 25 25 To 44 45 To 64 65 & Over All Ages Under 25 25 To 44 45 To 64 65 & Over || || Total Households: 150,166 10,702 7.1 900 3,146 3,395 3,261 139,464 2,360 32,912 43,083 61,109 || Family Households: 95,167 4,827 5.1 433 2,248 1,292 854 90,340 1,168 23,271 29,568 36,333 || Married-Couple Family 80,075 2,344 2.9 72 811 783 678 77,731 682 17,791 25,529 33,729 || Other Family, no spouse: 15,092 2,483 16.5 361 1,437 509 176 12,609 486 5,480 4,039 2,604 || Male Householder 3,981 330 8.3 53 153 81 43 3,651 215 1,749 1,136 551 || Female Householder 11,111 2,153 19.4 308 1,284 428 133 8,958 271 3,731 2,903 2,053 || Nonfamily Households: 54,999 5,875 10.7 467 898 2,103 2,407 49,124 1,192 9,641 13,515 24,776 || Male Householder 21,047 2,096 10.0 151 460 928 557 18,951 732 5,913 5,775 6,531 || Female Householder 33,952 3,779 11.1 316 438 1,175 1,850 30,173 460 3,728 7,740 18,245 || ||----------------------------------------------------------------------------------------------------------------------------------------------------|| P93. RATIO OF INCOME IN 1999 TO POVERTY LEVEL BY HOUSEHOLD TYPE | P88. RATIO OF 1999 INCOME TO POVERTY LEVEL || Universe: Households (**) | Universe: Population for whom poverty status is determined (*) || Total Under 1.50 1.50 & Over | || Total Households: 150,166 21,025 129,141 | Cumul. Cumul. || Family Households: 95,167 9,383 85,784 | Persons Percent Persons Percent || Married-Couple Family 80,075 5,154 74,921 | Total: 319,270 100.0% || Other Family: 15,092 4,229 10,863 | || Male Householder,No Wife 3,981 740 3,241 | Under 0.50 11,202 3.5% | 1.50 - 1.74 11,937 18.3% || Female Householder,No Husband 11,111 3,489 7,622 | 0.50 - 0.74 5,928 5.4% | 1.75 - 1.84 5,431 20.0% || Nonfamily Households: 54,999 11,642 43,357 | 0.75 - 0.99 7,687 7.8% | 1.85 - 1.99 8,094 22.5% || Male Householder 21,047 3,794 17,253 | 1.00 - 1.24 9,855 10.9% | 2.00 & over 247,420 100.0% || Female Householder 33,952 7,848 26,104 | 1.25 - 1.49 11,716 14.5% | || | ||----------------------------------------------------------------------------------------------------------------------------------------------------||* Persons for whom poverty status was determined includes all people EXCEPT (1) those in institutions, military group quarters, and college || dormitories and (2) unrelated individuals under 15 years old (children who are not related family members). ||** Poverty status is NOT determined for households. The counts in this table actually reflect the poverty status of the householder. |------------------------------------------------------------------------------------------------------------------------------------------------------

2000 Census of Population and Housing - Summary File 3 Florida State Data Center Poverty Profile, Page 2------------------------------------------------------------------------------------------------------------------------------------------------------| State: FL Area Name: Sarasota County || County: 115 MCD/CCD: Place: . Tract: Block Group: |======================================================================================================================================================| P90/P160 A-I. POVERTY STATUS IN 1999 OF FAMILIES BY FAMILY TYPE BY PRESENCE OF RELATED CHILDREN UNDER 18 YEARS BY AGE OF RELATED CHILDREN BY || RACE AND HISPANIC/LATINO ORIGIN || Universe: Families [PART 1 OF 2 - INCOME IN 1999 BELOW POVERTY LEVEL] || || --------------------------- Families With Income In 1999 Below Poverty Level -------------------------------- || : -------------------------------- Race* -------------------------------- : ---- Hispanic** ----- || : : || : American Hawaiian : || : Black or Indian & Other Some : White || : African & Alaska Pacific Other Two : Alone, Not || All : White American Native Asian Islander Race or More : Hispanic Hispanic || Races : Alone Alone Alone Alone Alone Alone Races : or Latino or Latino || : : || Total Families Below Poverty: 4,827 : 3,632 907 20 91 0 106 71 : 488 3,301 || Percent Below Poverty 5.1% : 4.1% 27.2% 8.4% 15.1% .0% 16.6% 10.3% : 14.8% 3.8% || : : || Married-Couple Families: 2,344 : 2,042 129 16 53 0 74 30 : 331 1,807 || Percent Below Poverty 2.9% : 2.6% 8.5% 9.6% 11.6% .0% 17.2% 7.3% : 14.3% 2.4% || : : || With Related Children Under 18: 940 : 711 81 16 28 0 74 30 : 311 496 || Under 5 Years Only 182 : 163 0 0 0 0 19 0 : 100 82 || Under 5 Years And 5 to 17 Years 337 : 255 32 0 0 0 42 8 : 123 182 || 5 To 17 Years Only 421 : 293 49 16 28 0 13 22 : 88 232 || No Related Children Under 18 Years 1,404 : 1,331 48 0 25 0 0 0 : 20 1,311 || : : || Other Families: 2,483 : 1,590 778 4 38 0 32 41 : 157 1,494 || Percent Below Poverty 16.5% : 12.6% 42.8% 5.6% 26.4% .0% 15.2% 14.9% : 16.2% 12.5% || : : || Male Householder, No wife: 330 : 281 25 4 8 0 12 0 : 45 248 || Percent Below Poverty 8.3% : 8.0% 11.7% 13.3% 13.8% .0% 13.6% .0% : 11.3% 7.7% || : : || With Related Children Under 18: 285 : 243 18 4 8 0 12 0 : 39 216 || Under 5 Years Only 101 : 101 0 0 0 0 0 0 : 14 87 || Under 5 Years and 5 to 17 Years 47 : 29 8 4 0 0 6 0 : 14 21 || 5 To 17 Years Only 137 : 113 10 0 8 0 6 0 : 11 108 || No Related Children Under 18 Years 45 : 38 7 0 0 0 0 0 : 6 32 || : : || Female Householder, No husband: 2,153 : 1,309 753 0 30 0 20 41 : 112 1,246 || Percent Below Poverty 19.4% : 14.5% 47.0% .0% 34.9% .0% 16.3% 20.6% : 19.6% 14.3% || : : || With Related Children Under 18: 1,869 : 1,108 681 0 19 0 20 41 : 106 1,045 || Under 5 Years Only 378 : 279 89 0 0 0 10 0 : 26 263 || Under 5 Years And 5 to 17 Years 455 : 156 287 0 12 0 0 0 : 24 132 || 5 To 17 Years Only 1,036 : 673 305 0 7 0 10 41 : 56 650 || No Related Children Under 18 Years 284 : 201 72 0 11 0 0 0 : 6 201 || : : ||----------------------------------------------------------------------------------------------------------------------------------------------------||* For Census 2000, persons could report more than one race, but the seven racial categories shown are mutually exclusive and include everyone. ||** Hispanic or Latino origin is NOT considered a race. People who reported themselves as Hispanic or Latino are also counted in the seven racial || categories. |------------------------------------------------------------------------------------------------------------------------------------------------------
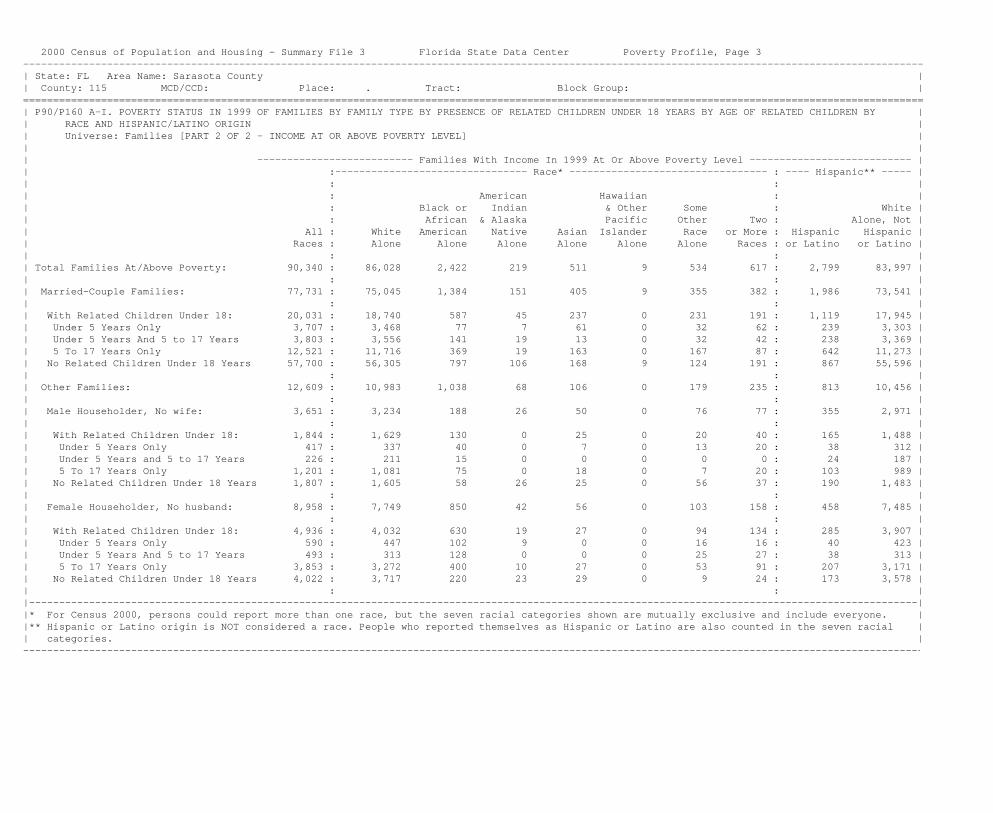
2000 Census of Population and Housing - Summary File 3 Florida State Data Center Poverty Profile, Page 3------------------------------------------------------------------------------------------------------------------------------------------------------| State: FL Area Name: Sarasota County || County: 115 MCD/CCD: Place: . Tract: Block Group: |======================================================================================================================================================| P90/P160 A-I. POVERTY STATUS IN 1999 OF FAMILIES BY FAMILY TYPE BY PRESENCE OF RELATED CHILDREN UNDER 18 YEARS BY AGE OF RELATED CHILDREN BY || RACE AND HISPANIC/LATINO ORIGIN || Universe: Families [PART 2 OF 2 - INCOME AT OR ABOVE POVERTY LEVEL] || || -------------------------- Families With Income In 1999 At Or Above Poverty Level --------------------------- || :-------------------------------- Race* --------------------------------- : ---- Hispanic** ----- || : : || : American Hawaiian : || : Black or Indian & Other Some : White || : African & Alaska Pacific Other Two : Alone, Not || All : White American Native Asian Islander Race or More : Hispanic Hispanic || Races : Alone Alone Alone Alone Alone Alone Races : or Latino or Latino || : : || Total Families At/Above Poverty: 90,340 : 86,028 2,422 219 511 9 534 617 : 2,799 83,997 || : : || Married-Couple Families: 77,731 : 75,045 1,384 151 405 9 355 382 : 1,986 73,541 || : : || With Related Children Under 18: 20,031 : 18,740 587 45 237 0 231 191 : 1,119 17,945 || Under 5 Years Only 3,707 : 3,468 77 7 61 0 32 62 : 239 3,303 || Under 5 Years And 5 to 17 Years 3,803 : 3,556 141 19 13 0 32 42 : 238 3,369 || 5 To 17 Years Only 12,521 : 11,716 369 19 163 0 167 87 : 642 11,273 || No Related Children Under 18 Years 57,700 : 56,305 797 106 168 9 124 191 : 867 55,596 || : : || Other Families: 12,609 : 10,983 1,038 68 106 0 179 235 : 813 10,456 || : : || Male Householder, No wife: 3,651 : 3,234 188 26 50 0 76 77 : 355 2,971 || : : || With Related Children Under 18: 1,844 : 1,629 130 0 25 0 20 40 : 165 1,488 || Under 5 Years Only 417 : 337 40 0 7 0 13 20 : 38 312 || Under 5 Years and 5 to 17 Years 226 : 211 15 0 0 0 0 0 : 24 187 || 5 To 17 Years Only 1,201 : 1,081 75 0 18 0 7 20 : 103 989 || No Related Children Under 18 Years 1,807 : 1,605 58 26 25 0 56 37 : 190 1,483 || : : || Female Householder, No husband: 8,958 : 7,749 850 42 56 0 103 158 : 458 7,485 || : : || With Related Children Under 18: 4,936 : 4,032 630 19 27 0 94 134 : 285 3,907 || Under 5 Years Only 590 : 447 102 9 0 0 16 16 : 40 423 || Under 5 Years And 5 to 17 Years 493 : 313 128 0 0 0 25 27 : 38 313 || 5 To 17 Years Only 3,853 : 3,272 400 10 27 0 53 91 : 207 3,171 || No Related Children Under 18 Years 4,022 : 3,717 220 23 29 0 9 24 : 173 3,578 || : : ||----------------------------------------------------------------------------------------------------------------------------------------------------||* For Census 2000, persons could report more than one race, but the seven racial categories shown are mutually exclusive and include everyone. ||** Hispanic or Latino origin is NOT considered a race. People who reported themselves as Hispanic or Latino are also counted in the seven racial || categories. |------------------------------------------------------------------------------------------------------------------------------------------------------

2000 Census of Population and Housing - Summary File 3 Florida State Data Center Poverty Profile, Page 4------------------------------------------------------------------------------------------------------------------------------------------------------| State: FL Area Name: Sarasota County || County: 115 MCD/CCD: Place: . Tract: Block Group: |======================================================================================================================================================| PCT49/PCT75 A-I. POVERTY STATUS IN 1999 BY SEX BY AGE BY RACE AND HISPANIC/LATINO ORIGIN || Universe: Population for whom poverty status is determined (*) [PART 1 OF 2 - INCOME IN 1999 BELOW POVERTY LEVEL] || || ----------------------------------- Population With Income In 1999 Below Poverty Level -----------------------------------|| :----------------------------------- Race**---------------------------------------- : ----- Hispanic*** ---- || : Native : || : American Hawaiian : || : Black or Indian & Other Some : White || All : African & Alaska Pacific Other Two : Alone, Not || ----Races--- : White American Native Asian Islander Race or More : Hispanic Hispanic || Number % : Alone Alone Alone Alone Alone Alone Races : or Latino or Latino || Total Population : : || Below Poverty Level: 24,817 7.8 : 18,810 4,196 88 415 0 810 498 : 2,730 17,164 || Pct Below Poverty: 7.8% : 6.4% 32.1% 10.9% 16.2% .0% 23.5% 15.1% : 19.1% 6.0% || : : || Male: 10,783 7.1 : 8,222 1,680 61 176 0 452 192 : 1,383 7,407 || Under 5 Years 974 15.6 : 615 227 6 28 0 56 42 : 223 489 || 5 Years 191 12.2 : 143 36 0 12 0 0 0 : 24 119 || 6 To 11 Years 1,134 12.2 : 655 394 0 38 0 32 15 : 151 536 || 12 To 14 Years 579 11.6 : 421 112 0 10 0 17 19 : 69 376 || 15 Years 232 13.7 : 134 55 0 0 0 43 0 : 55 122 || 16 And 17 Years 397 13.8 : 310 65 0 6 0 16 0 : 45 281 || 18 To 24 Years 970 12.3 : 685 164 0 15 0 98 8 : 200 592 || 25 To 34 Years 972 7.0 : 777 92 4 16 0 55 28 : 263 597 || 35 To 44 Years 1,316 6.4 : 918 215 0 44 0 104 35 : 205 831 || 45 To 54 Years 1,368 7.1 : 1,107 189 35 7 0 22 8 : 94 1,052 || 55 To 64 Years 1,057 5.7 : 955 74 0 0 0 9 19 : 24 940 || 65 To 74 Years 776 3.4 : 711 40 16 0 0 0 9 : 24 687 || 75 Yrs And Over 817 3.8 : 791 17 0 0 0 0 9 : 6 785 || : : || Female: 14,034 8.4 : 10,588 2,516 27 239 0 358 306 : 1,347 9,757 || Under 5 Years 987 16.0 : 537 342 0 6 0 86 16 : 230 403 || 5 Years 227 16.8 : 123 82 0 0 0 14 8 : 60 77 || 6 To 11 Years 1,090 12.4 : 713 323 10 0 0 6 38 : 131 619 || 12 To 14 Years 542 11.3 : 233 206 0 27 0 43 33 : 82 214 || 15 Years 201 14.0 : 111 81 0 0 0 0 9 : 0 111 || 16 And 17 Years 257 9.8 : 141 88 0 9 0 6 13 : 6 141 || 18 To 24 Years 1,602 21.1 : 1,112 260 0 79 0 112 39 : 260 994 || 25 To 34 Years 1,601 11.4 : 1,168 294 0 52 0 39 48 : 288 947 || 35 To 44 Years 1,769 8.2 : 1,371 294 0 25 0 42 37 : 120 1,285 || 45 To 54 Years 1,363 6.2 : 1,135 167 0 16 0 10 35 : 105 1,058 || 55 To 64 Years 1,503 6.6 : 1,290 181 17 8 0 0 7 : 17 1,273 || 65 To 74 Years 1,201 4.6 : 1,028 150 0 0 0 0 23 : 36 1,021 || 75 Yrs And Over 1,691 6.1 : 1,626 48 0 17 0 0 0 : 12 1,614 || ||----------------------------------------------------------------------------------------------------------------------------------------------------||* Persons for whom poverty status was determined includes everyone EXCEPT (1) persons in institutions, military group quarters, and college || dormitories and (2) unrelated individuals under 15 years old (children who are not related family members). ||** For Census 2000, persons could report more than one race, but the seven racial categories shown are mutually exclusive and include everyone. ||*** Hispanic or Latino origin is NOT considered a race. People who reported themselves as Hispanic or Latino are also counted in the seven racial || categories. |------------------------------------------------------------------------------------------------------------------------------------------------------

2000 Census of Population and Housing - Summary File 3 Florida State Data Center Poverty Profile, Page 5------------------------------------------------------------------------------------------------------------------------------------------------------| State: FL Area Name: Sarasota County || County: 115 MCD/CCD: Place: . Tract: Block Group: |======================================================================================================================================================| PCT49/PCT75 A-I. POVERTY STATUS IN 1999 BY SEX BY AGE BY RACE AND HISPANIC/LATINO ORIGIN || Universe: Population for whom poverty status is determined (*) [PART 2 OF 2 - INCOME IN 1999 AT OR ABOVE POVERTY LEVEL] || || -------------------------------- Population With Income In 1999 At Or Above Poverty Level --------------------------------|| :--------------------------------------- Race** ------------------------------------ : ------ Hispanic*** ----- || : Native : || : American Hawaiian : || : Black or Indian & Other Some : White || : African & Alaska Pacific Other Two : Alone, Not || All : White American Native Asian Islander Race or More : Hispanic Hispanic || Races : Alone Alone Alone Alone Alone Alone Races : or Latino or Latino || Total Population At/ : : || Above Poverty Status: 294,453 : 277,237 8,876 718 2,145 35 2,640 2,802 : 11,526 269,094 || : : || Male: 140,882 : 132,673 4,048 392 890 18 1,437 1,424 : 6,118 128,356 || Under 5 Years 5,255 : 4,704 249 32 49 0 29 192 : 363 4,425 || 5 Years 1,373 : 1,245 69 0 0 0 20 39 : 114 1,153 || 6 To 11 Years 8,142 : 7,232 440 24 95 10 142 199 : 642 6,755 || 12 To 14 Years 4,411 : 3,969 227 33 34 0 40 108 : 213 3,804 || 15 Years 1,463 : 1,386 19 0 22 0 29 7 : 51 1,364 || 16 And 17 Years 2,476 : 2,227 135 10 15 0 53 36 : 175 2,109 || 18 To 24 Years 6,895 : 6,006 382 48 82 0 252 125 : 798 5,529 || 25 To 34 Years 12,981 : 11,832 508 22 105 0 336 178 : 1,247 10,994 || 35 To 44 Years 19,371 : 17,965 683 103 165 0 290 165 : 1,053 17,268 || 45 To 54 Years 18,026 : 17,032 488 34 135 8 135 194 : 580 16,621 || 55 To 64 Years 17,614 : 16,916 378 52 124 0 70 74 : 433 16,570 || 65 To 74 Years 22,152 : 21,685 296 28 64 0 41 38 : 264 21,452 || 75 Years And Over 20,723 : 20,474 174 6 0 0 0 69 : 185 20,312 || : : || Female: 153,571 : 144,564 4,828 326 1,255 17 1,203 1,378 : 5,408 140,738 || Under 5 Years 5,198 : 4,617 295 15 39 0 92 140 : 392 4,319 || 5 Years 1,125 : 996 93 0 6 0 14 16 : 30 980 || 6 To 11 Years 7,691 : 6,900 396 0 77 0 133 185 : 455 6,597 || 12 To 14 Years 4,275 : 3,890 291 16 8 0 36 34 : 226 3,724 || 15 Years 1,238 : 1,072 78 11 19 0 39 19 : 93 1,024 || 16 And 17 Years 2,353 : 2,139 92 0 11 0 57 54 : 141 2,071 || 18 To 24 Years 6,005 : 5,183 356 23 179 0 135 129 : 504 4,861 || 25 To 34 Years 12,479 : 11,321 622 9 155 8 185 179 : 933 10,667 || 35 To 44 Years 19,814 : 18,013 777 101 341 0 266 316 : 893 17,449 || 45 To 54 Years 20,770 : 19,566 651 56 217 9 168 103 : 729 19,057 || 55 To 64 Years 21,381 : 20,637 465 70 87 0 49 73 : 400 20,304 || 65 To 74 Years 25,112 : 24,483 411 8 109 0 14 87 : 382 24,131 || 75 Years And Over 26,130 : 25,747 301 17 7 0 15 43 : 230 25,554 || ||----------------------------------------------------------------------------------------------------------------------------------------------------||* Persons for whom poverty status was determined includes everyone EXCEPT (1) persons in institutions, military group quarters, and college || dormitories and (2) unrelated individuals under 15 years old (children who are not related family members). ||** For Census 2000, persons could report more than one race, but the seven racial categories shown are mutually exclusive and include everyone. ||*** Hispanic or Latino origin is NOT considered a race. People who reported themselves as Hispanic or Latino are also counted in the seven racial || categories. |------------------------------------------------------------------------------------------------------------------------------------------------------

2000 Census of Population and Housing - Summary File 3 Florida State Data Center Poverty Profile, Page 6------------------------------------------------------------------------------------------------------------------------------------------------------| State: FL Area Name: Sarasota County || County: 115 MCD/CCD: Place: . Tract: Block Group: |======================================================================================================================================================| PCT52/PCT76 A-I. POVERTY STATUS IN 1999 OF RELATED CHILDREN UNDER 18 YEARS BY FAMILY TYPE BY AGE BY RACE/HISPANIC || Universe: Related children under 18 years || || :----------------------------------- Race* ------------------------------- : ----- Hispanic** ---- || : American Hawaiian : || : Black or Indian & Other Some : White || : African & Alaska Pacific Other Two : Alone, Not || All : White American Native Asian Islander Race or More : Hispanic Hispanic || Races : Alone Alone Alone Alone Alone Alone Races : or Latino or Latino || : : || Total Related Children Under 18 yrs: 51,461 : 44,235 4,355 157 502 10 993 1,209 : 3,956 41,540 || Poverty Rate for Related Children : : || Under 18 years: 12.7% : 8.8% 45.5% 10.2% 25.3% .0% 31.1% 14.9% : 26.9% 7.8% || : : || In Families : : || Income In 1999 Below Poverty Level: 6,513 : 3,901 1,980 16 127 0 309 180 : 1,066 3,253 || In Married-Couple Families: 2,289 : 1,761 149 0 71 0 237 71 : 770 1,277 || Under 5 Years 771 : 589 29 0 12 0 128 13 : 347 388 || 5 Years 163 : 144 0 0 12 0 7 0 : 41 110 || 6 To 17 Years 1,355 : 1,028 120 0 47 0 102 58 : 382 779 || In Other Families: 4,224 : 2,140 1,831 16 56 0 72 109 : 296 1,976 || Male Householder, no wife: 408 : 311 34 16 19 0 28 0 : 60 275 || Under 5 Years 138 : 124 4 6 0 0 4 0 : 28 96 || 5 Years 21 : 21 0 0 0 0 0 0 : 8 13 || 6 To 17 Years 249 : 166 30 10 19 0 24 0 : 24 166 || Female Householder, no husband: 3,816 : 1,829 1,797 0 37 0 44 109 : 236 1,701 || Under 5 Years 1,052 : 439 536 0 22 0 10 45 : 78 408 || 5 Years 234 : 101 118 0 0 0 7 8 : 35 73 || 6 To 17 Years 2,530 : 1,289 1,143 0 15 0 27 56 : 123 1,220 || : : || In Families With : : || Income In 1999 At/Above Poverty Lvl: 44,948 : 40,334 2,375 141 375 10 684 1,029 : 2,890 38,287 || In Married-Couple Families: 34,527 : 31,944 987 75 353 10 455 703 : 2,141 30,343 || Under 5 Years 8,536 : 7,908 216 29 78 0 58 247 : 553 7,444 || 5 Years 1,913 : 1,789 61 0 6 0 13 44 : 130 1,681 || 6 To 17 Years 24,078 : 22,247 710 46 269 10 384 412 : 1,458 21,218 || In Other Families: 10,421 : 8,390 1,388 66 22 0 229 326 : 749 7,944 || Male Householder, no wife: 2,805 : 2,422 224 13 10 0 15 121 : 288 2,167 || Under 5 Years 750 : 613 71 0 10 0 10 46 : 91 543 || 5 Years 154 : 124 24 0 0 0 0 6 : 0 124 || 6 To 17 Years 1,901 : 1,685 129 13 0 0 5 69 : 197 1,500 || Female Householder, no husband: 7,616 : 5,968 1,164 53 12 0 214 205 : 461 5,777 || Under 5 Years 1,167 : 800 257 18 0 0 53 39 : 111 757 || 5 Years 431 : 328 77 0 0 0 21 5 : 14 328 || 6 To 17 Years 6,018 : 4,840 830 35 12 0 140 161 : 336 4,692 || ||----------------------------------------------------------------------------------------------------------------------------------------------------||* For Census 2000, persons could report more than one race, but the seven racial categories shown are mutually exclusive and include everyone. ||** Hispanic or Latino origin is NOT considered a race. People who reported themselves as Hispanic or Latino are also counted in the seven racial || categories. |------------------------------------------------------------------------------------------------------------------------------------------------------

2000 Census of Population and Housing - Summary File 3 Florida State Data Center Poverty Profile, Page 7------------------------------------------------------------------------------------------------------------------------------------------------------| State: FL Area Name: Sarasota County || County: 115 MCD/CCD: Place: . Tract: Block Group: |======================================================================================================================================================| PCT50. AGE BY RATIO OF INCOME IN 1999 TO POVERTY LEVEL || Universe: Population for whom poverty status is determined (*) || || Rate 0.50 0.75 1.00 1.25 1.30 1.50 1.75 1.85 2.00 || by Under to to to to to to to to and || Total Age 0.50 0.74 0.99 1.24 1.29 1.49 1.74 1.84 1.99 Over || Total Population || In Poverty Univ.: 319,270 7.8% 11,202 5,928 7,687 9,855 2,457 9,259 11,937 5,431 8,094 247,420 || Under 5 Years 12,414 15.8% 836 460 665 695 172 563 777 304 445 7,497 || 5 Years 2,916 14.3% 165 92 161 101 23 158 276 59 112 1,769 || 6 to 11 Years 18,057 12.3% 943 510 771 887 211 688 1,033 555 771 11,688 || 12 to 14 Years 9,807 11.4% 372 375 374 514 84 351 479 259 379 6,620 || 15 Years 3,134 13.8% 258 95 80 154 16 141 111 79 76 2,124 || 16 and 17 Years 5,483 11.9% 327 123 204 183 16 191 224 105 190 3,920 || 18 to 24 Years 15,472 16.6% 1,282 642 648 710 136 795 778 309 367 9,805 || 25 to 34 Years 28,033 9.2% 1,098 597 878 858 214 980 1,206 659 680 20,863 || 35 to 44 Years 42,270 7.3% 1,401 691 993 1,246 341 1,117 1,484 758 1,138 33,101 || 45 to 54 Years 41,527 6.6% 1,341 727 663 913 174 894 947 492 722 34,654 || 55 to 64 Years 41,555 6.2% 1,278 603 679 979 102 1,005 1,182 541 604 34,582 || 65 to 74 Years 49,241 4.0% 850 411 716 1,101 349 894 1,471 553 1,064 41,832 || 75 Years and Over 49,361 5.1% 1,051 602 855 1,514 619 1,482 1,969 758 1,546 38,965 || ||Number under 18 yrs: 51,811 2,901 1,655 2,255 2,534 522 2,092 2,900 1,361 1,973 33,618 ||Cumul. pct. under 18: 5.6% 8.8% 13.1% 18.0% 19.0% 23.1% 28.7% 31.3% 35.1% 100.0% ||Number 65 yrs & over: 98,602 1,901 1,013 1,571 2,615 968 2,376 3,440 1,311 2,610 80,797 ||Cumul. pct. 65 & over: 1.9% 3.0% 4.5% 7.2% 8.2% 10.6% 14.1% 15.4% 18.1% 100.0% ||----------------------------------------------------------------------------------------------------------------------------------------------------|| PCT59. POVERTY STATUS IN 1999 OF FAMILIES BY FAMILY TYPE BY SOCIAL SECURITY INCOME BY SUPPLEMENTAL SECURITY INCOME (SSI) AND/OR PUBLIC ASSISTANCE || INCOME || Universe: Families Families with Income Families with Income || -- In 1999 Below Poverty Level-- In 1999 At Or Above Poverty Level || With Social | Without Social With Social | Without Social || Security Income | Security Income Security Income | Security Income || Total In 1999 | In 1999 In 1999 | In 1999 || || Total Families: 95,167 1,032 3,795 42,319 48,021 || || Married-Couple Families: 80,075 674 1,670 38,283 39,448 || With SSI And/Or Public Assistance Income In 1999 2,537 65 163 1,228 1,081 || Without SSI Or Public Assistance Income In 1999 77,538 609 1,507 37,055 38,367 || Other Families: 15,092 358 2,125 4,036 8,573 || Male Householder, No Wife Present: 3,981 21 309 1,061 2,590 || With SSI And/Or Public Assistance Income In 1999 289 0 39 130 120 || Without SSI And/Or Public Assistance Income In 1999 3,692 21 270 931 2,470 || Female Householder, No Husband Present: 11,111 337 1,816 2,975 5,983 || With SSI And/Or Public Assistance Income In 1999 1,098 114 242 369 373 || Without SSI And/Or Public Assistance Income In 1999 10,013 223 1,574 2,606 5,610 || ||----------------------------------------------------------------------------------------------------------------------------------------------------||* Persons for whom poverty status was determined includes everyone EXCEPT (1) persons in institutions, military group quarters, and college || dormitories and (2) unrelated individuals under 15 years old (children who are not related family members). |------------------------------------------------------------------------------------------------------------------------------------------------------

2000 Census of Population and Housing - Summary File 3 Florida State Data Center Poverty Profile, Page 8------------------------------------------------------------------------------------------------------------------------------------------------------| State: FL Area Name: Sarasota County || County: 115 MCD/CCD: Place: . Tract: Block Group: |======================================================================================================================================================| PCT60. POVERTY STATUS IN 1999 OF FAMILIES BY FAMILY TYPE BY WORK EXPERIENCE OF HOUSEHOLDER AND SPOUSE || Universe: Families || || -Householder Worked Full-Time,- : --Householder Worked Less Than- : ----Householder Did Not Work--- || -------Year-Round In 1999------ : -Full-Time, Year-Round In 1999- : ------------In 1999------------ || Below Poverty Above Poverty : Below Poverty Above Poverty : Below Poverty Above Poverty || Number Pct. : Number Pct. : Number Pct. || : : || Total Families: 800 2.1 37,391 : 1,672 8.8 17,272 : 2,355 6.2 35,677 || Married-Couple Families: 322 1.0 30,445 : 570 3.8 14,528 : 1,452 4.2 32,758 || : : || Spouse Worked Full-Time, : : || Year-Round In 1999 20 .1 14,677 : 23 .6 3,828 : 54 2.2 2,368 || : : || Spouse Worked Less Than Full-Time, : : || Year-Round In 1999 53 .6 9,016 : 236 4.2 5,328 : 182 5.4 3,178 || : : || Spouse Did Not Work In 1999 249 3.6 6,752 : 311 5.5 5,372 : 1,216 4.3 27,212 || : : || Other Families: 478 6.4 6,946 : 1,102 28.7 2,744 : 903 23.6 2,919 || Male Householder, No Wife 59 2.5 2,256 : 142 16.1 740 : 129 16.5 655 || Female Householder, No Husband 419 8.2 4,690 : 960 32.4 2,004 : 774 25.5 2,264 ||----------------------------------------------------------------------------------------------------------------------------------------------------|| PCT61. RATIO OF INCOME IN 1999 TO POVERTY LEVEL OF FAMILIES BY FAMILY TYPE BY PRESENCE AND AGE OF RELATED CHILDREN UNDER 18 YEARS OF AGE || Universe: Families || 1.00 1.30 1.50 1.85 : Cumulative Cumulative || Under to to to and : Total Total || Total 1.00 1.29 1.49 1.84 Above : Under 1.50 Under 1.85 || : || Total Families: 95,167 4,827 2,378 2,178 4,220 81,564 : 9,383 13,603 || Married-Couple Families: 80,075 2,344 1,493 1,317 3,082 71,839 : 5,154 8,236 || : || With Related Children Under 18 Years: 20,971 940 751 497 1,343 17,440 : 2,188 3,531 || Under 5 Years Only 3,889 182 191 121 226 3,169 : 494 720 || Under 5 Years And 5 To 17 Years 4,140 337 258 135 391 3,019 : 730 1,121 || 5 To 17 Years Only 12,942 421 302 241 726 11,252 : 964 1,690 || No Related Children Under 18 Years 59,104 1,404 742 820 1,739 54,399 : 2,966 4,705 || : || Other Families: 15,092 2,483 885 861 1,138 9,725 : 4,229 5,367 || : || Male Householder, No Wife Present: 3,981 330 186 224 305 2,936 : 740 1,045 || With Related Children Under 18 Years: 2,129 285 158 196 223 1,267 : 639 862 || Under 5 Years Only 518 101 39 46 66 266 : 186 252 || Under 5 Years And 5 To 17 Years 273 47 60 30 34 102 : 137 171 || 5 To 17 Years Only 1,338 137 59 120 123 899 : 316 439 || No Related Children Under 18 Years 1,852 45 28 28 82 1,669 : 101 183 || : || Female Householder, No Husband Present: 11,111 2,153 699 637 833 6,789 : 3,489 4,322 || With Related Children Under 18 Years: 6,805 1,869 577 502 636 3,221 : 2,948 3,584 || Under 5 Years Only 968 378 44 49 101 396 : 471 572 || Under 5 Years And 5 To 17 Years 948 455 116 132 38 207 : 703 741 || 5 To 17 Years Only 4,889 1,036 417 321 497 2,618 : 1,774 2,271 || No Related Children Under 18 Years 4,306 284 122 135 197 3,568 : 541 738 |------------------------------------------------------------------------------------------------------------------------------------------------------

2000 Census of Population and Housing - Summary File 3 Florida State Data Center Transportation Profile, Page 1------------------------------------------------------------------------------------------------------------------------------------------------------| State: FL Area Name: Sarasota County || County: 115 MCD/CCD: Place: . Tract: Block Group: |======================================================================================================================================================| P32 TRAVEL TIME TO WORK BY MEANS OF TRANSPORTATION TO WORK | P35 PRIVATE VEHICLE OCCUPANCY || Universe: Workers 16 years old and over who did not work at home | Universe: Workers 16 years old and over || | Pct. || Public Other | Total workers: 132,765 100.0 || Total Pct. Transp. Pct. Means Pct. | Car, truck, or van: 120,672 90.9 || Total out-of-home workers: 126,586 100.0 1,070 .8 125,516 99.2 | Drove alone 107,208 80.8 || Less than 30 min. 95,549 75.5 437 .3 95,112 75.1 | Carpooled: 13,464 10.1 || 30 to 44 min. 20,267 16.0 287 .2 19,980 15.8 | 2-person carpool 11,183 8.4 || 45 to 59 min. 4,925 3.9 127 .1 4,798 3.8 | 3-person carpool 1,622 1.2 || 60 or more min. 5,845 4.6 219 .2 5,626 4.4 | 4-person carpool 419 .3 || | 5- or 6-person carpool 183 .1 ||---------------------------------------------------------------------------------------------| 7-or-more-person carpool 57 .0 || P33 AGGREGATE TRAVEL TIME TO WORK BY MEANS OF TRANSPORTATION TO WORK | Other means (including || Universe: Workers 16 years old and over who did not work at home | worked at home) 12,093 9.1 || |------------------------------------------------------|| Public Other | P34 TIME LEAVING HOME TO GO TO WORK || Total Pct. Transp. Pct. Means Pct. | Universe: Workers 16 years old and over || Aggregate minutes: 2,757,965 100.0 39,765 1.4 2,718,195 98.6 | Pct. || Less than 30 min. 1,307,370 47.4 6,350 .2 1,301,015 47.2 | Total workers: 132,765 100.0 || 30 to 44 min. 642,955 23.3 9,000 .3 633,955 23.0 | Did not work at home: 126,586 95.3 || 45 to 59 min. 228,965 8.3 5,975 .2 222,990 8.1 | 12:00 a.m. to 4:59 a.m. 2,956 2.2 || 60 or more min. 578,675 21.0 18,440 .7 560,235 20.3 | 5:00 a.m. to 5:29 a.m. 2,347 1.8 || Mean travel time to work 22 minutes 37 minutes 22 minutes | 5:30 a.m. to 5:59 a.m. 3,468 2.6 ||---------------------------------------------------------------------------------------------| 6:00 a.m. to 6:29 a.m. 7,824 5.9 || P29 PLACE OF WORK - MINOR CIVIL DIVISION LEVEL (*) FOR 12 SELECTED STATES | 6:30 a.m. to 6:59 a.m. 11,806 8.9 || Universe: Workers 16 years old and over living in | 7:00 a.m. to 7:29 a.m. 17,912 13.5 || CT, MA, ME, MI, MN, NH, NJ, NY, PA, RI, VT, WI | 7:30 a.m. to 7:59 a.m. 22,508 17.0 || Pct. | 8:00 a.m. to 8:29 a.m. 18,745 14.1 || Total Workers: 132,765 100.0 | 8:30 a.m. to 8:59 a.m. 9,558 7.2 || Living in the 12 selected states: 0 .0 | 9:00 a.m. to 9:59 a.m. 9,777 7.4 || Worked in minor civil | 10:00 a.m. to 10:59 a.m. 3,903 2.9 || division of residence 0 .0 | 11:00 a.m. to 11:59 a.m. 1,547 1.2 || Worked outside minor civil | 12:00 p.m. to 3:59 p.m. 7,188 5.4 || division of residence 0 .0 | 4:00 p.m. to 11:59 p.m. 7,047 5.3 || Not living in the 12 selected states 132,765 100.0 | Worked at home 6,179 4.7 || (*) Cities, towns, etc. which are the principal subdivisions of counties in the 12 states | ||----------------------------------------------------------------------------------------------------------------------------------------------------|| P27 PLACE OF WORK - PLACE LEVEL | P26 PLACE OF WORK - STATE AND COUNTY LEVEL || Universe: Workers 16 years old and over | Universe: Workers 16 years old and over || | || Pct. | Pct. || Total workers: 132,765 100.0 | Total workers: 132,765 100.0 || Living in a place: 109,304 82.3 | Worked in state of residence: 131,035 98.7 || Worked in place of residence 25,185 19.0 | Worked in county of residence 113,691 85.6 || Worked outside place of residence 84,119 63.4 | Worked outside county of residence 17,344 13.1 || Not living in a place 23,461 17.7 | Worked outside state of residence 1,730 1.3 || | |------------------------------------------------------------------------------------------------------------------------------------------------------
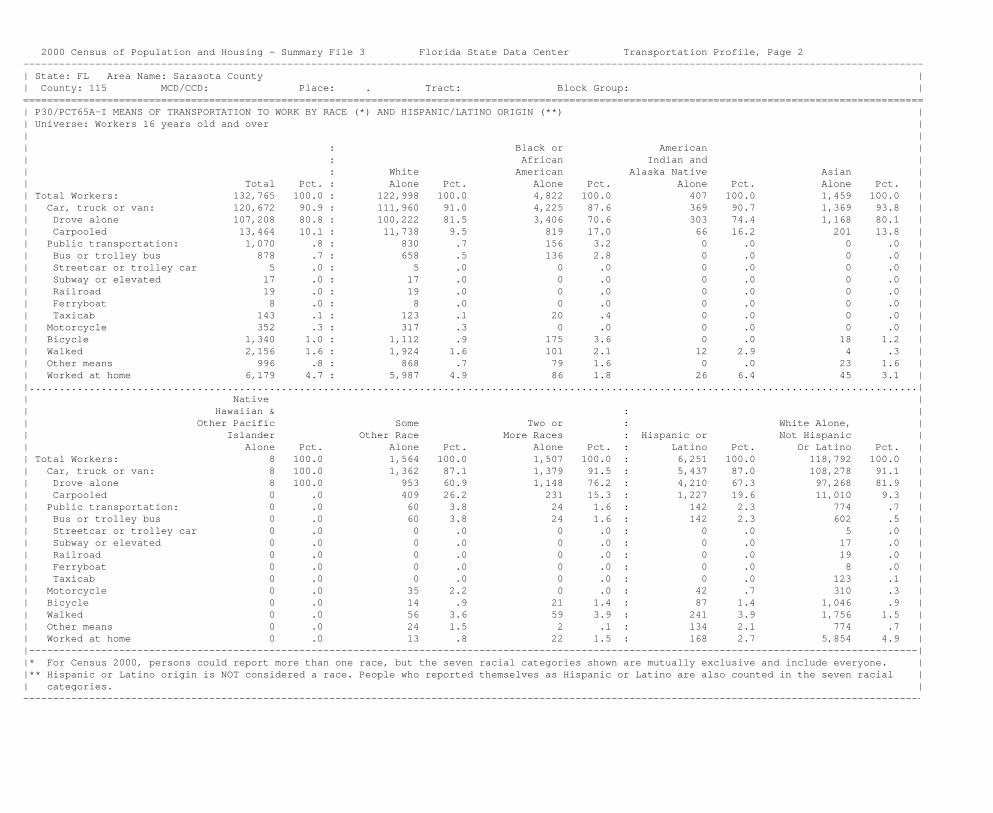
2000 Census of Population and Housing - Summary File 3 Florida State Data Center Transportation Profile, Page 2------------------------------------------------------------------------------------------------------------------------------------------------------| State: FL Area Name: Sarasota County || County: 115 MCD/CCD: Place: . Tract: Block Group: |======================================================================================================================================================| P30/PCT65A-I MEANS OF TRANSPORTATION TO WORK BY RACE (*) AND HISPANIC/LATINO ORIGIN (**) || Universe: Workers 16 years old and over || || : Black or American || : African Indian and || : White American Alaska Native Asian || Total Pct. : Alone Pct. Alone Pct. Alone Pct. Alone Pct. || Total Workers: 132,765 100.0 : 122,998 100.0 4,822 100.0 407 100.0 1,459 100.0 || Car, truck or van: 120,672 90.9 : 111,960 91.0 4,225 87.6 369 90.7 1,369 93.8 || Drove alone 107,208 80.8 : 100,222 81.5 3,406 70.6 303 74.4 1,168 80.1 || Carpooled 13,464 10.1 : 11,738 9.5 819 17.0 66 16.2 201 13.8 || Public transportation: 1,070 .8 : 830 .7 156 3.2 0 .0 0 .0 || Bus or trolley bus 878 .7 : 658 .5 136 2.8 0 .0 0 .0 || Streetcar or trolley car 5 .0 : 5 .0 0 .0 0 .0 0 .0 || Subway or elevated 17 .0 : 17 .0 0 .0 0 .0 0 .0 || Railroad 19 .0 : 19 .0 0 .0 0 .0 0 .0 || Ferryboat 8 .0 : 8 .0 0 .0 0 .0 0 .0 || Taxicab 143 .1 : 123 .1 20 .4 0 .0 0 .0 || Motorcycle 352 .3 : 317 .3 0 .0 0 .0 0 .0 || Bicycle 1,340 1.0 : 1,112 .9 175 3.6 0 .0 18 1.2 || Walked 2,156 1.6 : 1,924 1.6 101 2.1 12 2.9 4 .3 || Other means 996 .8 : 868 .7 79 1.6 0 .0 23 1.6 || Worked at home 6,179 4.7 : 5,987 4.9 86 1.8 26 6.4 45 3.1 ||....................................................................................................................................................|| Native || Hawaiian & : || Other Pacific Some Two or : White Alone, || Islander Other Race More Races : Hispanic or Not Hispanic || Alone Pct. Alone Pct. Alone Pct. : Latino Pct. Or Latino Pct. || Total Workers: 8 100.0 1,564 100.0 1,507 100.0 : 6,251 100.0 118,792 100.0 || Car, truck or van: 8 100.0 1,362 87.1 1,379 91.5 : 5,437 87.0 108,278 91.1 || Drove alone 8 100.0 953 60.9 1,148 76.2 : 4,210 67.3 97,268 81.9 || Carpooled 0 .0 409 26.2 231 15.3 : 1,227 19.6 11,010 9.3 || Public transportation: 0 .0 60 3.8 24 1.6 : 142 2.3 774 .7 || Bus or trolley bus 0 .0 60 3.8 24 1.6 : 142 2.3 602 .5 || Streetcar or trolley car 0 .0 0 .0 0 .0 : 0 .0 5 .0 || Subway or elevated 0 .0 0 .0 0 .0 : 0 .0 17 .0 || Railroad 0 .0 0 .0 0 .0 : 0 .0 19 .0 || Ferryboat 0 .0 0 .0 0 .0 : 0 .0 8 .0 || Taxicab 0 .0 0 .0 0 .0 : 0 .0 123 .1 || Motorcycle 0 .0 35 2.2 0 .0 : 42 .7 310 .3 || Bicycle 0 .0 14 .9 21 1.4 : 87 1.4 1,046 .9 || Walked 0 .0 56 3.6 59 3.9 : 241 3.9 1,756 1.5 || Other means 0 .0 24 1.5 2 .1 : 134 2.1 774 .7 || Worked at home 0 .0 13 .8 22 1.5 : 168 2.7 5,854 4.9 ||----------------------------------------------------------------------------------------------------------------------------------------------------||* For Census 2000, persons could report more than one race, but the seven racial categories shown are mutually exclusive and include everyone. ||** Hispanic or Latino origin is NOT considered a race. People who reported themselves as Hispanic or Latino are also counted in the seven racial || categories. |------------------------------------------------------------------------------------------------------------------------------------------------------

2000 Census of Population and Housing - Summary File 3 Florida State Data Center Housing Profile, Page 1------------------------------------------------------------------------------------------------------------------------------------------------------| State: FL Area Name: Sarasota County || County: 115 MCD/CCD: Place: . Tract: Block Group: |======================================================================================================================================================|H1/H2/H3/H4/H5/H6/H7/H8. HOUSING SUMMARY |H44/H46. VEHICLES AVAILABLE BY TENURE |H40/HCT10. HOUSE HEATING FUEL BY TENURE ||Universe: Housing Units |Universe: Occupied Housing Units |Universe: Occupied Housing Units || | | Occupied Owner Renter ||Total Housing Units 182,467 | Occupied Owner Renter | Units Occupied Occupied ||100% Count Housing Units 182,467 | Units Occupied Occupied | || | |Total Units: 149,937 118,538 31,399 ||Unweighted Sample |Total Units: 149,937 118,538 31,399 | Utility Gas 3,758 2,947 811 || Total Housing Units 21,770 | No Vehicle 8,975 4,473 4,502 | Bottled, Tank, LP Gas 2,389 1,928 461 || Occupied Housing Units 17,407 | 1 Vehicle 69,282 53,062 16,220 | Electricity 140,838 111,432 29,406 || Vacant Housing Units 4,363 | 2 Vehicles 56,989 48,271 8,718 | Fuel, Oil, Kero.,etc. 1,559 1,388 171 || | 3 Vehicles 11,540 10,122 1,418 | Coal or Coke 8 8 0 ||Percent of Units In Sample | 4 Vehicles 2,519 2,111 408 | Wood 174 129 45 || Total Housing Units 11.9% | 5+ Vehicles 632 499 133 | Solar Energy 15 15 0 || Occupied Housing Units 11.6% | | Other Fuel 61 54 7 || Vacant Housing Units 13.4% |Mean Vehicles | No Fuel Used 1,135 637 498 || |Available 1.55 1.61 1.29 | ||Total Housing Units: |-----------------------------------------------|----------------------------------------------------------|| Urban: 175,356 |H16/H17/H18. HOUSEHOLD SIZE BY TENURE |H34/H35/H36/H37. YEAR STRUCTURE BUILT BY TENURE || Inside Urbanized Areas 175,356 |Universe: Occupied Housing Units |Universe: Housing Units || Inside Urban Clusters 0 | | Occupied Housing Units || Rural: 7,111 |Household Occupied Owner Renter | Housing Owner Renter || Farm 138 | Size-- Units Occupied Occupied |Year Built-- Units Occupied Occupied || NonFarm 6,973 | | || |Total Units: 149,937 118,538 31,399 |Total Units: 182,467 118,538 31,399 ||Occupied Housing Units: 149,937 | 1 Person 45,622 32,959 12,663 | 1999 to March 2000 4,864 3,057 640 || Owner Occupied 118,538 | 2 Persons 68,641 58,820 9,821 | 1995 to 1998 14,137 10,097 1,889 || Renter Occupied 31,399 | 3 Persons 16,864 12,759 4,105 | 1990 to 1994 16,550 11,690 2,404 || | 4 Persons 11,877 9,115 2,762 | 1980 to 1989 47,896 32,418 6,820 ||Vacant Housing Units: 32,530 | 5 Persons 4,768 3,436 1,332 | 1970 to 1979 52,442 32,065 8,633 || For Rent 5,514 | 6 Persons 1,400 942 458 | 1960 to 1969 24,402 15,000 5,159 || For Sale Only 2,249 | 7+ Persons 765 507 258 | 1950 to 1959 14,993 9,964 3,566 || Rented/Sold, Not Occupied 1,257 | | 1940 to 1949 3,579 2,140 988 || For Seasonal, Recreational, |Mean | 1939 or earlier 3,604 2,107 1,300 || or Occasional Use 21,619 |Household Size 2.13 2.13 2.12 | || For Migrant Workers 0 | |Median Year Built 1979 1979 1975 || Other Vacant 1,891 | | ||----------------------------------------------------------------------------------------------------------------------------------------------------||H30/H31/H32. UNITS IN STRUCTURE BY TENURE/VACANCY STATUS |H33. POPULATION BY UNITS IN STRUCTURE BY TENURE ||Universe: Housing Units |Universe: Population in Occupied Housing Units || Vacant | ----------------- Persons ----------------- || Housing ----- Occupied Housing Units ----- : Housing | Per Owner Renter || Units Total Owner Renter : Units | Total Hhld Occupied Occupied || : | ||Total Units: 182,467 149,937 118,538 31,399 : 32,530 |Total Persons: 319,485 2.13 252,801 66,684 || 1, Detached 103,409 94,852 83,629 11,223 : 8,557 | 1, Detached 226,209 2.38 195,484 30,725 || 1, Attached 12,627 10,173 8,367 1,806 : 2,454 | 1, Attached 18,534 1.82 14,527 4,007 || 2 5,132 4,071 1,434 2,637 : 1,061 | 2 7,621 1.87 2,400 5,221 || 3 or 4 4,974 3,665 1,568 2,097 : 1,309 | 3 or 4 6,471 1.77 2,415 4,056 || 5 to 9 7,285 5,491 2,160 3,331 : 1,794 | 5 to 9 9,441 1.72 3,541 5,900 || 10 to 19 7,681 5,351 2,178 3,173 : 2,330 | 10 to 19 9,081 1.70 3,287 5,794 || 20 to 49 9,758 5,497 3,037 2,460 : 4,261 | 20 to 49 8,648 1.57 4,733 3,915 || 50 or more 11,195 6,795 3,274 3,521 : 4,400 | 50 or more 10,177 1.50 5,250 4,927 || Mobile Home 20,226 13,908 12,773 1,135 : 6,318 | Mobile Home 23,092 1.66 20,980 2,112 || Boat, RV, Van, etc. 180 134 118 16 : 46 | Boat,Van,RV,etc. 211 1.57 184 27 |------------------------------------------------------------------------------------------------------------------------------------------------------

2000 Census of Population and Housing - Summary File 3 Florida State Data Center Housing Profile, Page 2------------------------------------------------------------------------------------------------------------------------------------------------------| State: FL Area Name: Sarasota County || County: 115 MCD/CCD: Place: . Tract: Block Group: |======================================================================================================================================================|H23-H28/H41/H42. ROOMS AND BEDROOMS BY TENURE |H20. OCCUPANTS PER ROOM BY TENURE |H47/H48/H50/H51. PLUMBING AND KITCHEN ||Universe: Housing Units |Universe: Occupied Housing Units | FACILITIES BY TENURE || | |Universe: Housing Units || Housing ---- Occupied Housing Units ---- | Occupied Owner Renter | || Units Total Owner Renter | Units Occupied Occupied | Total -- Occupied Units -- || | | Housing Owner Renter ||Total: 182,467 149,937 118,538 31,399 |Total Units: 149,937 118,538 31,399 | Units Occupied Occupied || Rooms-- | 0.50 or less 120,564 100,038 20,526 | || 1 1,474 1,227 144 1,083 | 0.51 to 1.00 26,238 17,196 9,042 |Tot. Units: 182,467 118,538 31,399 || 2 5,958 4,805 1,410 3,395 | 1.01 to 1.50 1,865 878 987 |Complete || 3 14,020 10,895 5,106 5,789 | 1.51 to 2.00 950 339 611 |Facilities-- || 4 39,664 28,340 18,840 9,500 | 2.01 or more 320 87 233 | Plumbing 181,974 118,269 31,258 || 5 50,284 40,316 33,974 6,342 |------------------------------------------------| Kitchen 181,496 118,362 30,749 || 6 36,403 32,246 29,045 3,201 |H38/H39. YEAR HOUSEHOLDER MOVED INTO UNIT |Lacking Complete || 7 19,407 17,800 16,458 1,342 |Universe: Occupied Housing Units |Facilities-- || 8 9,256 8,637 8,153 484 | | Plumbing 493 269 141 || 9+ 6,001 5,671 5,408 263 |Year Moved Occupied Owner Renter | Kitchen 971 176 650 || Rooms per Unit-- |Into Unit Units Occupied Occupied | || Median 5.1 5.2 5.5 4.1 | |---------------------------------------------|| Mean 5.2 5.4 5.7 4.1 |Total Units: 149,937 118,538 31,399 |H43. TELEPHONE SERVICE AVAILABLE BY TENURE || | 1999-Mar 00 28,824 14,927 13,897 |Universe: Occupied Housing Units || Bedrooms-- | 1995-98 45,758 34,070 11,688 | || None 2,068 1,778 386 1,392 | 1990-94 27,979 24,798 3,181 | Occupied Renter || 1 17,420 13,181 4,778 8,403 | 1980-89 30,745 28,837 1,908 | Units Occupied || 2 89,945 68,149 53,170 14,979 | 1970-79 12,000 11,423 577 | || 3 60,715 55,310 49,507 5,803 | Before 1970 4,631 4,483 148 |Total Units: 149,937 31,399 || 4 10,809 10,137 9,474 663 | | With Telephone 148,081 30,038 || 5+ 1,510 1,382 1,223 159 |Median Year 1995 1993 1998 | No Telephone 1,856 1,361 ||----------------------------------------------------------------------------------------------------------------------------------------------------||H90/H91/H92/H98. MORTGAGE STATUS AND SELECTED MONTHLY OWNER COSTS |HCT19/HCT20/HCT21 REAL ESTATE TAXES|H94/H95. MORTGAGE STATUS BY SELECTED MONTHLY ||Two Universes: All/Specified Owner-Occupied Housing Units |Universe: Specified Owner- | OWNER COSTS AS A PERCENTAGE OF || | Occupied Housing Units | HOUSEHOLD INCOME IN 1999 || Total : --- Specified Owner Occupied --- | |Universe: Specified Owner-Occupied || Owner : With A Without A |Spec. Owner-Occ. Units: 89,216 | Housing Units ||Monthly Costs-- Occupied : Total Mortgage Mortgage | Less than $200 1,026 | || : | $200 to $299 537 |Percentage With A Without A ||Total Units: 118,538 : 89,216 55,906 33,310 | $300 to $399 1,229 |of HH Income-- Total Mortgage Mortgage || Less than $200 6,350 : 3,599 8 3,591 | $400 to $599 4,188 | || $200 to $299 13,046 : 9,310 192 9,118 | $600 to $799 7,744 |Total Units: 89,216 55,906 33,310 || $300 to $399 13,198 : 9,082 792 8,290 | $800 to $999 11,076 | Under 10.0% 19,168 3,667 15,501 || $400 to $499 10,342 : 6,642 1,809 4,833 | $1,000 to $1,499 24,721 | 10.0-14.9% 14,763 7,681 7,082 || $500 to $599 8,793 : 5,874 3,145 2,729 | $1,500 to $1,999 14,580 | 15.0-19.9% 13,769 10,075 3,694 || $600 to $699 8,675 : 6,197 4,682 1,515 | $2,000 to $2,999 12,317 | 20.0-24.9% 11,460 9,241 2,219 || $700 to $799 9,164 : 7,170 6,219 951 | $3,000 to $3,999 5,427 | 25.0-29.9% 7,642 6,556 1,086 || $800 to $899 8,325 : 6,899 6,214 685 | $4,000 to $4,999 2,430 | 30.0-34.9% 5,442 4,540 902 || $900 to $999 7,223 : 6,228 5,798 430 | $5,000 to $7,499 2,323 | 35.0-39.9% 3,531 3,121 410 || $1,000 or More 33,422 : 28,215 27,047 1,168 | $7,500 to $9,999 771 | 40.0-49.9% 4,542 3,915 627 || $1,000 to $1,249 N/A : N/A 9,885 N/A | $10,000 or More 787 | 50.0%+ 8,229 6,885 1,344 || $1,250 to $1,499 N/A : N/A 6,021 N/A | No taxes paid 60 | Not || $1,500 to $1,999 N/A : N/A 5,655 N/A | | Computed 670 225 445 || $2,000 to $2,499 N/A : N/A 2,559 N/A |Median Real Estate Taxes $1,380 | || $2,500 to $2,999 N/A : N/A 1,081 N/A |Mean Real Estate Taxes $1,809 |Median Costs || $3,000 or More N/A : N/A 1,846 N/A | |As a Percentage || : | |of HH Income 18.8 23.5 10.7 ||Median Monthly Costs : N/A $984 $344 | | ||Mean Monthly Costs : $906 $1,202 $410 | | |------------------------------------------------------------------------------------------------------------------------------------------------------
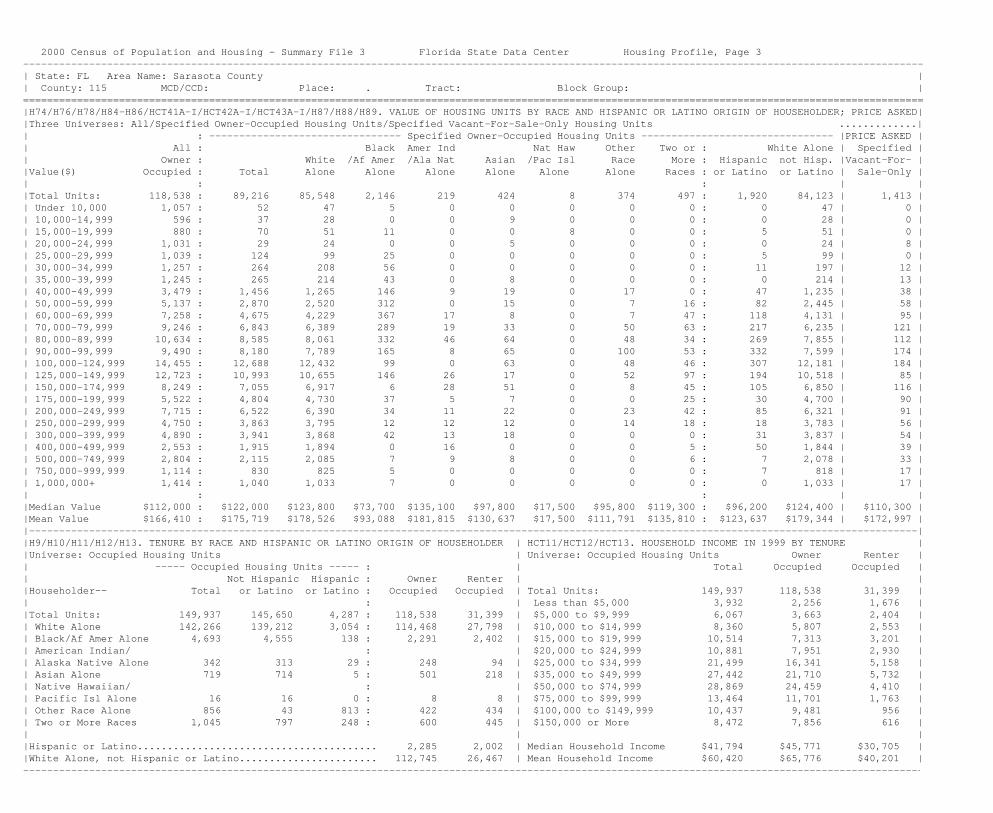
2000 Census of Population and Housing - Summary File 3 Florida State Data Center Housing Profile, Page 3------------------------------------------------------------------------------------------------------------------------------------------------------| State: FL Area Name: Sarasota County || County: 115 MCD/CCD: Place: . Tract: Block Group: |======================================================================================================================================================|H74/H76/H78/H84-H86/HCT41A-I/HCT42A-I/HCT43A-I/H87/H88/H89. VALUE OF HOUSING UNITS BY RACE AND HISPANIC OR LATINO ORIGIN OF HOUSEHOLDER; PRICE ASKED||Three Universes: All/Specified Owner-Occupied Housing Units/Specified Vacant-For-Sale-Only Housing Units .............|| : -------------------------------- Specified Owner-Occupied Housing Units -------------------------------- |PRICE ASKED || All : Black Amer Ind Nat Haw Other Two or : White Alone | Specified || Owner : White /Af Amer /Ala Nat Asian /Pac Isl Race More : Hispanic not Hisp. |Vacant-For- ||Value($) Occupied : Total Alone Alone Alone Alone Alone Alone Races : or Latino or Latino | Sale-Only || : : | ||Total Units: 118,538 : 89,216 85,548 2,146 219 424 8 374 497 : 1,920 84,123 | 1,413 || Under 10,000 1,057 : 52 47 5 0 0 0 0 0 : 0 47 | 0 || 10,000-14,999 596 : 37 28 0 0 9 0 0 0 : 0 28 | 0 || 15,000-19,999 880 : 70 51 11 0 0 8 0 0 : 5 51 | 0 || 20,000-24,999 1,031 : 29 24 0 0 5 0 0 0 : 0 24 | 8 || 25,000-29,999 1,039 : 124 99 25 0 0 0 0 0 : 5 99 | 0 || 30,000-34,999 1,257 : 264 208 56 0 0 0 0 0 : 11 197 | 12 || 35,000-39,999 1,245 : 265 214 43 0 8 0 0 0 : 0 214 | 13 || 40,000-49,999 3,479 : 1,456 1,265 146 9 19 0 17 0 : 47 1,235 | 38 || 50,000-59,999 5,137 : 2,870 2,520 312 0 15 0 7 16 : 82 2,445 | 58 || 60,000-69,999 7,258 : 4,675 4,229 367 17 8 0 7 47 : 118 4,131 | 95 || 70,000-79,999 9,246 : 6,843 6,389 289 19 33 0 50 63 : 217 6,235 | 121 || 80,000-89,999 10,634 : 8,585 8,061 332 46 64 0 48 34 : 269 7,855 | 112 || 90,000-99,999 9,490 : 8,180 7,789 165 8 65 0 100 53 : 332 7,599 | 174 || 100,000-124,999 14,455 : 12,688 12,432 99 0 63 0 48 46 : 307 12,181 | 184 || 125,000-149,999 12,723 : 10,993 10,655 146 26 17 0 52 97 : 194 10,518 | 85 || 150,000-174,999 8,249 : 7,055 6,917 6 28 51 0 8 45 : 105 6,850 | 116 || 175,000-199,999 5,522 : 4,804 4,730 37 5 7 0 0 25 : 30 4,700 | 90 || 200,000-249,999 7,715 : 6,522 6,390 34 11 22 0 23 42 : 85 6,321 | 91 || 250,000-299,999 4,750 : 3,863 3,795 12 12 12 0 14 18 : 18 3,783 | 56 || 300,000-399,999 4,890 : 3,941 3,868 42 13 18 0 0 0 : 31 3,837 | 54 || 400,000-499,999 2,553 : 1,915 1,894 0 16 0 0 0 5 : 50 1,844 | 39 || 500,000-749,999 2,804 : 2,115 2,085 7 9 8 0 0 6 : 7 2,078 | 33 || 750,000-999,999 1,114 : 830 825 5 0 0 0 0 0 : 7 818 | 17 || 1,000,000+ 1,414 : 1,040 1,033 7 0 0 0 0 0 : 0 1,033 | 17 || : : | ||Median Value $112,000 : $122,000 $123,800 $73,700 $135,100 $97,800 $17,500 $95,800 $119,300 : $96,200 $124,400 | $110,300 ||Mean Value $166,410 : $175,719 $178,526 $93,088 $181,815 $130,637 $17,500 $111,791 $135,810 : $123,637 $179,344 | $172,997 ||----------------------------------------------------------------------------------------------------------------------------------------------------||H9/H10/H11/H12/H13. TENURE BY RACE AND HISPANIC OR LATINO ORIGIN OF HOUSEHOLDER | HCT11/HCT12/HCT13. HOUSEHOLD INCOME IN 1999 BY TENURE ||Universe: Occupied Housing Units | Universe: Occupied Housing Units Owner Renter || ----- Occupied Housing Units ----- : | Total Occupied Occupied || Not Hispanic Hispanic : Owner Renter | ||Householder-- Total or Latino or Latino : Occupied Occupied | Total Units: 149,937 118,538 31,399 || : | Less than $5,000 3,932 2,256 1,676 ||Total Units: 149,937 145,650 4,287 : 118,538 31,399 | $5,000 to $9,999 6,067 3,663 2,404 || White Alone 142,266 139,212 3,054 : 114,468 27,798 | $10,000 to $14,999 8,360 5,807 2,553 || Black/Af Amer Alone 4,693 4,555 138 : 2,291 2,402 | $15,000 to $19,999 10,514 7,313 3,201 || American Indian/ : | $20,000 to $24,999 10,881 7,951 2,930 || Alaska Native Alone 342 313 29 : 248 94 | $25,000 to $34,999 21,499 16,341 5,158 || Asian Alone 719 714 5 : 501 218 | $35,000 to $49,999 27,442 21,710 5,732 || Native Hawaiian/ : | $50,000 to $74,999 28,869 24,459 4,410 || Pacific Isl Alone 16 16 0 : 8 8 | $75,000 to $99,999 13,464 11,701 1,763 || Other Race Alone 856 43 813 : 422 434 | $100,000 to $149,999 10,437 9,481 956 || Two or More Races 1,045 797 248 : 600 445 | $150,000 or More 8,472 7,856 616 || | ||Hispanic or Latino........................................ 2,285 2,002 | Median Household Income $41,794 $45,771 $30,705 ||White Alone, not Hispanic or Latino....................... 112,745 26,467 | Mean Household Income $60,420 $65,776 $40,201 |------------------------------------------------------------------------------------------------------------------------------------------------------

2000 Census of Population and Housing - Summary File 3 Florida State Data Center Housing Profile, Page 4------------------------------------------------------------------------------------------------------------------------------------------------------| State: FL Area Name: Sarasota County || County: 115 MCD/CCD: Place: . Tract: Block Group: |======================================================================================================================================================|H68. INCLUSION OF UTILITIES IN RENT |H62/H65. MEAN GROSS RENT BY MEALS |H67. BEDROOMS BY GROSS RENT ||Universe: Specified Renter-Occupied | INCLUDED IN RENT |Universe: Specified Renter-Occupied Housing Units || Housing Units |Universe: Specified Renter-Occupied | || | Housing Units Paying Cash Rent| ----------------- Bedrooms ---------------- ||Total Units: 31,306 | | Total None 1 2 3 or More || Pay Extra for One or |Total Units: $791 | || More Utilities 26,306 | Meals Included $1,595 |Total Units: 31,306 1,382 8,395 14,949 6,580 || No Extra Payment 5,000 | Meals Not Included $742 | With Cash Rent: 29,600 1,353 8,136 14,101 6,010 ||---------------------------------------------------------------------------| Less than 200 760 65 467 203 25 ||H69/H70. GROSS RENT AS A PERCENTAGE OF HOUSEHOLD INCOME IN 1999 | $200 to $299 661 96 291 188 86 ||Universe: Specified Renter-Occupied Housing Units | $300 to $499 3,606 402 1,645 1,208 351 || | $500 to $749 11,740 460 3,753 6,089 1,438 ||Total Units: 31,306 | $750 to $999 7,544 92 1,081 4,456 1,915 || Less than 10.0 Percent 1,526 30.0 to 34.9 Percent 2,648 | $1,000 or More 5,289 238 899 1,957 2,195 || 10.0 to 14.9 Percent 2,961 35.0 to 39.9 Percent 1,698 | No Cash Rent 1,706 29 259 848 570 || 15.0 to 19.9 Percent 4,177 40.0 to 49.9 Percent 2,563 | || 20.0 to 24.9 Percent 4,061 50.0 Percent or More 5,981 | || 25.0 to 29.9 Percent 3,332 Not Computed 2,359 | ||Median Percentage of 1999 Household Income Spent on Gross Rent 27.6% | ||----------------------------------------------------------------------------------------------------------------------------------------------------||H54/H56/H58-H64/HCT36A-I/HCT37A-I/HCT38A-I. CONTRACT RENT; GROSS RENT BY RACE AND HISPANIC OR LATINO ORIGIN OF HOUSEHOLDER; RENT ASKED ||Two Universes: Specified Renter-Occupied and Specified Vacant-For-Rent Housing Units || .............|| : ------------------------- Gross Rent For Specified Renter Occupied Housing Units --------------------------| RENT ASKED || Contract : Gross Black Amer Ind Nat Haw Other Two or : White Alone | Specified || Rent : Rent White /Af Amer /Ala Nat Asian /Pac Isl Race More : Hispanic not Hisp. | Vacant- || Total : Total Alone Alone Alone Alone Alone Alone Races : or Latino or Latino | For-Rent || : : | ||Total Units: 31,306 : 31,306 27,710 2,397 94 218 8 434 445 : 1,992 26,389 | 5,496 || Cash Rent: 29,600 : 29,600 26,080 2,335 94 204 8 434 445 : 1,940 24,811 | || Under $100 327 : 173 63 93 0 0 0 5 12 : 14 54 | 31 || $100-$149 528 : 341 208 133 0 0 0 0 0 : 7 201 | 6 || $150-$199 260 : 246 193 49 0 0 0 0 4 : 19 179 | 29 || $200-$249 417 : 377 272 91 9 0 0 0 5 : 15 267 | 37 || $250-$299 539 : 284 158 115 0 0 0 11 0 : 29 146 | 112 || $300-$349 742 : 485 357 100 6 5 8 0 9 : 23 343 | 77 || $350-$399 1,061 : 816 671 112 9 0 0 3 21 : 78 602 | 211 || $400-$449 1,727 : 1,021 843 141 0 0 0 10 27 : 50 811 | 185 || $450-$499 2,177 : 1,284 1,078 164 7 0 0 25 10 : 117 1,007 | 313 || $500-$549 2,928 : 2,058 1,700 220 4 39 0 61 34 : 204 1,579 | 293 || $550-$599 2,677 : 2,210 1,870 162 18 36 0 92 32 : 301 1,687 | 264 || $600-$649 2,747 : 2,380 2,100 197 7 25 0 33 18 : 210 1,928 | 359 || $650-$699 2,868 : 2,543 2,229 234 16 12 0 44 8 : 202 2,100 | 300 || $700-$749 1,985 : 2,549 2,269 119 8 16 0 68 69 : 159 2,178 | 310 || $750-$799 1,731 : 2,160 1,989 111 0 10 0 11 39 : 106 1,912 | 276 || $800-$899 2,104 : 3,126 2,950 100 10 7 0 30 29 : 141 2,843 | 334 || $900-$999 1,373 : 2,258 2,043 118 0 26 0 14 57 : 105 1,983 | 244 || $1,000-$1,249 1,233 : 2,625 2,466 55 0 28 0 22 54 : 119 2,395 | 323 || $1,250-$1,499 743 : 996 964 21 0 0 0 5 6 : 5 964 | 194 || $1,500-$1,999 526 : 730 719 0 0 0 0 0 11 : 26 704 | 199 || $2,000+ 907 : 938 938 0 0 0 0 0 0 : 10 928 | 1,399 || No Cash Rent 1,706 : 1,706 1,630 62 0 14 0 0 0 : 52 1,578 | || | ||Median Rent $626 : $711 $729 $539 $583 $644 $325 $615 $731 : $627 $734 | $790 ||Mean Rent $695 : $791 $820 $527 $551 $708 $338 $646 $731 : $663 $828 | $1,305 |------------------------------------------------------------------------------------------------------------------------------------------------------