Embed Size (px)
Citation preview

2000 Census of Population and
Housing
NAGA CITY
S o u r c e : N a t i o n a l S t a t i s t i c s O f f i c e

2000 CENSUS OF POPULATION AND HOUSING www.naga.gov.ph
Census of Population and Housing
The Census of Population and Housing takes an inventory of the total population and housing units in the Philippines and gathers information about their characteristics.
1570-1800s During these periods, population count was determined largely by estimates rather than actual counts. The earliest estimate which placed the population at half a million was made by Dr. D. P. Barrows, Chief of the Bureau of Non-Christian Tribes. This was for the year 1570, at about the time of the conquest of the islands by Legaspi.
In 1591, the population was estimated at 667,612 based on the number of tributes comprising an encomienda. About 166,903 tributes were counted, each representing four persons on the average. This was the only estimate based upon encomiendas as the system ceased in 1600.
Later, population estimates depended on church records since people were distributed by parish among religious orders. With records of baptisms, marriages and burials as the source, only the Christian population was counted. In 1799, Father Manuel Buzeta estimated the Christian population at 1,502,574.
1878 The first official census in the Philippines was carried out by the Spanish government pursuant to a royal decree calling for the counting of persons living as of the midnight of December 31, 1877. The census yielded a population count of 5,567,685.
1888 and 1898 Two more censuses, similar to that undertaken in 1878, followed by orders of separate royal decrees. The population for 1887 was counted at 5,984,727.In 1898, the population, as published in the Guia Official, was placed at 5,279,955. The census operation during that year was abandoned when war erupted between the Spaniards and the Americans.
1903 The census was conducted on March 2, exactly a year after the establishment of the civil government. This was conducted to fulfill Act 467 which was approved by the U.S. Congress in July 1902. The census covered the whole Philippine Islands and the actual gathering of data took about two months. The population was counted at 7,635,426.
1918 This was the first census in the Philippines undertaken by an all-Filipino crew from the directorship down to the lowest level. By proclamation of the Governor-General, Census Day was scheduled on December 31, 1918. The population was counted at 10,314,310.
1939 This census was undertaken in conformity with Section 1 of C. A. 170. It was the first taken under the Commonwealth government with Census day on January 1. The Philippine population figure was 16,000,303.
1948 With the war just ended, a census was needed to plan for the reconstruction and rehabilitation of the country. The first census under the Republic of the Philippines was authorized by Republic Act No. 36, popularly known as the Census Act of 1946. Census day was on October 1, 1948. The population was counted at 19,234,182.
1960 The census for this year combined population and housing, the first of its kind to be undertaken. Conducted simultaneously with the census of population, the housing census included questions on housing conditions, area of farms operated, and the number of livestock and poultry raised. This provided the sampling frame for the agriculture census. The population counted was 27,087,685.
1970 Executive Order No. 149 designated Sunday, February 15, 1970, as Census Day. But this had to be reset to May 6 because of budgetary constraints. It was compensated, however, with a wider and more vigorous participation from government agencies and their instrumentalities. The total population was 36,684,486.
C i t y P l a n n i n g a n d D e v e l o p m e n t O f f i c e ii
2000 CENSUS OF POPULATION AND HOUSING www.naga.gov.ph
1975 The first mid-decade population census was undertaken in May of this year, almost three years after Martial Law was declared on September 21, 1972. The census, aptly referred to as the Integrated Census of Population and Its Economic Activities, was sanctioned by Presidential Decree No. 650. The Philippine population was registered at 42,070,660.
1980 The Census of Population for this period, together with the Census of Housing, commenced on May 1.
It was during this census year when Parliamentary Bill No. 809, filed in February 1980, proposed "to hold the census every 10 years beginning in 1980 without prejudice to the undertaking of special censuses on agriculture, industry, commerce, housing and other sectors as may be approved by the National Economic and Development Authority." The said bill was enacted as Batas Pambansa Bilang 72 one month after the 1980 census enumeration ended.
Proclamation No. 2170 declared as official the 1980 population count conducted by the National Census and Statistics Office. The population was counted at 48,098,460.
1990 The Census of Population and Housing (CPH) for this period was conducted in May 1990. For the first time, a Census logo and slogan contest was launched nationwide. The winning slogan was "Sensong Pambayan, Sandigan ng Kaunlaran".
Pursuant to the provision of Batas Pambansa Bilang 72, a final report on the total population, total household population, and number of households at the barangay level was approved by the President under Proclamation No. 688 dated February 12, 1991. The population reported was 60,703,206.
1990 CPH Logo 1995 More popularly known as the POPCEN, the 1995 Census of Population was undertaken in the month of September. The data gathered
provided an updated basis for the apportionment of the Internal Revenue Allocation to local government units and for the creation of new legislative areas such as regions, provinces, municipalities and barangays.
Again, pursuant to Batas Pambansa Bilang 72, the population count and the number of households at the barangay level were declared official by the President under Proclamation No. 849 dated August 14, 1996. The total population was recorded at 68,616,536.
2000 The 2000 Census of Population and Housing or Census 2000 was conducted in May 2000. This is the 11th census of population conducted in the country since 1903, and the 5th census of housing conducted in the country since 1960. The data gathered will provide government planners, policy makers and administrators with data on which to base their social and economic development plans and program. The data gathered will also provide updated data on the size of the population that will serve as basis for the apportionment of congressional seats for the legislative branch; creation of new local government units, i.e., provinces, cities, municipalities and barangays; and conversion of a unit such as a municipality into a city.
Pursuant to Batas Pambansa Blg. 72, the results of Census 2000, i.e., the population count and the number of household were proclaimed and declared official by the President of the Philippine under Proclamation No. 28 dated April 18, 2001. The Philippines population as of May 1, 2000 was recorded at 76,498,735 persons.
Source: 1995 and prior years: NSO, "Discovering Facts and Figures from the 2000: NSO, Highlights of 2000 Census - Final Count
C i t y P l a n n i n g a n d D e v e l o p m e n t O f f i c e iii
2000 CENSUS OF POPULATION AND HOUSING www.naga.gov.ph
C O N T E N T S
A. HIGHLIGHTS 1B. DEMOGRAPHIC STATISTICS 8
1 Population Enumerated in Various Census Years: 1903 - 2000 92 Total Population by Age, Group, Sex 93 Household Population by Age, Group, Sex 94 Total Population, Household Population and Number of Households 105 Population, Number of Household, Area, Density and Average Family Size by Barangay 116 Projected Population for 2001-2010 by Barangay 127 Total Population 10 Years Old and Over by Age Group, Sex and Marital Status 138 Household Population 10 Years Old and Over by Age Group, Sex and Marital Status 149 Household Population by Religious Affiliation and Sex 15
10 Household Population 5 Years Old and Over by Highest Educational Attainment, Sex and Age Group
16
11 Household Population by Ethnicity and Sex 1812 Household Population 5 Years Old and Over by Sex and Place of Residence 5 Years Ago 1913 Number of Households by Age Group, Sex of Household Head and Household Size 1914 Households by type of Fuel Used for Lighting 2015 Households by Main Source of Water Supply for Drinking and/or Cooking 2016 Households by Main Source of Water Supply for laundry and/or Bathing 2017 Households by Kind of Fuel Used for Cooking 2018 Households by Kind of Toilet Facility Being Used 2019 Households by Usual Manner of Garbage Disposal 2120 Households Reporting Presence of Household Conveniences 2121 Households Reporting Land Ownership 21
22 Household Population 5 Years Old and Over Who Were Attending School at Anytime from June 1999 to March 2000 by Sex, City of Present Residence and Place of School
21
23 Literacy of Household Population 10 Years Old and Over by Age Group and Sex 2224 Ever-Married Women 15 to 49 Years Old by Number of Children Ever Born and Age Group 2325 Ever-Married Women 15 to 49 Years Old by Age at First Marriage and Age Group 23
C. HOUSING STATISTICS 2426 Occupied Housing Units: 1960, 1970, 1980, 1990 and 2000 25
27 Occupied Housing Units, Households, Household Population and Ratio of Households and Household Population to Occupied Housing Unit by Type of Building
25
28 Occupied Housing Units by Construction Materials of the Outer Walls and Roof 2529 Occupied Housing Units by Condition (State of Repair) of the Building and Year Built 2630 Occupied Housing Units by Type of Building, Number of Households in Each Housing Unit 2631 Occupied Housing Units by Floor Area and Number of Occupants in Each Housing Unit 2732 Households by Type of Building, Tenure Status of the Lot 2733 Households in Occupied Housing Units by Tenure Status of the Housing Unit 2834 Owner-Households in Occupied Housing Units by Mode of Acquisition of Housing Unit 28
35 Owner-Households that Purchased/Constructed their Housing Units by Reported Source of Financing
28
36 Renter-Households in Occupied Housing Units by Monthly rental of Housing Units 28
C i t y P l a n n i n g a n d D e v e l o p m e n t O f f i c e iv
2000 CENSUS OF POPULATION AND HOUSING – HIGHLIGHTS www.naga.gov.ph
HIGHLIGHTS
C i t y P l a n n i n g a n d D e v e l o p m e n t O f f i c e 1
2000 CENSUS OF POPULATION AND HOUSING – HIGHLIGHTS www.naga.gov.ph
POPULATION CHARACTERISTICS Population growth rate decreased to 1.65 percent (see Tables 1 and 4) The total population of Naga City as of May 1, 2000 was 137,810 persons, higher by 10,838 persons over the 1995 Census of Population results. This translated to an average annual population growth rate of 1.65%, 0.29 percentage point lower than that of the 1990 to 1995 period. If the said rate continues over the years, the population is expected to double in 42 years.
Among the 27 barangays of the city, Concepcion Pequeña registered the largest population at 16,818 persons followed by Concepcion Grande with 8,524 persons. Dinaga had the smallest population at 467 persons. More females than males (see Table 2)
Females outnumbered males with sex ratio of 102.54 females for every 100 males. There were more females reported among 54 years old and below while more males in the older ages.
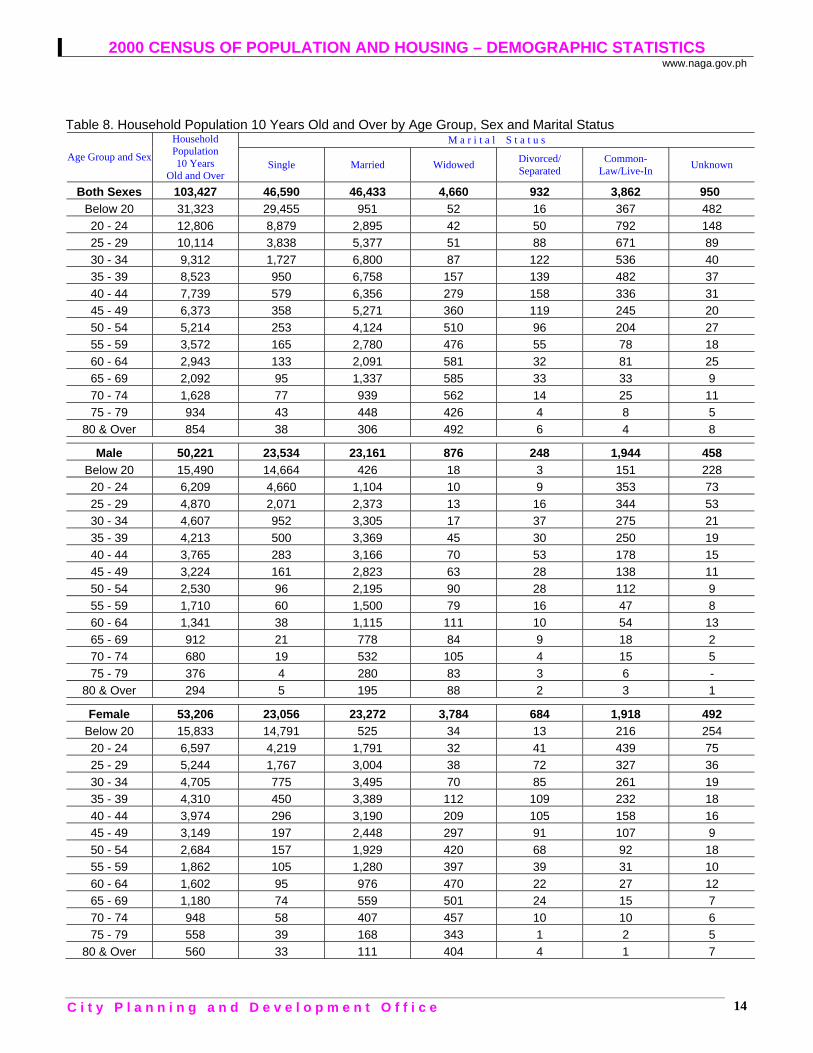
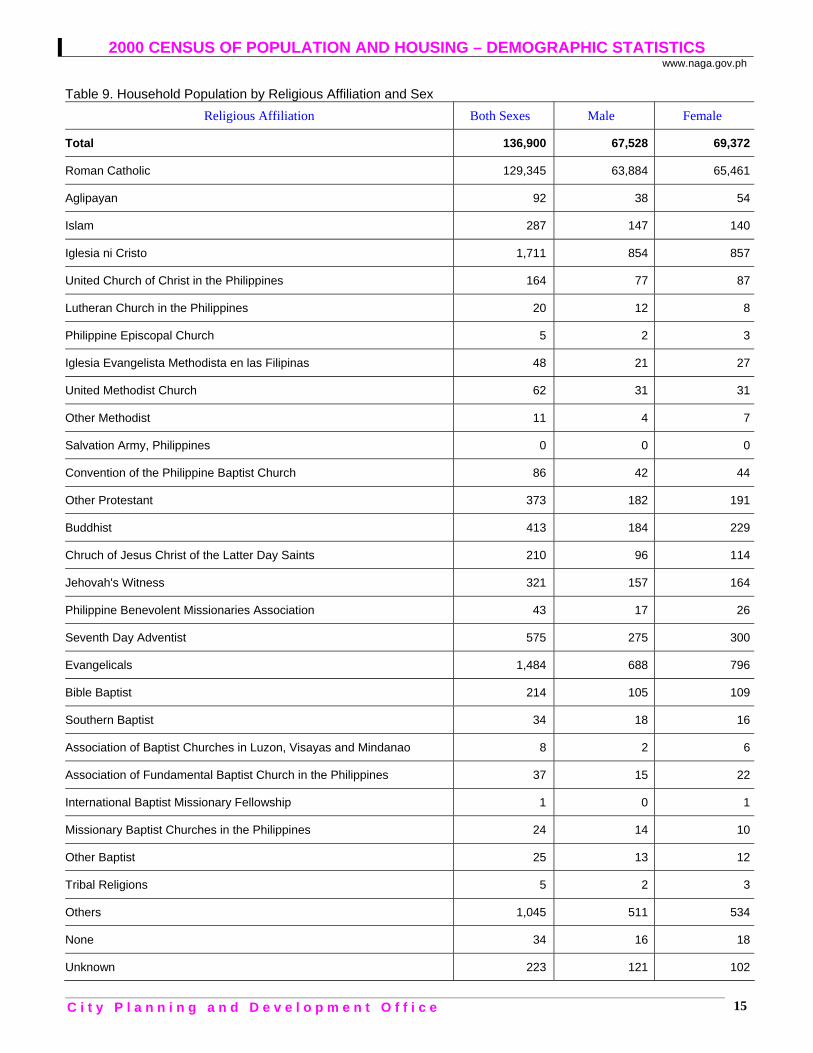
In 2000, the age groups 5 to 9 years and 0 to 4 years had the largest population constituting 23.34 percent of the total population, followed by the age group 10 to 14 years and 15 to 19 years (11.49 percent and 11. 36 percent, respectively). Average household size is 5.24 persons (see Table 5) An increase in the number of households was observed, from 23,632 households in 1995 to 26,317 households in 2000. However, a slight decrease in the average household size was recorded from 5.37 persons in 1995 to 5.24 persons in 2000. More single men than women (see Table 8) Of the 103,427 household population aged 10 years and over, 45.04 percent were single, followed by married individuals (41.99 percent). The proportion of widowed, divorced/separated, and those with other marital arrangements made up 4.51 percent, 0.90 percent, and 4.65 percent, respectively. There was a higher proportion of males among single (50.51 percent). Females, on the other hand dominated the married (50.12 percent), widowed (81.20 percent), divorced/separated (73.39 percent), and those with other marital arrangements (50.08 percent) Almost all of the household population in Naga City were Roman Catholics (see Table 9) Roman Catholic was the dominant religious affiliation in Naga City comprising 94.48 percent of the household population. Other religions were Iglesia ni Cristo (1.25 percent), Evangelical (1.08 percent), Seventh Day Adventist (0.42 percent), Buddhist (0.30 percent), and other religions (0.95 percent).
C i t y P l a n n i n g a n d D e v e l o p m e n t O f f i c e 2
2000 CENSUS OF POPULATION AND HOUSING – HIGHLIGHTS www.naga.gov.ph
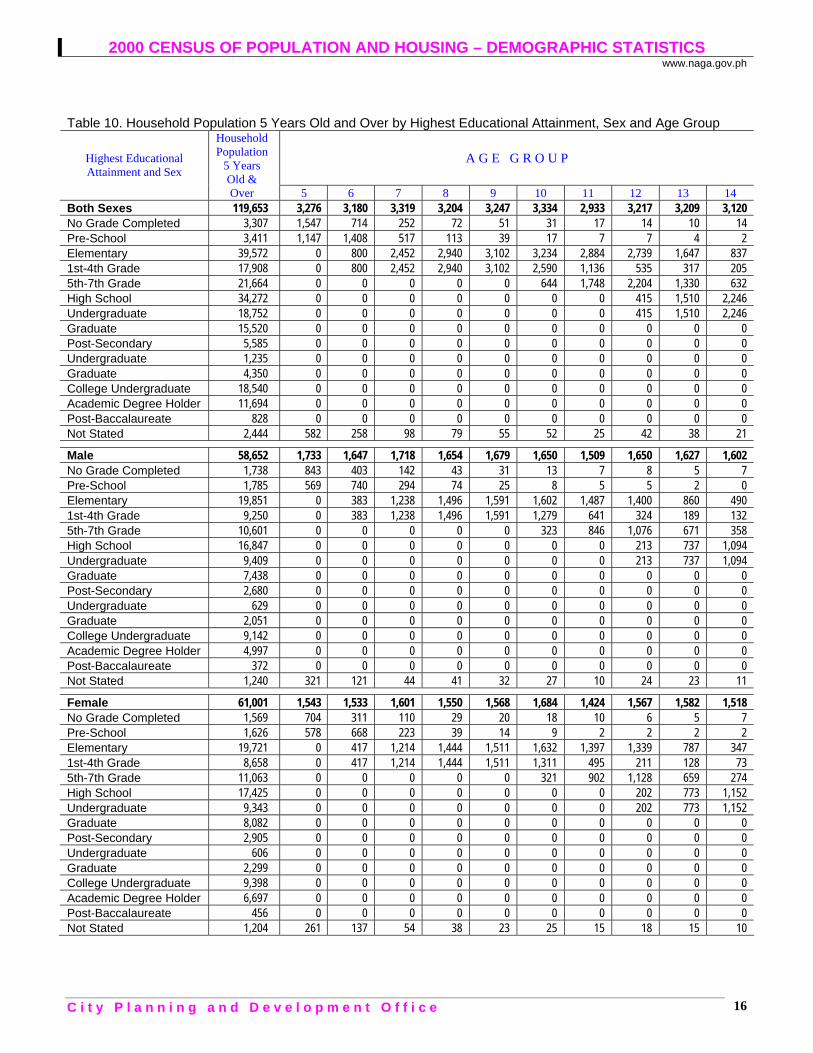
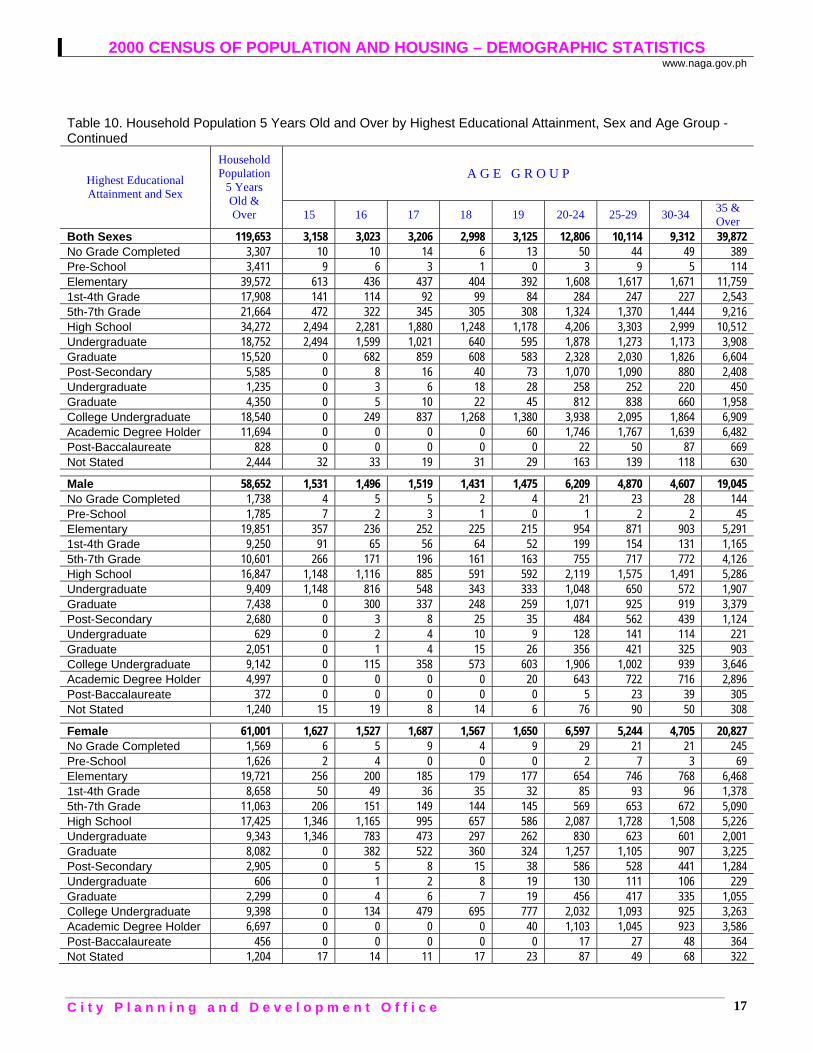
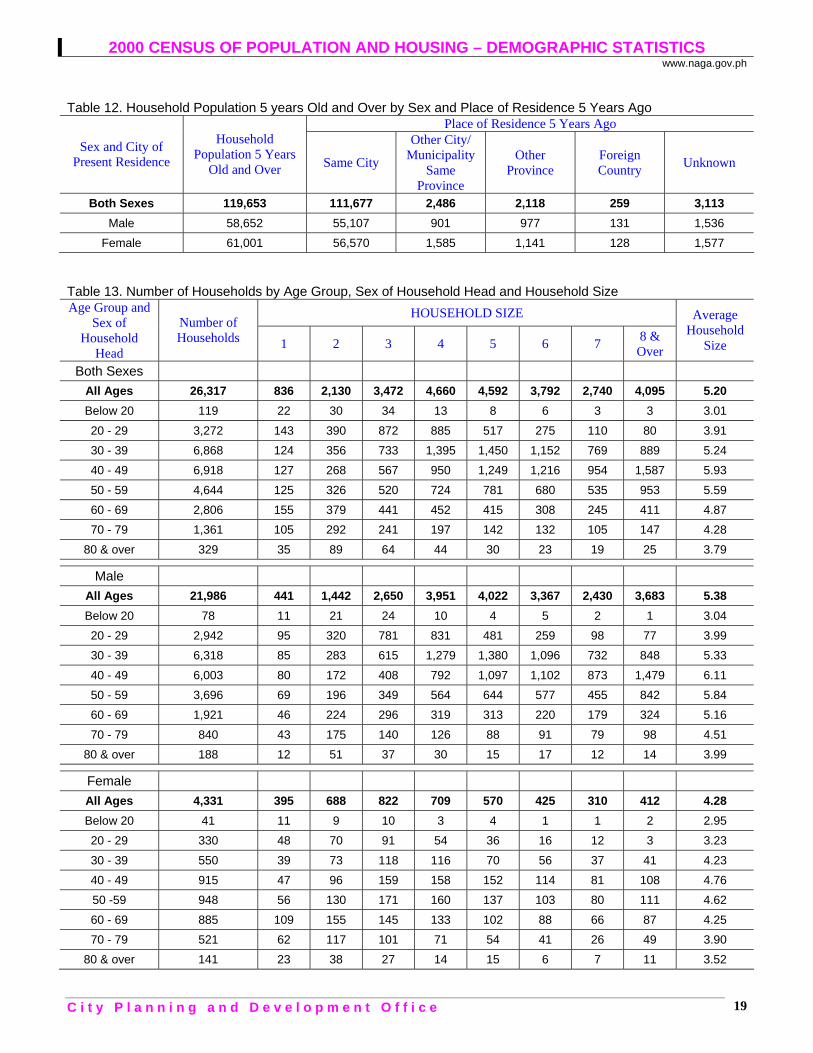
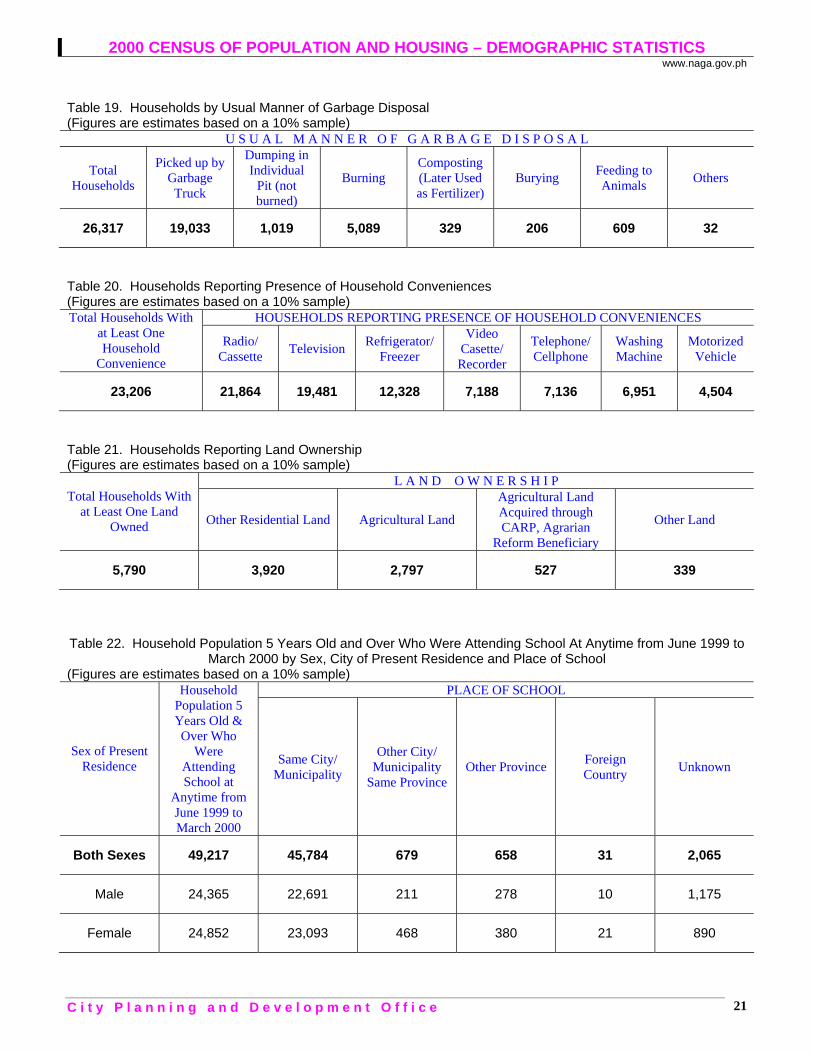
A third of the population attended/completed elementary (see Table 10) Of the household population five years old and over, 33.07 percent attended or completed elementary, 28.64 percent high school, 2.85 percent pre-school, and 4.67 percent post secondary education. Meanwhile, there were 15.49 percent college undergraduates, 9.77 percent academic degree holders, and less than one percent with post baccalaureate courses (0.69 percent).
Those who had not completed any grade made up 2.76 percent. There were more males found not completing any grade at all (52.56 percent).
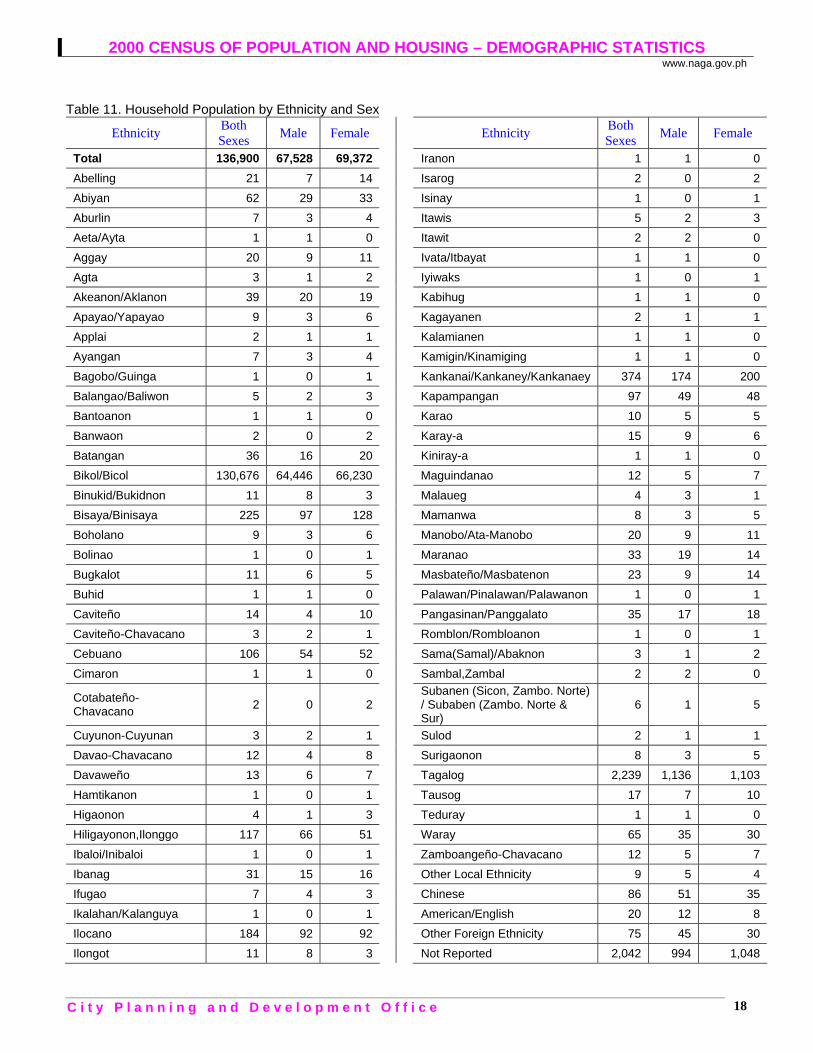
There was a higher proportion of males among those who attended or completed elementary (50.16 percent), and pre-school (52.33 percent). On the other hand, there was a higher proportion of females among those who had post secondary education (52.01 percent), high school (50.84 percent), academic degree holders (57.27 percent), college undergraduates (50.59 percent), and those with post baccalaureate courses (55.07 percent). Majority were Bicolanos (see Table 11) Almost all (95.45 percent) of the household population in Naga City classified themselves as Bicolanos/Bikolanos, while Tagalog comprised 1.64 percent. Other ethnic groups included Kankanai/Kankanaey/Kankaney (0.27 percent), Bisaya/ Binisaya (0.16 percent), Ilocano (0.13 percent), and Hiligaynon/Ilonggo (0.08 percent). Almost all remained in the city of residence (see Table 12) Of the 119,653 household population aged five years and over, 93.33 percent remained in the city where they were five years ago, 2.08 percent moved in from other cities/municipalities of Camarines Sur, 1.77 percent from other provinces, and 0.22 percent from other countries. Most households were headed by males (see Table 13) Males headed the majority (83.54 percent) of households in Naga City. Among males, headship rate peaked at ages 30 to 39 years (28.74 percent) while headship rate for females was the highest at ages 50 to 59 years (21.89 percent). Majority preferred studying in Naga City (see Table 22) Of the 49,217 household population five years and over who attended school at anytime from June 1999 to March 2000, majority (93.02 percent) were studying inside the city proper where they resided, 1.38 percent outside of the city but within Camarines Sur, 1.33 percent in other provinces, and 0.06 percent in foreign countries. On the other hand, there were more females studying in the city of residence (50.44 percent), outside of city residence but within Camarines Sur (68.92 percent), in other provinces (57.75 percent), and in foreign countries (67.74 percent).
C i t y P l a n n i n g a n d D e v e l o p m e n t O f f i c e 3
2000 CENSUS OF POPULATION AND HOUSING – HIGHLIGHTS www.naga.gov.ph
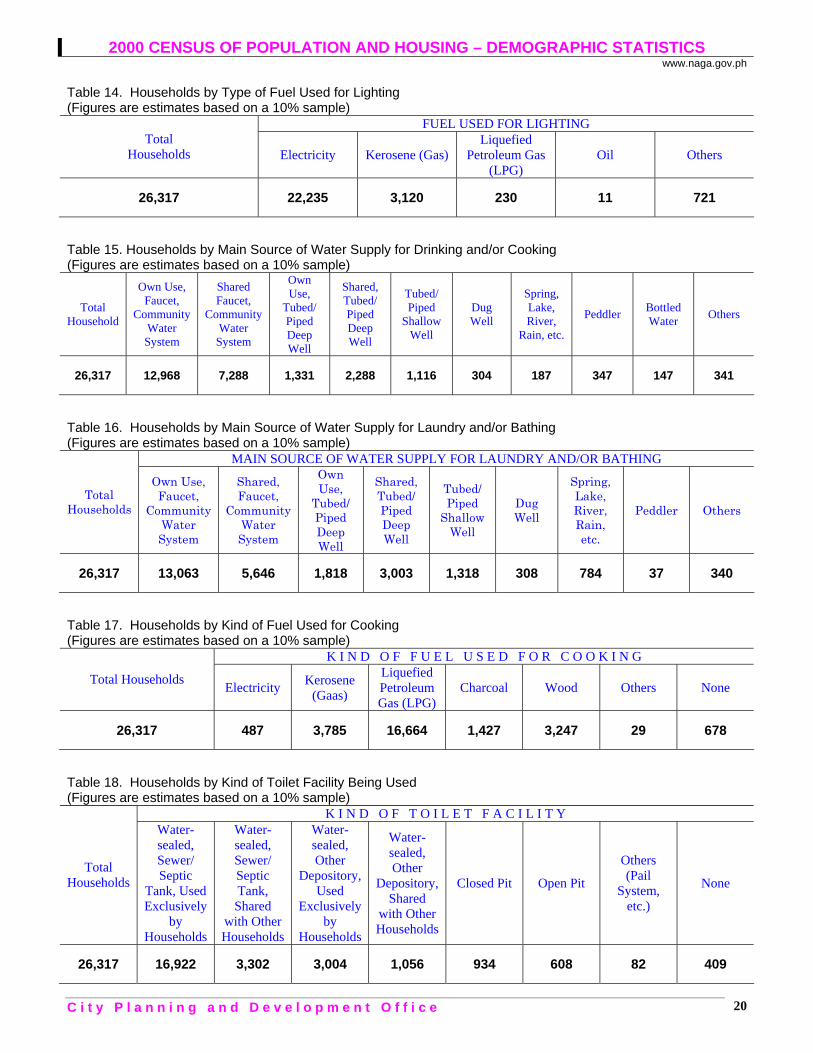
A high majority of household population in Naga City were literate (see Table 23) About 96.55 percent of the household population of Naga City were literate. Literacy rate among males (96.64 percent) was higher than among females (96.47 percent). Individuals aged 40 to 44 years registered the highest proportion (98.22 percent of literate persons, followed by individuals aged 35 to 39 (98.05 percent) and 20 to 24 years (97.96 percent). A third of ever-married women aged 15 to 49 years had four or more children (see Table 24) There were 20,848 ever-married women aged 15 to 49 years in Naga City, of which 33.95 percent had four or more children and 49.62 percent had one to three children. The average number of children for an ever-married woman in this city was 2.84 while the proportion of ever-married women who were still childless by the end of their reproductive life (45 to 49 years old) was 1.35 percent. Average age at first marriage was 22 years old (see Table 25) Ever-married women 15 to 49 years old recorded an average age at first marriage of 22 years. About 8.08 percent got married before they reached the legal age of marriage (18 years), 0.50 percent below 15 years, 73.61 percent at the age of 18 to 29 years, and 4.60 percent at the of 30 years and over. HOUSEHOLD CHARACTERISTICS Four out of five households used electricity for lighting (see Table 14) In 2000, majority (84.49 percent) of the households of Naga City used electricity for lighting. Households that used kerosene and liquefied petroleum gas (LPG) comprised 11.86 percent and 0.87 percent, respectively. Community water system was the main source of water supply for drinking and/or cooking (see Table 15) About half (49.28 percent) of the total households in Naga City utilized own faucet connected to a community water system as the main source of water supply for drinking and/or cooking. Own use faucet connected to a community water system was the main source of water supply for laundry and/or bathing in Naga City (see Table 16) One in two households in this city utilized own faucet connected to a community water system as the main source of water supply for laundry and/or bathing (49.64 percent). Households that drew water from shared faucet connected to a community
C i t y P l a n n i n g a n d D e v e l o p m e n t O f f i c e 4

2000 CENSUS OF POPULATION AND HOUSING – HIGHLIGHTS www.naga.gov.ph
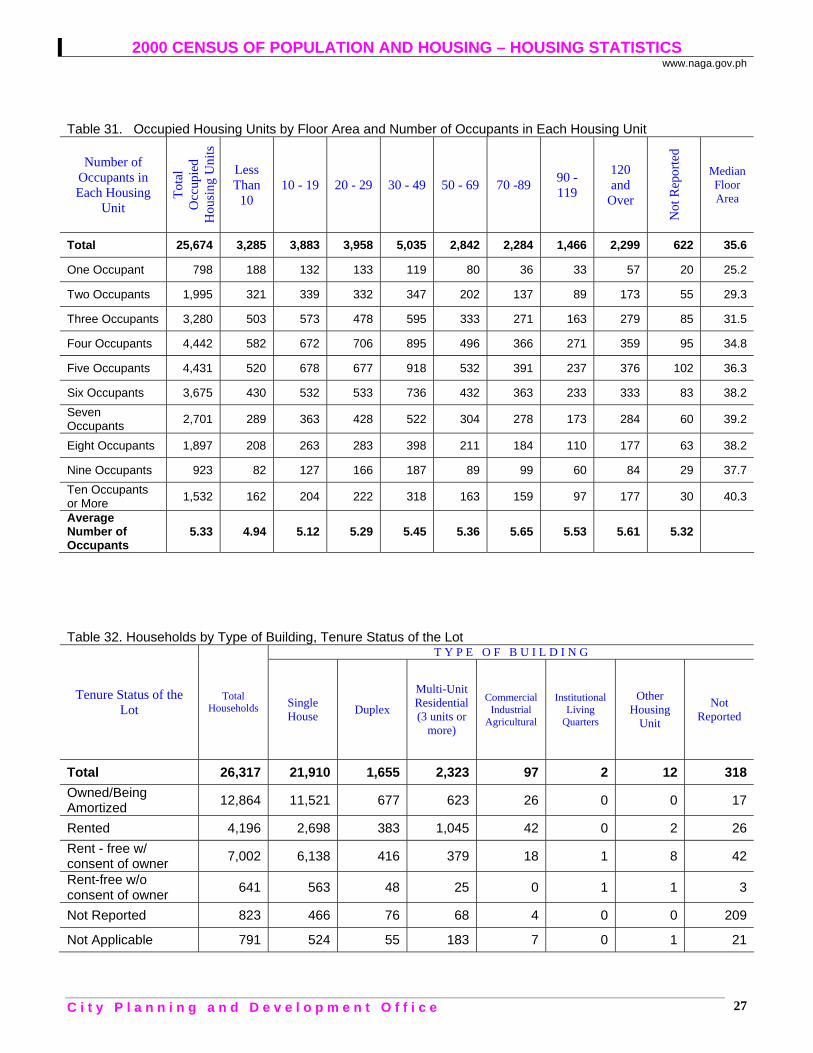
water system represented 21.45 percent., followed by households that used shared tubed/piped deep well (11.41 percent). More than half of the households used Liquefied Petroleum Gas (LPG) as fuel for cooking (see Table 17) About 63.32 percent of households used Liquefied Petroleum Gas (LPG) as fuel for cooking, distantly followed by kerosene (14.38 percent) and wood (12.34 percent). Less than two percent of Naga City's households used electricity for cooking (1.85 percent). More than two-thirds of households used water-sealed sewer/septic tank as kind of toilet facility (see Table 18) The most reported kind of toilet facility was water-sealed sewer/septic tank exclusively used by households (64.30 percent) followed by water-sealed sewer/septic tank shared with other households (12.55 percent) and water-sealed other depository used exclusively by households (11.42 percent). Other types were water-sealed other depository shared with other households (4.01 percent), closed pit (3.55 percent), open pit (2.31 percent) and others (pail system, etc. (0.31 percent). About 1.55 percent of Naga City's households had not toilet facility at all. Collection by garbage truck is the usual manner of garbage disposal in Naga City (see Table 19) In 2000, 72.32 percent of Naga City's households disposed their garbage through the regular collection by garbage truck around the city. Still, about one-fifth of the total households disposed their garbage by burning (19.34 percent). Other manner of gaarbage disposal included dumping in individual pit (3.87 percent), composting (1.25 percent), burying (0.78 percent) and feeding to animals (2.31 percent). More than nine out of ten households had radio/cassette (see Table 20) Of the 23,206 total households with at least one household convenience, 94.22 percent had radio/cassette, 83.95 percent has television set, 53.12 percent had refrigerator/freezer, 30. 97 percent had video cassette recorder, 30.75 percent had telephone/cellphone, 29.95 percent had washing machine, and 19.41 had at least one motorized vehicle. More households owned other residential land (see Table 21) Among the 5,790 households with at least one land owned, 67.70 percent owned other residential land, 48.31 percent owned agricultural land, 9.10 percent owned agricultural land through CARP or were Agrarian Reform beneficiary, and 5.85 percent owned other land. Majority of households owned/amortized their houses (see Table 33) Of the 26,317 total households in occupied housing units, 69.43 percent owned/ amortized their houses. Other households rented their houses (14.89 percent),
C i t y P l a n n i n g a n d D e v e l o p m e n t O f f i c e 5
2000 CENSUS OF POPULATION AND HOUSING – HIGHLIGHTS www.naga.gov.ph
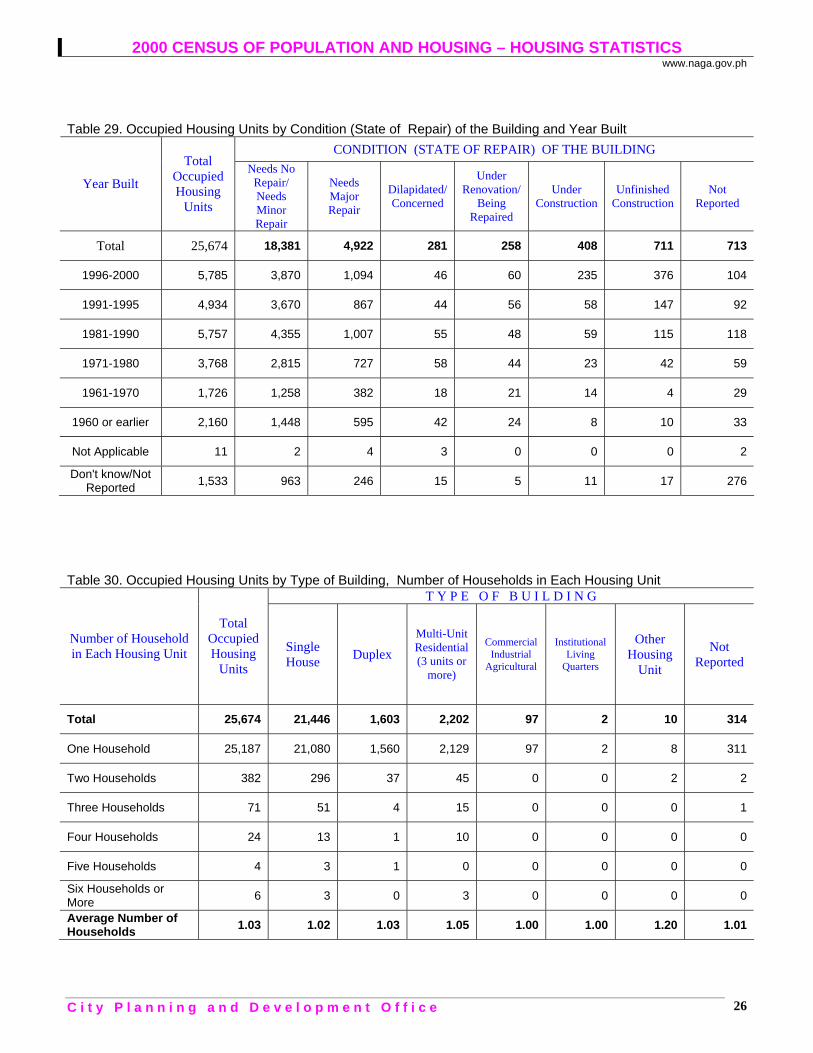
occupied the housing units for free with consent of owner (11.59 percent), and occupied for free without consent of owner (0.85 percent). One-half of owner households acquired their houses through construction by owner-occupants with or without help of friends/relatives (see Table 34) About 50.50 percent of the owner-households constructed their own houses with or without help of friends and/or relatives, 23.23 percent constructed their houses with the help of hired/skilled workers, 13.29 percent purchased, and 2.41 percent inherited. The remaining 4.87 percent of owner-households constructed their houses with the assistance of an organized contractor. Twenty five percent of the renter-households paid at a rate of 1,000 to 1,999 pesos a month (see Table 36) In 2000, there were 3,919 renter-households of which 25.41 percent paid at a rate of P1,000 to P1,999 pesos per month, 22.38 percent at P2,000 to P4,999, 17.07 percent at P500 to P999, and 10.64 percent at P200 to P499. HOUSING CHARACTERISTICS Ratio of households to occupied housing unit was recorded at 1.03 (see Table 27) A total of 136,900 persons and 26,317 households resided in 25,674 housing units. It registered a ratio of 1.02 households to one occupied housing unit and a ratio of 5.33 persons per occupied housing unit. Majority of the houses in Naga City had roofs of galvanized iron/aluminum, and walls of concrete, brick or stone (see Table 28) In 2000, close to three-fourths of the occupied housing units had roofs made of galvanized iron/alumium (71.36 percent). Housing units with roofs made of cogon/nipa/anahaw comprised 18.87 percent. Two-fifths (40.85 percent) of the occupied housing units in Naga City had walls made of concrete/brick/stone, 24.84 percent had wood, 17.39 percent had half concrete/brick/stone and half wood, and 9.77 percent had bamboo/sawali/cogon/nipa. Close to two-fifths (39.09 percent) of the occupied housing units in Naga City had a combination of galvanized iron/aluminum for roofs and concrete/brick/stone for walls. Majority of houses needed minor repair or no repair at all (see Table 29) In 2000, the proportion of housing units that still needed no repair or with minor repair only was 71.59 percent; needed major repair, 19.17 percent; and with unfinished construction, 2.77 percent.
C i t y P l a n n i n g a n d D e v e l o p m e n t O f f i c e 6
2000 CENSUS OF POPULATION AND HOUSING – HIGHLIGHTS www.naga.gov.ph
A fifth of the occupied housing units in Naga City were relatively new with about 22.53 percent built from 1996 to 2000 and 19.22 percent from 1991 to 1995. About 22.42 percent were built from 1981 to 1990, and 14.68 were built from 1971 to 1980. Almost all type of occupied housing units were single-type houses (see Table 30) Majority (83.25 percent) of the occupied housing units in Naga City were single houses. Other types include multi-unit residential (8.58 percent), duplex (6.24 percent), and commercial/industrial/agricultural (0.38 percent). Two in five housing units had a floor area of 30 to 49 square meters (see Table 31) In 2000, the most reported floor area of occupied housing units in Naga City was 30 to 49 square meters (19.61 percent). About 43.34 percent had a floor area less than 30 square meters, 30.68 percent had 30 to 69 square meters, and 23.56 percent had 70 square meters and over.
C i t y P l a n n i n g a n d D e v e l o p m e n t O f f i c e 7
2000 CENSUS OF POPULATION AND HOUSING – DEMOGRAPHIC STATISTICS www.naga.gov.ph
C i t y P l a n n i n g a n d D e v e l o p m e n t O f f i c e
DEMOGRAPHIC STATISTICS
8

2000 CENSUS OF POPULATION AND HOUSING – DEMOGRAPHIC STATISTICS www.naga.gov.ph
C i t y P l a n n i n g a n d D e v e l o p m e n t O f f i c e
Table 1. Population Enumerated in Various Censuses: 1903 – 2000
1903 1918 1939 1948 1960 1970 1975 1980 1990 1995 2000 2-Mar 31-Dec 1-Jan 1-Oct 15-Feb 6-May 1-May 1-May 1-May 1-Sep 1-May
17,943 9,396 22,505 56,238 55,506 79,846 83,337 90,712 115,329 126,972 137,810
Table 2. Total Population by Age Group, Sex Table 3. Household Population by Age Group, Sex Age Group Both Sexes Male Female Age Group Both Sexes Male Female
All Ages 137,810 68,040 69,770 All Ages 136,900 67,528 69,372
Under 1 3,502 1,857 1,645 Under 1 3,496 1,857 1,639
1 – 4 13,784 7,038 6,746 1 – 4 13,751 7,019 6,732
5 – 9 16,258 8,452 7,806 5 – 9 16,226 8,431 7,795
10 – 14 15,838 8,052 7,786 10 – 14 15,813 8,038 7,775
15 – 19 15,657 7,549 8,108 15 – 19 15,510 7,452 8,058
20 – 24 12,994 6,322 6,672 20 – 24 12,806 6,209 6,597
25 – 29 10,227 4,939 5,288 25 – 29 10,114 4,870 5,244
30 – 34 9,421 4,660 4,761 30 – 34 9,312 4,607 4,705
35 – 39 8,583 4,237 4,346 35 – 39 8,523 4,213 4,310
40 – 44 7,781 3,792 3,989 40 – 44 7,739 3,765 3,974
45 – 49 6,417 3,253 3,164 45 – 49 6,373 3,224 3,149
50 – 54 5,245 2,543 2,702 50 – 54 5,214 2,530 2,684
55 – 59 3,585 1,717 1,868 55 – 59 3,572 1,710 1,862
60 – 64 2,961 1,353 1,608 60 – 64 2,943 1,341 1,602
65 – 69 2,113 920 1,193 65 – 69 2,092 912 1,180
70 – 74 1,638 683 955 70 – 74 1,628 680 948
75 – 79 939 378 561 75 – 79 934 376 558
80 & Over 867 295 572 80 & Over 854 294 560
0 – 17 58,826 29,982 28,844 0 – 17 58,673 29,891 28,782
18 & Over 78,984 38,058 40,926 18 & Over 78,227 37,637 40,590
9

2000 CENSUS OF POPULATION AND HOUSING – DEMOGRAPHIC STATISTICS www.naga.gov.ph
C i t y P l a n n i n g a n d D e v e l o p m e n t O f f i c e
Table 4. Total Population, Household Population and Number of Households by Region, Province, City and Barangay Region/Province/ City /Barangay
Total Population
Household Population
Number Of Household
REGION V 4,674,855 ------------ 891,541
CAMARINES SUR 1,551,549 1,548,846 288,172
NAGA CITY 137,810 136,900 26,317
1. Abella 5,016 4,968 912
2. Bagumbayan Norte 2,331 2,324 443
3. Bagumbayan Sur 4,709 4,671 973
4. Balatas 6,808 6,785 1,262
5. Calauag 7,208 7,188 1,297
6. Cararayan 7,355 7,306 1,314
7. Carolina 4,349 4,320 824
8. Concepcion Grande 8,524 8,501 1,695
9. Concepcion Pequeña 16,818 16,734 3,252
10. Dayangdang 4,604 4,586 952
11. Del Rosario 6,260 6,113 1,178
12. Dinaga 467 467 106
13. Igualdad 2,591 2,591 472
14. Lerma 2,329 2,329 463
15. Liboton 3,006 2,923 585
16. Mabolo 5,962 5,962 1,116
17. Pacol 6,271 6,271 1,134
18. Panicuason 1,847 1,795 332
19. Peñafrancia 5,451 5,382 1,093
20. Sabang 5,991 5,986 1,107
21. San Felipe 6,126 6,098 1,124
22. San Francisco 1,139 1,128 242
23. San Isidro 1,813 1,813 331
24. Sta. Cruz 5,750 5,628 1,143
25. Tabuco 4,276 4,226 827
26. Tinago 3,927 3,923 778
27. Triangulo 6,882 6,882 1,362
10

2000 CENSUS OF POPULATION AND HOUSING – DEMOGRAPHIC STATISTICS www.naga.gov.ph
C i t y P l a n n i n g a n d D e v e l o p m e n t O f f i c e
Table 5. Population, Number of Household, Area, Density and Average Family Size by Barangay
A B C D E
BARANGAY Population No of Households
Area (Hectare)
Density (A/C)
Average Family Size
(A/B) 1. Abella 5,016 912 24.50 205 5.50
2. Bagumbayan Norte 2,331 443 26.19 89 5.26
3. Bagumbayan Sur 4,709 973 62.52 75 4.84
4. Balatas 6,808 1,262 201.91 34 5.39
5. Calauag 7,208 1,297 54.91 131 5.56
6. Cararayan 7,355 1,314 1,011.23 7 5.60
7. Carolina 4,349 824 1,777.45 2 5.28
8. Concepcion Grande 8,524 1,695 337.92 25 5.03
9. Concepcion Pequeña 16,818 3,252 381.00 44 5.17
10. Dayangdang 4,604 952 33.79 136 4.84
11. Del Rosario 6,260 1,178 221.33 28 5.31
12. Dinaga 467 106 8.45 55 4.41
13. Igualdad 2,591 472 9.29 279 5.49
14. Lerma 2,329 463 5.07 459 5.03
15. Liboton 3,006 585 27.88 108 5.14
16. Mabolo 5,962 1,116 116.58 51 5.34
17. Pacol 6,271 1,134 1,305.22 5 5.53
18. Panicuason 1,847 332 1,469.95 1 5.56
19. Peñafrancia 5,451 1,093 41.40 132 4.99
20. Sabang 5,991 1,107 45.62 131 5.41
21. San Felipe 6,126 1,124 577.84 11 5.45
22. San Francisco 1,139 242 11.83 96 4.71
23. San Isidro 1,813 331 272.87 7 5.48
24. Sta. Cruz 5,750 1,143 71.81 80 5.03
25. Tabuco 4,276 827 156.29 27 5.17
26. Tinago 3,927 778 40.55 97 5.05
27. Triangulo 6,882 1,362 154.60 45 5.05
NAGA CITY 137,810 26,317 8,448.00 16 5.24
11

2000 CENSUS OF POPULATION AND HOUSING – DEMOGRAPHIC STATISTICS www.naga.gov.ph
C i t y P l a n n i n g a n d D e v e l o p m e n t O f f i c e
Table 6. Projected Population for 2001-2010 by Barangay Using 1.65% Annual Growth Rate
PROJECTED POPULATION BARANGAY 2001 2002 2003 2004 2005 2006 2007 2008 2009 2010
NAGA CITY 140,084 142,395 144,745 147,133 149,561 152,029 154,537 157,087 159,679 162,313
1. Abella 5,099 5,183 5,268 5,355 5,444 5,534 5,625 5,718 5,812 5,908
2. Bagumbayan Norte 2,369 2,409 2,448 2,489 2,530 2,572 2,614 2,657 2,701 2,745
3. Bagumbayan Sur 4,787 4,866 4,946 5,028 5,111 5,195 5,281 5,368 5,456 5,546
4. Balatas 6,920 7,035 7,151 7,269 7,389 7,510 7,634 7,760 7,888 8,019
5. Calauag 7,327 7,448 7,571 7,696 7,823 7,952 8,083 8,216 8,352 8,490
6. Cararayan 7,476 7,600 7,725 7,853 7,982 8,114 8,248 8,384 8,522 8,663
7. Carolina 4,421 4,494 4,568 4,643 4,720 4,798 4,877 4,957 5,039 5,122
8. Concepcion Grande 8,665 8,808 8,953 9,101 9,251 9,403 9,559 9,716 9,877 10,040
9. Concepcion Pequeña 17,095 17,378 17,664 17,956 18,252 18,553 18,859 19,170 19,487 19,808
10. Dayangdang 4,680 4,757 4,836 4,915 4,997 5,079 5,163 5,248 5,335 5,423
11. Del Rosario 6,363 6,468 6,575 6,683 6,794 6,906 7,020 7,136 7,253 7,373
12. Dinaga 475 483 491 499 507 515 524 532 541 550
13. Igualdad Interior 2,634 2,677 2,721 2,766 2,812 2,858 2,905 2,953 3,002 3,052
14. Lerma 2,367 2,406 2,446 2,487 2,528 2,569 2,612 2,655 2,699 2,743
15. Liboton 3,056 3,106 3,157 3,209 3,262 3,316 3,371 3,426 3,483 3,540
16. Mabolo 6,060 6,160 6,262 6,365 6,470 6,577 6,686 6,796 6,908 7,022
17. Pacol 6,374 6,480 6,587 6,695 6,806 6,918 7,032 7,148 7,266 7,386
18. Panicuason 1,877 1,908 1,940 1,972 2,004 2,038 2,071 2,105 2,140 2,175
19. Peñafrancia 5,541 5,632 5,725 5,820 5,916 6,013 6,113 6,213 6,316 6,420
20. Sabang 6,090 6,190 6,292 6,396 6,502 6,609 6,718 6,829 6,942 7,056
21. San Felipe 6,227 6,330 6,434 6,540 6,648 6,758 6,870 6,983 7,098 7,215
22. San Francisco 1,158 1,177 1,196 1,216 1,236 1,257 1,277 1,298 1,320 1,342
23. San Isidro 1,843 1,873 1,904 1,936 1,968 2,000 2,033 2,067 2,101 2,135
24. Sta. Cruz 5,845 5,941 6,039 6,139 6,240 6,343 6,448 6,554 6,662 6,772
25. Tabuco 4,347 4,418 4,491 4,565 4,641 4,717 4,795 4,874 4,955 5,036
26. Tinago 3,992 4,058 4,125 4,193 4,262 4,332 4,404 4,476 4,550 4,625
27. Triangulo 6,996 7,111 7,228 7,348 7,469 7,592 7,717 7,845 7,974 8,106
12

2000 CENSUS OF POPULATION AND HOUSING – DEMOGRAPHIC STATISTICS www.naga.gov.ph
C i t y P l a n n i n g a n d D e v e l o p m e n t O f f i c e
Table 7. Total Population 10 Years Old and Over by Age Group, Sex and Marital Status
M a r i t a l S t a t u s Age Group and Sex
Total Population 10 Years
Old and Over Single Married Widowed Divorced/ Separated
Common-Law/ Live-In Unknown
Both Sexes 104,266 47,234 46,554 4,668 942 3,902 966 Below 20 31,495 29,617 952 52 16 373 485 20 - 24 12,994 9,048 2,906 42 50 798 150 25 - 29 10,227 3,918 5,401 51 88 678 91 30 - 34 9,421 1,807 6,822 87 124 539 42 35 - 39 8,583 984 6,778 159 139 486 37 40 - 44 7,781 600 6,370 280 160 340 31 45 - 49 6,417 376 5,285 360 121 253 22 50 - 54 5,245 269 4,134 510 99 205 28 55 - 59 3,585 171 2,783 479 56 78 18 60 - 64 2,961 146 2,093 581 32 82 27 65 - 69 2,113 112 1,337 587 33 33 11 70 - 74 1,638 87 939 562 14 25 11 75 - 79 939 48 448 426 4 8 5
80 & Over 867 51 306 492 6 4 8
Male 50,693 23,871 23,246 879 253 1,978 466 Below 20 15,601 14,770 426 18 3 153 231 20 - 24 6,322 4,759 1,112 10 9 359 73 25 - 29 4,939 2,118 2,390 13 16 349 53 30 - 34 4,660 986 3,320 17 38 278 21 35 - 39 4,237 507 3,382 45 30 254 19 40 - 44 3,792 295 3,176 70 54 182 15 45 - 49 3,253 168 2,835 63 28 146 13 50 - 54 2,543 99 2,201 90 30 113 10 55 - 59 1,717 62 1,502 81 17 47 8 60 - 64 1,353 46 1,117 111 10 55 14 65 - 69 920 27 778 85 9 18 3 70 - 74 683 22 532 105 4 15 5 75 - 79 378 6 280 83 3 6 -
80 & Over 295 6 195 88 2 3 1
Female 53,573 23,363 23,308 3,789 689 1,924 500 Below 20 15,894 14,847 526 34 13 220 254 20 - 24 6,672 4,289 1,794 32 41 439 77 25 - 29 5,288 1,800 3,011 38 72 329 38 30 - 34 4,761 821 3,502 70 86 261 21 35 - 39 4,346 477 3,396 114 109 232 18 40 - 44 3,989 305 3,194 210 106 158 16 45 - 49 3,164 208 2,450 297 93 107 9 50 - 54 2,702 170 1,933 420 69 92 18 55 - 59 1,868 109 1,281 398 39 31 10 60 - 64 1,608 100 976 470 22 27 13 65 - 69 1,193 85 559 502 24 15 8 70 - 74 955 65 407 457 10 10 6 75 - 79 561 42 168 343 1 2 5
80 & Over 572 45 111 404 4 1 7
13
2000 CENSUS OF POPULATION AND HOUSING – DEMOGRAPHIC STATISTICS www.naga.gov.ph
C i t y P l a n n i n g a n d D e v e l o p m e n t O f f i c e
Table 8. Household Population 10 Years Old and Over by Age Group, Sex and Marital Status
M a r i t a l S t a t u s Age Group and Sex
Household Population 10 Years
Old and Over Single Married Widowed Divorced/
Separated Common-
Law/Live-In Unknown
Both Sexes 103,427 46,590 46,433 4,660 932 3,862 950 Below 20 31,323 29,455 951 52 16 367 482 20 - 24 12,806 8,879 2,895 42 50 792 148 25 - 29 10,114 3,838 5,377 51 88 671 89 30 - 34 9,312 1,727 6,800 87 122 536 40 35 - 39 8,523 950 6,758 157 139 482 37 40 - 44 7,739 579 6,356 279 158 336 31 45 - 49 6,373 358 5,271 360 119 245 20 50 - 54 5,214 253 4,124 510 96 204 27 55 - 59 3,572 165 2,780 476 55 78 18 60 - 64 2,943 133 2,091 581 32 81 25 65 - 69 2,092 95 1,337 585 33 33 9 70 - 74 1,628 77 939 562 14 25 11 75 - 79 934 43 448 426 4 8 5
80 & Over 854 38 306 492 6 4 8
Male 50,221 23,534 23,161 876 248 1,944 458 Below 20 15,490 14,664 426 18 3 151 228 20 - 24 6,209 4,660 1,104 10 9 353 73 25 - 29 4,870 2,071 2,373 13 16 344 53 30 - 34 4,607 952 3,305 17 37 275 21 35 - 39 4,213 500 3,369 45 30 250 19 40 - 44 3,765 283 3,166 70 53 178 15 45 - 49 3,224 161 2,823 63 28 138 11 50 - 54 2,530 96 2,195 90 28 112 9 55 - 59 1,710 60 1,500 79 16 47 8 60 - 64 1,341 38 1,115 111 10 54 13 65 - 69 912 21 778 84 9 18 2 70 - 74 680 19 532 105 4 15 5 75 - 79 376 4 280 83 3 6 -
80 & Over 294 5 195 88 2 3 1
Female 53,206 23,056 23,272 3,784 684 1,918 492 Below 20 15,833 14,791 525 34 13 216 254 20 - 24 6,597 4,219 1,791 32 41 439 75 25 - 29 5,244 1,767 3,004 38 72 327 36 30 - 34 4,705 775 3,495 70 85 261 19 35 - 39 4,310 450 3,389 112 109 232 18 40 - 44 3,974 296 3,190 209 105 158 16 45 - 49 3,149 197 2,448 297 91 107 9 50 - 54 2,684 157 1,929 420 68 92 18 55 - 59 1,862 105 1,280 397 39 31 10 60 - 64 1,602 95 976 470 22 27 12 65 - 69 1,180 74 559 501 24 15 7 70 - 74 948 58 407 457 10 10 6 75 - 79 558 39 168 343 1 2 5
80 & Over 560 33 111 404 4 1 7
14
2000 CENSUS OF POPULATION AND HOUSING – DEMOGRAPHIC STATISTICS www.naga.gov.ph
C i t y P l a n n i n g a n d D e v e l o p m e n t O f f i c e
Table 9. Household Population by Religious Affiliation and Sex Religious Affiliation Both Sexes Male Female
Total 136,900 67,528 69,372
Roman Catholic 129,345 63,884 65,461
Aglipayan 92 38 54
Islam 287 147 140
Iglesia ni Cristo 1,711 854 857
United Church of Christ in the Philippines 164 77 87
Lutheran Church in the Philippines 20 12 8
Philippine Episcopal Church 5 2 3
Iglesia Evangelista Methodista en las Filipinas 48 21 27
United Methodist Church 62 31 31
Other Methodist 11 4 7
Salvation Army, Philippines 0 0 0
Convention of the Philippine Baptist Church 86 42 44
Other Protestant 373 182 191
Buddhist 413 184 229
Chruch of Jesus Christ of the Latter Day Saints 210 96 114
Jehovah's Witness 321 157 164
Philippine Benevolent Missionaries Association 43 17 26
Seventh Day Adventist 575 275 300
Evangelicals 1,484 688 796
Bible Baptist 214 105 109
Southern Baptist 34 18 16
Association of Baptist Churches in Luzon, Visayas and Mindanao 8 2 6
Association of Fundamental Baptist Church in the Philippines 37 15 22
International Baptist Missionary Fellowship 1 0 1
Missionary Baptist Churches in the Philippines 24 14 10
Other Baptist 25 13 12
Tribal Religions 5 2 3
Others 1,045 511 534
None 34 16 18
Unknown 223 121 102
15
2000 CENSUS OF POPULATION AND HOUSING – DEMOGRAPHIC STATISTICS www.naga.gov.ph
C i t y P l a n n i n g a n d D e v e l o p m e n t O f f i c e
Table 10. Household Population 5 Years Old and Over by Highest Educational Attainment, Sex and Age Group
A G E G R O U P Highest Educational Attainment and Sex
Household Population
5 Years Old & Over 5 6 7 8 9 10 11 12 13 14
Both Sexes 119,653 3,276 3,180 3,319 3,204 3,247 3,334 2,933 3,217 3,209 3,120 No Grade Completed 3,307 1,547 714 252 72 51 31 17 14 10 14 Pre-School 3,411 1,147 1,408 517 113 39 17 7 7 4 2
39,572 0 800 2,452 2,940 3,102 3,234 2,884 2,739 1,647 Elementary 837 1st-4th Grade 17,908 0 800 2,452 2,940 3,102 2,590 1,136 535 317 205 5th-7th Grade 21,664 0 0 0 0 0 644 1,748 2,204 1,330 632 High School 34,272 0 0 0 0 0 0 0 415 1,510 2,246
18,752 0 0 0 0 0 0 0 415 1,510 2,246 Undergraduate Graduate 15,520 0 0 0 0 0 0 0 0 0 0 Post-Secondary 5,585 0 0 0 0 0 0 0 0 0 0 Undergraduate 1,235 0 0 0 0 0 0 0 0 0 0 Graduate 4,350 0 0 0 0 0 0 0 0 0 0 College Undergraduate 18,540 0 0 0 0 0 0 0 0 0 0 Academic Degree Holder 11,694 0 0 0 0 0 0 0 0 0 0 Post-Baccalaureate 828 0 0 0 0 0 0 0 0 0 0 Not Stated 2,444 582 258 98 79 55 52 25 42 38 21
Male 58,652 1,733 1,647 1,718 1,654 1,679 1,650 1,509 1,650 1,627 1,602 No Grade Completed 1,738 843 403 142 43 31 13 7 8 5 7 Pre-School 1,785 569 740 294 74 25 8 5 5 2 0 Elementary 19,851 0 383 1,238 1,496 1,591 1,602 1,487 1,400 860 490 1st-4th Grade 9,250 0 383 1,238 1,496 1,591 1,279 641 324 189 132 5th-7th Grade 10,601 0 0 0 0 0 323 846 1,076 671 358 High School 16,847 0 0 0 0 0 0 0 213 737 1,094 Undergraduate 9,409 0 0 0 0 0 0 0 213 737 1,094 Graduate 7,438 0 0 0 0 0 0 0 0 0 0 Post-Secondary 2,680 0 0 0 0 0 0 0 0 0 0 Undergraduate 629 0 0 0 0 0 0 0 0 0 0 Graduate 2,051 0 0 0 0 0 0 0 0 0 0 College Undergraduate 9,142 0 0 0 0 0 0 0 0 0 0 Academic Degree Holder 4,997 0 0 0 0 0 0 0 0 0 0 Post-Baccalaureate 372 0 0 0 0 0 0 0 0 0 0 Not Stated 1,240 321 121 44 41 32 27 10 24 23 11
Female 61,001 1,543 1,533 1,601 1,550 1,568 1,684 1,424 1,567 1,582 1,518 No Grade Completed 1,569 704 311 110 29 20 18 10 6 5 7 Pre-School 1,626 578 668 223 39 14 9 2 2 2 2 Elementary 19,721 0 417 1,214 1,444 1,511 1,632 1,397 1,339 787 347 1st-4th Grade 8,658 0 417 1,214 1,444 1,511 1,311 495 211 128 73 5th-7th Grade 11,063 0 0 0 0 0 321 902 1,128 659 274 High School 17,425 0 0 0 0 0 0 0 202 773 1,152 Undergraduate 9,343 0 0 0 0 0 0 0 202 773 1,152 Graduate 8,082 0 0 0 0 0 0 0 0 0 0 Post-Secondary 2,905 0 0 0 0 0 0 0 0 0 0 Undergraduate 606 0 0 0 0 0 0 0 0 0 0 Graduate 2,299 0 0 0 0 0 0 0 0 0 0 College Undergraduate 9,398 0 0 0 0 0 0 0 0 0 0 Academic Degree Holder 6,697 0 0 0 0 0 0 0 0 0 0 Post-Baccalaureate 456 0 0 0 0 0 0 0 0 0 0 Not Stated 1,204 261 137 54 38 23 25 15 18 15 10
16
2000 CENSUS OF POPULATION AND HOUSING – DEMOGRAPHIC STATISTICS www.naga.gov.ph
C i t y P l a n n i n g a n d D e v e l o p m e n t O f f i c e
Table 10. Household Population 5 Years Old and Over by Highest Educational Attainment, Sex and Age Group - Continued
A G E G R O U P Highest Educational Attainment and Sex
Household Population
5 Years Old & Over 15 16 17 18 19 20-24 25-29 30-34 35 &
Over Both Sexes 119,653 3,158 3,023 3,206 2,998 3,125 12,806 10,114 9,312 39,872 No Grade Completed 3,307 10 10 14 6 13 50 44 49 389 Pre-School 3,411 9 6 3 1 0 3 9 5 114 Elementary 39,572 613 436 437 404 392 1,608 1,617 1,671 11,759 1st-4th Grade 17,908 141 114 92 99 84 284 247 227 2,543 5th-7th Grade 21,664 472 322 345 305 308 1,324 1,370 1,444 9,216 High School 34,272 2,494 2,281 1,880 1,248 1,178 4,206 3,303 2,999 10,512 Undergraduate 18,752 2,494 1,599 1,021 640 595 1,878 1,273 1,173 3,908 Graduate 15,520 0 682 859 608 583 2,328 2,030 1,826 6,604 Post-Secondary 5,585 0 8 16 40 73 1,070 1,090 880 2,408 Undergraduate 1,235 0 3 6 18 28 258 252 220 450 Graduate 4,350 0 5 10 22 45 812 838 660 1,958 College Undergraduate 18,540 0 249 837 1,268 1,380 3,938 2,095 1,864 6,909 Academic Degree Holder 11,694 0 0 0 0 60 1,746 1,767 1,639 6,482 Post-Baccalaureate 828 0 0 0 0 0 22 50 87 669 Not Stated 2,444 32 33 19 31 29 163 139 118 630
Male 58,652 1,531 1,496 1,519 1,431 1,475 6,209 4,870 4,607 19,045 No Grade Completed 1,738 4 5 5 2 4 21 23 28 144 Pre-School 1,785 7 2 3 1 0 1 2 2 45 Elementary 19,851 357 236 252 225 215 954 871 903 5,291 1st-4th Grade 9,250 91 65 56 64 52 199 154 131 1,165 5th-7th Grade 10,601 266 171 196 161 163 755 717 772 4,126 High School 16,847 1,148 1,116 885 591 592 2,119 1,575 1,491 5,286 Undergraduate 9,409 1,148 816 548 343 333 1,048 650 572 1,907 Graduate 7,438 0 300 337 248 259 1,071 925 919 3,379 Post-Secondary 2,680 0 3 8 25 35 484 562 439 1,124 Undergraduate 629 0 2 4 10 9 128 141 114 221 Graduate 2,051 0 1 4 15 26 356 421 325 903 College Undergraduate 9,142 0 115 358 573 603 1,906 1,002 939 3,646 Academic Degree Holder 4,997 0 0 0 0 20 643 722 716 2,896 Post-Baccalaureate 372 0 0 0 0 0 5 23 39 305 Not Stated 1,240 15 19 8 14 6 76 90 50 308
Female 61,001 1,627 1,527 1,687 1,567 1,650 6,597 5,244 4,705 20,827 No Grade Completed 1,569 6 5 9 4 9 29 21 21 245 Pre-School 1,626 2 4 0 0 0 2 7 3 69 Elementary 19,721 256 200 185 179 177 654 746 768 6,468 1st-4th Grade 8,658 50 49 36 35 32 85 93 96 1,378 5th-7th Grade 11,063 206 151 149 144 145 569 653 672 5,090 High School 17,425 1,346 1,165 995 657 586 2,087 1,728 1,508 5,226 Undergraduate 9,343 1,346 783 473 297 262 830 623 601 2,001 Graduate 8,082 0 382 522 360 324 1,257 1,105 907 3,225 Post-Secondary 2,905 0 5 8 15 38 586 528 441 1,284 Undergraduate 606 0 1 2 8 19 130 111 106 229 Graduate 2,299 0 4 6 7 19 456 417 335 1,055 College Undergraduate 9,398 0 134 479 695 777 2,032 1,093 925 3,263 Academic Degree Holder 6,697 0 0 0 0 40 1,103 1,045 923 3,586 Post-Baccalaureate 456 0 0 0 0 0 17 27 48 364 Not Stated 1,204 17 14 11 17 23 87 49 68 322
17
2000 CENSUS OF POPULATION AND HOUSING – DEMOGRAPHIC STATISTICS www.naga.gov.ph
C i t y P l a n n i n g a n d D e v e l o p m e n t O f f i c e
Table 11. Household Population by Ethnicity and Sex
Ethnicity Both Sexes Male Female Ethnicity Both
Sexes Male Female
Total 136,900 67,528 69,372 Iranon 1 1 0 Abelling 21 7 14 Isarog 2 0 2 Abiyan 62 29 33 Isinay 1 0 1 Aburlin 7 3 4 Itawis 5 2 3 Aeta/Ayta 1 1 0 Itawit 2 2 0 Aggay 20 9 11 Ivata/Itbayat 1 1 0 Agta 3 1 2 Iyiwaks 1 0 1 Akeanon/Aklanon 39 20 19 Kabihug 1 1 0 Apayao/Yapayao 9 3 6 Kagayanen 2 1 1 Applai 2 1 1 Kalamianen 1 1 0 Ayangan 7 3 4 Kamigin/Kinamiging 1 1 0 Bagobo/Guinga 1 0 1 Kankanai/Kankaney/Kankanaey 374 174 200 Balangao/Baliwon 5 2 3 Kapampangan 97 49 48 Bantoanon 1 1 0 Karao 10 5 5 Banwaon 2 0 2 Karay-a 15 9 6 Batangan 36 16 20 Kiniray-a 1 1 0 Bikol/Bicol 130,676 64,446 66,230 Maguindanao 12 5 7 Binukid/Bukidnon 11 8 3 Malaueg 4 3 1 Bisaya/Binisaya 225 97 128 Mamanwa 8 3 5 Boholano 9 3 6 Manobo/Ata-Manobo 20 9 11 Bolinao 1 0 1 Maranao 33 19 14 Bugkalot 11 6 5 Masbateño/Masbatenon 23 9 14 Buhid 1 1 0 Palawan/Pinalawan/Palawanon 1 0 1 Caviteño 14 4 10 Pangasinan/Panggalato 35 17 18 Caviteño-Chavacano 3 2 1 Romblon/Rombloanon 1 0 1 Cebuano 106 54 52 Sama(Samal)/Abaknon 3 1 2 Cimaron 1 1 0 Sambal,Zambal 2 2 0
Cotabateño-Chavacano 2 0 2
Subanen (Sicon, Zambo. Norte) / Subaben (Zambo. Norte & Sur)
6 1 5
Cuyunon-Cuyunan 3 2 1 Sulod 2 1 1 Davao-Chavacano 12 4 8 Surigaonon 8 3 5 Davaweño 13 6 7 Tagalog 2,239 1,136 1,103 Hamtikanon 1 0 1 Tausog 17 7 10 Higaonon 4 1 3 Teduray 1 1 0 Hiligayonon,Ilonggo 117 66 51 Waray 65 35 30 Ibaloi/Inibaloi 1 0 1 Zamboangeño-Chavacano 12 5 7 Ibanag 31 15 16 Other Local Ethnicity 9 5 4 Ifugao 7 4 3 Chinese 86 51 35 Ikalahan/Kalanguya 1 0 1 American/English 20 12 8 Ilocano 184 92 92 Other Foreign Ethnicity 75 45 30 Ilongot 11 8 3 Not Reported 2,042 994 1,048
18
2000 CENSUS OF POPULATION AND HOUSING – DEMOGRAPHIC STATISTICS www.naga.gov.ph
C i t y P l a n n i n g a n d D e v e l o p m e n t O f f i c e
Table 12. Household Population 5 years Old and Over by Sex and Place of Residence 5 Years Ago
Place of Residence 5 Years Ago
Sex and City of Present Residence
Household Population 5 Years
Old and Over Same City
Other City/ Municipality
Same Province
Other Province
Foreign Country Unknown
Both Sexes 119,653 111,677 2,486 2,118 259 3,113 Male 58,652 55,107 901 977 131 1,536
Female 61,001 56,570 1,585 1,141 128 1,577 Table 13. Number of Households by Age Group, Sex of Household Head and Household Size
HOUSEHOLD SIZE Age Group and Sex of
Household Head
Number of Households 1 2 3 4 5 6 7 8 &
Over
Average Household
Size
Both Sexes All Ages 26,317 836 2,130 3,472 4,660 4,592 3,792 2,740 4,095 5.20 Below 20 119 22 30 34 13 8 6 3 3 3.01 20 - 29 3,272 143 390 872 885 517 275 110 80 3.91 30 - 39 6,868 124 356 733 1,395 1,450 1,152 769 889 5.24 40 - 49 6,918 127 268 567 950 1,249 1,216 954 1,587 5.93 50 - 59 4,644 125 326 520 724 781 680 535 953 5.59 60 - 69 2,806 155 379 441 452 415 308 245 411 4.87 70 - 79 1,361 105 292 241 197 142 132 105 147 4.28
80 & over 329 35 89 64 44 30 23 19 25 3.79
Male All Ages 21,986 441 1,442 2,650 3,951 4,022 3,367 2,430 3,683 5.38 Below 20 78 11 21 24 10 4 5 2 1 3.04 20 - 29 2,942 95 320 781 831 481 259 98 77 3.99 30 - 39 6,318 85 283 615 1,279 1,380 1,096 732 848 5.33 40 - 49 6,003 80 172 408 792 1,097 1,102 873 1,479 6.11 50 - 59 3,696 69 196 349 564 644 577 455 842 5.84 60 - 69 1,921 46 224 296 319 313 220 179 324 5.16 70 - 79 840 43 175 140 126 88 91 79 98 4.51
80 & over 188 12 51 37 30 15 17 12 14 3.99
Female All Ages 4,331 395 688 822 709 570 425 310 412 4.28 Below 20 41 11 9 10 3 4 1 1 2 2.95 20 - 29 330 48 70 91 54 36 16 12 3 3.23 30 - 39 550 39 73 118 116 70 56 37 41 4.23 40 - 49 915 47 96 159 158 152 114 81 108 4.76 50 -59 948 56 130 171 160 137 103 80 111 4.62 60 - 69 885 109 155 145 133 102 88 66 87 4.25 70 - 79 521 62 117 101 71 54 41 26 49 3.90
80 & over 141 23 38 27 14 15 6 7 11 3.52
19
2000 CENSUS OF POPULATION AND HOUSING – DEMOGRAPHIC STATISTICS www.naga.gov.ph
C i t y P l a n n i n g a n d D e v e l o p m e n t O f f i c e
Table 14. Households by Type of Fuel Used for Lighting (Figures are estimates based on a 10% sample)
FUEL USED FOR LIGHTING Total
Households Electricity Kerosene (Gas) Liquefied
Petroleum Gas (LPG)
Oil Others
26,317 22,235 3,120 230 11 721
Table 15. Households by Main Source of Water Supply for Drinking and/or Cooking (Figures are estimates based on a 10% sample)
Total Household
Own Use, Faucet,
Community Water System
Shared Faucet,
Community Water System
Own Use,
Tubed/ Piped Deep Well
Shared, Tubed/ Piped Deep Well
Tubed/ Piped
Shallow Well
Dug Well
Spring, Lake, River,
Rain, etc.
Peddler Bottled Water Others
26,317 12,968 7,288 1,331 2,288 1,116 304 187 347 147 341
Table 16. Households by Main Source of Water Supply for Laundry and/or Bathing (Figures are estimates based on a 10% sample)
MAIN SOURCE OF WATER SUPPLY FOR LAUNDRY AND/OR BATHING
Total Households
Own Use, Faucet,
Community Water System
Shared, Faucet,
Community Water System
Own Use,
Tubed/ Piped Deep Well
Shared, Tubed/ Piped Deep Well
Tubed/ Piped
Shallow Well
Dug Well
Spring, Lake, River, Rain, etc.
Peddler Others
26,317 13,063 5,646 1,818 3,003 1,318 308 784 37 340
Table 17. Households by Kind of Fuel Used for Cooking (Figures are estimates based on a 10% sample)
K I N D O F F U E L U S E D F O R C O O K I N G
Total Households Electricity Kerosene (Gaas)
Liquefied Petroleum Gas (LPG)
Charcoal Wood Others None
26,317 487 3,785 16,664 1,427 3,247 29 678
Table 18. Households by Kind of Toilet Facility Being Used (Figures are estimates based on a 10% sample)
K I N D O F T O I L E T F A C I L I T Y
Total Households
Water-sealed, Sewer/ Septic
Tank, Used Exclusively
by Households
Water-sealed, Sewer/ Septic Tank, Shared
with Other Households
Water-sealed, Other
Depository, Used
Exclusively by
Households
Water-sealed, Other
Depository, Shared
with Other Households
Closed Pit Open Pit
Others (Pail
System, etc.)
None
26,317 16,922 3,302 3,004 1,056 934 608 82 409
20
2000 CENSUS OF POPULATION AND HOUSING – DEMOGRAPHIC STATISTICS www.naga.gov.ph
C i t y P l a n n i n g a n d D e v e l o p m e n t O f f i c e
Table 19. Households by Usual Manner of Garbage Disposal (Figures are estimates based on a 10% sample)
U S U A L M A N N E R O F G A R B A G E D I S P O S A L
Total Households
Picked up by Garbage Truck
Dumping in Individual
Pit (not burned)
Burning Composting (Later Used as Fertilizer)
Burying Feeding to Animals Others
26,317 19,033 1,019 5,089 329 206 609 32
Table 20. Households Reporting Presence of Household Conveniences (Figures are estimates based on a 10% sample)
HOUSEHOLDS REPORTING PRESENCE OF HOUSEHOLD CONVENIENCES Total Households With at Least One Household
Convenience
Radio/ Cassette Television Refrigerator/
Freezer
Video Casette/ Recorder
Telephone/ Cellphone
Washing Machine
Motorized Vehicle
23,206 21,864 19,481 12,328 7,188 7,136 6,951 4,504
Table 21. Households Reporting Land Ownership (Figures are estimates based on a 10% sample)
L A N D O W N E R S H I P Total Households With
at Least One Land Owned Other Residential Land Agricultural Land
Agricultural Land Acquired through CARP, Agrarian
Reform Beneficiary
Other Land
5,790 3,920 2,797 527 339
Table 22. Household Population 5 Years Old and Over Who Were Attending School At Anytime from June 1999 to
March 2000 by Sex, City of Present Residence and Place of School (Figures are estimates based on a 10% sample)
PLACE OF SCHOOL
Sex of Present Residence
Household Population 5 Years Old & Over Who
Were Attending School at
Anytime from June 1999 to March 2000
Same City/ Municipality
Other City/ Municipality
Same Province Other Province Foreign
Country Unknown
Both Sexes 49,217 45,784 679 658 31 2,065
Male 24,365 22,691 211 278 10 1,175
Female 24,852 23,093 468 380 21 890
21

2000 CENSUS OF POPULATION AND HOUSING – DEMOGRAPHIC STATISTICS www.naga.gov.ph
C i t y P l a n n i n g a n d D e v e l o p m e n t O f f i c e
Table 23. Literacy of Household Population 10 Years Old and Over by Age Group and Sex (Figures are estimates based on a 10% sample)
Age Group and Sex Household Population 10 Years Old and Over Literate Illiterate
Both Sexes 103,427 99,862 3,565 10 - 14 15,813 14,940 873 15 - 19 15,510 15,100 410 20 - 24 12,806 12,545 261 25 - 29 10,114 9,879 235 30 - 34 9,312 9,095 217 35 - 39 8,523 8,353 170 40 - 44 7,739 7,601 138 45 - 49 6,373 6,229 144 50 - 54 5,214 5,019 195 55 - 59 3,572 3,341 231 60 - 64 2,943 2,750 193 65 - 69 2,092 1,965 127
70 and over 3,416 3,045 371
Male 50,221 48,533 1,688 10 - 14 8,038 7,610 428 15 - 19 7,452 7,240 212 20 - 24 6,209 6,069 140 25 - 29 4,870 4,740 130 30 - 34 4,607 4,558 49 35 - 39 4,213 4,103 110 40 - 44 3,765 3,649 116 45 - 49 3,224 3,189 35 50 - 54 2,530 2,420 110 55 - 59 1,710 1,611 99 60 - 64 1,341 1,276 65 65 - 69 912 843 69
70 and over 1,350 1,225 125
Female 53,206 51,329 1,877 10 - 14 7,775 7,330 445 15 - 19 8,058 7,860 198 20 - 24 6,597 6,476 121 25 - 29 5,244 5,139 105 30 - 34 4,705 4,537 168 35 - 39 4,310 4,250 60 40 - 44 3,974 3,952 22 45 - 49 3,149 3,040 109 50 - 54 2,684 2,599 85 55 - 59 1,862 1,730 132 60 - 64 1,602 1,474 128 65 - 69 1,180 1,122 58
70 and over 2,066 1,820 246
22

2000 CENSUS OF POPULATION AND HOUSING – DEMOGRAPHIC STATISTICS www.naga.gov.ph
C i t y P l a n n i n g a n d D e v e l o p m e n t O f f i c e
Table 24. Ever-Married Women 15 to 49 Years Old by Number of Children Ever Born and Age Group (Figures are estimates based on a 10% sample)
N U M B E R O F C H I L D R E N E V E R B O R N
Age Group
Tota
l Num
ber o
f C
hild
ren
Ever
Bor
n
Ever
-Mar
ried
Wom
en
15 to
49
Yea
rs O
ld
0 1 2 3 4 5 6 7 8 or More
Not
Rep
orte
d
Ave
rage
Par
ity
Total 59,230 20,848 3,403 3,031 3,767 3,547 2,752 1,802 1,080 668 776 22 2.84
15 - 19 371 401 139 164 54 33 0 0 0 0 0 11 0.95
20 - 24 2,844 2,435 707 839 650 207 21 0 0 0 0 11 1.17
25 - 29 7,035 3,578 709 729 924 694 330 135 28 19 10 0 1.97
30 - 34 11,538 4,082 589 476 798 787 619 455 226 76 56 0 2.83
35 - 39 11,948 3,864 611 335 610 771 589 398 297 132 121 0 3.09
40 - 44 13,825 3,699 366 320 407 677 684 477 290 213 265 0 3.74
45 - 49 11,669 2,789 282 168 324 378 509 337 239 228 324 0 4.18
Table 25. Ever-Married Women 15 to 49 Years Old by Age at First Marriage and Age Group
AGE AT FIRST MARRIAGE Age Group
Ever Married Women 15 to 49 Years Old
Below 15 15 16 17 18 19 20 21 22
Total 20,848 104 254 470 960 1,839 1,735 2,287 1,648 1,461 15 - 19 401 33 21 33 43 87 33 0 0 0 20 - 24 2,435 0 44 55 143 433 370 409 305 109 25 - 29 3,578 10 30 96 169 264 318 387 301 217 30 - 34 4,082 20 55 125 192 313 255 481 371 280 35 - 39 3,864 30 82 50 103 279 265 343 257 395 40 - 44 3,699 11 0 80 168 266 311 297 211 353 45 - 49 2,789 0 22 31 142 197 183 370 203 107
Table 25. Ever-Married Women 15 to 49 Years Old by Age at First Marriage and Age Group - Continued
AGE AT FIRST MARRIAGE
Age Group 23 24 25 26 27 28 29 30 and Over
Not Stated
Average Age at First
Marriage Total 1,366 1,208 1,732 615 575 677 204 960 2,753 22
15 - 19 0 0 0 0 0 0 0 0 151 17 20 - 24 131 0 0 0 0 0 0 0 436 19 25 - 29 299 277 409 121 81 46 10 0 543 22 30 - 34 262 276 287 160 160 121 74 139 511 22 35 - 39 225 206 380 92 128 225 32 311 461 23 40 - 44 288 209 397 143 66 156 66 275 402 23 45 - 49 161 240 259 99 140 129 22 235 249 23
23
2000 CENSUS OF POPULATION AND HOUSING – HOUSING STATISTICS www.naga.gov.ph
C i t y P l a n n i n g a n d D e v e l o p m e n t O f f i c e
HOUSING STATISTICS
24

2000 CENSUS OF POPULATION AND HOUSING – HOUSING STATISTICS www.naga.gov.ph
C i t y P l a n n i n g a n d D e v e l o p m e n t O f f i c e
Table 26. Occupied Housing Units: 1960, 1970, 1980, 1990 and 2000 1960 1970 1980 1990 2000 8,182 11,384 15,526 19,592 25,674
Table 27. Occupied Housing Units, Households, Household Population and Ratio of Households and Household Population to Occupied Housing Unit by Type of Building
R A T I O
Type of Building Occupied Housing
Units Households Household
Population
Households to Occupied
Housing Unit
Household Population to
Occupied Housing
Unit Total 25,674 26,317 136,900 1.03 5.33
Single House 21,446 21,910 116,196 1.02 5.42
Duplex 1,603 1,655 7,912 1.03 4.94
Multi-Unit Residential 2,202 2,323 10,479 1.05 4.76
Commercial/Industrial/Agricultural 97 97 455 1.00 4.69
Institutional Living Quarters 2 2 10 1.00 5.00
Other Housing Unit 10 12 49 1.20 4.90
Not Reported 314 318 1,799 1.01 5.73
Table 28. Occupied Housing Units by Construction Materials of the Outer Walls and Roof
C O N S T R U C T I O N M A T E R I A L S O F T H E R O O F
Construction Materials of the Outer Walls
Total Occupied Housing
Units
Galvanized Iron/
Aluminum
Tile/ Concrete/ Clay Tile
Half Galvanized
Iron & Half
Concrete
Wood Cogon/ Nipa/
Anahaw
Makeshift/ Salvaged/
Improvised Materials
Asbestos/ Others
Not Reported
Total 25,674 18,321 185 1,482 333 4,844 233 21 255
Concrete/Brick/ Stone 10,489 10,036 131 124 46 139 7 6 0
Wood 6,378 4,116 17 286 128 1,808 19 4 0
Half Concrete/Brick/ Stone and Half Wood
4,465 3,061 22 849 77 446 10 0 0
Galvanized Iron/Aluminum 239 115 3 82 0 37 1 1 0
Bamboo/Sawali/ Cogon/Nipa 2,509 466 0 93 73 1,858 18 1 0
Asbestos 24 20 4 0 0 0 0 0 0
Glass 27 22 1 1 1 0 0 2 0
Makeshift/Salvaged/ Improvised Materials 824 228 0 21 2 395 174 4 0
Others/Not Reported 694 246 6 25 5 150 4 3 255
No Walls 25 11 1 1 1 11 0 0 0
25
2000 CENSUS OF POPULATION AND HOUSING – HOUSING STATISTICS www.naga.gov.ph
C i t y P l a n n i n g a n d D e v e l o p m e n t O f f i c e
Table 29. Occupied Housing Units by Condition (State of Repair) of the Building and Year Built
CONDITION (STATE OF REPAIR) OF THE BUILDING
Year Built
Total Occupied Housing
Units
Needs No Repair/ Needs Minor Repair
Needs Major Repair
Dilapidated/ Concerned
Under Renovation/
Being Repaired
Under Construction
Unfinished Construction
Not Reported
Total 25,674 18,381 4,922 281 258 408 711 713
1996-2000 5,785 3,870 1,094 46 60 235 376 104
1991-1995 4,934 3,670 867 44 56 58 147 92
1981-1990 5,757 4,355 1,007 55 48 59 115 118
1971-1980 3,768 2,815 727 58 44 23 42 59
1961-1970 1,726 1,258 382 18 21 14 4 29
1960 or earlier 2,160 1,448 595 42 24 8 10 33
Not Applicable 11 2 4 3 0 0 0 2
Don't know/Not Reported 1,533 963 246 15 5 11 17 276
Table 30. Occupied Housing Units by Type of Building, Number of Households in Each Housing Unit
T Y P E O F B U I L D I N G
Number of Household in Each Housing Unit
Total Occupied Housing
Units
Single House Duplex
Multi-Unit Residential (3 units or
more)
Commercial Industrial
Agricultural
Institutional Living
Quarters
Other Housing
Unit
Not Reported
Total 25,674 21,446 1,603 2,202 97 2 10 314
One Household 25,187 21,080 1,560 2,129 97 2 8 311
Two Households 382 296 37 45 0 0 2 2
Three Households 71 51 4 15 0 0 0 1
Four Households 24 13 1 10 0 0 0 0
Five Households 4 3 1 0 0 0 0 0
Six Households or More 6 3 0 3 0 0 0 0
Average Number of Households 1.03 1.02 1.03 1.05 1.00 1.00 1.20 1.01
26
2000 CENSUS OF POPULATION AND HOUSING – HOUSING STATISTICS www.naga.gov.ph
C i t y P l a n n i n g a n d D e v e l o p m e n t O f f i c e
Table 31. Occupied Housing Units by Floor Area and Number of Occupants in Each Housing Unit
Number of Occupants in Each Housing
Unit
Tota
l O
ccup
ied
Hou
sing
Uni
ts
Less Than
10 10 - 19 20 - 29 30 - 49 50 - 69 70 -89 90 -
119
120 and
Over
Not
Rep
orte
d
Median Floor Area
Total 25,674 3,285 3,883 3,958 5,035 2,842 2,284 1,466 2,299 622 35.6
One Occupant 798 188 132 133 119 80 36 33 57 20 25.2
Two Occupants 1,995 321 339 332 347 202 137 89 173 55 29.3
Three Occupants 3,280 503 573 478 595 333 271 163 279 85 31.5
Four Occupants 4,442 582 672 706 895 496 366 271 359 95 34.8
Five Occupants 4,431 520 678 677 918 532 391 237 376 102 36.3
Six Occupants 3,675 430 532 533 736 432 363 233 333 83 38.2 Seven Occupants 2,701 289 363 428 522 304 278 173 284 60 39.2
Eight Occupants 1,897 208 263 283 398 211 184 110 177 63 38.2
Nine Occupants 923 82 127 166 187 89 99 60 84 29 37.7 Ten Occupants or More 1,532 162 204 222 318 163 159 97 177 30 40.3
Average Number of Occupants
5.33 4.94 5.12 5.29 5.45 5.36 5.65 5.53 5.61 5.32
Table 32. Households by Type of Building, Tenure Status of the Lot
T Y P E O F B U I L D I N G
Tenure Status of the Lot
Total Households Single
House Duplex
Multi-Unit Residential (3 units or
more)
Commercial Industrial
Agricultural
Institutional Living
Quarters
Other Housing
Unit
Not Reported
Total 26,317 21,910 1,655 2,323 97 2 12 318Owned/Being Amortized 12,864 11,521 677 623 26 0 0 17
Rented 4,196 2,698 383 1,045 42 0 2 26Rent - free w/ consent of owner 7,002 6,138 416 379 18 1 8 42
Rent-free w/o consent of owner 641 563 48 25 0 1 1 3
Not Reported 823 466 76 68 4 0 0 209
Not Applicable 791 524 55 183 7 0 1 21
27

2000 CENSUS OF POPULATION AND HOUSING – HOUSING STATISTICS www.naga.gov.ph
C i t y P l a n n i n g a n d D e v e l o p m e n t O f f i c e
Table 33. Households in Occupied Housing Units by Tenure Status of the Housing Unit (Figures are estimates based on a 10% sample) Total Households
in Occupied Housing Unit
Owned/ Being Amortized Rented
Being Occupied for Free With
Consent of Owner
Being Occupied for Free Without
Consent of Owner Not Reported
26,317 18,271 3,919 3,049 224 854 Table 34. Owner-Households in Occupied Housing Units by Mode of Acquisition of Housing Unit (Figures are estimates based on a 10% sample)
MODE OF ACQUISITION OF THE HOUSING UNIT
Total Owner - Household in Occupied
Housing Unit
Purchased
Constructed by the
Owner/ Occupants
With or Without Help of Friends/ Relatives
Constructed by Hired/ Skilled
Workers
Constructed by an
Organized Contractor
Inherited Others
(Lottery, Gift, etc.)
Not Reported
18,271 2,429 9,227 4,245 890 441 60 979 Table 35. Owner-Households That Purchased/Constructed Their Housing Units by Reported Source of Financing (Figures are estimates based on a 10% sample)
R E P O R T E D S O U R C E O F F I N A N C I N G Total Owner-Households
That Purchased/ Constructed
Their Housing
Units
Own Resources/
Interest-Free Loans From Relatives/ Friends
Government Assistance: PAG-IBIG, GSIS, SSS, DBP, etc.
Private Banks/
Foundations/ Cooperatives
Employer Assistance
Private Persons
Other Sources Not Reported
16,791 5,964 754 143 70 238 20 9,758 Table 36. Renter-Households in Occupied Housing Units by Monthly Rental of Housing Units (Figures are estimates based on a 10% sample)
MONTHLY RENTAL OF HOUSING UNIT
Tota
l Ren
ter-
H
ouse
hold
s in
Occ
upie
d H
ousi
ng
Uni
ts
Below 100 100-199 200-499 500-999 1,000 -
1,999 2,000 - 4,999
5,000 - 9,999
10,000 and over
Not Reported
Median Rental
3,919 191 127 417 669 996 877 218 29 395 1,359.44
28