Embed Size (px)
Citation preview

Working toward a healthier world.Working toward a healthier world.
2 0 0 0 A N N U A L R E P O R T2 0 0 0 A N N U A L R E P O R T
195 West StreetWaltham, MA 02451-1163Telephone: (781) 487-9900Facsimile: (781) 487-0525
www.parexel.com 1493-AR-00

Corporate Information
CORPORATE OFFICESPAREXEL International Corporation195 West StreetWaltham, Massachusetts 02451-1163Telephone: (781) 487-9900Facsimile: (781) 487-0525Website: www.parexel.com
ANNUAL MEETINGThe fiscal 2000 Annual Meeting of Stockholders will be held at 10:00 a.m. onThursday, November 16, 2000 at the Museum of Our National Heritage, Lexington, MA.
STOCK LISTINGNASDAQ National MarketSymbol: PRXL
FINANCIAL REPORTSCopies of the Company’s Annual Report on Form10-K and Quarterly Reports on Form 10-Q filedwith the Securities and Exchange Commission, aswell as other investor materials, are availableupon request without charge from:
PAREXEL International CorporationInvestor Relations195 West StreetWaltham, Massachusetts 02451-1163Telephone: (781) 434-4118Facsimile: (781) 487-9931
TRANSFER AGENT AND REGISTRARFleet National Bankc/o EquiServe Limited Partnership150 Royall StreetCanton, Massachusetts 02021-1030Telephone: (781) 575-3120
INDEPENDENT ACCOUNTANTSPricewaterhouseCoopers LLPBoston, Massachusetts
LEGAL COUNSELHale and Dorr LLPBoston, Massachusetts
OFFICE LOCATIONSNorth AmericaSan Diego, CaliforniaSan Mateo, CaliforniaToronto, CanadaBoulder, ColoradoGreenwich, ConnecticutWashington, District of ColumbiaAtlanta, GeorgiaChicago, IllinoisRockville, MarylandLowell, MassachusettsWaltham, MassachusettsHackensack, New JerseyDurham, North CarolinaPhiladelphia, PennsylvaniaAlexandria, Virginia
EuropePrague, Czech RepublicCopenhagen, DenmarkHelsinki, FinlandLevallois-Perret, FranceOrleans, FranceParis, FrancePoitiers, FranceBerlin, GermanyFrankfurt, GermanyFreiburg, GermanyBudapest, HungaryMilan, ItalyVilnius, LithuaniaAmsterdam, NetherlandsLillestrøm, NorwayWarsaw, PolandMoscow, RussiaBarcelona, SpainMadrid, SpainStockholm, SwedenGuildford, United KingdomLondon, United KingdomSheffield, United KingdomWorthing, United Kingdom
Asia/Pacific/Middle East/AfricaSydney, AustraliaTel Aviv, IsraelKobe, JapanTokyo, JapanJohannesburg, South Africa
Des
ign:
Ben
es B
rand
Imag
ing
Gro
up,
Lexi
ngto
n, M
A
31
PAREXEL is the third largest Contract Research
Organization (CRO) in the world, providing customized,
expertise-based product development and launch services to
the international pharmaceutical, biotechnology and medical
device industries. Over the past 17 years, PAREXEL has
developed significant global expertise in clinical trials
management, drug development strategy, medical marketing,
regulatory affairs and the use of technology to enhance the
drug development and launch process.
PAREXEL has relationships with most of the world’s top
pharmaceutical and biotechnology companies, and also pro-
vides services to the growing sector of smaller biotechnology,
pharmaceutical and medical device companies.
PAREXEL currently has 4,200 employees in 43 locations
throughout 29 countries.
C O R P O R A T E S U M M A R Y
1
6
8
2
T A B L E O F C O N T E N T S
PAREXEL at a Glance
Letter from the Chairman
Clinical Research Services
Consulting Services
Medical Marketing Services
Financial Highlights
Management’s Discussion and Analysis
Consolidated Financial Statements
Notes to Consolidated Financial Statements
Quarterly and Selected Financial Data
Directors and Officers
Corporate Information
20
29
30
16
11
4
10 31

1
P A R E X E L A T A G L A N C E
Helping our clients make the world a healthier place – that’s our mission at PAREXEL.
To achieve that goal, we offer a complete spectrum of drug development services.
FULL CLINICAL DEVELOPMENT SERVICES
• Strategy Development
• Clinical Trials Management
• Data Management
• Biostatistical Analysis
• Medical Writing
• Medical Services
• Interactive Voice Response Systems
WEB-BASED TOOLS
• Enterprise Information Portal (ParXnet™)
• Clinical Trials Management (ParXtrial™)
• Data Capture and Management
ADVANCED CLINICAL TECHNOLOGIES
• Medical Imaging
• ECG
Clinical Research Services
CLINICAL PHARMACOLOGY
• Strategy Development
• Phase I Services
• Pharmacogenomics
REGULATORY/MANUFACTURING SERVICES
• Regulatory Affairs Strategy and Consulting
• Manufacturing Compliance and
Information Systems Validation (GMP)
• Worldwide Regulatory Submissions
• Quality Assurance
BUSINESS MANAGEMENT
• Clinical Benchmarking
• Business Process Management
• Knowledge Management
• Drug Development Strategy,
Organization and Process
CLINICAL TRAINING AND EDUCATION
INDUSTRY CONFERENCES ANDPUBLICATIONS
Consulting Services
STRATEGIC MEDICAL MARKETING
• Market Analysis
• Product Positioning and Branding
• Scientific Publications
• Medical Education and Symposia
• Advocacy Development and Support
• Meetings and Exhibitions
• Pricing Strategies
REIMBURSEMENT SERVICES
CALL CENTER SERVICES
• Patient Registries
• Reimbursement Hotlines
• Expanded Access Services
• Phase IV and Post-Marketing Studies
WEB-BASED TOOLS
• Knowledge Management (ParXlaunch™)
• Training (ParXtutor™)
• Product Web Sites
Medical Marketing Services

2
L E T T E R F R O M T H E C H A I R M A N
To our stakeholders:For PAREXEL and our peers in the clinical
research industry, the past year has been one of
transition. The pharmaceutical industry is
undergoing major change and, as service
providers to the sector, we are changing with it.
Our clients have been grappling with intensified
pressure to introduce new products, setting
priorities among a burgeoning number of
promising drug targets and industry consolidation.
Their business strategies are evolving rapidly,
and as a result, product development priorities
have been in flux. The immediate impact of
these changes for us and the other major CROs
is that we’ve experienced an unusually high
level of project cancellations and delays. As
you would expect, this volatility had negative
consequences on our revenue and margin
performance during the year. In response, we
are reviewing certain aspects of our business
model to more effectively weather these times,
and are also tailoring new and existing services
to meet our clients’ evolving needs.
One such service is ParXnetTM, which we formally
launched in the past year. ParXnetTM is a suite
of web-based tools for applications ranging
from clinical trial management to data
mining and warehousing. Early feedback
from clients indicates that these tools are
being very well-received and are well ahead
of competitive offerings. The Advanced
Technology and Informatics (ATI) Group was
formed within the Clinical Research Services
(CRS) business unit to introduce and deliver
these new services. In fiscal 2001, ATI has
become a separate business unit to maximize its
ability to create new technology-based services.
In addition to our progress with ParXnetTM, we
are also proud of the effective senior management
transition that occurred throughout the year.
Through a combination of external hires and
internal succession, we rapidly identified
successors in key roles, while also deepening
the experience of the team. James Winschel
joined us to succeed William Sobo as Chief
A recent study showed that PAREXEL had
participated in the development of 19 of the 20
top-selling prescription drugs in the world.

Financial Officer, and Andrew Smith joined
us to succeed Joseph Eagle as President of
Medical Marketing Services. Bill has joined
our Board of Directors, and Joe remains on
the Board. From within, Barry Philpott was
promoted to President of CRS and Andrew
Morffew was promoted to President of our
Consulting Group. We look forward to their
leadership as we continue to grow and evolve.
Regarding the future, we believe that the
long-term outlook for our business is positive,
although we can’t say exactly when market
conditions will become more predictable. Two
key factors account for this view. First, the
pace of new drug development is not expected
to slow any time in the foreseeable future.
Second, drugs intended for human use will
always require carefully supervised clinical
evaluation – a key strength of PAREXEL.
Consequently, we see a clear and ongoing
opportunity for PAREXEL to apply
its expertise and global resources to
developing new drugs. A recent study
showed that PAREXEL had participated
in the development of 19 of the 20 top-selling
prescription drugs in the world. We fully
anticipate a continuing significant role in
bringing new medicines to the world.
In closing, I want to thank our exceptional
employees, whose enthusiasm, dedication and
innovative ideas allow us to adapt and thrive in
the new environment. I also want to thank our
clients and shareholders for their ongoing
support during this challenging period.
Sincerely,
Josef H. von Rickenbach
Chairman of the Board, President
and Chief Executive Officer

4
A healthier future depends on developingeffective new drugs. We’re helping tomake it happen.

5
Today, pharmaceutical, biotechnology and medical device companies
around the world are turning to PAREXEL’s expertise to help speed their
products through the rigors of international clinical trials. In fact, 80% of
the world’s top 50 best-selling drugs have benefited from this expertise.
Every new drug faces the same journey. Before it can help those who need
it most, it must pass through the hands of researchers, physicians and
the myriad of other people who participate in its clinical trials. It’s a
necessary and complex process – and it’s PAREXEL’s mission to make it
as efficient as possible.
So when it comes to clinical research, we lead by constantly
seeking ways to help our clients decrease the time,
cost and risk of developing new products. To this
end, PAREXEL has created an innovative suite
of web-based tools called ParXnetTM, which
provide a client’s organization with a one-stop
data repository across trials, compounds and
therapeutic areas, allowing them to manage
multiple aspects of their product portfolios.
PAREXEL’s clinical expertise: by streamlining the
clinical trial process, we help new drugs reach
patients more quickly.
P A R E X E L C L I N I C A L R E S E A R C H S E R V I C E S
Faster, more efficient clinical trials:with PAREXEL,everyone wins.
A PAREXEL clinical researchteam collaboratedwith one of theworld’s leadingpharmaceuticalcompanies to complete the largest regulatory filing in its history.

Tough problems, smart solutions: PAREXEL Consulting guides the way.
P A R E X E L C O N S U L T I N G S E R V I C E S
From clinical trials to regulatory approval, successfully developing a new
drug takes time, focus and expert guidance at every step. We understand –
and we’re ready to help. At PAREXEL, we offer our clients a strong team
of experienced clinical, regulatory and drug development consultants.
Sometimes even the most sophisticated companies need and seek out
specialized help in developing and producing their products. PAREXEL’s
Consulting group provides the experienced guidance that helps our clients
succeed. From clinical pharmacology experts to specialists in manufacturing
compliance, PAREXEL offers customized assistance in a broad
array of drug development disciplines. No matter where they
are in their product development pipeline, our clients
can tap into global resources with comprehensive
PAREXEL expertise. Whether helping devise a
new drug development strategy, compiling a
multi-national regulatory submission or training
a client’s staff, PAREXEL consultants help our
clients achieve their desired results.
Understanding the intricacies of worldwide drug
development and guiding our clients through
them: for PAREXEL and our clients, it’s an essential
element of success.
6
A team ofKMI/PAREXEL consultants reviewsthe latest release of GMPware™, a proprietary softwaretool that automatesmany of the businessprocesses needed to obtain regulatoryapproval.

When our drug development experts puttheir heads together, the world benefits.
7

8
From doctor to pharmacist to patient: we help to communicate informationthat changes lives.
99
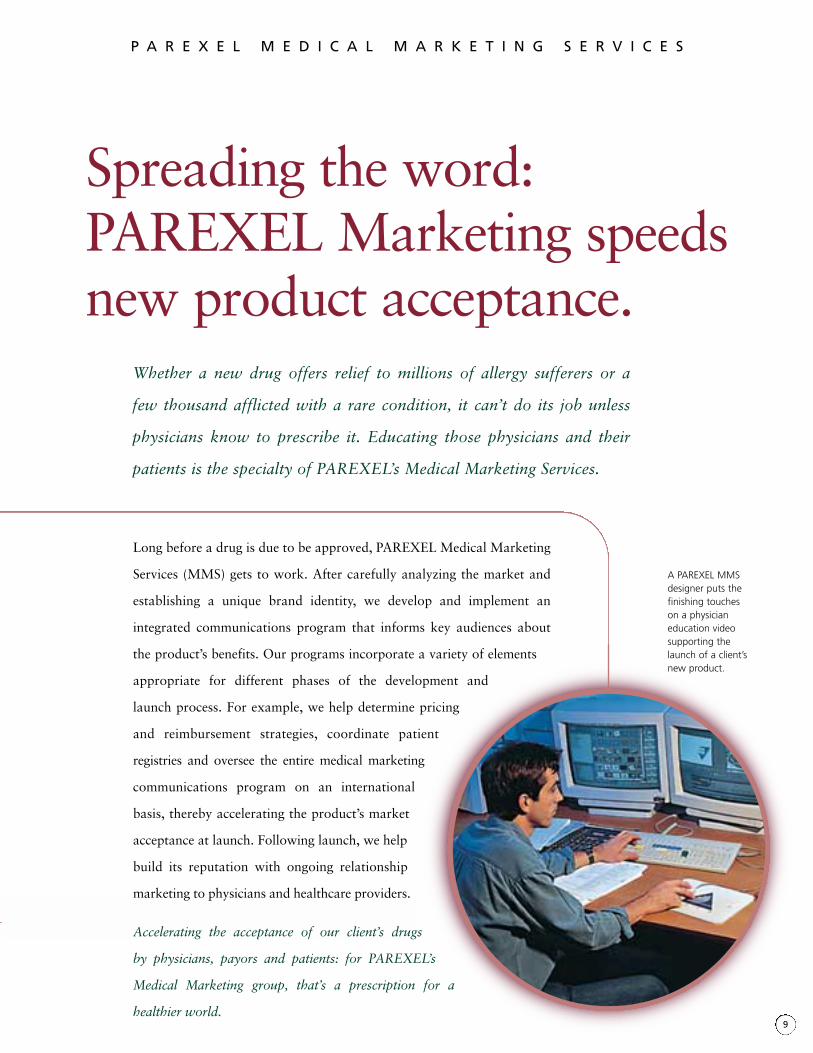
Whether a new drug offers relief to millions of allergy sufferers or a
few thousand afflicted with a rare condition, it can’t do its job unless
physicians know to prescribe it. Educating those physicians and their
patients is the specialty of PAREXEL’s Medical Marketing Services.
Long before a drug is due to be approved, PAREXEL Medical Marketing
Services (MMS) gets to work. After carefully analyzing the market and
establishing a unique brand identity, we develop and implement an
integrated communications program that informs key audiences about
the product’s benefits. Our programs incorporate a variety of elements
appropriate for different phases of the development and
launch process. For example, we help determine pricing
and reimbursement strategies, coordinate patient
registries and oversee the entire medical marketing
communications program on an international
basis, thereby accelerating the product’s market
acceptance at launch. Following launch, we help
build its reputation with ongoing relationship
marketing to physicians and healthcare providers.
Accelerating the acceptance of our client’s drugs
by physicians, payors and patients: for PAREXEL’s
Medical Marketing group, that’s a prescription for a
healthier world.
P A R E X E L M E D I C A L M A R K E T I N G S E R V I C E S
Spreading the word: PAREXEL Marketing speedsnew product acceptance.
A PAREXEL MMSdesigner puts the finishing touches on a physician education videosupporting thelaunch of a client’snew product.

10
F I N A N C I A L H I G H L I G H T S
N E T R E V E N U E B Y G E O G R A P H YN E T R E V E N U E B Y S E R V I C E S E G M E N T
13%Medical Marketing
18% Consulting
69%Clinical Research
38%Europe
60%North America
FISCAL YEAR ENDED JUNE 30
2%Asia/Pacific
(in thousands, except per share data)2000 2000 1999 1998
NET REVENUEClinical Research Services $262,698 $239,502 $187,954PAREXEL Consulting Services $ 66,525 $ 57,633 $ 45,831Medical Marketing Services $ 48,927 $ 51,351 $ 51,657
TOTAL NET REVENUE $378,150 $348,486 $285,442Growth over prior year 8.5% 22.1% 40.1%
INCOME FROM OPERATIONS BEFORERESTRUCTURING AND OTHER SPECIAL CHARGES $ 17,7483 $ 25,2142 $ 26,8681
Percent of net revenue 4.7% 7.2% 9.4%
INCOME FROM OPERATIONS $ 3,6293 $ 20,5642 $ 13,3011
NET INCOME $ 5,4853 $ 15,6222 $ 9,3191
DILUTED EARNINGS PER SHARE $ 0.223 $ 0.622 $ 0.381
WORKING CAPITAL $127,746 $132,757 $118,937TOTAL ASSETS $350,919 $333,565 $261,758STOCKHOLDERS’ EQUITY $190,153 $192,032 $168,380
1 Merger-related and facilities charges aggregated $13.6 million in fiscal 1998. Net income and diluted earnings per share before merger-related and other special chargeswere $19.5 million and $0.79 per share respectively.
2 Special charges aggregated $4.7 million in fiscal 1999, including $1.9 million in costs related to a terminated merger agreement and $2.8 million in leasehold abandonment charges resulting primarily from the centralization of certain facilities in North America and Europe. Net income and diluted earnings per share before special charges were $18.6 million and $0.74 per share respectively.
3 Restructuring and other charges aggregated $13.4 million, consisting primarily of severance and lease termination costs and $1.0 million related to accelerated depreciation expense due to changes in the estimated useful lives of leasehold improvements on abandoned leased facilities. The $13.4 million restructuring charge is net of a $0.3 millionfacilities benefit in Q1 related to a Q4 1999 lease abandonment charge.

11P A R E X E L A N N U A L R E P O R T 2 0 0 0
Management’s Discussion and Analysis of Financial Condition and Results of Operations
OVERVIEWPAREXEL International Corporation (the “Company”)is a leading contract research, medical marketing and con-sulting services organization providing a broad spectrumof services from first-in-human clinical studies throughproduct launch to the pharmaceutical, biotechnology and medical device industries around the world. TheCompany’s primary objective is to help its clients rap-idly obtain the necessary regulatory approvals for theirproducts and market those products successfully. TheCompany provides the following services to its clients:
° clinical trials management;
° data management;
° biostatistical analysis;
° medical marketing;
° clinical pharmacology;
° regulatory and medical consulting;
° performance improvement;
° industry training and publishing; and
° other drug development consulting services.
The Company is managed through three reportable seg-ments, namely, the clinical research services group, theconsulting services group and the medical marketingservices group. The clinical research services group(“CRS”) constitutes the Company’s core business andincludes clinical trials management, biostatistics anddata management, as well as related medical advisory,information technology and investigator site services.PAREXEL’s consulting group (“PCG”) provides technicalexpertise in such disciplines as clinical pharmacology,regulatory affairs, industry training, publishing and drugdevelopment. These consultants identify options andpropose solutions to address clients’ product develop-ment, registration and commercialization issues. Themedical marketing services group (“MMS”) provides afull spectrum of market development, product develop-ment and targeted communications services in supportof product launch.
The Company’s contracts are typically fixed price, multi-year contracts that require a portion of the fee to be paidat the time the contract is entered into, with the balanceof the fee paid in installments during the contract’s duration. Net revenue from contracts is generally rec-ognized on a percentage of completion basis as work isperformed. The contracts may contain provisions forrenegotiation of cost overruns arising from changes inthe scope of work. Renegotiated amounts are included innet revenues when earned and realization is assured.
Generally, the Company’s contracts are terminable uponsixty days notice by the client. Clients terminate or delay
contracts for a variety of reasons, including, among others,the failure of products being tested to satisfy safetyand/or efficacy requirements, unexpected or undesiredclinical results of the product, the client’s decision toforego a particular study, insufficient patient enrollmentor investigator recruitment or production problemsresulting in shortages of the drug.
As is customary in the industry, the Company routinelysubcontracts with independent physician investigators inconnection with clinical trials and other third party serv-ice providers for laboratory analysis and other specializedservices. Revenues and expenses are reported net of thesefees since such fees are granted by customers on a “pass-through basis” without risk or reward to the Company.
Direct costs primarily consist of compensation andrelated fringe benefits for project-related employees, othernon-reimbursable project-related costs and allocatedfacilities and information systems costs. Selling, generaland administrative expenses primarily consist of com-pensation and related fringe benefits for selling andadministrative employees, professional services andadvertising costs, as well as allocated costs related tofacilities and information systems.
The Company’s stock is quoted on the Nasdaq StockMarket under the symbol “PRXL.”
RESULTS OF OPERATIONSAcquisition and Impact of Restructuring and Other ChargesIn September 1999, the Company acquired CEMAFS.A., a leading Phase I clinical research and bioanalyticallaboratory located in Poitiers, France. The Companyacquired the business and related facilities for an initial cash payment of approximately $3.0 million in a transaction accounted for as a purchase business combination. In connection with recording the assetsand liabilities acquired, the Company recorded approximately $2.4 million related to the excess costover the fair value of the net assets acquired. In connec-tion with this transaction, the Company paid approxi-mately an additional $3.0 million to purchase certainbuildings in May 2000. This amount is reflected inproperty and equipment on the Company’s balancesheet as of June 30, 2000.
During the three months ended March 31, 2000, theCompany announced that Novartis, a key client,reduced the amount of work outsourced to the CRSbusiness segment, due to Novartis’ reprioritization of itsresearch pipeline. As a result, the Company estimated

12 P A R E X E L A N N U A L R E P O R T 2 0 0 0
Management’s Discussion and Analysis of Financial Condition and Results of Operations
that total revenues for fiscal 2000 and 2001 would bereduced by $50 million to $55 million in the aggregate.
Consequently, during the year ended June 30, 2000, theCompany recorded restructuring and other charges of$13.1 million. These charges included $7.2 million foremployee severance costs related to the Company’s deci-sion to eliminate approximately 475 managerial and staffpositions in order to reduce personnel costs as a result ofa material dollar volume of contract cancellations. Thecharges also included $4.3 million for lease terminationcosts related to continued efforts to consolidate certainfacilities and reduce excess space in certain locations inaddition to changes in the Company’s original estimateof when certain facilities would be sublet. The remainingcharges, totaling $1.6 million, primarily related to thewrite-off of certain intangible assets and other investments,which are not expected to produce future value. TheCompany is planning to further consolidate facilities togain further cost savings. In this regard, the Companyplans to take an additional facilities-related charge ofbetween $5 and $10 million in the first quarter of fiscal2001. Overall, the Company anticipates these restructuringand other charges will result in aggregate cost savings of$15 to $20 million once implemented.
During 1999, the Company recorded a $2.8 millioncharge in connection with the centralization of certainfacilities. The charge consisted of future non-cancellablelease payments partially offset by estimated subleaseincome. Current year activity against the restructuringand other charges accrual (which is included in “Othercurrent liabilities” in the Consolidated Balance Sheet)was as follows:
Balance, Balance,June 30, Net June 30,
(in thousands) 1999 Provisions Charges 2000
Employee severance costs $ – $ 7,157 $(2,974) $4,183
Facilities related charges 2,557 4,317 (1,898) 4,976
Other charges – 1,614 (1,629) (15)$2,557 $13,088 $(6,501) $9,144
Fiscal Year Ended June 30, 2000 Compared to Fiscal Year Ended June 30, 1999Net revenue increased $29.7 million (8.5%) to $378.2million for fiscal 2000 from $348.5 million for 1999.This net revenue growth was primarily attributable toan increase in the volume of projects serviced by theCompany. In fiscal 2000, net revenue from North
American and Asian operations increased 14% and61%, respectively, over the prior year while net revenuefrom European operations for fiscal 2000 was flat. On a segment basis, fiscal 2000 net revenues from CRS and PCG increased by 9.7% and 15.4%, respectively,over the prior year. Net revenues from the MMS seg-ment decreased by 4.7% compared with the prior yeardue to not having a current year counterpart to a large1999 project.
Direct costs increased $27.2 million (11.7%) to $260.9million for fiscal 2000 from $233.7 million for 1999.On a segment basis, CRS direct costs increased $22.2million to $173.5 million for fiscal 2000 from $151.3million; PCG direct costs increased $10.8 million to$52.0 million from $41.2 million; and MMS direct costsdecreased $5.8 million to $35.4 million from $41.2 mil-lion. The higher direct costs for CRS and PCG wereprimarily due to an increased level of hiring and personnelcosts coupled with related facilities and information systems costs necessary to support growth in realizedand expected levels of operations. As a percentage of netrevenue, direct costs increased to 66.1% and 78.1% infiscal 2000 from 63.2% and 71.5% in 1999 for CRSand PCG, respectively. Direct costs for MMS decreasedas a percentage of net revenue to 72.3% in fiscal 2000from 80.2% in 1999 due to improved cost managementand the absence of certain wind-down costs incurred ona project in fiscal 1999 (see above).
Selling, general and administrative (“SG&A”) expensesincreased by $7.3 million (10.1%) to $79.0 million forfiscal 2000 from $71.7 million in 1999. This rise wasprimarily due to increased personnel hiring and facilitiescosts directly connected to the infrastructure build-uprequired to accommodate the Company’s realized andexpected growth. As a percentage of net revenue, SG&Aexpenses increased to 20.9% in fiscal 2000 from 20.6%in fiscal 1999.
Depreciation and amortization expense increased $3.7million (20.4%) to $21.6 million for fiscal 2000 from$17.9 million for fiscal 1999. This increase was primarilydue to an increase in capital spending on informationtechnology and facility improvements necessary to sup-port higher operating levels. In addition, the Companyrecorded accelerated depreciation charges in conjunctionwith the reduction in estimated useful lives of leaseholdimprovements on abandoned facilities related to theCompany’s restructuring efforts. As a percentage of netrevenue, depreciation and amortization expense increasedto 5.7% in fiscal 2000 from 5.1% in fiscal 1999.

13P A R E X E L A N N U A L R E P O R T 2 0 0 0
Management’s Discussion and Analysis of Financial Condition and Results of Operations
Income from operations decreased $16.9 million (82.4%)to $3.6 million in fiscal 2000 from $20.6 million in fiscal1999. Excluding restructuring and other charges, incomefrom operations decreased $11.0 million (38.3%) to$17.7 million for fiscal 2000 from $28.7 million in fiscal1999. Excluding the impact of these charges, incomefrom operations decreased to 4.7% of net revenue forfiscal 2000 from 8.2% in 1999, primarily due to higherdirect and SG&A expenses, as noted on page 12.
Interest income increased $1.4 million in fiscal 2000 primarily due to higher average cash balances and the mixbetween taxable and tax-exempt securities held duringthe year. Other income increased $1.6 million primarilydue to realized foreign exchange gains and the sale of aminority investment in a company.
The Company’s effective income tax rate increased to45.4% in fiscal 2000 from 34.8% in fiscal 1999. Thisincrease was primarily attributable to changes in the mixof taxable income within the different geographic juris-dictions in which the Company operated in fiscal 2000compared with fiscal 1999.
Fiscal Year Ended June 30, 1999 Compared to Fiscal Year Ended June 30, 1998Net revenue increased $63.0 million (22.1%) to $348.5million for fiscal 1999 from $285.4 million for 1998. Ona segment basis, fiscal 1999 net revenues from CRS andPCG of $239.5 million and $57.6 million increased by$51.5 million (27.4%) and $11.8 million (25.8%), respec-tively, over the prior year. Fiscal 1999 net revenues fromMMS of $51.4 million were flat compared to the prioryear. Net revenue growth from fiscal 1998 was primarilythe result of an increase in the volume of projects servicedby the Company.
Direct costs increased $47.9 million (25.8%) to $233.7million for fiscal 1999 from $185.8 million for 1998. Ona segment basis, CRS direct costs increased $34.8 millionto $151.3 million for fiscal 1999 from $116.5 million;PCG direct costs increased $7.8 million to $41.2 millionfrom $33.4 million; and MMS direct costs increased $5.3million to $41.2 million from $35.9 million. Theseincreases in direct costs were principally due to the increasein hiring and personnel costs along with related facilitiesand information systems costs necessary to support current and future increased levels of operations. As apercentage of net revenue, direct costs increased to67.8% in fiscal 1999 from 65.1% in fiscal 1998, reflectingan increase in the overall operational capacity.
SG&A expenses increased by $10.7 million (17.5%) to$71.7 million for fiscal 1999 from $61.0 million for
1998. This increase was mainly due to increased sellingand administrative personnel hiring and facilities costs,as a result of building infrastructure to accommodatethe Company’s growth. As a percentage of net revenue,SG&A expenses decreased to 20.6% in fiscal 1999 from21.4% in fiscal 1998.
Depreciation and amortization expense increased $2.8million (18.6%) to $17.9 million for fiscal 1999 from$15.1 million for fiscal 1998. This increase was largelycaused by an increase in capital spending on informationtechnology, facility improvements and furnishings nec-essary to support an increased level of operations. As apercentage of net revenue, depreciation and amortiza-tion expense decreased to 5.1% in fiscal 1999 from 5.3%in fiscal 1998.
Income from operations increased $7.3 million (54.6%)to $20.6 million in fiscal 1999 from $13.3 million in fiscal1998. Excluding merger-related and facilities charges of$4.7 million in fiscal 1999 and $10.3 million in fiscal1998, income from operations increased $1.6 million(7.0%) to $25.2 million for fiscal 1999 from $23.6 millionin fiscal 1998. Excluding the impact of these charges,income from operations decreased to 7.2% of net revenuefor fiscal 1999 from 8.3% in 1998, primarily due to anincrease in direct costs and SG&A expenses as noted above.
Interest income decreased $0.5 million in fiscal 1999 primarily due to lower interest rates obtained due to ashift to tax-exempt securities in the second half of fiscal1998, partially offset by a shift back to taxable securitiesin the third quarter of fiscal 1999.
The Company’s effective income tax rate decreased to34.8% in fiscal 1999 from 45.2% in fiscal 1998.Excluding the effect of certain non-deductible merger-related charges, the effective tax rate for fiscal 1998would have been 36.2%. This decrease was attributableto changes in the mix of taxable income from the dif-ferent geographic jurisdictions in which the Companyoperated in fiscal 1999 compared with fiscal 1998.
LIQUIDITY AND CAPITAL RESOURCESSince its inception, the Company has financed its oper-ations and growth, including acquisition costs, with cashflows from operations and the proceeds from the sale ofequity securities. Investing activities primarily reflectacquisition costs and capital expenditures for informationsystems enhancements and leasehold improvements.
The Company’s clinical research and development contracts are generally fixed price with some variable

14 P A R E X E L A N N U A L R E P O R T 2 0 0 0
Management’s Discussion and Analysis of Financial Condition and Results of Operations
components and range in duration from a few months to several years. The cash flows from contracts typicallyconsist of a down payment required at the time the contract is signed and the balance in installments over the contract’s duration, usually on a milestone-achievementbasis. Revenue from contracts is recognized on apercentage-of-completion basis as the work is performed.Accordingly, cash receipts do not necessarily correspondto costs incurred and revenue recognized on contracts.
The Company’s operating cash flow is heavily influencedby changes in the levels of billed and unbilled receivablesand advance billings. These account balances and the number of days’ revenue outstanding in accountsreceivable, net of advance billings, can vary based oncontractual milestones and the timing and size of cashreceipts. The number of days’ sales outstanding inaccounts receivable, net of advance billings, was 60 daysat June 30, 2000 and 1999. Accounts receivable, net ofthe allowance for doubtful accounts, increased to $161.4million at June 30, 2000 from $150.5 million at June30, 1999. Advance billings increased to $78.7 million atJune 30, 2000 from $69.8 million at June 30, 1999.
During fiscal 2000, the Company’s operations providednet cash of $29.6 million, an increase of $0.5 millionfrom the corresponding fiscal 1999 amount. Cash flowsfrom net income adjusted for non-cash activity provided$29.1 million during fiscal 2000, down $3.8 millionfrom the corresponding fiscal 1999 amount. Changes innet operating assets provided $0.6 million in cash duringfiscal 2000, primarily due to an increase in advancebillings and other current liabilities partially offset by an increase in accounts receivable. In comparison, forfiscal 1999, the change in net operating assets used $3.8million in cash.
Net cash used by investing activities totaled $33.1 millionfor fiscal 2000 as compared with $8.4 million used byinvesting activities in fiscal 1999. The primary use ofnet cash for investing activities represented purchase ofproperty and equipment of $20.1 million related tofacility expansions and investments in information technology in fiscal 2000, as compared to $18.9 millionin fiscal 1999. Net purchases of marketable securitieswere $9.4 million in fiscal 2000, as compared to netmarketable security sales of $9.6 million in fiscal 1999.
Net cash used by financing activities totaled $4.6 millionfor fiscal 2000 as compared to $2.8 million provided byfinancing activities in fiscal 1999. Under a stock repur-chase program approved by the Board of Directors inSeptember 1999, the Company acquired 631,000 shares
of its common stock at a total cost of $6.2 million. Thisspending was partially offset by $2.4 million in proceedsfrom the issuance of common stock through stockoption exercises and the employee stock purchase plan.The Company has domestic and foreign lines of creditwith banks totaling approximately $3.2 million. At June30, 2000, the Company had approximately $2.4 millionin available credit under these arrangements.
The Company’s primary cash needs are for the paymentof salaries and fringe benefits, hiring and recruitingexpenses, business development costs, acquisition-relatedcosts, capital expenditures and facility-related expenses.The Company believes that its existing capital resourcestogether with cash flows from operations and borrowingcapacity under existing lines of credit will be sufficient to meet its foreseeable cash needs. In the future, theCompany will consider acquiring businesses to enhanceits service offerings, expand its therapeutic expertiseand/or increase its global presence. Any such acquisi-tions may require additional external financing, and theCompany may from time to time seek to obtain fundsfrom public or private issuances of equity or debt secu-rities. There can be no assurance that such financing willbe available on terms acceptable to the Company.
The statements included in this Annual Report, includ-ing “Management’s Discussion and Analysis of FinancialCondition and Results of Operations,” may contain“forward-looking” statements, within the meaning ofSection 27A of the Securities Act of 1933 and Section21E of the Securities Exchange Act of 1934, regardingfuture results and events that involve a number of risksand uncertainties, including the adequacy of theCompany’s existing capital resources and future cashflows from operations, and statements regardingexpected financial results, future growth and customerdemand. For this purpose, any statements that are notstatements of historical fact may be deemed forward-looking statements. Without limiting the foregoing, thewords “believes,” “anticipates,” “plans,” “expects,”“intends” and similar expressions are intended to identifyforward-looking statements. The Company’s actualfuture results may differ significantly from the resultsdiscussed in the forward-looking statements. Importantfactors that might cause such a difference include, butare not limited to, risks associated with: the cancellation,revision, or delay of contracts, including those contractsin backlog; the Company’s dependence on certain indus-tries and clients; the Company’s ability to managegrowth and its ability to attract and retain employees;the Company’s ability to complete additional acquisitions

15P A R E X E L A N N U A L R E P O R T 2 0 0 0
Management’s Discussion and Analysis of Financial Condition and Results of Operations
and to integrate newly acquired businesses or enter intonew lines of business; government regulation of certainindustries and clients; competition and consolidationwithin the pharmaceutical industry; the potential for significant liability to clients and third parties; the poten-tial adverse impact of health care reform; and the effectsof exchange rate fluctuations. These factors and othersare discussed more fully in the section entitled “RiskFactors” of the Company’s Annual Report on Form 10-Kfor the year ended June 30, 2000.
MARKET RISKMarket risk is the potential loss arising from adversechanges in the market rates and prices, such as foreigncurrency rates, interest rates and other relevant marketrate or price changes. In the ordinary course of business,the Company is exposed to various market risks, includingchanges in foreign currency exchange rates and interestrates, and the Company regularly evaluates its exposureto such changes. The Company’s overall risk manage-ment strategy seeks to balance the magnitude of theexposure and the costs and availability of appropriatefinancial instruments. The Company occasionally purchases securities with seven-day put options thatallow the Company to sell the underlying securities in seven days at par value. The Company uses thesederivative financial instruments on a limited basis toshorten contractual maturity dates, thereby managinginterest rate risk. The Company does not hold derivativeinstruments for trading purposes.
Foreign Currency Exchange RatesThe Company derived approximately 40% of its net revenue for fiscal 2000, 43% of its net revenue for fiscal 1999 and 39% of its net revenue for fiscal 1998,from operations outside of North America. TheCompany does not have significant operations in countries in which the economy is considered to behighly inflationary. The Company’s financial statementsare denominated in U.S. dollars, and accordingly,changes in the exchange rate between foreign currenciesand the U.S. dollar will affect the translation of such sub-sidiaries’ financial results into U.S. dollars for purposesof reporting the Company’s consolidated financial results.
The Company may be subject to foreign currency trans-action risk when the Company’s foreign subsidiariesenter into contracts denominated in the local currencyof the foreign subsidiary. Because expenses of the foreignsubsidiaries are generally paid in the local currency, suchforeign subsidiaries’ local currency earnings are notmaterially affected by fluctuations in exchange rates.
In cases where the Company contracts for a multi-country clinical trial and a significant portion of the con-tract expenses are in a currency other than the contract currency, the Company seeks to contractually shift to itsclient the effect of fluctuations in the relative values ofthe contract currency and the currency in which theexpenses are incurred. To the extent the Company isunable to shift the effects of currency fluctuations to itsclients, these fluctuations could have a material effecton the Company’s results of operations. The Companyoccasionally hedges against the risk of exchange ratefluctuations between the G.B. pound and the U.S. dollar for three month periods.
INFLATIONThe Company believes the effects of inflation generallydo not have a material adverse impact on its operationsor financial condition.
RECENTLY ISSUED ACCOUNTING STANDARDSIn December 1999, the Securities and ExchangeCommission issued Staff Accounting Bulletin 101,“Revenue Recognition” (“SAB 101”). SAB 101 summa-rizes certain of the SEC staff ’s views in applying generally accepted accounting principles to selected revenue recognition issues in financial statements. SAB101, which was delayed by the issuance of SAB 101A onMarch 27, 2000 and SAB 101B on June 26, 2000, mustnow be implemented by the Company by the fourthquarter of fiscal 2001. The Company is currently in theprocess of evaluating the impact, if any, that SAB 101will have on its consolidated financial position or resultsof operations.

FOR THE YEARS ENDED JUNE 30,
($ in thousands, except per share data) 2000 1999 1998
NET REVENUE $378,150 $348,486 $285,442Cost and Expenses:
Direct costs 260,885 233,650 185,718Selling, general and administrative 78,965 71,690 61,036Depreciation and amortization 21,583 17,932 15,114Restructuring and other charges 13,088 4,650 10,273
374,521 327,922 272,141
INCOME FROM OPERATIONS 3,629 20,564 13,301
Interest income 4,370 3,018 3,511Interest expense (312) (351) (195)Other income (expense), net 2,358 720 382
6,416 3,387 3,698
Income before provision for income taxes 10,045 23,951 16,999Provision for income taxes 4,560 8,329 7,680
NET INCOME $ 5,485 $ 15,622 $ 9,319
Earnings per share:Basic $ 0.22 $ 0.63 $ 0.39Diluted $ 0.22 $ 0.62 $ 0.38
Weighted average shares outstanding:Basic 24,981 24,848 23,939Diluted 25,140 25,128 24,825
THE ACCOMPANYING NOTES ARE AN INTEGRAL PART OF THE CONSOLIDATED FINANCIAL STATEMENTS.
16 P A R E X E L A N N U A L R E P O R T 2 0 0 0
Consolidated Statements of Operations

Consolidated Balance Sheets
17P A R E X E L A N N U A L R E P O R T 2 0 0 0
JUNE 30,
($ in thousands, except share data) 2000 1999
ASSETSCurrent assets:
Cash and cash equivalents $ 53,191 $ 62,005Marketable securities 37,022 27,952Accounts receivable, net 161,447 150,520Prepaid expenses 10,186 7,917Deferred tax assets 15,370 14,011Other current assets 1,874 2,421
Total current assets 279,090 264,826Property and equipment, net 43,783 47,065Other assets 28,046 21,674
Total assets $350,919 $333,565
LIABILITIES AND STOCKHOLDERS’ EQUITYCurrent liabilities:
Notes payable and current portion of long-term debt $ 269 $ 1,057Accounts payable 20,979 14,698Advance billings 78,743 69,776Other current liabilities 51,353 46,538
Total current liabilities 151,344 132,069Long-term debt 104 79Other liabilities 9,318 9,385
Total liabilities $160,766 $141,533
Commitments (Note 14)
Stockholders’ equity:Preferred stock – $.01 par value; shares authorized: 5,000,000;
none issued and outstanding – –Common stock – $.01 par value; shares authorized: 50,000,000 at
June 30, 2000 and 1999; shares issued: 25,399,570 at June 30, 2000 and 25,132,461 at June 30, 1999; shares outstanding: 24,719,158 at June 30, 2000 and 25,103,049 at June 30, 1999 254 251
Additional paid-in capital 162,057 159,593Treasury stock, at cost (6,424) (18)Retained earnings 41,270 35,785Accumulated other comprehensive loss (7,004) (3,579)
Total stockholders’ equity 190,153 192,032Total liabilities and stockholders’ equity $350,919 $333,565
THE ACCOMPANYING NOTES ARE AN INTEGRAL PART OF THE CONSOLIDATED FINANCIAL STATEMENTS.

18
Retained AccumulatedCommon Stock Additional Treasury Earnings Other Total
Number Par Paid-in Stock, (Accumulated Comprehensive Stockholders’ Comprehensive($ in thousands, except share data) Of Shares Value Capital At Cost Deficit) Income (Loss) Equity Income
BALANCE AT JUNE 30, 1997 23,991,670 $240 $136,567 $ (18) $11,488 $ (829) $147,448 $11,629
Shares issued under stockoption/purchase plans 420,120 4 7,803 7,807
Deferred compensation 2,198 2,198Income tax benefit from
exercise of stock options 2,400 2,400Acquisitions (Note 3) 216,435 2 1,227 311 1,540Acquisition costs reimbursed
by shareholders 300 300Elimination of PPS and MIRAI
net activity duplicated for the six months ended November 30, and December 31, 1997, respectively (Note 3) (556) (1,040) (1,596)
Effect of change in fiscal year of foreign operation (Note 2) 85 85
Net unrealized loss on marketable securities (140) (140) (140)
Foreign currency translation (981) (981) (981)Net income 9,319 9,319 9,319
BALANCE AT JUNE 30, 1998 24,628,225 246 149,939 (18) 20,163 (1,950) 168,380 8,198
Shares issued under stock option/purchase plans 275,256 3 4,145 4,148
Income tax benefit from exercise of stock options 765 765
Acquisition (Note 3) 199,568 2 4,744 4,746Net unrealized loss on
marketable securities (4) (4) (4)Foreign currency translation (1,625) (1,625) (1,625)Net income 15,622 15,622 15,622
BALANCE AT JUNE 30, 1999 25,103,049 251 159,593 (18) 35,785 (3,579) 192,032 13,993
Shares issued under stock option/purchase plans 267,109 3 2,354 2,357
Income tax benefit from exercise of stock options 110 110
Shares repurchased (651,000) (6,406) (6,406)Net unrealized gain on
marketable securities 2 2 2Foreign currency translation (3,427) (3,427) (3,427)Net income 5,485 5,485 5,485
BALANCE AT JUNE 30, 2000 24,719,158 $254 $162,057 $(6,424) $41,270 $(7,004) $190,153 $ 2,060
THE ACCOMPANYING NOTES ARE AN INTEGRAL PART OF THE CONSOLIDATED FINANCIAL STATEMENTS.
P A R E X E L A N N U A L R E P O R T 2 0 0 0
Consolidated Statements of Stockholders’ Equity

Consolidated Statements of Cash Flows
19P A R E X E L A N N U A L R E P O R T 2 0 0 0
FOR THE YEARS ENDED JUNE 30,
($ in thousands) 2000 1999 1998
CASH FLOWS FROM OPERATING ACTIVITIES:Net income $ 5,485 $ 15,622 $ 9,319Adjustments to reconcile net income to net
cash provided (used) by operating activities:Depreciation and amortization 21,934 17,932 15,114Loss (Gain) on disposal of assets 1,638 (647) –Stock compensation charges of acquired companies – – 4,844Change in assets and liabilities, net of effects from acquisitions:
Restricted cash – – 1,967Accounts receivable, net (10,495) (35,970) (26,829)Deferred tax assets (1,359) (6,142) (4,618)Prepaid expenses and other current assets (1,439) 899 (2,691)Other assets (4,955) (5,892) (1,637)Accounts payable 5,506 2,700 498Advance billings 8,784 23,033 (897)Other current liabilities 4,587 11,168 5,022Other liabilities (68) 6,421 (15)
Net cash provided by operating activities 29,618 29,124 77
CASH FLOWS FROM INVESTING ACTIVITIES:Purchase of marketable securities (83,090) (76,641) (118,533)Proceeds from sale of marketable securities 73,670 86,168 148,634Cash of acquired companies – 633 –Purchase of property and equipment (20,067) (18,910) (27,736)Acquisition of a business (3,000) – –Proceeds from sale of assets 587 1,287 –Other investing activities (1,244) (921) (1,377)
Net cash provided (used) by investing activities (33,144) (8,384) 988
CASH FLOWS FROM FINANCING ACTIVITIES:Proceeds from issuance of common stock 2,357 4,148 4,906Payments to repurchase common stock (6,225) – –Net borrowings (repayments) under line of credit (787) 1,057 (866)Repayments of long-term debt 25 (2,378) (100)Dividends paid by acquired companies – – (1,293)
Net cash (used) provided by financing activities (4,630) 2,827 2,647
Elimination of net cash activities of acquired companies for duplicated periods – – 672
Effect of exchange rate changes on cash and cash equivalents (658) (1,503) (1,069)Net (decrease) increase in cash and cash equivalents (8,814) 22,064 3,315Cash and cash equivalents at beginning of year 62,005 39,941 36,626Cash and cash equivalents at end of year $ 53,191 $ 62,005 $ 39,941
SUPPLEMENTAL DISCLOSURES OF CASH FLOW INFORMATION:Cash paid during the year for:
Interest $ 22 $ 84 $ 188Income taxes $ 14,159 $ 7,201 $ 4,730
SUPPLEMENTAL DISCLOSURES OF NON-CASHINVESTING AND FINANCING ACTIVITIES:
Income tax benefit from exercise of stock options $ 110 $ 765 $ 2,400Common stock issued in connection with acquisitions $ – $ 4,746 $ 3,928
THE ACCOMPANYING NOTES ARE AN INTEGRAL PART OF THE CONSOLIDATED FINANCIAL STATEMENTS.

20 P A R E X E L A N N U A L R E P O R T 2 0 0 0
Notes to Consolidated Financial Statements
NOTE 1 DESCRIPTION OF BUSINESSThe Company is a leading contract research organizationproviding a broad range of knowledge-based productdevelopment and product launch services on a contractbasis to the worldwide pharmaceutical, biotechnology andmedical device industries. The Company has developedexpertise in such disciplines as: clinical trials management,biostatistical analysis and data management, medical marketing, clinical pharmacology, regulatory and medicalconsulting, industry training and publishing and other drugdevelopment consulting services.
NOTE 2 SUMMARY OF SIGNIFICANTACCOUNTING POLICIESBasis of Presentation and Principles of ConsolidationThe consolidated financial statements include the accountsof PAREXEL International Corporation and its wholly-owned subsidiaries. All significant intercompany accountsand transactions have been eliminated. In fiscal year 1998,the Company’s German subsidiary changed its fiscal yearend from May 31 to June 30 in order to conform to theCompany’s fiscal year end. Results of operations for themonth ended June 30, 1998, were credited directly toRetained Earnings.
Accounting EstimatesThe preparation of financial statements in conformitywith generally accepted accounting principles requires management to make estimates and assumptions thataffect the reported amounts of assets, liabilities, revenuesand expenses and disclosures of contingent assets andliabilities. Actual results may differ from those estimates.
RevenueFixed price contract revenue is recognized using thepercentage-of-completion method based on the ratio thatcosts incurred to date bear to estimated total costs atcompletion. Revenue from other contracts is recognizedas services are provided. Revenue related to contract mod-ifications is recognized when realization is assured andthe amounts are reasonably determinable. Adjustmentsto contract cost estimates are made in the periods inwhich the facts that require the revisions become known.When the revised estimate indicates a loss, such loss isprovided in the current period in its entirety. Unbilledaccounts receivable represents revenue recognized inexcess of amounts billed. Advance billings representamounts billed in excess of revenue recognized.
As is customary in the industry, the Company routinelysubcontracts with independent physician investigatorsin connection with clinical trials and other third party
service providers for laboratory analysis and other specialized services. Revenues and expenses are reportednet of these fees since such fees are granted by customerson a “pass-through basis” without risk or reward to the Company.
Cash, Cash Equivalents, Marketable Securities andFinancial InstrumentsThe Company considers all highly liquid investmentspurchased with original maturities of three months orless to be cash equivalents. Marketable securities includesecurities purchased with original maturities of greaterthan three months. Cash equivalents and marketablesecurities are classified as “available for sale” and arecarried at fair market value. Unrealized gains and lossesare recorded as part of stockholders’ equity.
The Company occasionally purchases securities withseven-day put options that allow the Company to sell theunderlying securities in seven days at par value. TheCompany uses these derivative financial instruments ona limited basis to shorten contractual maturity dates,thereby managing interest rate risk. Approximately $3.9million of securities held at June 30, 2000 were subject toseven-day put options; no securities held at June 30, 1999were subject to such put options. The Company does nothold derivative instruments for trading purposes.
The fair value of the Company’s financial instrumentsare not materially different from their carrying amountsat June 30, 2000 and 1999.
Concentration of Credit RiskFinancial instruments which potentially expose theCompany to concentrations of credit risk include tradeaccounts receivable. However, such risk is limited due to the large number of clients and their international dispersion. In addition, the Company maintains reservesfor potential credit losses and such losses, in the aggregate,have not exceeded management expectations. One cus-tomer, Novartis, accounted for 21%, or $80.9 million, ofconsolidated net revenue for fiscal 2000, primarily in theclinical research services group. In fiscal 1999, the samecustomer accounted for 20% of consolidated net revenue.
Property and EquipmentProperty and equipment is stated at cost. Depreciation isprovided on the straight-line method based on estimateduseful lives of 40 years for buildings, 3 to 8 years forcomputer hardware and software and 5 years for officefurniture, fixtures and equipment. Leasehold improve-ments are amortized over the lesser of the estimated usefullives of the improvements or the remaining lease term.Repair and maintenance costs are expensed as incurred.

21P A R E X E L A N N U A L R E P O R T 2 0 0 0
Notes to Consolidated Financial Statements
Intangible AssetsIntangible assets consist principally of goodwill, customerlists, covenants not to compete and other intangible assetsattributable to acquired businesses. Goodwill representsthe excess of the cost of businesses acquired over the fairvalue of the related net assets at the date of acquisition foracquisitions accounted for under the purchase method.Intangible assets are amortized using the straight-linemethod over their expected useful lives ranging from fiveto twenty-five years.
Intangible assets of $13.1 million and $13.3 million,included in Other Assets, are net of accumulated amorti-zation of $1.6 million and $1.8 million as of June 30,2000 and 1999, respectively. Amortization expense was$1.5 million, $0.6 million and $0.4 million for the fiscalyears ended June 30, 2000, 1999 and 1998, respectively.
Comprehensive IncomeIn fiscal 1999, the Company adopted Statement ofFinancial Accounting Standards (“SFAS”) No. 130,“Reporting Comprehensive Income.” SFAS No. 130established new standards for the reporting and displayof comprehensive income and its components. SFAS No.130 requires the Company’s foreign currency translationadjustments and unrealized gains (losses) on marketablesecurities, which prior to adoption were reported sepa-rately in stockholders’ equity, to be included in other com-prehensive income. The Company presents comprehensiveincome in its Consolidated Statement of Stockholders’Equity. The adoption of SFAS No. 130 had no impact onthe Company’s net income or stockholders’ equity.
Income TaxesDeferred income tax assets and liabilities are recognizedfor the expected future tax consequences, utilizing currenttax rates, of temporary differences between the carryingamounts and the tax bases of assets and liabilities.Deferred tax assets are recognized, net of any valuationallowance, for the estimated future tax effects of deductibletemporary differences and tax operating loss and creditcarryforwards. Deferred income tax expense represents thechange in the net deferred tax asset and liability balances.
Foreign CurrencyAssets and liabilities of the Company’s internationaloperations are translated into U.S. dollars at exchangerates in effect at the balance sheet date. Income andexpense items are translated at average exchange rates ineffect during the year. Translation adjustments are accu-mulated in a separate component of stockholders’ equity.
Earnings Per ShareEarnings per share has been calculated in accordancewith SFAS No. 128, “Earnings per Share.” Basic earningsper share is calculated based on the weighted averagenumber of common shares outstanding during theperiod. Diluted earnings per share is calculated based onthe weighted average number of common shares anddilutive common equivalent shares assumed outstandingduring the period.
Stock-Based CompensationThe Company accounts for employee stock awards usingthe intrinsic value based method as prescribed byAccounting Principles Board Opinion No. 25, “Accountingfor Stock Issued to Employees.” Accordingly, no compen-sation expense is recognized because the exercise price ofthe Company’s stock options was equal to the market priceof the underlying stock on the date of grant. The Companyhas adopted the provisions of SFAS No. 123, “Accountingfor Stock-based Compensation,” for disclosure only.
ReclassificationsCertain 1999 amounts have been reclassified to conformwith the fiscal 2000 presentation.
Recently Issued Accounting StandardsIn December 1999, the Securities and ExchangeCommission issued Staff Accounting Bulletin 101,“Revenue Recognition” (“SAB 101”). SAB 101 summarizescertain of the SEC staff’s views in applying generallyaccepted accounting principles to selected revenue recog-nition issues in financial statements. SAB 101, which wasdelayed by the issuance of SAB 101A on March 27, 2000and SAB 101B on June 26, 2000, must now be implementedby the Company by the fourth quarter of fiscal 2001. TheCompany is currently in the process of evaluating theimpact, if any, SAB 101 will have on its consolidated finan-cial position or results of operations.
NOTE 3 ACQUISITIONSFiscal 2000On September 1, 1999, the Company acquired CEMAFS.A., a leading Phase I clinical research and bioanalyticallaboratory located in Poitiers, France. The Companyacquired the business and related facilities for an initialcash payment of approximately $3.0 million in a trans-action accounted for as a purchase business combination.In connection with this transaction, the Company paidapproximately an additional $3.0 million to purchase cer-tain buildings in May 2000. This amount is reflected inproperty and equipment on the Company’s balance sheetas of June 30, 2000. In accordance with the terms of the

22 P A R E X E L A N N U A L R E P O R T 2 0 0 0
Notes to Consolidated Financial Statements
asset purchase agreement, the Company is obligated tomake additional payments in contingent purchase priceif CEMAF achieves certain established annual earningstargets in each fiscal year through June 30, 2002. Nopayments were required in fiscal 2000. The remainingmaximum contingent obligation is $3.2 million. In con-nection with recording the assets and liabilities acquired,the Company recorded a charge of approximately $2.4million related to the excess cost over the fair value ofthe net assets acquired. This goodwill is being amortizedusing the straight-line method over 25 years. Pro formaresults of operations of the Company, assuming thisacquisition was recorded at the beginning of each periodpresented, would not be materially different from actualresults presented.
Fiscal 1999On March 31, 1999, the Company acquired the stock ofGroupe PharMedicom S.A. in exchange for approximately199,600 shares of the Company’s common stock in atransaction accounted for as a purchase business combi-nation. Groupe PharMedicom S.A. is a leading Frenchprovider of post-regulatory services to pharmaceuticalmanufacturers. The Company recorded approximately$8.5 million related to the excess cost over the fair value ofthe net assets acquired. This goodwill is being amortizedusing the straight-line method over 25 years. Pro formaresults of operations of the Company, assuming thisacquisition was recorded at the beginning of each periodpresented, would not be materially different from actualresults presented.
Fiscal 1998In March 1998, the Company acquired four companies inseparate transactions. PPS Europe Limited, subsequentlyrenamed PAREXEL MMS Europe Limited (“MMSEurope”), a leading medical marketing firm based in theUnited Kingdom, was acquired by the issuance of2,774,813 shares of the Company’s common stock inexchange for all of the outstanding ordinary shares of PPSand 134,995 of the Company’s common stock options inexchange for all of the outstanding ordinary share optionsof PPS. MIRAI B.V. (“MIRAI”), a full service, pan-European contract research organization based in theNetherlands, was acquired by the issuance of 682,345shares of the Company’s common stock in exchange forall of the outstanding shares of MIRAI. The Companyacquired Genesis Pharma Strategies Limited (“Genesis”), aphysician-focused marketing and clinical communicationsfirm servicing the international pharmaceutical industry,and LOGOS GmbH (“LOGOS”), a provider of regulatory
services to pharmaceutical manufacturers, by issuing atotal of 184,819 shares of the Company’s common stockin exchange for all of the outstanding shares of Genesisand LOGOS. In December 1997, the Company acquiredKemper-Masterson, Inc. (“KMI”), a leading regulatoryconsulting firm based in Massachusetts, by issuing 581,817shares of the Company’s common stock in exchange forall of the outstanding shares of KMI.
All of the above fiscal 1998 acquisitions were accountedfor as poolings of interests. The Company’s historicalconsolidated financial statements have been restated toinclude the financial position and results of operationsof MMS Europe, MIRAI and KMI for all periods priorto the acquisitions. The historical results of operationsand financial position of Genesis and LOGOS are notmaterial, individually or in aggregate, to the Company’shistorical financial statements. Therefore, prior periodamounts have not been restated and results of operationsof Genesis and LOGOS have been included in the consol-idated results since acquisition.
In March 1998, the Company changed the fiscal year endof PPS from November 30 to May 31 and the fiscal yearends of MIRAI and KMI from December 31 to June 30. Assuch, the statement of operations for the fiscal year endedJune 30, 1998, includes the results of operations of MMSEurope and MIRAI for the twelve months ended May 31and June 30, 1998, respectively. As a result of conformingfiscal year ends, the results of operations of MMS Europeand MIRAI for the six months ended November 30 andDecember 31, 1997, respectively, are duplicated in the com-bined statements of operations for fiscal 1997 and 1998.KMI’s results of operations for the six months endedDecember 31, 1996, (including revenue, operating incomeand net income of $5.0 million, $167,000 and $117,000,respectively) were duplicated in the consolidated statementsof operations for fiscal 1997. Accordingly, net income andequity activity for one of the duplicated periods has beeneliminated from stockholders’ equity.
The following represents the duplicated amounts includedin the results of operations for fiscal 1998:
($ in thousands) MMS Europe MIRAI TOTAL
Net revenue $13,205 $4,891 $18,096Operating income 1,553 438 1,991Net income 697 343 1,040
In connection with the acquisitions during fiscal 1998, theCompany incurred acquisition-related charges of $10.3million consisting principally of non-cash compensation

23P A R E X E L A N N U A L R E P O R T 2 0 0 0
Notes to Consolidated Financial Statements
attributed to stock options of KMI and MMS Europe,granted prior to the acquisition by the Company, anaccelerated compensation payment to a PPS executivepursuant to a pre-existing employment agreement andlegal, accounting and other transaction-related fees. Inaddition, the Company recorded a $1.6 million provisionduring fiscal 1998 which has been reflected in selling,general and administrative expense in the accompanyingconsolidated statement of operations to increase the accounts receivable reserves of PPS and MIRAI toconform reserve estimates with Company policy.
NOTE 4 INVESTMENTSAvailable-for-sale securities included in cash equivalents asof June 30, 2000 and 1999, consisted of the following:
($ in thousands) 2000 1999
Money market instruments $ 2,665 $ 9,869Municipal and corporate debt securities 12,374 4,600Repurchase agreements 10,436 16,143
$25,475 $30,612
Available-for-sale securities included in marketable securi-ties at June 30, 2000 and 1999, consisted of the following:
($ in thousands) 2000 1999
Municipal securities $36,337 $27,261Federal government securities 380 398Corporate debt securities 305 293
$37,022 $27,952
The Company’s investments are reflected at fair marketvalue. During fiscal 2000, gross realized gains totaled $2.2million and gross realized losses totaled $2.0 million.Unrealized gains and losses as of June 30, 1999 and 1998were not material.
NOTE 5 ACCOUNTS RECEIVABLEAccounts receivable at June 30, 2000 and 1999, consistedof the following:
($ in thousands) 2000 1999
Billed $ 89,208 $ 81,590Unbilled 75,939 74,057Allowance for doubtful accounts (3,700) (5,127)
$161,447 $150,520
NOTE 6 PROPERTY AND EQUIPMENTProperty and equipment at June 30, 2000 and 1999,consisted of the following:
($ in thousands) 2000 1999
Computer and office equipment $ 48,914 $46,850Computer software 19,445 16,206Furniture and fixtures 19,283 17,762Leasehold improvements 8,512 7,021Buildings 6,012 2,757Other 1,763 1,854
103,929 92,450Less accumulated depreciation
and amortization 60,146 45,385$ 43,783 $47,065
Depreciation and amortization expense relating to prop-erty and equipment was $20.1 million, $17.3 million and$14.7 million for the years ended June 30, 2000, 1999and 1998, respectively, of which $1.2 million in fiscal1998 related to amortization of property and equipmentunder capital leases. The depreciation expense for theyear ended June 30, 2000 includes $1.0 million of accel-erated depreciation due to the restructuring charge takenin the third quarter of fiscal 2000 and the consequentchanges in the estimated useful lives of leaseholdimprovements on abandoned leased facilities.
In fiscal 1998, the Company recorded a $1.7 millioncharge to depreciation and amortization expense resultingfrom a change in estimate of the remaining service lives ofcertain computer equipment arising from integrationactivities associated with acquisitions and a company-wide program implemented to upgrade and standardizeits information technology platform.
NOTE 7 OTHER CURRENT LIABILITIESOther current liabilities at June 30, 2000 and 1999, consisted of the following:
($ in thousands) 2000 1999
Accrued compensation and withholding $16,240 $14,645
Income taxes payable 11,834 10,328Other 23,279 21,565
$51,353 $46,538

24 P A R E X E L A N N U A L R E P O R T 2 0 0 0
Notes to Consolidated Financial Statements
NOTE 8 RESTRUCTURING AND OTHER CHARGESDuring the year ended June 30, 2000, the Companyrecorded restructuring and other charges of $13.1 million.These charges included $7.2 million of employee sever-ance costs related to the Company’s decision to eliminateapproximately 475 managerial and staff positions inorder to reduce personnel costs as a result of a materialdollar volume of contract cancellations. The charges alsoincluded $4.3 million for lease termination costs relatedto continued efforts to consolidate certain facilities andto reduce excess space in certain locations, in addition tochanges in the Company’s original estimate of when cer-tain facilities would be sublet. The remaining charges,totaling $1.6 million, primarily related to the write-off ofcertain intangible assets and other investments, which arenot expected to produce future value. In addition, theCompany is planning to further consolidate facilities togain further cost savings. The Company plans to take anadditional facilities related charge of between $5 and $10million in the first quarter of fiscal 2001. Overall, theCompany anticipates these restructuring and othercharges will result in aggregate cost savings of $15 to $20million once implemented.
During the three months ended June 30, 1999, theCompany recorded a $2.8 million charge in connectionwith the centralization of certain facilities. The chargeconsisted of future non-cancellable lease payments partially offset by estimated sublease income. Currentyear activity against the restructuring and other chargesaccrual (which is included in “Other current liabilities”in the Consolidated Balance Sheet) was as follows:
Balance, Balance,June 30, Net June 30,
(in thousands) 1999 Provisions Charges 2000
Employee severance costs $ – $ 7,157 $(2,974) $4,183
Facilities related charges 2,557 4,317 (1,898) 4,976
Other charges – 1,614 (1,629) (15)$2,557 $13,088 $(6,501) $9,144
NOTE 9 CREDIT ARRANGEMENTSThe Company has domestic and foreign lines of creditwith banks totaling approximately $3.2 million. Thelines are collateralized by accounts receivable and fixedassets, are payable on demand and bear interest at ratesranging from 1.1% to 9.0%. The lines of credit expire atvarious dates through December 2000 and are renewable.At June 30, 2000, $0.8 million was outstanding underthese lines of credit and included in notes payable. AtJune 30, 2000, $2.4 million was available under theselines of credit.
NOTE 10 STOCKHOLDERS’ EQUITYAs of June 30, 2000 and 1999, there were five millionshares of preferred stock, $0.01 per share, authorized; butnone were issued or outstanding. Preferred stock may beissued at the discretion of the Board of Directors (withoutstockholder approval) with such designations, rights andpreferences as the Board of Directors may determine.
In September 1999, the Board of Directors approved astock repurchase program authorizing the purchase of upto $20 million of the Company’s common stock. Therepurchases are made in the open market subject to marketconditions. The Company acquired 651,000 shares at atotal cost of $6.4 million during the year ended June 30,2000. As of June 30, 2000, $0.2 million of the $6.4 millionwas accrued for the repurchase of 20,000 shares.
NOTE 11 EARNINGS PER SHAREThe following table is a summary of shares used in calculating basic and diluted earnings per share:
YEARS ENDED JUNE 30,
(in thousands) 2000 1999 1998
Weighted average number of shares outstanding, used in computing basic earnings per share 24,981 24,848 23,939
Contingently issuable common shares – – 381
Dilutive common stock options 159 280 505Weighted average shares
used in computing diluted earnings per share 25,140 25,128 24,825
NOTE 12 STOCK AND EMPLOYEE BENEFIT PLANSThe Stock Option Committee of the Board of Directors isresponsible for administration of the Company’s stockoption plans and determines the term of each option, theoption exercise price, the number of option shares grantedand the rate at which options become exercisable.
1998 Stock PlanIn February 1998, the Company adopted the 1998 Non-qualified, Non-officer Stock Option Plan (the “1998Plan”) which provides for the grant of non-qualifiedoptions to purchase up to an aggregate of 500,000shares of common stock to any employee or consultantof the Company who is not an executive officer or directorof the Company. In January 1999, the Company’s Boardof Directors approved an increase in the number ofshares issuable under the 1998 Plan to 1,500,000 shares.Options under the 1998 Plan expire in eight years fromthe date of grant and vest at dates ranging from theissuance date to five years.

25P A R E X E L A N N U A L R E P O R T 2 0 0 0
Notes to Consolidated Financial Statements
1995 Stock PlanThe 1995 Stock Plan (“1995 Plan”) provides for the grantof incentive stock options for the purchase of up to anaggregate of 3,160,344 shares of common stock to direc-tors, officers, employees and consultants to the Company.Options under the 1995 Plan expire in eight years fromthe date of grant and vest over ninety days to five years.
In November 1997, the stockholders of the Companyapproved an amendment to the 1995 Plan. In connectiontherewith, the Company terminated the 1995 Non-Employee Director Stock Option Plan (the “DirectorPlan”) and transferred all remaining shares under theDirector Plan to the 1995 Plan, without increasing theaggregate number of shares available for grant under allof the Company’s stock option plans. In November 1999,the Company’s shareholders approved an amendment to increase the number of shares issuable under the 1995 Planby 800,000 shares. Both the November 1997 andNovember 1999 amendments are reflected in the3,160,344 shares noted above.
Employee Stock Purchase PlanIn September 1995, the Company adopted the 1995Employee Stock Purchase Plan (the “Purchase Plan”).Under the Purchase Plan, employees had the opportunityto purchase common stock at 85% of the average marketvalue on the first or last day of the plan period (asdefined by the Purchase Plan), whichever is lower, up tospecified limits. An aggregate of approximately 600,000shares were issued under the Purchase Plan. The PurchasePlan terminated in fiscal 2000.
In March 2000, the Board of Directors of the Companyadopted the 2000 Employee Stock Purchase Plan (the“2000 Purchase Plan”). Under the 2000 Purchase Plan,employees will have the opportunity to purchase commonstock at 85% of the fair market value on the first day ofthe offering period or last trading day of the purchase
period (all as defined by the 2000 Purchase Plan),whichever is lower, up to specified limits. An aggregateof 800,000 shares may be issued under the 2000Purchase Plan.
Stock Options of Acquired CompaniesAll outstanding options under the Kemper-Masterson,Inc. Stock Option Plan (“KMI Plan”) were exercised inconnection with the acquisition of KMI. KMI recordedcompensation expense of $4.1 million in December 1997as a result of these exercises. In conjunction with theacquisition of MMS Europe, all outstanding MMSEurope options became fully vested, and accordingly the Company recognized compensation expense of $1.6million in March 1998. Aggregate compensation expenseunder the various stock option plans was $5.4 millionfor the year ended June 30, 1998.
Aggregate stock option activity for all plans for the threeyears ended June 30, 2000 is as follows:
WeightedAverage Exercise
Options Price
OUTSTANDING AT JUNE 30, 1997 1,515,799 $13.76Granted 1,011,495 29.78Exercised (332,174) 6.72Canceled (129,585) 24.27
OUTSTANDING AT JUNE 30, 1998 2,065,535 22.13Granted 648,700 22.10Exercised (128,344) 8.35Canceled (227,631) 25.26
OUTSTANDING AT JUNE 30, 1999 2,358,260 22.55Granted 945,850 9.88Exercised (56,718) 4.75Canceled (588,897) 21.77
OUTSTANDING AT JUNE 30, 2000 2,658,495 $18.38Exercisable at June 30, 2000 1,076,312 $19.51Available for future grant 1,920,009
Summary information related to options outstanding and exercisable as of June 30, 2000, is as follows:
Weighted Average
Range of Outstanding Remaining Weighted Exercisable WeightedExercise as of Contractual Average as of Average
Prices June 30, 2000 Life (Years) Exercise Price June 30, 2000 Exercise Price
$ 0.01–10.00 596,653 6.4 $ 7.49 242,153 $ 5.6210.01–20.00 792,837 6.6 13.58 185,486 18.4020.01–30.00 893,588 5.9 23.98 537,101 23.3730.01–37.81 375,417 4.9 32.51 111,572 32.91
2,658,495 1,076,312

26 P A R E X E L A N N U A L R E P O R T 2 0 0 0
Notes to Consolidated Financial Statements
The fair value for options granted was estimated at thetime of the grant using the Black-Scholes option pricingmodel with the following weighted-average assumptionsfor the three years ended June 30, 2000: Risk free interestrates of 6.10% in fiscal 2000, 4.58% in fiscal 1999 and5.84% in fiscal 1998, dividend yield of 0.0% for eachyear, volatility factor of the expected market price of theCompany’s common stock of 72% for fiscal 2000, 71%for fiscal 1999 and 45% for fiscal 1998 and an averageholding period of five years. During fiscal 2000, 1999and 1998, the weighted-average grant-date fair value ofthe stock options granted during the fiscal year was$6.30, $17.20 and $15.28 per share, respectively.
If the compensation cost for the Company’s stock optionsand the Purchase Plan had been determined based on thefair value at the date of grant, as prescribed in SFAS No.123, the Company’s net income and net income per sharewould have been as follows:
(in thousands, except per share data) 2000 1999 1998
Pro forma net income $40 $9,214 $8,215Pro forma income per diluted
weighted average share $ – $ 0.37 $ 0.33
As stock options vest over several years and additionalstock option grants are expected to be made each year,the above pro forma disclosures are not necessarily rep-resentative of pro forma effects on results of operationsfor future years.
401(k) PlanThe Company sponsors an employee savings plan (“thePlan”) as defined by Section 401(k) of the Internal RevenueCode of 1986, as amended. The Plan covers substantiallyall employees in the U.S. who elect to participate.Participants have the opportunity to invest on a pre-taxbasis in a variety of mutual fund options. The Companymatches 100% of each participant’s voluntary contribu-tions up to 3% of gross salary per payroll period.Company contributions vest to the participants in 20%increments for each year of employment and becomefully vested after five years of continuous employment.Company contributions to the Plan were $2.4 million,$1.8 million and $1.4 million, for the years ended June30, 2000, 1999 and 1998, respectively.
NOTE 13 INCOME TAXESDomestic and foreign income before income taxes for thethree years ended June 30, 2000, are as follows:
($ in thousands) 2000 1999 1998
Domestic $16,621 $ 3,475 $ 9,428Foreign (6,576) 20,476 7,571
$10,045 $23,951 $16,999
The provisions for income taxes for the three years endedJune 30, 2000, are as follows:
($ in thousands) 2000 1999 1998
CURRENT:Federal $ 5,520 $ 2,801 $ 5,402State 2,053 1,506 1,144Foreign 1,360 7,359 3,403
8,933 11,666 9,949DEFERRED:
Federal (1,087) (2,526) (1,122)State (362) (842) (384)Foreign (2,924) 31 (763)
(4,373) (3,337) (2,269)$ 4,560 $ 8,329 $ 7,680
The Company’s consolidated effective income tax ratediffered from the U.S. federal statutory income tax rate asset forth below:
($ in thousands) 2000 1999 1998
Income tax expense computed at the federal statutory rate $3,516 $8,383 $5,949
State income taxes, net of federal benefit 976 994 494
Foreign rate differential 454 (629) (141)Use of foreign net operating
loss carryforwards (801) (532) (1,117)Foreign losses
w/o current benefit 962 291 522Foreign permanent
tax adjustments 202 191U.S. permanent
tax adjustments (124) (287) 1,454U.S. separate return
limitation year loss (154) 160Other (471) (242) 519
$4,560 $8,329 $7,680
Provision has not been made for U.S. or additional foreigntaxes on undistributed earnings of foreign subsidiaries asthose earnings have been permanently reinvested. Suchtaxes, if any, are not expected to be significant.

27P A R E X E L A N N U A L R E P O R T 2 0 0 0
Notes to Consolidated Financial Statements
Significant components of the Company’s net deferred taxasset as of June 30, 2000 and 1999, are as follows:
($ in thousands) 2000 1999
DEFERRED TAX ASSETS:Foreign loss carryforwards $ 7,869 $ 4,869Accrued expenses 15,872 9,480Allowance for doubtful accounts 558 1,300Deferred contract profit 6,699 8,852Other 118 89Gross deferred tax assets 31,116 24,590Deferred tax asset valuation allowance (3,468) (3,563)
Total deferred tax assets 27,648 21,027DEFERRED TAX LIABILITIES:
Property and equipment (4,822) (3,948)Other (4,224) (5,364)
Total deferred tax liabilities (9,046) (9,312)$18,602 $11,715
Net deferred tax assets and liabilities are included in theconsolidated balance sheet as of June 30, 2000 and 1999,as follows:
($ in thousands) 2000 1999
Other current assets $15,370 $14,011Other assets 12,278 7,016Other current liabilities (1,007) (1,175)Other liabilities (8,039) (8,137)
$18,602 $11,715
The net deferred tax asset includes a tax effect of approxi-mately $8.1 million for pre-acquisition and post-acquisitionforeign tax loss carryforwards available to offset futureliabilities for foreign income taxes. Substantially all of theforeign tax losses are carried forward indefinitely, subjectto certain limitations. A valuation allowance has beenestablished for certain of the future foreign income taxbenefits primarily related to income tax loss carryforwardsand temporary differences based on management’sassessment that it is more likely than not that such ben-efits will not be realized. In fiscal 2000, the valuationallowance decreased by $0.1 million due to use of foreignnet operating loss carryforwards. The ultimate realizationof the remaining loss carryforwards is dependent uponthe generation of sufficient taxable income in variousjurisdictions, primarily Germany.
NOTE 14 LEASE COMMITMENTSThe Company leases its facilities under operating leases thatinclude renewal and escalation clauses. Total rent expensewas $20.3 million, $17.3 million and $13.9 million for theyears ended June 30, 2000, 1999 and 1998, respectively.Future minimum lease payments due under non-cancellable
operating leases totaled $18.3 million, $14.1 million, $10.5million, $7.5 million, $6.8 million and $22.2 million forfiscal 2001, 2002, 2003, 2004, 2005 and thereafter,respectively. These future minimum lease payments areoffset by future sublease payments totaling $4.3 millionand $1.4 million for fiscal 2001 and 2002, respectively.
NOTE 15 RELATED PARTY TRANSACTIONSDuring the three years ended June 30, 2000, certain mem-bers of the Company’s Board of Directors were associatedwith certain of the Company’s customers. Net revenue recognized from these customers was $25.3 million and$25.2 million in fiscal 1999 and 1998, respectively.Amounts due from these customers included in accountsreceivable at June 30, 1998 totaled $14.3 million. Relatedparty amounts included in accounts receivable were onstandard terms and manner of settlement. At June 30,2000 and 1999, none of the Company’s directors wereassociated as related parties with any of its customers.
At June 30, 1998, the Company had notes receivable of$1.4 million from a company owned by the former direc-tors of MMS Europe. The notes bore interest at 8.0% andwere payable on demand. The Company recorded interestincome related to these notes of $0.2 million for the yearended June 30,1998. These notes were settled in fiscal 1999.
NOTE 16 GEOGRAPHIC ANDSEGMENT INFORMATIONFinancial information by geographic area for the threeyears ended June 30, 2000, is as follows:
($ in thousands) 2000 1999 1998
NET REVENUE:North America $225,478 $198,236 $175,045United Kingdom 65,444 79,312 56,607Europe 79,695 66,250 50,012Asia/Pacific 7,533 4,688 3,778
$378,150 $348,486 $285,442INCOME (LOSS) FROM
OPERATIONS:North America $ 6,007 $ 1,060 $ 6,334United Kingdom (3,666) 16,545 4,747Europe 2,134 3,368 2,519Asia/Pacific (846) (409) (299)
$ 3,629 $ 20,564 $ 13,301IDENTIFIABLE ASSETS:
North America $198,775 $218,625 $190,017United Kingdom 64,994 54,360 42,804Europe 81,348 58,086 28,710Asia/Pacific 5,802 2,494 227
$350,919 $333,565 $261,758

28 P A R E X E L A N N U A L R E P O R T 2 0 0 0
Notes to Consolidated Financial Statements
The Company is managed through three reportable segments, namely, the clinical research services group,the consulting services group and the medical marketingservices group. The clinical research services group(“CRS”) constitutes the Company’s core business andincludes clinical trials management, biostatistics anddata management, as well as related medical advisory,information technology and investigator site services.PAREXEL’s consulting group (“PCG”) provides technicalexpertise in such disciplines as clinical pharmacology,regulatory affairs, industry training, publishing and drugdevelopment. These consultants identify options andpropose solutions to address clients’ product develop-ment, registration and commercialization issues. Themedical marketing services group (“MMS”) provides afull spectrum of market development, product develop-ment and targeted communications services in supportof product launch.
The Company evaluates its segment performance andallocates resources based on revenue and gross profit (netrevenue less direct costs), while other operating costs areevaluated on a geographical basis. Accordingly, theCompany does not include selling, general and adminis-trative expenses, depreciation and amortization expense,non-recurring and merger-related costs, interest income(expense), other income (expense) and income tax expensein segment profitability. The accounting policies of the reportable segments are the same as those describedin Note 2.
($ in thousands) CRS PCG MMS TotalNET REVENUE:
2000 $262,698 $66,525 $48,927 $378,1501999 $239,502 $57,633 $51,351 $348,4861998 $187,954 $45,831 $51,657 $285,442
GROSS PROFIT:2000 $ 89,154 $14,562 $13,549 $117,2651999 $ 88,227 $16,422 $10,187 $114,8361998 $ 71,459 $12,452 $15,813 $ 99,724
Report of Independent Accountants
TO THE BOARD OF DIRECTORS AND STOCKHOLDERS OF PAREXEL INTERNATIONAL CORPORATION:
In our opinion, the accompanying consolidated balance sheets and the related consolidated statements of operations,stockholders’ equity and of cash flows present fairly, in all material respects, the financial position of PAREXELInternational Corporation and its subsidiaries at June 30, 2000 and June 30, 1999, and the results of their operationsand their cash flows for each of the three years in the period ended June 30, 2000, in conformity with accountingprinciples generally accepted in the United States. These financial statements are the responsibility of the Company’smanagement; our responsibility is to express an opinion on these financial statements based on our audits. We conducted our audits of these statements in accordance with auditing standards generally accepted in the UnitedStates, which require that we plan and perform the audit to obtain reasonable assurance about whether the financialstatements are free of material misstatement. An audit includes examining, on a test basis, evidence supporting theamounts and disclosures in the financial statements, assessing the accounting principles used and significant estimatesmade by management, and evaluating the overall financial statement presentation. We believe that our audits providea reasonable basis for the opinion expressed above.
PricewaterhouseCoopers LLPBoston, MassachusettsAugust 18, 2000

Quarterly Operating Results and Common Stock Information (unaudited)
29
The following is a summary of unaudited quarterly results of operations for the two years ended June 30, 2000:
FOR THE YEAR ENDED JUNE 30, 2000
($ in thousands, except per share data) First Quarter Second Quarter Third Quarter Fourth Quarter
NET REVENUE $91,768 $97,957 $97,253 $91,172Income (loss) from operations1 6,087 6,327 (9,129) 344Net income (loss) 4,439 5,064 (5,448) 1,430Diluted earnings (loss) per share 0.18 0.20 (0.22) 0.06Range of common stock prices2 $8.03-13.50 $7.62-12.56 $8.12-15.44 $8.25-10.37
FOR THE YEAR ENDED JUNE 30, 1999
($ in thousands, except share data) First Quarter Second Quarter Third Quarter Fourth Quarter
NET REVENUE $82,835 $87,855 $90,032 $87,764Income (loss) from operations3 7,677 7,277 7,703 (2,093)Net income (loss) 5,505 5,141 5,685 (709)Diluted earnings (loss) per share 0.22 0.21 0.23 (0.03)Range of common stock prices2 $29.69-40.13 $20.25-45.50 $19.00-29.38 $10.48-26.811 The Statement of Operations for the year ended June 30, 2000 includes charges of $13.1 million related to restructuring and other charges, consisting primarily of severance and lease
termination costs and $1.0 million related to accelerated depreciation expense due to changes in the estimated useful lives of leasehold improvements on abandoned leased facilities.
2 The range of common stock prices is based on the high and low sales price on the Nasdaq National Market for the periods indicated.
3 Income (loss) from operations for the year ended June 30, 1999 includes $4.7 million in non-recurring charges including $1.9 million in costs related to the terminated merger agreement withCovance Inc. and $2.8 million in leasehold abandonment charges resulting primarily from the centralization of certain facilities in North America and Europe.
The Company’s common stock is quoted on the Nasdaq National Market under the symbol “PRXL.”
As of September 11, 2000, there were approximately 127 stockholders of record.
The Company has never declared or paid any cash dividends on its common stock and does not anticipate paying any cash dividendsin the foreseeable future. The Company intends to retain future earnings for the development and expansion of its business.
Selected Financial Data(in thousands, except per share data and number of employees) 2000 1999 1998 1997 1996
OPERATIONSNet revenue $378,150 $348,486 $285,442 $203,676 $125,053Income from operations 3,6291 20,5642 13,3013 17,119 10,391Net income 5,485 15,622 9,319 12,803 6,655Diluted earnings per share $0.22 $0.62 $0.38 $0.56 $0.39
FINANCIAL POSITIONCash, cash equivalents and marketable securities $ 90,213 $ 89,957 $ 76,634 $104,339 $ 52,022Working capital 127,746 132,757 118,937 113,997 55,681Total assets 350,919 333,565 261,758 240,544 135,721Long-term debt 104 79 36 136 466Stockholders’ equity $190,153 $192,032 $168,380 $147,448 $ 69,788
OTHER DATAPurchase of property and equipment $ 20,067 $ 18,910 $ 27,736 $ 25,112 $ 7,461Depreciation and amortization $ 21,934 $ 17,932 $ 15,1144 $ 7,710 $ 4,280Number of employees 4,200 4,198 3,705 2,928 1,767Weighted average shares used in
computing diluted earnings per share 25,140 25,128 24,825 22,822 17,2551 The Statement of Operations for the year ended June 30, 2000 includes charges of $13.1 million related to restructuring and other charges, consisting primarily of severance and lease
termination costs and $1.0 million related to accelerated depreciation expense due to changes in the estimated useful lives of leasehold improvements on abandoned leased facilities.
2 Income from operations for the year ended June 30, 1999 includes $4.7 million in non-recurring charges including $1.9 million in costs related to the terminated merger agreement with CovanceInc. and $2.8 million in leasehold abandonment charges resulting primarily from the centralization of certain facilities in North America and Europe.
3 Income from operations for the year ended June 30, 1998 includes $13.6 million of non-recurring charges, including $10.3 million pertaining to acquisitions.
4 Depreciation and amortization for the year ended June 30, 1998 includes a non-cash charge of $1.7 million to reflect a change in estimate in the remaining useful lives of certain computerequipment as a result of integration activities of acquired companies and the Company’s program to upgrade and standardize its information technology platform.

30 P A R E X E L A N N U A L R E P O R T 2 0 0 0
Directors and Officers
BOARD OF DIRECTORSA. Dana Callow, Jr.Managing General PartnerBoston Millennia Partners Limited Partnershipand Boston Millennia Partners II Limited Partnership
A. Joseph EagleIndividual Investor
Patrick J. FortunePresident and Chief Operating OfficerNew Era of Networks Incorporated
Prof. Dr. med. Werner M. HerrmannSenior Vice President, Worldwide ClinicalPharmacology and Chief Scientific OfficerPAREXEL International Corporation
Serge OkunPresident and Chief Executive OfficerPST International
William T. Sobo, Jr.Chief Operating Officer and Chief Financial OfficerPolitzer & Haney Incorporated
Josef H. von RickenbachChairman of the BoardPresident and Chief Executive OfficerPAREXEL International Corporation
OFFICERSJosef H. von RickenbachChairman of the BoardPresident and Chief Executive Officer
James F. Winschel, Jr.Senior Vice President and Chief Financial Officer
Barry R. PhilpottPresident, Clinical Research Services
Andrew J. Morffew, Ph.D.President, PAREXEL Consulting Group
Andrew L. SmithPresident, Medical Marketing Services
Mark A. Goldberg, M.D.President, Advanced Technology and Informatics, Inc.
Ulf I. Schneider, Ph.D.Senior Vice President and Chief Administrative Officer
Mark T. BeaudouinVice President, General Counsel and Clerk
Paule A. Daprés, M.D.Executive Vice President, Clinical Research Services
Mary Bareilles, M.D.Senior Vice President, Asia/Pacific
Prof. Dr. med. Werner M. HerrmannSenior Vice President,Worldwide ClinicalPharmacology and Chief Scientific Officer
Alberto Grignolo, Ph.D.Senior Vice President, Worldwide Regulatory Affairs
Veronica G.H. Jordan, Ph.D.Senior Vice President, Clinical Research Services
Warren C. Stern, Ph.D.Senior Vice President, Scientific and Medical Services
James H. GeddesPresident, Barnett International, LLC

Corporate Information
CORPORATE OFFICESPAREXEL International Corporation195 West StreetWaltham, Massachusetts 02451-1163Telephone: (781) 487-9900Facsimile: (781) 487-0525Website: www.parexel.com
ANNUAL MEETINGThe fiscal 2000 Annual Meeting of Stockholders will be held at 10:00 a.m. onThursday, November 16, 2000 at the Museum of Our National Heritage, Lexington, MA.
STOCK LISTINGNASDAQ National MarketSymbol: PRXL
FINANCIAL REPORTSCopies of the Company’s Annual Report on Form10-K and Quarterly Reports on Form 10-Q filedwith the Securities and Exchange Commission, aswell as other investor materials, are availableupon request without charge from:
PAREXEL International CorporationInvestor Relations195 West StreetWaltham, Massachusetts 02451-1163Telephone: (781) 434-4118Facsimile: (781) 487-9931
TRANSFER AGENT AND REGISTRARFleet National Bankc/o EquiServe Limited Partnership150 Royall StreetCanton, Massachusetts 02021-1030Telephone: (781) 575-3120
INDEPENDENT ACCOUNTANTSPricewaterhouseCoopers LLPBoston, Massachusetts
LEGAL COUNSELHale and Dorr LLPBoston, Massachusetts
OFFICE LOCATIONSNorth AmericaSan Diego, CaliforniaSan Mateo, CaliforniaToronto, CanadaBoulder, ColoradoGreenwich, ConnecticutWashington, District of ColumbiaAtlanta, GeorgiaChicago, IllinoisRockville, MarylandLowell, MassachusettsWaltham, MassachusettsHackensack, New JerseyDurham, North CarolinaPhiladelphia, PennsylvaniaAlexandria, Virginia
EuropePrague, Czech RepublicCopenhagen, DenmarkHelsinki, FinlandLevallois-Perret, FranceOrleans, FranceParis, FrancePoitiers, FranceBerlin, GermanyFrankfurt, GermanyFreiburg, GermanyBudapest, HungaryMilan, ItalyVilnius, LithuaniaAmsterdam, NetherlandsLillestrøm, NorwayWarsaw, PolandMoscow, RussiaBarcelona, SpainMadrid, SpainStockholm, SwedenGuildford, United KingdomLondon, United KingdomSheffield, United KingdomWorthing, United Kingdom
Asia/Pacific/Middle East/AfricaSydney, AustraliaTel Aviv, IsraelKobe, JapanTokyo, JapanJohannesburg, South Africa
Des
ign:
Ben
es B
rand
Imag
ing
Gro
up,
Lexi
ngto
n, M
A
31
PAREXEL is the third largest Contract Research
Organization (CRO) in the world, providing customized,
expertise-based product development and launch services to
the international pharmaceutical, biotechnology and medical
device industries. Over the past 17 years, PAREXEL has
developed significant global expertise in clinical trials
management, drug development strategy, medical marketing,
regulatory affairs and the use of technology to enhance the
drug development and launch process.
PAREXEL has relationships with most of the world’s top
pharmaceutical and biotechnology companies, and also pro-
vides services to the growing sector of smaller biotechnology,
pharmaceutical and medical device companies.
PAREXEL currently has 4,200 employees in 43 locations
throughout 29 countries.
C O R P O R A T E S U M M A R Y
1
6
8
2
T A B L E O F C O N T E N T S
PAREXEL at a Glance
Letter from the Chairman
Clinical Research Services
Consulting Services
Medical Marketing Services
Financial Highlights
Management’s Discussion and Analysis
Consolidated Financial Statements
Notes to Consolidated Financial Statements
Quarterly and Selected Financial Data
Directors and Officers
Corporate Information
20
29
30
16
11
4
10 31

Working toward a healthier world.Working toward a healthier world.
2 0 0 0 A N N U A L R E P O R T2 0 0 0 A N N U A L R E P O R T
195 West StreetWaltham, MA 02451-1163Telephone: (781) 487-9900Facsimile: (781) 487-0525
www.parexel.com 1493-AR-00