Embed Size (px)
Citation preview
April 2018
Captur ing the per formance of se lec t ‘Qual i t y ’ companies f rom large and
mid- cap segments{ {
WHITE PAPERSERIES #11
200 Quality30
1
Introduction
Imagine it is the UEFA Champions league final between two of the biggest football clubs in the world:
Manchester United and Real Madrid. Two grueling hours of cagy football couldn’t decide the winner of
this years biggest competition in club football. Referee blows the final whistle to announce the end of
extra time; there is no other option but to decide the winner based on penalties. Two of the most
decorated managers in the modern day football: Jose Mourinho and Zinedine Zidane are in a dilemma -
a tough choice to pick the best penalty takers - players who can be banked upon. Finally, the managers
have made up their minds and not surprisingly, the ‘best’ (read ‘quality’) players of the respective teams
are chosen to take the decisive kicks : Ronaldo, Ramos, Kroos, Modric & Marcelo for Real Madrid and
Pogba, Lukaku, Mata, Matic & Sanchez for Manchester United. What makes them ‘quality’ players are
probably attributes like high success rate, self-reliance, and consistency in performance.
In equity investments also, we often face such dilemma of identifying the right stock that is expected to
perform well in most of market phases. Banking upon ‘quality’ stocks in such a dilemma may turn out to
be a more appropriate investment strategy, especially in the long run. The newly launched NIFTY200
Quality 30 index follows a similar strategy. The NIFTY200 Quality 30 includes top 30 companies from its
parent NIFTY 200 index, selected based on their ‘quality’ scores. The quality score for each company in
the index is determined based on profitability (read success rate), leverage (read self-reliance) and
earnings growth variability (read consistency in performance).
2
What defines a ‘Quality’ company?
Researchers often differ on the definition of ‘quality’ company, as unlike value, momentum and
volatility, where these is a broad consensus, ‘quality’ does not seem to have a universally accepted
definition. While Benjamin Graham’s identification of quality centred around ‘earnings stability’ and ‘EPS
growth’ (1973), Sloan (1996) stressed on ‘accruals-based measure of earnings’. In 2000, Piotroski
emphasized on F-score1 based measure of financial strength, likewise in 2013, Novy-Marx devised
performance strategies based on gross profitability (gross profits-to-assets), whereas Grantham in his
whitepaper (2004) defined quality companies as those which meet the criteria of low leverage, high
profitability, and low earnings volatility.
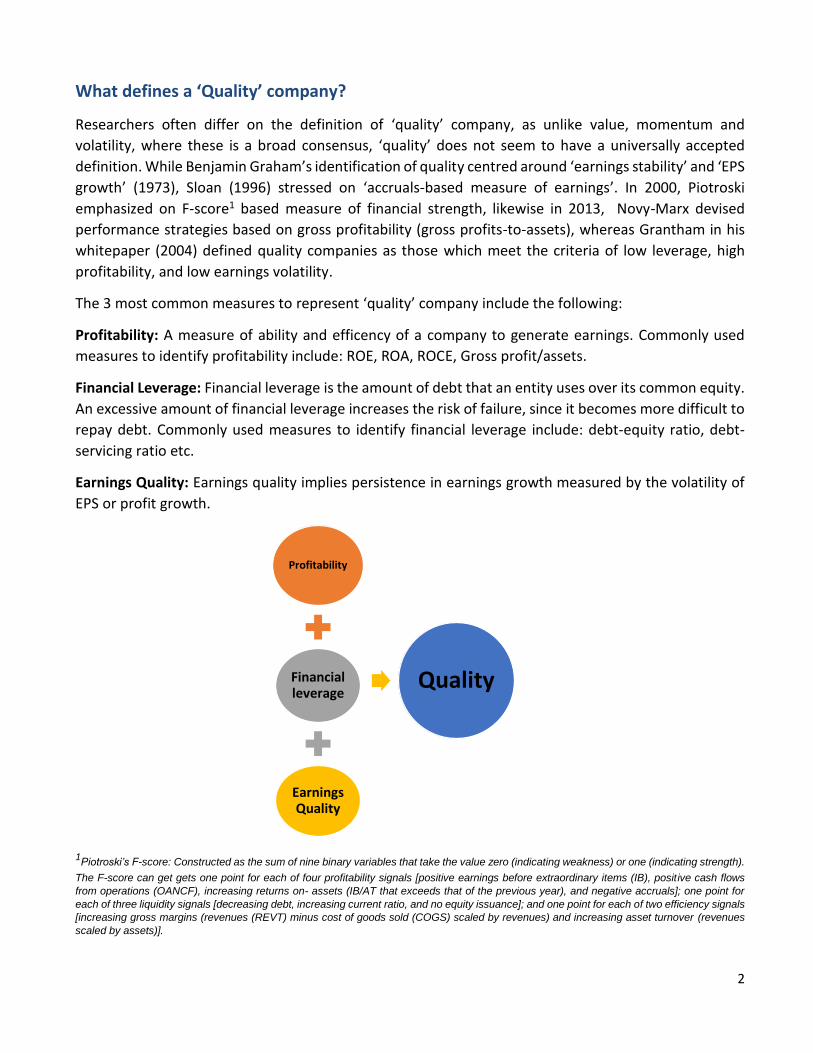
The 3 most common measures to represent ‘quality’ company include the following:
Profitability: A measure of ability and efficency of a company to generate earnings. Commonly used
measures to identify profitability include: ROE, ROA, ROCE, Gross profit/assets.
Financial Leverage: Financial leverage is the amount of debt that an entity uses over its common equity.
An excessive amount of financial leverage increases the risk of failure, since it becomes more difficult to
repay debt. Commonly used measures to identify financial leverage include: debt-equity ratio, debt-
servicing ratio etc.
Earnings Quality: Earnings quality implies persistence in earnings growth measured by the volatility of
EPS or profit growth.
1Piotroski’s F-score: Constructed as the sum of nine binary variables that take the value zero (indicating weakness) or one (indicating strength).
The F-score can get gets one point for each of four profitability signals [positive earnings before extraordinary items (IB), positive cash flows
from operations (OANCF), increasing returns on- assets (IB/AT that exceeds that of the previous year), and negative accruals]; one point for
each of three liquidity signals [decreasing debt, increasing current ratio, and no equity issuance]; and one point for each of two efficiency signals
[increasing gross margins (revenues (REVT) minus cost of goods sold (COGS) scaled by revenues) and increasing asset turnover (revenues
scaled by assets)].
Profitability
Financial leverage
Earnings Quality
Quality
3
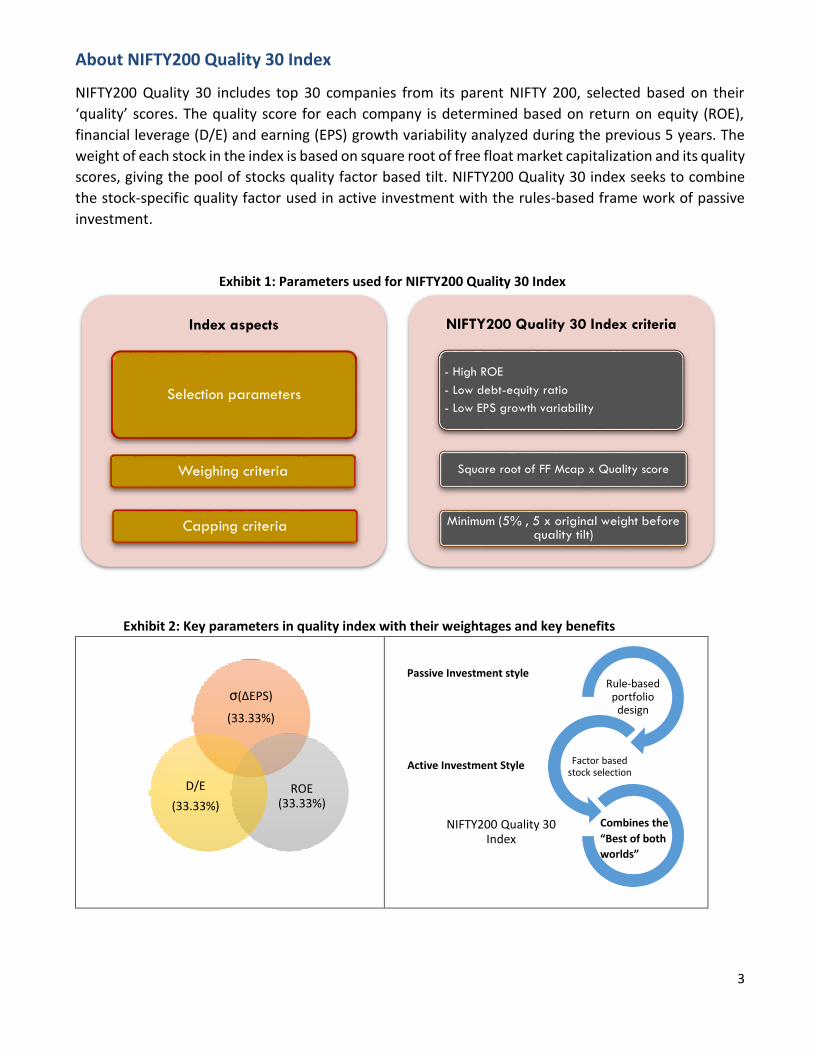
About NIFTY200 Quality 30 Index
NIFTY200 Quality 30 includes top 30 companies from its parent NIFTY 200, selected based on their
‘quality’ scores. The quality score for each company is determined based on return on equity (ROE),
financial leverage (D/E) and earning (EPS) growth variability analyzed during the previous 5 years. The
weight of each stock in the index is based on square root of free float market capitalization and its quality
scores, giving the pool of stocks quality factor based tilt. NIFTY200 Quality 30 index seeks to combine
the stock-specific quality factor used in active investment with the rules-based frame work of passive
investment.
Exhibit 1: Parameters used for NIFTY200 Quality 30 Index
Exhibit 2: Key parameters in quality index with their weightages and key benefits
Index aspects
Selection parameters
Weighing criteria
Capping criteria
NIFTY200 Quality 30 Index criteria
- High ROE
- Low debt-equity ratio
- Low EPS growth variability
Square root of FF Mcap x Quality score
Minimum (5% , 5 x original weight before quality tilt)
σ(ΔEPS)
(33.33%)
ROE (33.33%)
D/E
(33.33%)
Rule-based portfolio
design
Factor based stock selection
NIFTY200 Quality 30 Index
Passive Investment style
Active Investment Style
Combines the
“Best of both
worlds”
4
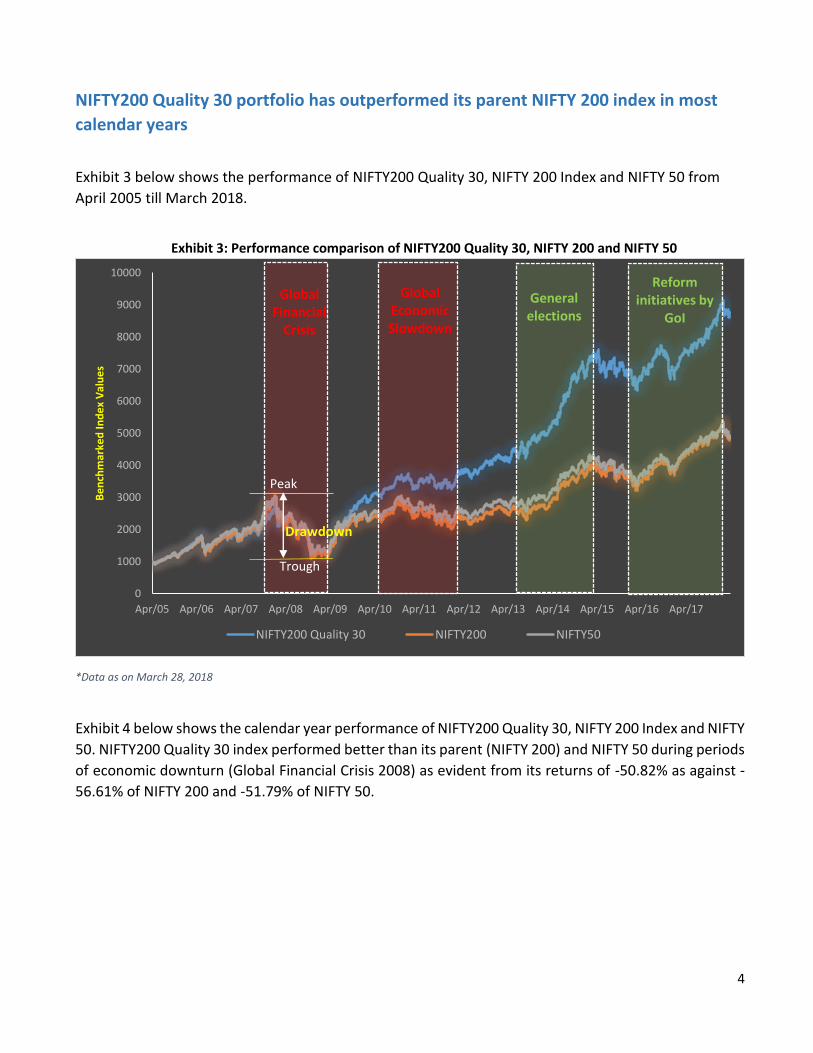
NIFTY200 Quality 30 portfolio has outperformed its parent NIFTY 200 index in most
calendar years
Exhibit 3 below shows the performance of NIFTY200 Quality 30, NIFTY 200 Index and NIFTY 50 from
April 2005 till March 2018.
Exhibit 3: Performance comparison of NIFTY200 Quality 30, NIFTY 200 and NIFTY 50
*Data as on March 28, 2018
Exhibit 4 below shows the calendar year performance of NIFTY200 Quality 30, NIFTY 200 Index and NIFTY
50. NIFTY200 Quality 30 index performed better than its parent (NIFTY 200) and NIFTY 50 during periods
of economic downturn (Global Financial Crisis 2008) as evident from its returns of -50.82% as against -
56.61% of NIFTY 200 and -51.79% of NIFTY 50.
0
1000
2000
3000
4000
5000
6000
7000
8000
9000
10000
Apr/05 Apr/06 Apr/07 Apr/08 Apr/09 Apr/10 Apr/11 Apr/12 Apr/13 Apr/14 Apr/15 Apr/16 Apr/17
Be
nch
mar
ked
Ind
ex
Val
ue
s
NIFTY200 Quality 30 NIFTY200 NIFTY50
Generalelections
Global Financial
Crisis
Global Economic Slowdown
Reforminitiatives by
GoI
Trough
Peak
Drawdown
5
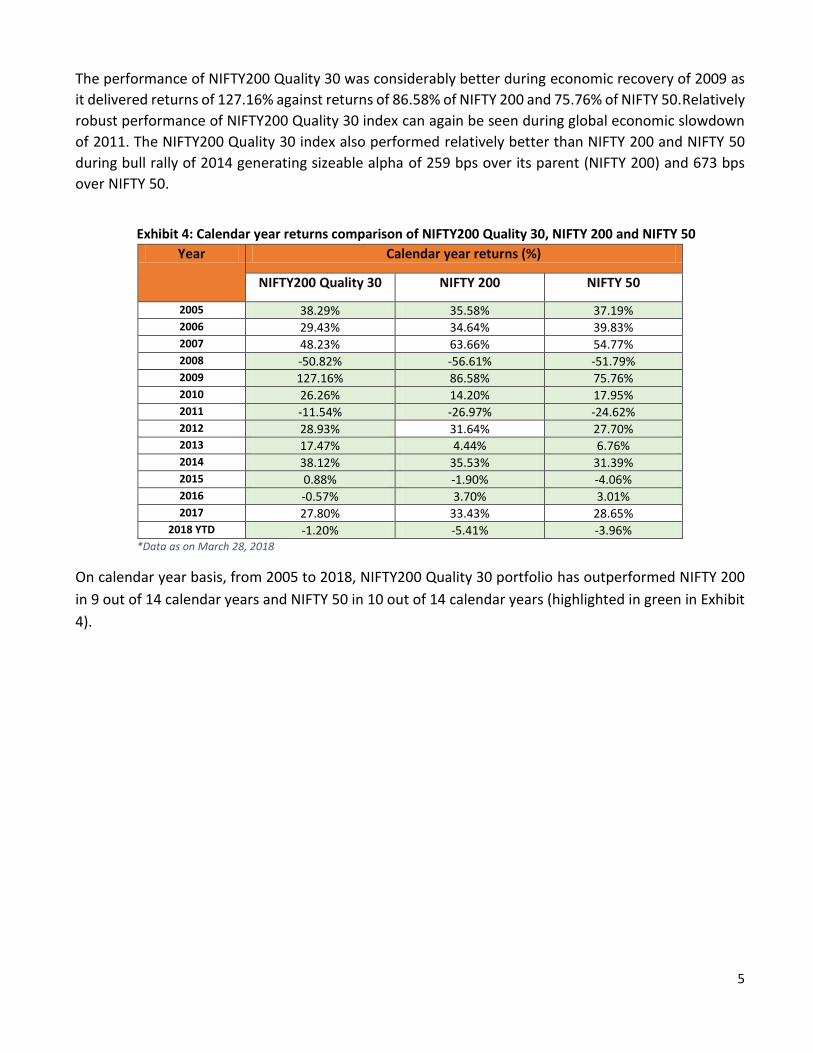
The performance of NIFTY200 Quality 30 was considerably better during economic recovery of 2009 as
it delivered returns of 127.16% against returns of 86.58% of NIFTY 200 and 75.76% of NIFTY 50.Relatively
robust performance of NIFTY200 Quality 30 index can again be seen during global economic slowdown
of 2011. The NIFTY200 Quality 30 index also performed relatively better than NIFTY 200 and NIFTY 50
during bull rally of 2014 generating sizeable alpha of 259 bps over its parent (NIFTY 200) and 673 bps
over NIFTY 50.
Exhibit 4: Calendar year returns comparison of NIFTY200 Quality 30, NIFTY 200 and NIFTY 50 Year Calendar year returns (%)
NIFTY200 Quality 30 NIFTY 200 NIFTY 50
2005 38.29% 35.58% 37.19% 2006 29.43% 34.64% 39.83% 2007 48.23% 63.66% 54.77% 2008 -50.82% -56.61% -51.79% 2009 127.16% 86.58% 75.76% 2010 26.26% 14.20% 17.95% 2011 -11.54% -26.97% -24.62% 2012 28.93% 31.64% 27.70% 2013 17.47% 4.44% 6.76% 2014 38.12% 35.53% 31.39% 2015 0.88% -1.90% -4.06% 2016 -0.57% 3.70% 3.01% 2017 27.80% 33.43% 28.65%
2018 YTD -1.20% -5.41% -3.96% *Data as on March 28, 2018
On calendar year basis, from 2005 to 2018, NIFTY200 Quality 30 portfolio has outperformed NIFTY 200
in 9 out of 14 calendar years and NIFTY 50 in 10 out of 14 calendar years (highlighted in green in Exhibit
4).
6
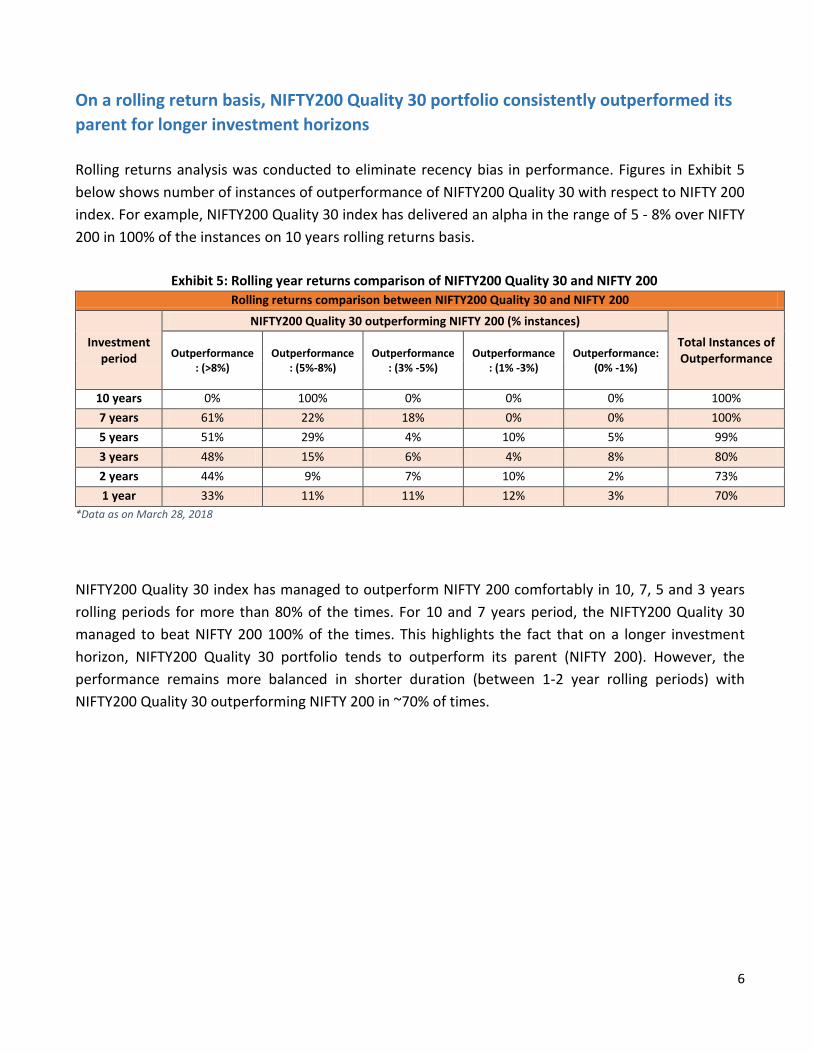
On a rolling return basis, NIFTY200 Quality 30 portfolio consistently outperformed its
parent for longer investment horizons
Rolling returns analysis was conducted to eliminate recency bias in performance. Figures in Exhibit 5
below shows number of instances of outperformance of NIFTY200 Quality 30 with respect to NIFTY 200
index. For example, NIFTY200 Quality 30 index has delivered an alpha in the range of 5 - 8% over NIFTY
200 in 100% of the instances on 10 years rolling returns basis.
Exhibit 5: Rolling year returns comparison of NIFTY200 Quality 30 and NIFTY 200 Rolling returns comparison between NIFTY200 Quality 30 and NIFTY 200
Investment period
NIFTY200 Quality 30 outperforming NIFTY 200 (% instances)
Total Instances of Outperformance Outperformance
: (>8%) Outperformance
: (5%-8%) Outperformance
: (3% -5%) Outperformance
: (1% -3%) Outperformance:
(0% -1%)
10 years 0% 100% 0% 0% 0% 100%
7 years 61% 22% 18% 0% 0% 100%
5 years 51% 29% 4% 10% 5% 99%
3 years 48% 15% 6% 4% 8% 80%
2 years 44% 9% 7% 10% 2% 73%
1 year 33% 11% 11% 12% 3% 70%
*Data as on March 28, 2018
NIFTY200 Quality 30 index has managed to outperform NIFTY 200 comfortably in 10, 7, 5 and 3 years
rolling periods for more than 80% of the times. For 10 and 7 years period, the NIFTY200 Quality 30
managed to beat NIFTY 200 100% of the times. This highlights the fact that on a longer investment
horizon, NIFTY200 Quality 30 portfolio tends to outperform its parent (NIFTY 200). However, the
performance remains more balanced in shorter duration (between 1-2 year rolling periods) with
NIFTY200 Quality 30 outperforming NIFTY 200 in ~70% of times.
7
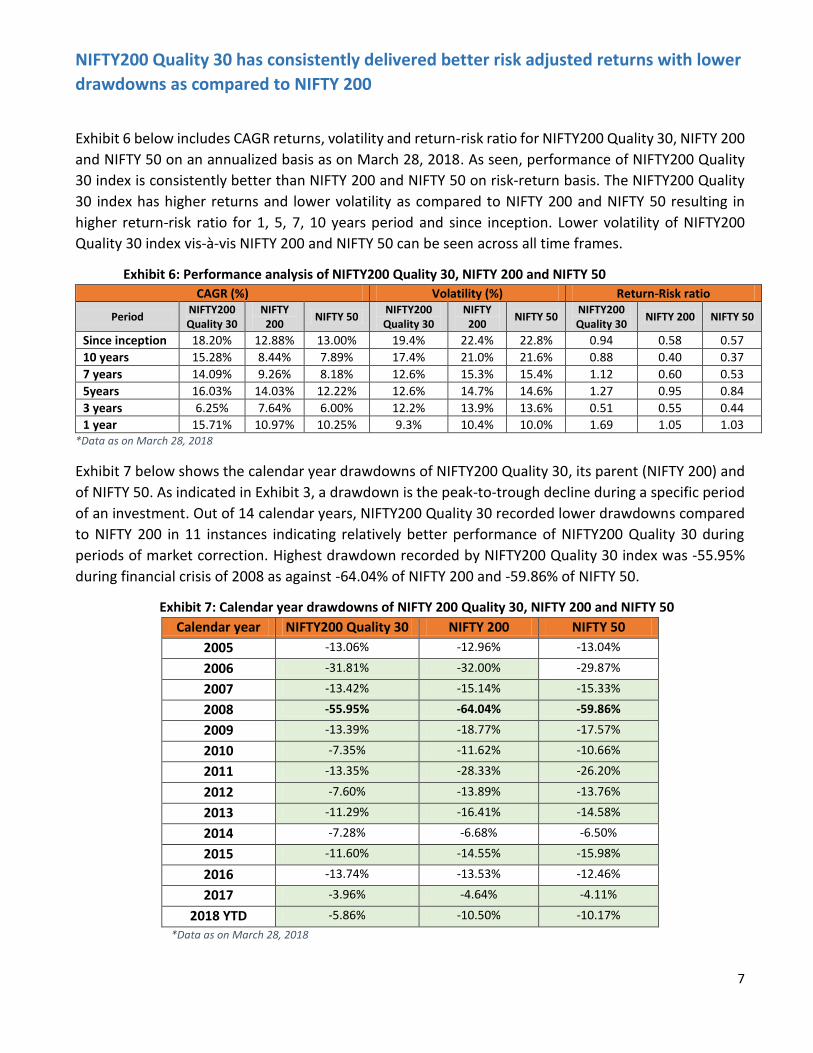
NIFTY200 Quality 30 has consistently delivered better risk adjusted returns with lower
drawdowns as compared to NIFTY 200
Exhibit 6 below includes CAGR returns, volatility and return-risk ratio for NIFTY200 Quality 30, NIFTY 200
and NIFTY 50 on an annualized basis as on March 28, 2018. As seen, performance of NIFTY200 Quality
30 index is consistently better than NIFTY 200 and NIFTY 50 on risk-return basis. The NIFTY200 Quality
30 index has higher returns and lower volatility as compared to NIFTY 200 and NIFTY 50 resulting in
higher return-risk ratio for 1, 5, 7, 10 years period and since inception. Lower volatility of NIFTY200
Quality 30 index vis-à-vis NIFTY 200 and NIFTY 50 can be seen across all time frames.
Exhibit 6: Performance analysis of NIFTY200 Quality 30, NIFTY 200 and NIFTY 50 CAGR (%) Volatility (%) Return-Risk ratio
Period NIFTY200 Quality 30
NIFTY 200
NIFTY 50 NIFTY200 Quality 30
NIFTY 200
NIFTY 50 NIFTY200 Quality 30
NIFTY 200 NIFTY 50
Since inception 18.20% 12.88% 13.00% 19.4% 22.4% 22.8% 0.94 0.58 0.57
10 years 15.28% 8.44% 7.89% 17.4% 21.0% 21.6% 0.88 0.40 0.37
7 years 14.09% 9.26% 8.18% 12.6% 15.3% 15.4% 1.12 0.60 0.53
5years 16.03% 14.03% 12.22% 12.6% 14.7% 14.6% 1.27 0.95 0.84
3 years 6.25% 7.64% 6.00% 12.2% 13.9% 13.6% 0.51 0.55 0.44
1 year 15.71% 10.97% 10.25% 9.3% 10.4% 10.0% 1.69 1.05 1.03 *Data as on March 28, 2018
Exhibit 7 below shows the calendar year drawdowns of NIFTY200 Quality 30, its parent (NIFTY 200) and
of NIFTY 50. As indicated in Exhibit 3, a drawdown is the peak-to-trough decline during a specific period
of an investment. Out of 14 calendar years, NIFTY200 Quality 30 recorded lower drawdowns compared
to NIFTY 200 in 11 instances indicating relatively better performance of NIFTY200 Quality 30 during
periods of market correction. Highest drawdown recorded by NIFTY200 Quality 30 index was -55.95%
during financial crisis of 2008 as against -64.04% of NIFTY 200 and -59.86% of NIFTY 50.
Exhibit 7: Calendar year drawdowns of NIFTY 200 Quality 30, NIFTY 200 and NIFTY 50 Calendar year NIFTY200 Quality 30 NIFTY 200 NIFTY 50
2005 -13.06% -12.96% -13.04%
2006 -31.81% -32.00% -29.87%
2007 -13.42% -15.14% -15.33%
2008 -55.95% -64.04% -59.86%
2009 -13.39% -18.77% -17.57%
2010 -7.35% -11.62% -10.66%
2011 -13.35% -28.33% -26.20%
2012 -7.60% -13.89% -13.76%
2013 -11.29% -16.41% -14.58%
2014 -7.28% -6.68% -6.50%
2015 -11.60% -14.55% -15.98%
2016 -13.74% -13.53% -12.46%
2017 -3.96% -4.64% -4.11%
2018 YTD -5.86% -10.50% -10.17%
*Data as on March 28, 2018
8
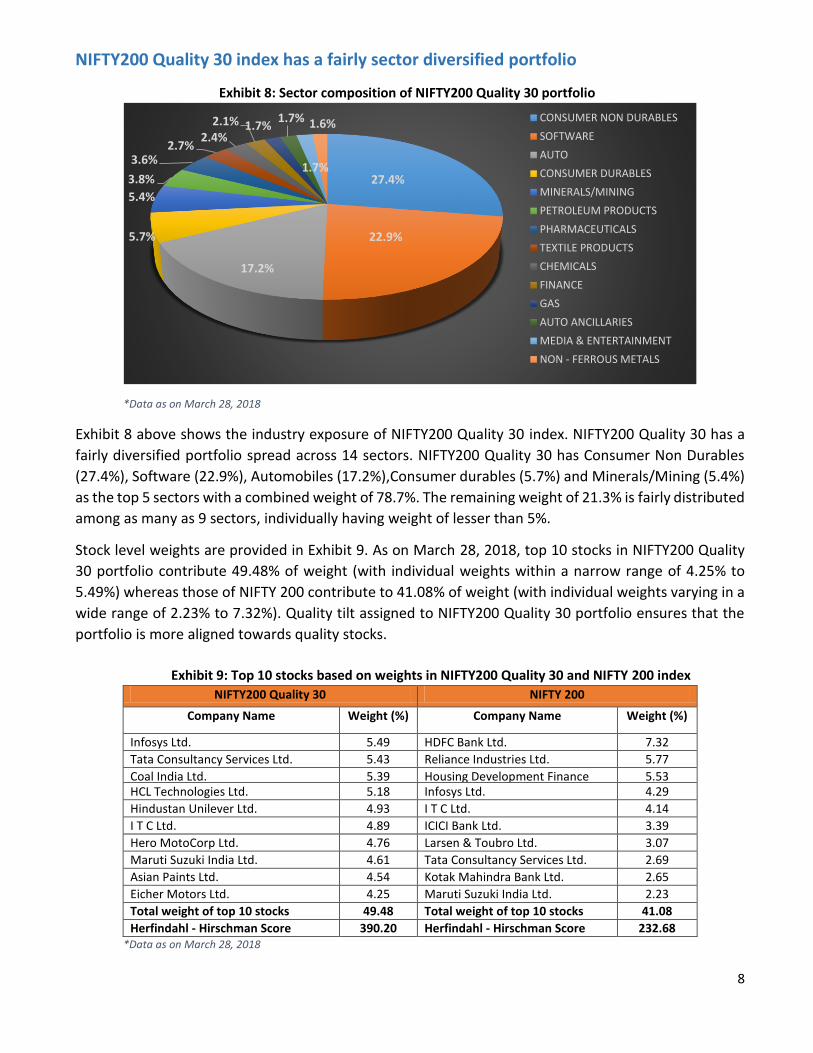
NIFTY200 Quality 30 index has a fairly sector diversified portfolio
Exhibit 8: Sector composition of NIFTY200 Quality 30 portfolio
*Data as on March 28, 2018
Exhibit 8 above shows the industry exposure of NIFTY200 Quality 30 index. NIFTY200 Quality 30 has a
fairly diversified portfolio spread across 14 sectors. NIFTY200 Quality 30 has Consumer Non Durables
(27.4%), Software (22.9%), Automobiles (17.2%),Consumer durables (5.7%) and Minerals/Mining (5.4%)
as the top 5 sectors with a combined weight of 78.7%. The remaining weight of 21.3% is fairly distributed
among as many as 9 sectors, individually having weight of lesser than 5%.
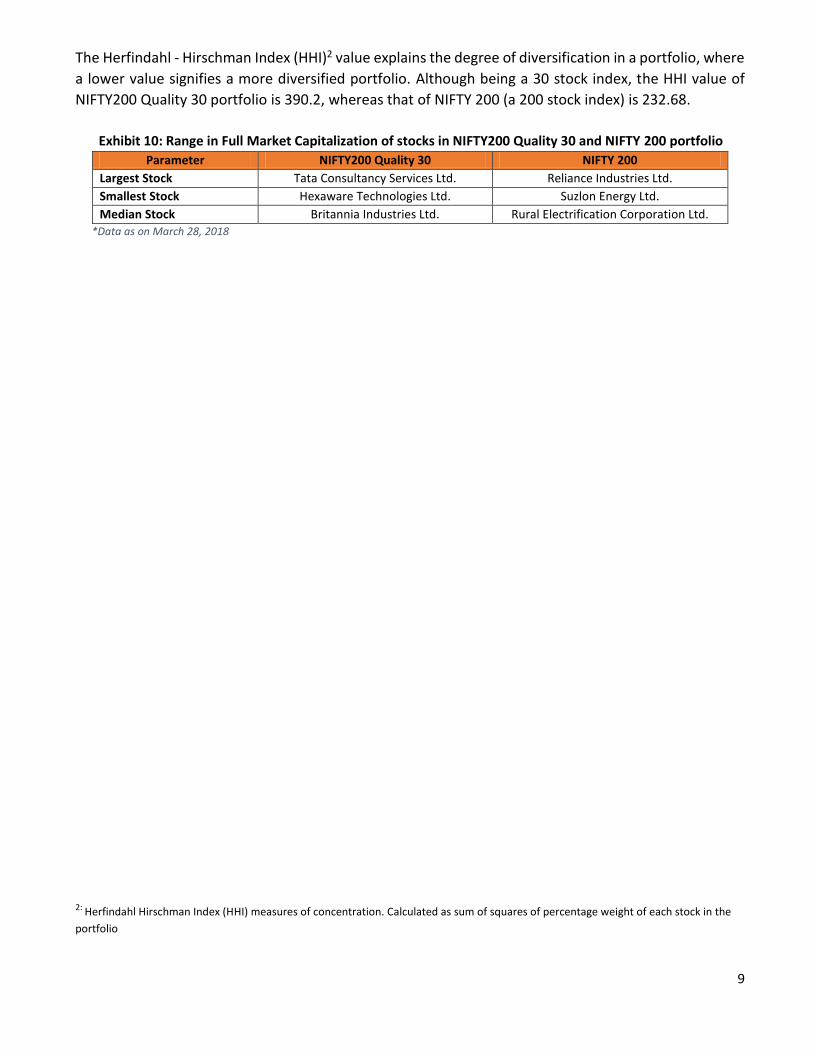
Stock level weights are provided in Exhibit 9. As on March 28, 2018, top 10 stocks in NIFTY200 Quality
30 portfolio contribute 49.48% of weight (with individual weights within a narrow range of 4.25% to
5.49%) whereas those of NIFTY 200 contribute to 41.08% of weight (with individual weights varying in a
wide range of 2.23% to 7.32%). Quality tilt assigned to NIFTY200 Quality 30 portfolio ensures that the
portfolio is more aligned towards quality stocks.
Exhibit 9: Top 10 stocks based on weights in NIFTY200 Quality 30 and NIFTY 200 index
NIFTY200 Quality 30 NIFTY 200
Company Name Weight (%) Company Name Weight (%)
Infosys Ltd. 5.49 HDFC Bank Ltd. 7.32
Tata Consultancy Services Ltd. 5.43 Reliance Industries Ltd. 5.77
Coal India Ltd. 5.39 Housing Development Finance Corporation Ltd.
5.53 HCL Technologies Ltd. 5.18 Infosys Ltd. 4.29
Hindustan Unilever Ltd. 4.93 I T C Ltd. 4.14
I T C Ltd. 4.89 ICICI Bank Ltd. 3.39
Hero MotoCorp Ltd. 4.76 Larsen & Toubro Ltd. 3.07
Maruti Suzuki India Ltd. 4.61 Tata Consultancy Services Ltd. 2.69
Asian Paints Ltd. 4.54 Kotak Mahindra Bank Ltd. 2.65
Eicher Motors Ltd. 4.25 Maruti Suzuki India Ltd. 2.23
Total weight of top 10 stocks 49.48 Total weight of top 10 stocks 41.08
Herfindahl - Hirschman Score 390.20 Herfindahl - Hirschman Score 232.68 *Data as on March 28, 2018
27.4%
22.9%
17.2%
5.7%
5.4%
3.8%
3.6%2.7%
2.4%2.1% 1.7%
1.7%
1.7%
1.6% CONSUMER NON DURABLES
SOFTWARE
AUTO
CONSUMER DURABLES
MINERALS/MINING
PETROLEUM PRODUCTS
PHARMACEUTICALS
TEXTILE PRODUCTS
CHEMICALS
FINANCE
GAS
AUTO ANCILLARIES
MEDIA & ENTERTAINMENT
NON - FERROUS METALS
9
The Herfindahl - Hirschman Index (HHI)2 value explains the degree of diversification in a portfolio, where
a lower value signifies a more diversified portfolio. Although being a 30 stock index, the HHI value of
NIFTY200 Quality 30 portfolio is 390.2, whereas that of NIFTY 200 (a 200 stock index) is 232.68.
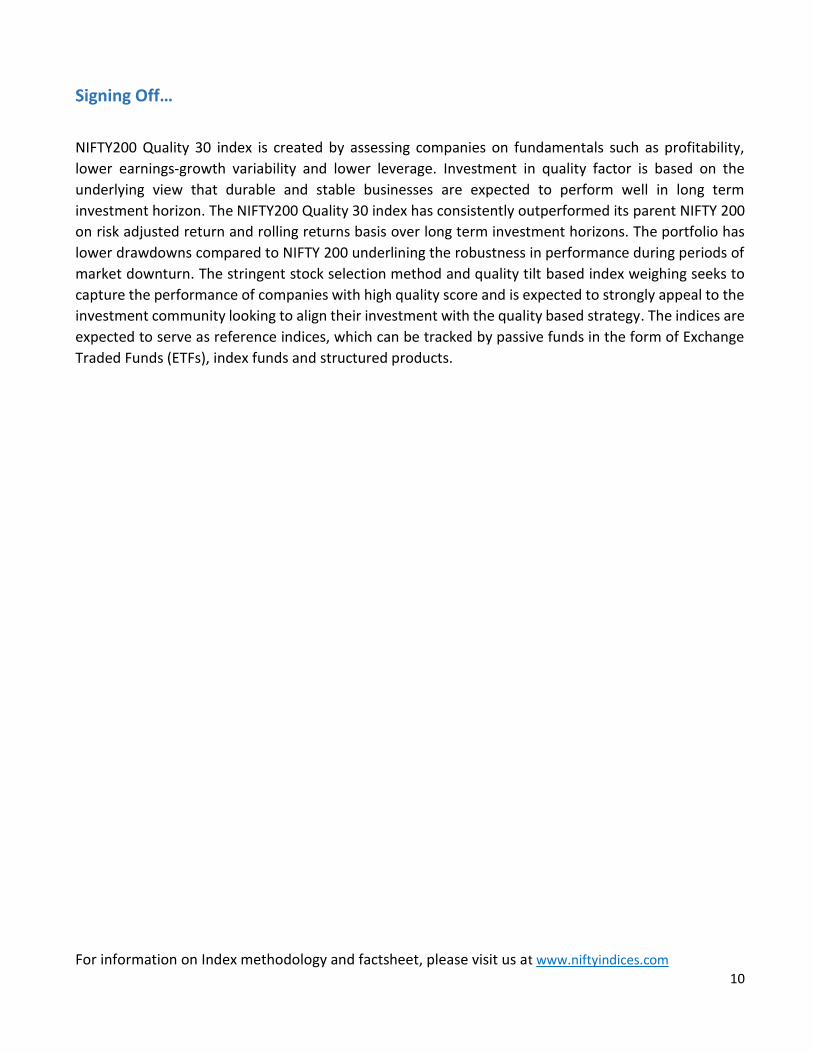
Exhibit 10: Range in Full Market Capitalization of stocks in NIFTY200 Quality 30 and NIFTY 200 portfolio
Parameter NIFTY200 Quality 30 NIFTY 200
Largest Stock Tata Consultancy Services Ltd. Reliance Industries Ltd.
Smallest Stock Hexaware Technologies Ltd. Suzlon Energy Ltd.
Median Stock Britannia Industries Ltd. Rural Electrification Corporation Ltd.
*Data as on March 28, 2018
2: Herfindahl Hirschman Index (HHI) measures of concentration. Calculated as sum of squares of percentage weight of each stock in the
portfolio
10
Signing Off…
NIFTY200 Quality 30 index is created by assessing companies on fundamentals such as profitability,
lower earnings-growth variability and lower leverage. Investment in quality factor is based on the
underlying view that durable and stable businesses are expected to perform well in long term
investment horizon. The NIFTY200 Quality 30 index has consistently outperformed its parent NIFTY 200
on risk adjusted return and rolling returns basis over long term investment horizons. The portfolio has
lower drawdowns compared to NIFTY 200 underlining the robustness in performance during periods of
market downturn. The stringent stock selection method and quality tilt based index weighing seeks to
capture the performance of companies with high quality score and is expected to strongly appeal to the
investment community looking to align their investment with the quality based strategy. The indices are
expected to serve as reference indices, which can be tracked by passive funds in the form of Exchange
Traded Funds (ETFs), index funds and structured products.
For information on Index methodology and factsheet, please visit us at www.niftyindices.com
11
About India Index Services & Products Ltd. (IISL):
India Index Services & Products Ltd. (IISL), a subsidiary of NSE, provides a variety of indices and index
related services for the capital markets. IISL focuses upon the index as a core product. IISL owns and
manages a portfolio of indices under the NIFTY brand of NSE, including the flagship index, the NIFTY 50.
IISL equity Indices comprises of broad-based benchmark indices, sectoral indices, strategy indices,
thematic indices and customised indices. IISL also maintains fixed income indices based on Government
of India securities, corporate bonds and money market instruments. Many investment products based
on IISL indices have been developed within India and abroad. These include index based derivatives
traded on NSE, Singapore Exchange Ltd. (SGX), Chicago Mercantile Exchange Inc. (CME), Osaka Exchange
Inc. (OSE), Taiwan Futures Exchange (TAIFEX) and a number of index funds and exchange traded funds.
The flagship 'NIFTY 50' index is widely tracked and traded as the benchmark for Indian Capital Markets.
Disclaimer: All information contained herewith is provided for reference purpose only. IISL ensures accuracy and
reliability of the above information to the best of its endeavors. However, IISL makes no warranty or representation as
to the accuracy, completeness or reliability of any of the information contained herein and disclaim any and all liability
whatsoever to any person for any damage or loss of any nature arising from or as a result of reliance on any of the
information provided herein. The information contained in this document is not intended to provide any professional
advice.
Contact:
Email: [email protected]
Tel: +91 22 26598386
Address: Exchange Plaza, Bandra Kurla Complex,
Bandra (East), Mumbai– 400 051(India)
Contact Details
Analytical contact
Aman Singhania, CFA, FRM
Head – Products (IISL)
+91-22-26598214
Business Development contact
Rohit Kumar, FRM
Chief Manager – Business Development
+91-22- 26598386