Embed Size (px)
Citation preview
Morgan Stanley
20 March 2015
Overview of REITsSundareswaran SExecutive Director, Morgan Stanley India
Table of ContentsSection 1 REIT Market Update
Section 2 Investors in REITs
Section 3 Risk-Return Analysis

REIT Market UpdateSection 1
4
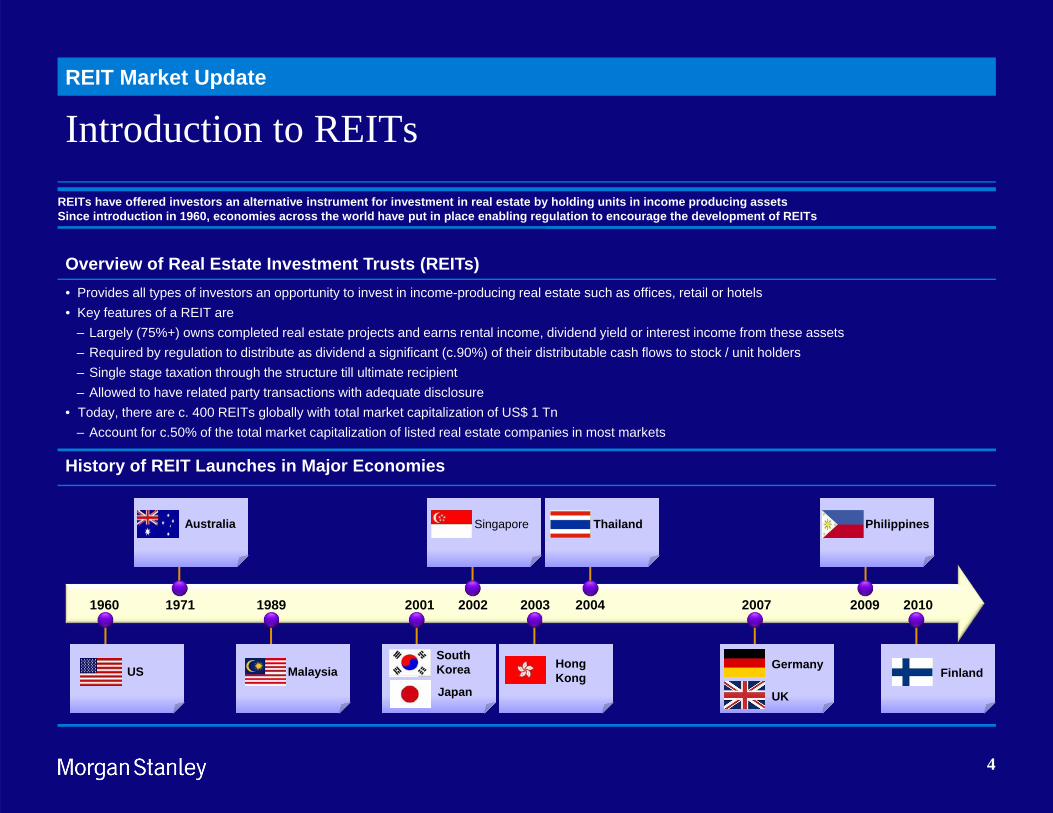
Introduction to REITs
History of REIT Launches in Major Economies
1960 1971 1989 2001 2002 2003 2004 2007 2009 2010
US Malaysia
Australia Singapore Thailand Philippines
Finland
UK
GermanyHong Kong
Japan
South Korea
REITs have offered investors an alternative instrument for investment in real estate by holding units in income producing assetsSince introduction in 1960, economies across the world have put in place enabling regulation to encourage the development of REITs
Overview of Real Estate Investment Trusts (REITs)• Provides all types of investors an opportunity to invest in income-producing real estate such as offices, retail or hotels• Key features of a REIT are
– Largely (75%+) owns completed real estate projects and earns rental income, dividend yield or interest income from these assets – Required by regulation to distribute as dividend a significant (c.90%) of their distributable cash flows to stock / unit holders– Single stage taxation through the structure till ultimate recipient– Allowed to have related party transactions with adequate disclosure
• Today, there are c. 400 REITs globally with total market capitalization of US$ 1 Tn– Account for c.50% of the total market capitalization of listed real estate companies in most markets
REIT Market Update
5
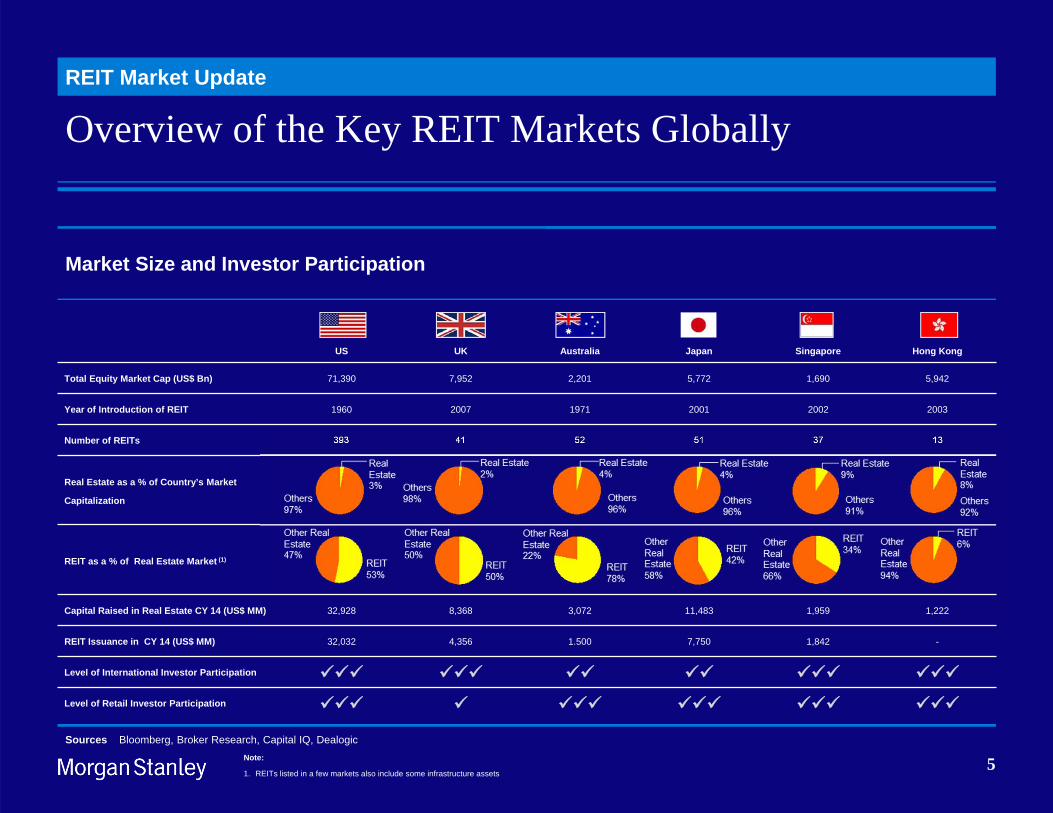
Overview of the Key REIT Markets Globally
Sources Bloomberg, Broker Research, Capital IQ, Dealogic
Market Size and Investor Participation
US UK Australia Japan Singapore Hong Kong
Total Equity Market Cap (US$ Bn) 71,390 7,952 2,201 5,772 1,690 5,942
Year of Introduction of REIT 1960 2007 1971 2001 2002 2003
Number of REITs 393 41 52 51 37 13
Real Estate as a % of Country’s Market
Capitalization
REIT as a % of Real Estate Market (1)
Capital Raised in Real Estate CY 14 (US$ MM) 32,928 8,368 3,072 11,483 1,959 1,222
REIT Issuance in CY 14 (US$ MM) 32,032 4,356 1.500 7,750 1,842 -
Level of International Investor Participation
Level of Retail Investor Participation
REIT Market Update
Note:
1. REITs listed in a few markets also include some infrastructure assets
6
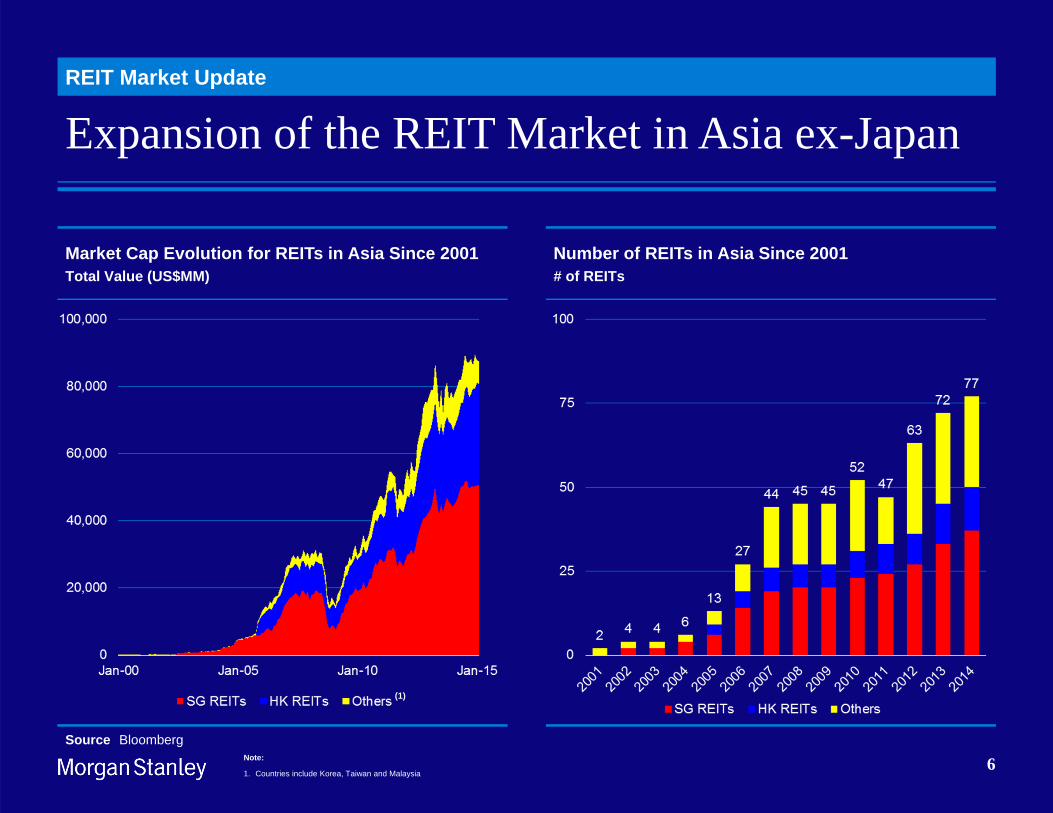
Expansion of the REIT Market in Asia ex-JapanREIT Market Update
Market Cap Evolution for REITs in Asia Since 2001Total Value (US$MM)
(1)
Note:
1. Countries include Korea, Taiwan and Malaysia
Source Bloomberg
Number of REITs in Asia Since 2001# of REITs
7
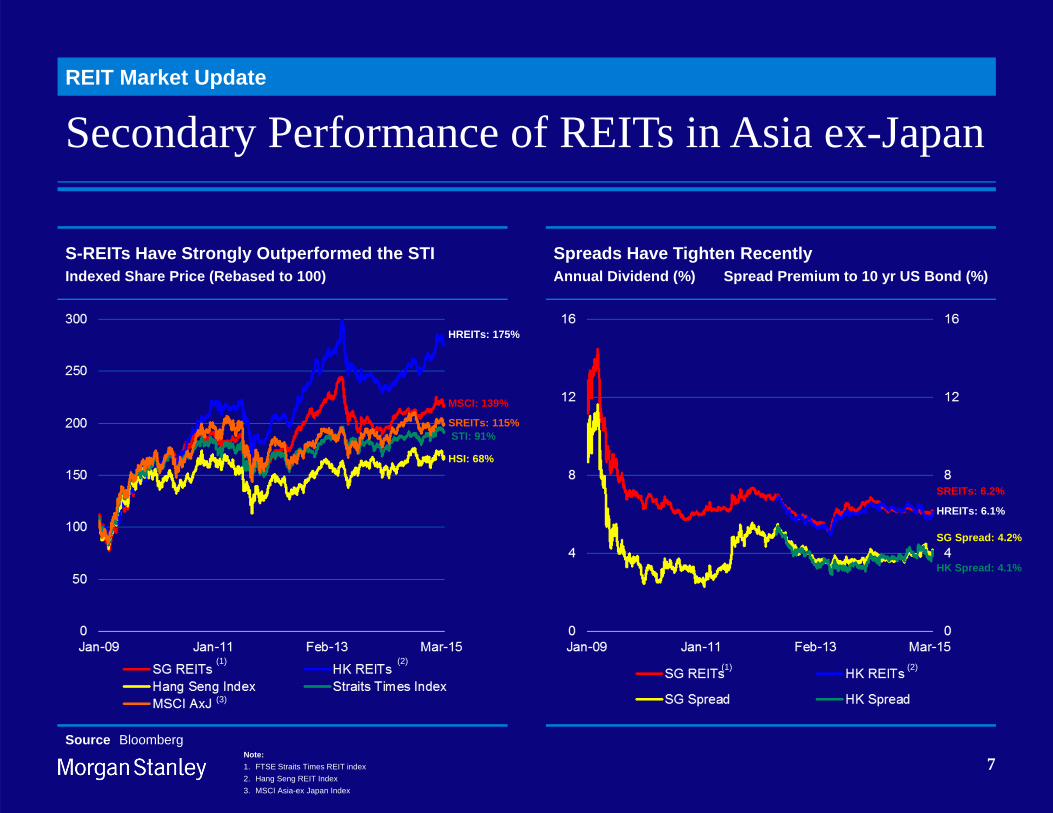
Secondary Performance of REITs in Asia ex-JapanREIT Market Update
Note:1. FTSE Straits Times REIT index2. Hang Seng REIT Index3. MSCI Asia-ex Japan Index
Source Bloomberg
S-REITs Have Strongly Outperformed the STIIndexed Share Price (Rebased to 100)
HREITs: 175%
MSCI: 139%
SREITs: 115%STI: 91%
HSI: 68%
(2)(1)
(3)
Spreads Have Tighten RecentlyAnnual Dividend (%) Spread Premium to 10 yr US Bond (%)
SREITs: 6.2%
HREITs: 6.1%
SG Spread: 4.2%
HK Spread: 4.1%
(2)(1)
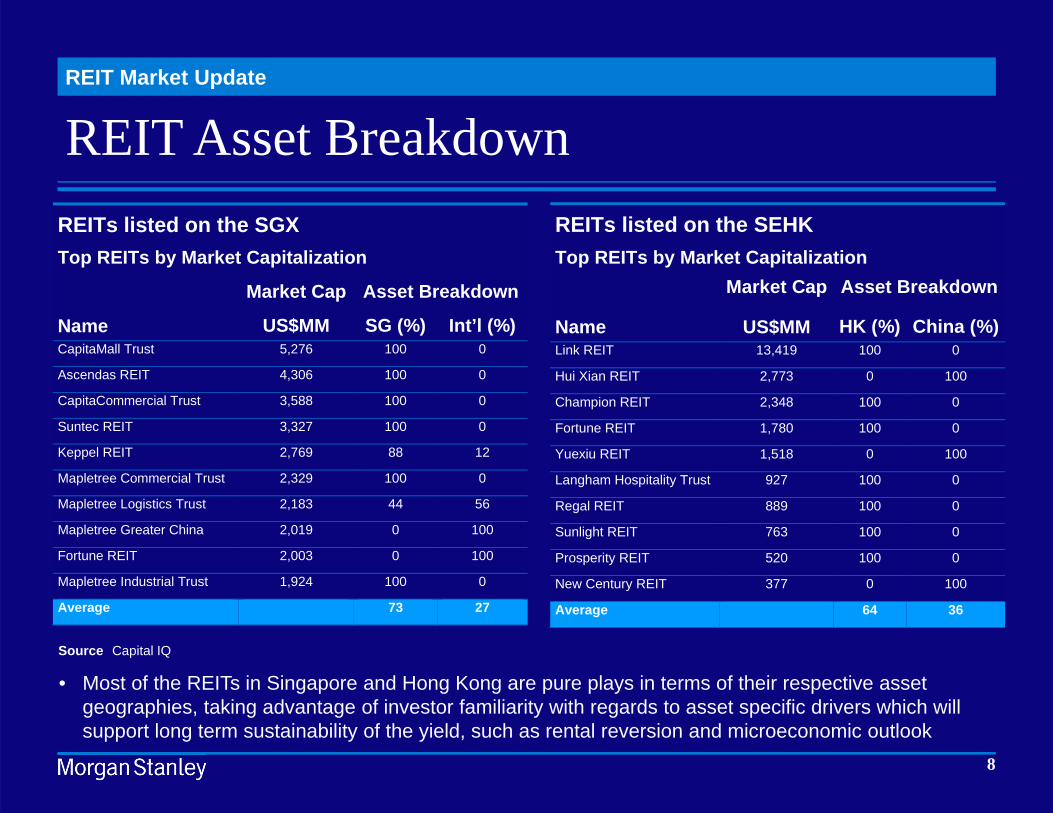
• Most of the REITs in Singapore and Hong Kong are pure plays in terms of their respective asset geographies, taking advantage of investor familiarity with regards to asset specific drivers which will support long term sustainability of the yield, such as rental reversion and microeconomic outlook
REITs listed on the SEHK Top REITs by Market Capitalization Market Cap Asset Breakdown
Name US$MM HK (%) China (%) Link REIT 13,419 100 0
Hui Xian REIT 2,773 0 100
Champion REIT 2,348 100 0
Fortune REIT 1,780 100 0
Yuexiu REIT 1,518 0 100
Langham Hospitality Trust 927 100 0
Regal REIT 889 100 0
Sunlight REIT 763 100 0
Prosperity REIT 520 100 0
New Century REIT 377 0 100
Average 64 36
REIT Asset BreakdownREIT Market Update
8
REITs listed on the SGX Top REITs by Market Capitalization
Market Cap Asset Breakdown Name US$MM SG (%) Int’l (%) CapitaMall Trust 5,276 100 0
Ascendas REIT 4,306 100 0
CapitaCommercial Trust 3,588 100 0
Suntec REIT 3,327 100 0
Keppel REIT 2,769 88 12
Mapletree Commercial Trust 2,329 100 0
Mapletree Logistics Trust 2,183 44 56
Mapletree Greater China 2,019 0 100
Fortune REIT 2,003 0 100
Mapletree Industrial Trust 1,924 100 0
Average 73 27
Source Capital IQ
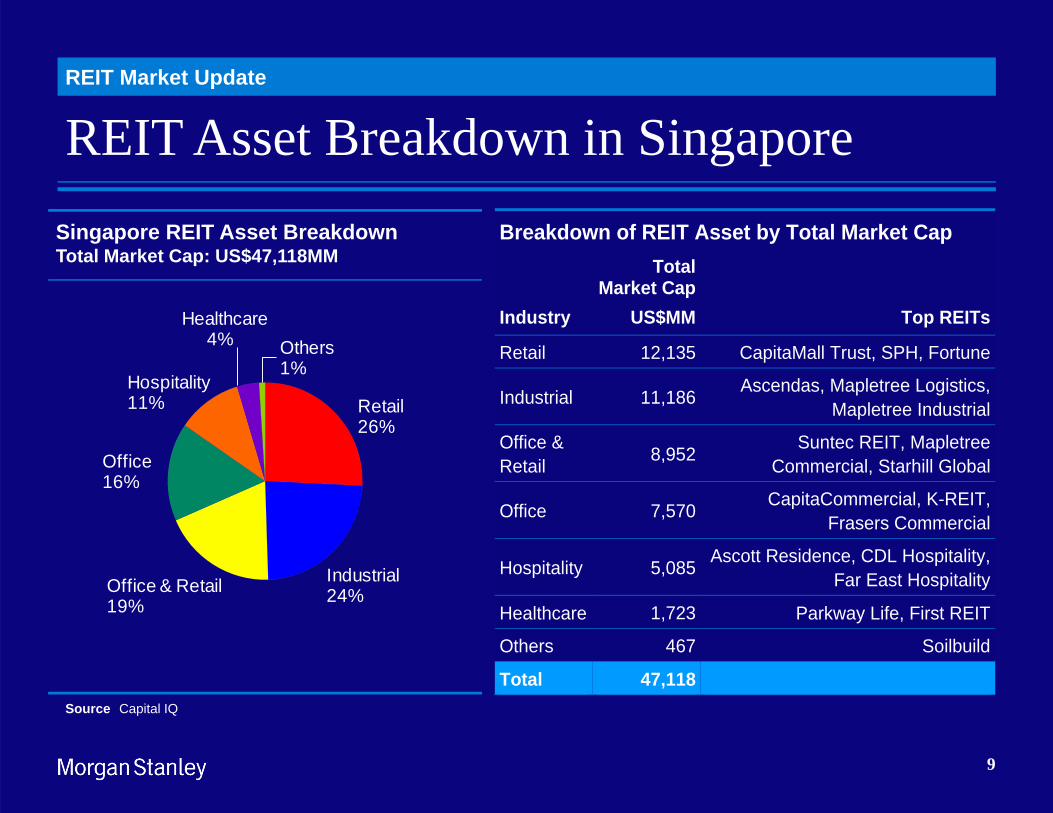
REIT Asset Breakdown in SingaporeREIT Market Update
Breakdown of REIT Asset by Total Market Cap
Industry
Total Market Cap
US$MM Top REITs Retail 12,135 CapitaMall Trust, SPH, Fortune
Industrial 11,186 Ascendas, Mapletree Logistics, Mapletree Industrial
Office & Retail 8,952 Suntec REIT, Mapletree
Commercial, Starhill Global
Office 7,570 CapitaCommercial, K-REIT, Frasers Commercial
Hospitality 5,085 Ascott Residence, CDL Hospitality, Far East Hospitality
Healthcare 1,723 Parkway Life, First REIT
Others 467 Soilbuild
Total 47,118
Retail26%
Industrial24%Office & Retail
19%
Office16%
Hospitality11%
Healthcare4% Others
1%
Singapore REIT Asset BreakdownTotal Market Cap: US$47,118MM
Source Capital IQ
9
Investors in REITsSection 2
11
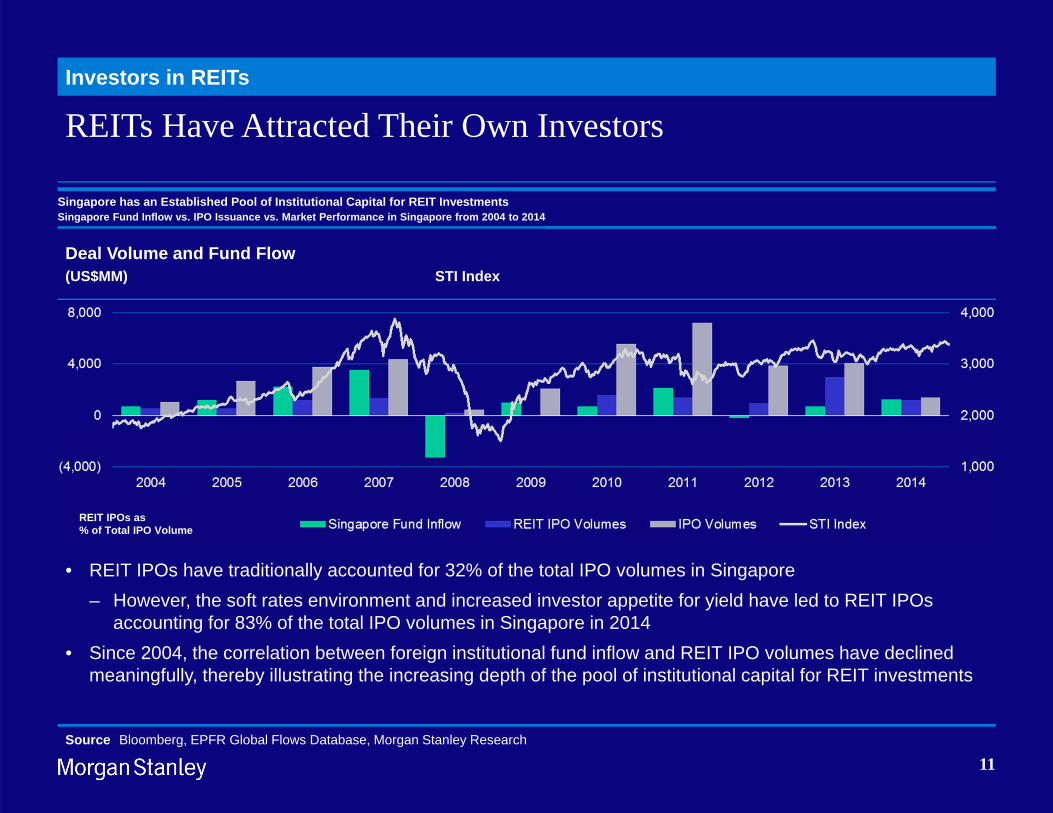
REITs Have Attracted Their Own InvestorsInvestors in REITs
Source Bloomberg, EPFR Global Flows Database, Morgan Stanley Research
Singapore has an Established Pool of Institutional Capital for REIT InvestmentsSingapore Fund Inflow vs. IPO Issuance vs. Market Performance in Singapore from 2004 to 2014
Deal Volume and Fund Flow(US$MM) STI Index
• REIT IPOs have traditionally accounted for 32% of the total IPO volumes in Singapore– However, the soft rates environment and increased investor appetite for yield have led to REIT IPOs
accounting for 83% of the total IPO volumes in Singapore in 2014• Since 2004, the correlation between foreign institutional fund inflow and REIT IPO volumes have declined
meaningfully, thereby illustrating the increasing depth of the pool of institutional capital for REIT investments
REIT IPOs as% of Total IPO Volume
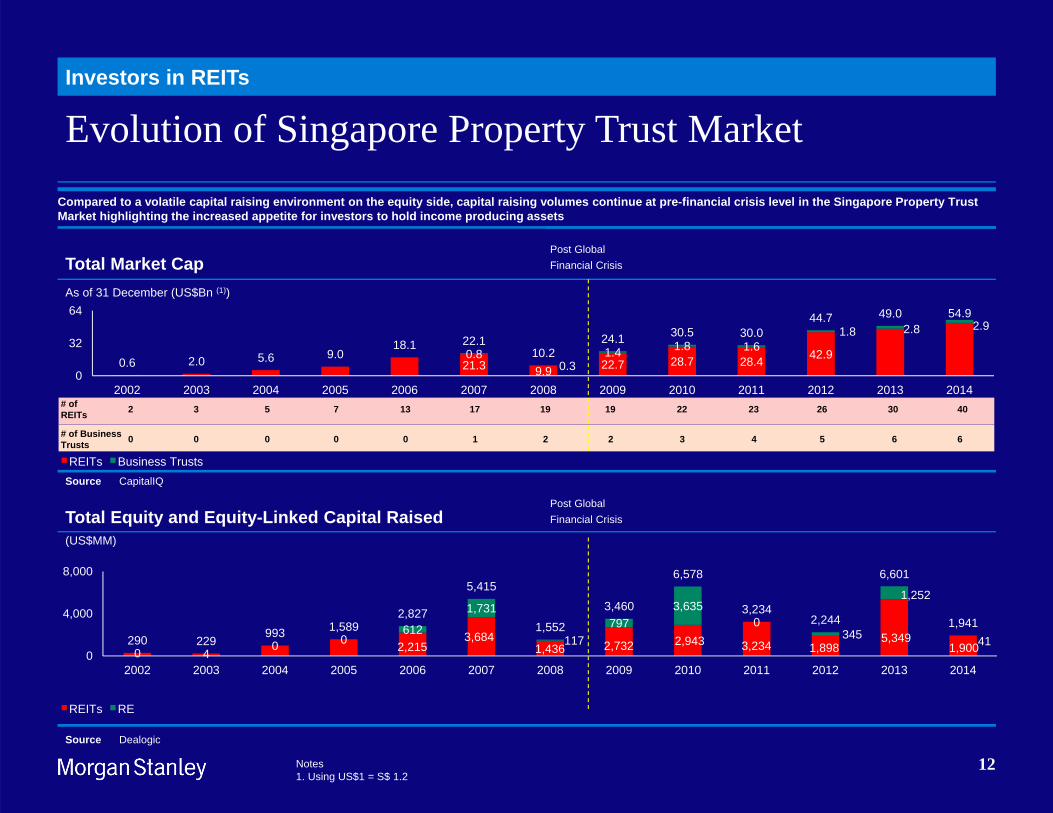
Evolution of Singapore Property Trust Market
Source Dealogic
Notes1. Using US$1 = S$ 1.2
Compared to a volatile capital raising environment on the equity side, capital raising volumes continue at pre-financial crisis level in the Singapore Property Trust Market highlighting the increased appetite for investors to hold income producing assets
Total Equity and Equity-Linked Capital Raised
Total Market CapAs of 31 December (US$Bn (1))
21.3 9.9 22.7 28.7 28.4 42.90.80.3
1.4 1.8 1.61.8 2.8 2.9
0.6 2.0 5.6 9.018.1 22.1
10.224.1 30.5 30.0
44.7 49.0 54.9
0
32
64
2002 2003 2004 2005 2006 2007 2008 2009 2010 2011 2012 2013 20142
0
# of REITs
# of Business Trusts
3
0
5
0
7
0
13
0
17
1
19
2
19
2
22
3
23
4
26
5
30
6
40
6
REITs Business TrustsSource CapitalIQ
(US$MM)
Post GlobalFinancial Crisis
Post GlobalFinancial Crisis
Investors in REITs
12
0 40 0
612
1,731
117797
3,6350
345
1,252
41290 229993 1,589
2,827
5,415
1,552
3,460
6,578
3,2342,244
6,601
1,941
0
4,000
8,000
2002 2003 2004 2005 2006 2007 2008 2009 2010 2011 2012 2013 2014
REITs RE
1,9005,349
1,8983,2342,9432,7321,4363,684
2,215
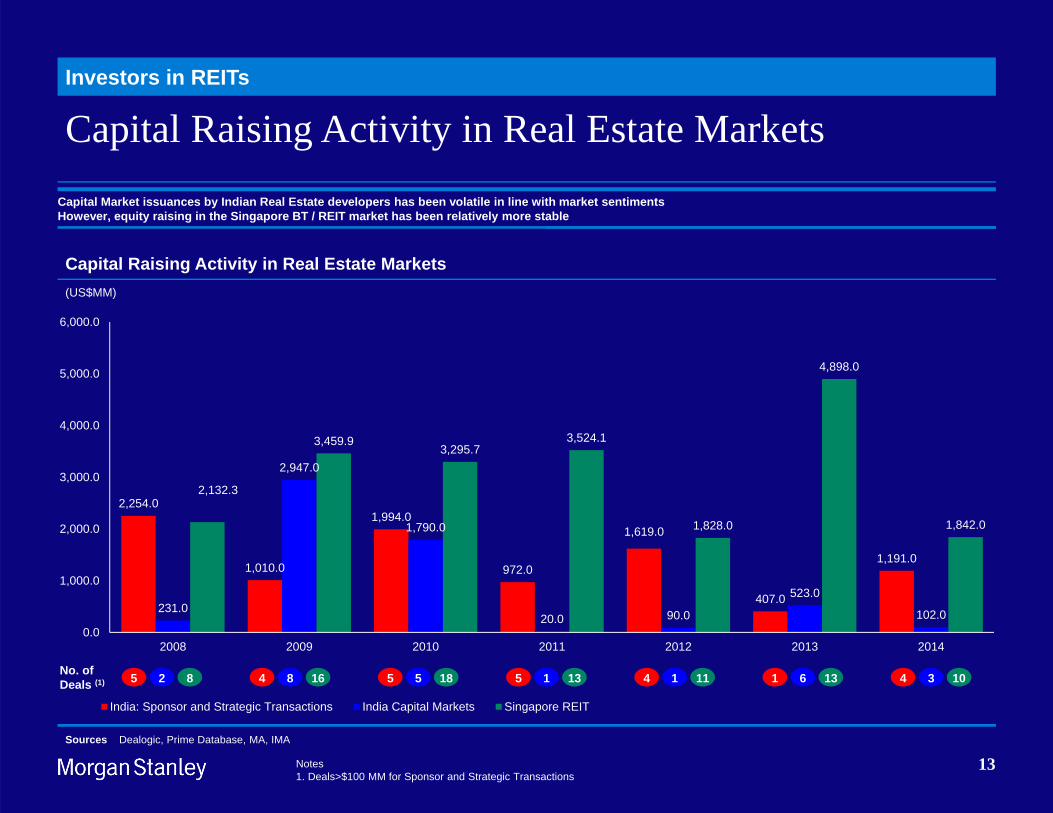
Capital Raising Activity in Real Estate Markets
Sources Dealogic, Prime Database, MA, IMA
Capital Market issuances by Indian Real Estate developers has been volatile in line with market sentimentsHowever, equity raising in the Singapore BT / REIT market has been relatively more stable
Capital Raising Activity in Real Estate Markets(US$MM)
2,254.0
1,010.0
1,994.0
972.0
1,619.0
407.0
1,191.0
231.0
2,947.0
1,790.0
20.0 90.0
523.0
102.0
2,132.3
3,459.93,295.7
3,524.1
1,828.0
4,898.0
1,842.0
0.0
1,000.0
2,000.0
3,000.0
4,000.0
5,000.0
6,000.0
2008 2009 2010 2011 2012 2013 2014
India: Sponsor and Strategic Transactions India Capital Markets Singapore REIT
5 2 8 4 8 16 5 5 18 5 1 13 4 1 11 1 6 13 4 3 10No. of Deals (1)
Investors in REITs
13Notes1. Deals>$100 MM for Sponsor and Strategic Transactions
14
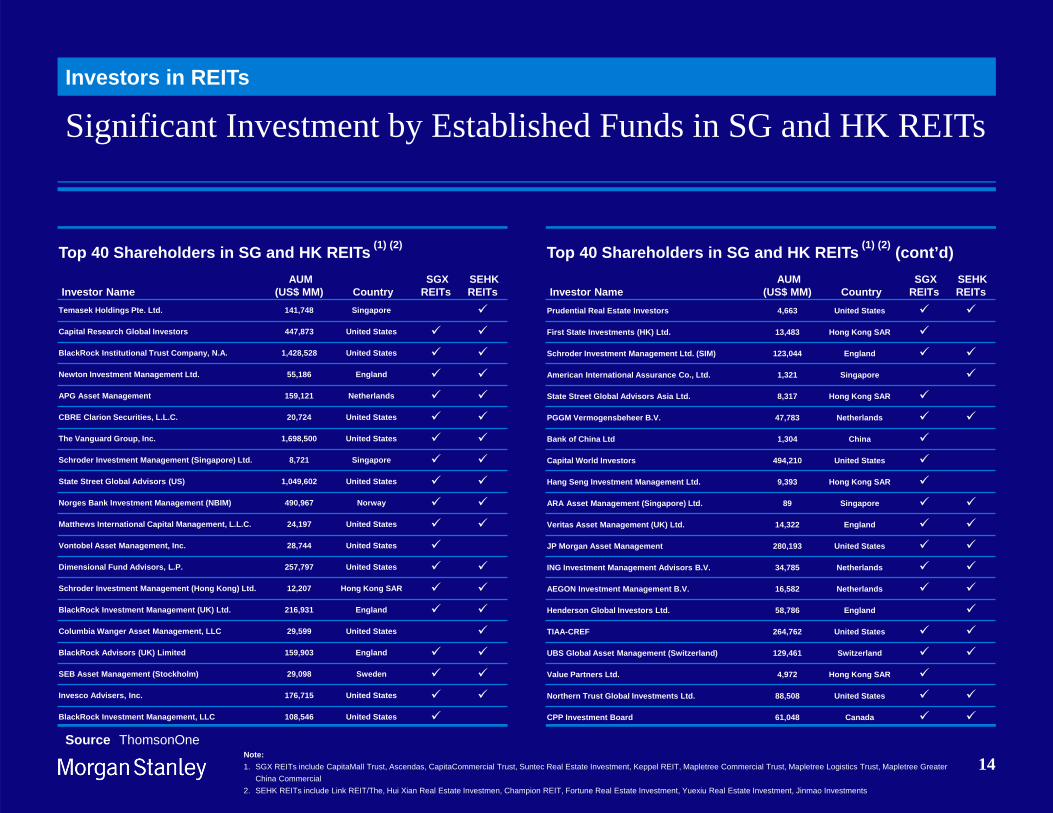
Significant Investment by Established Funds in SG and HK REITsInvestors in REITs
Note:1. SGX REITs include CapitaMall Trust, Ascendas, CapitaCommercial Trust, Suntec Real Estate Investment, Keppel REIT, Mapletree Commercial Trust, Mapletree Logistics Trust, Mapletree Greater
China Commercial2. SEHK REITs include Link REIT/The, Hui Xian Real Estate Investmen, Champion REIT, Fortune Real Estate Investment, Yuexiu Real Estate Investment, Jinmao Investments
Source ThomsonOne
Top 40 Shareholders in SG and HK REITs (1) (2)
Investor Name AUM
(US$ MM) Country SGX
REITs SEHK REITs
Temasek Holdings Pte. Ltd. 141,748 Singapore
Capital Research Global Investors 447,873 United States
BlackRock Institutional Trust Company, N.A. 1,428,528 United States
Newton Investment Management Ltd. 55,186 England
APG Asset Management 159,121 Netherlands
CBRE Clarion Securities, L.L.C. 20,724 United States
The Vanguard Group, Inc. 1,698,500 United States
Schroder Investment Management (Singapore) Ltd. 8,721 Singapore
State Street Global Advisors (US) 1,049,602 United States
Norges Bank Investment Management (NBIM) 490,967 Norway
Matthews International Capital Management, L.L.C. 24,197 United States
Vontobel Asset Management, Inc. 28,744 United States
Dimensional Fund Advisors, L.P. 257,797 United States
Schroder Investment Management (Hong Kong) Ltd. 12,207 Hong Kong SAR
BlackRock Investment Management (UK) Ltd. 216,931 England
Columbia Wanger Asset Management, LLC 29,599 United States
BlackRock Advisors (UK) Limited 159,903 England
SEB Asset Management (Stockholm) 29,098 Sweden
Invesco Advisers, Inc. 176,715 United States
BlackRock Investment Management, LLC 108,546 United States
Top 40 Shareholders in SG and HK REITs (1) (2) (cont’d)
Investor Name AUM
(US$ MM) Country SGX
REITs SEHK REITs
Prudential Real Estate Investors 4,663 United States
First State Investments (HK) Ltd. 13,483 Hong Kong SAR
Schroder Investment Management Ltd. (SIM) 123,044 England
American International Assurance Co., Ltd. 1,321 Singapore
State Street Global Advisors Asia Ltd. 8,317 Hong Kong SAR
PGGM Vermogensbeheer B.V. 47,783 Netherlands
Bank of China Ltd 1,304 China
Capital World Investors 494,210 United States
Hang Seng Investment Management Ltd. 9,393 Hong Kong SAR
ARA Asset Management (Singapore) Ltd. 89 Singapore
Veritas Asset Management (UK) Ltd. 14,322 England
JP Morgan Asset Management 280,193 United States
ING Investment Management Advisors B.V. 34,785 Netherlands
AEGON Investment Management B.V. 16,582 Netherlands
Henderson Global Investors Ltd. 58,786 England
TIAA-CREF 264,762 United States
UBS Global Asset Management (Switzerland) 129,461 Switzerland
Value Partners Ltd. 4,972 Hong Kong SAR
Northern Trust Global Investments Ltd. 88,508 United States
CPP Investment Board 61,048 Canada
Risk-Return AnalysisSection 3
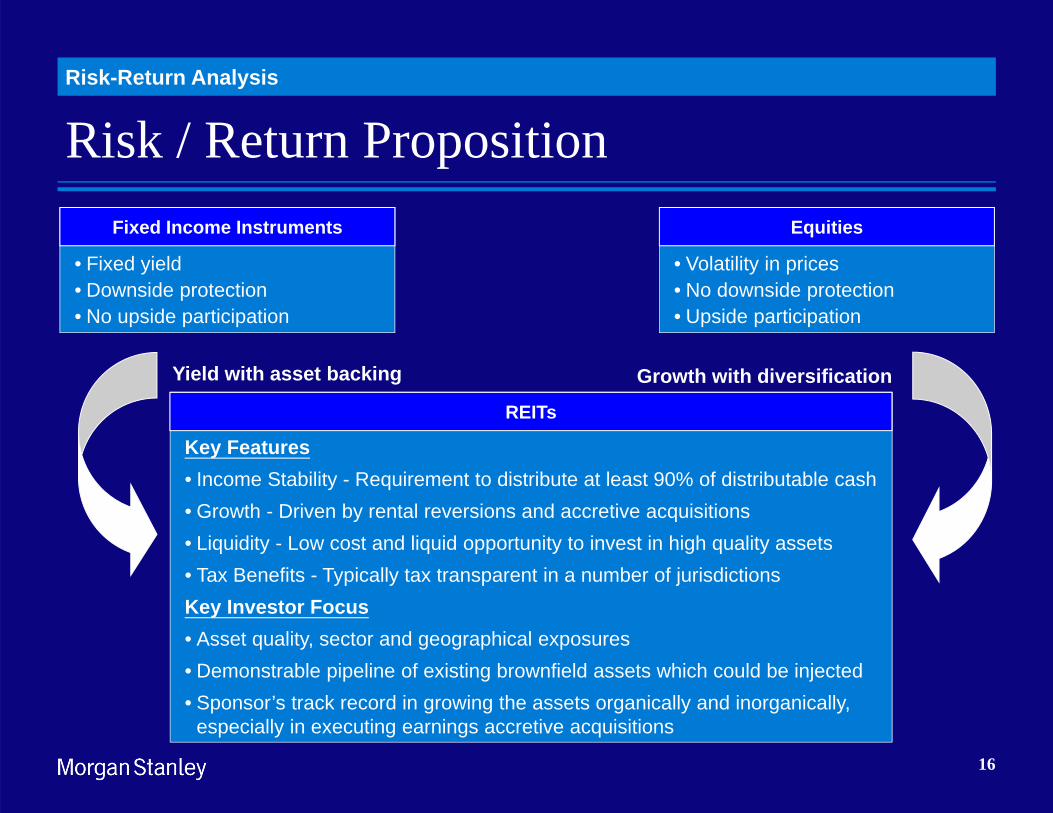
Risk / Return PropositionRisk-Return Analysis
16
• Fixed yield• Downside protection• No upside participation
Fixed Income Instruments
• Volatility in prices• No downside protection• Upside participation
Equities
Key Features• Income Stability - Requirement to distribute at least 90% of distributable cash• Growth - Driven by rental reversions and accretive acquisitions• Liquidity - Low cost and liquid opportunity to invest in high quality assets• Tax Benefits - Typically tax transparent in a number of jurisdictionsKey Investor Focus• Asset quality, sector and geographical exposures• Demonstrable pipeline of existing brownfield assets which could be injected• Sponsor’s track record in growing the assets organically and inorganically,
especially in executing earnings accretive acquisitions
REITs
Yield with asset backing Growth with diversification
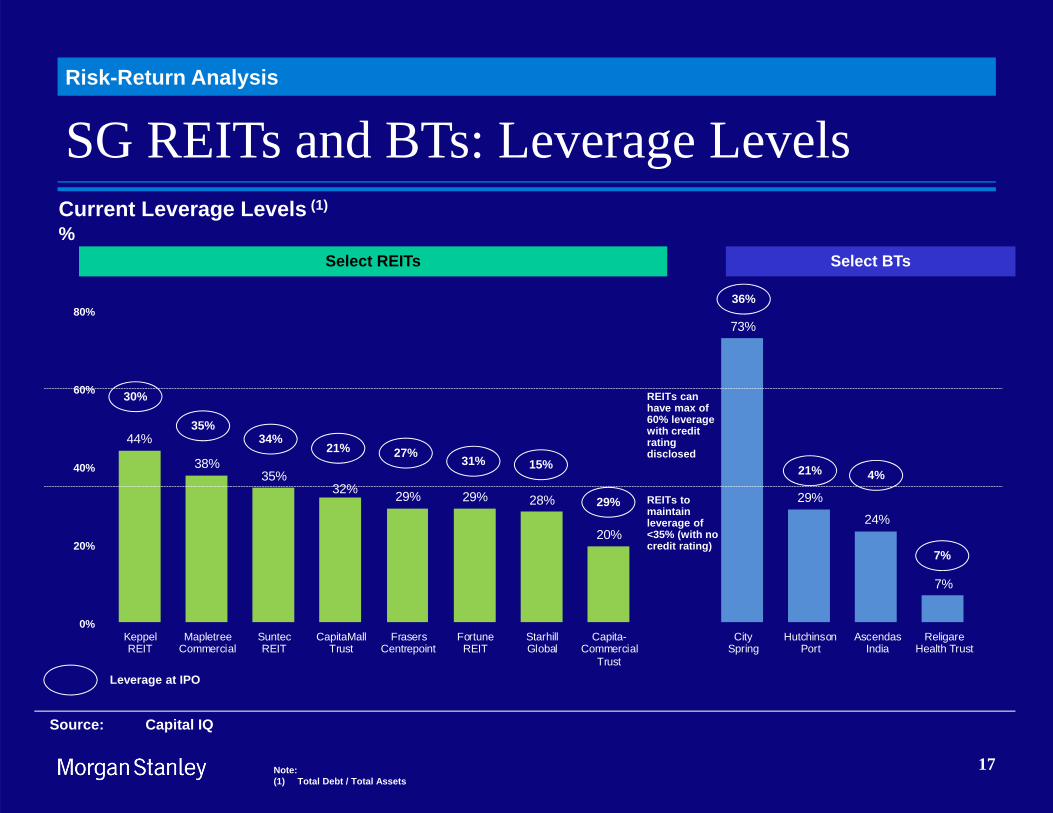
44%
38%35%
32% 29% 29% 28%
20%
73%
29%
24%
7%
0%
20%
40%
60%
80%
KeppelREIT
MapletreeCommercial
SuntecREIT
CapitaMallTrust
FrasersCentrepoint
FortuneREIT
StarhillGlobal
Capita-Commercial
Trust
CitySpring
HutchinsonPort
AscendasIndia
ReligareHealth Trust
Current Leverage Levels (1)
%
Note:(1) Total Debt / Total Assets
Source: Capital IQ
21%
36%
4%
7%
Leverage at IPO
30%
35%34%
21% 27%15%
29%
31%
REITs to maintain leverage of <35% (with no credit rating)
REITs can have max of 60% leverage with credit rating disclosed
17
SG REITs and BTs: Leverage LevelsRisk-Return Analysis
Select REITs Select BTs
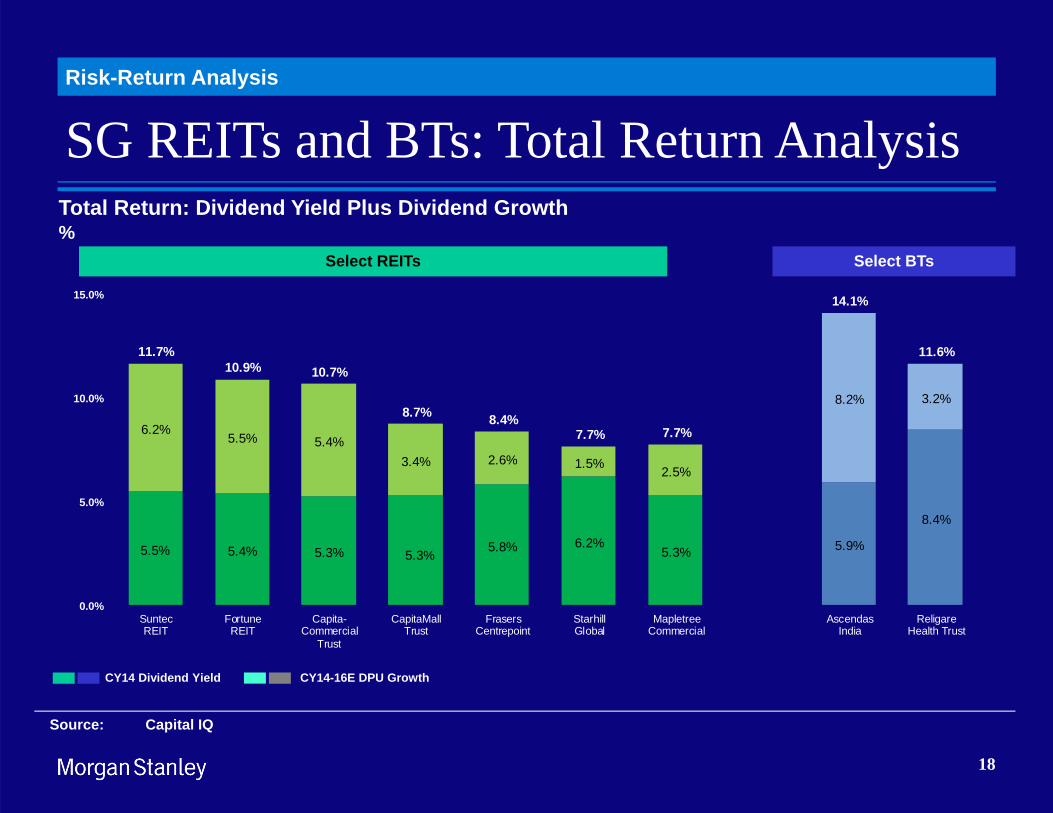
5.5% 5.4% 5.3% 5.3% 5.8% 6.2%5.3% 5.9%
8.4%
6.2%5.5% 5.4%
3.4% 2.6% 1.5% 2.5%
8.2% 3.2%
11.7%10.9% 10.7%
8.7% 8.4%7.7% 7.7%
14.1%
11.6%
0.0%
5.0%
10.0%
15.0%
SuntecREIT
FortuneREIT
Capita-Commercial
Trust
CapitaMallTrust
FrasersCentrepoint
StarhillGlobal
MapletreeCommercial
AscendasIndia
ReligareHealth Trust
Total Return: Dividend Yield Plus Dividend Growth%
Source: Capital IQ
CY14-16E DPU GrowthCY14 Dividend Yield
Select REITs Select BTs
18
SG REITs and BTs: Total Return AnalysisRisk-Return Analysis


![[Najib Razali] Islamic REITS - prres.net REITs.pdfDo Islamic REITs Behave Differently from Conventional REITs? – Empirical Evidence from Malaysian REITs Sing Tien Foo National University](https://img.pdfslide.us/doc/110x75/5abe8db57f8b9a7e418d14eb/najib-razali-islamic-reits-prres-reitspdfdo-islamic-reits-behave-differently.jpg)