Embed Size (px)
Citation preview
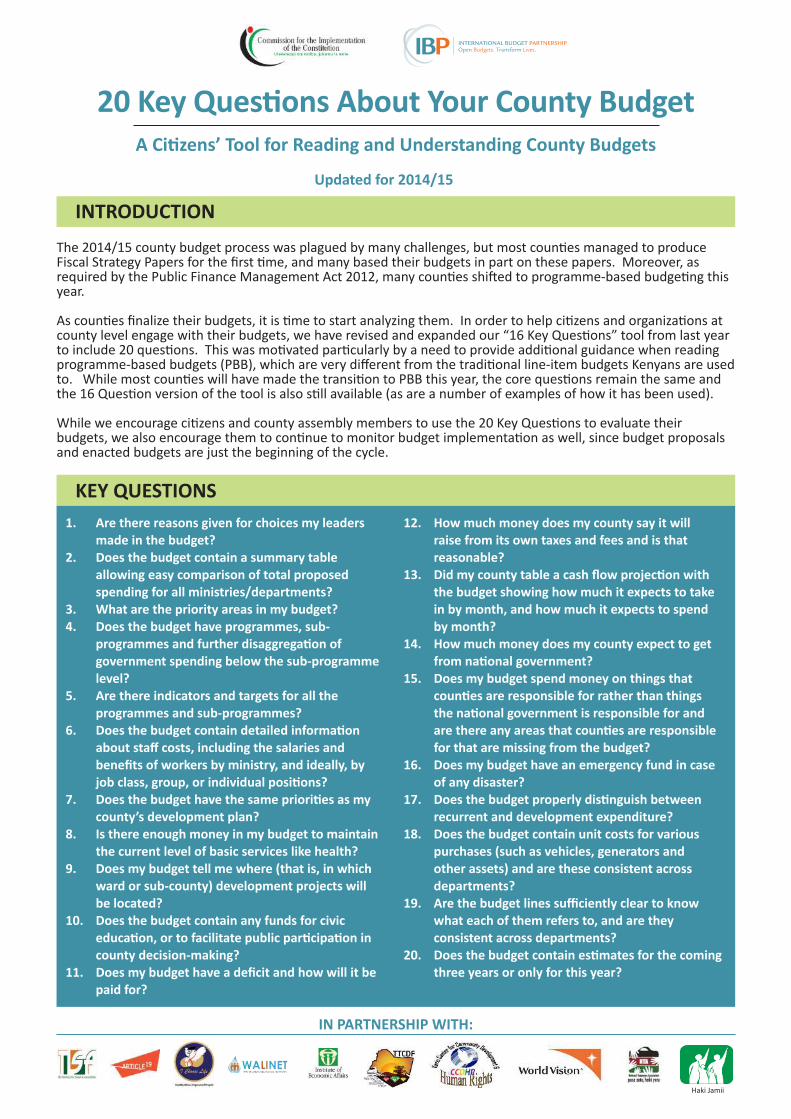
20 Key Questions About Your County BudgetA Citizens’ Tool for Reading and Understanding County Budgets
INTRODUCTION
The 2014/15 county budget process was plagued by many challenges, but most counties managed to produce Fiscal Strategy Papers for the first time, and many based their budgets in part on these papers. Moreover, as required by the Public Finance Management Act 2012, many counties shifted to programme-based budgeting this year.
As counties finalize their budgets, it is time to start analyzing them. In order to help citizens and organizations at county level engage with their budgets, we have revised and expanded our “16 Key Questions” tool from last year to include 20 questions. This was motivated particularly by a need to provide additional guidance when reading programme-based budgets (PBB), which are very different from the traditional line-item budgets Kenyans are used to. While most counties will have made the transition to PBB this year, the core questions remain the same and the 16 Question version of the tool is also still available (as are a number of examples of how it has been used).
While we encourage citizens and county assembly members to use the 20 Key Questions to evaluate their budgets, we also encourage them to continue to monitor budget implementation as well, since budget proposals and enacted budgets are just the beginning of the cycle.
KEY QUESTIONS1. Are there reasons given for choices my leaders
made in the budget? 2. Does the budget contain a summary table
allowing easy comparison of total proposed spending for all ministries/departments?
3. What are the priority areas in my budget?4. Does the budget have programmes, sub-
programmes and further disaggregation of government spending below the sub-programme level?
5. Are there indicators and targets for all the programmes and sub-programmes?
6. Does the budget contain detailed information about staff costs, including the salaries and benefits of workers by ministry, and ideally, by job class, group, or individual positions?
7. Does the budget have the same priorities as my county’s development plan?
8. Is there enough money in my budget to maintain the current level of basic services like health?
9. Does my budget tell me where (that is, in which ward or sub-county) development projects will be located?
10. Does the budget contain any funds for civic education, or to facilitate public participation in county decision-making?
11. Does my budget have a deficit and how will it be paid for?
12. How much money does my county say it will raise from its own taxes and fees and is that reasonable?
13. Did my county table a cash flow projection with the budget showing how much it expects to take in by month, and how much it expects to spend by month?
14. How much money does my county expect to get from national government?
15. Does my budget spend money on things that counties are responsible for rather than things the national government is responsible for and are there any areas that counties are responsible for that are missing from the budget?
16. Does my budget have an emergency fund in case of any disaster?
17. Does the budget properly distinguish between recurrent and development expenditure?
18. Does the budget contain unit costs for various purchases (such as vehicles, generators and other assets) and are these consistent across departments?
19. Are the budget lines sufficiently clear to know what each of them refers to, and are they consistent across departments?
20. Does the budget contain estimates for the coming three years or only for this year?
Updated for 2014/15
IN PARTNERSHIP WITH:
Haki Jamii
2 20 Key Questions About Your County Budget
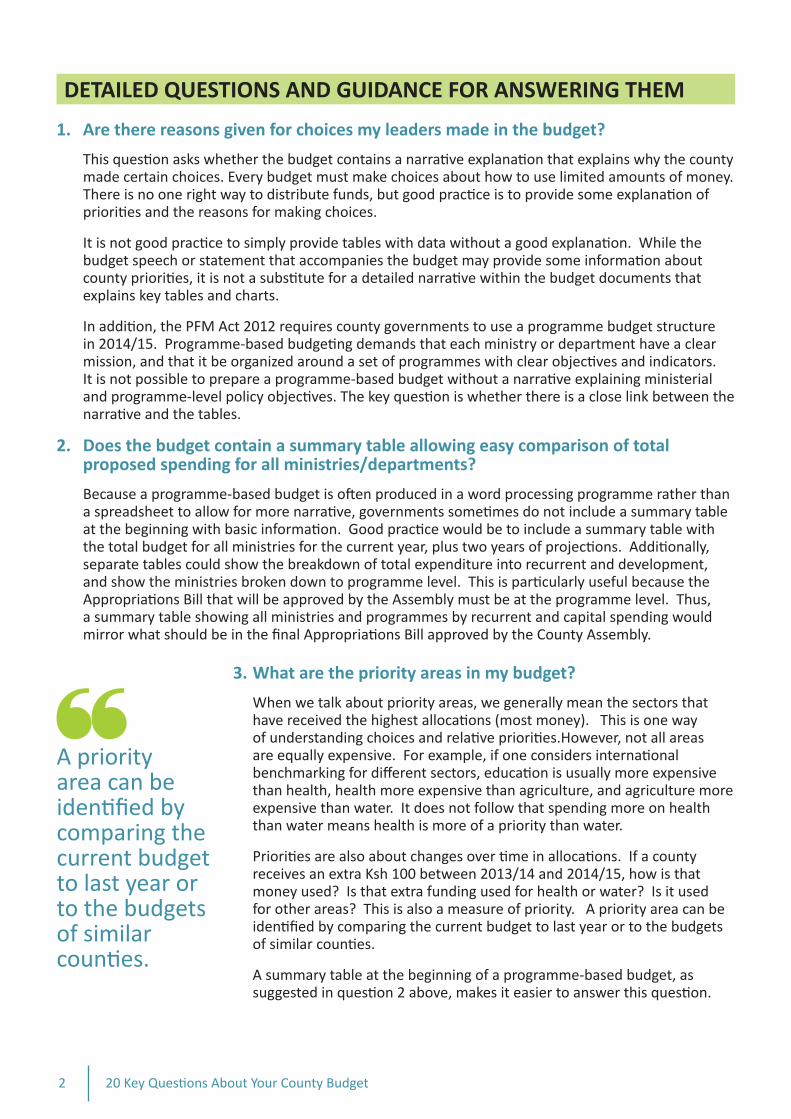
DETAILED QUESTIONS AND GUIDANCE FOR ANSWERING THEM
1. Are there reasons given for choices my leaders made in the budget?
This question asks whether the budget contains a narrative explanation that explains why the county made certain choices. Every budget must make choices about how to use limited amounts of money. There is no one right way to distribute funds, but good practice is to provide some explanation of priorities and the reasons for making choices.
It is not good practice to simply provide tables with data without a good explanation. While the budget speech or statement that accompanies the budget may provide some information about county priorities, it is not a substitute for a detailed narrative within the budget documents that explains key tables and charts.
In addition, the PFM Act 2012 requires county governments to use a programme budget structure in 2014/15. Programme-based budgeting demands that each ministry or department have a clear mission, and that it be organized around a set of programmes with clear objectives and indicators. It is not possible to prepare a programme-based budget without a narrative explaining ministerial and programme-level policy objectives. The key question is whether there is a close link between the narrative and the tables.
2. Does the budget contain a summary table allowing easy comparison of total proposed spending for all ministries/departments?
Because a programme-based budget is often produced in a word processing programme rather than a spreadsheet to allow for more narrative, governments sometimes do not include a summary table at the beginning with basic information. Good practice would be to include a summary table with the total budget for all ministries for the current year, plus two years of projections. Additionally, separate tables could show the breakdown of total expenditure into recurrent and development, and show the ministries broken down to programme level. This is particularly useful because the Appropriations Bill that will be approved by the Assembly must be at the programme level. Thus, a summary table showing all ministries and programmes by recurrent and capital spending would
mirror what should be in the final Appropriations Bill approved by the County Assembly.
A priority area can be identified by comparing the current budget to last year or to the budgets of similar counties.
3. What are the priority areas in my budget?
When we talk about priority areas, we generally mean the sectors that have received the highest allocations (most money). This is one way of understanding choices and relative priorities.However, not all areas are equally expensive. For example, if one considers international benchmarking for different sectors, education is usually more expensive than health, health more expensive than agriculture, and agriculture more expensive than water. It does not follow that spending more on health than water means health is more of a priority than water.
Priorities are also about changes over time in allocations. If a county receives an extra Ksh 100 between 2013/14 and 2014/15, how is that money used? Is that extra funding used for health or water? Is it used for other areas? This is also a measure of priority. A priority area can be identified by comparing the current budget to last year or to the budgets of similar counties.
A summary table at the beginning of a programme-based budget, as suggested in question 2 above, makes it easier to answer this question.
320 Key Questions About Your County Budget
4. Does the budget have programmes, sub-programmes and further disaggregation of government spending below the sub-programme level?
As noted above, the PFM Act requires counties to use programme-based budgeting in 2014/15. In order for a budget to meet the standard of a programme-based budget, each programme must have clear objectives so that the reader knows what the programme does. A programme is a way of bringing together activities of government that all aim to achieve a common purpose, such as reducing crime or improving population health.
The number of programmes and sub-programmes in a programme-based budget really determines the level of detail that a reader has about how the government is using money and for what purpose. Because programmes are often themselves too broad to really identify the focus of spending, it is usually important to have further breakdown to the sub-programme level. Each sub-programme should have its own objectives as well. Below the subprogrammes, there should be an economic classification of spending with information on wages, capital projects, and different goods and services to be purchased.
While ministries need a number of programmes and sub-programmes to provide sufficient explanation of government spending, it is also possible to have too many programmes with overlapping objectives that can become confusing. Moreover, while programmes and sub-programmes should be clear and distinct, they should also be sufficiently broad to prevent the need to reorganize ministries every year to accommodate new government initiatives.
5. Are there indicators and targets for all the programmes and sub-programmes?
There should be clear indicators and targets for each ministry in a programme-based budget. These indicators and targets should be linked to specific programmes and sub-programmes within the ministry. The indicators should be logical, have a clear baseline and clear timeframes to achieve the targets. The targets should be measurable and should be easy to relate back to the programme and sub-programme objectives.
The choice of indicators and targets should be linked to the most important objectives of the ministry, but should also be designed keeping in mind what kind of information is available and can be regularly collected. Some indicators may be ideal for tracking objectives, but may require expensive surveys that can only be conducted every five years. These types of indicators cannot be realistically tracked during a single year, or even three years. Some administrative targets may be less important, but easier to track (were certain workshops or studies conducted?). Counties must find a balance between what is important and what can actually be measured. There should be a clear link between the indicators and targets in the budget and those in
the County Integrated Development Plan.
6. Does the budget contain detailed information about staff costs, including the salaries and benefits of workers by ministry, and ideally, by job class, group, or individual positions?
A key concern when reviewing the budget is to understand what share of each ministry’s spending goes to wages versus other costs. Moreover, it is useful to know what kind of workers each ministry is employing to understand how much
of public spending is going to service delivery, how much to administration, and how much to other types of support services. Good practice is to present the total share of ministry
Good practice is to present the total share of ministry
spending going to compensation,
and then to break this down
further to provide information on the
types of workers and their costs.
4 20 Key Questions About Your County Budget
spending going to compensation, and then to break this down further to provide information on the types of workers and their costs. This also applies to the county assembly budget, which should distinguish between wages and benefits of MCAs and other employees of the assembly.
7. Does the budget have the same priorities as my county’s development plan?
Technically, counties should base their budgets on an Annual Development Plan tabled in September every year. Most counties opted to produce a 5-year County Integrated Development Plan first, so few produced Annual Plans this year. While all counties should have finalized their CIDPs, not all counties have plans that have been approved by the Assembly yet. But all counties have draft plans that can be used to answer this question.
There have been challenges in producing these plans, and a weakness is that many County Integrated Development Plans are not closely linked to county sector plans as they should be. Nevertheless, the law requires that the budget be based on county plans, and the priorities in the CIDP (or whatever plans are currently available) should be the same as the priorities in the budget. This means that if the plans focus on health, agriculture and water, the budget should do the same. This should be apparent at the level of programmes and projects.
8. Is there enough money in my budget to maintain the current level of basic services like health?
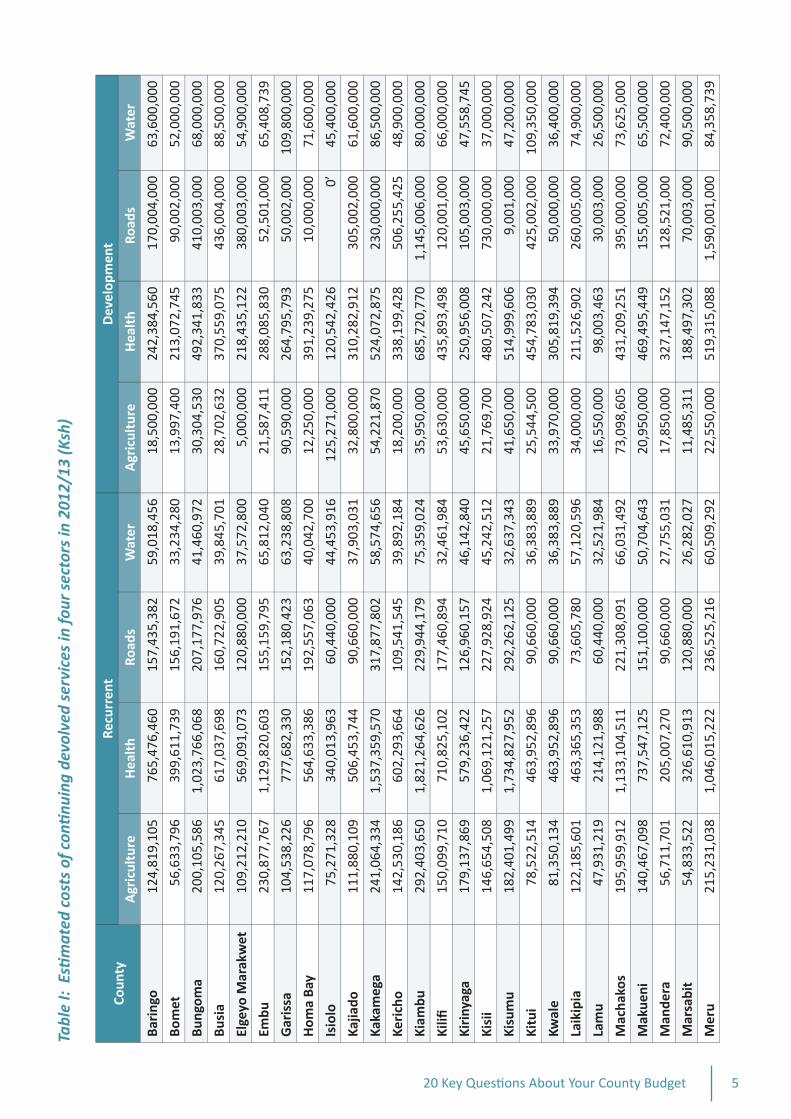
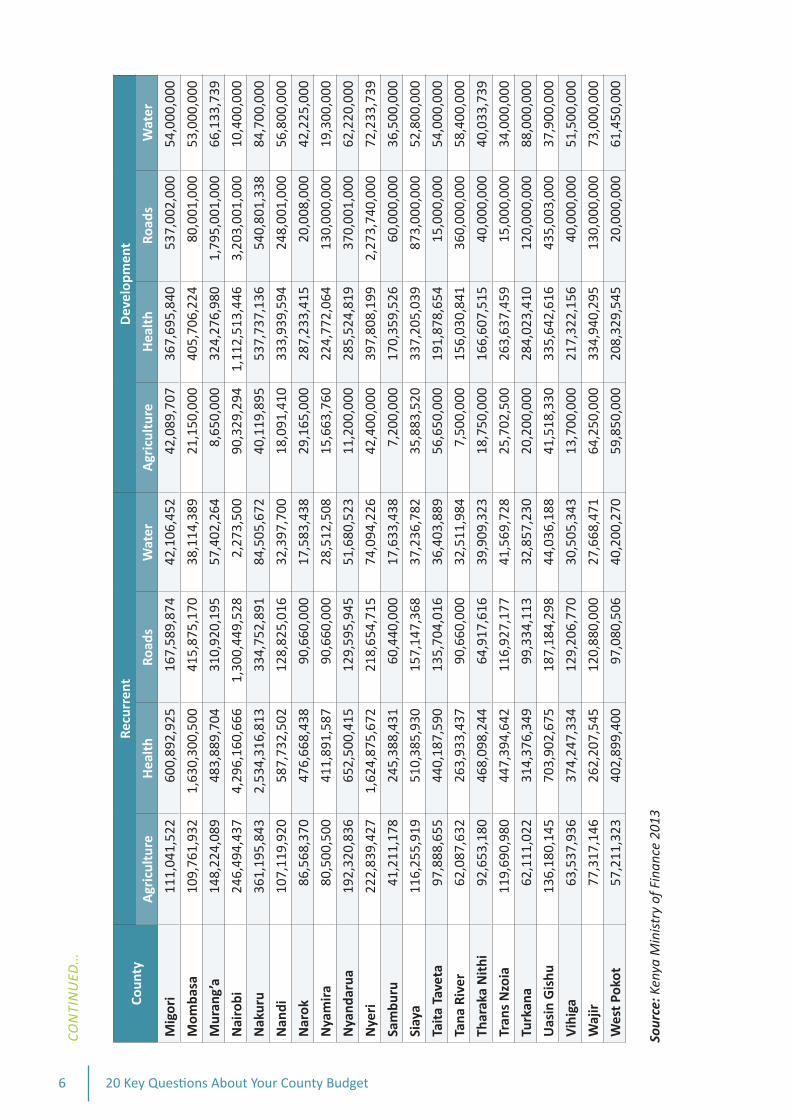
In order to know the answer to this question, one has to look at how much it cost to deliver services in previous years. In 2012/13, counties did not exist, but we can look at estimates of how much was spent by national government on devolved services that year. This is the baseline for what should have been spent in 2013/14 to maintain services. To view some of this Treasury data, refer to Budget Brief 19, “County Budgets: How do we know if there is enough to maintain key services,” on the IBP website, http://internationalbudget.org/wp-content/uploads/brief19.pdf. The full
underlying data is also available at www.internationalbudget.org/kenya below the link for Budget Brief 19. And some of this data is also available below in Table I. (See page 5)
In 2014/15, we can compare figures to the 2013/14 budget and the 2012/13 budget to get a sense of whether enough money is being allocated to maintain services. Since many counties did not have full information about their costs in 2013/14, it is important to use figures from 2012/13 as well to get a sense of the true service costs. It may be that over the course of 2013/14, it was discovered that 2012/13 costs were improper. For example, the county may have released a number of ghost workers, allowing it to reduce costs. Or it may have found that it could not sustain its existing facilities with the 2012/13 budget. In that case, the 2014/15 figures may deviate substantially from 2012/13. If so, this should be explained in the budget narrative.
For a proper comparison, we focus on the recurrent budgets
for key sectors. The reason we do this is that development spending tends to be less consistent over time, due to the nature of capital projects. Recurrent funding is more closely linked to the minimum costs of maintaining services through wages and inputs.
For a proper comparison,
we focus on the recurrent budgets
for key sectors...Recurrent funding is more closely linked
to the minimum costs of maintaining
services through wages and inputs.
520 Key Questions About Your County Budget
Tabl
e I:
Esti
mat
ed co
sts o
f con
tinui
ng d
evol
ved
serv
ices
in fo
ur se
ctor
s in
2012
/13
(Ksh
)
Coun
tyRe
curr
ent
Dev
elop
men
t
Agr
icul
ture
Hea
lth
Road
sW
ater
Agr
icul
ture
Hea
lth
Road
sW
ater
Bari
ngo
124,
819,
105
765,
476,
460
157
,435
,382
5
9,01
8,45
6 1
8,5
00
,00
024
2,38
4,56
0 1
70
,00
4,0
00
6
3,60
0,00
0
Bom
et56
,633
,796
399,
611,
739
156
,191
,672
3
3,23
4,28
0 13
,997
,400
213,
072,
745
90,
002,
000
52
,00
0,0
00
Bung
oma
200,
105,
586
1,02
3,76
6,06
8 2
07,1
77,9
76
41,
460,
972
30,3
04,5
3049
2,34
1,83
3 4
10,0
03,0
00
68,
000,
000
Busi
a12
0,26
7,34
561
7,03
7,69
8 1
60,7
22,9
05
39,
845,
701
28,7
02,6
3237
0,55
9,07
5 4
36,0
04,0
00
88
,50
0,0
00
Elge
yo M
arak
wet
109,
212,
210
569,
091,
073
12
0,8
80
,00
0
37,
572,
800
5,0
00
,00
021
8,43
5,12
2 3
80,0
03,0
00
54,
900,
000
Embu
230,
877,
767
1,12
9,82
0,60
3 1
55,1
59,7
95
65,
812,
040
21
,58
7,4
11
288,
085,
830
52
,50
1,0
00
6
5,40
8,73
9
Gar
issa
104,
538,
226
777,
682,
330
152
,180
,423
6
3,23
8,80
8 90
,590
,000
264,
795,
793
50
,00
2,0
00
1
09,8
00,0
00
Hom
a Ba
y11
7,07
8,79
656
4,63
3,38
6 1
92,5
57,0
63
40
,04
2,7
00
1
2,2
50
,00
039
1,23
9,27
5 1
0,0
00
,00
0
71,
600,
000
Isio
lo75
,271
,328
340,
013,
963
60,
440,
000
44,
453,
916
12
5,2
71
,00
012
0,54
2,42
6 0
’ 4
5,4
00
,00
0
Kajia
do11
1,88
0,10
950
6,45
3,74
4 9
0,66
0,00
0 3
7,90
3,03
1 32
,800
,000
310,
282,
912
305
,002
,000
6
1,60
0,00
0
Kaka
meg
a24
1,06
4,33
41,
537,
359,
570
317
,877
,802
5
8,57
4,65
6 5
4,2
21
,87
05
24
,07
2,8
75
230
,000
,000
8
6,50
0,00
0
Keri
cho
142,
530,
186
602,
293,
664
109
,541
,545
3
9,89
2,18
4 1
8,2
00
,00
033
8,19
9,42
8 5
06,2
55,4
25
48,
900,
000
Kiam
bu29
2,40
3,65
01,
821,
264,
626
229
,944
,179
7
5,35
9,02
4 35
,950
,000
685,
720,
770
1,1
45,0
06,0
00
80
,00
0,0
00
Kilifi
150,
099,
710
71
0,8
25
,10
2 1
77,4
60,8
94
32,
461,
984
53,6
30,0
0043
5,89
3,49
8 1
20
,00
1,0
00
6
6,00
0,00
0
Kiri
nyag
a17
9,13
7,86
957
9,23
6,42
2 1
26,9
60,1
57
46,
142,
840
45,6
50,0
0025
0,95
6,00
8 1
05,0
03,0
00
47
,55
8,7
45
Kisi
i14
6,65
4,50
81,
069,
121,
257
227
,928
,924
4
5,2
42
,51
2
21,7
69,7
004
80
,50
7,2
42
730
,000
,000
3
7,00
0,00
0
Kisu
mu
182,
401,
499
1,73
4,82
7,95
2 2
92,2
62,1
25
32,
637,
343
41,6
50,0
0051
4,99
9,60
6 9
,001
,000
4
7,2
00
,00
0
Kitu
i7
8,5
22
,51
446
3,95
2,89
6 9
0,66
0,00
0 3
6,38
3,88
9 2
5,5
44
,50
045
4,78
3,03
0 4
25
,00
2,0
00
1
09,3
50,0
00
Kwal
e81
,350
,134
463,
952,
896
90,
660,
000
36,
383,
889
33,9
70,0
0030
5,81
9,39
4 5
0,0
00
,00
0
36,
400,
000
Laik
ipia
122,
185,
601
463,
365,
353
73,
605,
780
57,
120,
596
34,0
00,0
0021
1,52
6,90
2 2
60,0
05,0
00
74,
900,
000
Lam
u47
,931
,219
214,
121,
988
60,
440,
000
32,
521,
984
16,5
50,0
0098
,003
,463
30,
003,
000
26,
500,
000
Mac
hako
s19
5,95
9,91
21,
133,
104,
511
221
,308
,091
6
6,03
1,49
2 73
,098
,605
431,
209,
251
395
,000
,000
7
3,62
5,00
0
Mak
ueni
140,
467,
098
737,
547,
125
15
1,1
00
,00
0
50,
704,
643
20,9
50,0
0046
9,49
5,44
9 1
55
,00
5,0
00
6
5,50
0,00
0
Man
dera
56,7
11,7
012
05
,00
7,2
70
90,
660,
000
27,
755,
031
17
,85
0,0
00
327,
147,
152
12
8,5
21
,00
0
72
,40
0,0
00
Mar
sabi
t54
,833
,522
326,
610,
913
12
0,8
80
,00
0
26,
282,
027
11,4
85,3
1118
8,49
7,30
2 7
0,00
3,00
0 9
0,50
0,00
0
Mer
u21
5,23
1,03
81,
046,
015,
222
236
,525
,216
6
0,50
9,29
2 2
2,5
50
,00
051
9,31
5,08
8 1
,590
,001
,000
8
4,35
8,73
9
6 20 Key Questions About Your County Budget
Coun
tyRe
curr
ent
Dev
elop
men
t
Agr
icul
ture
Hea
lth
Road
sW
ater
Agr
icul
ture
Hea
lth
Road
sW
ater
Mig
ori
11
1,0
41
,52
260
0,89
2,92
5 1
67,5
89,8
74
42,
106,
452
42,0
89,7
0736
7,69
5,84
0 5
37,0
02,0
00
54
,00
0,0
00
Mom
basa
109,
761,
932
1,63
0,30
0,50
0 4
15
,87
5,1
70
3
8,11
4,38
9 2
1,1
50
,00
040
5,70
6,22
4 8
0,0
01
,00
0
53,
000,
000
Mur
ang’
a14
8,22
4,08
948
3,88
9,70
4 3
10,9
20,1
95
57,
402,
264
8,65
0,00
032
4,27
6,98
0 1
,795
,001
,000
6
6,13
3,73
9
Nai
robi
246,
494,
437
4,29
6,16
0,66
6 1
,300
,449
,528
2
,273
,500
90
,329
,294
1,11
2,51
3,44
6 3
,203
,001
,000
1
0,4
00
,00
0
Nak
uru
361,
195,
843
2,53
4,31
6,81
3 3
34,7
52,8
91
84,
505,
672
40,1
19,8
9553
7,73
7,13
6 5
40,8
01,3
38
84
,70
0,0
00
Nan
di10
7,11
9,92
058
7,73
2,50
2 1
28,8
25,0
16
32,
397,
700
18,0
91,4
1033
3,93
9,59
4 2
48
,00
1,0
00
5
6,80
0,00
0
Nar
ok86
,568
,370
476,
668,
438
90,
660,
000
17,
583,
438
29,1
65,0
0028
7,23
3,41
5 2
0,0
08
,00
0
42
,22
5,0
00
Nya
mir
a8
0,5
00
,50
041
1,89
1,58
7 9
0,66
0,00
0 2
8,5
12
,50
8
15,6
63,7
6022
4,77
2,06
4 1
30,0
00,0
00
19,
300,
000
Nya
ndar
ua19
2,32
0,83
665
2,50
0,41
5 1
29,5
95,9
45
51,
680,
523
11
,20
0,0
00
285,
524,
819
370
,001
,000
6
2,22
0,00
0
Nye
ri22
2,83
9,42
71,
624,
875,
672
218
,654
,715
7
4,09
4,22
6 4
2,4
00
,00
039
7,80
8,19
9 2
,273
,740
,000
7
2,23
3,73
9
Sam
buru
41
,21
1,1
78
245,
388,
431
60,
440,
000
17,
633,
438
7,2
00
,00
017
0,35
9,52
6 6
0,00
0,00
0 3
6,50
0,00
0
Siay
a11
6,25
5,91
951
0,38
5,93
0 1
57,1
47,3
68
37,
236,
782
35,8
83,5
2033
7,20
5,03
9 8
73,0
00,0
00
52
,80
0,0
00
Tait
a Ta
veta
97,8
88,6
5544
0,18
7,59
0 1
35,7
04,0
16
36,
403,
889
56,6
50,0
0019
1,87
8,65
4 1
5,0
00
,00
0
54
,00
0,0
00
Tana
Riv
er62
,087
,632
263,
933,
437
90,
660,
000
32,
511,
984
7,5
00
,00
015
6,03
0,84
1 3
60,0
00,0
00
58
,40
0,0
00
Thar
aka
Nit
hi92
,653
,180
468,
098,
244
64,
917,
616
39,
909,
323
18
,75
0,0
00
166,
607,
515
40
,00
0,0
00
4
0,03
3,73
9
Tran
s N
zoia
119,
690,
980
447,
394,
642
116
,927
,177
4
1,56
9,72
8 2
5,7
02
,50
026
3,63
7,45
9 1
5,0
00
,00
0
34,
000,
000
Turk
ana
62,1
11,0
2231
4,37
6,34
9 9
9,33
4,11
3 3
2,85
7,23
0 2
0,2
00
,00
028
4,02
3,41
0 1
20
,00
0,0
00
8
8,0
00
,00
0
Uas
in G
ishu
136,
180,
145
703,
902,
675
187
,184
,298
4
4,03
6,18
8 41
,518
,330
335,
642,
616
435
,003
,000
3
7,90
0,00
0
Vih
iga
63,5
37,9
3637
4,24
7,33
4 1
29,2
06,7
70
30,
505,
343
13,7
00,0
0021
7,32
2,15
6 4
0,0
00
,00
0
51
,50
0,0
00
Waj
ir77
,317
,146
262,
207,
545
12
0,8
80
,00
0
27,
668,
471
64,2
50,0
0033
4,94
0,29
5 1
30,0
00,0
00
73,
000,
000
Wes
t Po
kot
57,2
11,3
2340
2,89
9,40
0 9
7,08
0,50
6 4
0,2
00
,27
0
59,8
50,0
0020
8,32
9,54
5 2
0,0
00
,00
0
61,
450,
000
CO
NT
INU
ED
...
Sour
ce: K
en
ya
Min
istr
y o
f F
ina
nce
20
13
720 Key Questions About Your County Budget
9. Does my budget tell me where (that is, in which ward or sub-county) development projects will be located?
In order to assess the degree to which the budget is allocating resources equitably, we want to know where buildings and infrastructure will be located. This requires that spending information be broken down below the county level (to sub-county or ward). Generally, this information should be included in the part of the budget that details development (capital) expenditure. This information should allow us to assess whether the distribution of these projects is related to the needs of the areas receiving them, and whether funds are fairly distributed across the county.
10. Does the budget contain any funds for civic education, or to facilitate public participation in county decision-making?
The Fourth Schedule of the Constitution assigns to counties the role of ensuring community participation in governance. The County Governments Act requires counties to facilitate public participation in a number of ways. These include, among others: meetings where plans, budgets and government performance can be discussed, opportunities to give inputs on bills and policies, to participate in selecting development projects, citizen commissions in various sectors, and a variety of information dissemination platforms (e.g., through notice boards). Since these activities are not free, the county should budget for them in some way and this should be clearly indicated.
Moreover, the budget should contain some narrative information explaining how comments or suggestions from the public were incorporated into the budget. If these inputs were not included in the budget, then this should also be explained.
11. Does my budget have a deficit and how will it be paid for?
Many counties have deficits. A deficit has to be financed somehow, and this almost always means taking a loan. But loans are not permitted without national sign-off, which is unlikely at this time. Given this, it is also important to know what will be cut from the budget if the deficit cannot be financed.
In the first year, the Controller of Budget was clear that deficits were not allowed. The position is similar in 2014/15. Any county proposing a deficit must have information about how it plans to fund that deficit. There should also be evidence in the budget that borrowing has been allowed by national government if a county is presenting a deficit.
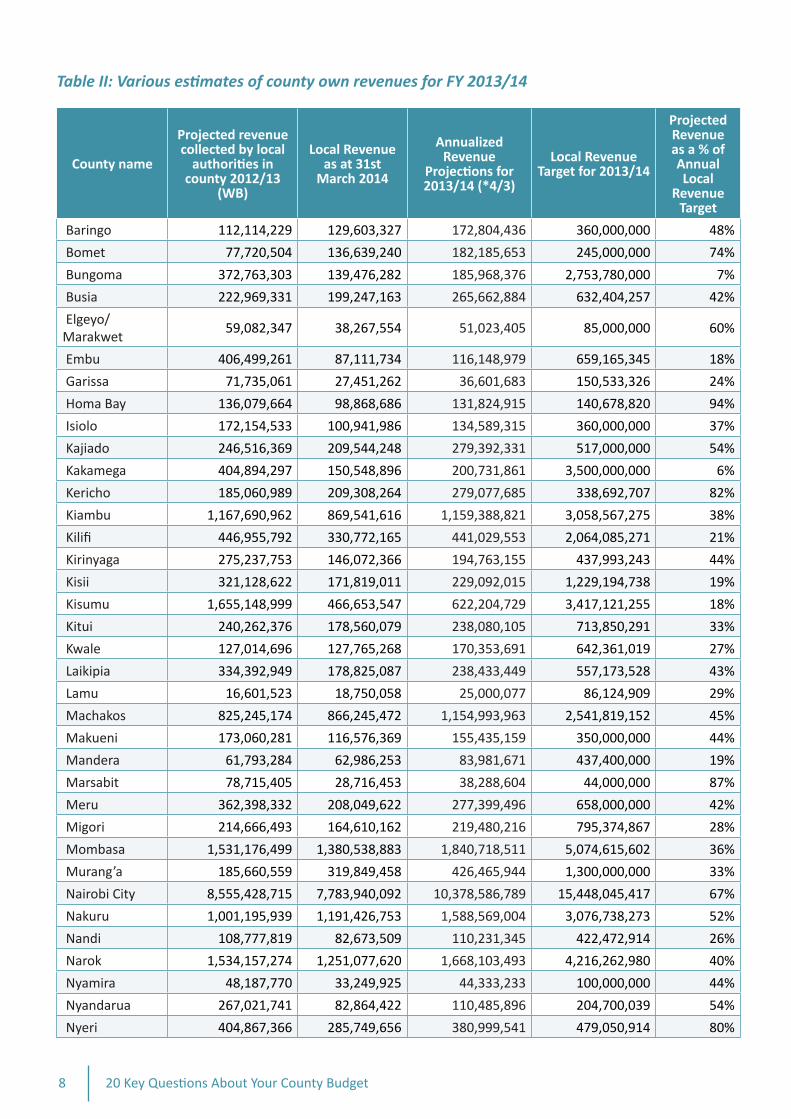
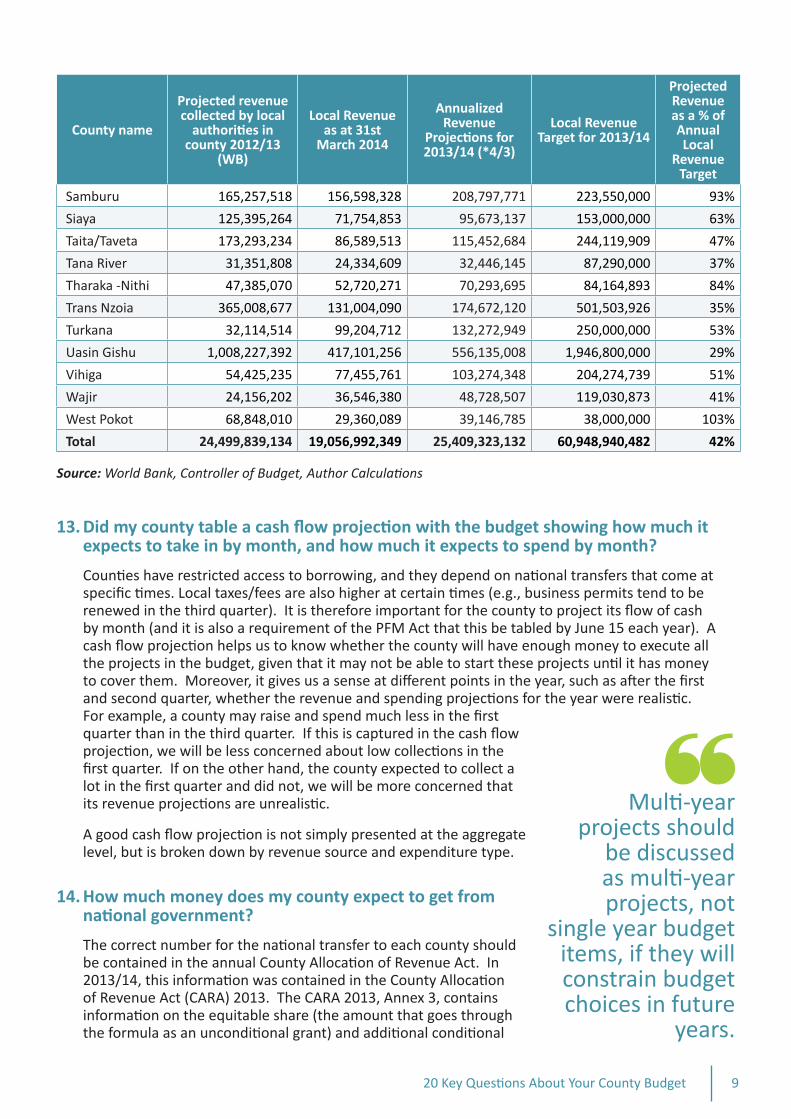
12. How much money does my county say it will raise from its own taxes and fees and is that reasonable?
Counties mostly receive money from national transfers and from their own taxes and fees. Good practice is to clearly show local revenue estimates against previous year estimates and actuals. Revenue sources should be broken down by source, and it should be easy to connect this information to what is in the county’s cash flow projections for revenues.
Many counties have estimated very high revenues from their own sources. To know if these are reasonable, one could compare them to what local authorities were able to raise from similar sources. The Parliamentary Budget Office has estimated this for 2010/11. You can compare your county estimates to these to get a sense of what is reasonable. This data is contained in the 2012/13 PBO report. The World Bank also has updated estimates for 2012/13 contained in Table II here. (See
page 8 )
We now also have some data from the Controller of Budget that tells us how much counties have actually been able to raise during their first year. By projecting these figures out for an additional quarter, we can estimate what they are likely to collect (soon, we will have a full year of actual collections to use as a baseline).
8 20 Key Questions About Your County Budget
County name
Projected revenue collected by local
authorities in county 2012/13
(WB)
Local Revenue as at 31st
March 2014
Annualized Revenue
Projections for 2013/14 (*4/3)
Local Revenue Target for 2013/14
Projected Revenue as a % of Annual Local
Revenue Target
Baringo 112,114,229 129,603,327 172,804,436 360,000,000 48%
Bomet 77,720,504 136,639,240 182,185,653 245,000,000 74%
Bungoma 372,763,303 139,476,282 185,968,376 2,753,780,000 7%
Busia 222,969,331 199,247,163 265,662,884 632,404,257 42%
Elgeyo/Marakwet
59,082,347 38,267,554 51,023,405 85,000,000 60%
Embu 406,499,261 87,111,734 116,148,979 659,165,345 18%
Garissa 71,735,061 27,451,262 36,601,683 150,533,326 24%
Homa Bay 136,079,664 98,868,686 131,824,915 140,678,820 94%
Isiolo 172,154,533 100,941,986 134,589,315 360,000,000 37%
Kajiado 246,516,369 209,544,248 279,392,331 517,000,000 54%
Kakamega 404,894,297 150,548,896 200,731,861 3,500,000,000 6%
Kericho 185,060,989 209,308,264 279,077,685 338,692,707 82%
Kiambu 1,167,690,962 869,541,616 1,159,388,821 3,058,567,275 38%
Kilifi 446,955,792 330,772,165 441,029,553 2,064,085,271 21%
Kirinyaga 275,237,753 146,072,366 194,763,155 437,993,243 44%
Kisii 321,128,622 171,819,011 229,092,015 1,229,194,738 19%
Kisumu 1,655,148,999 466,653,547 622,204,729 3,417,121,255 18%
Kitui 240,262,376 178,560,079 238,080,105 713,850,291 33%
Kwale 127,014,696 127,765,268 170,353,691 642,361,019 27%
Laikipia 334,392,949 178,825,087 238,433,449 557,173,528 43%
Lamu 16,601,523 18,750,058 25,000,077 86,124,909 29%
Machakos 825,245,174 866,245,472 1,154,993,963 2,541,819,152 45%
Makueni 173,060,281 116,576,369 155,435,159 350,000,000 44%
Mandera 61,793,284 62,986,253 83,981,671 437,400,000 19%
Marsabit 78,715,405 28,716,453 38,288,604 44,000,000 87%
Meru 362,398,332 208,049,622 277,399,496 658,000,000 42%
Migori 214,666,493 164,610,162 219,480,216 795,374,867 28%
Mombasa 1,531,176,499 1,380,538,883 1,840,718,511 5,074,615,602 36%
Murang’a 185,660,559 319,849,458 426,465,944 1,300,000,000 33%
Nairobi City 8,555,428,715 7,783,940,092 10,378,586,789 15,448,045,417 67%
Nakuru 1,001,195,939 1,191,426,753 1,588,569,004 3,076,738,273 52%
Nandi 108,777,819 82,673,509 110,231,345 422,472,914 26%
Narok 1,534,157,274 1,251,077,620 1,668,103,493 4,216,262,980 40%
Nyamira 48,187,770 33,249,925 44,333,233 100,000,000 44%
Nyandarua 267,021,741 82,864,422 110,485,896 204,700,039 54%
Nyeri 404,867,366 285,749,656 380,999,541 479,050,914 80%
Table II: Various estimates of county own revenues for FY 2013/14
920 Key Questions About Your County Budget
13. Did my county table a cash flow projection with the budget showing how much it expects to take in by month, and how much it expects to spend by month?
Counties have restricted access to borrowing, and they depend on national transfers that come at specific times. Local taxes/fees are also higher at certain times (e.g., business permits tend to be renewed in the third quarter). It is therefore important for the county to project its flow of cash by month (and it is also a requirement of the PFM Act that this be tabled by June 15 each year). A cash flow projection helps us to know whether the county will have enough money to execute all the projects in the budget, given that it may not be able to start these projects until it has money to cover them. Moreover, it gives us a sense at different points in the year, such as after the first and second quarter, whether the revenue and spending projections for the year were realistic. For example, a county may raise and spend much less in the first quarter than in the third quarter. If this is captured in the cash flow projection, we will be less concerned about low collections in the first quarter. If on the other hand, the county expected to collect a lot in the first quarter and did not, we will be more concerned that its revenue projections are unrealistic.
A good cash flow projection is not simply presented at the aggregate level, but is broken down by revenue source and expenditure type.
14. How much money does my county expect to get from national government?
The correct number for the national transfer to each county should be contained in the annual County Allocation of Revenue Act. In 2013/14, this information was contained in the County Allocation of Revenue Act (CARA) 2013. The CARA 2013, Annex 3, contains information on the equitable share (the amount that goes through the formula as an unconditional grant) and additional conditional
Multi-year projects should
be discussed as multi-year projects, not
single year budget items, if they will constrain budget choices in future
years.
Samburu 165,257,518 156,598,328 208,797,771 223,550,000 93%
Siaya 125,395,264 71,754,853 95,673,137 153,000,000 63%
Taita/Taveta 173,293,234 86,589,513 115,452,684 244,119,909 47%
Tana River 31,351,808 24,334,609 32,446,145 87,290,000 37%
Tharaka -Nithi 47,385,070 52,720,271 70,293,695 84,164,893 84%
Trans Nzoia 365,008,677 131,004,090 174,672,120 501,503,926 35%
Turkana 32,114,514 99,204,712 132,272,949 250,000,000 53%
Uasin Gishu 1,008,227,392 417,101,256 556,135,008 1,946,800,000 29%
Vihiga 54,425,235 77,455,761 103,274,348 204,274,739 51%
Wajir 24,156,202 36,546,380 48,728,507 119,030,873 41%
West Pokot 68,848,010 29,360,089 39,146,785 38,000,000 103%
Total 24,499,839,134 19,056,992,349 25,409,323,132 60,948,940,482 42%
County name
Projected revenue collected by local
authorities in county 2012/13
(WB)
Local Revenue as at 31st
March 2014
Annualized Revenue
Projections for 2013/14 (*4/3)
Local Revenue Target for 2013/14
Projected Revenue as a % of Annual Local
Revenue Target
Source: World Bank, Controller of Budget, Author Calculations
10 20 Key Questions About Your County Budget
grants that counties received for regional hospitals (provincial and high volume hospitals), donor-financed projects, and the Equalization Fund. The Act is available at http://kenyalaw.org/kl/fileadmin/pdfdownloads/Acts/CountyAllocationofRevenueActNo34of2013.pdf.
In 2014/15, the passage of the CARA has been delayed, and counties would only be able to consult the County Allocation of Revenue Bill 2014, which has changed substantially due to changes in the Division of Revenue Bill 2014. Nevertheless, the CARB 2014 remains the most definitive source for counties to use to calculate their share of national revenues. The Bill can be found here: http://www.cickenya.org/index.php/legislation/item/379-the-county-allocation-of-revenue-bill-2014#.
In addition to information about the national transfer, the budget should also contain clear information about any donor funding or loans that the county expects. As per Question 10, however, there is no provision for counties to accept loans at this point.
15. Does my budget spend money on things that counties are responsible for rather than things the national government is responsible for and are there any areas that counties are responsible for that are missing from the budget?
Citizens can consult the Fourth Schedule of the Constitution to determine which functions counties are responsible for, and which national government is responsible for, then see if the county budget is aligned with county functions. Further detail on the functions described in the Fourth Schedule are available in a Gazette Notice issued by the Transition Authority on 9 August 2013.
In reviewing some budgets, we find that counties are taking up primary or secondary education, or security, while things like housing are completely missing. Primary and secondary education, and security, are national functions, while housing is a county function. When counties spend money on national functions, they reduce the funds available for county functions. While no county is obligated to spend money on specific functions, it is useful to raise questions about the rationale for ignoring core county functions in the budget.
Answering this question should start with a look at the Fourth Schedule, but also within each sector to compare the activities in the budget to those that a sector specialist (in health, housing, etc.) would identify as key areas of spending. This can be supplemented by looking at key sectoral activities contained in (MTEF) sector reports and the 2012/13 budget at national level. In some cases, however, poor classification of the budget makes it difficult to tell what functions are being taken up under each county department/ministry.
While no county is obligated to spend money on specific functions, it is useful to raise questions about the rationale for ignoring core county functions in the budget.
16. Does my budget have an emergency fund in case of any disaster?
All counties can (and should) have a County Emergency Fund in their budget to provide for disasters. As per the Public Finance Management Act, this can spend up to 2 percent of the county revenues in a single year (based on previous year audited revenues). The PFM Act states clearly that the Emergency Fund should only cater for unforeseen circumstances that constitute a serious threat to human life or the environment.
17. Does the budget properly distinguish between recurrent and development expenditure?
In some budgets, we find that these expenditures are misclassified, which also leads to an incorrect assessment of the share of the
budget that is for development. The PFM Act 2012 requires at least 30 percent of the budget for development spending over the
1120 Key Questions About Your County Budget
medium term (3-5 years). Some budgets classify medicines as development spending (when they should be recurrent) and assets like specialized equipment as recurrent spending (when they are capital/development). We also noticed variations of classification within a single budget, but across departments (e.g., equipment classified as recurrent in some departments, and development in other departments).
18. Does the budget contain unit costs for various purchases (such as vehicles, generators and other assets) and are these consistent across departments?
Not all of the budgets contain unit costs. Good practice is to give an indication of the number of units (say, vehicles) and the total cost, along with a unit cost to know how much each asset is estimated to cost. This allows comparison with market rates and with other parts of the budget. In our review of some budgets, unit costs are missing and there is some evidence that they differ across departments within a single budget.
19. Are the budget lines sufficiently clear to know what each of them refers to, and are they consistent across departments?
Proper budgeting requires a consistent set of codes and budget lines that are easy to interpret. This is usually referred to as the Chart of Accounts. Where budget lines are not easy to interpret, narrative explanation should be provided. One can look at this issue broadly but also within specific sectors. Ideally, the Chart of Accounts should follow the national structure and be consistent with what is required for the use of the Integrated Financial Management Information System.
20. Does the budget contain estimates for the coming three years or only for this year?
Some budgets seem to contain only a single year of estimates, whereas the PFM Act 2012 encourages budgeting in a medium term framework (the coming year, plus at least two additional years). The PFM Act requires three years of revenue estimates at least, but good practice is to provide three years of expenditure estimates as well, for both recurrent and development spending. Development spending is particularly important because it generally commits the budget for future years and reduces choices in those years. Multi-year projects should be discussed as multi-year projects, not single year budget items, if they will constrain budget choices in future years.
www.internationalbudget.org/kenya