Embed Size (px)
Citation preview
Please refer to Disclosures and Disclaimers at the end of the Research Report.
Agri Inputs Uttar Pradesh ‐ India’s largest Agri state 29 April 2014
PhillipCapital (India) Pvt. Ltd.
Rabi sowings advance by 4.6%: The gross sown area of all major crops is about 64 mn hect up almost 4.6% yoy (Note Kharif sowings improved 5% over last year at ~ 105 mn hect). Wheat, Pulses, Gram, Mustard, Oilseeds sowings have improved by 2‐10% over last year. Wheat sowings (that forms ~50% of total Rabi sowings) grew 2%, given limited increase in MSPs (just about Rs 50 to Rs 1400/qtl), this season.
Water levels 43% ahead of 10 yr average; should lessen impact of El Nino,: Water level in 85 major reservoirs is at 57 BCM higher than last year (45) and 10 yr average (40). A strong water table should support next Kharif sowings in the advent of insufficient monsoons. Latest updates from two global weather prediction agencies (US weather forecaster Climatic Prediction Center (CPC) and Australian Bureau of Meteorology) have added to the spectre of a developing El Nino, raising fears of a possible weak monsoon this year. Indian Met officials have said that rainfall is likely to be 95% of the LPA (Long Period Average) with a model error of +‐5%. However we argue, India’s agriculture has shown marked resilience to uncertainties in monsoon which is evident from record production, improved yields and buffer stocks. India had a positive growth in food production of 0.8% in 2009 drought year when rainfall had dipped by 27%.
Fertilisers – Coromandel; GSFC and Chambal production improves in Q4: P&K dispatches degrew by 6% yoy, whilst urea degrew 13%. The ban on imports of urea and higher gas prices that impacted production beyond cut‐off limits have led to the steep decline in urea dispatches. Consistent with the trend complex fert imports grew much sharply in Q4 and YTD; so much that overall imports have doubled to ~ 2.5mmt. As for companies, Coromandel production improved by 17.5% in Q4 and 24% YTD to ~ 2.3 mmt. Tata Chemicals production fell in Q4, whilst Chambal production grew 17% over Q4 last year.
Hail and rains damage India’s summer crops: Unseasonal rain and hailstorms have destroyed crops in many parts of the country, including Uttar Pradesh, Rajasthan, Madhya Pradesh, Maharashtra, Punjab, Gujarat, Uttarakhand, Haryana and Andhra Pradesh. Storms and high velocity winds in Punjab, MP and UP have affected the wheat and pulses. MP estimates the crop loss at about Rs 130 bn, whilst in Maharashtra that is severely hit by hailstorms and unseasonal rains it is estimated to be about Rs 200 bn. In Maharashtra ‐ Wheat, Jowar, Pulses, Sunflower, Mango, Pomegranates, Onion and selectively grapes have suffered extensive damage. Akin to Maharashtra serious damages to crops and fruit orchards are caused in AP. Crop losses lower the affordability of agri‐inputs in particular pesticides and to some extent MOP & Complex fertilizers.
Uttar Pradesh ‐ India’s largest Agri state! Uttar Pradesh is primarily an agrarian economy with more than 60% of the population engaging in agriculture for their livelihood. The state is the largest producer of food grain in India and offers a diverse agro climatic condition which is conducive for growing major crops such as wheat, paddy, potato, mustard, groundnut, gram, pea and lentil. Uttar Pradesh is known for its highest contribution to nation’s sugarcane basket. The most important part of the state is the highly fertile and densely populated upper Gangetic plain. It has two major rivers, viz., the Ganges and the Yamuna along with other rivers like the Gomti and the Ramganga. Uttar Pradesh is also one of the major agri‐exporting (of rice, mangoes, vegetables and potatoes) states in the country.
Read inside • Key Crop Sowings
• Agri Valuation Metrics
• Key commodity price trends
• Fertiliser Industry Sales Volume
• Urea policy impact analysis
• Uttar Pradesh: India’s largest
Agri state!
Uttar Pradesh
Sugar, Wheat, Potato, Rice and Maize
UP
(Sugar, Wheat, Potato, Rice and Maize) Gauri Anand (+ 9122 66679943) [email protected]
29 April 2014 / INDIA EQUITY RESEARCH / AGRI INPUTS MONTHLY UPDATE
Key crop sowings – Rabi Sowings improve 4.6% over last year Area in mn hect RS13 RS 14* % growthWheat 30.00 30.61 2.0Total pulses 13.30 14.66 10.2Gram 8.52 9.66 13.3All oilseeds 8.16 8.63 5.8Rapeseed & Mustard 6.36 6.63 4.2Jowar 3.79 3.55 ‐6.3Rice 3.84 4.38 14.1Maize 1.46 1.49 2.4All crops 61.25 64.09 4.6
Source: * 2nd advance estimates; RS – Rabi Season, Dept of Agriculture, PhillipCapital India Research
Agri Inputs Comparative Valuation Metrics: Attractive dividend yield limits investment downside CMP __Adj. EPS (Rs) __ CAGR ___PER (x) ___ ___PBR (x) ___ _EV/EBITDA (x) _ Div Yield (%) TP Rating Rs FY14E FY15E FY014‐16E FY14E FY15E FY14E FY15E FY14E FY15E FY13 Rs Chambal Fertilizer 42 6.2 7.8 14.5 6.7 5.3 0.8 0.7 8.4 6.1 4.6 48 BuyCoromandel Fert. 219 13.0 18.9 38.5 16.8 11.6 2.4 2.1 11.0 8.6 2.1 258 BuyDeepak Fertilizer 128 21.6 25.5 15.0 5.9 5.0 0.7 0.6 4.0 3.7 4.3 120 NeutralTata Chemicals 296 20.9 25.9 19.4 14.1 11.4 1.1 1.0 6.5 5.7 3.4 300 NeutralKaveri 632 30.6 35.8 17.9 20.7 17.6 8.4 6.1 18.7 15.5 0.5 UR BuyPI 253 13.0 16.0 22.7 19.4 15.8 2.3 1.9 18.7 10.5 0.4 275 BuyRallis 187 7.8 9.3 18.3 23.9 20.1 4.9 4.2 13.5 11.2 1.2 185 NeutralUPL 278 23.7 27.5 11.2 11.7 10.1 1.8 1.5 5.8 5.6 0.9 300 BuyAverage 17.1 20.8 19.7 14.9 12.1 2.8 2.3 10.8 8.4 2.2
Source: Company, PhillipCapital India Research Estimates
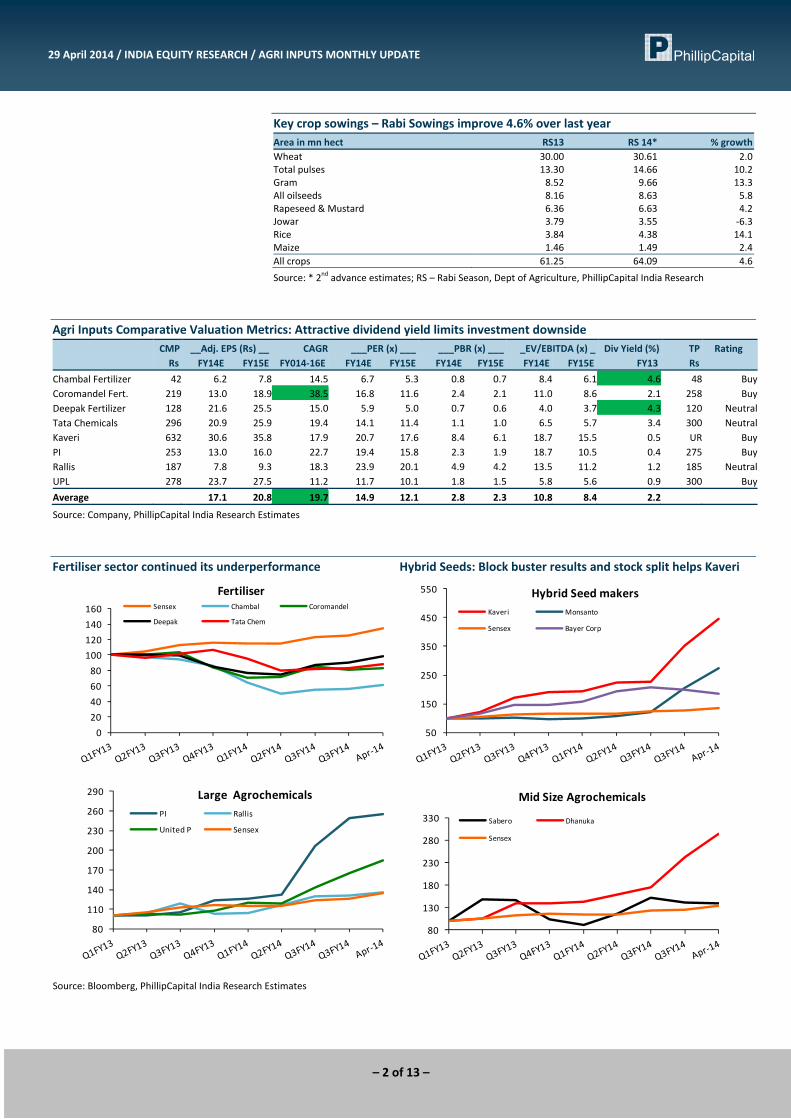
Fertiliser sector continued its underperformance Hybrid Seeds: Block buster results and stock split helps Kaveri
020406080100120140160
FertiliserSensex Chambal Coromandel
Deepak Tata Chem
50
150
250
350
450
550 Hybrid Seed makersKaveri Monsanto
Sensex Bayer Corp
80
110
140
170
200
230
260
290 Large AgrochemicalsPI Rallis
United P Sensex
80
130
180
230
280
330
Mid Size Agrochemicals
Sabero Dhanuka
Sensex
Source: Bloomberg, PhillipCapital India Research Estimates
– 2 of 13 –
29 April 2014 / INDIA EQUITY RESEARCH / AGRI INPUTS MONTHLY UPDATE
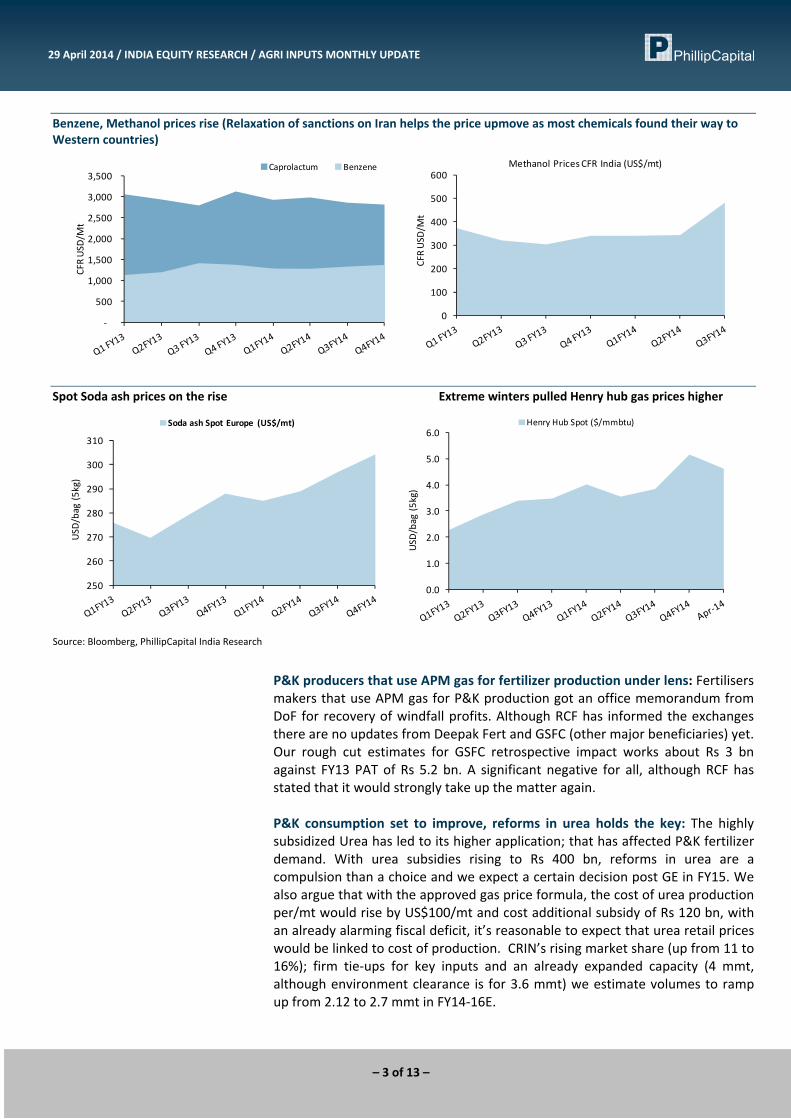
Benzene, Methanol prices rise (Relaxation of sanctions on Iran helps the price upmove as most chemicals found their way to Western countries)
‐
500
1,000
1,500
2,000
2,500
3,000
3,500
CFR US
D/Mt
Caprolactum Benzene
0
100
200
300
400
500
600
CFR US
D/Mt
Methanol Prices CFR India (US$/mt)
Spot Soda ash prices on the rise Extreme winters pulled Henry hub gas prices higher
250
260
270
280
290
300
310
USD/bag (5kg)
Soda ash Spot Europe (US$/mt)
0.0
1.0
2.0
3.0
4.0
5.0
6.0
USD/bag (5kg)
Henry Hub Spot ($/mmbtu)
Source: Bloomberg, PhillipCapital India Research
P&K producers that use APM gas for fertilizer production under lens: Fertilisers makers that use APM gas for P&K production got an office memorandum from DoF for recovery of windfall profits. Although RCF has informed the exchanges there are no updates from Deepak Fert and GSFC (other major beneficiaries) yet. Our rough cut estimates for GSFC retrospective impact works about Rs 3 bn against FY13 PAT of Rs 5.2 bn. A significant negative for all, although RCF has stated that it would strongly take up the matter again. P&K consumption set to improve, reforms in urea holds the key: The highly subsidized Urea has led to its higher application; that has affected P&K fertilizer demand. With urea subsidies rising to Rs 400 bn, reforms in urea are a compulsion than a choice and we expect a certain decision post GE in FY15. We also argue that with the approved gas price formula, the cost of urea production per/mt would rise by US$100/mt and cost additional subsidy of Rs 120 bn, with an already alarming fiscal deficit, it’s reasonable to expect that urea retail prices would be linked to cost of production. CRIN’s rising market share (up from 11 to 16%); firm tie‐ups for key inputs and an already expanded capacity (4 mmt, although environment clearance is for 3.6 mmt) we estimate volumes to ramp up from 2.12 to 2.7 mmt in FY14‐16E.
– 3 of 13 –
29 April 2014 / INDIA EQUITY RESEARCH / AGRI INPUTS MONTHLY UPDATE
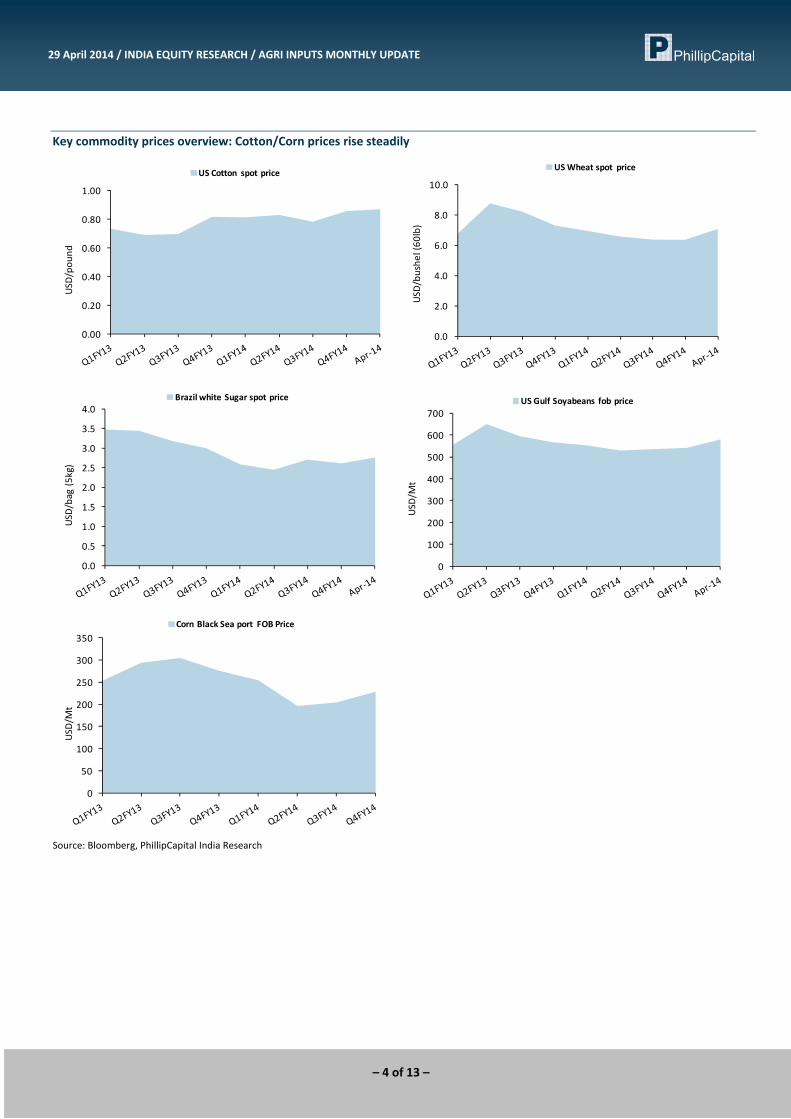
Key commodity prices overview: Cotton/Corn prices rise steadily
0.00
0.20
0.40
0.60
0.80
1.00
USD/po
und
US Cotton spot price
0.0
2.0
4.0
6.0
8.0
10.0
USD/bu
shel (6
0lb)
US Wheat spot price
0.0
0.5
1.0
1.5
2.0
2.5
3.0
3.5
4.0
USD/bag (5kg)
Brazil white Sugar spot price
0
100
200
300
400
500
600
700US
D/Mt
US Gulf Soyabeans fob price
0
50
100
150
200
250
300
350
USD/Mt
Corn Black Sea port FOB Price
Source: Bloomberg, PhillipCapital India Research
– 4 of 13 –
29 April 2014 / INDIA EQUITY RESEARCH / AGRI INPUTS MONTHLY UPDATE
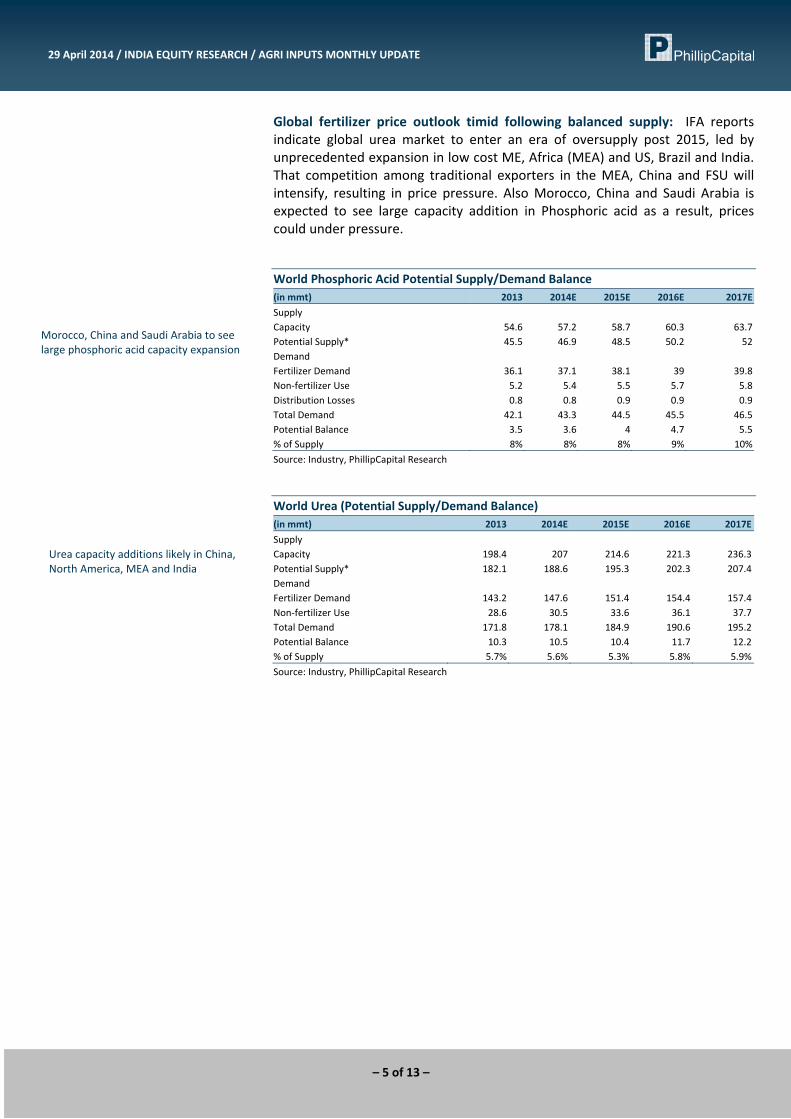
Global fertilizer price outlook timid following balanced supply: IFA reports indicate global urea market to enter an era of oversupply post 2015, led by unprecedented expansion in low cost ME, Africa (MEA) and US, Brazil and India. That competition among traditional exporters in the MEA, China and FSU will intensify, resulting in price pressure. Also Morocco, China and Saudi Arabia is expected to see large capacity addition in Phosphoric acid as a result, prices could under pressure. World Phosphoric Acid Potential Supply/Demand Balance (in mmt) 2013 2014E 2015E 2016E 2017ESupply Capacity 54.6 57.2 58.7 60.3 63.7Potential Supply* 45.5 46.9 48.5 50.2 52Demand Fertilizer Demand 36.1 37.1 38.1 39 39.8Non‐fertilizer Use 5.2 5.4 5.5 5.7 5.8Distribution Losses 0.8 0.8 0.9 0.9 0.9Total Demand 42.1 43.3 44.5 45.5 46.5Potential Balance 3.5 3.6 4 4.7 5.5% of Supply 8% 8% 8% 9% 10%
Morocco, China and Saudi Arabia to see large phosphoric acid capacity expansion
Source: Industry, PhillipCapital Research
World Urea (Potential Supply/Demand Balance) (in mmt) 2013 2014E 2015E 2016E 2017ESupply Capacity 198.4 207 214.6 221.3 236.3Potential Supply* 182.1 188.6 195.3 202.3 207.4Demand Fertilizer Demand 143.2 147.6 151.4 154.4 157.4Non‐fertilizer Use 28.6 30.5 33.6 36.1 37.7Total Demand 171.8 178.1 184.9 190.6 195.2Potential Balance 10.3 10.5 10.4 11.7 12.2% of Supply 5.7% 5.6% 5.3% 5.8% 5.9%
Urea capacity additions likely in China, North America, MEA and India
Source: Industry, PhillipCapital Research
– 5 of 13 –
29 April 2014 / INDIA EQUITY RESEARCH / AGRI INPUTS MONTHLY UPDATE
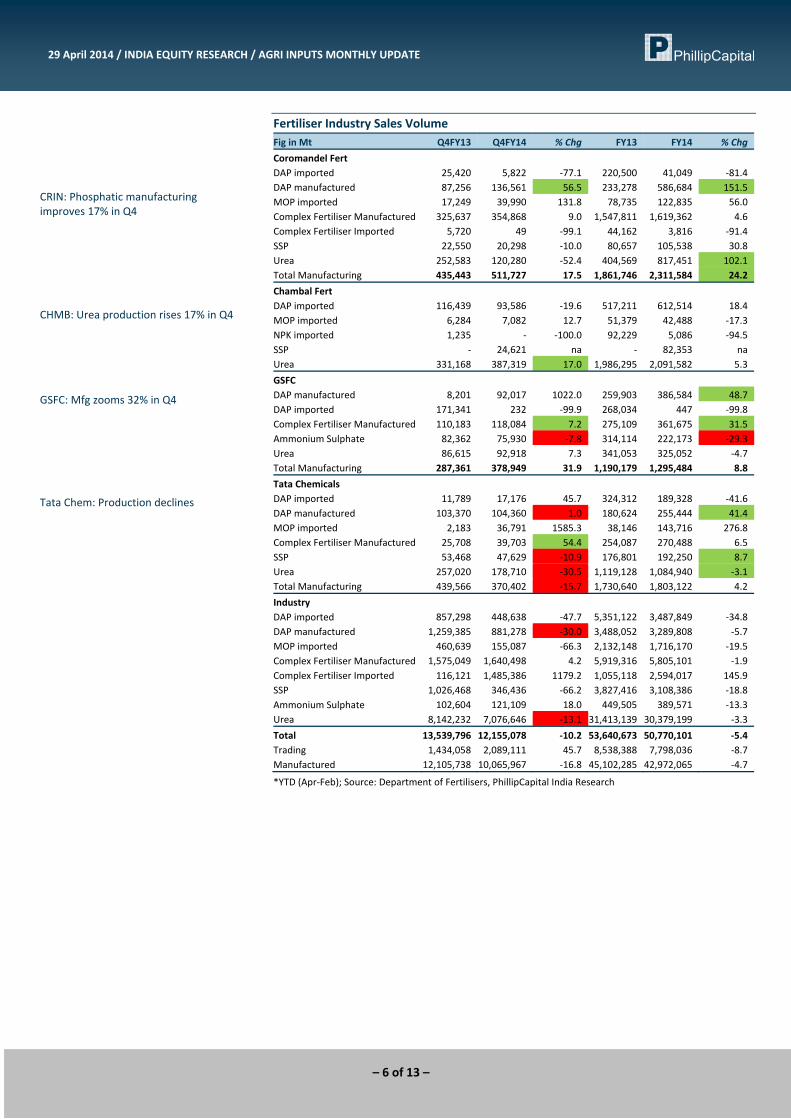
Fertiliser Industry Sales Volume Fig in Mt Q4FY13 Q4FY14 % Chg FY13 FY14 % Chg Coromandel Fert DAP imported 25,420 5,822 ‐77.1 220,500 41,049 ‐81.4 DAP manufactured 87,256 136,561 56.5 233,278 586,684 151.5 MOP imported 17,249 39,990 131.8 78,735 122,835 56.0 Complex Fertiliser Manufactured 325,637 354,868 9.0 1,547,811 1,619,362 4.6 Complex Fertiliser Imported 5,720 49 ‐99.1 44,162 3,816 ‐91.4 SSP 22,550 20,298 ‐10.0 80,657 105,538 30.8 Urea 252,583 120,280 ‐52.4 404,569 817,451 102.1 Total Manufacturing 435,443 511,727 17.5 1,861,746 2,311,584 24.2 Chambal Fert DAP imported 116,439 93,586 ‐19.6 517,211 612,514 18.4 MOP imported 6,284 7,082 12.7 51,379 42,488 ‐17.3 NPK imported 1,235 ‐ ‐100.0 92,229 5,086 ‐94.5 SSP ‐ 24,621 na ‐ 82,353 na Urea 331,168 387,319 17.0 1,986,295 2,091,582 5.3 GSFC DAP manufactured 8,201 92,017 1022.0 259,903 386,584 48.7 DAP imported 171,341 232 ‐99.9 268,034 447 ‐99.8 Complex Fertiliser Manufactured 110,183 118,084 7.2 275,109 361,675 31.5 Ammonium Sulphate 82,362 75,930 ‐7.8 314,114 222,173 ‐29.3 Urea 86,615 92,918 7.3 341,053 325,052 ‐4.7 Total Manufacturing 287,361 378,949 31.9 1,190,179 1,295,484 8.8 Tata Chemicals DAP imported 11,789 17,176 45.7 324,312 189,328 ‐41.6 DAP manufactured 103,370 104,360 1.0 180,624 255,444 41.4 MOP imported 2,183 36,791 1585.3 38,146 143,716 276.8 Complex Fertiliser Manufactured 25,708 39,703 54.4 254,087 270,488 6.5 SSP 53,468 47,629 ‐10.9 176,801 192,250 8.7 Urea 257,020 178,710 ‐30.5 1,119,128 1,084,940 ‐3.1 Total Manufacturing 439,566 370,402 ‐15.7 1,730,640 1,803,122 4.2 Industry DAP imported 857,298 448,638 ‐47.7 5,351,122 3,487,849 ‐34.8 DAP manufactured 1,259,385 881,278 ‐30.0 3,488,052 3,289,808 ‐5.7 MOP imported 460,639 155,087 ‐66.3 2,132,148 1,716,170 ‐19.5 Complex Fertiliser Manufactured 1,575,049 1,640,498 4.2 5,919,316 5,805,101 ‐1.9 Complex Fertiliser Imported 116,121 1,485,386 1179.2 1,055,118 2,594,017 145.9 SSP 1,026,468 346,436 ‐66.2 3,827,416 3,108,386 ‐18.8 Ammonium Sulphate 102,604 121,109 18.0 449,505 389,571 ‐13.3 Urea 8,142,232 7,076,646 ‐13.1 31,413,139 30,379,199 ‐3.3 Total 13,539,796 12,155,078 ‐10.2 53,640,673 50,770,101 ‐5.4 Trading 1,434,058 2,089,111 45.7 8,538,388 7,798,036 ‐8.7 Manufactured 12,105,738 10,065,967 ‐16.8 45,102,285 42,972,065 ‐4.7
CRIN: Phosphatic manufacturing improves 17% in Q4
CHMB: Urea production rises 17% in Q4
GSFC: Mfg zooms 32% in Q4
Tata Chem: Production declines
*YTD (Apr‐Feb); Source: Department of Fertilisers, PhillipCapital India Research
– 6 of 13 –
29 April 2014 / INDIA EQUITY RESEARCH / AGRI INPUTS MONTHLY UPDATE
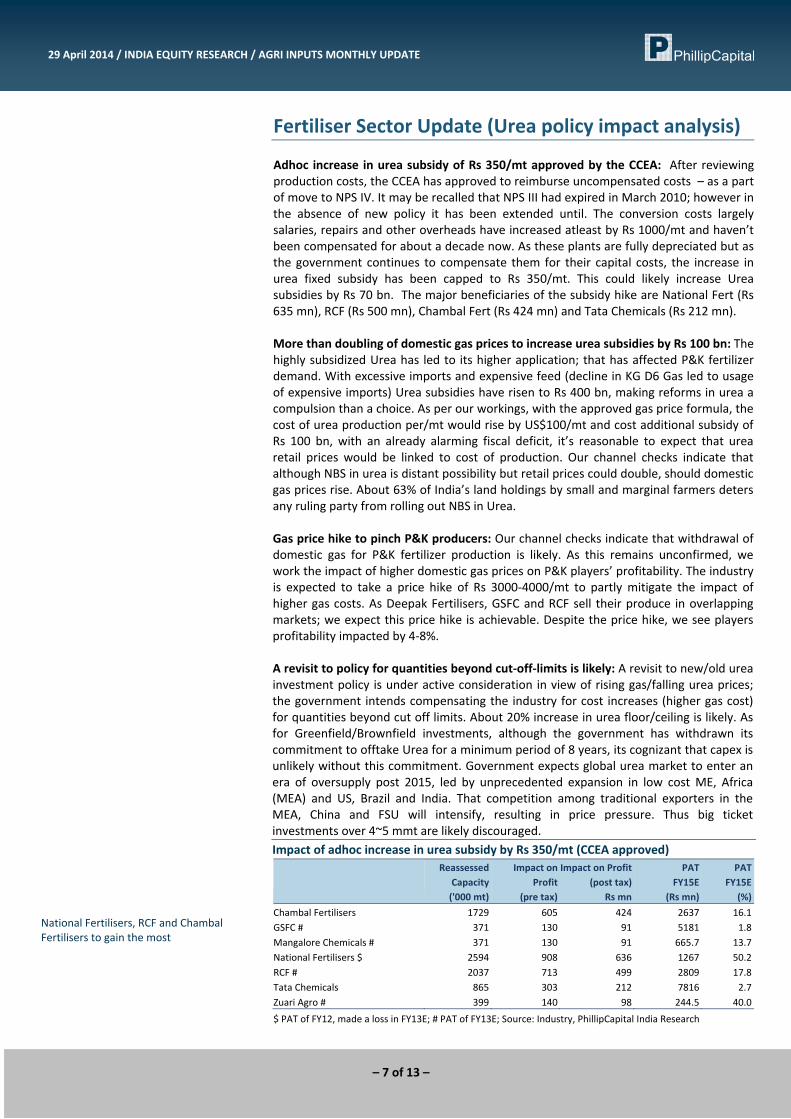
Fertiliser Sector Update (Urea policy impact analysis) Adhoc increase in urea subsidy of Rs 350/mt approved by the CCEA: After reviewing production costs, the CCEA has approved to reimburse uncompensated costs – as a part of move to NPS IV. It may be recalled that NPS III had expired in March 2010; however in the absence of new policy it has been extended until. The conversion costs largely salaries, repairs and other overheads have increased atleast by Rs 1000/mt and haven’t been compensated for about a decade now. As these plants are fully depreciated but as the government continues to compensate them for their capital costs, the increase in urea fixed subsidy has been capped to Rs 350/mt. This could likely increase Urea subsidies by Rs 70 bn. The major beneficiaries of the subsidy hike are National Fert (Rs 635 mn), RCF (Rs 500 mn), Chambal Fert (Rs 424 mn) and Tata Chemicals (Rs 212 mn). More than doubling of domestic gas prices to increase urea subsidies by Rs 100 bn: The highly subsidized Urea has led to its higher application; that has affected P&K fertilizer demand. With excessive imports and expensive feed (decline in KG D6 Gas led to usage of expensive imports) Urea subsidies have risen to Rs 400 bn, making reforms in urea a compulsion than a choice. As per our workings, with the approved gas price formula, the cost of urea production per/mt would rise by US$100/mt and cost additional subsidy of Rs 100 bn, with an already alarming fiscal deficit, it’s reasonable to expect that urea retail prices would be linked to cost of production. Our channel checks indicate that although NBS in urea is distant possibility but retail prices could double, should domestic gas prices rise. About 63% of India’s land holdings by small and marginal farmers deters any ruling party from rolling out NBS in Urea. Gas price hike to pinch P&K producers: Our channel checks indicate that withdrawal of domestic gas for P&K fertilizer production is likely. As this remains unconfirmed, we work the impact of higher domestic gas prices on P&K players’ profitability. The industry is expected to take a price hike of Rs 3000‐4000/mt to partly mitigate the impact of higher gas costs. As Deepak Fertilisers, GSFC and RCF sell their produce in overlapping markets; we expect this price hike is achievable. Despite the price hike, we see players profitability impacted by 4‐8%. A revisit to policy for quantities beyond cut‐off‐limits is likely: A revisit to new/old urea investment policy is under active consideration in view of rising gas/falling urea prices; the government intends compensating the industry for cost increases (higher gas cost) for quantities beyond cut off limits. About 20% increase in urea floor/ceiling is likely. As for Greenfield/Brownfield investments, although the government has withdrawn its commitment to offtake Urea for a minimum period of 8 years, its cognizant that capex is unlikely without this commitment. Government expects global urea market to enter an era of oversupply post 2015, led by unprecedented expansion in low cost ME, Africa (MEA) and US, Brazil and India. That competition among traditional exporters in the MEA, China and FSU will intensify, resulting in price pressure. Thus big ticket investments over 4~5 mmt are likely discouraged. Impact of adhoc increase in urea subsidy by Rs 350/mt (CCEA approved)
Reassessed Capacity ('000 mt)
Impact on Profit
(pre tax)
Impact on Profit (post tax)
Rs mn
PAT FY15E
(Rs mn)
PAT FY15E
(%)Chambal Fertilisers 1729 605 424 2637 16.1GSFC # 371 130 91 5181 1.8Mangalore Chemicals # 371 130 91 665.7 13.7National Fertilisers $ 2594 908 636 1267 50.2RCF # 2037 713 499 2809 17.8Tata Chemicals 865 303 212 7816 2.7Zuari Agro # 399 140 98 244.5 40.0
National Fertilisers, RCF and Chambal Fertilisers to gain the most
$ PAT of FY12, made a loss in FY13E; # PAT of FY13E; Source: Industry, PhillipCapital India Research
– 7 of 13 –
29 April 2014 / INDIA EQUITY RESEARCH / AGRI INPUTS MONTHLY UPDATE
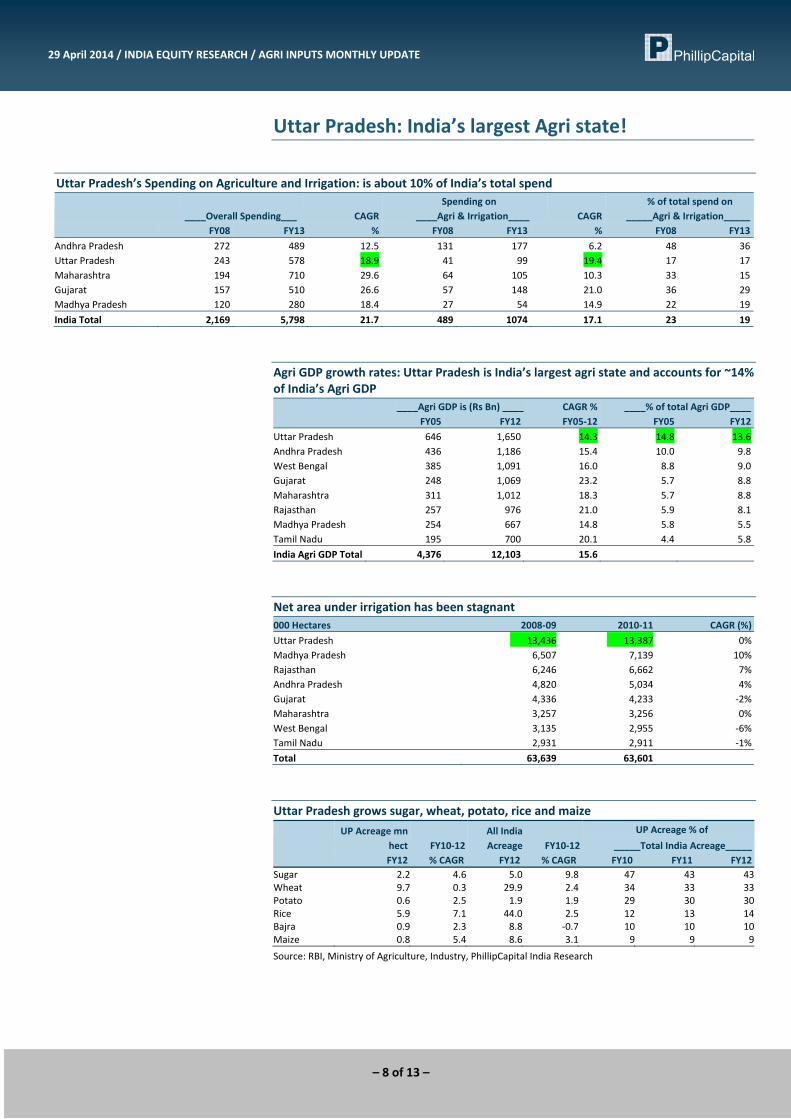
Uttar Pradesh: India’s largest Agri state!
Uttar Pradesh’s Spending on Agriculture and Irrigation: is about 10% of India’s total spend
____Overall Spending___ CAGR Spending on
____Agri & Irrigation____ CAGR % of total spend on _____Agri & Irrigation_____
FY08 FY13 % FY08 FY13 % FY08 FY13Andhra Pradesh 272 489 12.5 131 177 6.2 48 36Uttar Pradesh 243 578 18.9 41 99 19.4 17 17Maharashtra 194 710 29.6 64 105 10.3 33 15Gujarat 157 510 26.6 57 148 21.0 36 29Madhya Pradesh 120 280 18.4 27 54 14.9 22 19India Total 2,169 5,798 21.7 489 1074 17.1 23 19
Agri GDP growth rates: Uttar Pradesh is India’s largest agri state and accounts for ~14% of India’s Agri GDP ____Agri GDP is (Rs Bn) ____ CAGR % ____% of total Agri GDP____ FY05 FY12 FY05‐12 FY05 FY12Uttar Pradesh 646 1,650 14.3 14.8 13.6Andhra Pradesh 436 1,186 15.4 10.0 9.8West Bengal 385 1,091 16.0 8.8 9.0Gujarat 248 1,069 23.2 5.7 8.8Maharashtra 311 1,012 18.3 5.7 8.8Rajasthan 257 976 21.0 5.9 8.1Madhya Pradesh 254 667 14.8 5.8 5.5Tamil Nadu 195 700 20.1 4.4 5.8India Agri GDP Total 4,376 12,103 15.6
Net area under irrigation has been stagnant 000 Hectares 2008‐09 2010‐11 CAGR (%)Uttar Pradesh 13,436 13,387 0%Madhya Pradesh 6,507 7,139 10%Rajasthan 6,246 6,662 7%Andhra Pradesh 4,820 5,034 4%Gujarat 4,336 4,233 ‐2%Maharashtra 3,257 3,256 0%West Bengal 3,135 2,955 ‐6%Tamil Nadu 2,931 2,911 ‐1%Total 63,639 63,601
Uttar Pradesh grows sugar, wheat, potato, rice and maize
UP Acreage mn
hect FY10‐12All India Acreage FY10‐12
UP Acreage % of _____Total India Acreage_____
FY12 % CAGR FY12 % CAGR FY10 FY11 FY12Sugar 2.2 4.6 5.0 9.8 47 43 43 Wheat 9.7 0.3 29.9 2.4 34 33 33 Potato 0.6 2.5 1.9 1.9 29 30 30 Rice 5.9 7.1 44.0 2.5 12 13 14 Bajra 0.9 2.3 8.8 ‐0.7 10 10 10 Maize 0.8 5.4 8.6 3.1 9 9 9
Source: RBI, Ministry of Agriculture, Industry, PhillipCapital India Research
– 8 of 13 –
29 April 2014 / INDIA EQUITY RESEARCH / AGRI INPUTS MONTHLY UPDATE
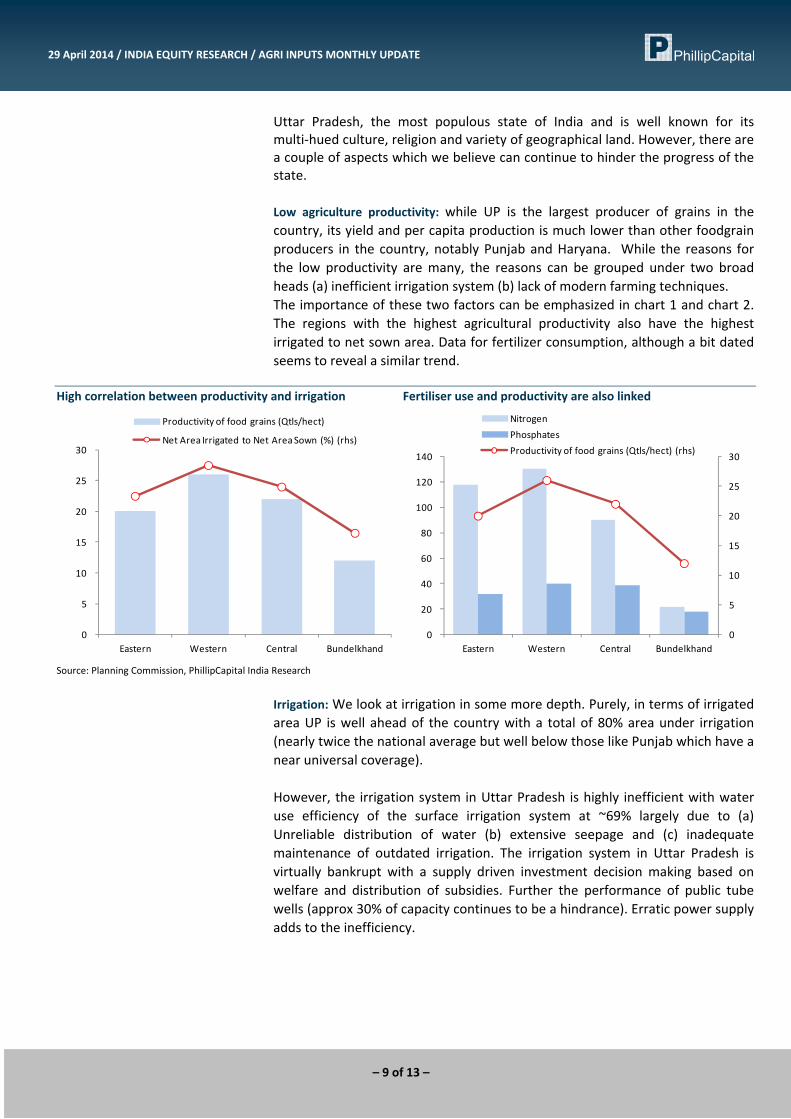
Uttar Pradesh, the most populous state of India and is well known for its multi‐hued culture, religion and variety of geographical land. However, there are a couple of aspects which we believe can continue to hinder the progress of the state. Low agriculture productivity: while UP is the largest producer of grains in the country, its yield and per capita production is much lower than other foodgrain producers in the country, notably Punjab and Haryana. While the reasons for the low productivity are many, the reasons can be grouped under two broad heads (a) inefficient irrigation system (b) lack of modern farming techniques. The importance of these two factors can be emphasized in chart 1 and chart 2. The regions with the highest agricultural productivity also have the highest irrigated to net sown area. Data for fertilizer consumption, although a bit dated seems to reveal a similar trend.
High correlation between productivity and irrigation Fertiliser use and productivity are also linked
0
5
10
15
20
25
30
Eastern Western Central Bundelkhand
Productivity of food grains (Qtls/hect)
Net Area Irrigated to Net Area Sown (%) (rhs)
0
5
10
15
20
25
30
0
20
40
60
80
100
120
140
Eastern Western Central Bundelkhand
NitrogenPhosphatesProductivity of food grains (Qtls/hect) (rhs)
Source: Planning Commission, PhillipCapital India Research
Irrigation: We look at irrigation in some more depth. Purely, in terms of irrigated area UP is well ahead of the country with a total of 80% area under irrigation (nearly twice the national average but well below those like Punjab which have a near universal coverage). However, the irrigation system in Uttar Pradesh is highly inefficient with water use efficiency of the surface irrigation system at ~69% largely due to (a) Unreliable distribution of water (b) extensive seepage and (c) inadequate maintenance of outdated irrigation. The irrigation system in Uttar Pradesh is virtually bankrupt with a supply driven investment decision making based on welfare and distribution of subsidies. Further the performance of public tube wells (approx 30% of capacity continues to be a hindrance). Erratic power supply adds to the inefficiency.
– 9 of 13 –
29 April 2014 / INDIA EQUITY RESEARCH / AGRI INPUTS MONTHLY UPDATE
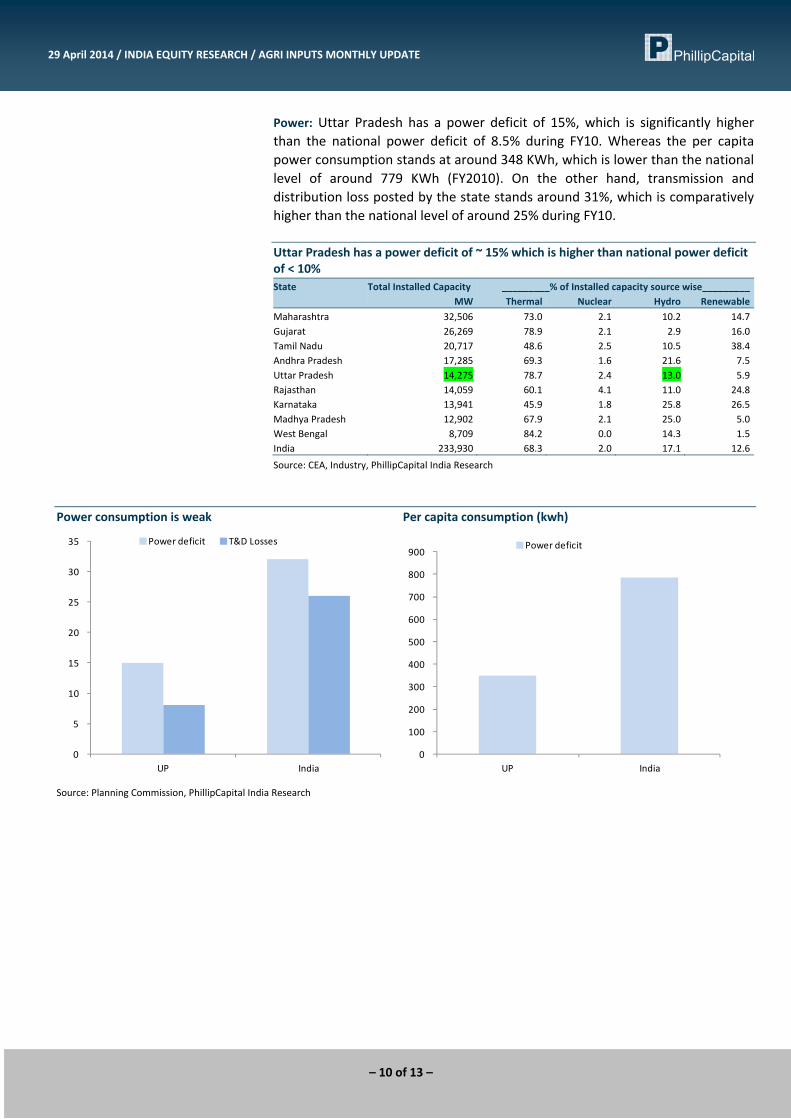
Power: Uttar Pradesh has a power deficit of 15%, which is significantly higher than the national power deficit of 8.5% during FY10. Whereas the per capita power consumption stands at around 348 KWh, which is lower than the national level of around 779 KWh (FY2010). On the other hand, transmission and distribution loss posted by the state stands around 31%, which is comparatively higher than the national level of around 25% during FY10. Uttar Pradesh has a power deficit of ~ 15% which is higher than national power deficit of < 10% State Total Installed Capacity _________% of Installed capacity source wise_________ MW Thermal Nuclear Hydro RenewableMaharashtra 32,506 73.0 2.1 10.2 14.7Gujarat 26,269 78.9 2.1 2.9 16.0Tamil Nadu 20,717 48.6 2.5 10.5 38.4Andhra Pradesh 17,285 69.3 1.6 21.6 7.5Uttar Pradesh 14,275 78.7 2.4 13.0 5.9Rajasthan 14,059 60.1 4.1 11.0 24.8Karnataka 13,941 45.9 1.8 25.8 26.5Madhya Pradesh 12,902 67.9 2.1 25.0 5.0West Bengal 8,709 84.2 0.0 14.3 1.5India 233,930 68.3 2.0 17.1 12.6
Source: CEA, Industry, PhillipCapital India Research
Power consumption is weak Per capita consumption (kwh)
0
5
10
15
20
25
30
35
UP India
Power deficit T&D Losses
0
100
200
300
400
500
600
700
800
900
UP India
Power deficit
Source: Planning Commission, PhillipCapital India Research
– 10 of 13 –
29 April 2014 / INDIA EQUITY RESEARCH / AGRI INPUTS MONTHLY UPDATE
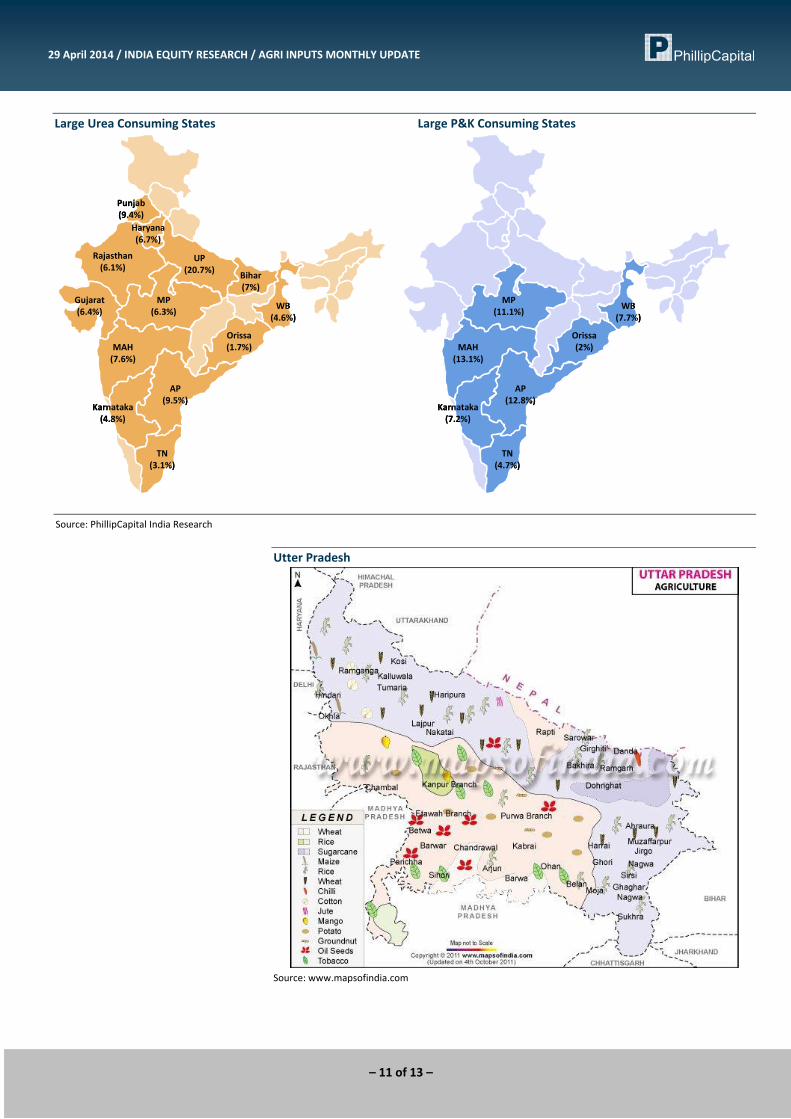
Large Urea Consuming States Large P&K Consuming States
UP(20.7%)
AP(9.5%)
Punjab(9.4%)
MAH(7.6%)
TN(3.1%)
Bihar(7%)
Gujarat(6.4%)
Haryana(6.7%)
MP(6.3%)
Rajasthan(6.1%)
Karnataka(4.8%)
WB(4.6%)
Orissa(1.7%)
UP(20.7%)
AP(9.5%)
Punjab(9.4%)
MAH(7.6%)
TN(3.1%)
Bihar(7%)
Gujarat(6.4%)
Haryana(6.7%)
MP(6.3%)
Rajasthan(6.1%)
Karnataka(4.8%)
WB(4.6%)
Orissa(1.7%)
AP(12.8%)
MAH(13.1%)
TN(4.7%)
MP(11.1%)
Karnataka(7.2%)
WB(7.7%)
Orissa(2%)
AP(12.8%)
MAH(13.1%)
TN(4.7%)
MP(11.1%)
Karnataka(7.2%)
WB(7.7%)
Orissa(2%)
Source: PhillipCapital India Research Utter Pradesh
Source: www.mapsofindia.com
– 11 of 13 –
29 April 2014 / INDIA EQUITY RESEARCH / AGRI INPUTS MONTHLY UPDATE
Management
(91 22) 2300 2999(91 22) 6667 9735
Research Engineering, Capital Goods Pharma
Deepak Jain (9122) 6667 9758 Ankur Sharma (9122) 6667 9759 Surya Patra (9122) 6667 9768Priya Ranjan (9122) 6667 9965 Aditya Bahety (9122) 6667 9986
Retail, Real EstateInfrastructure & IT Services Abhishek Ranganathan, CFA (9122) 6667 9952
Manish Agarwalla (9122) 6667 9962 Vibhor Singhal (9122) 6667 9949 Neha Garg (9122) 6667 9996Sachit Motwani, CFA, FRM (9122) 6667 9953 Varun Vijayan (9122) 6667 9992
TechnicalsMetals Subodh Gupta (9122) 6667 9762
Naveen Kulkarni, CFA, FRM (9122) 6667 9947 Dhawal Doshi (9122) 6667 9769Vivekanand Subbaraman (9122) 6667 9766 Dharmesh Shah (9122) 6667 9974 Database ManagerManish Pushkar (9122) 6667 9764 Vishal Randive (9122) 6667 9944
Oil&Gas, Agri InputsCement Gauri Anand (9122) 6667 9943 Sr. Manager – Equities SupportVaibhav Agarwal (9122) 6667 9967 Deepak Pareek (9122) 6667 9950 Rosie Ferns (9122) 6667 9971
Anjali Verma (9122) 6667 9969
Sales & Distribution Kinshuk Tiwari (9122) 6667 9946 Sales Trader ExecutionAshvin Patil (9122) 6667 9991 Dilesh Doshi (9122) 6667 9747 Mayur Shah (9122) 6667 9945Shubhangi Agrawal (9122) 6667 9964 Suniil Pandit (9122) 6667 9745Kishor Binwal (9122) 6667 9989Sidharth Agrawal (9122) 6667 9934Dipesh Sohani (9122) 6667 9756
Economics
Consumer, Media, Telecom
Vineet Bhatnagar (Managing Director)Jignesh Shah (Head – Equity Derivatives)
Automobiles
Banking, NBFCs
Contact Information (Regional Member Companies)
SINGAPORE
Phillip Securities Pte Ltd 250 North Bridge Road, #06‐00 Raffles City Tower,
Singapore 179101 Tel : (65) 6533 6001 Fax: (65) 6535 3834
www.phillip.com.sg
MALAYSIA Phillip Capital Management Sdn Bhd B‐3‐6 Block B Level 3, Megan Avenue II,
No. 12, Jalan Yap Kwan Seng, 50450 Kuala Lumpur Tel (60) 3 2162 8841 Fax (60) 3 2166 5099
www.poems.com.my
HONG KONG Phillip Securities (HK) Ltd
11/F United Centre 95 Queensway Hong Kong Tel (852) 2277 6600 Fax: (852) 2868 5307
www.phillip.com.hk
JAPAN Phillip Securities Japan, Ltd
4‐2 Nihonbashi Kabutocho, Chuo‐ku Tokyo 103‐0026
Tel: (81) 3 3666 2101 Fax: (81) 3 3664 0141 www.phillip.co.jp
INDONESIA PT Phillip Securities Indonesia
ANZ Tower Level 23B, Jl Jend Sudirman Kav 33A, Jakarta 10220, Indonesia
Tel (62) 21 5790 0800 Fax: (62) 21 5790 0809 www.phillip.co.id
CHINA Phillip Financial Advisory (Shanghai) Co. Ltd.
No 550 Yan An East Road, Ocean Tower Unit 2318 Shanghai 200 001
Tel (86) 21 5169 9200 Fax: (86) 21 6351 2940 www.phillip.com.cn
THAILAND Phillip Securities (Thailand) Public Co. Ltd.
15th Floor, Vorawat Building, 849 Silom Road, Silom, Bangrak, Bangkok 10500 Thailand
Tel (66) 2 2268 0999 Fax: (66) 2 2268 0921 www.phillip.co.th
FRANCE King & Shaxson Capital Ltd.
3rd Floor, 35 Rue de la Bienfaisance 75008 Paris France
Tel (33) 1 4563 3100 Fax : (33) 1 4563 6017 www.kingandshaxson.com
UNITED KINGDOM King & Shaxson Ltd.
6th Floor, Candlewick House, 120 Cannon Street London, EC4N 6AS
Tel (44) 20 7929 5300 Fax: (44) 20 7283 6835 www.kingandshaxson.com
UNITED STATES Phillip Futures Inc.
141 W Jackson Blvd Ste 3050 The Chicago Board of Trade Building
Chicago, IL 60604 USA Tel (1) 312 356 9000 Fax: (1) 312 356 9005
AUSTRALIA PhillipCapital Australia
Level 37, 530 Collins Street Melbourne, Victoria 3000, Australia
Tel: (61) 3 9629 8380 Fax: (61) 3 9614 8309 www.phillipcapital.com.au
SRI LANKA Asha Phillip Securities Limited
Level 4, Millennium House, 46/58 Navam Mawatha, Colombo 2, Sri Lanka
Tel: (94) 11 2429 100 Fax: (94) 11 2429 199 www.ashaphillip.net/home.htm
INDIA PhillipCapital (India) Private Limited
No. 1, C‐Block, 2nd Floor, Modern Center , Jacob Circle, K. K. Marg, Mahalaxmi Mumbai 400011 Tel: (9122) 2300 2999 Fax: (9122) 6667 9955 www.phillipcapital.in
– 12 of 13 –
– 13 of 13 –
29 April 2014 / INDIA EQUITY RESEARCH / AGRI INPUTS MONTHLY UPDATE
Disclosures and Disclaimers PhillipCapital (India) Pvt. Ltd. has three independent equity research groups: Institutional Equities, Institutional Equity Derivatives and Private Client Group. This report has been prepared by Institutional Equities Group. The views and opinions expressed in this document may or may not match or may be contrary at times with the views, estimates, rating, target price of the other equity research groups of PhillipCapital (India) Pvt. Ltd. This report is issued by PhillipCapital (India) Pvt. Ltd. which is regulated by SEBI. PhillipCapital (India) Pvt. Ltd. is a subsidiary of Phillip (Mauritius) Pvt. Ltd. References to "PCIPL" in this report shall mean PhillipCapital (India) Pvt. Ltd unless otherwise stated. This report is prepared and distributed by PCIPL for information purposes only and neither the information contained herein nor any opinion expressed should be construed or deemed to be construed as solicitation or as offering advice for the purposes of the purchase or sale of any security, investment or derivatives. The information and opinions contained in the Report were considered by PCIPL to be valid when published. The report also contains information provided to PCIPL by third parties. The source of such information will usually be disclosed in the report. Whilst PCIPL has taken all reasonable steps to ensure that this information is correct, PCIPL does not offer any warranty as to the accuracy or completeness of such information. Any person placing reliance on the report to undertake trading does so entirely at his or her own risk and PCIPL does not accept any liability as a result. Securities and Derivatives markets may be subject to rapid and unexpected price movements and past performance is not necessarily an indication to future performance. This report does not have regard to the specific investment objectives, financial situation and the particular needs of any specific person who may receive this report. Investors must undertake independent analysis with their own legal, tax and financial advisors and reach their own regarding the appropriateness of investing in any securities or investment strategies discussed or recommended in this report and should understand that statements regarding future prospects may not be realized. In no circumstances it be used or considered as an offer to sell or a solicitation of any offer to buy or sell the Securities mentioned in it. The information contained in the research reports may have been taken from trade and statistical services and other sources, which we believe are reliable. PhillipCapital (India) Pvt. Ltd. or any of its group/associate/affiliate companies do not guarantee that such information is accurate or complete and it should not be relied upon as such. Any opinions expressed reflect judgments at this date and are subject to change without notice Important: These disclosures and disclaimers must be read in conjunction with the research report of which it forms part. Receipt and use of the research report is subject to all aspects of these disclosures and disclaimers. Additional information about the issuers and securities discussed in this research report is available on request. Certifications: The research analyst(s) who prepared this research report hereby certifies that the views expressed in this research report accurately reflect the research analyst’s personal views about all of the subject issuers and/or securities, that the analyst have no known conflict of interest and no part of the research analyst’s compensation was, is or will be, directly or indirectly, related to the specific views or recommendations contained in this research report. The Research Analyst certifies that he /she or his / her family members does not own the stock(s) covered in this research report. Independence/Conflict: PhillipCapital (India) Pvt. Ltd. has not had an investment banking relationship with, and has not received any compensation for investment banking services from, the subject issuers in the past twelve (12) months, and PhillipCapital (India) Pvt. Ltd does not anticipate receiving or intend to seek compensation for investment banking services from the subject issuers in the next three (3) months. PhillipCapital (India) Pvt. Ltd is not a market maker in the securities mentioned in this research report, although it or its employees, directors, or affiliates may hold either long or short positions in such securities. PhillipCapital (India) Pvt. Ltd may not hold more than 1% of the shares of the company(ies) covered in this report. Suitability and Risks: This research report is for informational purposes only and is not tailored to the specific investment objectives, financial situation or particular requirements of any individual recipient hereof. Certain securities may give rise to substantial risks and may not be suitable for certain investors. Each investor must make its own determination as to the appropriateness of any securities referred to in this research report based upon the legal, tax and accounting considerations applicable to such investor and its own investment objectives or strategy, its financial situation and its investing experience. The value of any security may be positively or adversely affected by changes in foreign exchange or interest rates, as well as by other financial, economic or political factors. Past performance is not necessarily indicative of future performance or results. Sources, Completeness and Accuracy: The material herein is based upon information obtained from sources that PCIPL and the research analyst believe to be reliable, but neither PCIPL nor the research analyst represents or guarantees that the information contained herein is accurate or complete and it should not be relied upon as such. Opinions expressed herein are current opinions as of the date appearing on this material and are subject to change without notice. Furthermore, PCIPL is under no obligation to update or keep the information current. Copyright: The copyright in this research report belongs exclusively to PCIPL. All rights are reserved. Any unauthorized use or disclosure is prohibited. No reprinting or reproduction, in whole or in part, is permitted without the PCIPL’s prior consent, except that a recipient may reprint it for internal circulation only and only if it is reprinted in its entirety. Caution: Risk of loss in trading in can be substantial. You should carefully consider whether trading is appropriate for you in light of your experience, objectives, financial resources and other relevant circumstances. For U.S. persons only: This research report is a product of PhillipCapital (India) Pvt Ltd. which is the employer of the research analyst(s) who has prepared the research report. The research analyst(s) preparing the research report is/are resident outside the United States (U.S.) and are not associated persons of any U.S. regulated broker‐dealer and therefore the analyst(s) is/are not subject to supervision by a U.S. broker‐dealer, and is/are not required to satisfy the regulatory licensing requirements of FINRA or required to otherwise comply with U.S. rules or regulations regarding, among other things, communications with a subject company, public appearances and trading securities held by a research analyst account. This report is intended for distribution by PhillipCapital (India) Pvt Ltd. only to "Major Institutional Investors" as defined by Rule 15a‐6(b)(4) of the U.S. Securities andExchange Act, 1934 (the Exchange Act) and interpretations thereof by U.S. Securities and Exchange Commission (SEC) in reliance on Rule 15a 6(a)(2). If the recipient of this report is not a Major Institutional Investor as specified above, then it should not act upon this report and return the same to the sender. Further, this report may not be copied, duplicated and/or transmitted onward to any U.S. person, which is not the Major Institutional Investor. In reliance on the exemption from registration provided by Rule 15a‐6 of the Exchange Act and interpretations thereof by the SEC in order to conduct certain business with Major Institutional Investors, PhillipCapital (India) Pvt Ltd. has entered into an agreement with a U.S. registered broker‐dealer, Marco Polo Securities Inc. ("Marco Polo").Transactions in securities discussed in this research report should be effected through Marco Polo or another U.S. registered broker dealer. PhillipCapital (India) Pvt. Ltd. Registered office: 2nd Floor, C‐Block, Modern Centre, Mahalaxmi, Mumbai – 400011