Embed Size (px)
Citation preview

Deliverable D8.4 (DS4.3.1): End-to-end Management – Catalogue of Business Processes Document Code: GN3PLUS13-589-13
20-11-13
Deliverable D8.4 (DS4.3.1): End-to-end Management – Catalogue of Business Processes
Deliverable D8.4 (DS4.3.1)
Contractual Date: 30-09-2013
Actual Date: 20-11-2013
Grant Agreement No.: 605243
Activity: SA4
Task Item: T3
Nature of Deliverable: R
Dissemination Level: PU
Lead Partner: AMRES
Document Code: GN3PLUS13-589-13
Authors: V. Bilicki (HUNGARNET), M. Dunmore (Janet), A. Gräter (DFN), I. Golub (CARNet), L. Hrboka (CARNet), B.
Jakovljević (AMRES), F. Liu (DFN), V. Olifer (Janet), B. Schmidt, (CARNet), P. Vuletić (AMRES), M. Wolski
(PSNC), M. Zdravković (AMRES)
© DANTE on behalf of the GN3plus project.
The research leading to these results has received funding from the European Community’s Seventh Framework Programme (FP7 2007–
2013) under Grant Agreement No. 605243 (GN3plus).

Deliverable D8.4 (DS4.3.1): End-to-end Management – Catalogue of Business Processes Document Code: GN3PLUS13-589-13

Deliverable D8.4 (DS4.3.1): End-to-end Management – Catalogue of Business Processes Document Code: GN3PLUS13-589-13
iii
Table of Contents
Abstract 1
Executive Summary 1
1 Introduction 4
1.1 Objective 4
1.2 GÉANT multi-domain services and tools - current situation 5
1.3 Background – network management principles 6
1.4 Catalogue of business processes 7
1.5 Choosing the most important business processes 8
1.6 Business process analysis 9
2 Service delivery business processes in GÉANT-NREN environment 11
2.1 GÉANT-NREN as a federated environment 11
2.2 GÉANT-NREN business process catalogue 12
3 Business processes in a typical end-to-end GÉANT service - MDVPN service process flow
analysis 14
3.1 MDVPN service – overview 14
3.2 MDVPN main entities and functions 15
3.3 Business process flows and end-to-end business streams 15
3.4 End-to-end Service Configuration process flow 17
3.4.1 User request management 18
3.4.2 Service availability check 19
3.4.3 MDVPN Service instance design, configuration and activation 21
3.4.4 MDVPN service instance testing, closing service request 22
3.4.5 Monitoring service provisioning process flow 22
3.5 End-to-end Service Problem Management process flow 22
3.5.1 Problem reporting 23
3.5.2 Problem isolation and recovery 24
3.5.3 Service problem diagnostics and resolution 25
3.5.4 Closing user problem report 26
3.5.5 Monitoring problem management process flow 26
3.6 MDVPN service conclusions 26

Abstract
Deliverable D8.4 (DS4.3.1): End-to-end Management – Catalogue of Business Processes Document Code: GN3PLUS13-589-13
iv
4 Support for Performance Management in GÉANT environment 28
4.1 perfSONAR - brief overview 30
4.2 perfSONAR – Business process analysis 31
4.2.1 Methodology and Analysis Context of perfSONAR 31
4.2.2 eTOM Analysis of perfSONAR 32
4.3 perfSONAR – Features analysis 37
4.3.1 perfSONAR supported TAM features 38
4.3.2 Customer Management Domain Analysis 39
4.3.3 Service Management Domain Analysis 40
4.3.4 Resource Management Domain Analysis 41
4.4 Multi-domain network performance management – current status 43
4.4.1 M-Lab 44
4.4.2 SamKnows 46
4.4.3 Grenouille 49
4.4.4 RIPE TTM and Atlas 50
4.4.5 Summary 52
4.4.6 LMAP 54
4.5 Trends in network performance management 55
4.5.1 Trends 55
4.5.2 Results of the joint GN3 JRA1/JRA2 Ethernet OAM activity 57
4.5.3 Incorporation of embedded Ethernet performance agents into
perfSONAR 59
4.6 Conclusions of the perfSONAR analysis 61
Conclusions 63
Appendix A TM Forum eTOM and TAM specifications 65
A.1 TMF Business Framework (eTOM) 65
A.2 TMF Application Framework (TAM) 67
Appendix B GEMBus and TMF TIP interfaces 69
B.1 Introduction 69
B.2 TM Forum standardised interfaces 69
B.3 ESB as a platform for SOA 70
B.3.1 Background 71
B.3.2 Focus 73
B.4 Autobahn TIP RAM based cNIS integration without ESB 73
B.4.1 Context 74
B.4.2 Focus 74

Abstract
Deliverable D8.4 (DS4.3.1): End-to-end Management – Catalogue of Business Processes Document Code: GN3PLUS13-589-13
v
B.4.3 Implementaton 75
B.5 Autobahn TIP RAM based cNIS integration with ESB 76
B.5.1 Setup 76
B.5.2 Role of the ESB, role of the proxy modules 76
B.5.3 Short summary of the work done 78
B.6 Conclusions 79
Appendix C Standards of Ethernet performance monitoring 81
C.1.1 Standards of Ethernet performance monitoring 81
C.1.2 Service Definitions Standards 81
References 84
Glossary 86

Deliverable D8.4 (DS4.3.1): End-to-end Management – Catalogue of Business Processes Document Code: GN3PLUS13-589-13
vi
Table of Figures
Figure 1.1: Procedure for specifying and implementing business processes [GN921-R] 7
Figure 2.1: Business process decomposition for NREN to NREN interaction [GN3 DJ2.1.1] 12
Figure 3.1: MDVPN Service provisioning process flow 18
Figure 3.2: MDVPN User reported problem resolution process flow 23
Figure 4.1: Performance Management process subgrouping 29
Figure 4.2: eTOM High Level Mapping 32
Figure 4.3: Mapping of perfSONAR on Vertical and Horizontal Process Groups 34
Figure 4.4: Mapping of perfSONAR to eTOM Level 2 Process 35
Figure 4.5: Mapping of perfSONAR on level 3 Customer Interface Management process according
to eTOM 36
Figure 4.6: Mapping of perfSONAR on level 3 Service Quality Management process according to
eTOM 36
Figure 4.7: Mapping of perfSONAR on level 3 Resource Performance Management process
according to eTOM 37
Figure 4.8: Mapping of perfSONAR on level 3 Resource Data Collection & Distribution
Management process according to eTOM 37
Figure 4.9: Overlap of TAM and current perfSONAR implementation 39
Figure 4.10: Service Performance Management 40
Figure 4.11: Service Test Management 41
Figure 4.12: Resource Performance Management 42
Figure 4.13: Resource Fault Management 42
Figure 4.14: Resource Test Management 43
Figure 4.15: M-Lab performance measurement results presented through Google Public Data
Explorer 46
Figure 4.16: An example of SamKnows measurement results 48
Figure 4.17: SamKnows Whitebox probe placement 49
Figure 4.18: RIPE TTM measurement architecture 50
Figure 4.19: RIPE ATLAS probe 51
Figure 4.20: RIPE ATLAS measurement results 52
Figure 4.21: perfSONAR extension architecture 58
Figure A.1: Frameworx Components [tmforum.org] 65
Figure A.2: eTOM Level 1 View 66
Figure A.3: Communication software value chain [TAM] 67
Figure A.4: The Application Framework 68
Figure B.1: Enterprise Service Bus (reference architecture) 72

Abstract
Deliverable D8.4 (DS4.3.1): End-to-end Management – Catalogue of Business Processes Document Code: GN3PLUS13-589-13
vii
Figure B.2: TIP RAM implementation for cNIS and AutoBAHN (Phase 1) 75
Figure B.3: Pure WS based vs. ESB based SOA implementation 76
Figure B.4: Alarm service call sequence 77
Figure B.5: AutoBAHN service call sequence 78
Figure C.1: Throughput test according to the ITU-T Y.1564 recommendation 82
Figure C.2: A hierarchy of maintenance sessions according to IEEE 802.1ag specification 83
Table of Tables
Table 4.1: Comparison of the main multi-domain measurement platforms 54
Table 4.2: perfSONAR extensions needed to access Ethernet measurement data 58

Deliverable D8.4 (DS4.3.1): End-to-end Management – Catalogue of Business Processes Document Code: GN3PLUS13-589-13
1
Abstract
This document describes the GÉANT business process catalogue, a set of business processes that are executed
during all the phases of the operations of GÉANT3plus multi-domain services. It also describes the selection
procedure for the most important business processes that will be analysed in subsequent phases of the project.
The main process flows of the newly developed MDVPN service and the perfSONAR tool (which supports
performance monitoring for the GÉANT community) were analysed. This revealed several places where existing
manual procedures in the multi-domain service operations could be replaced by OSS components, making
service operations significantly simpler. The analysis also highlighted some problems with the design and focus
of the existing tools that require improvement.
Executive Summary
The main aim of this document is to model the business process catalogue, a set of business processes that are
executed during all the phases of the operations of GÉANT3plus multi-domain services (e.g. bandwidth on
demand, multi-domain VPN and similar) and the selection of the most important business processes that will be
analysed in the next phases of the project. It is a report of the first phase of the modelling and redesigning
procedure for new and existing GÉANT OSS (Operation Support Systems) components.
The first two sections of this report describe standardisation in the field of network management and define the
methodology for the analysis given in the remainder of the text and the criteria for the selection of the three
processes. Because of the strict top-down structure of the task, defined through the set of milestones, the analysis
will lead by the end of the project to significant improvements in the GÉANT OSS component. Since any kind of
software development has to be properly justified, the analysis considered the information about available
services, the need for particular OSS service components, the trends in the number of users, the tools and

Executive Summary
Deliverable D8.4 (DS4.3.1): End-to-end Management – Catalogue of Business Processes Document Code: GN3PLUS13-589-13
2
functionalities already provided, the availability within the market of similar tools and a cost/benefit analysis of
some of the proposed changes.
The third section of this report presents the analysis of the typical process flows for the MDVPN service that is
currently being developed in SA3 T3. These process flows describe typical end-to-end activities such as request-
to-provisioning and problem reporting-to-resolution for newly designed services, and all processes that are
currently executed by human administrators. Key conclusions of this section are that proper modelling of the
Inter-domain service interaction is crucial for the efficient operations of the MDVPN (and any similar multi-domain)
service. In addition, the existence of a service instance catalogue that stored domain service capabilities, a
catalogue of installed service instances and service availability information, would significantly improve
provisioning time for the service.
The final section of this report analyses perfSONAR, the tool that supports performance monitoring processes
for the GÉANT community. The analysis revealed that different initiatives within the GÉANT community in the
past made it difficult to define the main purpose and goal of perfSONAR. It is perceived among some groups in
the community as a general multi-domain active network monitoring platform while others perceive it as a
supporting tool for other GÉANT multi-domain services. These different views led in the past to the development
of different modules that support one or the other view. The analysis shows that in both cases there are problems
with perfSONAR which result in the relatively low rates of tool adoption and usage, but with a potential for these
to be improved. perfSONAR as a general multi-domain active network monitoring platform, although performing
similar types of network measurements, is handicapped compared to similar platforms by having a smaller
number of measurement points, a smaller geographic range and a more complex installation procedure. On the
other side, perfSONAR as a supporting tool for other multi-domain network services lacks the capabilities to
process specific multi-domain service parameters (e.g. BoD reservations, VPN circuits, SLA parameters, warning
thresholds, and so on). There is no correlation between network performance and service parameters in
perfSONAR. The SA4 T3 task recommends revisiting the main goals of perfSONAR tool to define a sharper focus
for the platform before proceeding with the tool improvements that would make it more desirable and competitive.
Based on the previous two analyses, the task decided to choose three process groupings for further analysis:
Performance Management processes.
Problem Management processes.
Multi-domain Service Interaction.
The first group is supported by perfSONAR (though needing improvements) but the other two processes are
unsupported in the current GÉANT OSS portfolio.
The document in the Appendix also contains a report on the integration of the two existing GÉANT tools (cNIS
and AutoBAHN) using GEMBus, the GÉANT-developed Enterprise Service Bus (ESB) platform which is still in
the pilot phase, and standard TM Forum’s TIP Resource Alarm Management interface. OSS component
integration using common communication vehicle (ESB, and in this case home developed solution) and
standardised interfaces is the current network management best practice.
This report does not strictly belong to the business process analysis, but since the main goal of the task is the
improvement of new and existing GÉANT tools, the improvement can be made also through better internal
organisation and architecture (e.g. redesigning the tool from the software silo to SOA architecture or applying

Executive Summary
Deliverable D8.4 (DS4.3.1): End-to-end Management – Catalogue of Business Processes Document Code: GN3PLUS13-589-13
3
standardised interfaces for inter-OSS communication). The conclusion of this subtask is that the GEMBus
platform is suitable for OSS component integration, and that this integration is easily achievable.
Deliverable D8.4 (DS4.3.1): End-to-end Management – Catalogue of Business Processes Document Code: GN3PLUS13-589-13
4
1 Introduction
1.1 Objective
The main objective of the Deliverable DS4.3.1 is to define the catalogue of network management business
processes for the GÉANT-NREN multi-domain environment. This is a set of business processes that are
executed during all the phases of the operations of GÉANT3plus multi-domain services (e.g. bandwidth-on-
demand, multi-domain VPN and similar).
The first Milestone of the SA4 T3 task, which coincides with the due date of the DS4.3.1, is the selection from
this catalogue of the three most important business processes which will be modeled in the next phases of the
project and whose modeling will be eventually used for the redesign and refactoring of the existing tools that are
being developed within the GN3plus project. Therefore this document will focus on the model of the business
process catalogue and the selection of the most important business processes using the findings of GN3 JRA2T1
task which is a direct predecessor of GN3plus SA4 T3. It can be seen as a report of the first phase of the top-
down approach to the modeling and/or redesign of the new/existing OSS (Operation Support Systems)
components.
The document has a much wider scope than simply enlisting and briefly describing the set of business processes
that are relevant to the GÉANT-NREN multi-domain environment. The selection of the most important business
processes cannot be carried out by a purely abstract analysis of the business process frameworks: it needs to
include an analysis of the particular services and tools that are in use or are being planned in GÉANT. In addition
to focusing on processes whose automation could lead to significant service improvements, consideration must
also be given to potential weaknesses and operational bottlenecks. Three Appendices have been included with
this Deliverable in order to make the document self-sufficient. Some material is fairly readily accessible elsewhere
(e.g. Ethernet performance monitoring standards) but other material is not (e.g. the Introduction to TM Forum
specifications) and is included here for the convenience of the reader.
1.2 Document Outline
The document is organised as follows: Section 2 is a brief overview of the GÉANT business process catalogue
modelled in GN3. Section 3 analyses MDVPN service operations and finds processes that could be candidates
for the selection. Section 4 analyses the way Assurance business processes are currently supported in the
GÉANT environment and Section 5 gives the conclusion to this report.

Introduction
Deliverable D8.4 (DS4.3.1): End-to-end Management – Catalogue of Business Processes Document Code: GN3PLUS13-589-13
5
Appendix A is a brief introduction into TMF Business and Application Framework; Appendix B contains the report
of the successful AutoBAHN-cNIS integration using GEMBus; Appendix C is an overview on the recently
published standards for Ethernet performance monitoring.
1.3 GÉANT Multi-domain Services and Tools - Current
Situation
The main aim of the SA4 T3 task is the redesign of the existing GN3plus monitoring and other tools supporting
multi-domain network services. Existing GN3plus multi-domain services that are the potential subject of the SA4
T3 analysis are: Bandwidth on demand (developed by SA3T1), multi-domain VPN (SA3T3) and multi-domain
wavelength service (SA3T2). These services are in different phases of service lifecycle. Bandwidth on demand
(BoD) service is in a relatively mature stage, being developed throughout the GN3 project and supported by
AutoBAHN tool for automatic service provisioning across multiple domains and cNIS as a repository of network
topologies being used by AutoBAHN for service topology calculations. The design of the multi-domain VPN
(MDVPN) service started with the beginning of the GN3plus project, and the service is now in the service design
phase, where the main focus is on finding the best technical solution for the service, configuration, testing the
service and on defining the service architecture, main actors, roles and functions. MDVPN service at the moment
does not have any software supporting tools. Multi-domain wavelength service is not being actively developed
as there is no sufficient demand for such service at the moment of writing this document.
Another tool that is being developed within the project and whose development and design matches the aim of
the SA4 T3 task is perfSONAR multi-domain monitoring (MDM) (SA4T1). There is a slight ambiguity in the way
perfSONAR is perceived within the GÉANT community that can be seen through the diverse subtasks and
activities related to perfSONAR during the GN3 project and after it. Typically there are two different views:
perfSONAR viewed as a service-agnostic4 multi-domain monitoring platform, branded as a perfSONAR
MDM product which NRENs can use in order to get the insight into the network performance parameters
beyond the borders of their network and regardless of the services in use in the GÉANT environment
perfSONAR viewed as a potential supporting service for other network services being offered in the
environment (attempts and pilots to integrate perfSONAR and AutoBAHN in order to use perfSONAR as
a monitoring platform for BoD service, circuit monitoring (CMON) module development, E2EMON and so
on).
In the first case, perfSONAR users are NOC and PERT engineers from GÉANT-NREN environment and/or from
supporting teams from multi-domain projects communities such as LHCONE or EGI. In the second case,
perfSONAR users are other network services that would use perfSONAR features such as AutoBAHN, CMON,
MDVPN, etc.
4 perfSONAR is unaware of the underlying network services (e.g. GÉANT IP, BoD, wavelength), their service
topologies, performance parameters and other service‐specific details

Introduction
Deliverable D8.4 (DS4.3.1): End-to-end Management – Catalogue of Business Processes Document Code: GN3PLUS13-589-13
6
One of the main challenges that SA4 T3 is facing during the GN3plus project is the decreased size of this part of
the GÉANT service portfolio. Some services, like multi-domain wavelength service and tools like iSHARE and
AMPS have now been withdrawn. The other challenge is a relatively low usage of other services and tools
mentioned in this section. This fact makes it very difficult to create a real business case for the final goal of this
task: the development of new or redesigned OSS components that would support service operations. This is
because the cost of development could exceed the benefit of reducing manpower by automating certain
supported processes, given the number of required service operations.
1.4 Background – Network Management Principles
Network management practice has evolved in recent decades from being mainly network device management to
a much wider set of activities. Increased complexity of network technologies, inter-network relations and new
services, the need to perform any service-related operations in the most efficient, reliable and quick way in order
to provide the best possible customer experience has shifted the focus of modern network management towards
the design and development of OSS components. One of the aims of network management is to replace manual
procedures in service operations with software-supported processes wherever possible and suitable. The final
goal is to create fully autonomic networks able to react without human intervention to various events inside or
outside the network – though this goal is still at the research stage.
The shifting focus of network management towards OSS design and development led to the proposal of various
specifications that summarize best practice in network management and define several standards. One of the
leading bodies in the field that creates such specifications is TeleManagement Forum5 (TMF). TMF specified the
Frameworx, a set of documents that describe various topics in network management from different viewpoints
(What do we have to do in order to provide a service? What do we want to manage? What kind of supporting
tools can we create? How to model data for these tools? Which interfaces should we use in order to have
interoperable OSS components?). The most well-known of the Frameworx specifications is the Business Process
Framework (eTOM - enhanced Telecom Operations Map), which gives a description and decomposition of all
business processes that could be found in a network service provider (it gives an answer to the question e.g.
What has to be done in order to provide a service and by whom?, but not how you do that). The Business Process
Framework is agreed as a common reference model and vocabulary for the business process description and is
adopted by ITU-T6 as M.3050 and by ETSI-TISPAN7 as the best business process description for network service
providers8. Other TMF specifications are the Application Framework (TAM – Telecom Application Map), which
gives the functional description of an ideal set of OSS components in an ISP, and the Information Framework
(SID – Shared Information and Data model) which describes the most complete existing information model that
can be used for the design of OSS components. The scheme is being incrementally adopted by ITU-T as
Recommendation M.3190. A significant part of the TMF work is the attempt to create standardised interfaces for
5 http://www.tmforum.org/
6 http://www.itu.int/en/ITU‐T/Pages/default.aspx
7 http://www.etsi.org/TISPAN/
8 More details about the TMF Business and Application Framework, which are used extensively in this
document, are given in Appendix A of this document. Additional details can be found in [GN3 DJ2.1.1]

Introduction
Deliverable D8.4 (DS4.3.1): End-to-end Management – Catalogue of Business Processes Document Code: GN3PLUS13-589-13
7
the communication between OSS components. There have been several initiatives: MTNM, MTOSI, OSS/J, but
the current effort is to gather all of these under the common umbrella of TIP (the TMF Interface Programme).
1.5 Catalogue of Business Processes
Various TMF specifications, although written in support of efficient and automated service operations in
communication providers are not always fully compatible and their use is not always straightforward. For instance,
business processes cannot be mapped one-to-one to TAM applications; it is not clear how and which parts of the
SID model to use for the design of the tools supporting some process; the SID model is not always compatible
with various TMF interface specifications, and so on. However, there is a general approach in TMF towards a
top-down method in implementing their principles [GN921-R], as shown in Figure 1.1.
Figure 1.1: Procedure for specifying and implementing business processes [GN921‐R]
The approach may be summarised in the following steps:
Choose a specific business processes whose automation could significantly improve service operations.
Analyse that process thoroughly for the service which is being improved (the business processes as it is
now executed).
Decompose the process to technology-specific processes for modeling.
Pick the correct information model for that particular problem from SID.
Design an appropriate tool using TMF specific interfaces.

Introduction
Deliverable D8.4 (DS4.3.1): End-to-end Management – Catalogue of Business Processes Document Code: GN3PLUS13-589-13
8
This approach is broadly in line with the GN3plus SA4 T3 task milestone schedule, according to which the task
has to create the catalogue of business processes, then pick and model the three most important business
processes before selecting one of the three processes and design the improvements to the existing GÉANT tools
according to the model of this process.
This deliverable is a continuation of the work of the GN3 JRA2T1 task which applied TMF specifications to various
network service management activities. Analyses were completed in order to find gaps and possibilities for
improvement in the design of existing tools, to improve interoperability and later compatibility with other software
tools in use, such as Network Management Systems. Many of the JRA2T1 recommendations turned out to be
successful and are in production now, including the design of the DWDM plugin for the cNIS tool using SID
artefacts and the integration of cNIS and AutoBAHN using TMF TIP interfaces.
The main findings of the GN3 JRA2T1 task were summarised in the Deliverable document [GN3 DJ2.1.1]. In
addition to presenting a Business Process Architecture for the GÉANT-NREN environment, the report concluded
that service operations in a multi-domain environment differ from the single domain case by the existence of a
specific group of processes which define Inter-domain communication. This group of processes is called ‘Multi-
domain service Interaction’ and is described in detail in [GN3 DJ2.1.1]. All other processes for the single-domain
ISP case (and thoroughly described in the TMF Business Framework) are applicable to both single-domain and
multi-domain environments. Therefore SA4 T3 (as GN3 JRA2T1) is of the opinion that there is little sense in
creating a new static GÉANT-specific business process catalogue. Specifying a new business process catalogue
would lead to either excessive duplication from the existing (and well proven) TMF Business Framework
specification with the specific multi-domain extension already described in [GN3 DJ2.1.1]. The alternative would
require the specification of a new proprietary model with the risk of errors and without the review from other
independent sources and service providers. It is anticipated that only minor changes and refinements of the
model will be made, if any, therefore SA4 T3 will use Business Process Architecture [GN3 DJ2.1.1] as the
business process catalogue for the GÉANT environment.
1.6 Choosing the Most Important Business Processes
The first Milestone of the SA4 T3 task is to select the three most important business processes from the business
process catalogue which will be modeled in the next phases of the project. The modeling will eventually be used
for the redesign of the existing tools that are being developed within the GN3plus project. A few questions
naturally arise from this procedure: How to measure the importance of the business processes? What are the
measurable selection criteria? At what level of decomposition (in the sense of eTOM process decomposition)
should the chosen process be?
Pure analysis of the business process framework cannot automatically give the right answer to these questions,
as all business processes more or less equally contribute to a successful service delivery. For example, someone
from a technical background might consider that efficient service provisioning is more important than service
marketing or customer care, but this is not true. Even those services whose operations are organised in the most
efficient and automated way, using the most advanced technologies can be completely unsuccessful if insufficient
attention is devoted to capacity management, service marketing, relations to suppliers or other non-technical
processes, so other criteria have to be found.

Introduction
Deliverable D8.4 (DS4.3.1): End-to-end Management – Catalogue of Business Processes Document Code: GN3PLUS13-589-13
9
It was shown in the previous section that the methodology of the whole task is structured in a top-down manner
where the selection of the important business processes will eventually feed into the design of the new or
improved GÉANT tools according to the processes being modelled. The selection of the business processes in
this phase therefore directly impacts the choice of the tool that will be developed or improved in the later phases
of the project. Since the development or the significant change of the OSS component can be seen as the
development of the new or changed IT service, such changes have to be properly justified. Justification for the
development of some specific OSS components can then be used as a justification or a selection criterion for
business processes that would be modelled later. Therefore the rigid top-down structure from choosing processes
to the OSS redesign is not reasonable and has to be modified by taking into account the information about the
available services, needs of services for particular OSS components, the number of users and trends in their
change, existing tools, their set of functionalities, position within the market of similar tools, a cost-benefit analysis
of some proposed changes, etc. Since the structure of the task assumes that in the later phase, one business
process out of the three selected now will be used for the tool redesign, the justification in this stage does not
have to be very detailed, but should just narrow down the scope to the set of business processes that appear to
be the most often in the majority of typical multi-domain service operations. This will be done through the analysis
of the service operations of MDVPN service and through the analysis of the business processes supported by
the perfSONAR tool, its comparison to the standard models and similar existing tools.
The selected business processes are eTOM Level 2 process groupings that support some end-to-end activities
(described in Section 3). It is better, for example, to analyse a Problem management vertical process grouping
that includes both Resource Trouble Management and Service Problem Management L2 processes, than to
single out one of these processes, because the process grouping contains all the processes from service problem
report to problem resolution. In this way, the end-to-end activity will match the set of functionalities of the
supporting tools.
Despite the earlier remark about the equal importance of the business processes of all process areas (strategy
and product, operations and enterprise), the focus of the business process analysis in this document will remain
on business processes from the operations area because the targeted recipients of the SA4 T3 recommendations
are other SA tasks and activities whose objectives are to design and develop Operations Support Systems.
Business processes, from strategy, product and enterprise process areas, typically belong to the NA tasks and
activities of GN3plus, and their proper design and execution is of equal importance for the success of GÉANT
services.
1.7 Business Process Analysis
Network management principles promoted by TMF were already applied to some tools and services in the GN3
project. Development teams of AutoBAHN and especially cNIS were exposed to the business process and
functionality analysis. They adopted many features of the SID information model and the integration between the
tools was developed using TMF TIP RAM (Resource Alarm Management) interfaces. The priority in this phase
of the work will be on the analysis of the tools and services (i.e. perfSONAR and MDVPN) that did not have any
contact with these principles and this style of assistance.
In order to assess the importance of business processes, the task analysed process flows for specific service
related operations for the MDVPN service. Another result of the previous work of GN3 JRA2T1 are generic multi-
domain process flows which describe the most common end-to-end process streams in the GÉANT-NREN

Introduction
Deliverable D8.4 (DS4.3.1): End-to-end Management – Catalogue of Business Processes Document Code: GN3PLUS13-589-13
10
environment such as request-to-service provisioning or service problem-to-resolution. Process flows are a
powerful tool for process visualisation and were used to detect some of the components specific for the multi-
domain environment which would significantly shorten the whole end-to-end activity. However, this approach was
never applied to a particular service in our environment. Since the beginning of the GN3plus project, the SA3T3
task has been developing a Multi-domain VPN service (MDVPN). The design of this service from scratch gives
a unique opportunity to test the top-down approach to the management of a service, and to potentially give
recommendations for the service and OSS organisation before the development of the appropriate components
actually begins. Therefore the first part of the Deliverable focuses on the detailed analysis of the actors and
business process flows for the MDVPN service as a typical service in the GÉANT-NREN environment. This
analysis will reveal business processes and process sub-flows whose automation would significantly shorten the
complexity of the most common service operations procedures.
One of the main objectives of SA4 T3 is to improve the design of the existing GÉANT monitoring tools (e.g.
perfSONAR). From the beginning of the GN3plus project, SA3T3 expressed the need to monitor the performance
of the MDVPN service and was interested in the potential use of perfSONAR for service monitoring. perfSONAR
is an infrastructure for network performance monitoring, and thus it could be said that it supports processes from
the Assurance vertical process grouping, Performance Management vertical sub-group 9 in the GÉANT
environment. Assurance business processes lie at the heart of service operations of any service, so we analysed
the set of supported processes from that process grouping and the current status of perfSONAR platform.
Besides making the improvements of the existing tools through:
The introduction of new features and processes supported by the tool.
Functionality alignment with other similar tools.
The introduction of standardised interfaces in order to improve the possibility to integrate the tool with
other OSS components.
The existing GÉANT tools can be improved by better internal organisation and architecture (e.g.
redesigning the tool from software silo to SOA architecture or applying standardised interfaces for inter-
OSS communication).
While the first three ways of tool improvement are covered by the top-down approach based on business process
analysis mentioned above, the last one, the improvement of the internal architecture and organisation of the tools
does not naturally come from the business process analysis. The SA4 T3 team used the Enterprise Service Bus
(ESB) for tool integration, deploying cNIS-AutoBAHN integration using GEMBus and TMF TIP RAM interfaces.
GEMBus is a GÉANT-developed ESB platform which is still in the pilot phase, so practical experience of using
ESB for tool integration should prove useful for the rest of the GÉANT community, The results of this analysis
are available in Appendix B of this document since these results do not fall strictly into the overall objective of the
document.
9 Business process names are from the TMF Business Framework terminology. All business process names and
descriptions throughout the text, unless stated otherwise, are going to be according to the TMF specifications.

Deliverable D8.4 (DS4.3.1): End-to-end Management – Catalogue of Business Processes Document Code: GN3PLUS13-589-13
11
2 Service Delivery Business Processes in the GÉANT-NREN Environment
As stressed in the introduction, Business process architecture for the GÉANT-NREN environment was already
in use in the GN3 project. It is a combination of standard TMF Business framework specification and business
processes specific for the multi-domain operations in the GÉANT-NREN environment. The main conclusions of
that work will be briefly repeated in order to make an introduction to the reader and this deliverable as a stand-
alone document. For details about the Business process architecture, process descriptions and other analyses
please refer to [GN3 DJ2.1.1].
2.1 GÉANT-NREN as a Federated Environment
Federated environments are not unique to academic and research networks. Such environments exist also in the
commercial provider’s ecosystems (e.g. one can buy connectivity between Pittsburgh, PA and Dusseldorf, DE
which spans networks of several service providers) or between military organisations in coalitions [MIL]. In the
commercial case, one service provider has a contract with the customer and the underpinning contracts with
other service providers which provide components needed to create the value chain for the whole service. The
relationship between service providers in that case is typical consumer-provider, where the provider having a
contract with the end user is a consumer of the services provided by other providers. These other providers are
invisible for the end user.
GÉANT-NREN is also a federated environment. Multi-domain services in it are provided jointly by the participating
NRENs and GÉANT network. Unlike the commercial case, there is no strict consumer-provider relationship
between domains (NRENs). Service is composed by joining the effort of participating domains, and all domains
have equal responsibility in the delivery of the service. In order to achieve the required quality of service, SLA
and OLA for the services being provided exist. Domains participating in the delivery of services are autonomous
in the control and management of the resources they own which makes this federated model a loosely coupled
example.

Service Delivery Business Processes in the GÉANT-NREN Environment
Deliverable D8.4 (DS4.3.1): End-to-end Management – Catalogue of Business Processes Document Code: GN3PLUS13-589-13
12
2.2 GÉANT-NREN Business Process Catalogue
Domains in the GÉANT-NREN environment can be seen as independent service providers and business
processes in them can be accurately described using the whole set of processes from the TMF Business
Framework. What distinguishes GÉANT-NREN as a service delivery environment from similar commercial
environments is the nature of the interaction between domains. There is no consumer-provider relation, but
domains exchange technical data needed to deliver services and to react to various events. The process unique
for this environment which models inter-domain interaction is called Multi-domain service interaction (see Figure
2.1, coloured orange) and is responsible for Federated Service topology discovery, allocation of service
resources, coordination of Service Configuration and Activation, Service Problem Management and Service
Quality Management across domain boundaries. Detailed description of the Multi-domain service interaction
process is given in [GN3 DJ2.1.1]. This process is placed at the service functional area and it is important to
stress that interactions over other functional areas are very unlikely. Interaction over resource area would mean
that there is a signalling protocol which enables automatic device configuration from remote domains, which is
violating the autonomy of the participating domains in controlling their own resources. Furthermore the interaction
between the User Relationship Management functional areas is unlikely because of the language barriers
between institutions in one country and other NRENs and contractual obligations between institutions and their
NRENs. Also, each NREN has its own set of suppliers and partners.
Figure 2.1: Business process decomposition for NREN to NREN interaction [GN3 DJ2.1.1]
As the GÉANT-NREN environment is not a single enterprise, the whole Enterprise Process Area from the TMF
Business Framework is hardly applicable as-is to the service operations in it and can be omitted from further
consideration. Also since the main objective of the SA4 T3 task is the improvement of GÉANT OSS component
design, business processes in the Strategy, Infrastructure and Product process area were omitted, while the
focus was on the Operations process area. All TMF Level 2 business processes are depicted in Figure 1.1 and
briefly described in the remainder of this section.
User Relationship Management

Service Delivery Business Processes in the GÉANT-NREN Environment
Deliverable D8.4 (DS4.3.1): End-to-end Management – Catalogue of Business Processes Document Code: GN3PLUS13-589-13
13
This process group defines processes responsible for development, maintenance and improvement of a
relationship with the users. It includes processes which involve development of the support capability, contact
management, accepting and issuing user orders, management of problems reported by customers, monitoring
and management of service performance, billing, selling, charging and marketing.
Service Management and Operations
This process group encompasses all the functionalities and processes necessary for the management and
operation of services offered in the GÉANT environment. It includes processes which are responsible for the
development of service capabilities, configuration and activation of services, service problems and quality
management.
Beside standard Service Management and Operations processes, GÉANT Business Process Architecture also
includes Multi-domain Service Interaction processes. These processes are needed for the establishment and
operation of services in the multi-domain peer environment. Multi-Domain Service Interaction processes
encompass the exchange of information between domains needed for the establishment, operation and
maintenance of services delivered to end-users in the multi-domain environment where the domains are in the
peer relationship. These processes enable the extension of the Service Management and Operations processes
to the multi-domain environment.
Resource Management and Operations
This is a group of functional processes which maintain resource information (application, computing and network
infrastructures). This process group is also responsible for managing all resources (servers, routers, IT systems,
networks, etc.) and ensuring that they deliver and support the services that are offered to the users.
Resource Management and Operations processes are also involved in collecting resource-related information
from network elements or element management systems, and in integrating, correlating and summarising that
information, either passing it on to the Service Management processes and systems, or executing appropriate
actions on resources.
Supplier/Partner Relationship Management
Supplier/Partner Relationship Management processes align closely with a supplier‘s or partner‘s Customer
Relationship Management processes. These processes include issuing purchase orders and tracking them
through to delivery. This involves the mediation of purchase orders to conform to external processes, handling
problems, validating billing and authorising payments, and quality management of suppliers and partners. These
processes cover the buying of Supplier/Partner products by the enterprise.

Deliverable D8.4 (DS4.3.1): End-to-end Management – Catalogue of Business Processes Document Code: GN3PLUS13-589-13
14
3 Business Processes in a typical End-to-End GÉANT service - MDVPN Service Process Flow Analysis
The design of the MDVPN service began at the start of the GN3plus project. Section 3.1 and 3.2 give a brief non-
technical overview of the MDVPN service which defines the main actors and functions needed for proper service
provisioning. For a detailed technical service description and service architecture, please refer to [DS3.3.1].
Section 3.3 explains process flows, their use and purpose, and describes process flows for some of the most
common end-to-end process streams of the MDVPN service.
3.1 MDVPN Service – Overview
Multi-Domain Virtual Private Network (MDVPN) service is a core service10 which provides its users connectivity
between two or more institutions in various NRENs, using MPLS VPN technology. The MDVPN service will be
offered collaboratively by GÉANT and participating European NRENs. GÉANT/Dante will provide the enabling
service – Transport VPN service (Carrier Supports Carrier VPN solution) that is needed in order to deliver core
MDVPN service. Transport VPN service that GÉANT provides to the NRENs will be invisible to the end users of
MDVPN service. NRENs will provide core service – MDVPN service to the users across the Europe.
MDVPN is in the phase of service design. SA3T3 in this phase tries to establish the technological and technical
procedures needed to establish a service and makes plans for the transition of the service to the operational
phase. The MDVPN service currently has few service instances and service users seen as future customers (e.g.
LHCone). However, because the service is very general and potentially useful to a wider set of users (e.g. various
research projects can benefit from this kind of connectivity, access to common resources and so on), the potential
number of service instances could be measured in hundreds in the near future. The amount of automation, the
number and the set of OSS components that should support MDVPN service operations will depend on the actual
uptake of the service.
10 ITIL definition – Core services deliver the basic outcomes desired by the user

Business Processes in a typical End-to-End GÉANT service - MDVPN Service Process Flow Analysis
Deliverable D8.4 (DS4.3.1): End-to-end Management – Catalogue of Business Processes Document Code: GN3PLUS13-589-13
15
3.2 MDVPN Main Entities and Functions
To properly define the MDVPN business process architecture, it is important to clearly define the main
entities/actors which will be included in the service delivery. Business processes are defined with respect to the
particular Service provider that provides a well-defined set of Services to its Users using its subset of Network
Resources. The provider can also have various relations to its Suppliers and Partners needed for the proper
Service provision. The following entities will be included in the MDVPN business process architecture:
Users are those to whom the core MDVPN service is offered and are the focus of the business objectives. The
following types of users could potentially use the service:
Campuses and Institutions: Education and research campuses and/or other public institutions such as
libraries and hospitals that have access to the GÉANT network through their NREN.
Projects: Research and technology projects have specific networking requirements to facilitate their
project‘s collaboration needs, and these are typically met by the project‘s host institutions (which are in
turn connected to the local NREN and through that to GÉANT).
A service provider is an organisation supplying services to one or more users. The service provider of the
MDVPN service is the set of NRENs participating in the VPN service. The MDVPN service will be listed in their
service portfolios and offered along with the services local to the NREN. The MDVPN Service desk is a single
point of contact for users on a day-to-day basis. It is responsible for dealing with a variety of service activities. It
handles incidents, escalates incidents to problem management staff, manages users’ service and change request,
handles communication with users, etc. Due to the MDVPN nature of the service provider, the service desk has
to be decentralised and is typically a set of NOCs in those NRENs or their parts participating in the MDVPN
service. Users group/project member institution will contact and communicate the local NREN service desk (first
level NREN NOC) for every question or request regarding the MDVPN service. Higher level support will be
decentralised and will be provided by members of participating NRENs NOCs (second and third level NREN
NOCs), probably organised as a separate task within the future GÉANT projects.
Suppliers provide resources and other capabilities used by the service provider. NRENs have to be
interconnected in order to provide the MDVPN service. This connectivity is provided by the GÉANT network
through the Transport VPN service. In providing the MDVPN service, GÉANT will be one of the suppliers to the
NRENs.
Partners are those with whom the service provider co-operates in a shared business area. In the context of the
MDVPN service, Regional networks are partners in delivering of the service to the NRENs which have this
complex architecture.
3.3 Business Process Flows and End-to-End Business
Streams
Business process flows and streams are used to visualise the business, the main actors, the order of processes
and potential scenarios in service-related operations [eTOM AddJ]. “End-to-end business streams” describe a
Business Processes in a typical End-to-End GÉANT service - MDVPN Service Process Flow Analysis
Deliverable D8.4 (DS4.3.1): End-to-end Management – Catalogue of Business Processes Document Code: GN3PLUS13-589-13
16
high level view on the core activities within the service provider. Their name contains the start and end point of
the core processes activity (e.g. Order-to-payment, Problem-to-resolution). End-to-end business streams do not
include sub-processes and any more detailed description of the activity. On the other side, process flows include
all sub-processes and activities in the sequence required to accomplish some particular goal. If the goal of the
process flow is to accomplish the goal of the business stream, then such a process flow is called an end-to-end
business flow.
It is important for process flows to be modelled as high-level, generic and technology independent, so that various
services can be supported using the same flow. This is achieved through the top-down approach and with the
level of decomposition of business processes up to eTOM Level 3. Further decomposition could lead into
technology-specific solutions. Such an approach can be required when some specific actions have to be
modelled in details for some particular service.
For process flow modelling described below we used TMF guidelines [eTOM AddK]. Process flows in the TMF
documentation are described using a choice of notations [eTOM AddF]:
TMF specific which is developed from the eTOM diagram, uses eTOM processes as boxes, and arrows
between them designating communication and order.
BPMN 2.011.
This document uses TMF-specific notation as in the authors’ opinion it brings out more clearly which business
processes are involved in the process flow. Converting from TMF-specific to BPMN 2.0 notation is, in any case,
trivial.
The next sections describe two process flows:
MDVPN service provisioning process flow
MDVPN service problem resolution process flow
The task also analysed MDVPN performance problem resolution process flow. This process flow is very similar
to the service problem resolution process flow. The only difference is in the different set of processes which are
used within the same Assurance vertical process grouping (performance problem resolution uses Service Quality
Management instead of Service Problem Management and Resource Performance Management instead of
Resource Trouble Management). To avoid repetition this process flow has been omitted: in any case, Service
Quality Management and Service Problem Management are described in Section 4 through the analysis of
perfSONAR.
Process flows described in the next section are modelled using the following assumptions:
The MDVPN service is in the design phase so there are only a few service instances and service users
that are seen as future customers (e.g. LHCone), in addition the service has no supporting software tools.
In such a case manual operations of almost all service operations processes can be justified. The situation
11 http://www.bpmn.org/

Business Processes in a typical End-to-End GÉANT service - MDVPN Service Process Flow Analysis
Deliverable D8.4 (DS4.3.1): End-to-end Management – Catalogue of Business Processes Document Code: GN3PLUS13-589-13
17
at the time of writing is that there are no databases of services, service instances or domain capabilities
that would be used to assist network operators in service operations to check whether the requested
service instance is feasible and whether there are available resources for such service (section 3.4.2).
However, with the increase of the number of service instances, designing and building such databases
and components will become necessary; several steps in the process flow could then be skipped,
resulting in the whole procedure becoming more efficient. Actually this reduction in the complexity of the
process flow makes the perfect case for the design of various OSS components.
Process flows described below are complex as they cover the whole end-to-end operations from service
request via service provisioning and from service problem report to problem resolution. In these process
flows an exception can occur in almost every step of the flow (e.g. a user may not be authorised to request
the service, his/her request could be incomplete, there could be no available resources, or there could
be a configuration error in some domain, etc.). All these exceptions create feedback loops to an earlier
process and require further processing. Describing all possible feedback loops and appropriate actions
after them would make the process flows, which are already quite complex, completely unreadable.
Therefore only the process flows in a straightforward situation will be shown. Such process flows cannot
be used for a thorough analysis of the behaviour of some actors and for the design of the appropriate
OSS components, but it can show processes upon which service operations are very dependent and thus
be used for our main goal – the decision of the business processes that will be further analysed during
the course of the project.
3.4 End-to-End Service Configuration Process Flow
The Multi-Domain Service Provisioning process flow defined in [GN3 DJ2.1.1] illustrates business process
interaction for general multi-domain service provisioning, regardless of the technologies used and the type of
service provisioned. This model is used as a basis to describe MDVPN service provisioning workflow which
shows the whole set of business processes required to complete end-to-end activity request-to-provision. This
process flow is shown in Figure 3.1. It uses business processes from the Business process architecture described
in Section 2, and where needed these processes are analysed up to the next level of decomposition. Note that
standardised process names (as used in the diagram) are emboldened in this section of the text.

Business Processes in a typical End-to-End GÉANT service - MDVPN Service Process Flow Analysis
Deliverable D8.4 (DS4.3.1): End-to-end Management – Catalogue of Business Processes Document Code: GN3PLUS13-589-13
18
Use
r R
elat
ions
hip
Ma
nage
men
tS
ervi
ce
Man
age
men
t & O
per
atio
ns
Res
ourc
eM
ana
gem
ent &
Op
erat
ion
s
Figure 3.1: MDVPN Service provisioning process flow
3.4.1 User Request Management
The MDVPN Service Provisioning process flow starts when users group/project request for the new MDVPN
service instance. The MDVPN service request in the name of the user group/project could submit any member
institution that is authorised by the other partners in that user group (we will call it Authorised Member Institution
- AMI). The AMI will submit MDVPN service request to the Service desk of local NREN to which AMI is connected
providing all the necessary information for the user’s service request.
The Manage Request process inside local NREN receives the AMI service request for the new MDVPN
service instance. This process is defined by the local NREN and will be performed according to the
existing local NREN rules (e.g. phone call, service portal, email etc.) for their users. All necessary MDVPN
service request details (e.g. user order description, service order end-point addresses, contact details,
etc.) are captured and the status of the service request is managed.
Business Processes in a typical End-to-End GÉANT service - MDVPN Service Process Flow Analysis
Deliverable D8.4 (DS4.3.1): End-to-end Management – Catalogue of Business Processes Document Code: GN3PLUS13-589-13
19
The Manage Request process transfers the AMI service request to the Issue User Order process which
checks if the necessary information about the user group/project service order is provided.
3.4.2 Service Availability Check
The Issue User Order process will create a record of the relevant initiating request and the associated user order
(e.g. ticket in ticketing system of local NREN, new request on the NREN service portal etc.) aimed for
documentation purposes. The issued user order requires a feasibility assessment in all NREN domains that are
listed in the initiating service request (whose users will participate in requested MDVPN service instance).
Since the Issued User Order requires further handling and processing, it is passed to the Track & Manage
User Order Handling process. The Track & Manage User Order Handling process is responsible for
monitoring the service provisioning procedure, updating existing user order, modifying the user order
status etc. The Track & Manage User Order Handling process tracks further progress of the user
group/project service order. The local NREN who received the MDVPN service request from AMI will be
responsible and accountable for further management of MDVPN service instance activation.
The Track & Manage User Order Handling process requests from Determine User Order Feasibility
process to check the availability and/or the feasibility of providing and supporting the MDVPN service to
the AMI and all other members of the user group/project across the GÉANT Multi-domain Service Area
(e.g. Are the member institutions authorised to use the MDVPN service inside their NREN domains?
Does the NREN provide and support MDVPN service? Do they have enough resources to provide service
to requesting institution?, etc.). The Determine User Feasibility Order process inside the local NREN
domain checks if the AMI is authorised to use this particular service and in cooperation with the Service
Management and Operation processes whether the technical conditions for access to service are met.
The Track & Manage User Order Handling process initiates communication with the Service Configuration &
Activation processes in all participating NREN domains, whose users will participate in requested MDVPN
service instance, to check the availability and/or the feasibility of providing and supporting the requested MDVPN
service instance in their own domains. In the later stage of the development of the MDVPN service, checking the
availability and/or feasibility of providing and supporting the MDVPN service can be automated through the use
of the repository of service portfolios, service instances in use and domain capabilities – the Federated Service
Inventory – FSI [GN3 DJ2.1.1]. In that case, steps 5 to 9 can be removed from this process flow and replaced by
a single process – checking FSI.
To be able to communicate with the Service Configuration & Activation processes in all participating
NREN domains (and whose users have requested MDVPN service instance), the Track & Manage User
Order Handling process needs to generate the Service Order through the Issue Service Order process.
This will translate the User Order into a Service Order because user orders might have non-technical
descriptions for marketing purposes. This could be done by completing a service order template
document or web form on an MDVPN central repository location (e.g. a file server, web portal, MDSD
knowledge base, etc.).
Since the issued Service Order requires further handling and processing, it is passed to the Track &
Manage Service Provisioning process. This tracks further progress and is responsible for scheduling,

Business Processes in a typical End-to-End GÉANT service - MDVPN Service Process Flow Analysis
Deliverable D8.4 (DS4.3.1): End-to-end Management – Catalogue of Business Processes Document Code: GN3PLUS13-589-13
20
assigning and coordinating service provisioning related activities, monitoring the service provisioning
procedure, updating information in an existing service order, modifying service order status, etc.
The Track & Manage Service Provisioning process transfers the issued Service Order to the Service
Configuration & Activation processes in all NRENs domains whose users have requested an MDVPN
service instance through the Manage Multi-domain Service Information Exchange process. The
Service Order could be sent to the peer’s domains by an email list or through the MDVPN central
repository notification (e.g. web based portal, central ticketing system, etc.).
The Manage Multi-domain Service Information Exchange process in all peer domains receives the
service request and transfers it to Issue Service Order (8.a) and Track & Manage Service Provisioning
processes (8.b). In this case, where the originating NREN domain (NOC) defines service request there
should be no difference between the user and service orders in the remote domain. In this case, Track
and Manage User Order Handling and Track and Manage Service provisioning processes might be
supported jointly by the same local supporting tool and the difference between the processes may not be
obvious.
The Track and Manage Service provisioning process needs to check the availability and/or the feasibility of
providing and supporting the MDVPN service to member institutions in peer’s domain. This is done through the
activities in the Determine User Feasibility Order (8.c) and the Design Solution (8.d) processes. The
Determine User Feasibility Order process checks if the local member institution is interested in providing
MDVPN service, is it authorised by local the NREN to use an MDVPN service, etc. The Design Solution process
will be invoked as part of a service feasibility assessment and will provide information about the fulfillment of
technical requirements for access to an MDVPN service.
The Track and Manage Service provisioning process in every peer domains collect and send information to
the originating NREN Track & Manage Service Provisioning process (8.h). This could be done by email list, a
federated trouble-ticketing system or by updating an MDVPN central repository location (e.g. file server, web
portal, MDSD knowledge base etc.). Information will be sent again through Manage Multi-domain Service
Information Exchange process (8.f and 8.e).
When the information from all peer domains about the availability and/or feasibility of providing and
supporting the MDVPN service is received, the Track & Manage Service Provisioning process inside
originating NREN will update the status of the Service Order record and transfer information to the Track
& Manage User Order Handling.
The Track & Manage User Order Handling updates the status of User Order and informs the AMI about it. If all
participating NRENs confirm the availability and/or the feasibility of providing and supporting the MDVPN service
to all member institutions of user group/project, AMI is informed that the User Order is accepted and that request
passes to the design, configuration and activation phase.
If all participating NRENs do not confirm availability and/or the feasibility of providing and supporting the MDVPN
service to all member institutions of the user group/project, AMI is informed that the User Order is not accepted
and that user group/project request has to be changed.

Business Processes in a typical End-to-End GÉANT service - MDVPN Service Process Flow Analysis
Deliverable D8.4 (DS4.3.1): End-to-end Management – Catalogue of Business Processes Document Code: GN3PLUS13-589-13
21
3.4.3 MDVPN Service Instance Design, configuration and activation
When the User Order is confirmed the Track and Manage Service provisioning process requests the
design of the solution for the MDVPN service instance. The Design Solution process uses information
obtained through the Service Order process to develop end-to-end the MDVPN service instance design
using design guidelines defined by SA3T3. The Service Instance Architect, typically a senior expert from
the NOC of the originating NREN, could be consulted to define the technical and administrative
parameters (Route Target, unique service instance identifier, etc.) needed for the functioning of the
MDVPN service.
The Design Solution process, depending on the MDVPN service topology, could request the installation
of one or more new resources in the network. In that case, the Track and Manage Service Provisioning
process will request one or more Resource Orders through the Resource Provisioning processes inside
the local NREN domain. The local NREN (NOC) is responsible for the execution of these processes.
When they complete activities, Resource Provisioning processes need to inform the resource order's
requestor (i.e. the Track & Manage Service Provisioning process) that the resources are installed and
configured according to the request.
The Track and Manage Service Provisioning process forward the design solution to the local NREN
Implement, Configure and Activate Service process for implementation, configuration and activation
of the MDVPN service instance.
Also, the MDVPN service instance activation is expected to begin in other participating NREN domains.
According to the design of the MDVPN service instance, the Track & Manage Service Provisioning
process triggers service activation in all other NREN peer domains via the Enable Multi-domain Service
Configuration & Activation process (13.a).
The Enable Multi-domain Service Activation & Configuration process is responsible for the planning and
deployment of the MDVPN service infrastructure, requesting MDVPN service configuration and activation from
participating domains, processing service activation and configuration requests from other domains, and
forwarding them to the local Service Configuration and Activation processes.
The Enable Multi-Domain Service Configuration & Activation process forwards the confirmed Issued Service
Order to the peer domains' Track & Manage Service Provisioning process (13.b). This process forwards the
confirmed service order and end-to-end MDVPN service instance design solution to the Design Solution process
in the peer domain (13.c). The Design Solution process in the peer NREN domain designs only the intra-domain
part of the MDVPN service instance (e.g. local IP address range, NREN PE – CPE routing protocol, etc.).
The Design Solution process, through the Track & Manage Service Provisioning process could trigger
Resource Provisioning processes for the installation and configuration resources needed to activate the
requested MDVPN service instance (13.d). After Resource Provisioning processes inform the Track & Manage
Service Provisioning process that the resources are installed and configured (13.e), the Track and Manage
Service Provisioning process forward the proposed design solution to the Implement, Configure and Activate
Service process for service activation in the peer’s domain (13.f).
After finishing the service provisioning activities, the peer domains inform the originating domain of the
results.(13.g, 13.h, 13.i)
Business Processes in a typical End-to-End GÉANT service - MDVPN Service Process Flow Analysis
Deliverable D8.4 (DS4.3.1): End-to-end Management – Catalogue of Business Processes Document Code: GN3PLUS13-589-13
22
3.4.4 MDVPN Service Instance Testing, closing service request
The Track and Manage Service Provisioning process of the originating NREN triggers the testing of
the service across all participating NREN domains via the Test Service End-to-End process.
If the testing of the requested MDVPN service instance is successful, the Track & Manage Service
Provisioning process changes the status of the Service Order to activate and could initiate the Close
Service Order process.
The Track & Manage Service Provisioning process update the MDVPN service repository with the data
about the installed service instances and informs the service order's requestor (i.e. the Track & Manage
User Order Handling process) that the service is configured and activated according to the request. Also
the Track & Manage Service Provisioning process in the peer’s domain notifies the member institutions
from their domains of the activation of the MDVPN service instance. This is done through the Track &
Manage User Order Handling process in peers’ domains.
The Track & Manage User Order Handling process triggers the Complete User Order process to
finalise the user order. Through activities in this process, the AMI is informed about the successful
activation of the MDVPN service instance.
Once the user order is finalised, the Track & Manage User Order Handling process triggers the user
order to be closed.
3.4.5 Monitoring Service Provisioning Process Flow
The Report Service Provisioning process continuously monitors the status of service orders, provides
notifications of any changes and provides management reports to the MDVPN Operational manager/ MDVPN
Service Level Manager during the MDVPN Service Provisioning workflow. The activities inside Report Service
Provisioning process could be implemented using an email list where the MDVPN Operational
manager/MDVPN Service Level Manager is member, or through the “watcher” role inside Central MDVPN
Ticketing system. Carrying out activities within this process ensures that all parties involved in the MDVPN
Service Provisioning workflow take responsibility and adhere to the obligations defined in the OLA agreement.
3.5 End-to-End Service Problem Management Process Flow
MDVPN service user-reported problem management process flow is an instance of general Multi-Domain Service
Problem Management process flow.
According to the procedures that are currently adopted by the SA3T3 task, we can assume that the user/member
institutions of the MDVPN service instance will contact the local NREN service desk (part of the MDVPN Service
Desk) to report problems in an MDVPN service instance they are currently using. It is assumed that every NREN
will provide all necessary topological information relevant to MDVPN service instance delivery and problem
management. Technical documentation related to the MDVPN service instance will be available at central
MDVPN Service repository to all participating NRENs (e.g. MDVPN Knowledge Base integrated in the GÉANT
MDSD Knowledge Base, MDVPN Wiki platform, MDVPN Web portal, etc.).

Business Processes in a typical End-to-End GÉANT service - MDVPN Service Process Flow Analysis
Deliverable D8.4 (DS4.3.1): End-to-end Management – Catalogue of Business Processes Document Code: GN3PLUS13-589-13
23
Use
r R
ela
tion
ship
M
ana
ge
me
nt
Se
rvic
e
Ma
nag
em
en
t &
Op
era
tion
sR
eso
urc
eM
an
age
me
nt
& O
pe
ratio
ns
Resource Trouble Management
Service Problem ManagementService Problem Management
Create Service Trouble Report
Track & Manage Service Problem
Diagnose Service Problem
Correct & Resolve Service
Problem
Close Service Trouble Report
9
13
8
12
Enable Multi-domain Service
Problem Management
Multi-domain Service Interaction
10.a
Create Resource
Trouble Report
Track & Manage Resource Trouble
Localize Resource Trouble
Correct & Resolve
Resource Trouble
Close Resource Trouble Report
11.a
11.b
Enable Multi-domain Service
Problem Management
Multi-domain Service Interaction
10.b
10.c
Create Service Trouble Report
Track & Manage Service Problem
Diagnose Service Problem
Correct & Resolve Service
Problem
Close Service Trouble Report
10.d
10.e
10.f
Domain A Domain B
Problem Handling
Create User Problem Report
Track & Manage User Problem
Isolate User Problem
Correct & Recover User
Problem
Close User Problem Report
4
15
5
Service user
1
Manage Request
User Interface Management
2
14
8.d
Su
pplie
r/P
artn
er
Re
latio
nsh
ip M
ana
ge
me
nt Initiate S/P
Problem Report
Track & Manage S/P Problem Resolution
Close S/P Problem Report
Receive S/P Problem Report
S/P Problem Reporting & Management
6.a
6.b
3
7
16
Report Service Problem
Figure 3.2: MDVPN User reported problem resolution process flow
3.5.1 Problem Reporting
The MDVPN Service User-reported Problem Management workflow starts when a user reports a problem
through the Manage Request process. Every participating institution of the MDVPN service instance
could report a problem in delivery of service and will have to request resolution from the local NREN
Service Desk. The Manage Request process inside a local NREN is responsible for collecting all required
problem-related data (e.g. user problem description, MDVPN service instance ID, contact details,

Business Processes in a typical End-to-End GÉANT service - MDVPN Service Process Flow Analysis
Deliverable D8.4 (DS4.3.1): End-to-end Management – Catalogue of Business Processes Document Code: GN3PLUS13-589-13
24
authentication information, etc.). This process is defined by the local NREN and is performed (by phone
call, service portal, email, etc.) according to the existing local NREN rules for their users.
The Manage Request process extracts and transfers information from the User Problem request to the
Create User Problem Report process to create a User Problem Report for later problem solving (e.g. a
trouble ticket in a local NREN ticketing system).
Because the User Problem Report needs further processing, the Create User Problem Report process
informs the Track & Manage User Problem process of the creation of a new problem report which then
assigns and coordinates any recovery, repair and restoration activities delegated to other processes,
tracking their execution progress and modifying the User Problem Report status.
3.5.2 Problem Isolation and Recovery
The Track & Manage User Problem process triggers the Isolate User Problem process, which isolates
the user problem and identifies its root cause (e.g. is the problem in the service domain of the MDVPN
service, or is it caused by the improper use of the MDVPN service by the user, or is it caused by a problem
linked to the underlying services?). The Isolate Customer Problem processes updates the status of
open User Problem Report during the assessment, and when the root cause has been identified.
After successful identifying the root cause of a problem, the local NREN Service Desk must inform Service Desks
of other participating NRENs. This MDVPN service problem notification will improve efficiency in resolving issues
inside the MDVPN service instance and will inform participating NREN domains about the existence of problems
in the functioning of a service. Notification could be sent by the email list of the MDVPN operational group. The
information which needs to be included in a message will be defined by the MDVPN Technical group.
Once the user problem is isolated, the Track & Manage User Problem process triggers correction
activities via the Correct & Recover User Problem process. Depending on the cause of the problem,
activities inside of the Correct & Recover User Problem process may include educational interaction
with users to ensure correct usage of the MDVPN service, identifying restoration activities inside the
Service Management & Operation processes, or initiating request to enabling services Supplier for
restoration and recovery. NREN Service Desks will perform activities within these User Relationship
Management processes.
The MDVPN service is provided in a specific and complex GÉANT Service Area environment where
Transport VPN service (the enabling service for the core MDVPN service) is managed by GÉANT/DANTE.
If the Correct & Recover User Problem process indicates that the user problem is caused by problem
linked to the Transport VPN service, the Track & Manage User Problem process becomes responsible
for initiating requests through S/P Problem Reporting & Management processes for restoration and
recovery of the Transport VPN service (6.a). This process coordinates, tracks and manages GÉANT
/DANTE problem resolution activities. In this case GÉANT/DANTE will inform all NREN domains about
the cause of the problem and provide an estimated time for resolution through the GÉANT MDSD function.
The Track & Manage S/P Problem Resolution process informs the Track & Manage User Problem
process about results of activities done by the S/P Problem Reporting & Management processes (6.b).

Business Processes in a typical End-to-End GÉANT service - MDVPN Service Process Flow Analysis
Deliverable D8.4 (DS4.3.1): End-to-end Management – Catalogue of Business Processes Document Code: GN3PLUS13-589-13
25
3.5.3 Service Problem Diagnostics and Resolution
If the Correct & Recover User Problem process indicates that the user problem is caused by the specific
MDVPN service problem, the Track & Manage User Problem process triggers the creation of one or
more Service Problem Reports.
The Create Service Trouble Report process creates a Service Problem/Trouble Report (e.g. change
trouble ticket owner from Service Desk to NREN NOC, open trouble ticket on Central MDVPN Ticketing
system or create new item on Central MDVPN Service Repository etc.) and notifies the Track & Manage
Service Problem process to continue to monitor the progress of the MDVPN service instance problem
resolution. The Track & Manage Service Problem process is responsible for co-ordinating the
necessary activities in order to guarantee that all tasks are finished in the appropriate time and sequence.
The Track & Manage Service Problem process triggers the necessary diagnostic actions. The
Diagnose Service Problem process performs diagnostics, tests and various audits against specific
MDVPN service instances in order to detect the cause of the service problem. During diagnosis, the
Diagnose Service Problem process uses MDVPN Service Instance documentations (maintained
centrally on MDVPN Service repository or maintained locally by every participated NREN.) that contain
topology information, participating domains, IP addressing and MDVPN general monitoring tools. The
Diagnose Service Problem process updates the Service Problem Report during and after the cause has
been identified. After a diagnosis of the service problem, all participating NRENs are informed about the
cause of the problem and the status of the Service Problem Report.
The service problem can be caused by a problem in some of the underlying services. In this case, the Diagnose
Service Problem process initiates the creation of appropriate trouble reports for the underlying services and the
Track & Manage Service Problem process continues to monitor the progress of their resolution.
If the Diagnose Service Problem process shows that the problem is located in other domains, the Track
& Manage Service Problem requests the Enable Multi-Domain Problem Management process (10.a)
to create a Service Trouble Report in the other domains involved in the provisioning of the service
instance (e.g. an email notification, an email notification to the peer NREN domain, a trouble ticket in a
Central MDVPN ticketing system). The Enable Multi-Domain Problem Management process (10.b) in
the peer domain will trigger instances of a Service Problem Report using the Create Service Trouble
Report process (10.c).
The Track & Manage Service Problem process in peer domains coordinates actions for resolving the service
problem in the remote domains. These processes can also trigger Resource Trouble Management processes
or S/P Problem Reporting & Management processes in their own domain. Once the problem is solved in the
peer domain, the Track & Manage Service Problem process informs Track & Manage Service Problem in the
originating domain of the result via the Enable Multi-Domain Problem Management process (10.d, 10.e, 10.f).
If the Diagnose Service Problem process shows that the problem is caused by resource trouble within
the local NREN domain, the Track & Manage Service Problem process request one or more Resource
Trouble Reports to be created inside Resource Trouble Management processes (11.a). The objectives
of these processes are to efficiently and effectively manage reported resource trouble, isolate the cause
and act to resolve the resource trouble. When the resource troubles are resolved, Resource Trouble

Business Processes in a typical End-to-End GÉANT service - MDVPN Service Process Flow Analysis
Deliverable D8.4 (DS4.3.1): End-to-end Management – Catalogue of Business Processes Document Code: GN3PLUS13-589-13
26
Management processes inform the Track & Manage Service Problem process of the successful
resource trouble-solving actions (11.b).
3.5.4 Closing User Problem Report
Regardless of the nature of the MDVPN service failure, the Track & Manage Service Problem process
is ultimately informed about a successful resolution. This triggers the Correct & Resolve Service
Problem process to restore the service to a normal operational state.
After the successful resolution of the service problem, Track & Manage Service Problem triggers the
Close Service Trouble Report process (it updates the status of open trouble ticket at Central MDVPN
Ticketing system, notifies peer NRENs regarding the resolution, etc.).
The Track & Manage Service Problem process notifies the Track & Manage User Problem process of
the successful resolution of the service problem.
The Track & Manage User Problem process initiates the closing of the User Problem Report (e.g. close
trouble ticket in local NREN Ticketing system, etc.).
The Manage Request process informs the user of the successful restoration of the service.
3.5.5 Monitoring Problem Management Process Flow
The Report Service Problem process continuously monitors the status of service trouble report, provides
notifications of any changes and provides management reports to the MDVPN Operational manager/MDVPN
Service Level Manager during the MDVPN Service Problem Management workflow. The activities inside Report
Service Problem process could be implemented using an email list where the MDVPN Operational
manager/MDVPN Service Level Manager is member, or through the “watcher” role inside the Central MDVPN
Ticketing system, etc. Carrying out activities within this process ensures that all parties involved in Problem
Management workflow take responsibility and adhere to the obligations defined in the OLA agreement.
3.6 MDVPN Service Conclusions
Business process flows given in previous sections describe the main procedures in some of the most common
operational business flows in MDVPN service. These process flows assumed completely manual operations and
did not analyse various error feedback loops. However, even such simplified description allows several
conclusions to be drawn:
The set of business processes in both process flows described in this section show one important property:
the main processes in the end-to-end activities belong to the same vertical process grouping (in the first
case, the set of processes belong to Fulfilment and in the second to Assurance process groupings).
Therefore in order to properly define some of the key end-to-end operations procedures it is more
important to start with the analysis of the vertical process groupings than with the single processes at
some level of decomposition.
Business Processes in a typical End-to-End GÉANT service - MDVPN Service Process Flow Analysis
Deliverable D8.4 (DS4.3.1): End-to-end Management – Catalogue of Business Processes Document Code: GN3PLUS13-589-13
27
User/customer-level procedures are performed independently in all domains, typically because of the
language barriers and contractual obligations between NRENs and the institutions that are their
customers.
Resource-level procedures are performed independently in all domains, as all domains have full control
over the resources they own. Resource-level procedures for MDVPN service are the same as for all other
services operated in each of the domain.
Inter-domain service interaction is crucial for successful operations of the MDVPN service. It appears in
various phases of the service operations: capability exchange, request exchange, problem and
performance reports exchange, problem correlation and resolution information exchanges, and so on.
Without automation, operations teams in different domains communicate using emails or phone calls.
Such communication is typically difficult to track and manage and prone to inefficient processing.
Therefore MDVPN service operations could benefit from some sort of automation for inter-domain service
communication.
The exchange of service capability information can be automated through the existence of inter-domain
service catalogues that are populated by the participating domains. The existence of a service instance
catalogue where at least domain service capabilities, a catalogue of installed service instances, service
availability information is stored would significantly shorten provisioning time, as all business processes
described in section 3.4.2 can be executed in the background and replaced with a single process of
checking the service catalogue for service availability and feasibility.
The exchange of service configuration requests can be implemented either by developing a system like
AutoBAHN that automatically configures devices in several domains, or by the Federated Trouble
Ticketing System (which allows the exchange of ticketing information between TTS in use in different
domains). Both systems can track and manage configuration requests but also allow for manual
intervention. The choice of the system depends on the organisational model that exists between
participating domains.
Service problem reports, as well as service performance issues can also be tracked and managed using
the Federated Trouble Ticketing System [FTTS].
Deliverable D8.4 (DS4.3.1): End-to-end Management – Catalogue of Business Processes Document Code: GN3PLUS13-589-13
28
4 Support for Performance Management in the GÉANT environment
Assurance is vertical process grouping of the eTOM Operations Process Area responsible for the execution of
proactive and reactive maintenance activities. The main purpose of those activities is to ensure that the services
provided to customers are continuously available and conform to the agreed SLA or QoS performance levels.
The Assurance vertical process grouping is divided into four horizontal process groupings: Customer Relationship
Management, Service Management and Operations, Resource Management and Operations and
Supplier/Partner Relationship Management, and can be divided into two vertical subgroupings:
Problem Management processes which are responsible for the management of various incident, failure
and problem resolution processes that can occur during the service operations.
Performance Management processes (shown in Figure 4.1) which are responsible for the management
of service performance level in order to assure that contracted service levels are met.

Support for Performance Management in the GÉANT environment
Deliverable D8.4 (DS4.3.1): End-to-end Management – Catalogue of Business Processes Document Code: GN3PLUS13-589-13
29
Figure 4.1: Performance Management process subgrouping
Monitoring resource and service performance is one of the essential processes in the service assurance, and
typically one of the first that are designed when a service is being planned. The GÉANT environment developed
the perfSONAR tool for multi-domain performance monitoring. perfSONAR supports Performance Management
processes (see section 4.1), and especially those processes related to Resource Management and Operations
and Service Management and Operations:
Service Quality Management (SQM) is a Layer 2 business process belonging to the Service Management
and Operations horizontal and Assurance vertical process grouping. This process element manages,
tracks, monitors, analyses, improves and reports on the performance of specific services.
Resource Performance Management (RPM) is a Layer 2 business process belonging to the Resource
Management and Operations horizontal and the same Assurance end to end process grouping. This
process element manages, tracks, monitors, analyses, improves and reports performance of resources
participating in the operations of specific services.
This section will assess the extent of the support for the Performance Management processes in perfSONAR by
analysing the set of Layer 3 business processes supported by perfSONAR and assessing its position in the OSS
portfolio and its feature set compared to the TAM framework. These analyses will enable an understanding of

Support for Performance Management in the GÉANT environment
Deliverable D8.4 (DS4.3.1): End-to-end Management – Catalogue of Business Processes Document Code: GN3PLUS13-589-13
30
perfSONAR’s position within the service operations and will show potential gaps and possibilities for improvement.
Further, the task analysed similar existing multi-domain performance monitoring platforms; these are a subject
of recent research and standardisation activities (IETF LMAP working group) in order to enable strategic
positioning of the tool and to resolve the ambiguous viewpoints on perfSONAR mentioned in section 1.3. In
section 4.5 (Trends in Network Performance Management) some novel methods for performance data gathering
that could be potentially included in perfSONAR are analysed.
4.1 perfSONAR - Brief Overview
perfSONAR is a multi-domain tool that provides performance monitoring and diagnostics for NOC and PERT
engineers in different NRENs or NREN-associated institutions. According to the official perfSONAR
documentation [perfSONAR], perfSONAR supports the following set of features grouped under the following
headings:
perfSONAR active measurements:
Available Bandwidth.
One Way Delay.
Jitter (One Way Delay variation).
Route Tracing - Traceroute.
One Way Packet Loss.
perfSONAR passive measurements:
Link utilisation.
Input errors.
Packet drops.
perfSONAR central functionalities:
Archiving.
Visualisation.
User interface.
perfSONAR is built according to the principles of the Service Oriented Architecture with the following sub-services
[perfSONAR-MDM][perfSONAR Services]:
Measurement Point (MP), i.e. performing network parameter measurements.
Measurement Archive (MA), i.e. storing measurement data.
Lookup Service, allowing user to discover other services like MA/MP, Authentications Service.
Authentication and Authorisation controlling access to monitoring data.

Support for Performance Management in the GÉANT environment
Deliverable D8.4 (DS4.3.1): End-to-end Management – Catalogue of Business Processes Document Code: GN3PLUS13-589-13
31
Topology Service, i.e. making network topology information available.
Resource Protection Service, i.e. arbitrating consumption of limited resources such as bandwidth.
Transformation Service, i.e. enabling data modification between perfSONAR components (e.g. data
producer and data consumer.
4.2 perfSONAR – Business Process Analysis
The main purpose of this section is to map the set of business processes supported by the current perfSONAR
toolset onto selected business processes defined by enhanced Telecommunication Operation Map (eTOM)
standardised by TM Forum. The ultimate goal of this effort is to provide a clear overview of the perfSONAR toolset
in the context of a standardised business process framework, so that stakeholders of perfSONAR in GÉANT
community could better position this toolset into their holistic business process management landscape. Note
that this section intends to serve as a referential proposal for stakeholders of GÉANT, such as NRENS, to map
perfSONAR onto standardised business processes.
4.2.1 Methodology and Analysis Context of perfSONAR
This section gives an overview on the methodology and context that is applied for the analysis of the perfSONAR
tool. The analysis context includes premise and settings that are made for the analysis and roles we defined in
the context of perfSONAR. The actual analysis process follows top-down approach which starts with top level
process groupings in different areas. The refinement of the business process and the final placement of
functionalities of perfSONAR are presented in this section.
4.2.1.1 Premise and Settings for Analysis
Section 1.2 showed that perfSONAR is perceived in the GÉANT community in two different ways. The key
difference between the two is the definition of the user of perfSONAR. When perfSONAR is used as a multi-
domain monitoring platform, perfSONAR users are NOC teams in DANTE and NRENs. When perfSONAR is
used as a supporting tool for other multi-domain network services, the users of perfSONAR can then be either
OSS components supporting these services, or administrators performing manual service operations. However
in both cases the underlying perfSONAR architecture remains the same, as well as the set of network parameters
monitored and perfSONAR components used (except the interface towards the user). Therefore, the set of
business processes supported by the tool will largely be the same with only few differences. In our analysis we
will focus on the second case, when perfSONAR is used as a supporting tool for other multi-domain network
services; the key differences from the first scenario will be indicated where appropriate.

Support for Performance Management in the GÉANT environment
Deliverable D8.4 (DS4.3.1): End-to-end Management – Catalogue of Business Processes Document Code: GN3PLUS13-589-13
32
4.2.1.2 Definition on Terms & Roles
Based on the premise made, in order to conduct analysis and mapping operations, it is necessary to clarify roles
that may involve in the analysis to ensure conceptual consistency.
The eTOM scheme defines roles whose interactions are described in the form of business processes.
Enterprise/Service Provider: MDVPN service providers of perfSONAR are like the providers of multi-
domain network services in GÉANT environment: jointly NRENs and DANTE.
Customers. The users of perfSONAR in the chosen scenario are - depending on the level of automation
of these services - either OSS components supporting multi-domain network services (e.g. BoD or
MDVPN), or administrators performing manual service operations.
Product/Service. The main product of perfSONAR is monitoring the performance of diverse network
parameters. Monitoring data acquired by perfSONAR is intended to support and reinforce operations of
the network. It will be easier to describe the product after this analysis, because the way performance
data is presented (e.g. whether the tool provides only raw measurement data or the data is put in the
context of some service related parameters like SLA, QoS parameters, performance thresholds, etc.) will
affect these conclusions.
Resources. In this document, resources refer to devices such as routers or switches that enable the
networking services required and servers needed to establish the perfSONAR measurement architecture.
4.2.2 eTOM Analysis of perfSONAR
Analysis and mappings of perfSONAR on eTOM business process follow a top-down approach. They start with
top level process groupings both vertical and horizontal, followed by process decomposition operations in which
details of mappings are revealed.
At the highest level of eTOM view, perfSONAR can be mapped to the process area of Operations as shown in
Figure 4.2. This eTOM process area covers all operation processes that support customer operations and
management. The following analysis is focused on this area.
Strategy, Infrastructure &
Product
Operations
Enterprise Management
PerfSONAR
Figure 4.2: eTOM High Level Mapping

Support for Performance Management in the GÉANT environment
Deliverable D8.4 (DS4.3.1): End-to-end Management – Catalogue of Business Processes Document Code: GN3PLUS13-589-13
33
4.2.2.1 Generic Process Groups for the Operations Process Area
This section organizes perfSONAR into horizontal as well vertical end-to-end process groups. Figure 4.3
illustrates the mapping of perfSONAR on an eTOM level 1 view.
a) Vertical Process Groupings. perfSONAR can be located in the Assurance process group which is responsible
to collect and provide customers with correct monitoring and other performance data on the target network in a
near-realtime manner.
b) Horizontal Functional Process Groupings. perfSONAR can be mapped across three different functional
process groups:
Customer Relationship Management (CRM). This process group maintains fundamental knowledge of
customers’ needs and all functionalities for interacting with them. perfSONAR subservice mapped in this
process group
○ Authentication and Authorisation Service
Service Management & Operations (SM&R). This process group is responsible for maintaining knowledge
of services and functionalities that are necessary for operation and management of information service
to customers, for example status reports of network operation. perfSONAR has following sub-services to
support SM&O:
○ Measurement Point (MP)
○ Measurement Archive (MA)
○ Lookup Service
○ Topology Service
Resource Management & Operations (RM&O) focus on obtaining knowledge about underlying resources
that support main services as well as management of them.
○ Resource Protection Service
○ Measurement Point (MP)
○ Measurement Archive (MA)
○ Transformation Service
Note that MP/MA have been included in both service management and resource management operations since
they can be part of the RM&O by collecting and distributing resource information, as well as supporting the SM&R
process group by revealing monitoring information on networking services, e.g. collecting resource information
from multiple distributed MP/MA. However, it should be emphasised that the support for SM&R in perfSONAR is
weak, as perfSONAR is not aware of the service-related parameters (SLA parameters, threshold values, etc.)
and that support for other services is only possible if there is a logical layer between perfSONAR and the service
user able to compare measurement results to these parameters.

Support for Performance Management in the GÉANT environment
Deliverable D8.4 (DS4.3.1): End-to-end Management – Catalogue of Business Processes Document Code: GN3PLUS13-589-13
34
Operations Support & Readiness
Fulfillment Billing & Revenue Mgt.
Operations
Assurance
Customer Relationship Mgt.
Service Mgt. & Operations
Resource Mgt. & Operations
Supplier/Partner Relationship Mgt.
PerfSONAR
Figure 4.3: Mapping of perfSONAR on Vertical and Horizontal Process Groups
4.2.2.2 Decomposition and Mapping of perfSONAR on eTOM Level 2
In the previous section, we narrow down the mapping of perfSONAR on the level 1 of eTOM. This mapping
allocated perfSONAR across multiple process areas, in both vertical and horizontal groupings. perfSONAR is
further decomposed into eTOM level 2 processes as shown in Figure 4.4.

Support for Performance Management in the GÉANT environment
Deliverable D8.4 (DS4.3.1): End-to-end Management – Catalogue of Business Processes Document Code: GN3PLUS13-589-13
35
Operations Support & Readiness
Fulfillment Billing & Revenue Mgt.
Operations
Assurance
Resource Performance
Mgt.
Resource Mgt. & Operations
Service Mgt. & Operations Service Quality Mgt.
Customer InterfaceMgt.
Customer Relationship Mgt.
Resource Data Col. & Distr.
Figure 4.4: Mapping of perfSONAR to eTOM Level 2 Process
The mapping of perfSONAR on Level 2 process groups produces the following:
The Customer Interface Management process group include the perfSONAR Authentication and
Authorisation subservice, with authenticates and authorises the use of certain perfSONAR subservices.
The Service Quality Management process group is mainly responsible for tracking, managing and
analysing service quality and performance. perfSONAR supports service quality management process
by providing access to distributed monitoring data on the performance data of targeted network services
provided by the NOC.
The Resource Performance Management process group has the responsibility to monitor, track,
analyse, control and report performance of resources.
The Resource Data Collection & Distribution process group records or distributes management
information and data records. It is also responsible for processing collected data and information.
4.2.2.3 Decomposition and Mapping of perfSONAR on eTOM Level 3
This section shows how the level 2 processes can be mapped to eTOM level 3 processes:
Customer Interface Management
The AA subservice from perfSONAR allows customer access control to the monitoring data, so it can be mapped
onto Manage Contact and Manage Request of the CIM process at level 3. The first level 3 process manages
all contacts/requests between customers and enterprises, while the latter manages all requests made by them.

Support for Performance Management in the GÉANT environment
Deliverable D8.4 (DS4.3.1): End-to-end Management – Catalogue of Business Processes Document Code: GN3PLUS13-589-13
36
Customer Interface Management
Mediate & Orchestrate Customer Interactions
Analyze & Report on Customer
Manage RequestManage Contact
Figure 4.5: Mapping of perfSONAR on level 3 Customer Interface Management process according to eTOM
Service Quality Management
perfSONAR provides means to monitor network service quality by collecting and storing performance data on
the network resources thus can be mapped onto Monitor Service Quality as level 3 process under Service
Quality Management process.
Service Quality Management
Improve Service Quality
Report Service Quality Performance
Monitor Service Quality
Analyse Service Quality
Analyse Service Quality
Analyse Service Quality
Analyse Service Quality
Analyse Service Quality
Figure 4.6: Mapping of perfSONAR on level 3 Service Quality Management process according to eTOM
Resource Performance Management
perfSONAR contributes to Resources Performance Management processes by providing monitoring and
measurement data on network infrastructure. It can be further be mapped onto Monitor Resource Performance
and Control Resource Performance (e.g., resource protector) at level 3 process level.

Support for Performance Management in the GÉANT environment
Deliverable D8.4 (DS4.3.1): End-to-end Management – Catalogue of Business Processes Document Code: GN3PLUS13-589-13
37
Resource Performance Management
Control Resource Performance
Report Resource Performance
Monitor Resource Performance
Analyse Service Quality
Analyse Resource Performance
Create Resource Performance
Degradation Report
Track&Manage Resource
Performance Resolution
Close Resource Performance
Degradation Report
Analyse Resource Performance
Figure 4.7: Mapping of perfSONAR on level 3 Resource Performance Management process according to eTOM
Resource Data Collection & Distribution
perfSONAR allows the collection and distribution of monitoring and performance data through its MP and MA,
with the transformation subservice enabling conversion and processing of monitoring and measurement data
between various components. These lead to the mapping of perfSONAR onto Collect Management & Data,
Process Management Information & Data and Distribute Management Information & Data level 3 processes
respectively.
Resource Data Collection &
Distribution
Distribute Management
Information & Data
Audit Data Collection & Distribution
Collect Management Information & Data
Process Management
Information & Data
Figure 4.8: Mapping of perfSONAR on level 3 Resource Data Collection & Distribution Management process according to eTOM
4.3 perfSONAR – Features Analysis
As in section 4.2, for the purpose of this feature analysis, perfSONAR is primarily perceived as a multi-domain
tool that supports other services in the GÉANT environment. From that perspective, perfSONAR is analysed as
a product (application) supporting services like GÉANT IP, GÉANT Plus, GÉANT Lambda, GÉANT BoD
(Bandwidth on Demand), etc. Users of perfSONAR are NOC and PERT engineers in different NRENs or NREN
associated institutions. Their use of perfSONAR can be accomplished either through a perfSONAR UI web
service or through some other third-party application that is integrated with the perfSONAR API (Application

Support for Performance Management in the GÉANT environment
Deliverable D8.4 (DS4.3.1): End-to-end Management – Catalogue of Business Processes Document Code: GN3PLUS13-589-13
38
Programming Interface). For example, AutoBahn (the bandwidth-on-demand provisioning tool) used in the
GÉANT BoD service would be considered as an integrated application that presents perfSONAR features to its
users (NOC and PERT engineers) indirectly, through the perfSONAR API.
4.3.1 perfSONAR Supported TAM Features
Figure 4.9. shows TAM level 1 categories that are implemented in current multi-domain perfSONAR
implementation:
Customer Information Management.
Service Performance Management.
Service Test Management.
Resource Performance Management.
Resource Fault Management.
Resource Test Management.
Dark orange colours represent TAM applications that are more aligned/ significant for the current implementation.
Those are Service and Resource Test Management categories, in accordance with the explanations given later
in this section. It should be emphasised that Service Management Domain decomposition is only observed from
the perspective of a basic IP connectivity service in current perfSONAR deployment (e.g. the GÉANT IP service).

Support for Performance Management in the GÉANT environment
Deliverable D8.4 (DS4.3.1): End-to-end Management – Catalogue of Business Processes Document Code: GN3PLUS13-589-13
39
Figure 4.9: Overlap of TAM and current perfSONAR implementation
In the following sections, perfSONAR and its features are analysed through three horizontal domains: Customer
Management Domain, Service Management Domain and Resource Management Domain. The analysis uses the
TAM framework model.
4.3.2 Customer Management Domain Analysis
Customer Information Management
Authentication and authorisation for secure access in current perfSONAR implementation is realised through
static single end-user credentials. Other authentication mechanisms that exist in GÉANT, such as GÉANT AAI,
eduGAIN, or static intranet accounts, are not used for perfSONAR.

Support for Performance Management in the GÉANT environment
Deliverable D8.4 (DS4.3.1): End-to-end Management – Catalogue of Business Processes Document Code: GN3PLUS13-589-13
40
4.3.3 Service Management Domain Analysis
perfSONAR is basically a service-agnostic tool (i.e. it is not aware of service-specific topologies, changes,
configurations, performance parameters, etc.). Therefore this section of TAM analysis looks at how perfSONAR
supports GÉANT IP service and associated simple IP connectivity monitoring and testing.
Service Performance Management
perfSONAR features enable monitoring and analysing the end-to-end service in the GÉANT multi-domain
environment (GÉANT IP service). Real-time measurements can be initiated to ensure that service is working
correctly. Historical data can be provided using measurement archives. This application includes the following
TAM category:
The Service Performance Monitoring application provides functionality to support performance monitoring
of the service (active and passive measurements) and data collection (measurement archives).
The TAM categories that are related to the current perfSONAR implementation are shown in Figure
4.10.(coloured orange).
Figure 4.10: Service Performance Management
Service Performance Management Applications are built on the Resource Performance data (physical
infrastructure elements in the GÉANT network): they are basic inputs to determine the Quality of Service.
In the scope of Service Performance Management section, perfSONAR measurements can be made on-demand
or at scheduled intervals.
Service Test Management
The Service Test Management Application, as part of both the fulfillment and the assurance process is
responsible for:
Ensuring that the assigned service works as designed using scheduled measurements.

Support for Performance Management in the GÉANT environment
Deliverable D8.4 (DS4.3.1): End-to-end Management – Catalogue of Business Processes Document Code: GN3PLUS13-589-13
41
Service trouble/problem isolation using on-demand measurements.
Regarding active measurements in perfSONAR (both scheduled and on-demand), it contains following entities:
The Service Test Strategy and Policy Management application provides functionality to manage the rules
that define the strategies for conducting various service tests.
The Service Test Lifecycle Management application manages the end-to-end lifecycle of a test of a
service. This primarily refers to scheduling active measurements, setting up the test configurations and
test executions.
The Service Test Command and Control application accesses, commands and controls the devices
required for service testing (perfSONAR Measurement Points).
The Service Test Services application accesses the testing capabilities. For the current perfSONAR
implementation, this TAM category primarily refers to a user interface (perfSONAR UI) for performing
manual (on-demand) or automated (scheduled) real-time service testing.
The TAM categories that are related to the current perfSONAR implementation are shown in Figure
4.11.(coloured orange).
Figure 4.11: Service Test Management
4.3.4 Resource Management Domain Analysis
Resource Performance Management
perfSONAR features enable monitoring and analysing performance of the resources in GÉANT multi-domain
environment (key infrastructure elements for GÉANT Service Performance Management). This application
includes the following TAM categories:
The Resource Performance Monitoring application provides functionality to support performance
monitoring of the resources (active and passive measurements) and data collection (measurement
archives).

Support for Performance Management in the GÉANT environment
Deliverable D8.4 (DS4.3.1): End-to-end Management – Catalogue of Business Processes Document Code: GN3PLUS13-589-13
42
The Resource Performance Analysis application provides functionality to analyse the performance data
received from Resource Performance Monitoring, and to determine the root cause of resource
performance degradation (e.g. perfSONAR Analyse path segment feature).
The TAM categories that are related to the current perfSONAR implementation are shown in Figure
4.12.(coloured orange).
Figure 4.12: Resource Performance Management
Resource Fault Management
perfSONAR features enable troubles associated with resources in the GÉANT multi-domain environment to be
managed. This application includes the following TAM categories:
The Fault Monitoring (Surveillance) application provides functionality to monitor the operational status of
resources.
The Fault Root Cause Analysis application provides functionality to determine the root cause of a problem
in the network (eg. perfSONAR Analyse path segment feature).
The respective TAM categories are shown in Figure 4.13 (coloured orange).
Figure 4.13: Resource Fault Management
Resource Test Management

Support for Performance Management in the GÉANT environment
Deliverable D8.4 (DS4.3.1): End-to-end Management – Catalogue of Business Processes Document Code: GN3PLUS13-589-13
43
perfSONAR Resource Test Management features ensure that the various resources in the GÉANT network are
working properly: they are part of both the fulfillment and the assurance process. A resource test in the fulfillment
process ensures that the assigned resources work as designed, while in the assurance process these application
ensure fault isolation.
Resource Test Management could be considered as the primary or most important TAM category in the
perfSONAR feature analysis. Regarding active measurements in perfSONAR (both scheduled and on-demand),
it contains following entities:
The Resource Test Strategy and Policy Management application provides functionality to manage the
rules that define the strategies for conducting various resource tests.
The Resource Test Lifecycle Management application provides functionality to manage the end-to-end
lifecycle of a resource test. This primarily refers to scheduling active measurements, setting up the test
configurations and test executions.
The Resource Test Command and Control application provides functionality to access, command and
control the devices required for resource testing (perfSONAR Measurement Points).
The Resource Test Services application provides functionality to access the testing capabilities.
Regarding the current perfSONAR implementation, this TAM category refers to a user interface
(perfSONAR UI) for performing manual (on-demand) or automated (scheduled) real-time resource testing.
The respective TAM categories that are related to the current perfSONAR implementation are shown in Figure
4.14.(coloured orange).
Figure 4.14: Resource Test Management
4.4 Multi-domain Network Performance Management – Current
Status
This section gives an overview of several multi-domain active measurement platforms more or less similar to
perfSONAR in the set of provided functionalities. These platforms are briefly described in order to assess the

Support for Performance Management in the GÉANT environment
Deliverable D8.4 (DS4.3.1): End-to-end Management – Catalogue of Business Processes Document Code: GN3PLUS13-589-13
44
current research and industry trend in the domain of active network monitoring, as well as to position perfSONAR
among these similar tools. A quick overview of the recent LMAP (Large-Scale Measurement of Broadband
Performance) IETF working group which aims to standardise methods for active measurement of ISP access
links is given. This IETF effort has partially emerged from the efforts of the SamKnows and the Grenouille platform
described below.
4.4.1 M-Lab
Measurement Lab (M-Lab) 12 is an open, distributed server platform for active end-to-end performance
measurement and detection of other characteristics of broadband connections. It was founded by a group of
researchers from several Universities in the USA and Europe, New America Foundations' Open Technology
Initiative (OTI), the PlanetLab consortium and Google (which provided servers and purchased network
connectivity for the platform). The aim of M-Lab is to carry out research in the area of large scale Internet
measurement and to offer to the public useful information about their broadband connections. Currently there are 33 M-Lab servers worldwide13.
The tools that make up the M-Lab platform are created by researchers, not M-Lab itself. M-Lab supports active
network tests on user demand (from a web browser or from the stand-alone application, or a special probe in the
case of the BISmark test). Measurements capture basic operational characteristics (e.g., TCP throughput,
available bandwidth), advanced host diagnostics (e.g., misconfigurations, small socket buffer sizes), and ISP
traffic management practices (e.g., BitTorrent blocking, traffic shaping). The set of tools that make the M-Lab
platform is gathered from various supporting research projects like BISmark (Georgia Tech), DONAR (Princeton
University), Glasnost (Max Planck Institute), Mobiperf (University of Michigan), NDT (Internet 2), etc. At the time
of writing, M-Lab supports the following set of tools [M-Lab1]:
Network Diagnostic Tool (NDT) is a web-based or command-line TCP client-server application for testing
upstream- and downstream-TCP throughput. NDT measurements results can support the detection of
congestions, upload/download impairments and infrastructure failures.
NPAD (Network Path & Application Diagnostics) – is also web-based or command-line diagnostic tool
designed to diagnose network performance problems in the end-system (the machine your browser is
running on) or the network between it and your nearest NPAD server.
Neubot is a tool that periodically creates BitTorrent, HTTP and raw TCP transmissions in order to check
network neutrality (the non-existence of any preferential treatment/classification towards any kind of
traffic).
ShaperProbe is an application which checks whether ISP uses traffic shaping mechanism.
Glasnost is a web-based set of tools that allows one to check whether there are application-specific traffic-
shaping mechanism installed on the network between client doing the test and M-Lab servers. Supported
protocols are: BitTorrent, eMule, Gnutella, POP4, IMAP4, HTTP, SSH, Usenet and Flash video
12 http://www.measurementlab.net/
13 http://measurementlab.net/mlab_sites

Support for Performance Management in the GÉANT environment
Deliverable D8.4 (DS4.3.1): End-to-end Management – Catalogue of Business Processes Document Code: GN3PLUS13-589-13
45
transmission. Glasnost tests are the longest tests in the M-Lab set of tools which last about 500 seconds
per tested protocol.
MobiPerf is an Android application for measuring throughput and latency of the mobile platform Internet
connection.
Reverse traceroute measures reverse paths from arbitrary destinations back to the user. Similar to
looking glass in functionality, but unlike that tool, it does not require access to the destination host. The
method relies on the fact that there are numerous M-Lab servers, uses record route and timestamp IP
options and assumes that ISPs along the route will allow address spoofing (the weakest point of the
method).
Paris-traceroute: ordinary traceroute can lead to the discovery of inaccurate and incomplete paths in the
presence of routers that employ load balancing; Paris-traceroute controls the probe packet header fields
in a manner that allows all packets towards a destination to follow the same path in the presence of per-
flow load balancing. All M-lab tools collect Paris-traceroute traces for every TCP connection they use.
BISmark is an OpenWRT-based platform similar to SamKnows described in the next section. Unlike
SamKnows Whitebox probes, BISmark devices have a web interface that allows for monitoring
performance in a LAN network, the graphical display of measurement results, QoS configuration, etc.
SideStream - collects statistics about the TCP connections used by the measurement tools running on
the M-Lab platform.
NTD, NPAD, Neubot and SideStream use Linux servers with Web100 extensions for gathering an extended set
of statistical data about TCP connections (RFC 4898).
All data collected by M-Lab tools is intended to be made publicly available under a Creative Commons Zero
license. Measurement results can be accessed as raw data on Google Storage or by sending SQL queries to
BigQuery (Google’s RESTful web service that enables the analysis of massively large datasets in conjunction
with Google storage). Raw data is kept in tar format under the name that includes the testing date, the name of
the M-Lab server, the tool used and a serial number. Google Storage provides two different ways to access the
raw data: the gsutils command line tool and a web based interface.
A user-friendly way of showing M-Lab data is through Google Public Data Explorer which is shown in Figure 4.15.

Support for Performance Management in the GÉANT environment
Deliverable D8.4 (DS4.3.1): End-to-end Management – Catalogue of Business Processes Document Code: GN3PLUS13-589-13
46
Figure 4.15: M‐Lab performance measurement results presented through Google Public Data Explorer
Researchers and organisations wishing to access the part of the server resources can do that after accepting
and fulfilling the conditions defined in [M-Lab2]. Resource allocation policies are designed to avoid contention
between different tools.
4.4.2 SamKnows
SamKnows14 is an active measurement platform for large scale testing of ISP access link characteristics created
by UK software developer Sam Crawford in 2009. Sam Crawford is currently actively involved in the IETF LMAP
(Large Scale Measurement of Broadband Performance) working group.
The SamKnows platform is comprised of more than 300 servers worldwide [SamK1], and more than 40 000
Whitebox probes [SamK2]. Whitebox probes are CPE devices installed at the user end of fixed or mobile
broadband connections. SamKnows developed probes based on TP-Link access routers and an adapted version
of the OpenWRT operating system. The custom firmware is flashed at the factory and is not directly upgradeable
by the user hosting the Whitebox, but the firmware is remotely upgradeable by SamKnows. Probes do not have
a web or other kind of GUI that would allow the users to access the devices. However SamKnows software is
free and open-source under the GPLv2 license. No measurement data is stored on test servers. All results
recorded by the Whiteboxes are transmitted to SamKnows.
SamKnows supports the following set of tests typically oriented toward the end user of the Internet connection:
Web browsing – Measuring time to get the web content from some of the well-known publicly available
sites. Measurement includes DNS resolution time.
Video streaming – Measuring time to get and buffer shared video from the sites like (YouTube, Metacafe).
14 http://www.samknows.com/broadband/index.php
Support for Performance Management in the GÉANT environment
Deliverable D8.4 (DS4.3.1): End-to-end Management – Catalogue of Business Processes Document Code: GN3PLUS13-589-13
47
Voice over IP – Measuring throughput, delay, jitter and packet loss using UDP probes in both directions.
Availability test – this test is started during the startup of the Whitebox and remains active in the
background. Whitebox establishes three long-term TCP connections with SamKnows servers. When a
server stops responding to Whitebox requests, the TCP connection is re-attempted. If all three
connections are not able to be established, Internet connectivity is considered to be down. Traceroute is
then executed in order to find the place of the outage.
UDP latency and packet loss – this test is a UDP ping which measures round-trip time (RTT) and UDP
packet loss between the client and the SamKnows server.
Data usage tests – passive monitoring of the amount of incoming- and outgoing-user traffic during one
hour. SamKnows guarantees that the user’s privacy will not be compromised.
Speed tests – uplink and downlink throughput measurement using HTTP GET and POST Requests.
ICMP latency and packet loss - ICMP ping. The minimum, maximum and standard deviation of successful
results are measured.
ICMP latency under load - ICMP ping executed during speed test;
DNS resolution – the time for ISP’s DNS servers to resolve names of some of popular web sites.
Peer-to-Peer – this test emulates BitTorrent 10MB file transfer. Measured metrics:
○ The average and peak throughput during the transfer.
○ The number of connections established to peers.
○ The total number of pieces transferred.
○ The number of TCP connections that were reset during transfer.
FTP transfer – measuring FTP upload and download throughput.
Email relaying – measures the time that an ISP’s SMTP server needs to send an email to a SamKnows
email server.
All times are measured in milliseconds. Whitebox probes have threshold managers installed which can delay
measurement execution if the user traffic is over certain limit. When a testing cycle has completed, the results
are encrypted and transmitted over SSL to a hosted backend infrastructure for processing and presentation
through a web interface to each SamKnows user and other interested parties. The Whitebox then sends the
results to secure SamKnows reporting servers which then present the results back to the user either via the
SamKnows web reporting site, a smartphone app or a monthly personalised ISP report card. ISPs that sign the
Code of Conduct are given access to anonymised and aggregated performance results on their network so they
can pro-actively deal with any network problems. Figure 4.16 shows a sample set of measurement results
obtained by the SamKnows system.

Support for Performance Management in the GÉANT environment
Deliverable D8.4 (DS4.3.1): End-to-end Management – Catalogue of Business Processes Document Code: GN3PLUS13-589-13
48
Figure 4.16: An example of SamKnows measurement results
SamKnows offers two types of probes: for fixed and mobile broadband connections and these can be ordered
from the official site together with a free application with a subset of tests that can be executed. The placement
of the Whitebox probe for the fixed access connection can be seen in Figure 4.17. The Whitebox probe behaves
like an Ethernet switch and has an antenna used for passive monitoring of the strongest access point in the
surrounding area.

Support for Performance Management in the GÉANT environment
Deliverable D8.4 (DS4.3.1): End-to-end Management – Catalogue of Business Processes Document Code: GN3PLUS13-589-13
49
Figure 4.17: SamKnows Whitebox probe placement
Unlike the Whitebox probe for fixed connections, the mobile probe does not share Internet connectivity with the
end-user, but is used exclusively for testing. The mobile probe is connected to USB SIM adapters, and has GPS
and WiFi triangulation capabilities installed, so the exact location can be sent together with the measurement
results.
Apart from smaller number of tests, the free SamKnows application has lower measurement reliability because
it does not have exclusive access to the network medium, but it shares it with other applications on the end-user
device.
4.4.3 Grenouille
Grenouille15, developed in France, is an active measurement platform for testing broadband access connections
between subscribers and their ISPs. The aim of the platform is similar to that of SamKnows; the difference is that
Grenouille uses a client software application developed under GPL and AGPL licenses and not dedicated
hardware. Grenouille performs the following measurements:
Upload and download speeds using FTP transfers of a file large around 500KB. The system is able to
detect if there is other user traffic that could interfere with the FTP test and to defer the execution of the
test.
Ping to test the response and round trip time.
The client application sends measurement results every 30 minutes to the central servers where these results
are stored and from which they can be seen. Daily data is stored for several weeks, and monthly data for much
longer periods of time. Measurement data is not publicly available, but is password protected for each user.
According to the report from 2011 [Gr1], Grenouille had more than 20 000 users.
15 http://www.grenouille.com/

Support for Performance Management in the GÉANT environment
Deliverable D8.4 (DS4.3.1): End-to-end Management – Catalogue of Business Processes Document Code: GN3PLUS13-589-13
50
4.4.4 RIPE TTM and Atlas
The RIPE NCC began the development of RIPE Atlas 16 in late 2010 with the goal of creating a global
measurement network for monitoring critical operational and performance aspects of the Internet infrastructure.
Atlas is a continuation of the older RIPE Test Traffic Measurement (TTM)17 service which is shortly to be
decommissioned. Both platforms are active end-to-end measurement platforms.
TTM is measuring:
One-way delay.
One-way packet loss.
Round-trip time.
Jitter.
Bandwidth.
Root and TLD DNS server availability.
Participants of the TTM project had to provide rack space for the installation of the TTM test-box servers. Servers
also had GPS antenna and receiver which was used for the time synchronisation necessary for one-way
measurements, as shown in Figure 4.18. TTM boxes could have been used as stratum 1 NTP servers with a
time accuracy of 10ms.
Figure 4.18: RIPE TTM measurement architecture
Users were not able to configure the system. All upgrades and configurations were done remotely by RIPE NCC
administrators through the SSH.
There were three ways in which a TTM box host could access the measurement results:
Follow in real time the network interface of the TTM test-box server.
16 https://atlas.ripe.net/
17 http://www.ripe.net/data‐tools/stats/ttm/test‐traffic‐measurement‐service
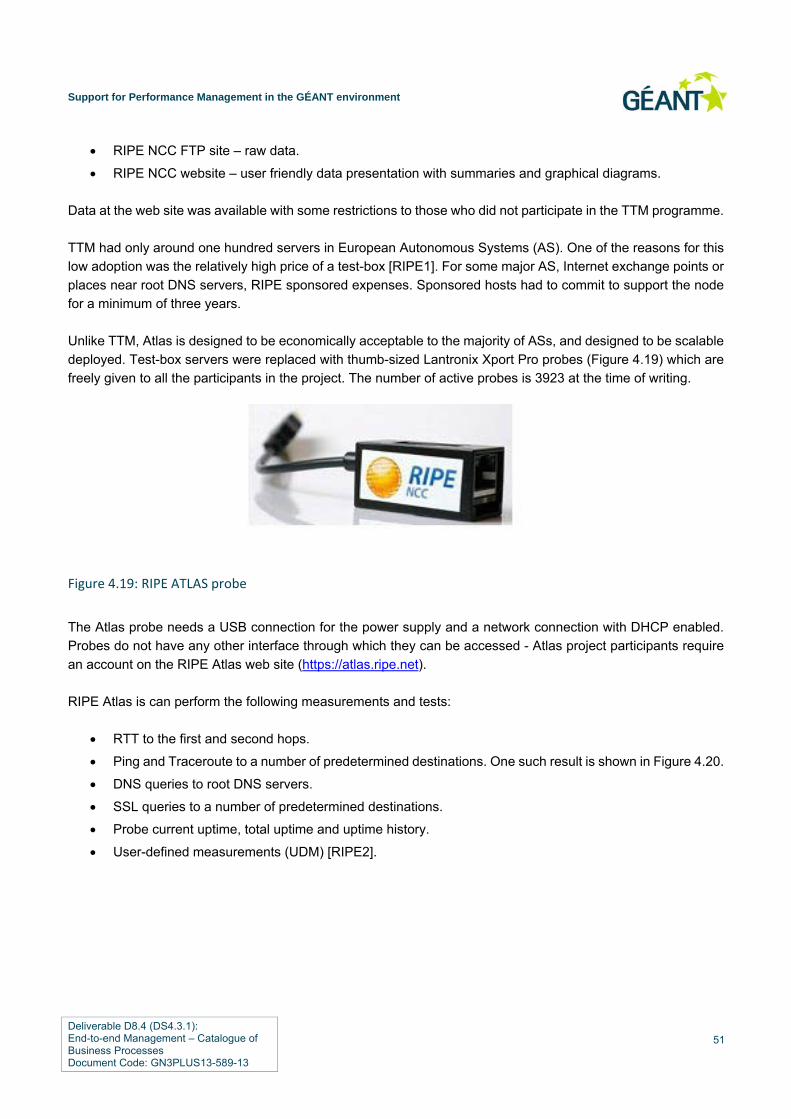
Support for Performance Management in the GÉANT environment
Deliverable D8.4 (DS4.3.1): End-to-end Management – Catalogue of Business Processes Document Code: GN3PLUS13-589-13
51
RIPE NCC FTP site – raw data.
RIPE NCC website – user friendly data presentation with summaries and graphical diagrams.
Data at the web site was available with some restrictions to those who did not participate in the TTM programme.
TTM had only around one hundred servers in European Autonomous Systems (AS). One of the reasons for this
low adoption was the relatively high price of a test-box [RIPE1]. For some major AS, Internet exchange points or
places near root DNS servers, RIPE sponsored expenses. Sponsored hosts had to commit to support the node
for a minimum of three years.
Unlike TTM, Atlas is designed to be economically acceptable to the majority of ASs, and designed to be scalable
deployed. Test-box servers were replaced with thumb-sized Lantronix Xport Pro probes (Figure 4.19) which are
freely given to all the participants in the project. The number of active probes is 3923 at the time of writing.
Figure 4.19: RIPE ATLAS probe
The Atlas probe needs a USB connection for the power supply and a network connection with DHCP enabled.
Probes do not have any other interface through which they can be accessed - Atlas project participants require
an account on the RIPE Atlas web site (https://atlas.ripe.net).
RIPE Atlas is can perform the following measurements and tests:
RTT to the first and second hops.
Ping and Traceroute to a number of predetermined destinations. One such result is shown in Figure 4.20.
DNS queries to root DNS servers.
SSL queries to a number of predetermined destinations.
Probe current uptime, total uptime and uptime history.
User-defined measurements (UDM) [RIPE2].

Support for Performance Management in the GÉANT environment
Deliverable D8.4 (DS4.3.1): End-to-end Management – Catalogue of Business Processes Document Code: GN3PLUS13-589-13
52
Figure 4.20: RIPE ATLAS measurement results
Atlas probe does not have GPS receiver, so one-way measurements are not possible. User-defined
measurements are customised tests the hosts can run against the entire RIPE Atlas network in addition to the
tests performed by default. The Atlas web portal allows the user to set appropriate user-defined measurements
(UDM) parameters:
Measurement type - Ping, Traceroute, DNS resolution, SSLCert or HTTP.
Target – destination IP address or FQDN name. For DNS measurements, the target refers to the resolver
which will be used, not the host the resolver will attempt to resolve.
Origin – a set of probes that will be included in the measurement. Various criteria can be set, such as:
geographic area (West, North-Central, South-central, World-wide, etc.), country, AS, IP prefix or probe
ID.
Time – test start and end time (UTC); start can be defined as "ASAP" (as soon as possible), and the end
as "Never" (host manually ends the test).
Each type of measurement allows the specification of additional settings like packet size for ping, the number of
alternative paths for Paris Traceroute, type of DNS request, etc. The UDM can be defined as private or public:
the portal keeps the history of user defined measurements.
Each user-defined measurement requires resources from the network of involved probes, as well as from the
RIPE Atlas infrastructure itself, so to keep the load of the Atlas system under control, RIPE developed a credit
system [RIPE3] which limits the number of user-defined tests. Credit is increased with every minute the probe is
active, and is decreased when user-defined tests are run. UDM can be run only if there is sufficient credit.
4.4.5 Summary
Table 4.1 summarises the main features of the multi-domain measurement platforms described in previous
sections.

Support for Performance Management in the GÉANT environment
Deliverable D8.4 (DS4.3.1): End-to-end Management – Catalogue of Business Processes Document Code: GN3PLUS13-589-13
53
SamKnows M‐Lab Grenouille RIPE Atlas perfSONAR
GÉANT version
Test ISP access connections
Yes Yes Yes Yes No
Test inter-AS connections
No Yes No Yes Yes
Test mobile connections
Yes Yes No No No
Hardware- or software-based platforms?
Hardware. Whitebox
probes free application with restricted set of
functions
Software. BISmark
requires access router to be purchased
Software Hardware Software
Paid for service?
No No No No No
Pay for hardware?
Yes Yes. Only for BISmark
N/A No N/A
Physical size of hardware
Home access router
Home access router for BISmark
N/A Slightly bigger than a typical
flash drive
N/A
Number of measurement points (31/07/13)
300 servers; 40k Whitebox probes; 3 data
collection server sites.
34 servers in USA, Eurpoe,
Australia, Africa, China and
Japan. Users’ PCs used to
execute measurements.
Over 20k users. 3619 probes worldwide
Less than 20 European NRENs
Available bandwidth measurement?
Yes Yes Yes No Yes
Traffic-shaping detection?
Yes Yes No No No
Network neutrality check?
No Yes No No No
One-way measurement?
No No No No Yes
Ping? Yes Yes Yes Yes Yes

Support for Performance Management in the GÉANT environment
Deliverable D8.4 (DS4.3.1): End-to-end Management – Catalogue of Business Processes Document Code: GN3PLUS13-589-13
54
SamKnows M‐Lab Grenouille RIPE Atlas perfSONAR
GÉANT version
Traceroute? No. Only for the location of the
closest SamKnows
server.
Yes. Paris and reverse
traceroute.
No Yes. Paris
traceroute.
Yes
BitTorrent and other protocols?
Yes Yes No No No
HTTP and FTP tests?
Yes Yes No No No
DNS resolution tests?
Yes No No Yes No
SSL Cert tests? No No No Yes No
Flash video streaming?
Yes Yes No No No
VoIP? Yes No No No No
User-customised measurement?
No Yes No Yes Yes
Table 4.1: Comparison of the main multi‐domain measurement platforms
4.4.6 LMAP
LMAP (Large scale Measurement of Broadband Performance)18 is a new workgroup within the IETF which started
in 2013. It aims to standardise the LMAP measurement system for performance measurements of broadband
access devices such as home and enterprise edge routers, personal computers, mobile devices, set top boxes,
etc. Workgroup gathers participants from network equipment vendors (Cisco, Avaya, Huawei), service providers
(BT, NTT), similar systems already deployed (SamKnows) and research institutions. Since the group has just
started, there are no Request for Comments (RFC) yet.
The goal of the group is to specify an information model, the associated data models, and select/extend one or
more protocols for secure communication:
A Control Protocol, from a Controller to instruct a large number of Measurement Agents on the Internet
what performance metrics to measure, when to measure them, how/when to report the measurement
results to a Collector,
18 http://datatracker.ietf.org/wg/lmap/charter/
Support for Performance Management in the GÉANT environment
Deliverable D8.4 (DS4.3.1): End-to-end Management – Catalogue of Business Processes Document Code: GN3PLUS13-589-13
55
A Report Protocol, for a Measurement Agent to report the results to the Collector.
A key assumption constraining the initial work is that the measurement system is under the control of a single
organisation: however, the use of the system in different domains is not forbidden.
4.5 Trends in Network Performance Management
4.5.1 Trends
Two recent trends in network performance monitoring are becoming important for NREN monitoring and
management practices:
The emergence of network devices (routers, switches) with embedded performance monitoring agents.
The growing importance of performance monitoring of Ethernet services.
Until recently all the perfSONAR measurement services worked at the IP layer and most of these used software-
based agents such as Iperf or HADES MP Perl script. Now perfSONAR functionality could benefit from these
new opportunities.
4.5.1.1 Embedded agents
Currently there are network boxes from different vendors, which have embedded agents for carrying out
performance monitoring at Ethernet, IP and application layers.
The principal difference between software-based performance measurement tools like BWCTL hosts 19 or
hardware-based RIPE TTM probes and embedded agents is that hardware-based probes do not require the
installation of extra servers or devices in a network. Instead, to measure performance parameters between two
points in the network one needs only to configure and activate two embedded performance agents on the
respective routers or switches.
An embedded Ethernet performance agent is a relatively new feature of network devices; its emergence reflects
the transformation of Ethernet into a carrier-grade transport technology, i.e. ‘Carrier Ethernet’. However, many
vendors, for example Cisco, Juniper, Extreme, Alcatel-Lucent and Ciena, already have models of routers and
switches with such embedded agents.
Embedded agents that are capable of measuring and monitoring performance at the IP and upper layers have
the longer history, being available on commercial routers for years.
19 Used for perfSONAR measurements as well
Support for Performance Management in the GÉANT environment
Deliverable D8.4 (DS4.3.1): End-to-end Management – Catalogue of Business Processes Document Code: GN3PLUS13-589-13
56
For example, Cisco IOS has an agent called IP SLA [IPSLA]. The agent supports a wide spectrum of active
performance measurements from UDP-based one-way and two-way delays, jitter and packet loss ones for
measuring DNS, DHCP and HTTP reaction times. Juniper Junos also has an agent with similar functionality
called RPM (Real-Time Performance Monitoring) [RPM]. Both Cisco and Junos agents are proprietary
implementations and they do not support open protocols like OWAMP.
It is not clear why the academic community hasn’t used the functionality of embedded performance monitoring
agents in network devices more widely so far. However, at least one case of such a use is known: in 2004, the
Janet QoS Development Project participants built a performance-monitoring system based on Cisco 1700 IP SLA
agents. The system was used for measuring round-trip delays of IP/UDP traffic over the project lifecycle.
4.5.1.2 Performance monitoring of Ethernet services
It is understandable that the performance monitoring of IP/UDP/TCP and applications traffic has been and still is
the focus of the customer and network administrator’s interest.
However, the performance monitoring of wide-area Ethernet services and connections is becoming more
important because of the growing use of Ethernet (or more precisely – Carrier Ethernet) as the carrier transport
technology.
Wide-area (also referred to as ‘Carrier’, or ‘Metro’) Ethernet services play an important role for the UK and
European academic users. Examples of wide-area Ethernet services are the GÉANT Plus service and the Janet
Lightpath service. Both of these represent point-to-point connections with Ethernet User Network Interface (UNI);
some segments of these connections are also Ethernet (along with SDH or OTN/DWDM ones).
Such services connect organisations which have particular data transfer requirements, e.g. large research
centres like CERN and RAL that transfer vast amounts of data and need bandwidth guarantees and isolation
from other network users. The specific requirements vary between customers but generally consist of one or
more of the usual metrics: bandwidth guarantees, high availability, low latency and low loss. The main point here
is that, whichever customer requirements are necessary, the network service is presented as a wide-area
Ethernet service instead of plain IP connectivity.
In addition to customer-facing services, NRENs also use wide-area Ethernet services themselves to underpin
their other network services such as IP transport. These internal Ethernet services and their particular
implementation, status and performance are only visible to NOC staff.
The problem with wide-area Ethernet connections is that they are mostly unmonitored, which creates a potential
conflict: on the one hand customers of such services expect to have better services than plain IP ones (better in
different aspects: predictability, availability or guaranteed bandwidth). On the other hand, providers of these
services have to rely blindly on a proper design and configuration of their network and its nodes in the absence
of measuring the real performance characteristics of the connections they provide. In fact, in the area of service
verification, we rely on the immaculate provisioning of a service by NOC engineers. In the area of service
monitoring, we mostly delegate this problem to our users (except for monitoring network interfaces of the core
routers) and wait until somebody reports a problem.

Support for Performance Management in the GÉANT environment
Deliverable D8.4 (DS4.3.1): End-to-end Management – Catalogue of Business Processes Document Code: GN3PLUS13-589-13
57
At the same time, Ethernet performance monitoring standards have been developed and ratified and vendors
have implemented them in their equipment20. Hence, the prerequisites of adding Ethernet monitoring to our tools
and systems including perfSONAR are in place, but some effort is still needed to convert them into real
functionality.
4.5.2 Results of the joint GN3 JRA1/JRA2 Ethernet OAM activity
To test the new features which could be used for performance monitoring of Ethernet services the joint GÉANT
3 Year 4 JRA1/JRA2 activity was established. The activity consisted of two sub-activities:
Testing embedded Ethernet OAM functionality of modern network equipment. For this a wide-area multi-
NREN testbed was created.
Developing a perfSONAR extension capable to obtain, store and visualise the Ethernet performance
monitoring data from network equipment.
The results of both sub-activities were mostly positive.
First sub-activity
Cisco, Juniper, Ciena, Brocade, Accedian and Overture equipment was tested for support of Connectivity Fault
Management (CFM) and Y.1731 functions. CFM functions of boxes under test allowed the real-time monitoring
of status for single-segment and multi-segment Ethernet connections. For some connections, robust and
plausible two-way delay and delay variation data were obtained (but not one-way data because of some bugs in
the equipment software).
Second sub-activity
The perfSONAR sub-activity developed the Ethernet OAM Application with Web GUI. The architecture of the
application is shown in Figure 4.21:
20 A brief overview of Ethernet performance monitoring standards is given in Appendix C of this document. It
is an excerpt from the GN3 JRA1 T1/JRA2 T3 report.

Support for Performance Management in the GÉANT environment
Deliverable D8.4 (DS4.3.1): End-to-end Management – Catalogue of Business Processes Document Code: GN3PLUS13-589-13
58
Figure 4.21: perfSONAR extension architecture
The Ethernet OAM Application polls embedded Ethernet CFM agents using Secure Shell (ssh) protocol and
stores data about the status of Ethernet services in the Relational database (RDB). The application is able to poll
three types of devices: Juniper MX80, Brocade MLX-8, and Overture ISG24.
The Web GUI allows users to control the Ethernet OAM Application as well as visualise the Ethernet OAM settings
and measurement data.
In order to use perfSONAR SQL MA service to access historical Ethernet status data in the RDB, several
extensions have been developed: Table 4.2 shows the main ones.
Library/Service Description Extensions
nmwg The library containing the implementation of the perfSONAR protocol elements (OGF NM/MNC).
New metadata describing the OAM configuration and a new metric – the Ethernet CCM status.
perfSONAR_base The library that includes common functionalities of perfSONAR GN3 services.
New query generator for fetching the Ethernet CCM status.
perfSONAR-java-sql-ma
This service is used to publish the monitoring data stored in the relational database.
Fetching the Ethernet CCM status from the relational database.
Table 4.2: perfSONAR extensions needed to access Ethernet measurement data
The developed software and perfSONAR extensions were an attempt to show how embedded Ethernet
performance agents could be used by perfSONAR instead of incorporating new Ethernet metrics and sources of
performance data into perfSONAR itself.
The obvious limitations of the developed software are that:

Support for Performance Management in the GÉANT environment
Deliverable D8.4 (DS4.3.1): End-to-end Management – Catalogue of Business Processes Document Code: GN3PLUS13-589-13
59
It support only one metric (a service status ‘Up/Down’ which is an instant indicator of availability and could
be used for its calculation) of the Ethernet performance metric set described in Y.1563 and MEF
10.2&10.2.1 (i.e. no support of delay/loss metrics)
It doesn’t support service assurance measurements (analogous to Iperf measurements) according to the
Y.1564 recommendation.
It is not fully integrated with perfSONAR services and components: e.g. with the perfSONAR UI,
authentication service.
4.5.3 Incorporation of Embedded Ethernet Performance Agents into perfSONAR
A systematic and full-scale solution might include the following elements:
The full support of the all Ethernet performance metrics, tools and agents
These metrics and tools are described in respective standards (IEEE 802.1ag CFM, ITU-T Y.1731,
Y.1563, Y.1564, MEF 10.2&10.2.1). The positive thing here is that there are standards that describe
Ethernet performance monitoring procedures and metrics in detail, and that all leading vendors follow
these standards and implement them in a similar way, making cross-vendor hardware much easier to
support. Software agents do not have this problem as one can use the same software on different
platforms so such a solution is uniform by design.
Support of Connectivity Fault Management (CFM) agents to monitor Ethernet services status (Up/Down).
Historical sequences of this type of data allows the availability of a service to be calculated, one of the
Ethernet performance metrics described in Y.1563. Support of this Ethernet performance metric means.
○ Ability to manage configuration parameters of CFM MEPs.
○ Ability to start and stop monitoring sessions between CFM MEPs (Maintenance End Points).
○ Including the MEP configuration parameters, and status/availability metrics into a respective database
scheme.
○ Support of topology maps with MEPs.
Support of Y.1731 agents to monitor frame latency (one-way and two-way) and loss metrics of Ethernet
services. The aspects of this support are similar to the CFM support described above.
Support of Y.1564 agents to test the bandwidth limits (CIR, EIR, policing limit) of Ethernet services.
Support of troubleshooting tools of CFM agents: loopback (a ping-like tool) and linktrace (a traceroute-
like tool): this should be similar to how perfSONAR uses ping and traceroute for testing reachability.
The support of different ways of obtaining measurement data from embedded agents
Despite the fact that all vendors follow the same standards and their agents supply the same set of
metrics to a monitoring software system like perfSONAR, the methods of obtaining these data vary from
vendor to vendor. The following methods of obtaining performance data from network devices could be
used:
SNMP MIB poll. This could be an excellent method if standard Management Information Bases (MIBs)
existed for all Ethernet performance monitoring metrics and configuration parameters and all vendors

Support for Performance Management in the GÉANT environment
Deliverable D8.4 (DS4.3.1): End-to-end Management – Catalogue of Business Processes Document Code: GN3PLUS13-589-13
60
implemented them. Unfortunately this is not the case, at present. IEEE 8021 CFM MIB is standard for
CFM but not all major vendors have implemented it: for example, Cisco have but Juniper haven’t. There
is no standard Y.1731 MIB, so all MIBs for latency/loss metrics are proprietary if they exist. However, this
is not a major problem as most Network Management Systems (NMSs) can use a proprietary MIB if its
description is written according to "Structure of Management Information Version 2 (SMIv2)" RFC 2538.
Secure Shell (SSH) access to a device. This is the most powerful method as allows data to be obtained
from any box supporting a Command Line Interpreter (CLI) although CLIs differ between each vendor.
Syslog messages could be used for status monitoring as it is ‘Up/Down’ type of messages and vendors
usually allow logging them. However, latency/loss data are not of that type and hence can’t be taken from
Syslog.
File Transfer Protocol (FTP) or Session Control Protocol (SCP) push. Some vendors support an FTP- or
SCP-push method where a box regularly sends performance data to a specified server using FTP or SCP
protocols.
In the absence of a single method of obtaining performance data from embedded agents, an
implementation might use a set of per-vendor or per-method add-ons similar to the Technology Proxies
approach of Autobahn.
Incorporation into the perfSONAR architecture
A way in which support of embedded Ethernet CFM/Y.1731 agents could be incorporated into
perfSONAR architecture could be similar to adding OWAMPs and HADES modules to the sets of IPPM
and Ethernet latency/loss metrics. The difference is that an embedded agent can’t be wrapped by Multilink
Protocol (MP) software working on the same node as in OWAMP or HADES cases. So, an MP should
work on separate server and access several embedded agents. A distributed architecture of MPs also
could be used for a multi-domain scenario.
Y.1564 agents might be used by perfSONAR in a similar way to the BWCTL MP agents in the existing
perfSONAR modules.
For all types of embedded agents (e.g. for CFM, Y.1731, and Y.1564) either extensions for the existing
perfSONAR modules should be developed or new modules have to be written. Extension might be
developed for:
perfSONAR UI to provide a single point of management and visualisation of all perfSONAR functions.
SQL MA for storing configuration parameters of MEPs and historical performance data.
Authentication service (e.g. eduGAIN).
Topology service, probably using the GN3 cNIS service for the intra-domain topology. (The GN3 inter-
domain topology service does not exist as a separate service but an Autobahn implementation of it could
be used for developing one).

Support for Performance Management in the GÉANT environment
Deliverable D8.4 (DS4.3.1): End-to-end Management – Catalogue of Business Processes Document Code: GN3PLUS13-589-13
61
4.6 Conclusions of the perfSONAR Analysis
Previous high-level analysis of the current GÉANT version of perfSONAR (perfSONAR MDM) reveals the
following main perfSONAR properties:
perfSONAR is a service-agnostic multi-domain performance monitoring platform. It monitors and
measures general network parameters like latency, jitter, round-trip-time, network path topologies, and is
unaware of the specific properties of the multi-domain services (e.g. BoD reservations, VPN circuits, SLA
parameters, warning thresholds and so on). There is no correlation between network performance and
service parameters in perfSONAR. However, with the proper placement of the Measurement Points,
current version of perfSONAR can be used as a service performance monitoring platform that assists
human operators in detecting specific service performance issues. It is also possible to integrate
perfSONAR components and the tools supporting specific network services which would allow these tools
to gather performance data and to react to specific changes in performance parameters. Such attempts
have so far been experimental.
The set of business processes that perfSONAR supports matches the best RPM layer 2 business process.
Similarly the Resource Test Management (in the Resource Management Domain) set of TAM
functionalities is the closest match to the set of perfSONAR functionalities.
Due to its service-agnostic nature it can be said that currently perfSONAR partially supports the SQM
business process only for the simplest network services such as IP connectivity.
perfSONAR is not the only multi-domain network performance monitoring platform that exists and is being
developed nowadays. Other platforms have either a similar goal as perfSONAR (M-Lab, ATLAS) or are
targeting the performance measurement of access broadband links (SamKnows, Grenouille). The latter
is the subject of the standardisation work in the IETF LMAP working group established recently. Due to
its larger footprint and complex and lengthy installation, the current version of perfSONAR is not dedicated
for access link performance measurements.
perfSONAR is capable of supporting a similar set of performance measurements to other tools. Adding
additional measurements should not be problem, as even the present measurements are performed by
the third party tools (bwctl21).
perfSONAR is not a plug-and play platform like ATLAS, SamKnows or Grenouille
perfSONAR has a smaller number of measurement points than similar platforms (M-Lab, ATLAS) with a
smaller geographic range covered (only European NRENs create perfSONAR MDM performance
monitoring area). Platforms like Grenouille and SamKnows have a significantly higher number of
measurement points.
perfSONAR has a larger footprint than similar monitoring platforms and does not allow for performance
checks by individual users. Unlike, for example, M-Lab, there are no client applications or web access
that would allow performance checks between a user machine and a measurement point.
There are other measurement methods that could be executed by network elements which could be used
as a source of performance data (e.g. network elements monitoring specific service parameters and
21 http://www.internet2.edu/performance/bwctl/

Support for Performance Management in the GÉANT environment
Deliverable D8.4 (DS4.3.1): End-to-end Management – Catalogue of Business Processes Document Code: GN3PLUS13-589-13
62
exporting them to the MPs). Such measurements are currently not supported by other multi-domain
measurement platforms.

Deliverable D8.4 (DS4.3.1): End-to-end Management – Catalogue of Business Processes Document Code: GN3PLUS13-589-13
63
Conclusions
This document presents process flows of one of the typical multi-domain services and analyses in depth
functionalities of perfSONAR tool developed within our community. Based on these analyses, the SA4 T3 task
concluded the following:
Inter-domain service interaction is a crucial business process for successful operations of any multi-
domain service. It appears in various phases of the service operations: capability exchange, request
exchange, problem and performance reports exchange, problem correlation and resolution information
exchanges, and so on. Automation, efficient execution and organisation of these processes is extremely
important since without it, operations teams in different domains have to communicate using emails or
phone calls. Such communication is typically difficult to track and manage and prone to inefficient
processing.
perfSONAR analysis revealed that perfSONAR-MDM is lagging behind the other multi-domain monitoring
platforms in terms of the number of measurement points and their placement, footprint size ease-of-
installation and user experience. On the other side, perfSONAR as a support to multi-domain services is
incomplete and does not support entirely Service Quality Management business processes; it requires
manual interventions in order to correlate measured data with the service-related information. Various
ideas and initiatives about the use of perfSONAR that exist in the GÉANT community (multi-domain
monitoring platform vs. performance support for multi-domain tools) create a challenging environment for
the perfSONAR team to focus on. The future direction of perfSONAR development should be established
as soon as possible to avoid abandoning further development. There is a high risk that perfSONAR as it
is now will soon become an obsolete and unattractive platform.
The other half of the Assurance vertical business process grouping – Problem Management – is not
supported by any of the existing GÉANT tools. This business process grouping was not analysed in detail
in previous GÉANT community projects using the principles of Network Management Architecture. Multi-
domain root cause analysis and multi-domain troubleshooting could be a challenging and time-consuming
task as the necessary information (errors, events, warnings produced by active devices) are in most
cases stored in separate information silos. Even inside a single entity (NREN) it is rare to have a unified
intelligent event/error handling facility. In the case of multi-domain services like MDVPN the investigation
of the feasibility of using multi-domain root cause analysis and multi-domain troubleshooting supporting
tools should be considered. Analysing this process grouping will make the analysis of main service
operations process groupings complete (as with the GN3 project’s analysis of AutoBAHN, cNIS and
iSHARE tools).

Conclusions
Deliverable D8.4 (DS4.3.1): End-to-end Management – Catalogue of Business Processes Document Code: GN3PLUS13-589-13
64
As explained in the Introduction in the second phase of the work, SA4 T3 will analyse three different process
groupings:
Performance Management process subgroup
Problem Management process subgroup
Multi-domain Service Interaction
According to the Business Process Framework, the Performance Management process subgroup includes, but
is not limited to, Service Quality Management and Resource Performance Management; the Problem
Management process subgroup includes Service Problem Management and Resource Trouble Management.
Multi-domain Service Interaction falls in the Service Management and Operations, according to the Business
process decomposition for NREN-to-NREN interaction [GN3 DJ2.1.1] shown in Figure 2.1. All of those selected
processes and process subgroups are in the domain of Operations, which is the primary concern of the Network
Support Services - SA4 - Activity. In addition, all the GÉANT3plus products described in this document belong in
the same area, thus representing the potential field of interest for the future work of SA4 T3, including milestones
and deliverables. With the selection of the three processes that will be the basis for the future work of SA4 T3,
the team has also achieved the first Milestone - MS4.3.1. the "Definition of business processes and selection of
three business processes for modelling".

Deliverable D8.4 (DS4.3.1): End-to-end Management – Catalogue of Business Processes Document Code: GN3PLUS13-589-13
65
Appendix A TM Forum eTOM and TAM Specifications
A.1 TMF Business Framework (eTOM)
The enhanced Telecommunication Operation Map (eTOM) initiated by TM Forum intends to deliver a business
process model and framework for service providers in telecommunication as well as IT service providers. It is
included in the TM Forum’s Frameworx architecture which as is described in Section 1 appears to be the
industry’s most comprehensive integrated business architecture.
Figure A.1: Frameworx Components [tmforum.org]
Figure A.1 shows the components included in the Frameworx architecture, in which the business process
framework (eTOM), the information framework (SID) and the application framework (TAM) is brought together by
the integration framework (TNA). Whereas each framework describes a particular perspective of enterprise
management, in this section the focus is given to the business process framework – eTOM.
As defined by the TM Forum, the business process framework or eTOM predefines a decomposition hierarchy
of the tasks that an enterprise needs to consider. A TM Forum document [eTOM-C&P] describes it as: “… a
reference framework for categorizing all the business activities used by an enterprise involved in delivering on-
line information, communications and entertainment services. This is done through definition of each area of

TM Forum eTOM and TAM Specifications
Deliverable D8.4 (DS4.3.1): End-to-end Management – Catalogue of Business Processes Document Code: GN3PLUS13-589-13
66
business activity, in the form of process components or process elements that can be decomposed to expose
progressive details.”
Figure A.2: eTOM Level 1 View
Business processes are organised in different detail levels in eTOM, which forms a hierarchical structure. The
level 0 view defines three process areas: Strategy, Infrastructure & Product (SIP), Operations and Enterprise
management. In level 1 view are illustrated in Figure A.2, more detailed vertical and horizontal process groupings
are added. Vertical groupings are end-to-end processes that are required to support customers and to manage
the business, whereas horizontal process grouping documents functional processes across an organisation.
Each higher level process can be decomposed into lower level processes, with which business processes are
refined into a more detailed view.
eTOM records the decomposition hierarchy, with which progressive details of the processes and elements are
revealed. Note that the purpose of eTOM is more of reference nature than a set of mandatory rules, which means
enterprises are not required to completely adopt business processes as defined in eTOM, rather they can select
processes which are suitable to the current structures and characteristics of their businesses. Due to this flexibility,
eTOM is also frequently applied by enterprises to map and analyse their current business processes according
to eTOM. This is also the focus of this section.

TM Forum eTOM and TAM Specifications
Deliverable D8.4 (DS4.3.1): End-to-end Management – Catalogue of Business Processes Document Code: GN3PLUS13-589-13
67
A.2 TMF Application Framework (TAM)
TAM (The Application Framework) is intended to be an industry set of standard application requirements to
support a more modular approach in application development.[TAM] It has been designed for both operator and
suppliers communities worldwide to have a common frame of reference in describing their current and future
needs and intentions. TAM can be applied on the entire communication software value chain, as shown in Figure
A.3.
Figure A.3: Communication software value chain [TAM]
As part of the TM Forum's Frameworx program, the Application Framework is built on the common process and
information models (Business Process Framework and Information Framework). Level 1 Application Framework
categories are shown in Figure A.4. The Application Framework categories are organised vertically using
Business Process Framework level 1 areas and horizontally aligned with the layering Information Framework
domains.

TM Forum eTOM and TAM Specifications
Deliverable D8.4 (DS4.3.1): End-to-end Management – Catalogue of Business Processes Document Code: GN3PLUS13-589-13
68
Figure A.4: The Application Framework
Deliverable D8.4 (DS4.3.1): End-to-end Management – Catalogue of Business Processes Document Code: GN3PLUS13-589-13
69
Appendix B GEMBus and TMF TIP Interfaces
B.1 Introduction
This sub-activity is a continuation of the work of GN3 JRA2 T1. In GN3, cNIS and AutoBAHN were integrated
using the TIP RAM notification schema for topology changes. The last step was to evaluate the possibilities of
introducing the Enterprise Service Bus (ESB) into that scenario. Modern network management principles,
summarised in [NGOSS TNA] assume the use of a common communication vehicle (ESB) for the OSS
component integration in complex OSS architectures. In this activity ESB acts as a Notification Service.
The objectives of the activities covered in this document are to build knowledge, experience and know-
how on a standardised interface implementation in real-life applications. cNIS and AutoBAHN, as the
supporting tools for the delivery of the m-domain Bandwidth on Demand service, have been chosen as
the target application suite. The work explained in this Appendix is based on the existing TIP RAM
notification schema for topology changes in cNIS and AutoBAHN, with the aim of evaluating the
introduction of ESB into that scenario. The opportunities of using ESB were determined by the SWOT
analyse for GEMBus [ESB-SWOT]. GEMBus is a GÉANT ESB implementation combining and leveraging
both SOA and ESB features.
The scope of the work within the sub-activity included the following activities:
Designing the TIP-RAM notification service with the use of GEMBus following the WS-Notification
specification. The existing TIP RAM notification interface which was built upon the OASIS WS Notification
specification will be used.
Building and configuring the testbed.
Implementing the service and deploying it for evaluation purposes.
B.2 TM Forum Standardised Interfaces
As for other types of TM Forum interface, work is being done within the TM Forum to bring together the previous
work done on OSSJ/FM [FaultMgmtAPI] and MTOSI RTM [MTOSI-rtmba] and to some extent the 3GPP Alarm
IRP. The aim is to harmonise the achievements and benefits of these previous efforts and align them under a
single alarm management interface, which should provide a simple solution for use in simple alarm reporting
scenarios but also have the flexibility to accommodate more complex scenarios.

GEMBus and TMF TIP Interfaces
Deliverable D8.4 (DS4.3.1): End-to-end Management – Catalogue of Business Processes Document Code: GN3PLUS13-589-13
70
This work is being done under the auspices of the TM Forum Interface Program (TIP) team. Part of their work is
focused on the development of interfaces for resource and service assurance. This group has focused on
Resource Alarm Management as it is a key interface where such alignment is needed, and such a harmonised
solution is high on the wish-list of Service Providers. From [MTOSI-rmidba]: “The long term plan (which is already
well under progress) is to migrate the various input work to a single harmonized suite of interfaces.”
The actual list of the TIP interface families is given here:
Service Problem Management:
○ Service Problem Management
Inventory:
○ Basic Resource Inventory
○ Generic Query
Security:
○ Enterprise Identity Management – Operator User Management
○ Enterprise Identity Management – Single Sign On
○ Security Compliance Audit
Fault Management:
○ Resource Alarm Management
○ Service Problem Management
○ Maintenance, Protection and Alarm Control
Policy Management:
○ Policy Information Exchange
Performance Management
Expedited Interfaces
These standardised interfaces, processes and application demarcation points contain in-depth knowledge in a
given domain, although the SOA-specific implementation of the TM Forum interfaces is an open question. One
can implement it as a so called “spaghetti integration” without using any integration facility/platform. From the
Total Cost of Ownership (TCO) point-of-view, this is the simplest and cheapest route in the short term, but in the
long term the TCO of this approach could become higher compared to an open standard SOA implementation
using ESB or API management facilities. The following is an overview of the “pros and cons” of using an ESB as
a platform for a Service Oriented Architecture.
B.3 ESB as a Platform for SOA
The Enterprise Service Bus (ESB) is an abstraction layer on top of an Enterprise Messaging System. This section
presents the ESB capabilities as a platform for SOA and it outlines the motivation and rationale for using ESB for
cNIS and AutoBAHN integration.

GEMBus and TMF TIP Interfaces
Deliverable D8.4 (DS4.3.1): End-to-end Management – Catalogue of Business Processes Document Code: GN3PLUS13-589-13
71
ESB is meant to deliver reliable communication between a producer and consumer according to the given rules
and ensuring message integrity. From the application perspective, ESB can be seen as a synchronous or
asynchronous system for messages exchange, which enables secure communication between applications with
the use of XML, Web Services or any other supported protocol.
GEMBus (GÉANT Multi domain Bus) is the federated multi-domain service-oriented infrastructure developed in
the GN3 project [GEMBus]. It is founded on a Composable Service Architecture (CSA), based on a general
framework for composite services, and on the industry adopted Enterprise Service Bus (ESB), extended to
support dynamically reconfigurable virtualised services.
B.3.1 Background
ESB is a flexible software architecture construct based on service orientation, the many capabilities of which
include provisions for [IBM10]:
Communications.
Service interactions.
Integration.
Quality of services.
Security.
Service level.
Message processing.
Management and autonomic services.
Modelling.
Infrastructure intelligence.

GEMBus and TMF TIP Interfaces
Deliverable D8.4 (DS4.3.1): End-to-end Management – Catalogue of Business Processes Document Code: GN3PLUS13-589-13
72
Figure B.1: Enterprise Service Bus (reference architecture)
Service Oriented Architecture (SOA) is characterised by its properties of loose coupling, reusability,
discoverability and interoperability. The principles of service-orientation have been outlined as [Fan2010]:
Loose coupling - the underlying logic of a service can be changed with little or no impact on the other
services within the same system.
Contract - documents describing how a service can be programmatically accessed.
Abstraction - services expose only the logic defined in the service contract and hide implementation from
the end user.
Autonomy - services have to control only the logic and functionality, which they encapsulate.
Reusability - services can be reused more than once and from multiple clients.
Composition - services can be grouped in composite service, which coordinate the data exchange
between composite services.
Statelessness - services cannot save the state of activity.
Interoperability - services are platform- and implementation-independent.
Discoverability - services are discoverable; there has to be a standard mechanism, which allow services
to be discovered.

GEMBus and TMF TIP Interfaces
Deliverable D8.4 (DS4.3.1): End-to-end Management – Catalogue of Business Processes Document Code: GN3PLUS13-589-13
73
B.3.2 Focus
The SWOT chart for ESB [ESB-SWOT] provides the detailed analysis for using this architectural solution in the
GÉANT application area. The identified opportunities of ESB are the following:
Creation of global application collaborations ('global' in the sense that its participating applications could
potentially be anywhere on the Net, running on any platform). It means bringing the GÉANT app
ecosystem closer with other Future Internet initiatives, environments and applications.
Reliable messaging layer for BoD and other network tools. By introducing ESB and replacing the point-
to-point integration with a common messaging layer we would potentially enhance the interoperability
between BoD systems (AutoBAHN, OSCARS, OpenNSI, OpenDrac) and other GÉANT applications. We
might also enhance the reliability of the transport layer to avoid information loss.
The SOA architecture is also recommended by standard network management bodies. ITU-T and ETSI
recommend that OSS systems should be built according to the Organisation for the Advancement of Structured
Information Standards (OASIS) SOA principles, laid out in their OSS design specification documents. TM Forum’s
NGOSS [NGOSS TNA] extended the SOA architecture for their purpose and named it Distributed Interface
Oriented Architecture (DIOA) [DJ2-1-1]
The architectural concepts within NGOSS provide guidelines for designing and building the OSS according to
the list of requirements detailed in the previous section. The concepts are mainly related to SOA software design
practices. An NGOSS system is characterised by the existence of a communications service (e.g., a
“communications bus”) [NGOSS TNA] or some other form of common communication, which is used by all
software entities to communicate with each other. Each communications service offers one or more different
transport mechanisms. There may be more than one such communications service within a given system
implementation, and these services may represent different technology-specific mappings
.
B.4 Autobahn TIP RAM-based cNIS Integration without ESB
This section outlines the TIP RAM based integration for cNIS and AutoBAHN. The results of this work have been
inherited from the previous project, GN3, which was a joint effort of SA2 T5 and JRA2 T1.
An example TIP RAM based integration was focused within the "Alarm Service" effort for BoD tools – cNIS and
AutoBAHN. Attention was placed on producing something that was useful in the GÉANT BoD service area (i.e.
topology update notification) and “in line with” relevant standards (i.e. TIM RAM). The outcome of the GN3 project
has now been expanded towards Resource Alarm Management and further beneficial standardisations.

GEMBus and TMF TIP Interfaces
Deliverable D8.4 (DS4.3.1): End-to-end Management – Catalogue of Business Processes Document Code: GN3PLUS13-589-13
74
B.4.1 Context
The TM Forum Interface Programme’s Resource Alarm Management Business Agreement [TIP‐RAM]
documents the business problem description, supported scenarios, requirements and use‐cases for the
management of alarms. Three Alarm Profiles are defined:
Simple Alarm Reporting Profile.
Standard Alarm Profile.
Enhanced Alarm Profile.
The Simple Alarm Reporting was chosen to be the reference for the implementation.
The SimpleAlarmReportingProfile includes the following notifications:
NewAlarm, mandatory.
ClearedAlarm, mandatory.
ChangedAlarm, optional.
HeartbeatNotification, optional.
The first three notifications (NewAlarm, ClearedAlarm, ChangedAlarm) are applied on the ResourceAlarm
object. Their actual TIP implementations will contain a sourceTime and an objectType and Id, referring to the
ResourceAlarm.
The SimpleAlarmReportingProfile includes only one operation: getResourceAlarms
B.4.2 Focus
The focus of the Resource Alarm Management interface implementation was narrowed for a simple small subset
of the Information Framework as applied to RAM for cNIS and AutoBAHN. The Information Framework provides
a couple of entities of interest here: a Resource and a Resource Alarm
This translated into the requirement: for AutoBAHN to be made aware by means of a notification via a standards-
based TM Forum notification interface of an event on cNIS (phase 1). An “event” in this context is the occurrence
of a “Relevant Topology Update”. Furthermore, we defined the cNIS’s Relevant Topology Update Monitor to
determine a “Resource”. The Resource creates a new alarm, a “Resource Alarm”, to indicate that a relevant
topology update has occurred
For the purposes of the next phase of this implementation (i.e. Phase 2), this was translated into the requirement:
for AutoBAHN to be made aware by means of an object creation event via a standard TM Forum RAM interface
of a new Resource Alarm on cNIS.
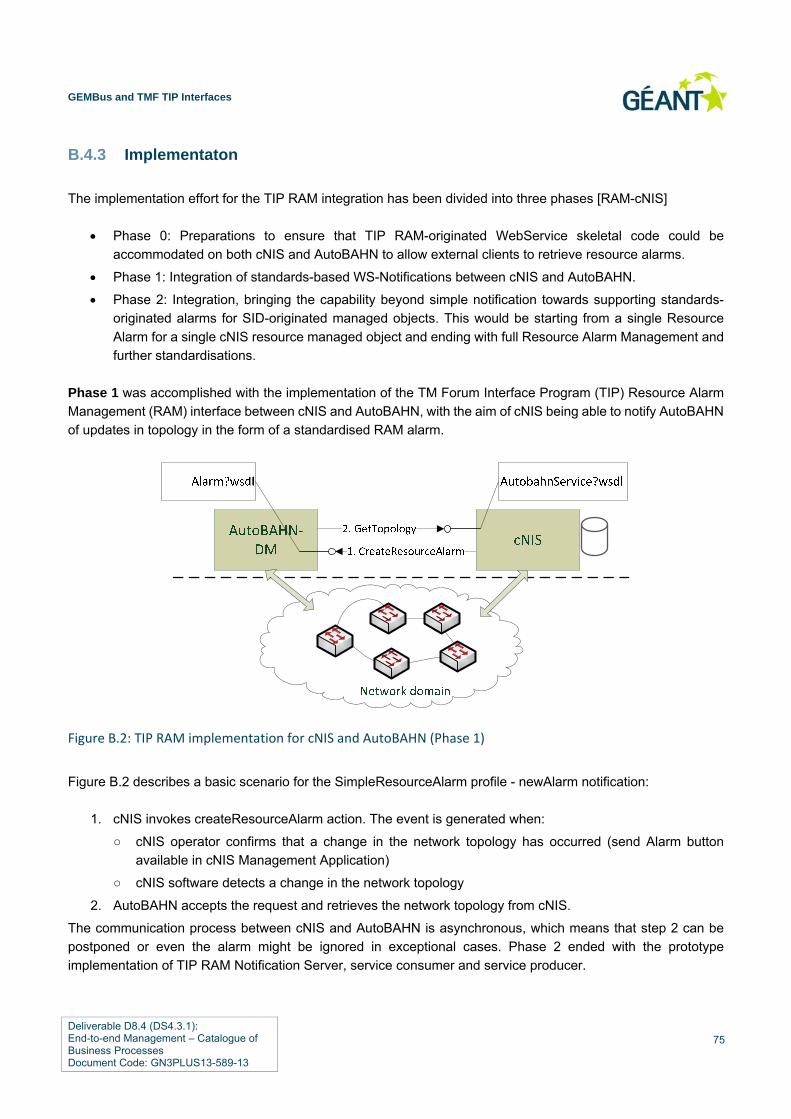
GEMBus and TMF TIP Interfaces
Deliverable D8.4 (DS4.3.1): End-to-end Management – Catalogue of Business Processes Document Code: GN3PLUS13-589-13
75
B.4.3 Implementaton
The implementation effort for the TIP RAM integration has been divided into three phases [RAM-cNIS]
Phase 0: Preparations to ensure that TIP RAM-originated WebService skeletal code could be
accommodated on both cNIS and AutoBAHN to allow external clients to retrieve resource alarms.
Phase 1: Integration of standards-based WS-Notifications between cNIS and AutoBAHN.
Phase 2: Integration, bringing the capability beyond simple notification towards supporting standards-
originated alarms for SID-originated managed objects. This would be starting from a single Resource
Alarm for a single cNIS resource managed object and ending with full Resource Alarm Management and
further standardisations.
Phase 1 was accomplished with the implementation of the TM Forum Interface Program (TIP) Resource Alarm
Management (RAM) interface between cNIS and AutoBAHN, with the aim of cNIS being able to notify AutoBAHN
of updates in topology in the form of a standardised RAM alarm.
Figure B.2: TIP RAM implementation for cNIS and AutoBAHN (Phase 1)
Figure B.2 describes a basic scenario for the SimpleResourceAlarm profile - newAlarm notification:
1. cNIS invokes createResourceAlarm action. The event is generated when:
○ cNIS operator confirms that a change in the network topology has occurred (send Alarm button
available in cNIS Management Application)
○ cNIS software detects a change in the network topology
2. AutoBAHN accepts the request and retrieves the network topology from cNIS.
The communication process between cNIS and AutoBAHN is asynchronous, which means that step 2 can be
postponed or even the alarm might be ignored in exceptional cases. Phase 2 ended with the prototype
implementation of TIP RAM Notification Server, service consumer and service producer.

GEMBus and TMF TIP Interfaces
Deliverable D8.4 (DS4.3.1): End-to-end Management – Catalogue of Business Processes Document Code: GN3PLUS13-589-13
76
B.5 Autobahn TIP RAM-based cNIS Integration with ESB
This section describes the results of the Proof of Concept (PoC) project conducted in order to validate the
effectiveness and the availability of the GEMBus-based SOA oriented example integration of BOD tools. Based
on the results of the second phase, where the web-service-based integration was demonstrated, a plan was
elaborated for ESB-based integration.
B.5.1 Setup
Figure B.3: Pure WS based vs. ESB based SOA implementation
Figure B.3 shows a comparison of the pure WS and the ESB based integration. The two application are in a
same virtual machine which runs an Ubuntu server operating system. The cNIS Management Application (CMA)
can send an alarm to AutoBAHN-IDM (Inter Domain Management), that the current topology changed. And in
that case the AutoBAHN can call the getTopology web service to get the actual topology from cNIS.
B.5.2 Role of the ESB, role of the proxy modules
In order to be able to use an ESB proxy, modules are needed. Figure B.4: shows the location and role of these
proxy modules.

GEMBus and TMF TIP Interfaces
Deliverable D8.4 (DS4.3.1): End-to-end Management – Catalogue of Business Processes Document Code: GN3PLUS13-589-13
77
Figure B.4: Alarm service call sequence
If the cNIS CMA gets a Send Alarm request, it will call the AutoBAHN's Alarm web service. First the call goes to
the consumer proxy, where inbound interceptors (in the ESB runtime) are called, for logging the incoming
message. There are three interceptor (both have also outbound type):
SAAJInterceptor – an interceptor for using the Soap with Attached API for Java.
AccountingInInterceptor – an interceptor for GEMBus Accounting.
LoggingInInterceptor – an Apache ServiceMix logger Interceptor.
The consumer passes the message to the provider and the provider calls the real web service. The response
goes to the provider, which passes the response to the consumer. The consumer sends the reply back to cNIS.
The AutoBAHN web service works in the same way:
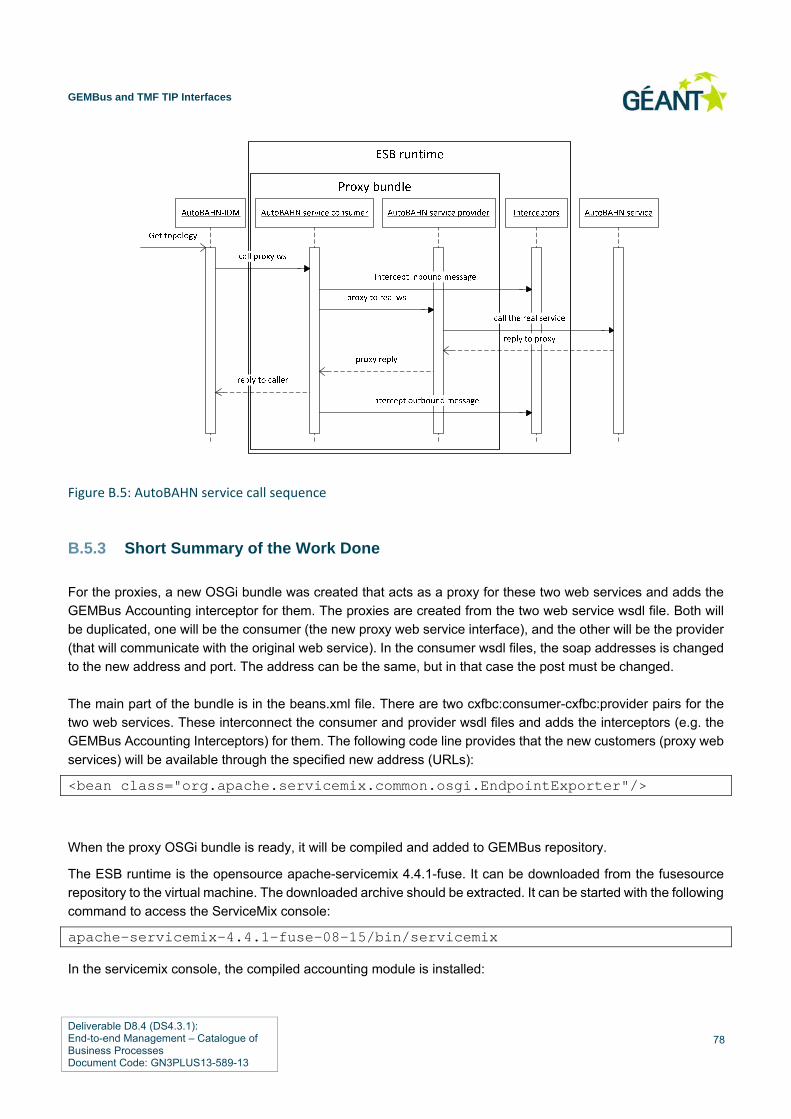
GEMBus and TMF TIP Interfaces
Deliverable D8.4 (DS4.3.1): End-to-end Management – Catalogue of Business Processes Document Code: GN3PLUS13-589-13
78
Figure B.5: AutoBAHN service call sequence
B.5.3 Short Summary of the Work Done
For the proxies, a new OSGi bundle was created that acts as a proxy for these two web services and adds the
GEMBus Accounting interceptor for them. The proxies are created from the two web service wsdl file. Both will
be duplicated, one will be the consumer (the new proxy web service interface), and the other will be the provider
(that will communicate with the original web service). In the consumer wsdl files, the soap addresses is changed
to the new address and port. The address can be the same, but in that case the post must be changed.
The main part of the bundle is in the beans.xml file. There are two cxfbc:consumer-cxfbc:provider pairs for the
two web services. These interconnect the consumer and provider wsdl files and adds the interceptors (e.g. the
GEMBus Accounting Interceptors) for them. The following code line provides that the new customers (proxy web
services) will be available through the specified new address (URLs):
<bean class="org.apache.servicemix.common.osgi.EndpointExporter"/>
When the proxy OSGi bundle is ready, it will be compiled and added to GEMBus repository.
The ESB runtime is the opensource apache-servicemix 4.4.1-fuse. It can be downloaded from the fusesource
repository to the virtual machine. The downloaded archive should be extracted. It can be started with the following
command to access the ServiceMix console:
apache-servicemix-4.4.1-fuse-08-15/bin/servicemix
In the servicemix console, the compiled accounting module is installed:

GEMBus and TMF TIP Interfaces
Deliverable D8.4 (DS4.3.1): End-to-end Management – Catalogue of Business Processes Document Code: GN3PLUS13-589-13
79
osgi:install file:/home/GEMBus/GEMBus/accounting/target/accounting-0.0.1-SNAPSHOT.jar
The added GEMBus Accounting module logs all inbound and outbound web service calls and made available in
the following URL:
http://<machine_ip_address_or_dns_name>:8283/AccountingService?wsdl
For installing bundles from OSGi Bundle Repository such as the GEMBus Repository, we should install it first
also from ServiceMix console:
features:install obr
The URL of the repository where the bundles are available (it can be also a file path of repository.xml) is then
added:
obr:addurl file:/home/GEMBus/GEMBus/repository/repository.xml
Now the proxy bundle can be installed:
obr:deploy GEMBus-proxy
After a successful deployment it can be started:
start <bundle_id>
Now the proxies are available in the setted addresses. The ServiceMix should be stopped, and started in server
mode. In server mode it won't stop after ssh session is over or if ServiceMix console is closed. Running the
ServiceMix in server mode:
apache-servicemix-4.4.1-fuse-08-15/bin/start server &
B.6 Conclusions
This section summarises the work on standardised interfaces and confirms that the use of standardised interfaces
takes only small additional effort and that it enables the integration of the TM Forum conformant OSS solutions.
We have also seen two approaches for integration, both using standardised interfaces:
The so called “spaghetti integration” where the implementation of the SOA is done in a point-to-point way.
Here the monitoring, security, management could be very painful if the system grows from two integrated
systems to ten or more (if we consider the full mesh and the point-to-point monitoring/debugging) The
maintenance of a value chain implemented in a P2P way could be very resource intensive task.
The ESB based integration paradigm was also benchmarked. In a simple situation where there is no
need for message transformation or unification, the development process was found to be no longer
compared to the point-to-point integration. In a real world case when there is a mismatch between two
WS endpoints, more resources would be needed in order to elaborate the normalised messages and the
WS transformation endpoints (although the same work must be done in the case of simple point-to-point
integration too).

GEMBus and TMF TIP Interfaces
Deliverable D8.4 (DS4.3.1): End-to-end Management – Catalogue of Business Processes Document Code: GN3PLUS13-589-13
80
Using an API monitor solution as a framework for the SOA could be also on option. The API management
approach simplifies the publishing, promotion and overseeing of application programming interfaces (APIs) in a
secure and scalable environment. The growing interest in API management can be observed recently as it is
seen as the missing link for SOA success. In addition, API management makes sense running in a cloud, as
opposed to on-site in the operator's data center. On the contrary, ESB cannot be easily moved to the cloud.
There are some examples of ESB deployed in the cloud (typically known as Cloud Service Bus, Cloud Hub or
Enterprise Service Cloud) however the debate whether ESBs can be a legit part of clouds is still opened.
The API monitor solutions are also popular in the field of network management. For example, Alcatel-Lucent has
introduced an open source and cloud-based API management platform called apiGrove.
Using the ESB or API management solution offers the following benefits:
Connections between different applications can be automated and controlled.
Version control for integration.
Traffic monitoring, anomalies checked, etc.
A performance boost with different caching solutions
A wide range of AAA capabilities
Moving the communication to ESB runtime makes the whole system an enterprise grade system, with
communication potentially supervised centrally. All incoming and outgoing web service calls are logged, with the
log available through web services for third-party systems. The ESB also ensures remote management, so the
proxy bundle can be stopped/started/restarted if is necessary. In the GEMBus Repository multiple proxy bundles
can be stored with multiple web service addresses, so they can be changed immediately. If one AutoBAHN-IDM
fails, the system can be restored by changing the proxy, making maintenances easier too. There are also several
features of Apache ServiceMix that make the manageability easier for administrators and more transparent for
leaders.
The TIP RAM implementation described in this document applies not only for BoD tools – it can be seen as
standard even for alarm notification mechanisms to convey a signal from one system to another. The
standardised approach can be also applied to the multi-domain interaction.

Deliverable D8.4 (DS4.3.1): End-to-end Management – Catalogue of Business Processes Document Code: GN3PLUS13-589-13
81
Appendix C Standards of Ethernet Performance Monitoring
C.1.1 Standards of Ethernet Performance Monitoring
Ethernet Operation, Administration and Maintenance (OAM) functionality includes those capabilities that allow a
service provider to create, monitor and troubleshoot Ethernet links and services in a standardised fashion. It
helps service providers offer end-to-end service assurance across the IP/MPLS core, the Ethernet Metro, and to
the customer premises. Ethernet OAM standards can be divided into three groups, which correspond to three
stages of network maintenance:
Service Assurance.
Service Monitoring.
Service Troubleshooting.
The standards in each group are described below.
C.1.2 Service Definitions Standards
Service Definitions Standards describe:
A service type, e.g. point-to-point or point-to-multipoint.
A service bandwidth profile, which includes such parameters as Committed Information Rate (CIR) and
Excess Information Rate (EIR) for several classes of service.
Service performance parameters such as availability, frame delay (one- and two-way), jitter, and loss.
Service Definitions standards are of great importance as their absence can easily lead to confusion: for example,
CIR might be measured for User Datagram Protocol (UDP) payload rate or for Ethernet frame rate and the results
will be very different for the same service.
There are three major standards in this area – MEF 10.2 [MEF 10.2] and MEF 10.2.1 [MEF 10.2.1] from the
Metro Ethernet Forum (MEF) and G.8011 and Y.1563 [ITU-T G.8011] from the ITU-T. All these give precise

Standards of Ethernet Performance Monitoring
Deliverable D8.4 (DS4.3.1): End-to-end Management – Catalogue of Business Processes Document Code: GN3PLUS13-589-13
82
formal definitions of Ethernet service types and parameters. These standards are aligned with each other and
give similar and non-contradictory definitions of Ethernet services.
C.1.2.1 Service Assurance Standards
Ethernet OAM standards of this type describe how to check whether a provisioned Ethernet service complies
with its SLD parameters. Until recently there were no standards in this area that took into account Ethernet-
specific services; the most popular standard among tester vendors, RFC 2544, is an IP-centric standard and its
use for Ethernet services could lead to ambiguous results. Fortunately, in spring 2011, the ITU-T approved the
Y.1564 recommendation “Ethernet service activation test methodology” [ITU-T Y.1564], which bridges this gap.
Figure C.1 illustrates a simple disruptive on-demand procedure described in Y.1564 which tests connectivity and
throughput up to CIR and EIR and policing limits by injecting traffic into an Ethernet connection. Traffic rate and
performance parameters are measured according to the definitions in Y.1563 “Ethernet frame transfer and
availability performance” [ITU-T Y.1563].
Figure C.1: Throughput test according to the ITU‐T Y.1564 recommendation
This standard corresponds to measurements which iperf/BWCTL carries out in UDP mode, with the difference
that iperf tests the one throughput specified by a user, while Y.1564 tests includes several steps up to the actual
service bandwidth limits.
There is no Y.1564 mode which corresponds to iperf TCP mode as Ethernet is a connectionless transport.
C.1.2.2 Service Monitoring Standards
Two major standards have been developed for this area:
IEEE 802.1ag: “Connectivity Fault Management” (CFM) [IEEE 802.1ag].
ITU-T Y.1731: “OAM functions and mechanisms for Ethernet based networks” [ITU-T Y.1731].

Standards of Ethernet Performance Monitoring
Deliverable D8.4 (DS4.3.1): End-to-end Management – Catalogue of Business Processes Document Code: GN3PLUS13-589-13
83
For the purpose of monitoring Ethernet services, IEEE 802.1ag defines a hierarchy of maintenance sessions
which allows independent monitoring for different segments of the same service by different entities, such as a
customer, a service provider or an operator (Figure C.2).
Figure C.2: A hierarchy of maintenance sessions according to IEEE 802.1ag specification
Each maintenance session uses a separate sequence of “heartbeat” messages called Continuity Check
Messages (CCMs) to monitor the health of a service.
The Y.1731 recommendation extends the IEEE 802.1ag specification and includes the description of the CFM
CCM function (called ETH-CC in Y.1731), adding several performance monitoring functions:
Loss Measurement (LM).
Delay Measurement (DM).
These functions allow active measurements of delay, delay variation and loss between connection end or
intermediate points to be carried out.
Note: As Y.1731 covers all IEEE 802.1ag functionality and adds some extra functions, the name Y.1731 will be
used in this chapter to refer to the IEEE 802.1ag / Y.1731 combined functionality when appropriate.
C.1.2.3 Service Troubleshooting Standards
Both the IEEE 802.1ag and Y.1731 standards describe two protocols (“functions” in Y.1731 terminology) that
may be used for service troubleshooting:
Linktrace Protocol – allows a path to be traced in an IP traceroute manner and can report on passing
intermediate maintenance points along a service path.
Loopback Protocol – allows connectivity to be checked with connection end and intermediate
maintenance points in an IP ping manner.

Deliverable D8.4 (DS4.3.1): End-to-end Management – Catalogue of Business Processes Document Code: GN3PLUS13-589-13
84
References
[DJ2-1-1] Deliverable D.J2.1.1: Information Schemas and Workflows for Multi-Domain Control and
Management Functions,
https://intranet.GÉANT.net/sites/Research/JRA2/Deliverables/DJ211/Documents/GN3-11-
072_DJ2-1-1_Information_Schemas_and_Workflows_for_Multi-
Domain_Control_and_Management_Functions.pdf
[DS3.3.1] First deliverable of SA3T3
[ESB-SWOT] M. Wolski, GEMBus (ESB) – SWOT Chart, https://GÉANT3-
intranet.archive.GÉANT.net/sites/Services/SA2/T5/Documents/ESB_SWOT.docx
[eTOM AddF] Process Flow Examples, TMF GB921, Addendum F, Version 12.0, June 2012.
[eTOM AddJ] Joining the Business Process Framework through to Process Flows, TMF GB921 Addendum J,
Version 11.2, October 2011
[eTOM AddK] Construction Guidelines for Process Flows, TMF GB921, Addendum K, Version 12.3, October
2012.
[eTOM-C&P] eTOM Concepts and Principles, Release 9.0, April 2011
[Fan2010] L. Fan, B. N. Jagdish, A. Senthil Kumar, S. Anbuselvan, S. Bok, “Collaborative Fixture Design
and Analysis Using Service Oriented Architecture”, 2010
[FaultMgmtAPI] Fault Management API Overview, Version 1.0, OSS Through Java Initiative
[FTTS] Integrated Trouble Ticket System – installation instructions, https://geant3-
intranet.archive.geant.net/sites/Research/JRA2/T1/Documents/Trouble%20Ticket%20System
%20integration/Integrated_trouble_ticket_system_installation_instructions.pdf
[GEMBus] Deliverable DJ3.3.2 Composable Network Services Framework and General Architecture:
GEMBus, https://GÉANT3-
intranet.archive.GÉANT.net/sites/Research/JRA3/T3/Documents/Deliverables/GN3-11-
002%20Composable%20Network%20Services%20Framework%20and%20Architecture%20(G
EMBus)%20DJ3.3.2.pdf
[GN3 DJ2.1.1] DJ2.1.1 Information Schemas and Workflows for Multi-Domain Control and Management
Functions
[GN921-R] NGOSS Real World Use Case, How to realise NGOSS principles? June 2009
[Gr1] Feamster N., Sundaresan S., de Donato W., Teixeira R. The Case for Measurements from
Home Network Gateways, CAIDA AIMS-3: Workshop on Active Internet Measurements. 2011
http://www.caida.org/workshops/isma/1102/slides/aims1102_nfeamster.pdf
[IBM10] www.ibm.com/developerworks/webservices/library/ws-esbscen/
[IPSLA] http://www.cisco.com/en/US/technologies/tk648/tk362/tk920/
technologies_white_paper0900aecd8017531d_ps6602_Products_White_Paper.html

References
Deliverable D8.4 (DS4.3.1): End-to-end Management – Catalogue of Business Processes Document Code: GN3PLUS13-589-13
85
[MIL] Federated Service Management for Defence (Catalyst) - Blueprint, TMF 866, TM Forum
Approved, Version 1.2, (2012)
[M-Lab1] Measurement tools running on M-Lab, http://measurementlab.net/measurement-lab-tools
[M-Lab2] M-Lab, Procedure for approval of new experiments and allocation of slices,
http://measurementlab.net/sites/default/files/SubmissionguidelinesforM-Labexperiments.pdf
[MTOSI-mridba] TM Forum MTOSI Manage Resource Inventory DDP Business Agreement, Version 1.2,
September 2011
[MTOSI-rtmba] TM Forum MTOSI Resource Trouble Management Business Agreement, TMF518_RTM,
Version 1.2, September 2011
[NGOSS TNA] The NGOSS Technology Neutral Architectureǁ, Release 6.0, TMF053, Member evaluation,
version 5.3, November 2005
[perfSONAR] http://GÉANT3.archive.GÉANT.net/service/perfSONAR /Resources/Pages/home.aspx
[perfSONAR-MDM] perfSONAR Services Listing: http://geant3.archive.geant.net/service/perfSONAR
/About_perfSONAR/How%20perfSONAR_MDM_works/Pages/perfSONAR_MDM_service_com
ponents.aspx
[perfSONAR-Services] perfSONAR Service Descriptions: http://www.perfsonar.net/services.html
[RAM-cNIS] Resource Alarm Management Integration for cNIS and AutoBAHN, P.Wright, JRA2T1,
https://GÉANT3-
intranet.archive.GÉANT.net/sites/Research/JRA2/T1/Documents/Resource_Alarm_Manageme
nt/RAM_Integration_for_cNIS_AutoBAHN.docx
[RIPE1] RIPE TTM - Request Test Traffic Measurement Services,
http://www.ripe.net/data-tools/stats/ttm/sign-up
[RIPE2] RIPE Atlas - User-Defined Measurements, https://atlas.ripe.net/doc/udm
[RIPE3] RIPE Atlas - The Credit System, https://atlas.ripe.net/doc/credits
[RPM] http://www.juniper.net/us/en/local/pdf/app-notes/3500145-en.pdf
[SamK1] Test Node Briefing Note, Technical information relating to the SamKnows test nodes, April
2012, http://www.samknows.com/broadband/uploads/methodology/SQ302-001-EN-Test-Node-
Briefing-D01.pdf
[SamK2] http://www.ietf.org/proceedings/85/slides/slides-85-iesg-opsandtech-7.pdf
[TAM] TM Forum: The Application Framework (TAM) GB929, Version 4.7. April, 2012.
[TIP-RAM] TM Forum Resource Alarm Management Business Agreement, TMF524, Version 1.8,
September 2011

Deliverable D8.4 (DS4.3.1): End-to-end Management – Catalogue of Business Processes Document Code: GN3PLUS13-589-13
86
Glossary
AS Autonomous System
BoD Bandwidth on Demand
BPMN Business Process Model and Notation
ESB Enterprise Service Bus
eTOM enhanced Telecom Operations Map
ETSI European Telecommunications Standard Institute
ITU-T International Telecommunications Union – Telecommunication Standardisation Sector
MDVPN Multi-Domain Virtual Private Network
MTNM Multi-Technology Network Management
MTOSI Multi-Technology Operations System Interface
NREN National Research and Education Network
OSS Operation Support System
RPM Resource Performance Management
SOA Service Oriented Architecture
SQM Service Quality Management
TAM Telecom Applications Map
TISPAN (ETSI) Telecommunications and Internet converged Services and Protocols for Advanced Networking
TMF TeleManagement Forum
UDM User-defined Measurements