Embed Size (px)
Citation preview
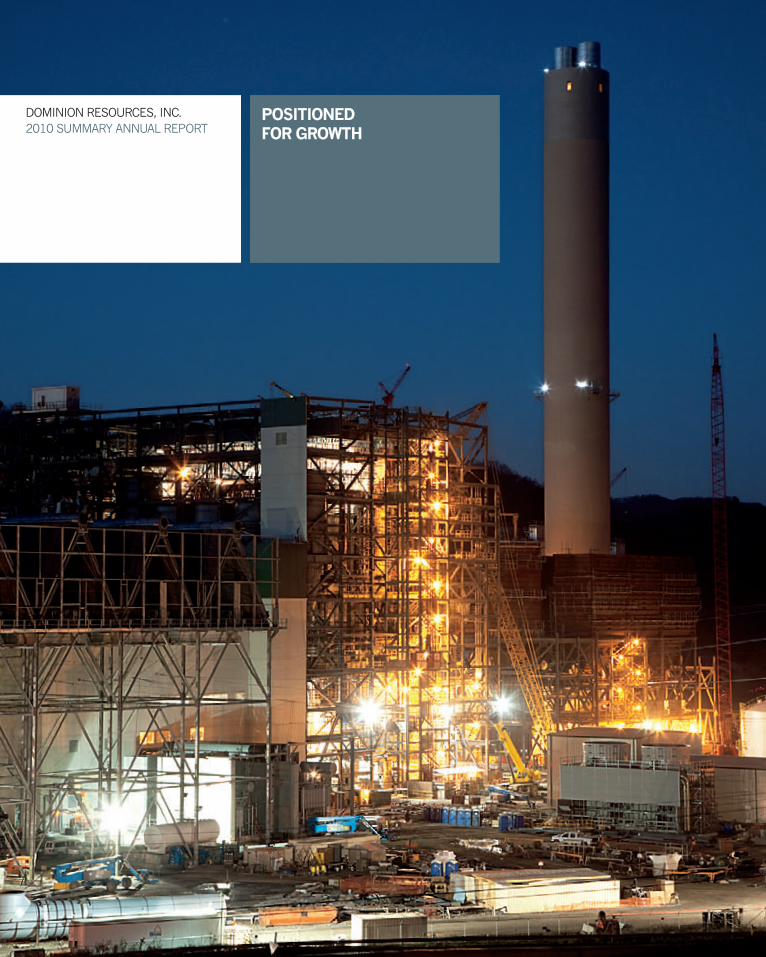
DOMINION RESOURCES, INC.
2010 SUMMARY ANNUAL REPORT
POSITIONED
FORGROWTH
POSITIONED
FORGROWTH
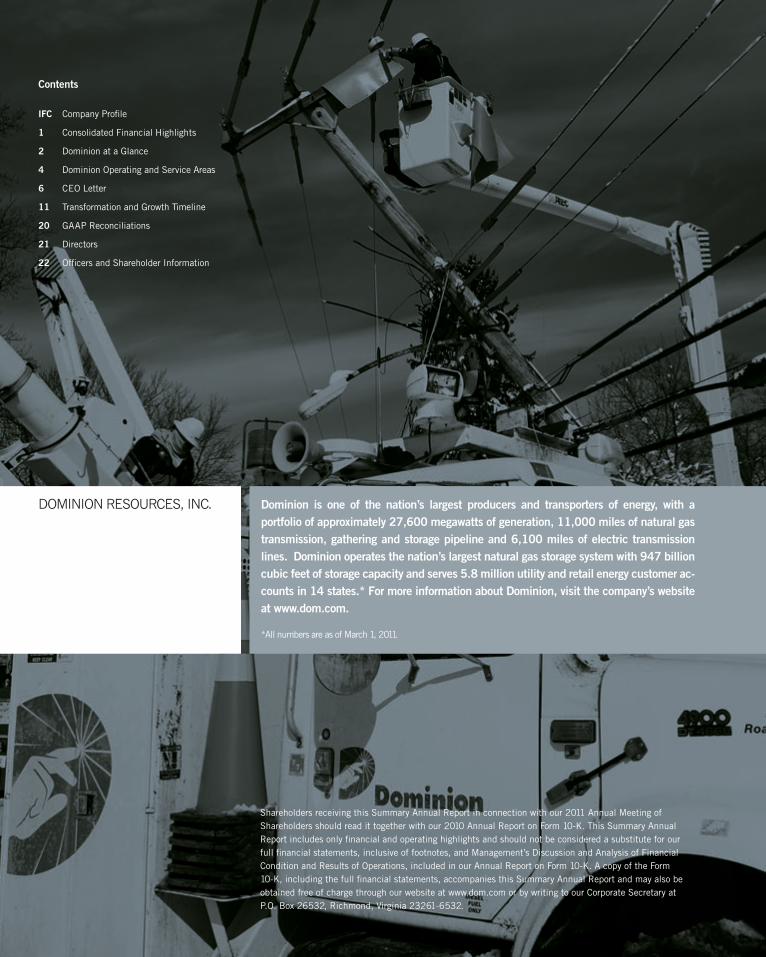
DOMINION RESOURCES, INC. Dominion is one of the nation’s largest producers and transporters of energy, with aportfolio of approximately 27,600 megawatts of generation, 11,000 miles of natural gastransmission, gathering and storage pipeline and 6,100 miles of electric transmissionlines. Dominion operates the nation’s largest natural gas storage system with 947 billioncubic feet of storage capacity and serves 5.8 million utility and retail energy customer ac-counts in 14 states.* For more information about Dominion, visit the company’s websiteat www.dom.com.
*All numbers are as of March 1, 2011.
Shareholders receiving this Summary Annual Report in connection with our 2011 Annual Meeting ofShareholders should read it together with our 2010 Annual Report on Form 10-K. This Summary AnnualReport includes only financial and operating highlights and should not be considered a substitute for ourfull financial statements, inclusive of footnotes, and Management’s Discussion and Analysis of FinancialCondition and Results of Operations, included in our Annual Report on Form 10-K. A copy of the Form10-K, including the full financial statements, accompanies this Summary Annual Report and may also beobtained free of charge through our website at www.dom.com or by writing to our Corporate Secretary atP.O. Box 26532, Richmond, Virginia 23261-6532.
Contents
IFC Company Profile
1 Consolidated Financial Highlights
2 Dominion at a Glance
4 Dominion Operating and Service Areas
6 CEO Letter
11 Transformation and Growth Timeline
20 GAAP Reconciliations
21 Directors
22 Officers and Shareholder Information
2010 Summary Annual Report DOMINION RESOURCES
1
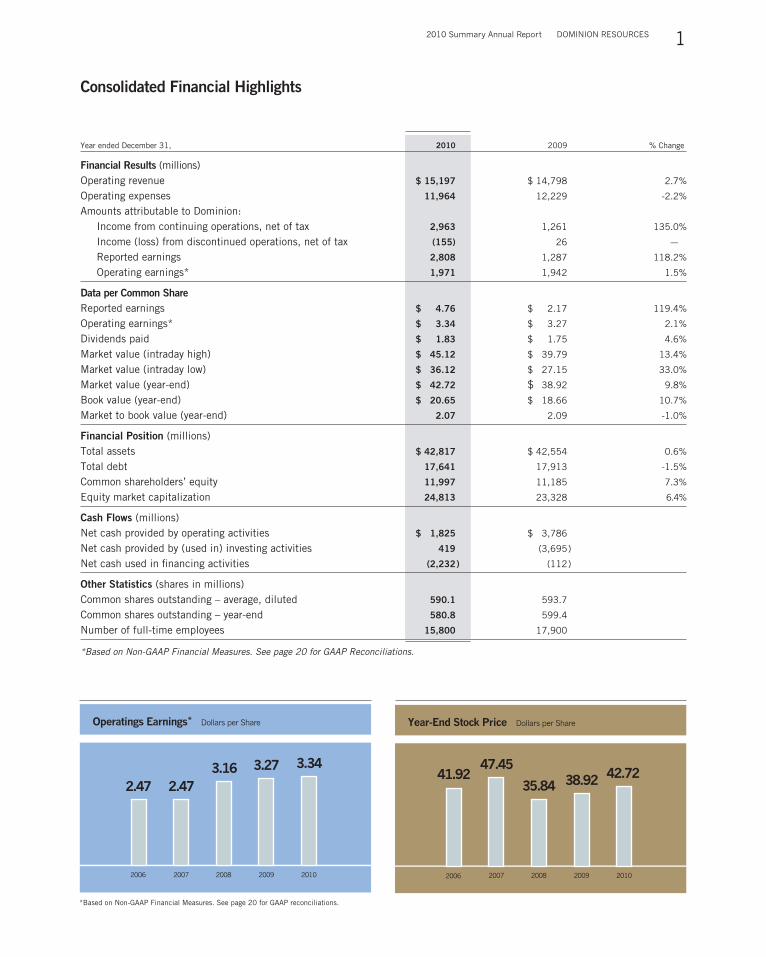
Year-End Stock Price Dollars per Share
41.9247.45
35.8438.92
42.72
2006 2007 2008 2009 2010
Operatings Earnings* Dollars per Share
2.47 2.47
3.16 3.27 3.34
2006 2007 2008 2009 2010
*Based on Non-GAAP Financial Measures. See page 20 for GAAP reconciliations.
Consolidated Financial Highlights
Year ended December 31, 2010 2009 % Change
Financial Results (millions)Operating revenue $ 15,197 $ 14,798 2.7%
Operating expenses 11,964 12,229 -2.2%
Amounts attributable to Dominion:Income from continuing operations, net of tax 2,963 1,261 135.0%
Income (loss) from discontinued operations, net of tax (155) 26 —
Reported earnings 2,808 1,287 118.2%
Operating earnings* 1,971 1,942 1.5%
Data per Common ShareReported earnings $ 4.76 $ 2.17 119.4%
Operating earnings* $ 3.34 $ 3.27 2.1%
Dividends paid $ 1.83 $ 1.75 4.6%
Market value (intraday high) $ 45.12 $ 39.79 13.4%
Market value (intraday low) $ 36.12 $ 27.15 33.0%
Market value (year-end) $ 42.72 $ 38.92 9.8%
Book value (year-end) $ 20.65 $ 18.66 10.7%
Market to book value (year-end) 2.07 2.09 -1.0%
Financial Position (millions)Total assets $ 42,817 $ 42,554 0.6%
Total debt 17,641 17,913 -1.5%
Common shareholders’ equity 11,997 11,185 7.3%
Equity market capitalization 24,813 23,328 6.4%
Cash Flows (millions)Net cash provided by operating activities $ 1,825 $ 3,786
Net cash provided by (used in) investing activities 419 (3,695)
Net cash used in financing activities (2,232) (112)
Other Statistics (shares in millions)Common shares outstanding – average, diluted 590.1 593.7
Common shares outstanding – year-end 580.8 599.4
Number of full-time employees 15,800 17,900
*Based on Non-GAAP Financial Measures. See page 20 for GAAP Reconciliations.

DOMINION RESOURCES 2010 Summary Annual Report
2
DOMINION AT
A GLANCE
DOMINION VIRGINIA POWER
DOMINION ENERGY
DOMINION GENERATION
Dominion’s three primary operating
segments operate in 14 states in the
mid-Atlantic, Northeast andMidwest.
For factors that could cause actual results to differ from expectedresults, see Item 1A. Risk Factors, Forward-Looking Statementsin Item 7. Management’s Discussion and Analysis of FinancialCondition and Results of Operations, and Item 7A. Quantitative andQualitative Disclosures About Market Risk in our Annual Report onForm 10-K for the year ended Dec. 31, 2010.
2010 Primary Operating Segment Earnings Percentages*
58%22%
20%DOMINION VIRGINIA POWER
DOMINION ENERGY
DOMINIONGENERATION
*Excludes Corporate and Other Segment
2010 Summary Annual Report DOMINION RESOURCES
3
Operates regulated electric
transmission and distribu-
tion franchises in Virginia
and northeastern North
Carolina, providing electric
service to about 2.4 million
customer accounts in the
two-state area. Dominion
Retail, serving approxi-
mately 2.1 million customer
accounts in 14 retail choice
states, is part of this unit.
BUSINESS LINES
• Electric transmission
• Electric distribution
• Non-regulated retail
energy marketing
(electric and gas)
2010 HIGHLIGHTS
• Connected about 27,000
new franchise customer
accounts.
• Settled 2009 Virginia
Power base rate case.
• Proceeded on schedule
and on budget with con-
struction on two major
transmission lines —
Meadow Brook to Loudoun
and Carson to Suffolk —
that are expected to be
completed in 2011.
2011 OUTLOOK
• Maintain a superior safety
record.
• File with the Virginia State
Corporation Commission
an application to rebuild
the aging Mt. Storm to
Doubs transmission line,
one of 65 projects totaling
$770 million to be filed.
• Propose a pilot program to
offer time-of-day pricing
options to encourage
off-peak charging of
electric vehicles.
Operates the nation’s largest
natural gas storage system;
a network of 11,000 miles
of natural gas transmission,
gathering and storage
pipelines; a natural gas
distribution system serving
1.3 million customer
accounts in West Virginia
and Ohio; and a liquefied
natural gas terminal in
Maryland. It also includes
the producer services
function.
BUSINESS LINES
• Natural gas transmission
• Natural gas distribution
• Natural gas storage
• Producer services
2010 HIGHLIGHTS
• Completed the sale of our
Appalachian natural gas
exploration and production
operations for nearly
$3.5 billion.
• Completed the sale of the
Pennsylvania local distrib-
tion company, Dominion
Peoples, for $780 million.
• Placed the HUB I, II, and
III and Rural Valley projects
into service.
2011 OUTLOOK
• Maintain a superior
safety record.
• Invest in infrastructure in
the Marcellus Shale region
to meet the needs of the
producer community and
the marketplace.
• Continue Dominion East
Ohio’s bare steel pipe
replacement program,
a $2.6 billion, 25-year
project launched in 2008.
Operates the company’s
fleet of regulated power
stations serving its electric
utility franchise, as well as
a merchant power fleet sup-
plying wholesale markets in
the Midwest and Northeast.
Together, they account
for approximately 27,600
megawatts of generation.
BUSINESS LINES
• Utility power production
• Merchant power
production
2010 HIGHLIGHTS
• Proceeded on schedule
and on budget with con-
struction of Bear Garden
and the Virginia City
Hybrid Energy Center,
combining for 1,165 mega-
watts and more than $2.4
billion in investment.
• Obtained from the Virginia
Department of Envi-
ronmental Quality an air
permit for the proposed
1,300-megawatt gas-fired
Warren County facility.
• Completed the Brayton
Point Unit 3 Economizer
replacement project to
improve efficiency and
reliability.
2011 OUTLOOK
• Maintain a superior
safety record.
• Bring online the
580-megawatt, gas-fired
combined cycle Bear
Garden Power Station
in Central Virginia.
• File with the Virginia SCC
an application for Warren
County, which is expected
to come online in late 2014
or early 2015.
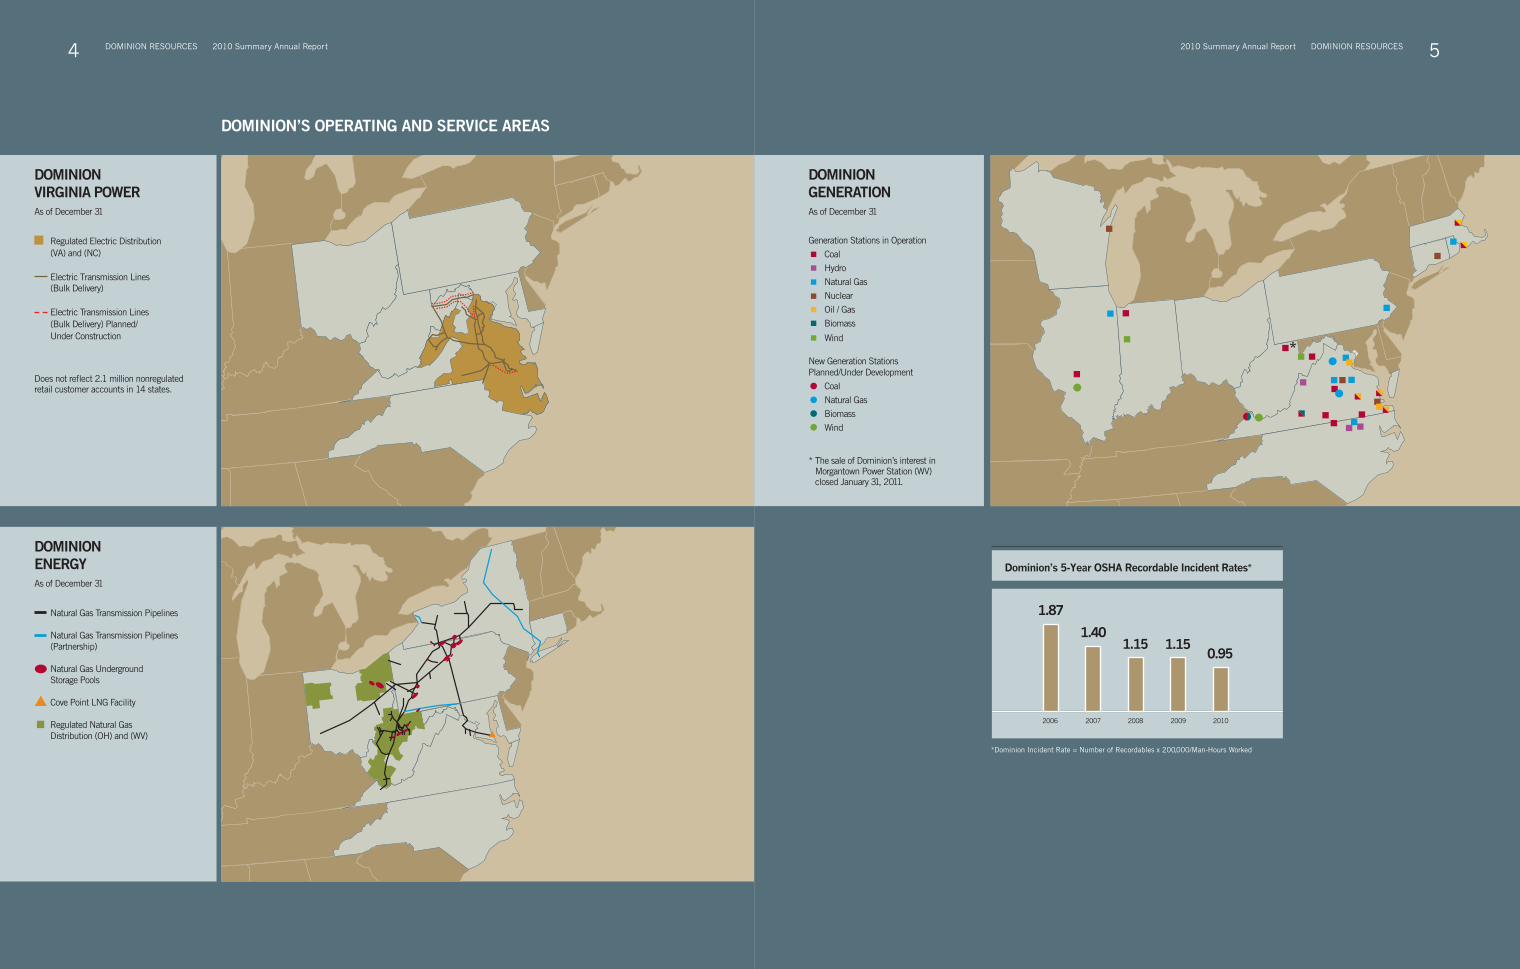
DOMINIONVIRGINIA POWERAs of December 31
Regulated Electric Distribution(VA) and (NC)
Electric Transmission Lines(Bulk Delivery)
Electric Transmission Lines(Bulk Delivery) Planned/Under Construction
Does not reflect 2.1 million nonregulatedretail customer accounts in 14 states.
DOMINIONENERGYAs of December 31
Natural Gas Transmission Pipelines
Natural Gas Transmission Pipelines(Partnership)
Natural Gas UndergroundStorage Pools
Cove Point LNG Facility
Regulated Natural GasDistribution (OH) and (WV)
DOMINION’S OPERATING AND SERVICE AREAS
DOMINION RESOURCES 2010 Summary Annual Report
42010 Summary Annual Report DOMINION RESOURCES
5
DOMINIONGENERATIONAs of December 31
Generation Stations in Operation
Coal
Hydro
Natural Gas
Nuclear
Oil / Gas
Biomass
Wind
New Generation StationsPlanned/Under Development
Coal
Natural Gas
Biomass
Wind
* The sale of Dominion’s interest inMorgantown Power Station (WV)closed January 31, 2011.
DOMINION’S OPERATING AND SERVICE AREAS
2010 Summary Annual Report DOMINION RESOURCES
5
Dominion’s 5-Year OSHA Recordable Incident Rates*
1.87
1.40
1.15 1.150.95
2006 2007 2008 2009 2010
*Dominion Incident Rate = Number of Recordables x 200,000/Man-Hours Worked
DOMINION RESOURCES 2010 Summary Annual Report
6
Thomas F. Farrell II
Chairman, President and Chief Executive Officer
DEAR INVESTORS,
The year 2010 will be remembered as one of significant
change — at Dominion as well as throughout the na-
tion and world. The U.S. economy took only modest
steps toward recovery, while the U.S. stock markets
traded up and down and the unemployment rate
remained at near double-digit levels.
Despite this turbulence, the people at Dominion
remained true to our four core values — safety, ethics,
excellence and teamwork. These principles are the
backbone of our corporate structure and culture. Man-
agement and employees alike strictly adhere to them.
Never forget that the daily tasks of many of our em-
ployees are dangerous — from repairing power and gas
lines to operating power stations and gas compressors.
That is why safety ranks first on our list. We are proud
that our U.S. Occupational Safety and Health Admin-
istration’s recordable incident rate of 0.95 incidents per
100 employees in 2010 represented a 17 percent
reduction from 2009, and 77 percent from 2003. In
fact, all three of our operating units demonstrated
superior safety performance in 2010. Dominion
consistently ranked in the top quartile of companies
in the Southeast Electric Exchange in employee safety
performance during 2010.
Our customer value and satisfaction rankings at
Dominion Transmission show without a doubt what
our people can do. For the fifth year, our gas pipeline
business unit was ranked first in customer value and
customer satisfaction among its primary Northeast
competitors, according to a 2010 study by Missouri-
based consultant Mastio & Co. Nationwide, Domin-
ion Transmission ranked third in customer value and
fifth in customer satisfaction among pipelines with at
least 3,500 miles of transmission pipeline and deliveries
of at least 1 trillion cubic feet of gas.
Thanks to dedicated employees throughout
Dominion, your company has substantially completed
2010 Summary Annual Report DOMINION RESOURCES
7
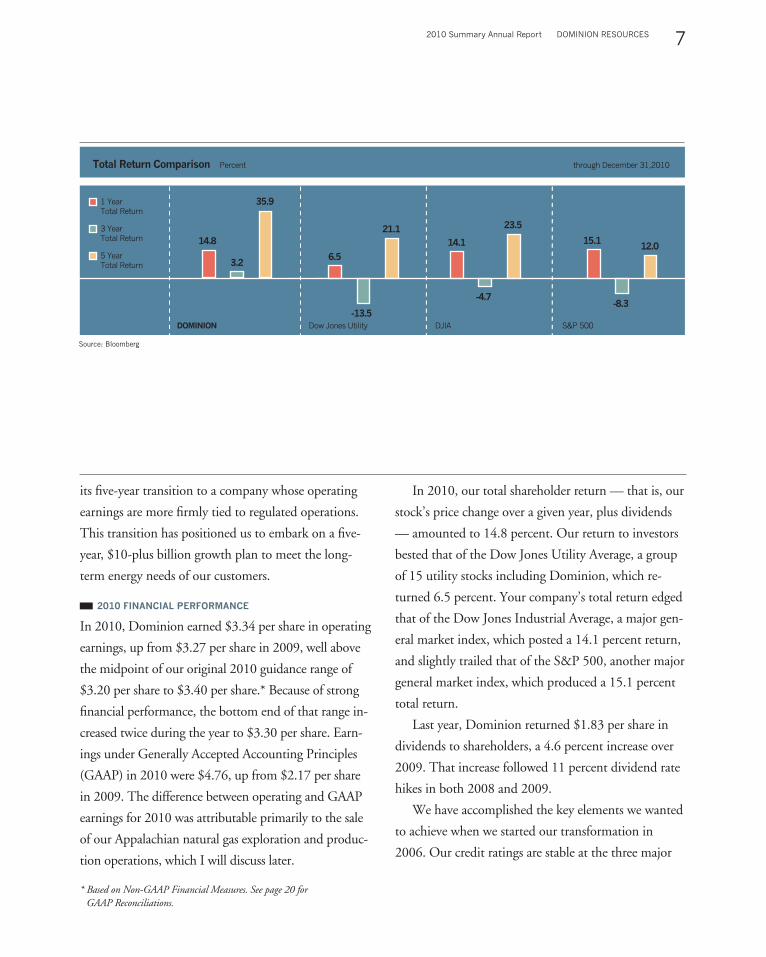
Total Return Comparison Percent through December 31,2010
-8.3
15.112.0
-4.7
-13.5
14.1
6.5
14.8
3.2
35.9
21.123.5
DOMINION Dow Jones Utility DJIA S&P 500
1 Year
Total Return
3 Year
Total Return
5 Year
Total Return
Source: Bloomberg
its five-year transition to a company whose operating
earnings are more firmly tied to regulated operations.
This transition has positioned us to embark on a five-
year, $10-plus billion growth plan to meet the long-
term energy needs of our customers.
2010 FINANCIAL PERFORMANCE
In 2010, Dominion earned $3.34 per share in operating
earnings, up from $3.27 per share in 2009, well above
the midpoint of our original 2010 guidance range of
$3.20 per share to $3.40 per share.* Because of strong
financial performance, the bottom end of that range in-
creased twice during the year to $3.30 per share. Earn-
ings under Generally Accepted Accounting Principles
(GAAP) in 2010 were $4.76, up from $2.17 per share
in 2009. The difference between operating and GAAP
earnings for 2010 was attributable primarily to the sale
of our Appalachian natural gas exploration and produc-
tion operations, which I will discuss later.
In 2010, our total shareholder return — that is, our
stock’s price change over a given year, plus dividends
— amounted to 14.8 percent. Our return to investors
bested that of the Dow Jones Utility Average, a group
of 15 utility stocks including Dominion, which re-
turned 6.5 percent. Your company’s total return edged
that of the Dow Jones Industrial Average, a major gen-
eral market index, which posted a 14.1 percent return,
and slightly trailed that of the S&P 500, another major
general market index, which produced a 15.1 percent
total return.
Last year, Dominion returned $1.83 per share in
dividends to shareholders, a 4.6 percent increase over
2009. That increase followed 11 percent dividend rate
hikes in both 2008 and 2009.
We have accomplished the key elements we wanted
to achieve when we started our transformation in
2006. Our credit ratings are stable at the three major
* Based on Non-GAAP Financial Measures. See page 20 forGAAP Reconciliations.

DOMINION RESOURCES 2010 Summary Annual Report
8
Wedoourbest to support
education, theenvironment,
humanservices, thearts and
manyotherphilanthropic
endeavors in the communities
weserve.
Dominion donated $15million through The Dominion
Foundation to more than 1,300 organizations in 2010.
Our employees volunteered 150,000 hours of their
time to improve their communities.
We donated $4.5million to EnergyShare in 2010.
We contributed more than $2million to support
environmental organizations, housing organizations
and homeless shelters in 14 states.
We launched a new competitive higher education
grants program in Virginia with a $500,000 donation
from the foundation.
rating agencies, and we are positioned to report future
dividend and earnings growth from our ongoing
infrastructure investments. Here is a summary of our
progress, our operating achievements in 2010, and our
outlook for the future.
A FIVE-YEAR TRANSFORMATION: 2006 - 2010
In 2006, senior management and the Board of Direc-
tors decided on a new direction for Dominion. At the
time, there was a growing gap in our Virginia franchise
area between demand and available generation — and
uncertainty in putting vast amounts of capital into
new infrastructure projects. We were producing large
amounts of natural gas and oil in wells across the U.S.,
the Gulf of Mexico and Canada, adding commodity
price exposure and volatility to our earnings and the
need for significant credit capacity and cash to cover
hedging programs. Three-fifths of Dominion’s oper-
ating earnings were derived from commodity-based
businesses, such as gas and oil exploration and produc-
tion (E&P) and power stations in the Northeast selling
electricity into non-regulated markets. That percentage
was expected to increase.
Investors asked, Is Dominion a utility? An E&P
company? An independent power producer? Our price-
to-earnings ratio — a common metric to value a stock
— reflected those concerns. Back then our P/E valu-
ation was at a 12 percent discount to the average P/E
ratio of the 14 companies we identified as representing
our peer group.*
THE 2006 PLAN
Seeking to alleviate investor concerns, senior manage-
ment unveiled a plan whose philosophy was simple:
Reduce risk by shifting the operating earnings mix to
focus on regulated businesses and decreasing earnings
sensitivity to commodity prices.
We developed a strategy to grow federal- and state-
regulated assets. In the Virginia General Assembly,
Dominion supported a regulatory model that allowed
the State Corporation Commission to set customers’
rates while providing forward-looking cost-recovery
mechanisms and performance incentives for new infra-
structure to meet rising demand. We considered selling* As of December 31, 2010, our peer companies consisted of Ameren, AEP,
Constellation Energy Group, DTE Energy, Duke Energy, Entergy, Exelon,FirstEnergy, NextEra Energy, NiSource, PPL, Progress Energy, PublicService Enterprise Group, and Southern Company. Going forward, CMSEnergy and Xcel Energy will be part of Dominion’s peer group.

2010 Summary Annual Report DOMINION RESOURCES
9
assets that did not or were not expected to produce ad-
equate returns on invested capital (ROIC). This would
support a strong balance sheet, stable credit ratings,
and the ability to provide investors with competitive
utility dividends.
EXECUTING THE PLAN
To execute our plan, the company in 2007 divested
our non-Appalachian E&P assets for nearly $14 bil-
lion. The after-tax proceeds reduced outstanding debt
by $3.3 billion and also allowed us to repurchase more
than $5.8 billion of common stock, more than 18
percent of the total shares outstanding as of December
31, 2006. Further, as the Virginia General Assembly
passed legislation in 2007 to reregulate the state’s elec-
tric utilities and provide premium returns on equity
for critical infrastructure investments, the company
focused its efforts on a build-out to serve our
customers’ needs.
Management continued to reduce commodity and
merchant risk and evaluate remaining business lines to
ensure that they met our targets for actual and poten-
tial ROIC.
As a result, last year we sold the remainder of our
E&P operations in the Appalachian region for nearly
$3.5 billion, including hundreds of thousands of acres
holding Marcellus Shale, one of the largest recoverable
gas discoveries in recent years. Because of our pipeline
and storage system’s strong presence throughout the
Marcellus Shale region, we believed it made better
business sense to sell our production interests there
and instead renew our focus on energy infrastructure.
Shareholder capital, we concluded, had more value in
improving existing infrastructure and building new
products extraction facilities, gathering, storage, and
transmission pipelines — infrastructure that would
help producers more effectively and efficiently get
natural gas to demand centers.
The Appalachian E&P transaction reduced our
overall, companywide commodity exposure by an ad-
ditional 20 percent and annual capital expenditures by
$250 million. We used the after-tax proceeds to offset
2010 and 2011 equity needs, buy back common stock,
pay down debt and make a contribution to our pen-
sion plan.
Based on ROIC considerations, we also closed on
the sale of Dominion Peoples, a gas local distribution
company serving parts of Pennsylvania, for $780 mil-
lion and reduced debt with the proceeds. Dominion
also divested its interest in Rumford and Morgantown,
two small merchant coal-fired power stations in Maine
and West Virginia, respectively.
RESULTS OF OUR REPOSITIONING
We have been pleased with the success of our trans-
formation to date. I must admit, however, that timing
and, to some extent, luck have played their part. Back
in 2006, when we decided to market our non-Appala-
chian E&P business, we did not know that natural gas
and oil prices would plummet or that the Gulf of Mex-
ico would be home to history’s largest oil spill. And at
DOMINION RESOURCES 2010 Summary Annual Report
14
Between 2011 and 2015, we have plans for $10-plus
billion in growth capital expenditures, not including
potential environmental spending of nearly $2 billion
for power stations serving Virginia and North Carolina.
Of the planned growth capital expenditures, 99
percent is budgeted for regulated infrastructure in our
electric service area and in regulated gas businesses.
Dominion must invest in such infrastructure for three
principal reasons.
First, we are anticipating demand growth at our
electric utility. Although new connects dropped to
about 27,000 in 2010, the utility has historically con-
nected 48,000 new customer accounts each year. PJM
Interconnection, a transmission grid operator serving
all or parts of 13 states and the District of Columbia,
reports that the Dominion Zone has the highest ex-
pected electric load growth rate — 2.1 percent per year
— of the 20 zones it operates. It further forecasts that
over the next decade peak demand growth in Virginia
will be the equivalent of adding 1.1 million additional
homes to our system.
Second, enormous gas deposit finds in the Mar-
cellus Shale have started a production rush in West
Virginia and Pennsylvania. Although we sold our
E&P business, we plan to help producers by investing
at least $850 million in infrastructure to bring their
Marcellus gas to market.
Third, gas and electric distribution systems in Vir-
ginia, North Carolina, Ohio and West Virginia need
to be upgraded and modernized. These aging wires
and pipes must continue to serve customers without
interruption and to connect new customers as energy
demand grows.
POWERING VIRGINIA
As I have stated in previous letters, Virginia is one
of the best states for business, according to both
CNBC and Forbes.com. The state is home to many of
America’s largest military installations, and serves half
the nation’s Internet flow. Because of its proximity to
Washington, D.C., Virginia continues to be largely
recession-resistant. Its economy continues to grow.
Three-quarters of our anticipated growth capital
expenditures from 2011 to 2015 — or approximately
$7.4 billion — is slated for generation, transmission
and distribution in the electric utility service area. That
figure excludes the more than $5.5 billion already
spent from 2006 to 2010 to satisfy demand growth in
Virginia and North Carolina.
The list of major projects currently in development
or under construction follows. All of these qualify for
enhanced returns on generation, transmission and
distribution investments either as part of the regula-
PLEASE LIFT
DOMINION’S
TRANSFORMATION&
GROWTH – 2006-2015
In 2006, Dominion decided to change direction and
unveiled a plan whose philosophy was simple: Reduce risk
by shifting the operating earnings mix to focus on regulat-
ed businesses and decreasing earnings sensitivity to com-
modity prices. This transition has positioned your company
to embark on a new, five-year, $10-plus billion growth plan
to meet the long-term energy needs of our customers.
2010 Summary Annual Report DOMINION RESOURCES
11
DOMINION RESOURCES 2010 Summary Annual Report
122010 Summary Annual Report DOMINION RESOURCES
13
DOMINION’S
TRANSFORMATION&
GROWTH – 2006-2015
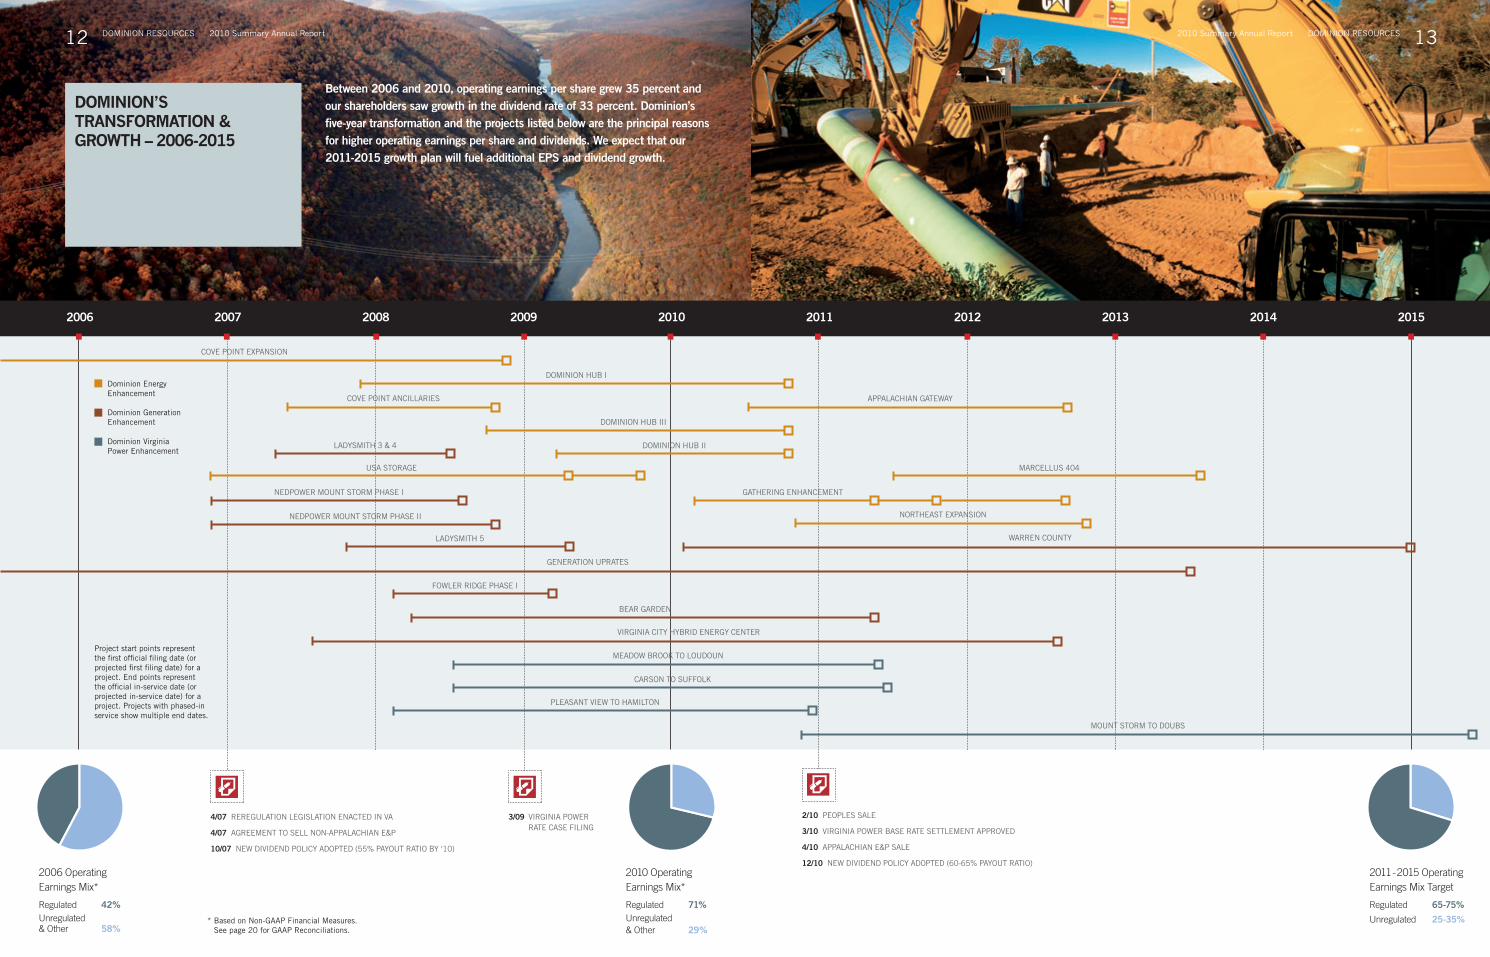
2006 OperatingEarnings Mix*
Regulated 42%Unregulated& Other 58%
2010 OperatingEarnings Mix*
Regulated 71%Unregulated& Other 29%
2011-2015 OperatingEarnings Mix Target
Regulated 65-75%
Unregulated 25-35%
4/07 REREGULATION LEGISLATION ENACTED IN VA
4/07 AGREEMENT TO SELL NON-APPALACHIAN E&P
10/07 NEW DIVIDEND POLICY ADOPTED (55% PAYOUT RATIO BY ‘10)
3/09 VIRGINIA POWERRATE CASE FILING
2/10 PEOPLES SALE
3/10 VIRGINIA POWER BASE RATE SETTLEMENT APPROVED
4/10 APPALACHIAN E&P SALE
12/10 NEW DIVIDEND POLICY ADOPTED (60-65% PAYOUT RATIO)
Between 2006 and 2010, operating earnings per share grew 35 percent andour shareholders saw growth in the dividend rate of 33 percent. Dominion’sfive-year transformation and the projects listed below are the principal reasonsfor higher operating earnings per share and dividends. We expect that our2011-2015 growth plan will fuel additional EPS and dividend growth.
2006 2007 2008 2009 2011 2012 2013 20142010 2015
COVE POINT EXPANSION
DOMINION HUB I
DOMINION HUB III
DOMINION HUB IILADYSMITH 3 & 4
PLEASANT VIEW TO HAMILTON
MEADOW BROOK TO LOUDOUN
LADYSMITH 5 WARREN COUNTY
GENERATION UPRATES
APPALACHIAN GATEWAYCOVE POINT ANCILLARIES
USA STORAGE MARCELLUS 404
NEDPOWER MOUNT STORM PHASE II NORTHEAST EXPANSION
CARSON TO SUFFOLK
NEDPOWER MOUNT STORM PHASE I GATHERING ENHANCEMENT
BEAR GARDEN
FOWLER RIDGE PHASE I
VIRGINIA CITY HYBRID ENERGY CENTER
MOUNT STORM TO DOUBS
Dominion VirginiaPower Enhancement
Dominion GenerationEnhancement
Dominion EnergyEnhancement
Project start points representthe first official filing date (orprojected first filing date) for aproject. End points representthe official in-service date (orprojected in-service date) for aproject. Projects with phased-inservice show multiple end dates.
* Based on Non-GAAP Financial Measures.See page 20 for GAAP Reconciliations.
DOMINION RESOURCES 2010 Summary Annual Report
10
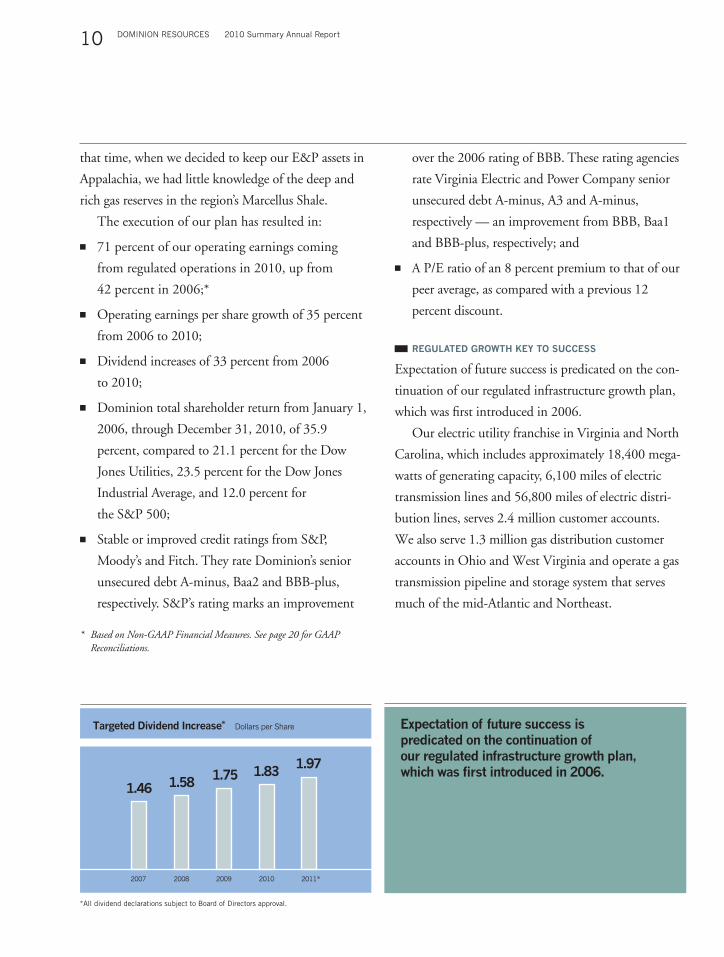
Targeted Dividend Increase* Dollars per Share
1.461.58
1.75 1.831.97
2007 2008 2009 2010 2011*
*All dividend declarations subject to Board of Directors approval.
Expectation of future success is
predicated on the continuation of
our regulated infrastructure growth plan,
which was first introduced in 2006.
that time, when we decided to keep our E&P assets in
Appalachia, we had little knowledge of the deep and
rich gas reserves in the region’s Marcellus Shale.
The execution of our plan has resulted in:
71 percent of our operating earnings coming
from regulated operations in 2010, up from
42 percent in 2006;*
Operating earnings per share growth of 35 percent
from 2006 to 2010;
Dividend increases of 33 percent from 2006
to 2010;
Dominion total shareholder return from January 1,
2006, through December 31, 2010, of 35.9
percent, compared to 21.1 percent for the Dow
Jones Utilities, 23.5 percent for the Dow Jones
Industrial Average, and 12.0 percent for
the S&P 500;
Stable or improved credit ratings from S&P,
Moody’s and Fitch. They rate Dominion’s senior
unsecured debt A-minus, Baa2 and BBB-plus,
respectively. S&P’s rating marks an improvement
over the 2006 rating of BBB. These rating agencies
rate Virginia Electric and Power Company senior
unsecured debt A-minus, A3 and A-minus,
respectively — an improvement from BBB, Baa1
and BBB-plus, respectively; and
A P/E ratio of an 8 percent premium to that of our
peer average, as compared with a previous 12
percent discount.
REGULATED GROWTH KEY TO SUCCESS
Expectation of future success is predicated on the con-
tinuation of our regulated infrastructure growth plan,
which was first introduced in 2006.
Our electric utility franchise in Virginia and North
Carolina, which includes approximately 18,400 mega-
watts of generating capacity, 6,100 miles of electric
transmission lines and 56,800 miles of electric distri-
bution lines, serves 2.4 million customer accounts.
We also serve 1.3 million gas distribution customer
accounts in Ohio and West Virginia and operate a gas
transmission pipeline and storage system that serves
much of the mid-Atlantic and Northeast.
* Based on Non-GAAP Financial Measures. See page 20 for GAAPReconciliations.

2010 Summary Annual Report DOMINION RESOURCES
9
assets that did not or were not expected to produce ad-
equate returns on invested capital (ROIC). This would
support a strong balance sheet, stable credit ratings,
and the ability to provide investors with competitive
utility dividends.
EXECUTING THE PLAN
To execute our plan, the company in 2007 divested
our non-Appalachian E&P assets for nearly $14 bil-
lion. The after-tax proceeds reduced outstanding debt
by $3.3 billion and also allowed us to repurchase more
than $5.8 billion of common stock, more than 18
percent of the total shares outstanding as of December
31, 2006. Further, as the Virginia General Assembly
passed legislation in 2007 to reregulate the state’s elec-
tric utilities and provide premium returns on equity
for critical infrastructure investments, the company
focused its efforts on a build-out to serve our
customers’ needs.
Management continued to reduce commodity and
merchant risk and evaluate remaining business lines to
ensure that they met our targets for actual and poten-
tial ROIC.
As a result, last year we sold the remainder of our
E&P operations in the Appalachian region for nearly
$3.5 billion, including hundreds of thousands of acres
holding Marcellus Shale, one of the largest recoverable
gas discoveries in recent years. Because of our pipeline
and storage system’s strong presence throughout the
Marcellus Shale region, we believed it made better
business sense to sell our production interests there
and instead renew our focus on energy infrastructure.
Shareholder capital, we concluded, had more value in
improving existing infrastructure and building new
products extraction facilities, gathering, storage, and
transmission pipelines — infrastructure that would
help producers more effectively and efficiently get
natural gas to demand centers.
The Appalachian E&P transaction reduced our
overall, companywide commodity exposure by an ad-
ditional 20 percent and annual capital expenditures by
$250 million. We used the after-tax proceeds to offset
2010 and 2011 equity needs, buy back common stock,
pay down debt and make a contribution to our pen-
sion plan.
Based on ROIC considerations, we also closed on
the sale of Dominion Peoples, a gas local distribution
company serving parts of Pennsylvania, for $780 mil-
lion and reduced debt with the proceeds. Dominion
also divested its interest in Rumford and Morgantown,
two small merchant coal-fired power stations in Maine
and West Virginia, respectively.
RESULTS OF OUR REPOSITIONING
We have been pleased with the success of our trans-
formation to date. I must admit, however, that timing
and, to some extent, luck have played their part. Back
in 2006, when we decided to market our non-Appala-
chian E&P business, we did not know that natural gas
and oil prices would plummet or that the Gulf of Mex-
ico would be home to history’s largest oil spill. And at
DOMINION RESOURCES 2010 Summary Annual Report
14
Between 2011 and 2015, we have plans for $10-plus
billion in growth capital expenditures, not including
potential environmental spending of nearly $2 billion
for power stations serving Virginia and North Carolina.
Of the planned growth capital expenditures, 99
percent is budgeted for regulated infrastructure in our
electric service area and in regulated gas businesses.
Dominion must invest in such infrastructure for three
principal reasons.
First, we are anticipating demand growth at our
electric utility. Although new connects dropped to
about 27,000 in 2010, the utility has historically con-
nected 48,000 new customer accounts each year. PJM
Interconnection, a transmission grid operator serving
all or parts of 13 states and the District of Columbia,
reports that the Dominion Zone has the highest ex-
pected electric load growth rate — 2.1 percent per year
— of the 20 zones it operates. It further forecasts that
over the next decade peak demand growth in Virginia
will be the equivalent of adding 1.1 million additional
homes to our system.
Second, enormous gas deposit finds in the Mar-
cellus Shale have started a production rush in West
Virginia and Pennsylvania. Although we sold our
E&P business, we plan to help producers by investing
at least $850 million in infrastructure to bring their
Marcellus gas to market.
Third, gas and electric distribution systems in Vir-
ginia, North Carolina, Ohio and West Virginia need
to be upgraded and modernized. These aging wires
and pipes must continue to serve customers without
interruption and to connect new customers as energy
demand grows.
POWERING VIRGINIA
As I have stated in previous letters, Virginia is one
of the best states for business, according to both
CNBC and Forbes.com. The state is home to many of
America’s largest military installations, and serves half
the nation’s Internet flow. Because of its proximity to
Washington, D.C., Virginia continues to be largely
recession-resistant. Its economy continues to grow.
Three-quarters of our anticipated growth capital
expenditures from 2011 to 2015 — or approximately
$7.4 billion — is slated for generation, transmission
and distribution in the electric utility service area. That
figure excludes the more than $5.5 billion already
spent from 2006 to 2010 to satisfy demand growth in
Virginia and North Carolina.
The list of major projects currently in development
or under construction follows. All of these qualify for
enhanced returns on generation, transmission and
distribution investments either as part of the regula-
PLEASE LIFT
DOMINION’S
TRANSFORMATION&
GROWTH – 2006-2015
In 2006, Dominion decided to change direction and
unveiled a plan whose philosophy was simple: Reduce risk
by shifting the operating earnings mix to focus on regulat-
ed businesses and decreasing earnings sensitivity to com-
modity prices. This transition has positioned your company
to embark on a new, five-year, $10-plus billion growth plan
to meet the long-term energy needs of our customers.
2010 Summary Annual Report DOMINION RESOURCES
11
DOMINION RESOURCES 2010 Summary Annual Report
122010 Summary Annual Report DOMINION RESOURCES
13
DOMINION’S
TRANSFORMATION&
GROWTH – 2006-2015
2006 OperatingEarnings Mix*
Regulated 42%Unregulated& Other 58%
2010 OperatingEarnings Mix*
Regulated 71%Unregulated& Other 29%
2011-2015 OperatingEarnings Mix Target
Regulated 65-75%
Unregulated 25-35%
4/07 REREGULATION LEGISLATION ENACTED IN VA
4/07 AGREEMENT TO SELL NON-APPALACHIAN E&P
10/07 NEW DIVIDEND POLICY ADOPTED (55% PAYOUT RATIO BY ‘10)
3/09 VIRGINIA POWERRATE CASE FILING
2/10 PEOPLES SALE
3/10 VIRGINIA POWER BASE RATE SETTLEMENT APPROVED
4/10 APPALACHIAN E&P SALE
12/10 NEW DIVIDEND POLICY ADOPTED (60-65% PAYOUT RATIO)
Between 2006 and 2010, operating earnings per share grew 35 percent andour shareholders saw growth in the dividend rate of 33 percent. Dominion’sfive-year transformation and the projects listed below are the principal reasonsfor higher operating earnings per share and dividends. We expect that our2011-2015 growth plan will fuel additional EPS and dividend growth.
2006 2007 2008 2009 2011 2012 2013 20142010 2015
COVE POINT EXPANSION
DOMINION HUB I
DOMINION HUB III
DOMINION HUB IILADYSMITH 3 & 4
PLEASANT VIEW TO HAMILTON
MEADOW BROOK TO LOUDOUN
LADYSMITH 5 WARREN COUNTY
GENERATION UPRATES
APPALACHIAN GATEWAYCOVE POINT ANCILLARIES
USA STORAGE MARCELLUS 404
NEDPOWER MOUNT STORM PHASE II NORTHEAST EXPANSION
CARSON TO SUFFOLK
NEDPOWER MOUNT STORM PHASE I GATHERING ENHANCEMENT
BEAR GARDEN
FOWLER RIDGE PHASE I
VIRGINIA CITY HYBRID ENERGY CENTER
MOUNT STORM TO DOUBS
Dominion VirginiaPower Enhancement
Dominion GenerationEnhancement
Dominion EnergyEnhancement
Project start points representthe first official filing date (orprojected first filing date) for aproject. End points representthe official in-service date (orprojected in-service date) for aproject. Projects with phased-inservice show multiple end dates.
* Based on Non-GAAP Financial Measures.See page 20 for GAAP Reconciliations.

DOMINION RESOURCES 2010 Summary Annual Report
14
Between 2011 and 2015, we have plans for $10-plus
billion in growth capital expenditures, not including
potential environmental spending of nearly $2 billion
for power stations serving Virginia and North Carolina.
Of the planned growth capital expenditures, 99
percent is budgeted for regulated infrastructure in our
electric service area and in regulated gas businesses.
Dominion must invest in such infrastructure for three
principal reasons.
First, we are anticipating demand growth at our
electric utility. Although new connects dropped to
about 27,000 in 2010, the utility has historically con-
nected 48,000 new customer accounts each year. PJM
Interconnection, a transmission grid operator serving
all or parts of 13 states and the District of Columbia,
reports that the Dominion Zone has the highest ex-
pected electric load growth rate — 2.1 percent per year
— of the 20 zones it operates. It further forecasts that
over the next decade peak demand growth in Virginia
will be the equivalent of adding 1.1 million additional
homes to our system.
Second, enormous gas deposit finds in the Mar-
cellus Shale have started a production rush in West
Virginia and Pennsylvania. Although we sold our
E&P business, we plan to help producers by investing
at least $850 million in infrastructure to bring their
Marcellus gas to market.
Third, gas and electric distribution systems in Vir-
ginia, North Carolina, Ohio and West Virginia need
to be upgraded and modernized. These aging wires
and pipes must continue to serve customers without
interruption and to connect new customers as energy
demand grows.
POWERING VIRGINIA
As I have stated in previous letters, Virginia is one
of the best states for business, according to both
CNBC and Forbes.com. The state is home to many of
America’s largest military installations, and serves half
the nation’s Internet flow. Because of its proximity to
Washington, D.C., Virginia continues to be largely
recession-resistant. Its economy continues to grow.
Three-quarters of our anticipated growth capital
expenditures from 2011 to 2015 — or approximately
$7.4 billion — is slated for generation, transmission
and distribution in the electric utility service area. That
figure excludes the more than $5.5 billion already
spent from 2006 to 2010 to satisfy demand growth in
Virginia and North Carolina.
The list of major projects currently in development
or under construction follows. All of these qualify for
enhanced returns on generation, transmission and
distribution investments either as part of the regula-

2010 Summary Annual Report DOMINION RESOURCES
15
Regulated Infrastructure Investment Dollars in Billions
Cumulative Planned Growth Capital Expenditures*
2.1
4.8
6.8
8.3
10.1
2011 2012 2013 2014 2015
*All planned expenditures are preliminary and may be subject to regulatory and/orBoard of Directors approvals.
tory compact in Virginia or from the Federal Energy
Regulatory Commission:
Virginia City Hybrid Energy Center in Southwest
Virginia, a $1.8 billion, 585-megawatt coal- and
biomass-fired station. As of January 2011, it was 79
percent complete and expected to be operational in
summer 2012. Virginia City construction is on time
and on budget.
Bear Garden, a $619 million, 580-megawatt natural
gas-fired combined cycle facility. As of January 2011,
it was 94 percent complete and is expected to be in
service in the second quarter of this year. It too is on
time and on budget.
Warren County, a natural gas-fired combined-cycle
facility that could supply more than 1,300 megawatts.
Dominion received the required air permit in Decem-
ber 2010. During the air permit process, the company
reached an accord with the National Park Service
by addressing environmental considerations for the
nearby Shenandoah National Park. By the time War-
ren County enters service in late 2014 or early 2015, as
part of the air permit process, Dominion plans to have
closed its coal-fired North Branch facility, a 74-mega-
watt station in West Virginia.
Renewable generation, including solar, onshore and
offshore wind and biomass. Dominion is in the early
stages of developing a 4-megawatt solar facility in Hali-
fax County and is evaluating biomass, onshore wind
farms in Virginia and offshore wind farms.
Major electric transmission lines — the Meadow
Brook to Loudoun line and Carson to Suffolk line —
which are on schedule to be in service mid-year 2011.
Two phases of the former are complete and operation-
al. Work continues on the third phase. As of January
2011, the latter was 60 percent complete. Combined,
the two 500-kilovolt lines cost $479 million. Both
projects are on time and on budget.
Mount Storm to Doubs, a project to rebuild an aging
500-kilovolt line running through Northern Virginia,
West Virginia and Maryland. PJM has recommended
that the line be rebuilt to alleviate transmission conges-
tion. We filed an application with the State Corpora-
tion Commission in January 2011. The line is expected
to be completed in 2015.
Projected Environmental Spending (Cumulative)* Dollars in Billions
2.93.4
4.34.9 5.1
2011 2012 2013 2014 2015
*All planned expenditures are preliminary and may be subject to regulatory and/orBoard of Directors approvals.
$2.5 billion spent 1998-2010.
DOMINION RESOURCES 2010 Summary Annual Report
16
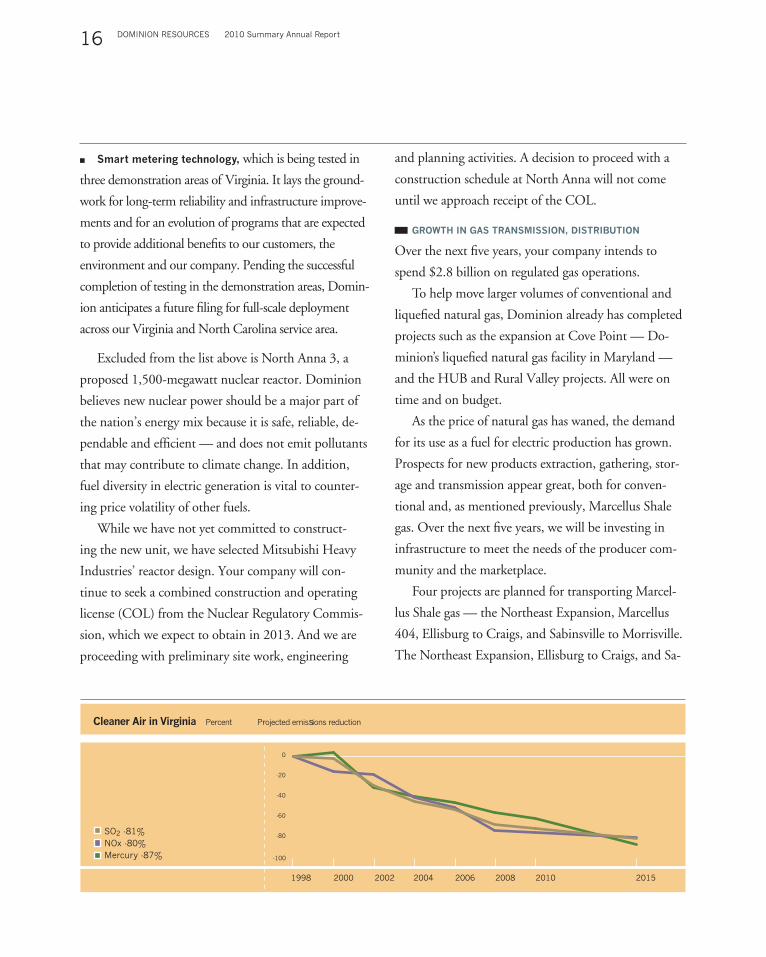
Cleaner Air in Virginia Percent Projected emissions reduction
2006 20102008 20151998 2000 20042002
SO2 -81%
NOx -80%
Mercury -87% -100
-80
-60
-40
-20
0
Smart metering technology, which is being tested in
three demonstration areas of Virginia. It lays the ground-
work for long-term reliability and infrastructure improve-
ments and for an evolution of programs that are expected
to provide additional benefits to our customers, the
environment and our company. Pending the successful
completion of testing in the demonstration areas, Domin-
ion anticipates a future filing for full-scale deployment
across our Virginia and North Carolina service area.
Excluded from the list above is North Anna 3, a
proposed 1,500-megawatt nuclear reactor. Dominion
believes new nuclear power should be a major part of
the nation’s energy mix because it is safe, reliable, de-
pendable and efficient — and does not emit pollutants
that may contribute to climate change. In addition,
fuel diversity in electric generation is vital to counter-
ing price volatility of other fuels.
While we have not yet committed to construct-
ing the new unit, we have selected Mitsubishi Heavy
Industries’ reactor design. Your company will con-
tinue to seek a combined construction and operating
license (COL) from the Nuclear Regulatory Commis-
sion, which we expect to obtain in 2013. And we are
proceeding with preliminary site work, engineering
and planning activities. A decision to proceed with a
construction schedule at North Anna will not come
until we approach receipt of the COL.
GROWTH IN GAS TRANSMISSION, DISTRIBUTION
Over the next five years, your company intends to
spend $2.8 billion on regulated gas operations.
To help move larger volumes of conventional and
liquefied natural gas, Dominion already has completed
projects such as the expansion at Cove Point — Do-
minion’s liquefied natural gas facility in Maryland —
and the HUB and Rural Valley projects. All were on
time and on budget.
As the price of natural gas has waned, the demand
for its use as a fuel for electric production has grown.
Prospects for new products extraction, gathering, stor-
age and transmission appear great, both for conven-
tional and, as mentioned previously, Marcellus Shale
gas. Over the next five years, we will be investing in
infrastructure to meet the needs of the producer com-
munity and the marketplace.
Four projects are planned for transporting Marcel-
lus Shale gas — the Northeast Expansion, Marcellus
404, Ellisburg to Craigs, and Sabinsville to Morrisville.
The Northeast Expansion, Ellisburg to Craigs, and Sa-
2010 Summary Annual Report DOMINION RESOURCES
17
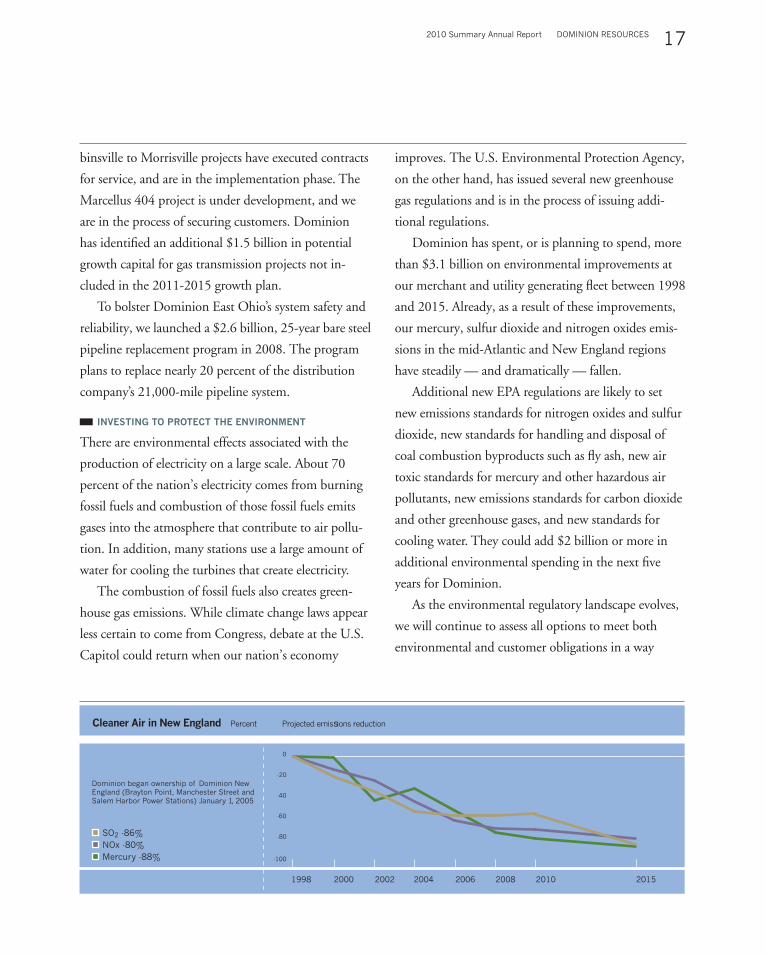
Cleaner Air in New England Percent Projected emissions reduction
Dominion began ownership of Dominion New
England (Brayton Point, Manchester Street and
Salem Harbor Power Stations) January 1, 2005
2006 20102008 20151998 2000 20042002
SO2 -86%
NOx -80%
Mercury -88% -100
-80
-60
-40
-20
0
binsville to Morrisville projects have executed contracts
for service, and are in the implementation phase. The
Marcellus 404 project is under development, and we
are in the process of securing customers. Dominion
has identified an additional $1.5 billion in potential
growth capital for gas transmission projects not in-
cluded in the 2011-2015 growth plan.
To bolster Dominion East Ohio’s system safety and
reliability, we launched a $2.6 billion, 25-year bare steel
pipeline replacement program in 2008. The program
plans to replace nearly 20 percent of the distribution
company’s 21,000-mile pipeline system.
INVESTING TO PROTECT THE ENVIRONMENT
There are environmental effects associated with the
production of electricity on a large scale. About 70
percent of the nation’s electricity comes from burning
fossil fuels and combustion of those fossil fuels emits
gases into the atmosphere that contribute to air pollu-
tion. In addition, many stations use a large amount of
water for cooling the turbines that create electricity.
The combustion of fossil fuels also creates green-
house gas emissions. While climate change laws appear
less certain to come from Congress, debate at the U.S.
Capitol could return when our nation’s economy
improves. The U.S. Environmental Protection Agency,
on the other hand, has issued several new greenhouse
gas regulations and is in the process of issuing addi-
tional regulations.
Dominion has spent, or is planning to spend, more
than $3.1 billion on environmental improvements at
our merchant and utility generating fleet between 1998
and 2015. Already, as a result of these improvements,
our mercury, sulfur dioxide and nitrogen oxides emis-
sions in the mid-Atlantic and New England regions
have steadily — and dramatically — fallen.
Additional new EPA regulations are likely to set
new emissions standards for nitrogen oxides and sulfur
dioxide, new standards for handling and disposal of
coal combustion byproducts such as fly ash, new air
toxic standards for mercury and other hazardous air
pollutants, new emissions standards for carbon dioxide
and other greenhouse gases, and new standards for
cooling water. They could add $2 billion or more in
additional environmental spending in the next five
years for Dominion.
As the environmental regulatory landscape evolves,
we will continue to assess all options to meet both
environmental and customer obligations in a way
DOMINION RESOURCES 2010 Summary Annual Report
18
Dominion believes that
rewarding those who own our
company and are a large part
of its success is important.
In sum, our board agrees that
increasing the dividend is the
right thing to do.
that serves the best interests of our shareholders and
customers. This may involve installation of additional
control equipment, potential early retirement of units,
and/or new build or fuel-conversion options.
One example of our environmental spending will
be on display this year, when the 500-foot tall cooling
towers at the Brayton Point Power Station in Massa-
chusetts begin to become operational. The closed-loop
cooling towers are designed to reduce water usage in
the Mount Hope Bay by more than 90 percent. Unlike
at many power stations across the country, we had the
flexibility — and the land — to add cooling towers
and other environmental equipment, such as scrubbers,
at Brayton.
OUTLOOK FOR 2011, 2012
Considering all these factors, our guidance for 2011
anticipates operating earnings in the range of $3.00 per
share to $3.30 per share.*
Principal reasons for lower earnings per share guid-
ance in 2011 as compared to 2010 include several
major merchant power stations being taken offline for
maintenance, refueling and environmental equipment
tie-ins and historically low commodity prices. Indeed,
it is possible that 2011 could result in Dominion’s first
year-over-year operating earnings per share decline
since 2005.
At this time, your company expects from 5 to 6
percent earnings growth in 2012 and beyond as a result
of fewer merchant outages, commodity price increases,
rising energy demand, and construction and operation
of new infrastructure in regulated businesses, such as
electric utility generation, transmission and distribu-
tion and gas transmission and distribution.
FOCUS ON DIVIDENDS
In October 2007, the board set a goal of achieving a
55 percent dividend payout ratio by 2010. Dominion’s
dividend payout ratio in 2010, based on operating
earnings, was 55 percent.**
With the continued transition to a regulated model
and the greater predictability that comes from a higher
proportion of cash flow and earnings from regulated
operations, in December 2010 the board set a new
dividend policy to pay out 60 to 65 percent of operat-
ing earnings per share to shareholders. The board also
increased the annual dividend rate by 14 cents per
share — from $1.83 per share in 2010 to $1.97 per
share in 2011 — subject to quarterly approval by the
directors. As investors view our company as more of a
* See page 20 for GAAP Reconciliation of 2011 OperatingEarnings Guidance.
** See page 20 for GAAP Reconciliation of Operating Dividend PayoutRatio (non-GAAP) to Reported Dividend Payout Ratio (GAAP).

2010 Summary Annual Report DOMINION RESOURCES
19
regulated company, our dividend payout ratio should
more closely track that of our regulated peer utilities.
While all dividend declarations are subject to board
approval, in light of the 60 to 65 percent payout policy
and our earnings growth expectations, you should
expect dividend increases to remain consistent with 5
to 6 percent earnings growth in 2012 and beyond.
We strongly believe that growth in our core regu-
lated businesses fuels the need for a dividend increase
— even in a year in which operating earnings per share
could fall from the previous year. Among the reasons:
First, remember that the company views 2011 as
an anomaly. We expect commodity prices — and,
consequently, New England power prices — to hit a
bottom. We expect to refuel all three of our merchant
nuclear reactors, tie in two cooling towers to two units
at Brayton, and perform maintenance on turbines at
the gas-fired Fairless Energy facility near Philadelphia,
which has operated more than expected because of low
natural gas costs. Second, consistent with the 2006
plan to transform Dominion, we are changing the
profile of investment in our company.
Dominion believes that rewarding those who
own our company and are a large part of its success is
important. In sum, our board agrees that increasing the
dividend is the right thing to do.
THANK YOU
In what has been a year of change — and for Domin-
ion, five years of change — your company continued
its transformation into a more regulated company, a
company whose earnings are less tied to the vagaries
of the commodity markets and more to constructive
regulatory structures that recognize the need to build
infrastructure now to meet future demand. We have
met earnings targets and increased the dividend. We
have sold operations that did not fit what we see as
part of the Dominion of tomorrow.
While last year was a great year, 2011 could be a
tough one. But our employees and shareholders have
confidence that Dominion will rise to the challenge.
During the five years of Dominion’s transforma-
tion, we did what we said we would do, and did it
well — thanks in large part to our 16,000 employees
and your confidence in our transformation and growth
plan. You have good reason to remain confident in
your company’s direction.
In 2011, this new Dominion will build on five
years of stable, predictable earnings, a solid dividend,
and promises fulfilled. We are poised to grow, and do
so holding steadfast to our core values.
Sincerely,
Thomas F. Farrell II
Chairman, President and CEO
DOMINION RESOURCES 2010 Summary Annual Report
20
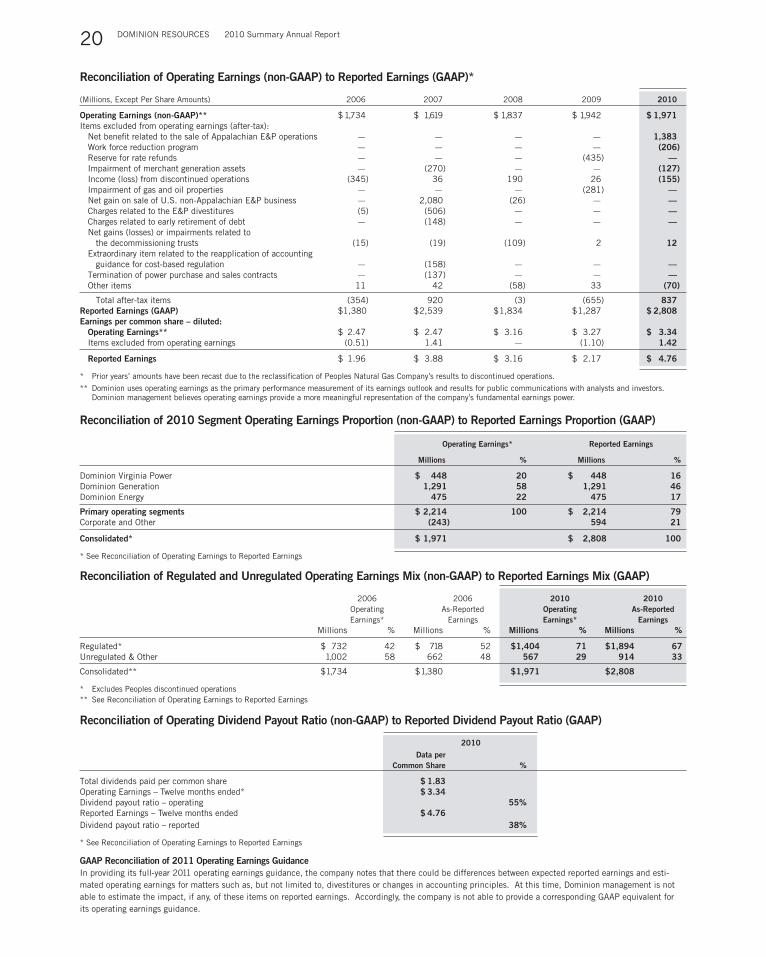
Reconciliation of 2010 Segment Operating Earnings Proportion (non-GAAP) to Reported Earnings Proportion (GAAP)
Operating Earnings* Reported Earnings
Millions % Millions %
Dominion Virginia Power $ 448 20 $ 448 16Dominion Generation 1,291 58 1,291 46Dominion Energy 475 22 475 17
Primary operating segments $ 2,214 100 $ 2,214 79Corporate and Other (243) 594 21
Consolidated* $ 1,971 $ 2,808 100
* See Reconciliation of Operating Earnings to Reported Earnings
Reconciliation of Operating Earnings (non-GAAP) to Reported Earnings (GAAP)*
(Millions, Except Per Share Amounts) 2006 2007 2008 2009 2010
Operating Earnings (non-GAAP)** $1,734 $ 1,619 $ 1,837 $ 1,942 $ 1,971Items excluded from operating earnings (after-tax):
Net benefit related to the sale of Appalachian E&P operations — — — — 1,383Work force reduction program — — — — (206)Reserve for rate refunds — — — (435) —Impairment of merchant generation assets — (270) — — (127)Income (loss) from discontinued operations (345) 36 190 26 (155)Impairment of gas and oil properties — — — (281) —Net gain on sale of U.S. non-Appalachian E&P business — 2,080 (26) — —Charges related to the E&P divestitures (5) (506) — — —Charges related to early retirement of debt — (148) — — —Net gains (losses) or impairments related to
the decommissioning trusts (15) (19) (109) 2 12Extraordinary item related to the reapplication of accounting
guidance for cost-based regulation — (158) — — —Termination of power purchase and sales contracts — (137) — — —Other items 11 42 (58) 33 (70)
Total after-tax items (354) 920 (3) (655) 837Reported Earnings (GAAP) $1,380 $2,539 $1,834 $1,287 $ 2,808Earnings per common share – diluted:
Operating Earnings** $ 2.47 $ 2.47 $ 3.16 $ 3.27 $ 3.34Items excluded from operating earnings (0.51) 1.41 — (1.10) 1.42
Reported Earnings $ 1.96 $ 3.88 $ 3.16 $ 2.17 $ 4.76
* Prior years’ amounts have been recast due to the reclassification of Peoples Natural Gas Company’s results to discontinued operations.
** Dominion uses operating earnings as the primary performance measurement of its earnings outlook and results for public communications with analysts and investors.Dominion management believes operating earnings provide a more meaningful representation of the company’s fundamental earnings power.
Reconciliation of Operating Dividend Payout Ratio (non-GAAP) to Reported Dividend Payout Ratio (GAAP)
2010Data per
Common Share %
Total dividends paid per common share $ 1.83Operating Earnings – Twelve months ended* $ 3.34Dividend payout ratio – operating 55%Reported Earnings – Twelve months ended $ 4.76Dividend payout ratio – reported 38%
* See Reconciliation of Operating Earnings to Reported Earnings
GAAP Reconciliation of 2011 Operating Earnings GuidanceIn providing its full-year 2011 operating earnings guidance, the company notes that there could be differences between expected reported earnings and esti-mated operating earnings for matters such as, but not limited to, divestitures or changes in accounting principles. At this time, Dominion management is notable to estimate the impact, if any, of these items on reported earnings. Accordingly, the company is not able to provide a corresponding GAAP equivalent forits operating earnings guidance.
Reconciliation of Regulated and Unregulated Operating Earnings Mix (non-GAAP) to Reported Earnings Mix (GAAP)
2006 2006 2010 2010Operating As-Reported Operating As-ReportedEarnings* Earnings Earnings* Earnings
Millions % Millions % Millions % Millions %
Regulated* $ 732 42 $ 718 52 $1,404 71 $1,894 67Unregulated & Other 1,002 58 662 48 567 29 914 33
Consolidated** $1,734 $1,380 $1,971 $2,808
* Excludes Peoples discontinued operations** See Reconciliation of Operating Earnings to Reported Earnings

2010 Summary Annual Report DOMINION RESOURCES
21
DIRECTORS*
William P. BarrFormer Attorney Generalof the United Statesand RetiredExecutive Vice Presidentand General Counsel,Verizon Communications, Inc.
Peter W. Brown, M.D.Physician,Virginia SurgicalAssociates, P.C.
George A. Davidson, Jr.Retired Chairman,Dominion Resources, Inc.
Helen E. DragasPresident andChief Executive Officer,The Dragas Companies(real estate development firm)
Thomas F. Farrell IIChairman, President andChief Executive Officer,Dominion Resources, Inc.
John W. HarrisPresident andChief Executive Officer,Lincoln Harris LLC(real estate consulting firm)
*As of February 1, 2011
Robert S. Jepson, Jr.Chairman andChief Executive Officer,Jepson Associates, Inc.(private investments)
Mark J. KingtonManaging Director,X-10 CapitalManagement, LLC(investments)
Margaret A. McKennaPresident,The Wal-Mart Foundation
Frank S. Royal, M.D.Healthcare Professional andPhysician
Robert H. Spilman, Jr.President andChief Executive Officer,Bassett Furniture Industries
David A. WollardFounding Chairmanof the Board, Emeritus,Exempla Healthcare
Dominion Board of Directors (left-to-right) – back row: Robert H. Spilman, Jr., Mark J. Kington,Robert S. Jepson, Jr.; middle row: William P. Barr, George A. Davidson, Jr., Helen E. Dragas, John W.Harris, Peter W. Brown, M.D.; front row: Frank S. Royal, M.D., Thomas F. Farrell II, David A.Wollard, Margaret A. McKenna
DOMINION RESOURCES 2010 Summary Annual Report
22
SHAREHOLDER INFORMATION
Dominion Resources Services, Inc. is the transfer agentand registrar for Dominion’s common stock. Our Share-holder Services staff provides personal assistance for anyinquiries Monday through Friday from 9 a.m. to noonand from 1 p.m. to 4 p.m. (ET). In addition, automatedinformation is available 24 hours a day through ourvoice-response system.
1 (800) 552-4034 (toll-free) 1 (804) 775-2500
Major press releases and other company information maybe obtained by visiting our website at www.dom.com.Registered shareholders also may obtain account-specificinformation by visiting this site. To sign up for this ser-vice, visit www.dom.com, click “Investors” and then“Access Your Account Online.” Once you have accessedthe sign-in page, click “First Time Visitor” in the upper-left corner of the screen and follow the directions for“New Member Sign Up.” After you have signed up, youwill be able to monitor your account, make changesand review your Dominion Activity Statements at yourconvenience.
Direct Stock Purchase Plan
You may buy Dominion common stock through Do-minion Direct®. Please contact Shareholder Services for aprospectus and enrollment form or visit www.dom.comand click “Investors,” and then select “Dominion Direct.”
Common Stock Listing
New York Stock Exchange Trading symbol: D
Common Stock Price Range
2010 2009
High Low High Low
First Quarter $ 41.61 $ 36.12 $ 37.18 $ 27.15
Second Quarter 42.56 38.05 33.93 28.70
Third Quarter 44.94 38.59 34.84 32.10
Fourth Quarter 45.12 41.13 39.79 33.15
Year $ 45.12 $ 36.12 $ 39.79 $ 27.15
Dividends on Dominion common stock are paid asdeclared by the board. Dominion paid 45.75 cents pershare in each quarter of 2010. Dividends are typi-cally paid on the 20th of March, June, September andDecember. Dividends can be paid by check or electronicdeposit, or they may be reinvested.
EXECUTIVE LEADERSHIP
OTHER SENIOR LEADERS
Thomas F. Farrell II*Chairman, President andChief Executive Officer
Mark F. McGettrick*Executive Vice President andChief Financial Officer
Paul D. Koonce*Executive Vice President andChief Executive Officer,Dominion Virginia Power
David A. Christian*Chief Executive Officer,Dominion Generation
Gary L. Sypolt*Chief Executive Officer,Dominion Energy
David A. Heacock*President andChief Nuclear Officer,Dominion Nuclear
M. Stuart BoltonSenior Vice President,Dominion Resources Services
G. Scott HetzerSenior Vice President,Tax and Treasurer
M.E. “Lyn” McDermidSenior Vice President andChief Information Officer,Dominion Resources Services
Charles E. RobertsSenior Vice President,Producer Services,Dominion Resources Services
Thomas P. WohlfarthSenior Vice President,State Electric Regulation,Dominion Resources Services
Robert M. Blue*Senior Vice President,Law, Public Policyand Environment
Mary C. DoswellSenior Vice President,Alternative Energy Solutions,Dominion Resources Services
James K. MartinSenior Vice President,Regulatory Affairs,Dominion Resources Services
Steven A. Rogers*Senior Vice President andChief Administrative Officer
Carter M. ReidVice President, General Counseland Corporate Secretary
Ashwini Sawhney*Vice President, Accounting andController
Anne E. BomarSenior Vice President andGeneral Manager,Dominion East Ohio
Diane G. LeopoldSenior Vice President,Business Development andGeneration Construction,Dominion Generation
J. David RivesSenior Vice President,Fossil and Hydro,Dominion Generation
Paul E. RuppertSenior Vice President,Dominion Transmission
Fred G. Wood, IIISenior Vice President,Financial Management,Dominion Generation
As of February 1, 2011*Executive Officer pursuant to Securities and Exchange Commission rules
Annual Meeting
This year’s Annual Meeting of Shareholders of DominionResources, Inc., will be held Thursday, May 12, at9:30 a.m. (ET) at The Boar’s Head Inn, 200 EdnamDrive, Charlottesville, Virginia.
Performance Graph
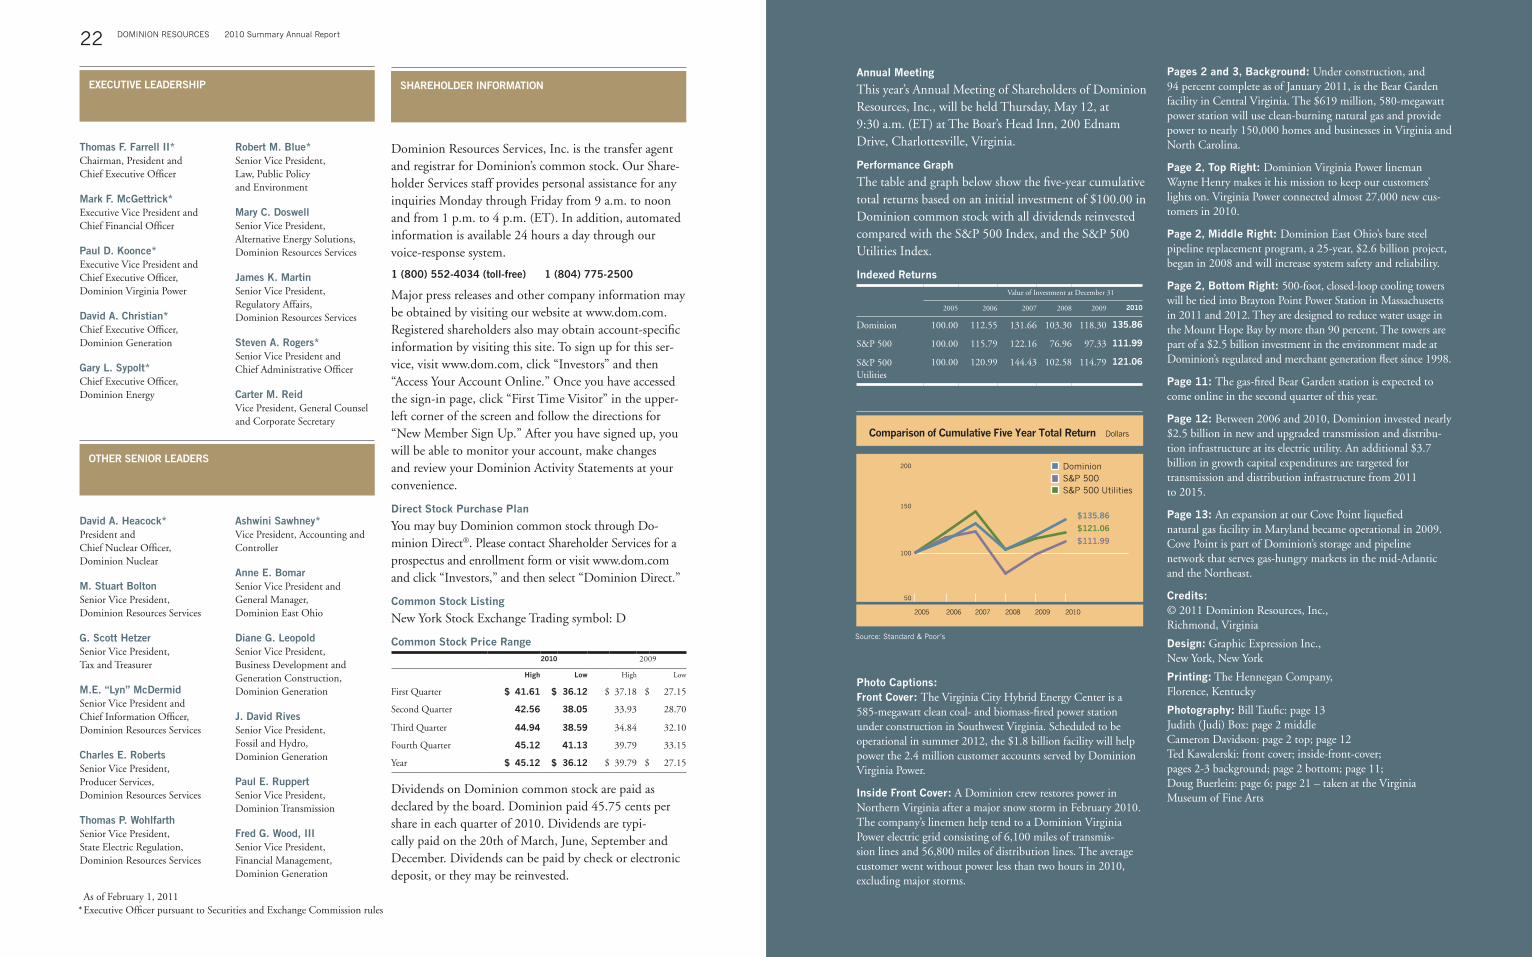
The table and graph below show the five-year cumulativetotal returns based on an initial investment of $100.00 inDominion common stock with all dividends reinvestedcompared with the S&P 500 Index, and the S&P 500Utilities Index.
Indexed Returns
Value of Investment at December 31
2005 2006 2007 2008 2009 2010
Dominion 100.00 112.55 131.66 103.30 118.30 135.86
S&P 500 100.00 115.79 122.16 76.96 97.33 111.99
S&P 500Utilities
100.00 120.99 144.43 102.58 114.79 121.06
Photo Captions:
Front Cover: The Virginia City Hybrid Energy Center is a585-megawatt clean coal- and biomass-fired power stationunder construction in Southwest Virginia. Scheduled to beoperational in summer 2012, the $1.8 billion facility will helppower the 2.4 million customer accounts served by DominionVirginia Power.
Inside Front Cover: A Dominion crew restores power inNorthern Virginia after a major snow storm in February 2010.The company’s linemen help tend to a Dominion VirginiaPower electric grid consisting of 6,100 miles of transmis-sion lines and 56,800 miles of distribution lines. The averagecustomer went without power less than two hours in 2010,excluding major storms.
Pages 2 and 3, Background: Under construction, and94 percent complete as of January 2011, is the Bear Gardenfacility in Central Virginia. The $619 million, 580-megawattpower station will use clean-burning natural gas and providepower to nearly 150,000 homes and businesses in Virginia andNorth Carolina.
Page 2, Top Right: Dominion Virginia Power linemanWayne Henry makes it his mission to keep our customers’lights on. Virginia Power connected almost 27,000 new cus-tomers in 2010.
Page 2, Middle Right: Dominion East Ohio’s bare steelpipeline replacement program, a 25-year, $2.6 billion project,began in 2008 and will increase system safety and reliability.
Page 2, Bottom Right: 500-foot, closed-loop cooling towerswill be tied into Brayton Point Power Station in Massachusettsin 2011 and 2012. They are designed to reduce water usage inthe Mount Hope Bay by more than 90 percent. The towers arepart of a $2.5 billion investment in the environment made atDominion’s regulated and merchant generation fleet since 1998.
Page 11: The gas-fired Bear Garden station is expected tocome online in the second quarter of this year.
Page 12: Between 2006 and 2010, Dominion invested nearly$2.5 billion in new and upgraded transmission and distribu-tion infrastructure at its electric utility. An additional $3.7billion in growth capital expenditures are targeted fortransmission and distribution infrastructure from 2011to 2015.
Page 13: An expansion at our Cove Point liquefiednatural gas facility in Maryland became operational in 2009.Cove Point is part of Dominion’s storage and pipelinenetwork that serves gas-hungry markets in the mid-Atlanticand the Northeast.
Credits:
© 2011 Dominion Resources, Inc.,Richmond, Virginia
Design: Graphic Expression Inc.,New York, New York
Printing: The Hennegan Company,Florence, Kentucky
Photography: Bill Taufic: page 13Judith (Judi) Box: page 2 middleCameron Davidson: page 2 top; page 12Ted Kawalerski: front cover; inside-front-cover;pages 2-3 background; page 2 bottom; page 11;Doug Buerlein: page 6; page 21 – taken at the VirginiaMuseum of Fine Arts
20102005
100
150
200
50
$135.86
$111.99
$121.06
2006 2007 2008 2009
Dominion
S&P 500
S&P 500 Utilities
Source: Standard & Poor’s
Comparison of Cumulative Five Year Total Return Dollars
Shareholder Inquiries
[email protected] Resources Services, Inc.Shareholder ServicesP.O. Box 26532Richmond, Virginia23261-6532
Corporate Street Address
Dominion Resources, Inc.120 Tredegar StreetRichmond, Virginia 23219
Mailing Address
Dominion Resources, Inc.P.O. Box 26532Richmond, Virginia23261-6532
Website
www.dom.com
Independent Registered
Public Accounting Firm
Deloitte & Touche LLPRichmond, Virginia
Additional Information
Copies of Dominion’s Sum-mary Annual Report, ProxyStatement and reports onForm 10-K, Form 10-Q andForm 8-K are available with-out charge. These items may
be viewed by visitingwww.dom.com, or requestsfor these items can be madeby writing to:
Corporate SecretaryDominion Resources, Inc.P.O. Box 26532Richmond, Virginia23261-6532
![Consulte la página 5 para la identificación de modelos ...docs.alliancelaundry.com/tech_pdf/Production/FR004028CO.pdf458 mm [18,02 plg] 144 mm [5,66 plg] 68 mm [2,67 plg] 1794 mm](https://img.pdfslide.us/doc/110x75/5af86ed27f8b9aac248d1d73/consulte-la-pgina-5-para-la-identificacin-de-modelos-docs-mm-1802-plg-144.jpg)