Embed Size (px)
Citation preview
score/fold
score/fold
08
The Longitudinal Study of Indigenous ChildrenFootprints in Time
20
Key Summary Report from Wave 1

The Longitudinal Study of Indigenous ChildrenFootprints in TimeKey Summary Report from Wave 1
Initiated, funded and managed by the Australian Government Department of Families,
Housing, Community Services and Indigenous Affairs
© Commonwealth of Australia 2009
ISBN 9781 921647 116
This work is copyright. You may download, display, print and reproduce this material in unaltered form only (retaining this notice) for your personal, non-commercial use or use within your organisation. Apart from any use as permitted under the Copyright Act 1968, all other rights are reserved.
Requests and enquiries concerning reproduction and rights should be addressed to:
Commonwealth Copyright Administration Attorney-General’s Department Robert Garran Offices National Circuit Barton ACT 2600
OR posted at www.ag.gov.au/cca
This report should be cited as:
Department of Families, Housing, Community Services and Indigenous Affairs 2009, Footprints in Time: The Longitudinal Study of Indigenous Children—Key Summary Report from Wave 1, FaHCSIA, Canberra
Aboriginal and Torres Strait Islander peoples are warned that this report may contain photos of deceased persons.
The photos of families and children used in the Report are taken from families participating in the study. Written permission to use these photos has been obtained in all instances.
Cover Photos
Top right: Methraima and Debah Fauid Top centre: Kadisha and Brook Tyson Top left: Cheenoa Bower Second left: Mathias Andrews Third left: Malaki Thomas Bottom left: Bradley Mumbulla
Minister’s foreword 2
Chair’s foreword 3
Steering Committee and Subcommittees 4
What is Footprints in Time? 6
Highlights from Wave 1 21
Family life: household, culture and language 22
Growing up strong: health, nutrition and development 31
Learning and doing: activities and early education 37
Strong souls, safe communities: wellbeing, resilience and support 41
Future directions and access to data 48
Acknowledgments 52
References 54
Contents
Footprints in Time: The Longitudinal Study of Indigenous Children | Key Summary Report from Wave 12
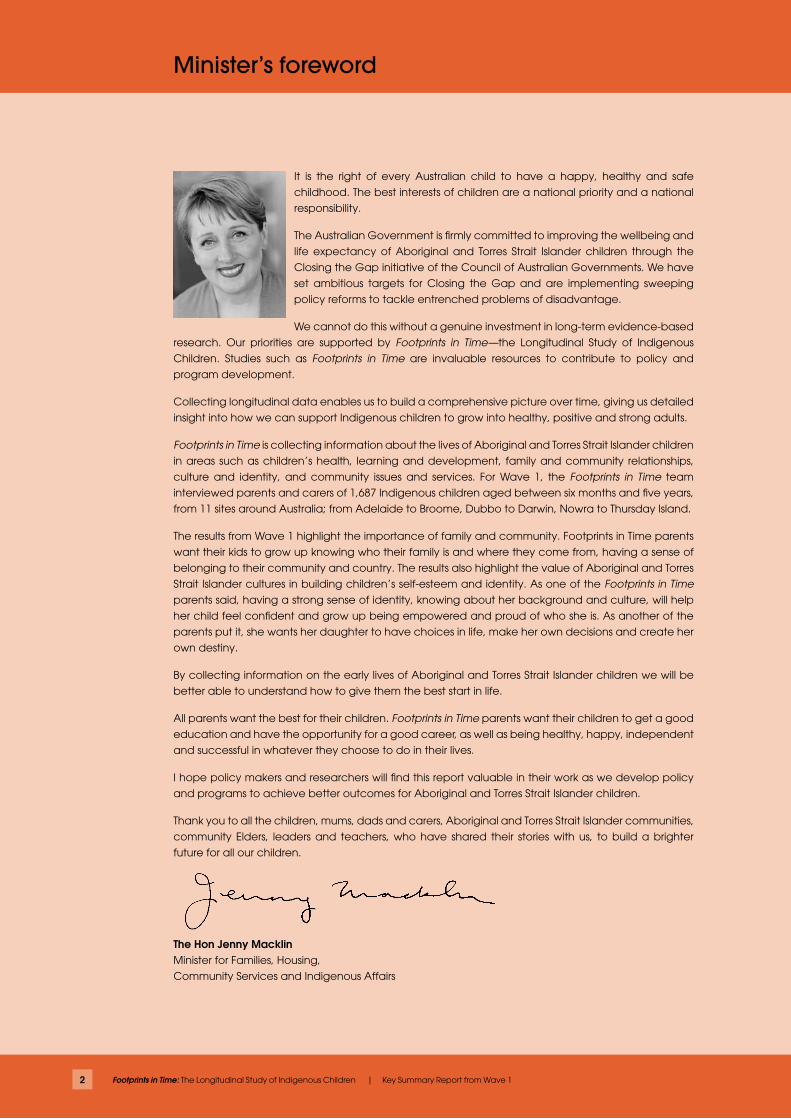
Minister’s foreword
It is the right of every Australian child to have a happy, healthy and safe
childhood. The best interests of children are a national priority and a national
responsibility.
The Australian Government is firmly committed to improving the wellbeing and
life expectancy of Aboriginal and Torres Strait Islander children through the
Closing the Gap initiative of the Council of Australian Governments. We have
set ambitious targets for Closing the Gap and are implementing sweeping
policy reforms to tackle entrenched problems of disadvantage.
We cannot do this without a genuine investment in long-term evidence-based
research. Our priorities are supported by Footprints in Time—the Longitudinal Study of Indigenous
Children. Studies such as Footprints in Time are invaluable resources to contribute to policy and
program development.
Collecting longitudinal data enables us to build a comprehensive picture over time, giving us detailed
insight into how we can support Indigenous children to grow into healthy, positive and strong adults.
Footprints in Time is collecting information about the lives of Aboriginal and Torres Strait Islander children
in areas such as children’s health, learning and development, family and community relationships,
culture and identity, and community issues and services. For Wave 1, the Footprints in Time team
interviewed parents and carers of 1,687 Indigenous children aged between six months and five years,
from 11 sites around Australia; from Adelaide to Broome, Dubbo to Darwin, Nowra to Thursday Island.
The results from Wave 1 highlight the importance of family and community. Footprints in Time parents
want their kids to grow up knowing who their family is and where they come from, having a sense of
belonging to their community and country. The results also highlight the value of Aboriginal and Torres
Strait Islander cultures in building children’s self-esteem and identity. As one of the Footprints in Time
parents said, having a strong sense of identity, knowing about her background and culture, will help
her child feel confident and grow up being empowered and proud of who she is. As another of the
parents put it, she wants her daughter to have choices in life, make her own decisions and create her
own destiny.
By collecting information on the early lives of Aboriginal and Torres Strait Islander children we will be
better able to understand how to give them the best start in life.
All parents want the best for their children. Footprints in Time parents want their children to get a good
education and have the opportunity for a good career, as well as being healthy, happy, independent
and successful in whatever they choose to do in their lives.
I hope policy makers and researchers will find this report valuable in their work as we develop policy
and programs to achieve better outcomes for Aboriginal and Torres Strait Islander children.
Thank you to all the children, mums, dads and carers, Aboriginal and Torres Strait Islander communities,
community Elders, leaders and teachers, who have shared their stories with us, to build a brighter
future for all our children.
The Hon Jenny Macklin Minister for Families, Housing,
Community Services and Indigenous Affairs
3
Every child deserves a chance at happiness and the opportunity
to realise their potential for a fulfilling and useful life. We all know
that children need more than just a roof over their heads—love,
understanding and encouragement are just as important.
This study, the Longitudinal Study of Indigenous Children, Footprints in Time, looks at the lives of Aboriginal and Torres Strait Islander children
and their families and the ways their culture keeps them strong and
healthy. We know that how people feel about themselves, whether
they feel valued and respected, has a whole lot to do with how they
handle problems.
By the time I was 10, both my parents had passed away and I went to live with relatives in
Darwin and eventually to boarding school in Western Victoria. My last nine years of schooling I
spent with the ‘Micks’ and it was an excellent education. It not only prepared me for university,
but made me ready, if a bit raw, idealistic and naïve, for life! It is clear from much previous
research that, for many Indigenous children, by the time they are 10, they are too far behind
their peers to ever catch up. By 15, the game is over. How do you count the cost—to the
children, to their communities, to this country? The shame is not in failing; it’s in not even trying.
Speaking to black American parents, US President Barack Obama said:
“One of the most destructive legacies of discrimination is the way that we have internalised a sense of limitation; how so many in our community have come to expect so little from ourselves. We have to say to our children, ‘Yes, if you live in a poor neighbourhood you will face some challenges, but that’s not a reason to give up on your education and drop out of school… No-one has written your destiny for you. Your destiny is in your hands.”
We have to challenge the ‘watered down’ expectations of our children. Our kids have to see
that they are stronger and smarter than this society has so far given them credit for and help
them to cultivate an Aboriginal and Torres Strait Islander identity that is strong and smart. We
all need to recognise that children’s sense of themselves as Aboriginal people—who they are
and where they come from—is of both practical and spiritual value. In bestowing identity we
also bestow dignity. It is a good deal more than symbolic—it has profound practical effects.
There are plenty of examples of Indigenous success; we just have to recognise it and replicate
it. We have to get rid of the ‘start again’ syndrome—whereby every new government starts
again from the beginning with little understanding of what has gone before—that has a lot
to do with politics and nothing to do with evidence. We have to see evidence of success
as points of light all around us and join them up to create a universe of opportunity for our
children. These results from the first wave of Footprints in Time data provide more points of light.
I hope you find them useful.
Professor Mick Dodson AM Chair
Steering Committee
Longitudinal Study of Indigenous Children
Chair’s foreword
4 Footprints in Time: The Longitudinal Study of Indigenous Children | Key Summary Report from Wave 1
Steering Committee and Subcommittees
Professor Mick Dodson AM, National Centre for Indigenous Studies (ANU) (Chair)
Ms Adele Cox, Consultant
Ms Carol Ey, Branch Manager, Research and Analysis Branch, FaHCSIA
Ms Jill Guthrie, Australian Institute of Aboriginal and Torres Strait Islander Studies
Dr Sarah Holcombe, National Centre for Indigenous Studies (ANU)
Dr Boyd Hunter, Centre for Aboriginal Economic Policy Research (ANU)
Dr Karen Martin, Associate Professor, Early Childhood, School of Education, Southern Cross
University, Lismore
Mr Shane Merritt, University of New England
Mr Frank Hytten, Secretariat of National Aboriginal and Islander Child Care
Professor Ann Sanson, University of Melbourne
Professor Sven Silburn, Menzies School of Health Research
Mr Paul Stewart, Onemda, University of Melbourne
Dr Penny Tripcony, Indigenous Education Consultant
Dr Maggie Walter, University of Tasmania
Dr Margo Weir, Education Consultant and Cross-cultural Researcher
Professor Stephen Zubrick, Curtin University of Technology
Data Protocol Subcommittee
Ms Adele Cox, Consultant
Dr Sarah Holcombe, Australian National University
Dr Karen Martin, Consultant and Associate Professor of Early Childhood
Professor Sven Silburn, Menzies School of Health Research
Dr Maggie Walter, University of Tasmania
Dr Margo Weir, Education Consultant and Cross-cultural Researcher
Steering Committee (Current members)
5
Department of Families, Housing, Community Services and Indigenous Affairs (FaHCSIA) Footprints in Time Project Team (Current members)
Branch Manager, Research and Analysis Branch
Carol Ey
Footprints in Time Section
Sharon Barnes, Tracy Barnes, Michael Barnes, Laura Bennetts Kneebone, Maude Caruana,
Melisah Feeney, Andrew Gibson, Laura Hidderley, Mary Ivec, Saovarose Lai, Rachael Simpson,
Fiona Skelton, Courtney Smith, Nadia Sweetnam, Ros Thorne
Research Administration Officers (RAOs)
Joshua Atkinson, Tanya Carney, Sandra Hooper, Leanne Kum Sing, Cynthia O’Loughlin,
Lee-Anne Parsons, Thelma Quartey, Geraldine Saunders, Sarah Selwyn, Karla Thompson,
Christine Urbanowski, Annie Wacando
6 Footprints in Time: The Longitudinal Study of Indigenous Children | Key Summary Report from Wave 1
What is Footprints in Time?
Overview
Footprints in Time is the name given to the Longitudinal Study of Indigenous Children (LSIC).
Footprints in Time aims to improve the understanding of, and policy response to, the diverse
circumstances faced by Aboriginal and Torres Strait Islander children, their families and
communities. The study provides a data resource that can be drawn on by all levels of
government, researchers, service providers, parents and communities.
The study collects important information about the lives of Aboriginal and Torres Strait Islander
children, covering areas including:
the children�� —their physical and mental health, how they develop socially and cognitively,
their place in their family and community, and significant events in their life
�� the children’s families—their health, work, lifestyle, and family and community
connectedness
the children’s communities�� —facilities, services, and social and community issues
services�� —child care, education, health and other services used by the child’s family.
Objective of the study
The main objective of the study is to provide high quality quantitative and qualitative data that
can be used to provide a better insight into how a child’s early years affect their development.
It is hoped that this information can be drawn upon to help close the gap in life circumstances
between Indigenous and non-Indigenous Australians.
Footprints in Time has four key research questions, formulated under the guidance of the
Steering Committee, which were designed to achieve this objective. These are:
What do Aboriginal and Torres Strait Islander children need to have the best start in life to ��
grow up strong?
What helps Aboriginal and Torres Strait Islander children to stay on track or get them to ��
become healthier, more positive and strong?
How are Aboriginal and Torres Strait Islander children raised?��
What is the importance of family, extended family and community in the early years of life ��
and when growing up?
Also of interest is the role that service use and support plays in the lives of Aboriginal and Torres
Strait Islander children:
How can services and other types of support make a difference to the lives of Aboriginal ��
and Torres Strait Islander children?
The data will provide information for individuals, families, communities, service providers,
researchers and governments to design and implement culturally appropriate policies and
programs that will assist with improving outcomes for Indigenous children.
Footprints in Time collects important information about the lives of Aboriginal and Torres Strait Islander children.
7
Based on extensive consultations held with communities and advice from the Footprints in Time
Steering Committee, some key priorities for Footprints in Time were set. Firstly, it was considered
important that the study be community-based in order to gain support from families and
minimise attrition. FaHCSIA is also committed to providing feedback to communities as well as
the families involved in the study; ensuring that information is distributed in different ways so as
to be understood by the range of stakeholders interested in the study’s data.
Both the Steering Committee and the communities consulted were also keen to ensure that
Footprints in Time is relevant, useful and leads to change. It was recognised that the study
needed to encompass qualitative as well as quantitative evidence, and that it should also
focus on resilience and positive factors, in order to balance the negative impressions of
Indigenous peoples’ lives.
Timelines
The 2003–04 Federal Budget provided the initial resources for the Footprints in Time study.
The first phase, from September 2003 to June 2004, involved extensive consultation with
Indigenous peoples and communities about the study. The design and development of the
study commenced in December 2005, with pilot testing continuing through 2006 and 2007.
Recruitment for Wave 1 commenced in December 2007 with interviews occurring from April
2008 to February 2009. It is intended under the current project that children and their families will
be interviewed at yearly intervals until 2011. Wave 2 data collection is currently underway.1
Who is involved?
Footprints in Time is funded by the Australian Government and managed by FaHCSIA. There
are 1,687 Study children and their families participating in the study.
The Footprints in Time (LSIC) Steering Committee oversees the design, development and
implementation of the study. Its members are drawn from academic and community
backgrounds, covering a wide range of disciplines such as health, early learning and child
care. The role of the Steering Committee is to provide advice on:
the research model design and implementation ��
community engagement processes and working with Aboriginal and Torres Strait Islander ��
communities and peoples
ethical and cultural protocols ��
data analysis, interpretation and reporting��
the use of the data to improve policy and service delivery. ��
Footprints in Time builds trust with Indigenous peoples and communities by working in partnership with Indigenous communities and employing local people wherever possible.
8 Footprints in Time: The Longitudinal Study of Indigenous Children | Key Summary Report from Wave 1
The Footprints in Time Steering Committee saw a need for expert advice to feed into the
study. Accordingly, a Research Design Subcommittee was convened in 2004 to ensure that
the study provided high quality information to underpin research and policy development.
This committee merged with the Steering Committee in 2007. The role of the Research Design
Subcommittee was to provide advice in regard to:
ethical and cultural protocols associated with the study design��
study options for the survey design that support the research objectives and questions ��
implementation of the study design��
data ownership, use and knowledge transfer issues��
processes for consulting with Indigenous communities and peoples, and seeking their ��
support of the study design
the nature of the study’s relationship with the design of the Longitudinal Study of Australian ��
Children (LSAC).2
With the imminent release of Wave 1 data, in 2009 a Data Protocol Subcommittee was
convened to work in partnership with FaHCSIA on culturally appropriate principles for data
access and release.
In February 2009, the focus of the Steering Committee changed from design to implementation
and membership was reviewed.
Strategic guidance and leadership on future content, operation and analysis of Footprints in
Time is also provided by the Longitudinal Studies Advisory Group (LSAG). The primary objective
of the LSAG is to provide advice to the LSAC, Footprints in Time and the Household, Income
and Labour Dynamics in Australia (HILDA) studies and thereby assist in maximising their strategic
importance to the Australian Government.
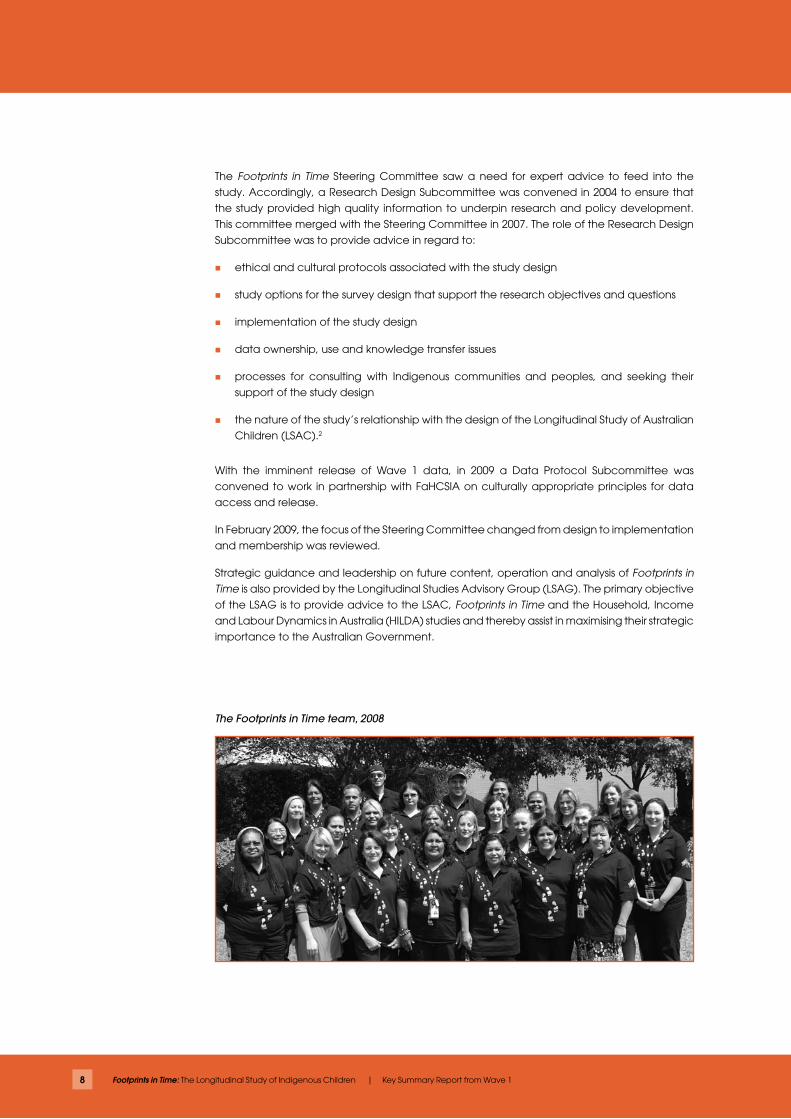
The Footprints in Time team, 2008
9
The first wave of interviews was conducted primarily by FaHCSIA-employed Aboriginal and
Torres Strait Islander Research Administration Officers (RAOs). Some Wave 1 interviews were
conducted by other FaHCSIA staff and experienced Roy Morgan research interviewers.
Ethics
Ethical clearance for the study was obtained from the Australian Government Department
of Health and Ageing Departmental Ethics Committee (DEC) which was chosen as the
primary Human Research Ethics Committee (HREC) for the study. The DEC complies with the
membership requirements for HRECs—the National Statement on Ethical Conduct in Human
Research—and has an Aboriginal and Torres Strait Islander Member. There is also an Aboriginal
and Torres Strait Islander panel working with the DEC to assist with Aboriginal and Torres Strait
Islander research applications.
In addition, state/territory and/or regional ethics clearance and support was obtained for all
Footprints in Time sites through state and territory HRECs or their equivalents (in accordance
with The National Health and Medical Research Council (NHMRC), 2003 and Australian
Institute of Aboriginal and Torres Strait Islander Studies (AIATSIS) guidelines). State and territory
departments of education and Catholic dioceses were also consulted to gain permission
and support for pre-school and school teachers to complete questionnaires about the Study
children. State and territory departments managing out-of-home care were also consulted.
Study sites
A non-representative purposive sampling design was implemented from which eligible families
were approached and voluntary consent obtained.
Footprints in Time focuses on 11 sites (see Box 1) chosen, in part, to cover the range of
socioeconomic and community environments where Aboriginal and Torres Strait Islander
children live. Agreement and approval to participate in the study was sought from communities
and Elders in these sites before research within the communities began.
The Footprints in Time sites were chosen to:
ensure approximately equal representation of urban, regional and remote areas, thus ��
enabling some geographical comparison
represent the concentration of Aboriginal and Torres Strait Islander people ��
around Australia
include a substantial Aboriginal and Torres Strait Islander population in the core and ��
surrounding areas
include locations engaged in the pilot of the study where existing relationships could be ��
built upon
be located near an Indigenous Coordination Centre (ICC), if possible, where RAOs could ��
be based.
10 Footprints in Time: The Longitudinal Study of Indigenous Children | Key Summary Report from Wave 1
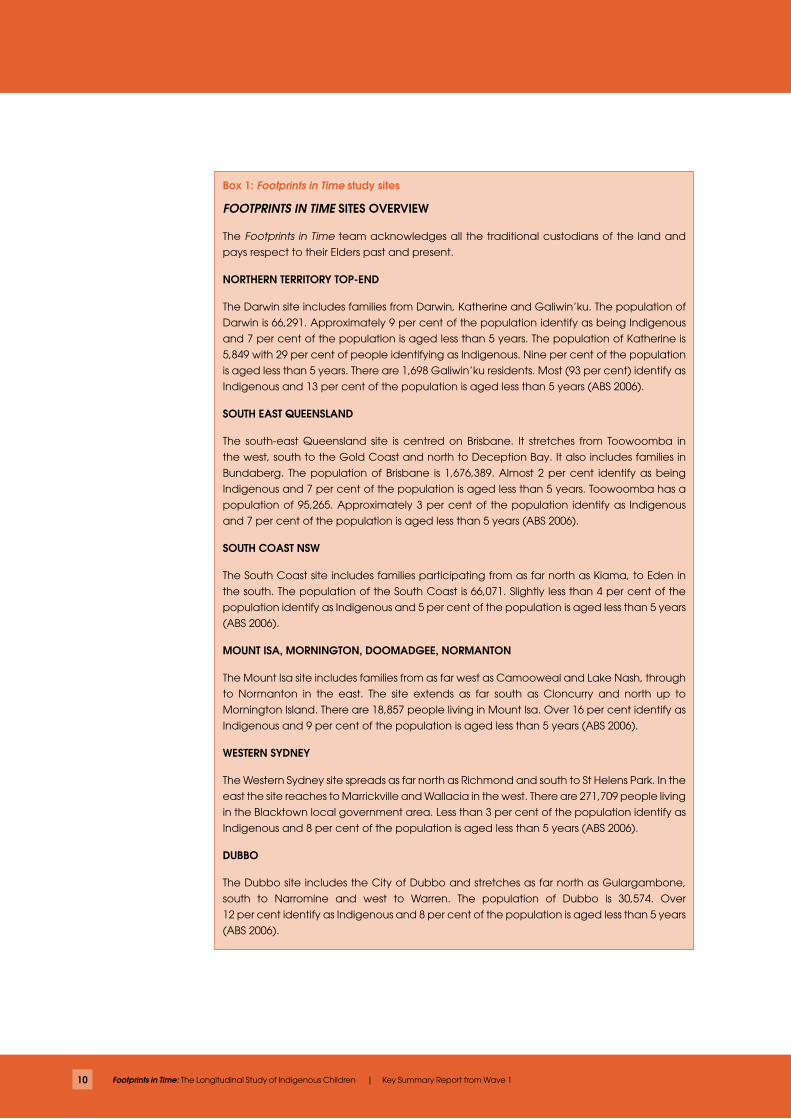
Box 1: Footprints in Time study sites
FOOTPRINTS IN TIME SITES OVERVIEW
The Footprints in Time team acknowledges all the traditional custodians of the land and
pays respect to their Elders past and present.
NORTHERN TERRITORY TOP-END
The Darwin site includes families from Darwin, Katherine and Galiwin’ku. The population of
Darwin is 66,291. Approximately 9 per cent of the population identify as being Indigenous
and 7 per cent of the population is aged less than 5 years. The population of Katherine is
5,849 with 29 per cent of people identifying as Indigenous. Nine per cent of the population
is aged less than 5 years. There are 1,698 Galiwin’ku residents. Most (93 per cent) identify as
Indigenous and 13 per cent of the population is aged less than 5 years (ABS 2006).
SOUTH EAST QUEENSLAND
The south-east Queensland site is centred on Brisbane. It stretches from Toowoomba in
the west, south to the Gold Coast and north to Deception Bay. It also includes families in
Bundaberg. The population of Brisbane is 1,676,389. Almost 2 per cent identify as being
Indigenous and 7 per cent of the population is aged less than 5 years. Toowoomba has a
population of 95,265. Approximately 3 per cent of the population identify as Indigenous
and 7 per cent of the population is aged less than 5 years (ABS 2006).
SOUTH COAST NSW
The South Coast site includes families participating from as far north as Kiama, to Eden in
the south. The population of the South Coast is 66,071. Slightly less than 4 per cent of the
population identify as Indigenous and 5 per cent of the population is aged less than 5 years
(ABS 2006).
MOUNT ISA, MORNINGTON, DOOMADGEE, NORMANTON
The Mount Isa site includes families from as far west as Camooweal and Lake Nash, through
to Normanton in the east. The site extends as far south as Cloncurry and north up to
Mornington Island. There are 18,857 people living in Mount Isa. Over 16 per cent identify as
Indigenous and 9 per cent of the population is aged less than 5 years (ABS 2006).
WESTERN SYDNEY
The Western Sydney site spreads as far north as Richmond and south to St Helens Park. In the
east the site reaches to Marrickville and Wallacia in the west. There are 271,709 people living
in the Blacktown local government area. Less than 3 per cent of the population identify as
Indigenous and 8 per cent of the population is aged less than 5 years (ABS 2006).
DUBBO
The Dubbo site includes the City of Dubbo and stretches as far north as Gulargambone,
south to Narromine and west to Warren. The population of Dubbo is 30,574. Over
12 per cent identify as Indigenous and 8 per cent of the population is aged less than 5 years
(ABS 2006).
11
GREATER SHEPPARTON
The Shepparton site includes families from as far east as Wangaratta, south to Seymour, west
to Bendigo and north to Cobram and Barmah. The population of Shepparton-Mooroopna
is 38,773. Approximately 4 per cent identify as Indigenous and 7 per cent of the population
is aged less than 5 years (ABS 2006).
TORRES STRAIT AND NORTHERN PENINSULA AREA
The Torres Strait site includes Waiben (Thursday Island), Hammond and Horn Islands
(Kaiwalagal cluster); Badu, Kubin (on Moa island) and the Northern Peninsula Area (NPA)
communities of Bamaga, Injinoo, New Mapoon, Seisia and Umagico. There are 8,576
people living in the region. Approximately 69 per cent of the population identify as Torres
Strait Islander, 2 per cent identify as Aboriginal and 12 per cent identify as both Torres Strait
Islander and Aboriginal. Just over 14 per cent of the population is aged less than 5 years
(ABS 2006).
KIMBERLEY REGION
The Kimberley region site has families participating from Derby, Fitzroy Crossing, Broome
and One Arm Point. The population of Broome is 11,547. Approximately 20 per cent of the
population identify as Indigenous and 8 per cent of the population is aged less than 5 years.
There are 3,093 people in Derby. Forty-five per cent of the population identify as Indigenous
and 9 per cent of the population is aged less than 5 years. There are 928 residents of Fitzroy
Crossing, of which 67 per cent identify as Indigenous and 10 per cent are aged less than 5
years. The population of One Arm Point is 214, of which 86 per cent identify as Indigenous
and 13 per cent are aged less than 5 years (ABS 2006).
ADELAIDE
The Adelaide site includes Adelaide City and Port Augusta. Adelaide City stretches as
far north as Elizabeth Downs, west to North Haven, south to Aldinga Beach, and east to
Hope Valley. The population of Adelaide is 1,040,719. Just over 1 per cent of the population
identifies as being Indigenous and 6 per cent of the population is aged less than 5 years.
Port Augusta has a much smaller population of 13,257. Approximately 17 per cent of the
population identify as Indigenous and 7 per cent of the population is aged less than 5 years
(ABS 2006).
ALICE SPRINGS
The Alice Springs site includes families from the towns of Alice Springs and Hermannsburg.
The population of Alice Springs is 21,622. Almost 17 per cent of the population identify as
being Indigenous and 8 per cent of the population is aged less than 5 years. The township
of Hermannsburg has 559 residents. Most (90 per cent) identify as Indigenous and 10 per
cent of the population is aged less than 5 years (ABS 2006).
12 Footprints in Time: The Longitudinal Study of Indigenous Children | Key Summary Report from Wave 1
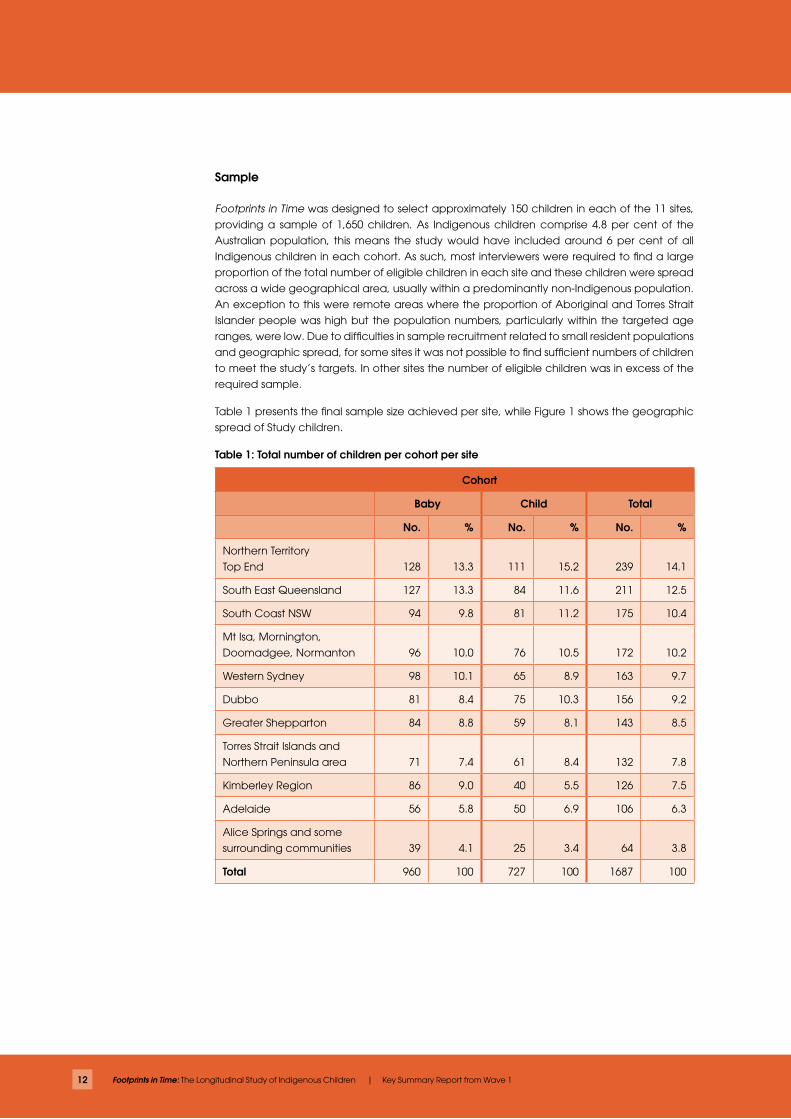
Sample
Footprints in Time was designed to select approximately 150 children in each of the 11 sites,
providing a sample of 1,650 children. As Indigenous children comprise 4.8 per cent of the
Australian population, this means the study would have included around 6 per cent of all
Indigenous children in each cohort. As such, most interviewers were required to find a large
proportion of the total number of eligible children in each site and these children were spread
across a wide geographical area, usually within a predominantly non-Indigenous population.
An exception to this were remote areas where the proportion of Aboriginal and Torres Strait
Islander people was high but the population numbers, particularly within the targeted age
ranges, were low. Due to difficulties in sample recruitment related to small resident populations
and geographic spread, for some sites it was not possible to find sufficient numbers of children
to meet the study’s targets. In other sites the number of eligible children was in excess of the
required sample.
Table 1 presents the final sample size achieved per site, while Figure 1 shows the geographic
spread of Study children.
Table 1: Total number of children per cohort per site
Cohort
Baby Child Total
No. % No. % No. %
Northern Territory
Top End 128 13.3 111 15.2 239 14.1
South East Queensland 127 13.3 84 11.6 211 12.5
South Coast NSW 94 9.8 81 11.2 175 10.4
Mt Isa, Mornington,
Doomadgee, Normanton 96 10.0 76 10.5 172 10.2
Western Sydney 98 10.1 65 8.9 163 9.7
Dubbo 81 8.4 75 10.3 156 9.2
Greater Shepparton 84 8.8 59 8.1 143 8.5
Torres Strait Islands and
Northern Peninsula area 71 7.4 61 8.4 132 7.8
Kimberley Region 86 9.0 40 5.5 126 7.5
Adelaide 56 5.8 50 6.9 106 6.3
Alice Springs and some
surrounding communities 39 4.1 25 3.4 64 3.8
Total 960 100 727 100 1687 100
13
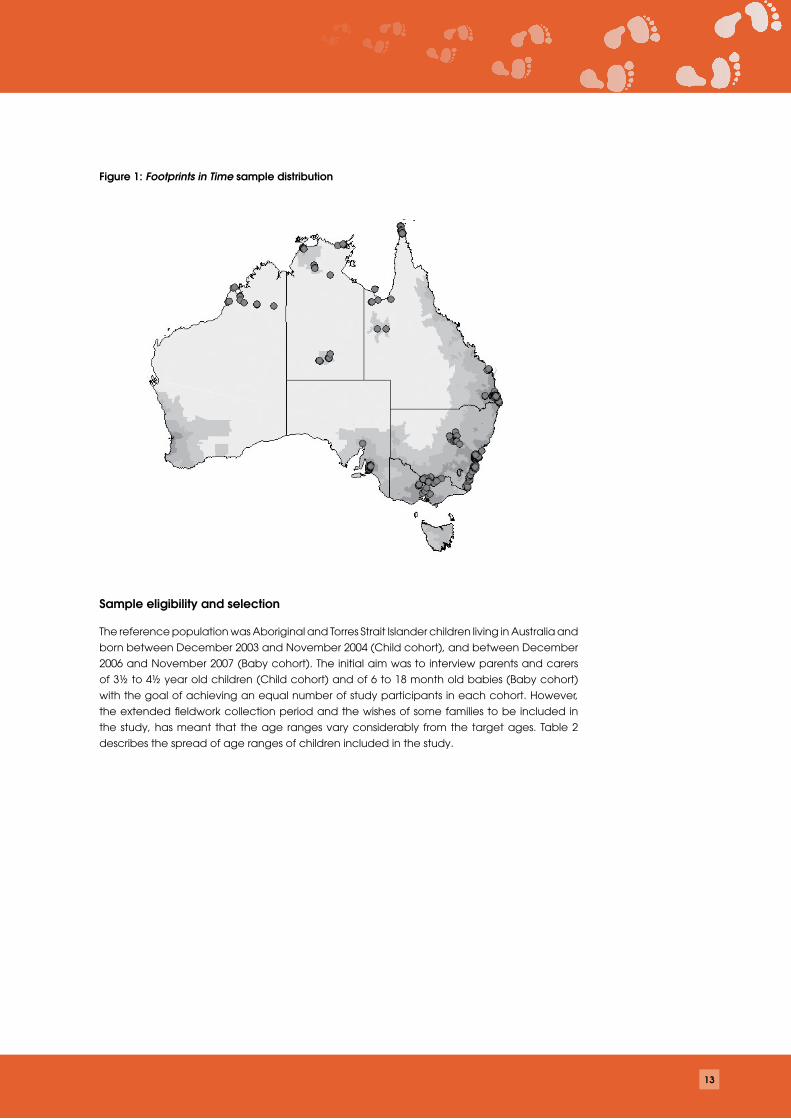
Figure 1: Footprints in Time sample distribution
Sample eligibility and selection
The reference population was Aboriginal and Torres Strait Islander children living in Australia and
born between December 2003 and November 2004 (Child cohort), and between December
2006 and November 2007 (Baby cohort). The initial aim was to interview parents and carers
of 3½ to 4½ year old children (Child cohort) and of 6 to 18 month old babies (Baby cohort)
with the goal of achieving an equal number of study participants in each cohort. However,
the extended fieldwork collection period and the wishes of some families to be included in
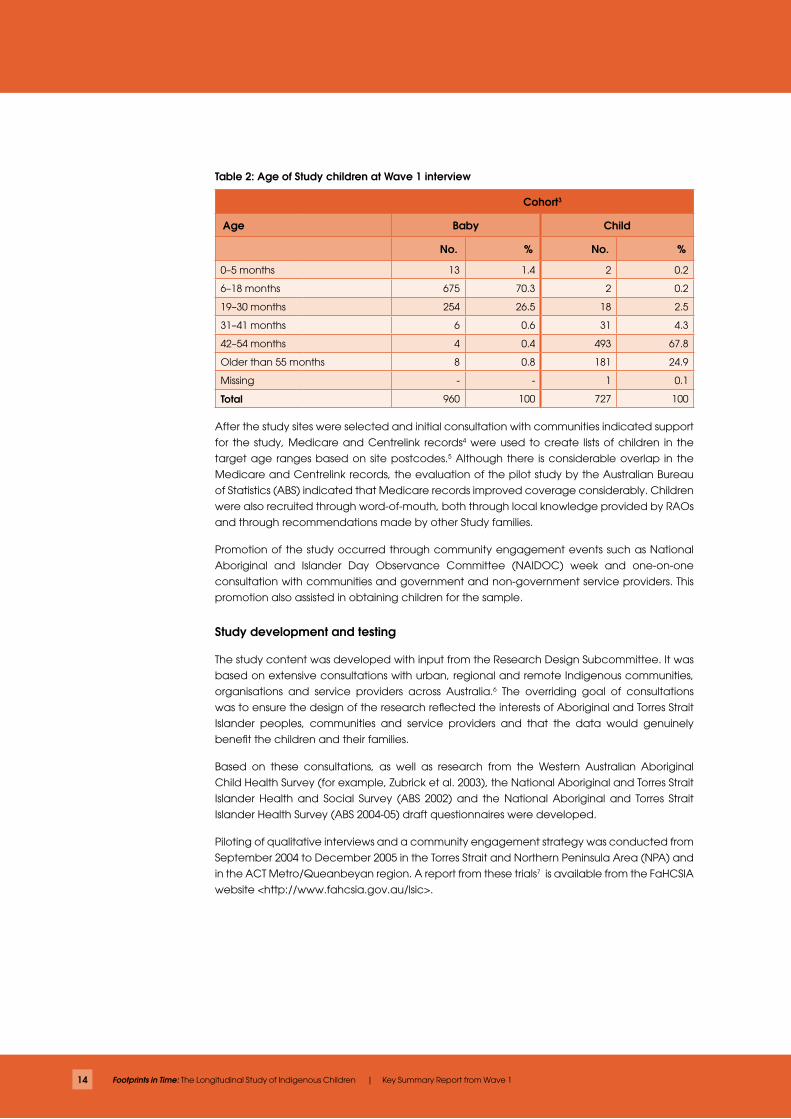
the study, has meant that the age ranges vary considerably from the target ages. Table 2
describes the spread of age ranges of children included in the study.
14 Footprints in Time: The Longitudinal Study of Indigenous Children | Key Summary Report from Wave 1
Table 2: Age of Study children at Wave 1 interview
Cohort3
Age Baby Child
No. % No. %
0–5 months 13 1.4 2 0.2
6–18 months 675 70.3 2 0.2
19–30 months 254 26.5 18 2.5
31–41 months 6 0.6 31 4.3
42–54 months 4 0.4 493 67.8
Older than 55 months 8 0.8 181 24.9
Missing - - 1 0.1
Total 960 100 727 100
After the study sites were selected and initial consultation with communities indicated support
for the study, Medicare and Centrelink records4 were used to create lists of children in the
target age ranges based on site postcodes.5 Although there is considerable overlap in the
Medicare and Centrelink records, the evaluation of the pilot study by the Australian Bureau
of Statistics (ABS) indicated that Medicare records improved coverage considerably. Children
were also recruited through word-of-mouth, both through local knowledge provided by RAOs
and through recommendations made by other Study families.
Promotion of the study occurred through community engagement events such as National
Aboriginal and Islander Day Observance Committee (NAIDOC) week and one-on-one
consultation with communities and government and non-government service providers. This
promotion also assisted in obtaining children for the sample.
Study development and testing
The study content was developed with input from the Research Design Subcommittee. It was
based on extensive consultations with urban, regional and remote Indigenous communities,
organisations and service providers across Australia.6 The overriding goal of consultations
was to ensure the design of the research reflected the interests of Aboriginal and Torres Strait
Islander peoples, communities and service providers and that the data would genuinely
benefit the children and their families.
Based on these consultations, as well as research from the Western Australian Aboriginal
Child Health Survey (for example, Zubrick et al. 2003), the National Aboriginal and Torres Strait
Islander Health and Social Survey (ABS 2002) and the National Aboriginal and Torres Strait
Islander Health Survey (ABS 2004-05) draft questionnaires were developed.
Piloting of qualitative interviews and a community engagement strategy was conducted from
September 2004 to December 2005 in the Torres Strait and Northern Peninsula Area (NPA) and
in the ACT Metro/Queanbeyan region. A report from these trials7 is available from the FaHCSIA
website <http://www.fahcsia.gov.au/lsic>.
15
Piloting of the design, sampling strategy and Wave 1 survey content was undertaken in
partnership with the ABS. The ABS tested the questionnaire and field procedures in the first
pilot sites in 2006. A number of content areas were adapted to ensure that respondents were
providing the information being sought by revising question wording, and by adding and
removing questions before testing the questionnaires and field procedures again in 2007.
Initially six full-time Indigenous RAOs were employed and trained to manage the community
engagement activities for the pilot research, including consent processes, data collection
and dissemination of information in pilot communities.
A qualitative research strategy was piloted again in 2006. This involved interviews with a number
of survey participants who agreed to be re-contacted after the first quantitative collection.
Interviews were also held with Indigenous parents engaged in a South Australian family home
visiting program.
Research design
Footprints in Time employs a mixed methods approach, as follows:
quantitative information is collected directly about a range of information in relation ��
to the Study children, their primary and auxiliary carers, and teachers using structured
interview questionnaires
qualitative information, where possible, is recorded on the ‘stories’ and life incidents of the ��
family of the Study children.
The main quantitative data collection for Wave 1 was a structured face-to-face interview with
the parent who knew the child best (Parent 1). Information collected in the interview included
household, family, pregnancy and birth details, health conditions, nutrition, child care, early
education and activities undertaken. Information was also collected about parent health,
social and emotional wellbeing, resilience, major life events in the previous year, language,
culture, employment, income, and financial stress. Copies of questionnaires are available
from <http://www.fahcsia.gov.au/lsic>.
Information about the Study child’s development was also collected, which will be
available at a later date. This included, for the Baby cohort, an Australian version of the
McArthur-Bates vocabulary checklist8 completed by Parent 1. For the Child cohort these were
the Renfrew word finding vocabulary test, an assessment of expressive vocabulary, and the
Who Am I?, a school readiness instrument. Height and weight measurements were taken for
both cohorts.
With parental or guardian permission, face-to-face interviews were conducted with the Study
child’s other parent or another carer (Parent 2). Questionnaires were also given to children’s
teachers or child care providers to complete.
16 Footprints in Time: The Longitudinal Study of Indigenous Children | Key Summary Report from Wave 1
Consent process
The process for gathering consent from the Study child, their family, teachers and carers forms
an integral part of the study.
Prior to being interviewed, parents were provided with an introductory letter and a DVD
describing the study and the consent process. At the interview RAOs went through each
consent form with the participant/s and explained what permission was being sought. This
enabled parents to make informed consent about their participation in the study. A plain
language statement was also available for parents who preferred to read about the study.
Parents gave consent on behalf of the Study child.
As well as seeking permission to take part in the study participants were separately asked for
consent to:
be voice recorded for the interview��
allow the other parent or another carer to be interviewed��
allow the child’s teacher or child care worker to be contacted ��
allow the Study child to be photographed ��
allow Medicare to release the Study child’s records for data linkage. ��
At the conclusion of the consent process participants were given a summary sheet that
recorded what they had agreed to. This sheet included contact details for the ethics
committee and FaHCSIA. Participants were informed that they could change their consent
and are able to withdraw from the study at any time.
Box 2: The experience of the Research Aministration Officers (RAOs)
Without the tremendous dedication of the Footprints in Time RAOs, this data collection
would not exist. RAOs were required to find children in diverse and remote geographic
locations. In doing so, they dealt with extreme heat and cold, vast distances and lack of
access to technology. Despite these challenges, interviewers were able to build strong and
meaningful relationships with families participating in the study. This is how some of them
described their experiences.
The distances involved
“To get to Thursday Island (TI) you get a plane from Canberra to Sydney or Brisbane, then another to Cairns. From Cairns you get the plane to Horn Island and then the bus from the airport out to the wharf. Then you get the ferry across to TI—takes about 9 hours non-stop and it costs a lot.”
“You can get a head spin driving 100 kms around and around town, let alone having to drive to another town, I’m sure some families think I am stalking them. I just smile and wave like them Penguins out of the Madagascar movies.”
17
Dealing with the elements
“Many times interviews have been conducted where the sun is directly on the Laptop screen and you cannot see anything besides kids’ fingerprints from the last interview, so you would move around the yard about five times trying to find shade before you could read the screen.”
“Good thing was, it was that damn hot, the dogs were too lazy to chase us.”
“Travelling late at night on roads that are meant to be there but are not.”
Building relationships
“The mother asked me how I did the interview while her six kids were running around playing football, the little ones were crying and two dogs running under my chair and between my legs. I said it was normal and I was used to working like this. The dogs dropped the odd flea on me whilst interviewing at this home and my leg was itchy for an hour after but the interview got done.”
“The people who plead for help because of depression and they feel they have no options—we refer to services but how do we keep listening over and over?”
“I love it when the kids come up and putting their arms on my shoulder and getting that real close connection—the four year old saying ‘gees you’re funny’.”
“Walking into a house with two bags to hear the Study child call out to her mother ‘Mum, the lady has come to sleep the night. Can she stay in my room?’”
Technical and methodological issues
“Don’t talk to me about IT! This is the second Laptop that has had Confirmit issues this year. I don’t know about our Scandinavian programs…. Roy Morgan know me well!”
“After doing the weight and height for the Study child, every child in the house wants theirs done as well as every kid in the vicinity of the Study child’s house. When that is all done I can pack up and leave and everyone is happy.”
“The computer helpdesk man I rang about an issue said ‘we will get someone out to you tomorrow’!” (An interviewer in the Torres Strait, talking to an IT consultant in Canberra).
18 Footprints in Time: The Longitudinal Study of Indigenous Children | Key Summary Report from Wave 1
Wave 1 response
Interviews were conducted with the parents/main carers of 1,850 Indigenous children. Of
these, 163 interviews were gathered from the parent/main carer of multiple children in the
study, mainly siblings. Where this occurred one child was chosen as the Study child, leaving a
final sample size of 1,687 study children.
Decisions on which sibling to select were based predominantly on whether one of the children
was in the target age range at the time of the interview. Preference was given to selecting the
younger child if both children fell into appropriate age ranges. If the children were twins, one
child was randomly selected.
The final study data included information from:
1,687 parents or primary carers of an Indigenous child. ��
– 960 Study children were in the Baby cohort, approximately 6–18 months old
– 727 were in the Child cohort, approximately 3 years 6 months to
4 years 6 months old
Approximately 1,500 Study child questionnaires, which included information on language, ��
height and weight
Approximately 240 interviews with the secondary carer (Parent 2)��
Approximately 45 questionnaires collected from teachers, child care centres or family day ��
care providers.
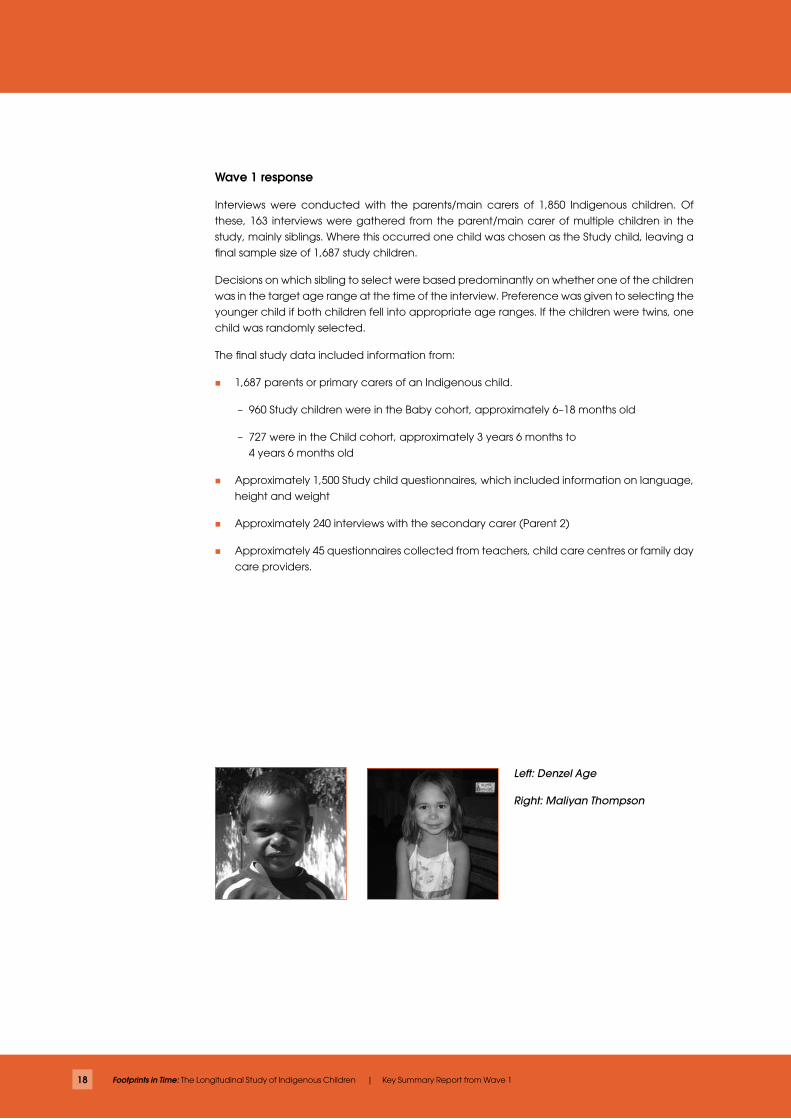
Left: Denzel Age
Right: Maliyan Thompson
19
Sample characteristics
Although not a nationally representative study, the distribution of children in the
Footprints in Time sample is relatively consistent with the distribution of ABS estimates of
the numbers of Indigenous children aged 0 to 5 years across Australia. The proportion
of children in the study who are Aboriginal (as opposed to Torres Strait Islander or
both) also reflects estimates of proportions of Aboriginal and Torres Strait Islander
populations in the study sites. There are approximately equal numbers of male and
female children.
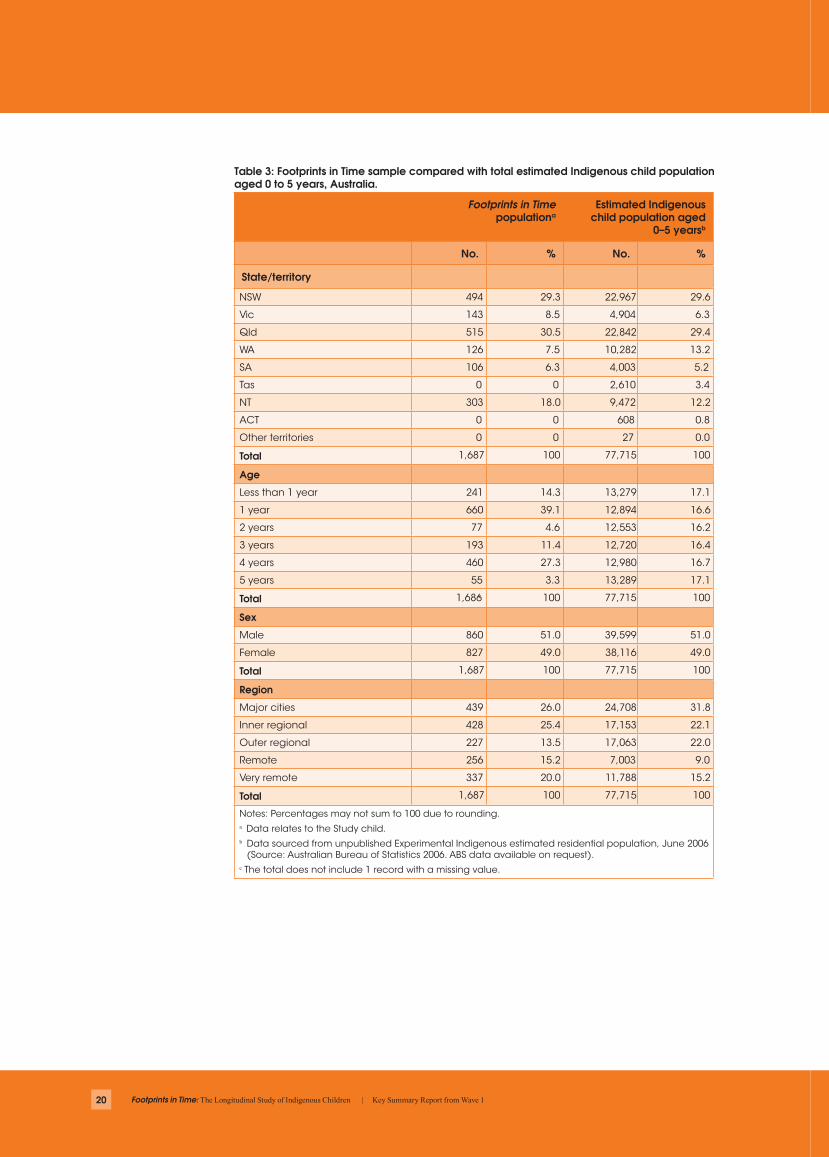
Table 3 provides a summary of selected characteristics of the sample. To assist in the
assessment of the representativeness of the sample, comparative (previously unpublished)
population data from the ABS Experimental Indigenous Estimated Residential Population
(2006) is provided.
Apart from the lack of representation from the two smaller jurisdictions (Tasmania and the
ACT), the spread of Footprints in Time Study children is similar to that of the overall estimated
population of Indigenous children aged between 0 and 5 years. The Study children are
under-represented in South Australia, slightly over-represented in Victoria and Western
Australia, and moderately over-represented in the Northern Territory.
In terms of remoteness, the study has an over-representation of children in the inner regional,
remote and very remote areas and an under-representation of children in major cities and
outer regional areas. The remoteness figures in this table are based on the Australian Standard
Geographical Classification used by the ABS. This classification is necessary when comparing
study data with ABS data. Elsewhere in this report, an indicator of the level of relative isolation
(LORI) is used when describing geographic characteristics.
Left: Tanaya Toby
Right: Tarlaya Te-Kowhai and mum
20 Footprints in Time: The Longitudinal Study of Indigenous Children | Key Summary Report from Wave 1
Footprints in Time populationa
Estimated Indigenous child population aged
0–5 yearsb
No. % No. %
State/territory
NSW 494 29.3 22,967 29.6
Vic 143 8.5 4,904 6.3
Qld 515 30.5 22,842 29.4
WA 126 7.5 10,282 13.2
SA 106 6.3 4,003 5.2
Tas 0 0 2,610 3.4
NT 303 18.0 9,472 12.2
ACT 0 0 608 0.8
Other territories 0 0 27 0.0
Total 1,687 100 77,715 100
Age
Less than 1 year 241 14.3 13,279 17.1
1 year 660 39.1 12,894 16.6
2 years 77 4.6 12,553 16.2
3 years 193 11.4 12,720 16.4
4 years 460 27.3 12,980 16.7
5 years 55 3.3 13,289 17.1
Total 1,686c 100 77,715 100
Sex
Male 860 51.0 39,599 51.0
Female 827 49.0 38,116 49.0
Total 1,687 100 77,715 100
Region
Major cities 439 26.0 24,708 31.8
Inner regional 428 25.4 17,153 22.1
Outer regional 227 13.5 17,063 22.0
Remote 256 15.2 7,003 9.0
Very remote 337 20.0 11,788 15.2
Total 1,687 100 77,715 100
Notes: Percentages may not sum to 100 due to rounding.a Data relates to the Study child.b Data sourced from unpublished Experimental Indigenous estimated residential population, June 2006 (Source: Australian Bureau of Statistics 2006. ABS data available on request).c The total does not include 1 record with a missing value.
Table 3: Footprints in Time sample compared with total estimated Indigenous child populationaged 0 to 5 years, Australia.
21
The following information provides a brief overview of the characteristics of Footprints in Time
Study children.
While the full value of a longitudinal survey, such as Footprints in Time, is only realised in later
waves of the study, the Wave 1 data does provide a snapshot of a wide range of information
about Indigenous children and their families. The information below provides a sample of the
data including:
family structure and housing��
household finances��
cultural identity��
health and development��
activities��
parenting��
stressful life events��
environmental factors��
The findings reported here are based on Wave 1 interviews conducted with the primary
carer of the Study child, known as Parent 1 (P1). P1 is identified at the start of the interview
as the adult family member who spends the most time with the Study child. In most instances
(96 per cent) this was a parent9, usually the mother (93 per cent). In 50 instances (3 per cent)
the primary carer was a grandparent and in 39 cases (2 per cent) fathers identified themselves
as the main carer of the child. The following information uses ‘parent’ to refer to the primary
carer of the child (P1), unless otherwise specified. Analyses exclude data with missing values.
Preston and Taj Hamilton with mum
Highlights from Wave 1
22 Footprints in Time: The Longitudinal Study of Indigenous Children | Key Summary Report from Wave 1
FAMILY LIFE: HOUSEHOLD, CULTURE AND LANGUAGE
Their parents, families and houses
Footprints in Time collects detailed information about household size and composition,
including the number of people living in a house, their age, sex, Aboriginal or Torres Strait
Islander status, and relationship to the parent.
Mothers provided the primary care for almost all of the Study children (93 per cent). Mothers
ranged in age from 16 to 54 years, with an average age of 28 years. Fifteen per cent of
mothers were aged 21 years or less, while 3 per cent (47 mothers) of mothers were aged
18 years or less.
Just over half of the parents had a partner living in the household (54 per cent). Equal
proportions of each cohort were living in unpartnered households.
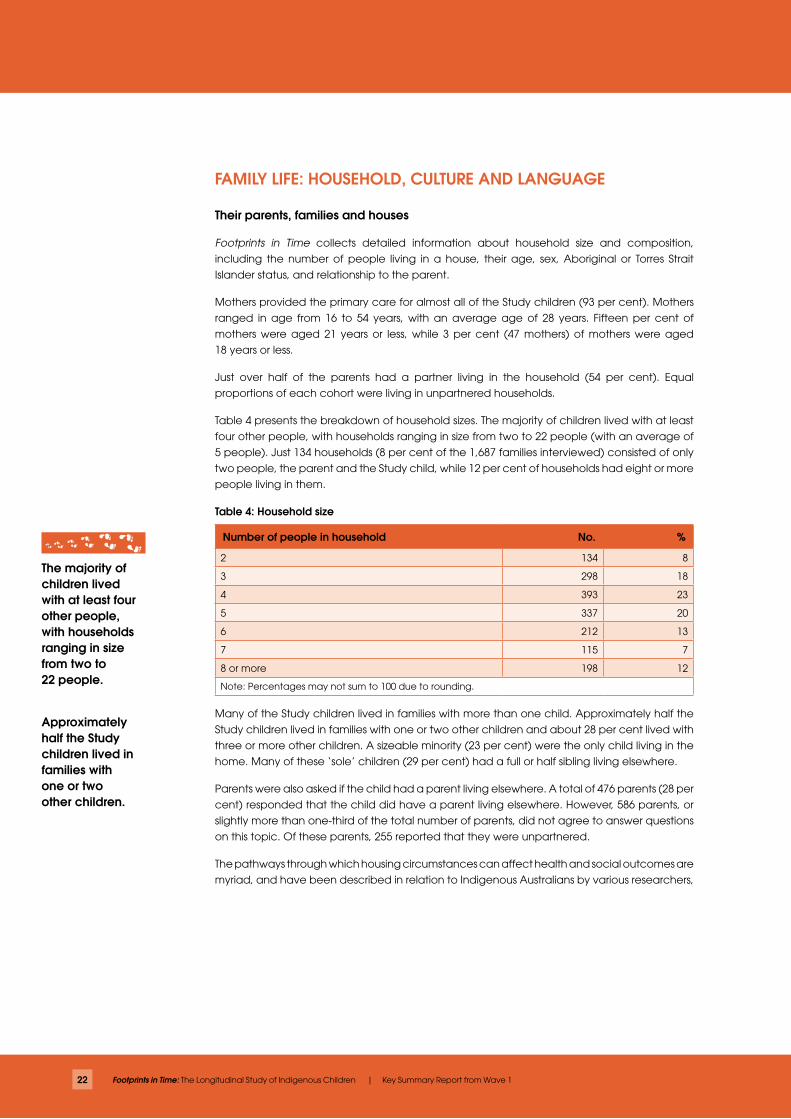
Table 4 presents the breakdown of household sizes. The majority of children lived with at least
four other people, with households ranging in size from two to 22 people (with an average of
5 people). Just 134 households (8 per cent of the 1,687 families interviewed) consisted of only
two people, the parent and the Study child, while 12 per cent of households had eight or more
people living in them.
Table 4: Household size
Number of people in household No. %
2 134 8
3 298 18
4 393 23
5 337 20
6 212 13
7 115 7
8 or more 198 12
Note: Percentages may not sum to 100 due to rounding.
Many of the Study children lived in families with more than one child. Approximately half the
Study children lived in families with one or two other children and about 28 per cent lived with
three or more other children. A sizeable minority (23 per cent) were the only child living in the
home. Many of these ‘sole’ children (29 per cent) had a full or half sibling living elsewhere.
Parents were also asked if the child had a parent living elsewhere. A total of 476 parents (28 per
cent) responded that the child did have a parent living elsewhere. However, 586 parents, or
slightly more than one-third of the total number of parents, did not agree to answer questions
on this topic. Of these parents, 255 reported that they were unpartnered.
The pathways through which housing circumstances can affect health and social outcomes are
myriad, and have been described in relation to Indigenous Australians by various researchers,
The majority of children lived with at least four other people, with households ranging in size from two to 22 people.
Approximately half the Study children lived in families with one or two other children.
23
with a good overview provided by Bailie and Wayte (2006). Home ownership, although not
necessarily an aspiration of all Indigenous people, is an important indicator of wealth and
saving. As well as providing other benefits, home ownership provides a secure asset base
that can contribute to financial stability, and against which people can borrow. Indigenous
Australians on average have a much lower income than non-Indigenous Australians and this
adds to the difficulties in achieving home ownership (SCRGSP 2009).
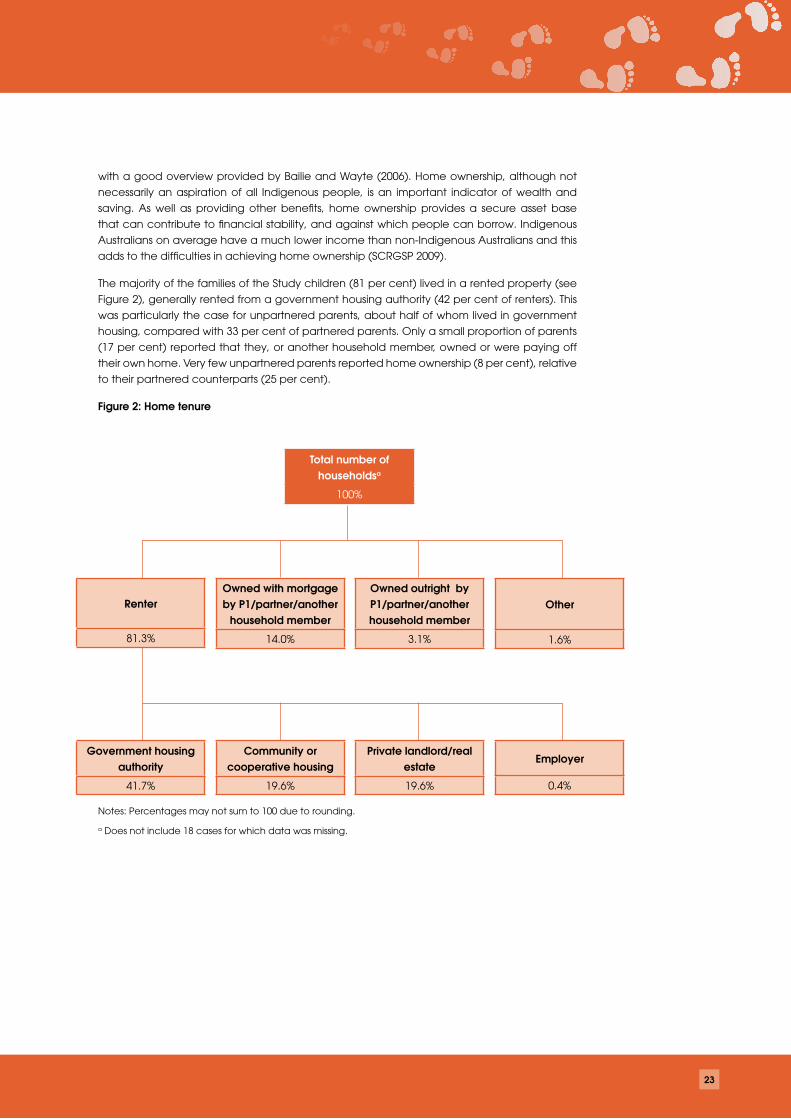
The majority of the families of the Study children (81 per cent) lived in a rented property (see
Figure 2), generally rented from a government housing authority (42 per cent of renters). This
was particularly the case for unpartnered parents, about half of whom lived in government
housing, compared with 33 per cent of partnered parents. Only a small proportion of parents
(17 per cent) reported that they, or another household member, owned or were paying off
their own home. Very few unpartnered parents reported home ownership (8 per cent), relative
to their partnered counterparts (25 per cent).
Figure 2: Home tenure
Notes: Percentages may not sum to 100 due to rounding.
a Does not include 18 cases for which data was missing.
Total number of householdsa
100%
Renter
81.3%
Owned with mortgage by P1/partner/another
household member
14.0%
Owned outright by P1/partner/another household member
3.1%
Other
1.6%
Government housing authority
41.7%
Community or cooperative housing
19.6%
Private landlord/real estate
19.6%
Employer
0.4%
24 Footprints in Time: The Longitudinal Study of Indigenous Children | Key Summary Report from Wave 1
Parents were asked if their home needed any major ‘things fixed’ (such as plumbing, fencing,
electrical or gas, flooring or kitchen and appliances). About 40 per cent reported that they
did need something fixed. Of these, 74 per cent, when asked if it was easily fixed, answered
‘not always’ or ‘no’.
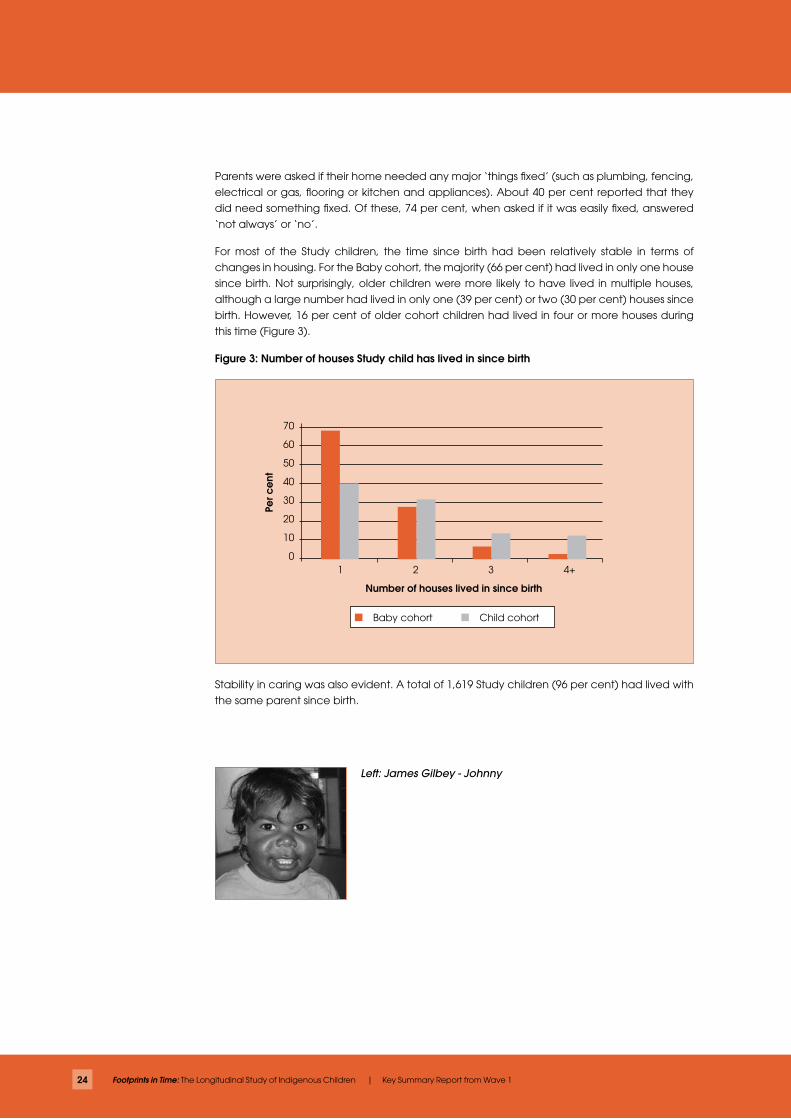
For most of the Study children, the time since birth had been relatively stable in terms of
changes in housing. For the Baby cohort, the majority (66 per cent) had lived in only one house
since birth. Not surprisingly, older children were more likely to have lived in multiple houses,
although a large number had lived in only one (39 per cent) or two (30 per cent) houses since
birth. However, 16 per cent of older cohort children had lived in four or more houses during
this time (Figure 3).
Figure 3: Number of houses Study child has lived in since birth
70
60
50
40
30
20
10
01 2 3 4+
Number of houses lived in since birth
Per c
ent
Baby cohort Child cohort
Stability in caring was also evident. A total of 1,619 Study children (96 per cent) had lived with
the same parent since birth.
Left: James Gilbey - Johnny
25
Work and finances
Only a small proportion of primary parents were employed, possibly reflecting their current
care giving responsibilities. For the Baby cohort, 27 per cent of primary parents were employed.
Of those who were employed, 8 per cent were on leave from their job at the time of the
interview. Employment figures were higher for parents of older children, even though some of
these parents had since given birth to another child. Among parents of older cohort children,
34 per cent of primary parents were employed, with about 2 per cent of these on leave at the
time of the interview. Overall, 12 per cent of parents (198 parents) were studying, mostly at a
TAFE, technical college or university.
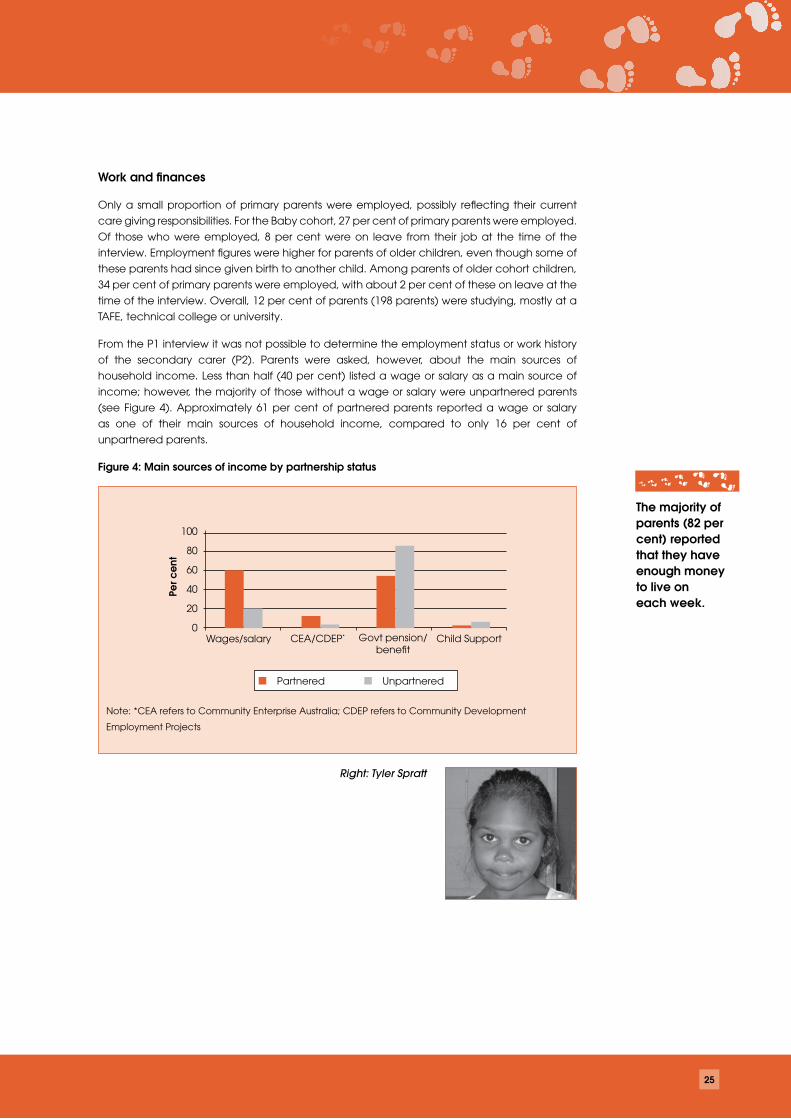
From the P1 interview it was not possible to determine the employment status or work history
of the secondary carer (P2). Parents were asked, however, about the main sources of
household income. Less than half (40 per cent) listed a wage or salary as a main source of
income; however, the majority of those without a wage or salary were unpartnered parents
(see Figure 4). Approximately 61 per cent of partnered parents reported a wage or salary
as one of their main sources of household income, compared to only 16 per cent of
unpartnered parents.
Figure 4: Main sources of income by partnership status
100
80
60
40
20
0Wages/salary
Per c
ent
Partnered Unpartnered
CEA/CDEP* Govt pension/ benefit
Child Support
Note: *CEA refers to Community Enterprise Australia; CDEP refers to Community Development
Employment Projects
Right: Tyler Spratt
The majority of parents (82 per cent) reported that they have enough money to live on each week.
26 Footprints in Time: The Longitudinal Study of Indigenous Children | Key Summary Report from Wave 1
45
30
15
0
Per c
ent
Partnered Unpartnered
We run out o
f money
before payday
We are spending m
ore
than we get
We have just
enough money
to get us t
hrough
There’s
some m
oney left o
ver
but we ju
st sp
end it
We can save a bit
We can save a lo
t
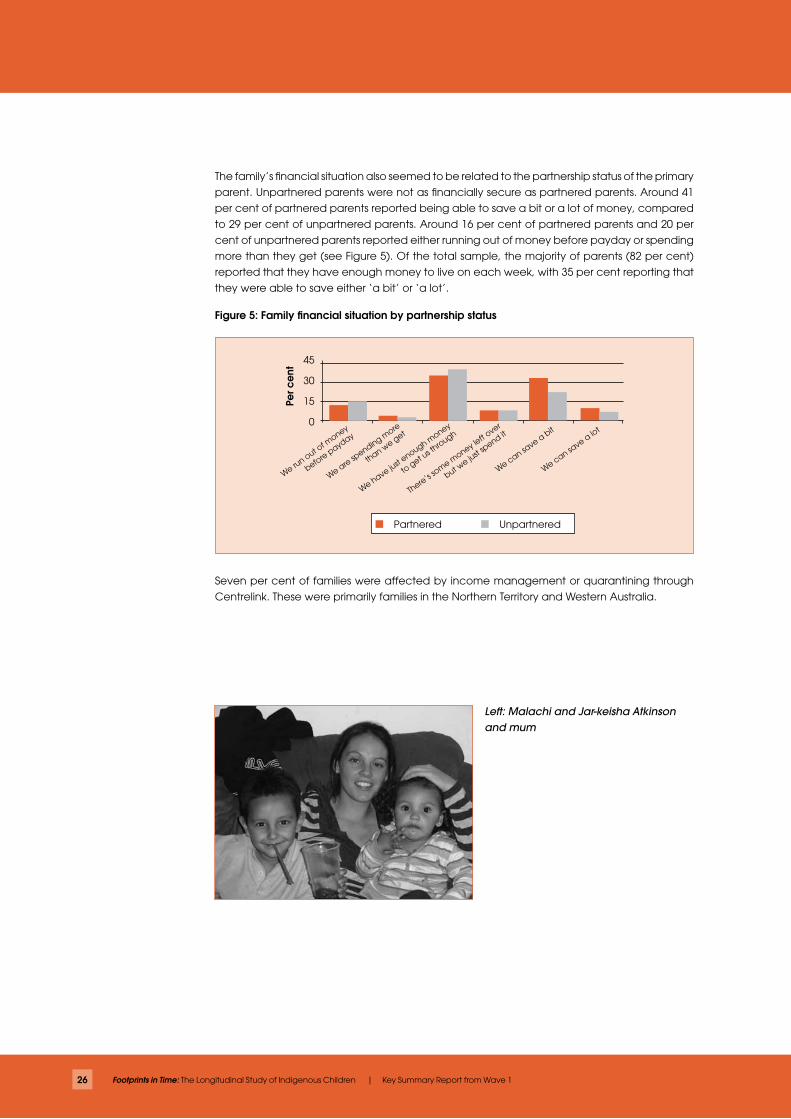
The family’s financial situation also seemed to be related to the partnership status of the primary
parent. Unpartnered parents were not as financially secure as partnered parents. Around 41
per cent of partnered parents reported being able to save a bit or a lot of money, compared
to 29 per cent of unpartnered parents. Around 16 per cent of partnered parents and 20 per
cent of unpartnered parents reported either running out of money before payday or spending
more than they get (see Figure 5). Of the total sample, the majority of parents (82 per cent)
reported that they have enough money to live on each week, with 35 per cent reporting that
they were able to save either ‘a bit’ or ‘a lot’.
Figure 5: Family financial situation by partnership status
Seven per cent of families were affected by income management or quarantining through
Centrelink. These were primarily families in the Northern Territory and Western Australia.
Left: Malachi and Jar-keisha Atkinson and mum
27
Cultural identification
All of the Footprints in Time Study children were either Aboriginal (88 per cent), Torres Strait Islander
(6 per cent) or both (6 per cent). Among parents, 1,256 (76 per cent) identified as Aboriginal,
7 per cent as Torres Strait Islander, 4 per cent as both Aboriginal and Torres Strait Islander and
13 per cent as neither Aboriginal nor Torres Strait Islander.
Within these broad classifications, parents identify their children with a wide variety of tribes,
language groups, clans and country. Some families have strong links to ethnic groups
overseas, especially Pacific Island groups, such as Maori and Tongan. Others mentioned links
to European, Asian and African communities.
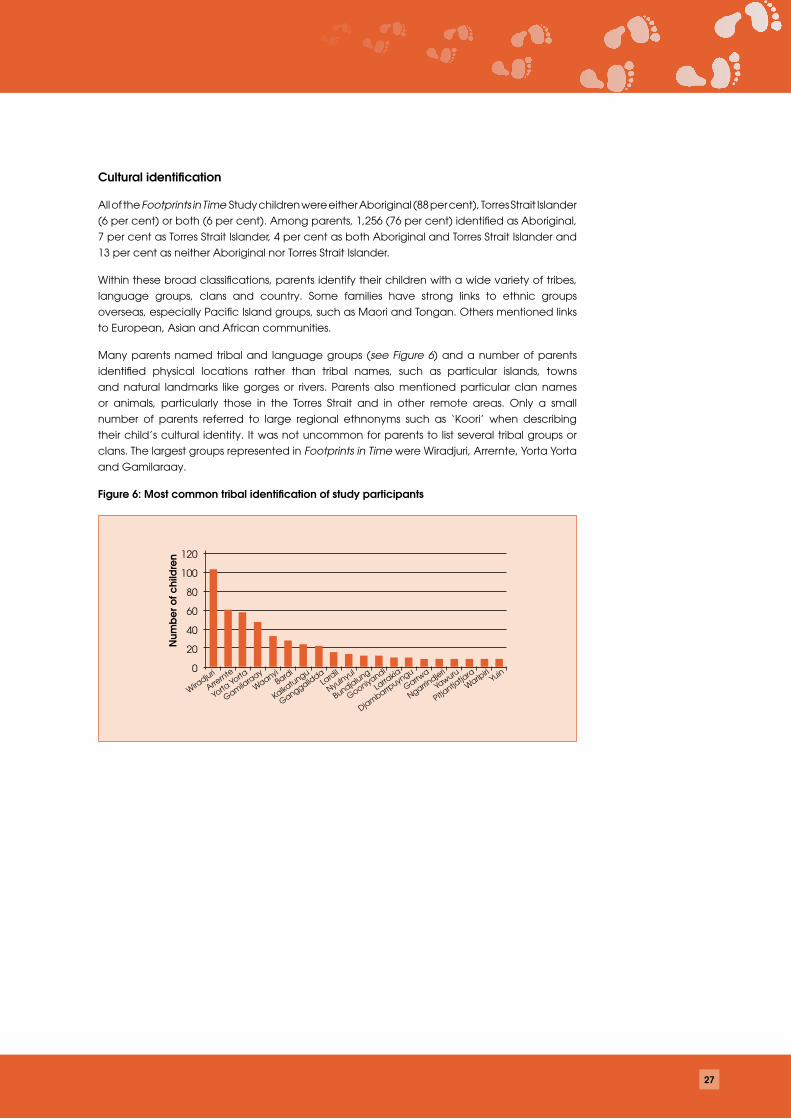
Many parents named tribal and language groups (see Figure 6) and a number of parents
identified physical locations rather than tribal names, such as particular islands, towns
and natural landmarks like gorges or rivers. Parents also mentioned particular clan names
or animals, particularly those in the Torres Strait and in other remote areas. Only a small
number of parents referred to large regional ethnonyms such as ‘Koori’ when describing
their child’s cultural identity. It was not uncommon for parents to list several tribal groups or
clans. The largest groups represented in Footprints in Time were Wiradjuri, Arrernte, Yorta Yorta
and Gamilaraay.
Figure 6: Most common tribal identification of study participants
120
100
80
60
40
20
0
Wiradjuri
Num
be
r of c
hild
ren
Arrernte
Yorta
Yorta
Gamilaraay
WaanyiBardi
Kalkatungu
Ganggalidda
Lardil
Nyulnyul
Bundjalung
Gooniyandi
Larra
kia
Djambarrpuyngu
Garrwa
Ngarrindjeri
Yawuru
Pitjantja
tjara
Warlpiri
Yuin
28 Footprints in Time: The Longitudinal Study of Indigenous Children | Key Summary Report from Wave 1
Parents reported doing a number of different activities ‘occasionally’, ‘often’ or ‘very often’
with their children to ensure that they are strong in their culture:
67 per cent took their child to an Indigenous cultural event, ceremony or sorry business��
44 per cent taught their child traditional arts like painting, dance, singing and making ��
ceremonial dress
41 per cent taught their child traditional practices like collecting food or hunting.��
Parents also reported that Study children eat bush tucker. Of the older cohort children,
48 per cent eat some type of bush tucker. The most common types of bush tucker tended to
be meats such as kangaroo, emu, goanna, turtle and dugong.
Language
Parents were asked which languages they speak, and their fluency and literacy in each of
those languages. This is important for beginning to understand which languages children are
being exposed to prior to starting school, and whether their parents are likely to be able to
help them learn to read and write in those languages. Parent responses were categorised
using a list of languages drawn from the ABS Australian Standard Classification of Languages.
These included English, sign language, foreign language, Kriol, Yumplatok (Torres Strait Creole)
and over 160 Aboriginal and Torres Strait Islander languages.
Approximately 20 per cent of parents speak one or more traditional Indigenous languages;
Kriol or Yumplatok are spoken by 14 per cent of parents. A total of 18 per cent of parents
reported that they are bilingual and 8 per cent reported that they are multilingual. Most
parents (95 per cent) speak English, and of these, 91 per cent are able to read and write it
well, only 1 per cent reported they are only able to read and write a few words or not at all.
Parents reported that they ‘read and write well’ in 24 per cent of all the traditional Indigenous
languages that are spoken, and ‘read and write some’ in a further 17 per cent. Of parents
who reported speaking a creole, 40 per cent are able to ‘read and write well’ in this language
and a further 20 per cent can ‘read and write some’.10
67 per cent of parents took their child to an Indigenous cultural event, ceremony or sorry business.
Of the older cohort children, 48 per cent eat some type of bush tucker.
29
Box 3: Indigenous language
Prior to European settlement, it is estimated that Australia had about 300 Indigenous
languages, fewer than 20 of which are currently being fully passed on to children
(McConvell 2008, p. 238). In the past it was typical for Indigenous people to speak their
own language, as well as several others spoken in the region. Multilingualism was stable
and enabled communication and marriage between different tribes.
In some remote areas in Australia this is still the case; however, it is unclear to what degree
Indigenous children are learning the same languages spoken by their parents and
grandparents. There have also been efforts in some areas to revitalise languages that are
endangered or lost, which means that some children are learning languages that their
parents may be unable to speak.
An additional complexity in understanding language is the use of creoles. Creoles began
as ‘pidgin’ languages. In Australia, these were simplified blends of English and Aboriginal or
Torres Strait languages, originally used to facilitate communication on missions, outstations,
and so on. Eventually these pidgins have creolised, that is, become languages in their own
right, they have increased in complexity, become capable of expressing a broad range
of concepts and learnt as a mother tongue by some children. The main creoles spoken in
Australia today are ‘Kriol’ (spoken in mainland Australia, but with regional characteristics,
based on Aboriginal languages) and Yumplatok, which is spoken in the Torres Strait and is
primarily based on Torres Strait Islander languages.
Aboriginal English is different to a creole, as it is essentially a dialect of English, and mutually
intelligible to other English speakers (much like Scots English, American English, or Australian
English, for example). Aboriginal English speakers can be said to speak with an Aboriginal
accent, and sometimes use an Aboriginal word, or slightly different grammar when speaking
English, from other Australians. Wave 1 of Footprints in Time did not attempt to measure the
number of Aboriginal English speakers because understanding of what Aboriginal English is
varies widely. Within the Footprints in Time Wave 1 data, Australian English and Aboriginal
English speakers are all considered to speak ‘English’.
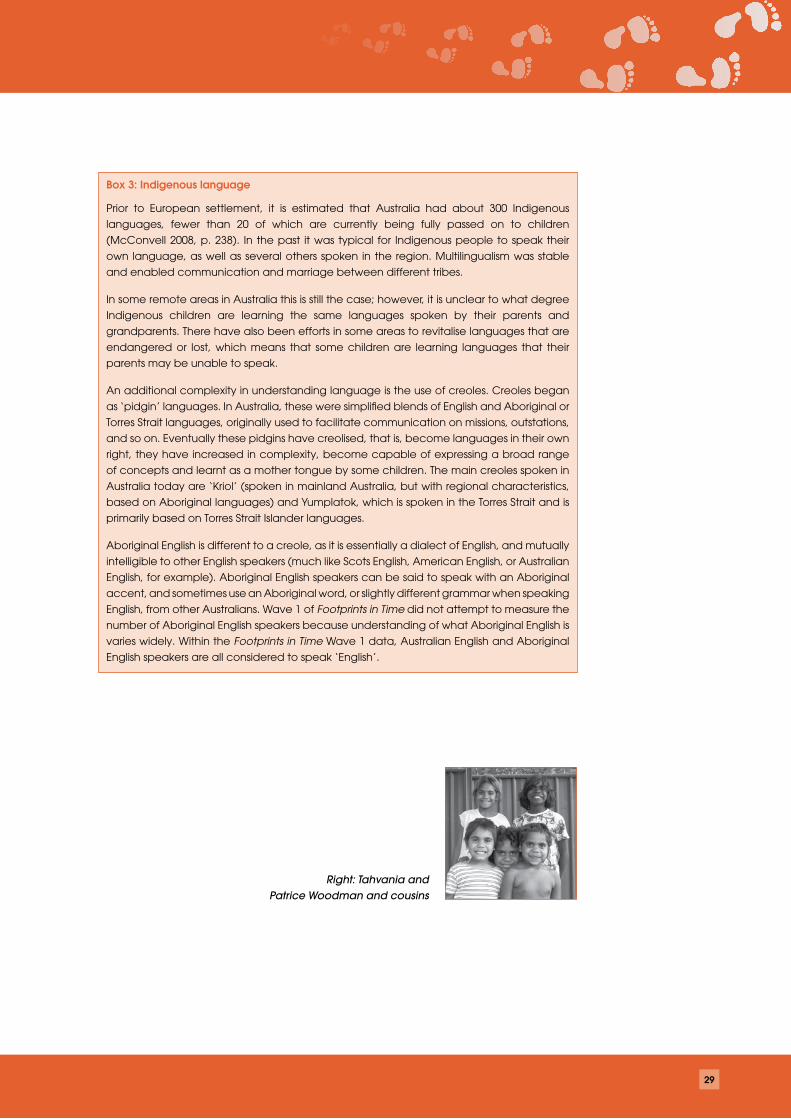
Right: Tahvania and Patrice Woodman and cousins
30 Footprints in Time: The Longitudinal Study of Indigenous Children | Key Summary Report from Wave 1
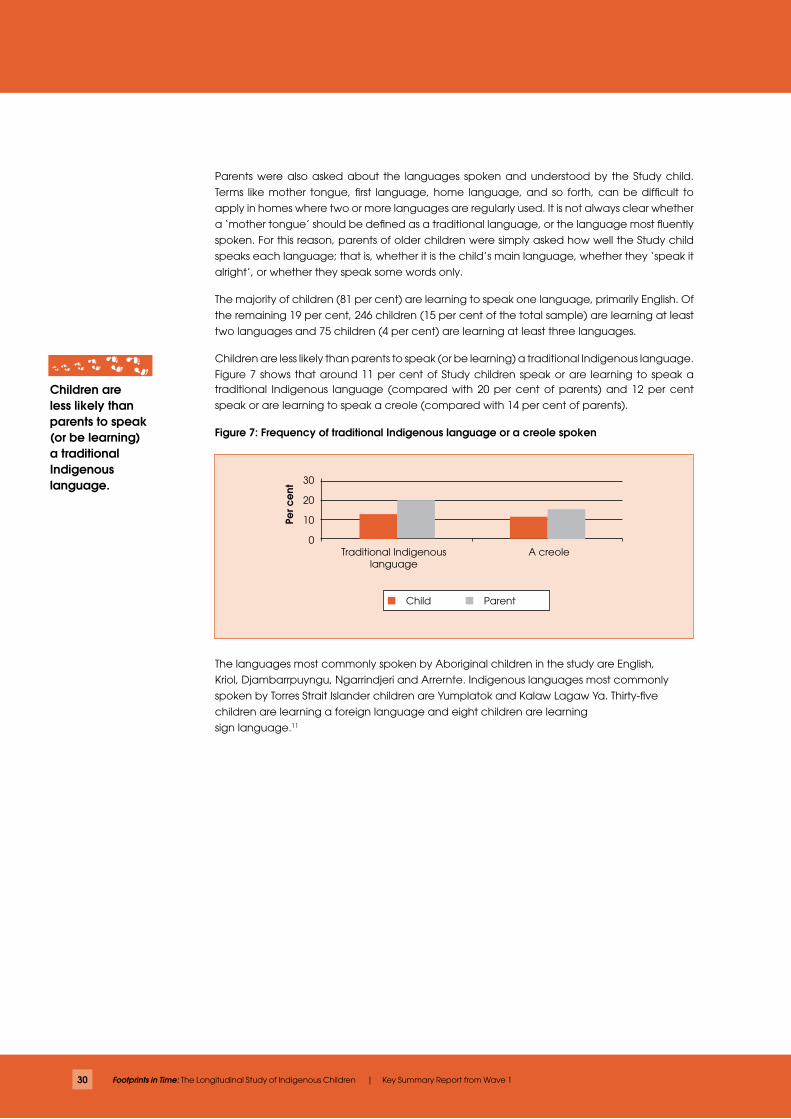
traditional Indigenous language (compared with 20 per cent of parents) and 12 per cent
speak or are learning to speak a creole (compared with 14 per cent of parents).
Figure 7: Frequency of traditional Indigenous language or a creole spoken
30
20
10
0Traditional Indigenous
language
Per c
ent
Child Parent
A creole
The languages most commonly spoken by Aboriginal children in the study are English,
Kriol, Djambarrpuyngu, Ngarrindjeri and Arrernte. Indigenous languages most commonly
spoken by Torres Strait Islander children are Yumplatok and Kalaw Lagaw Ya. Thirty-five
children are learning a foreign language and eight children are learning
sign language.11
Parents were also asked about the languages spoken and understood by the Study child.
Terms like mother tongue, first language, home language, and so forth, can be difficult to
apply in homes where two or more languages are regularly used. It is not always clear whether
a ‘mother tongue’ should be defined as a traditional language, or the language most fluently
spoken. For this reason, parents of older children were simply asked how well the Study child
speaks each language; that is, whether it is the child’s main language, whether they ‘speak it
alright’, or whether they speak some words only.
The majority of children (81 per cent) are learning to speak one language, primarily English. Of
the remaining 19 per cent, 246 children (15 per cent of the total sample) are learning at least
two languages and 75 children (4 per cent) are learning at least three languages.
Children are less likely than parents to speak (or be learning) a traditional Indigenous language.
Figure 7 shows that around 11 per cent of Study children speak or are learning to speak a Children are less likely than parents to speak (or be learning) a traditional Indigenous language.
31
GROWING UP STRONG: HEALTH, NUTRITION AND DEVELOPMENT
Maternal health
Maternal health has implications for the wellbeing of mothers and their children. The Council
of Australian Governments (COAG 2009), for example, predicts that improved maternal
health will contribute to the achievement of its target to ‘halve the gap in mortality rates
for Indigenous children under five within a decade’. Two measures important for maternal
health are antenatal care and tobacco smoking during pregnancy (SCRGSP 2009). Both were
explored in Wave 1 of Footprints in Time.
Antenatal care refers to the care given to the mother during the entire term of her pregnancy.
Regular visits to health professionals are an important component of antenatal care. Increased
antenatal visits have an impact on the health of pregnant women, foetuses, infants and
young children by enabling health risk factors to be identified and addressed (Eades 2004).
They also provide a means through which education, such as the benefits of breastfeeding,
can be provided to mothers. The World Health Organisation (WHO) recommends that mothers
in low risk categories should have at least four checkups, with the first occurring early in the first
trimester (WHO 2009).
Most mothers (97 per cent) of the Study children had checkups while pregnant, and the
majority (79 per cent) had had their first check up in the first trimester. About 95 per cent (824)
of these mothers had checkups that occurred at least once every two months.
Smoking is another important factor in antenatal health. Smoking during pregnancy has been
shown to increase the risk of complications in pregnancy and has been linked to premature
births and low birth weight (ABS & AIHW 2008). Half of the parents reported that birth mothers
smoked (or chewed tobacco) during their pregnancy with the Study child. Of these mothers
51 per cent reported that they smoked less while pregnant. Twenty–two per cent of parents
reported that the birth mother drank alcohol while pregnant with the Study child.
Birth weight and gestational age
Birth weight is a key indicator of the general health of a child. Low birth weight (less than
2,500 grams) occurs because of poor foetal growth and/or premature birth (36 weeks or
less). Low birth weight increases the risk of illness and death in early life and the development
of chronic diseases such as diabetes in adulthood (ABS & AIHW 2008; Eades 2004;
SCRGSP 2009).
A small number of Study children (12 per cent)12 weighed less than 2,500 grams when they were
born. This is similar to other figures of Indigenous birthweights (AIHW, 2009). Likewise, a small
number (11 per cent) were born prematurely (four or more weeks premature). Not surprisingly,
there was a moderately strong correlation between low birth weight and premature birth
(r=0.5, p<0.001). Approximately half (86 children) of the children who had low birth weights
were born prematurely.
Half of the parents reported that birth mothers smoked (or chewed tobacco) during their pregnancy with the Study child.
32 Footprints in Time: The Longitudinal Study of Indigenous Children | Key Summary Report from Wave 1
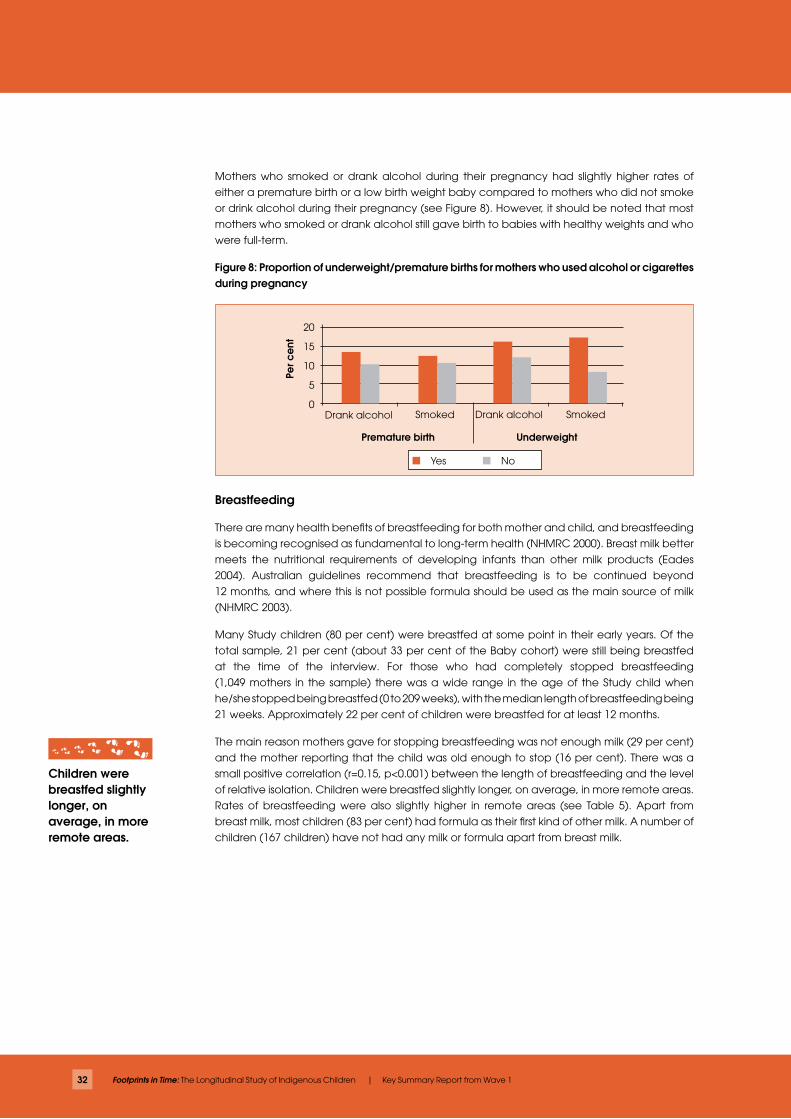
Mothers who smoked or drank alcohol during their pregnancy had slightly higher rates of
either a premature birth or a low birth weight baby compared to mothers who did not smoke
or drink alcohol during their pregnancy (see Figure 8). However, it should be noted that most
mothers who smoked or drank alcohol still gave birth to babies with healthy weights and who
were full-term.
Figure 8: Proportion of underweight/premature births for mothers who used alcohol or cigarettes during pregnancy
20
15
10
5
0Drank alcohol
Per c
ent
Yes No
Smoked SmokedDrank alcohol
Premature birth Underweight
Breastfeeding
There are many health benefits of breastfeeding for both mother and child, and breastfeeding
is becoming recognised as fundamental to long-term health (NHMRC 2000). Breast milk better
meets the nutritional requirements of developing infants than other milk products (Eades
2004). Australian guidelines recommend that breastfeeding is to be continued beyond
12 months, and where this is not possible formula should be used as the main source of milk
(NHMRC 2003).
Many Study children (80 per cent) were breastfed at some point in their early years. Of the
total sample, 21 per cent (about 33 per cent of the Baby cohort) were still being breastfed
at the time of the interview. For those who had completely stopped breastfeeding
(1,049 mothers in the sample) there was a wide range in the age of the Study child when
he/she stopped being breastfed (0 to 209 weeks), with the median length of breastfeeding being
21 weeks. Approximately 22 per cent of children were breastfed for at least 12 months.
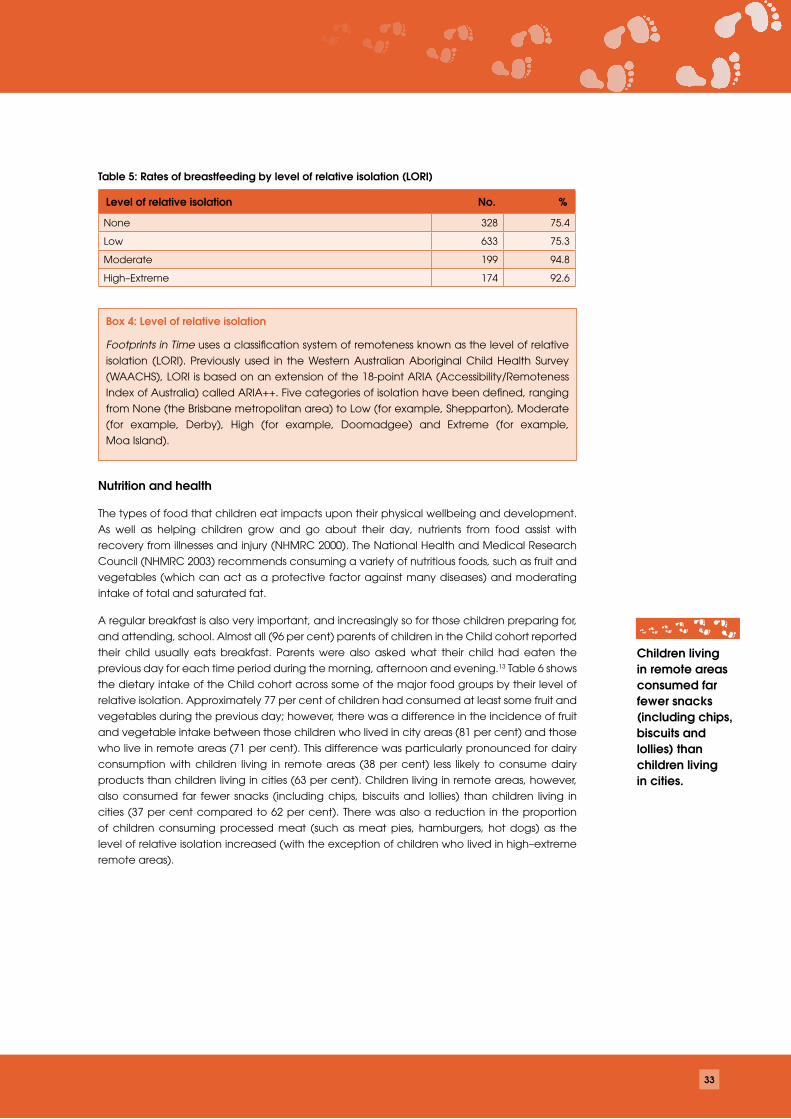
The main reason mothers gave for stopping breastfeeding was not enough milk (29 per cent)
and the mother reporting that the child was old enough to stop (16 per cent). There was a
small positive correlation (r=0.15, p<0.001) between the length of breastfeeding and the level
of relative isolation. Children were breastfed slightly longer, on average, in more remote areas.
Rates of breastfeeding were also slightly higher in remote areas (see Table 5). Apart from
breast milk, most children (83 per cent) had formula as their first kind of other milk. A number of
children (167 children) have not had any milk or formula apart from breast milk.
Children were breastfed slightly longer, on average, in more remote areas.
33
Table 5: Rates of breastfeeding by level of relative isolation (LORI)
Level of relative isolation No. %
None 328 75.4
Low 633 75.3
Moderate 199 94.8
High–Extreme 174 92.6
Nutrition and health
The types of food that children eat impacts upon their physical wellbeing and development.
As well as helping children grow and go about their day, nutrients from food assist with
recovery from illnesses and injury (NHMRC 2000). The National Health and Medical Research
Council (NHMRC 2003) recommends consuming a variety of nutritious foods, such as fruit and
vegetables (which can act as a protective factor against many diseases) and moderating
intake of total and saturated fat.
A regular breakfast is also very important, and increasingly so for those children preparing for,
and attending, school. Almost all (96 per cent) parents of children in the Child cohort reported
their child usually eats breakfast. Parents were also asked what their child had eaten the
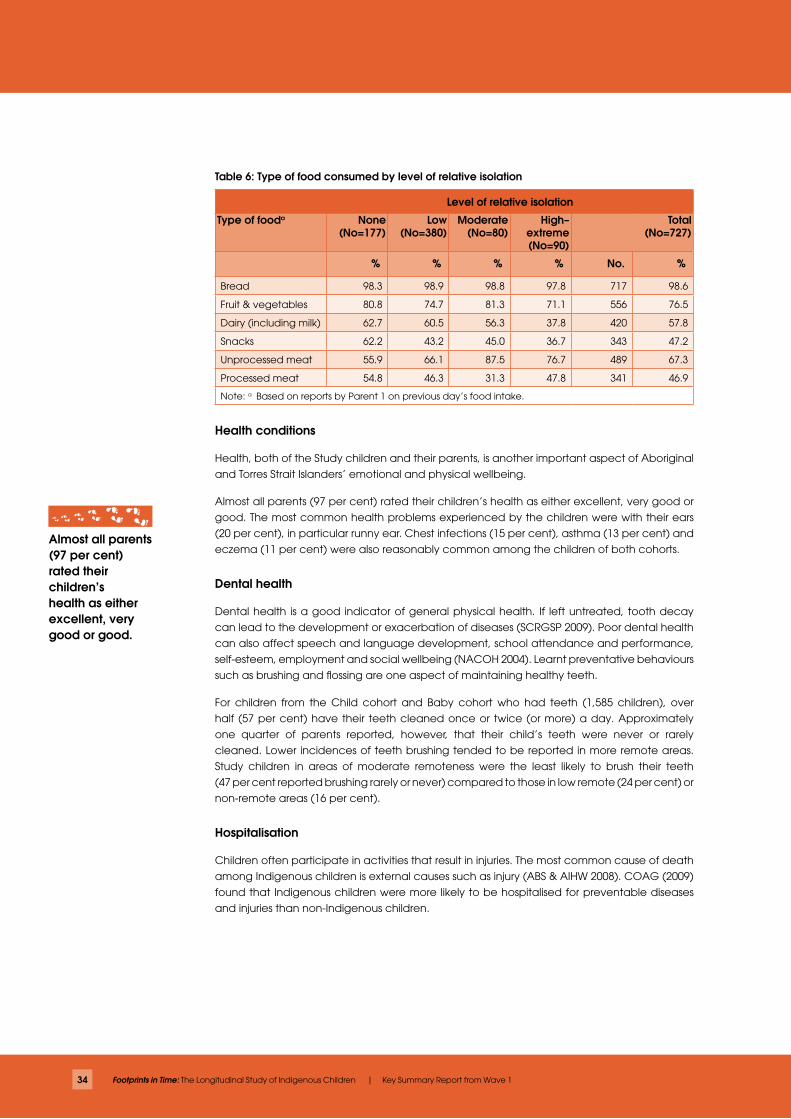
previous day for each time period during the morning, afternoon and evening.13 Table 6 shows
the dietary intake of the Child cohort across some of the major food groups by their level of
relative isolation. Approximately 77 per cent of children had consumed at least some fruit and
vegetables during the previous day; however, there was a difference in the incidence of fruit
and vegetable intake between those children who lived in city areas (81 per cent) and those
who live in remote areas (71 per cent). This difference was particularly pronounced for dairy
consumption with children living in remote areas (38 per cent) less likely to consume dairy
products than children living in cities (63 per cent). Children living in remote areas, however,
also consumed far fewer snacks (including chips, biscuits and lollies) than children living in
cities (37 per cent compared to 62 per cent). There was also a reduction in the proportion
of children consuming processed meat (such as meat pies, hamburgers, hot dogs) as the
level of relative isolation increased (with the exception of children who lived in high–extreme
remote areas).
Box 4: Level of relative isolation
Footprints in Time uses a classification system of remoteness known as the level of relative
isolation (LORI). Previously used in the Western Australian Aboriginal Child Health Survey
(WAACHS), LORI is based on an extension of the 18-point ARIA (Accessibility/Remoteness
Index of Australia) called ARIA++. Five categories of isolation have been defined, ranging
from None (the Brisbane metropolitan area) to Low (for example, Shepparton), Moderate
(for example, Derby), High (for example, Doomadgee) and Extreme (for example,
Moa Island).
Children living in remote areas consumed far fewer snacks (including chips, biscuits and lollies) than children living in cities.
34 Footprints in Time: The Longitudinal Study of Indigenous Children | Key Summary Report from Wave 1
Table 6: Type of food consumed by level of relative isolation
Level of relative isolation
Type of fooda None (No=177)
Low (No=380)
Moderate (No=80)
High–extreme (No=90)
Total (No=727)
% % % % No. %
Bread 98.3 98.9 98.8 97.8 717 98.6
Fruit & vegetables 80.8 74.7 81.3 71.1 556 76.5
Dairy (including milk) 62.7 60.5 56.3 37.8 420 57.8
Snacks 62.2 43.2 45.0 36.7 343 47.2
Unprocessed meat 55.9 66.1 87.5 76.7 489 67.3
Processed meat 54.8 46.3 31.3 47.8 341 46.9
Note: a Based on reports by Parent 1 on previous day’s food intake.
Health conditions
Health, both of the Study children and their parents, is another important aspect of Aboriginal
and Torres Strait Islanders’ emotional and physical wellbeing.
Almost all parents (97 per cent) rated their children’s health as either excellent, very good or
good. The most common health problems experienced by the children were with their ears
(20 per cent), in particular runny ear. Chest infections (15 per cent), asthma (13 per cent) and
eczema (11 per cent) were also reasonably common among the children of both cohorts.
Dental health
Dental health is a good indicator of general physical health. If left untreated, tooth decay
can lead to the development or exacerbation of diseases (SCRGSP 2009). Poor dental health
can also affect speech and language development, school attendance and performance,
self-esteem, employment and social wellbeing (NACOH 2004). Learnt preventative behaviours
such as brushing and flossing are one aspect of maintaining healthy teeth.
For children from the Child cohort and Baby cohort who had teeth (1,585 children), over
half (57 per cent) have their teeth cleaned once or twice (or more) a day. Approximately
one quarter of parents reported, however, that their child’s teeth were never or rarely
cleaned. Lower incidences of teeth brushing tended to be reported in more remote areas.
Study children in areas of moderate remoteness were the least likely to brush their teeth
(47 per cent reported brushing rarely or never) compared to those in low remote (24 per cent) or
non-remote areas (16 per cent).
Hospitalisation
Children often participate in activities that result in injuries. The most common cause of death
among Indigenous children is external causes such as injury (ABS & AIHW 2008). COAG (2009)
found that Indigenous children were more likely to be hospitalised for preventable diseases
and injuries than non-Indigenous children.
Almost all parents (97 per cent) rated their children’s health as either excellent, very good or good.
35
Parents were asked if their child had been hospitalised due to sickness, injury or because the
child required surgery. About 21 per cent of children (352 children) had been hospitalised
as least once in the previous year, or, in the case of those in the Baby cohort, since they
were born. The most common length of time spent in hospital was usually between two and
five nights.
Language and development
Parents were asked if they had concerns about their child’s language and development.
These questions were adapted from ‘Parent’s Evaluation of Developmental Status’ (PEDS),
the Australian version, with the assistance of the Centre for Community Child Health14. PEDS
is used as a screening tool to identify children from 0 to 8 years old at risk for school problems
and undetected developmental and behavioural disabilities. Early intervention increases the
likelihood of positive outcomes such as improved school attendance and holding down a job in
later life.
Most parents did not have any concerns about their child’s language and development.
For those who did have concerns, parents were most frequently concerned with how their
child talks and makes speech sounds (13 per cent). The most common reason for concern for
parents of children in both cohorts was that speech was not clear, either to family (73 children)
or to those outside the family (106 children). These concerns were reported more frequently by
parents of children in the Child cohort.
A smaller number (97 parents) were concerned with how well their child understands what is
said to them; again, mostly reported for children in the older cohort. The most common area
of concern about children’s understanding for parents of children in both cohorts was the
child having difficulty understanding what was said to them.
Some parents (12 per cent or 208 parents) also had concerns about their child’s behaviour,
again mostly among parents of the older cohort children. Fewer parents (8 per cent or
136 parents) had concerns about how their child gets along with others; however, this was
more predominant among parents of children in the Baby cohort.
Left: Charlize Winmill
Right: Jayquan Waia
Most parents did not have any concerns about their child’s language and development.
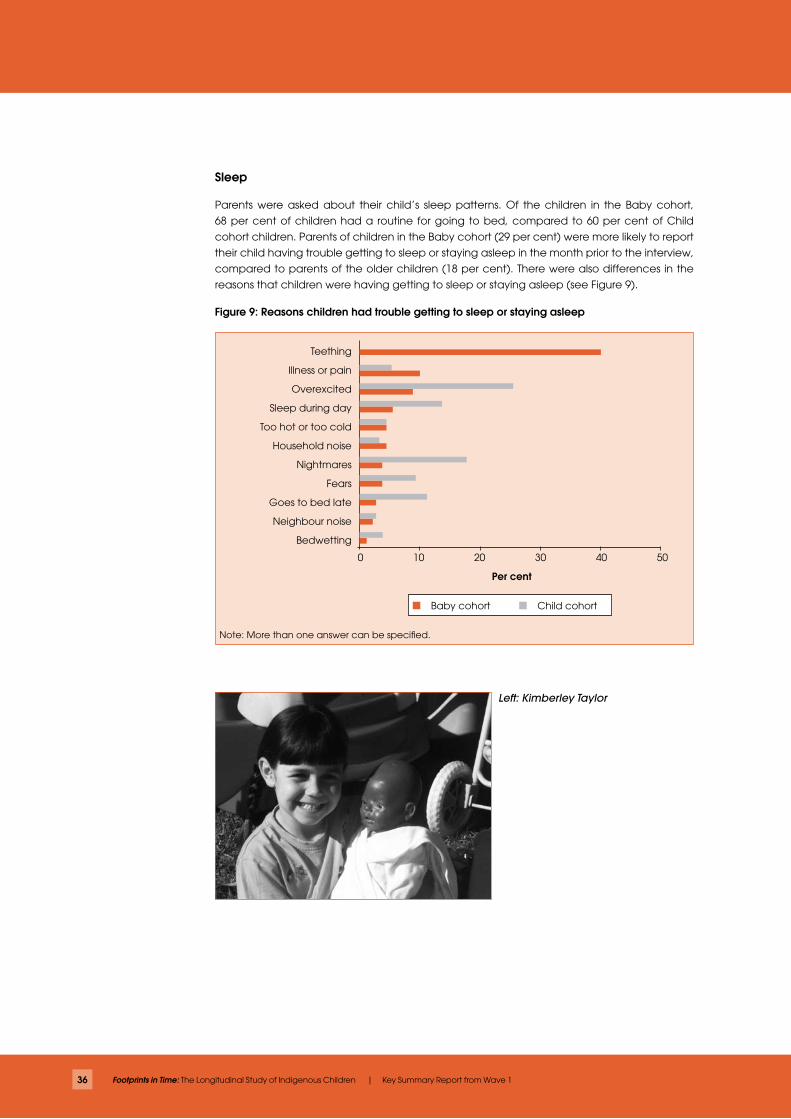
36 Footprints in Time: The Longitudinal Study of Indigenous Children | Key Summary Report from Wave 1
Sleep
Parents were asked about their child’s sleep patterns. Of the children in the Baby cohort,
68 per cent of children had a routine for going to bed, compared to 60 per cent of Child
cohort children. Parents of children in the Baby cohort (29 per cent) were more likely to report
their child having trouble getting to sleep or staying asleep in the month prior to the interview,
compared to parents of the older children (18 per cent). There were also differences in the
reasons that children were having getting to sleep or staying asleep (see Figure 9).
Figure 9: Reasons children had trouble getting to sleep or staying asleep
Teething
Illness or pain
Overexcited
Sleep during day
Too hot or too cold
Household noise
Nightmares
Fears
Goes to bed late
Neighbour noise
Bedwetting
0 10 20 30 40 50
Per cent
Baby cohort Child cohort
Note: More than one answer can be specified.
Left: Kimberley Taylor
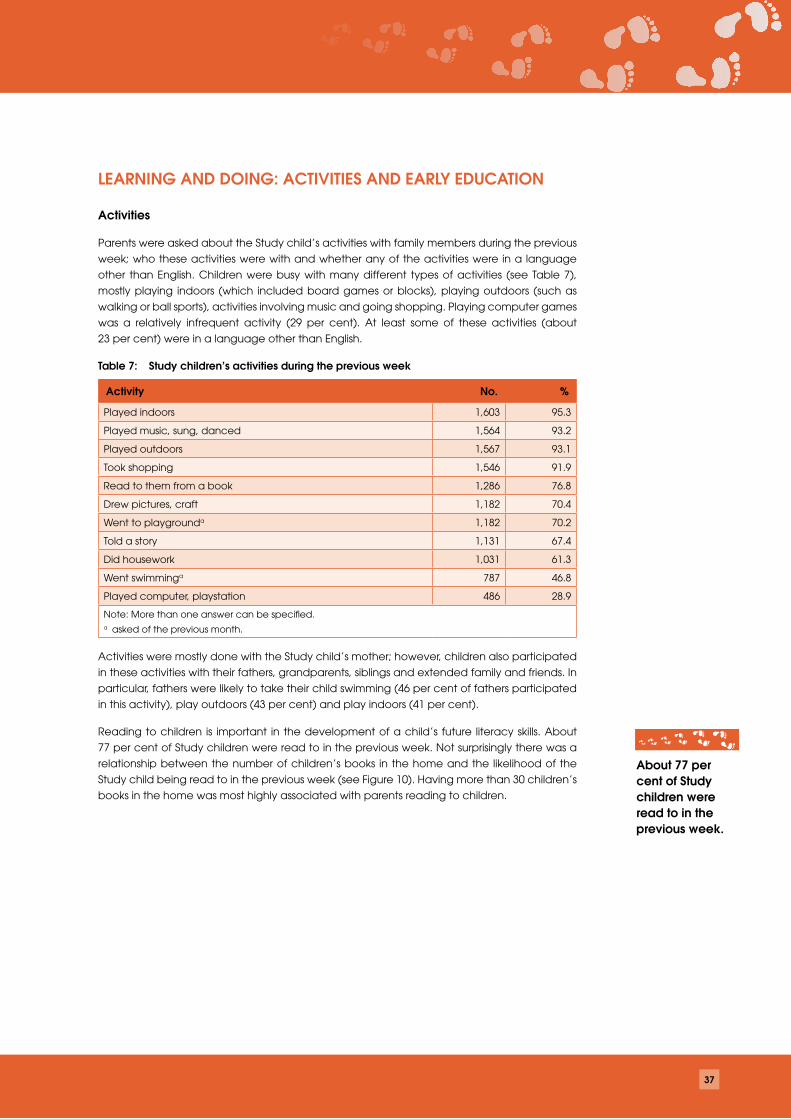
37
LEARNING AND DOING: ACTIVITIES AND EARLY EDUCATION
Activities
Parents were asked about the Study child’s activities with family members during the previous
week; who these activities were with and whether any of the activities were in a language
other than English. Children were busy with many different types of activities (see Table 7),
mostly playing indoors (which included board games or blocks), playing outdoors (such as
walking or ball sports), activities involving music and going shopping. Playing computer games
was a relatively infrequent activity (29 per cent). At least some of these activities (about
23 per cent) were in a language other than English.
Table 7: Study children’s activities during the previous week
Activity No. %
Played indoors 1,603 95.3
Played music, sung, danced 1,564 93.2
Played outdoors 1,567 93.1
Took shopping 1,546 91.9
Read to them from a book 1,286 76.8
Drew pictures, craft 1,182 70.4
Went to playgrounda 1,182 70.2
Told a story 1,131 67.4
Did housework 1,031 61.3
Went swimminga 787 46.8
Played computer, playstation 486 28.9
Note: More than one answer can be specified.a asked of the previous month.
Activities were mostly done with the Study child’s mother; however, children also participated
in these activities with their fathers, grandparents, siblings and extended family and friends. In
particular, fathers were likely to take their child swimming (46 per cent of fathers participated
in this activity), play outdoors (43 per cent) and play indoors (41 per cent).
Reading to children is important in the development of a child’s future literacy skills. About
77 per cent of Study children were read to in the previous week. Not surprisingly there was a
relationship between the number of children’s books in the home and the likelihood of the
Study child being read to in the previous week (see Figure 10). Having more than 30 children’s
books in the home was most highly associated with parents reading to children.
About 77 per cent of Study children were read to in the previous week.
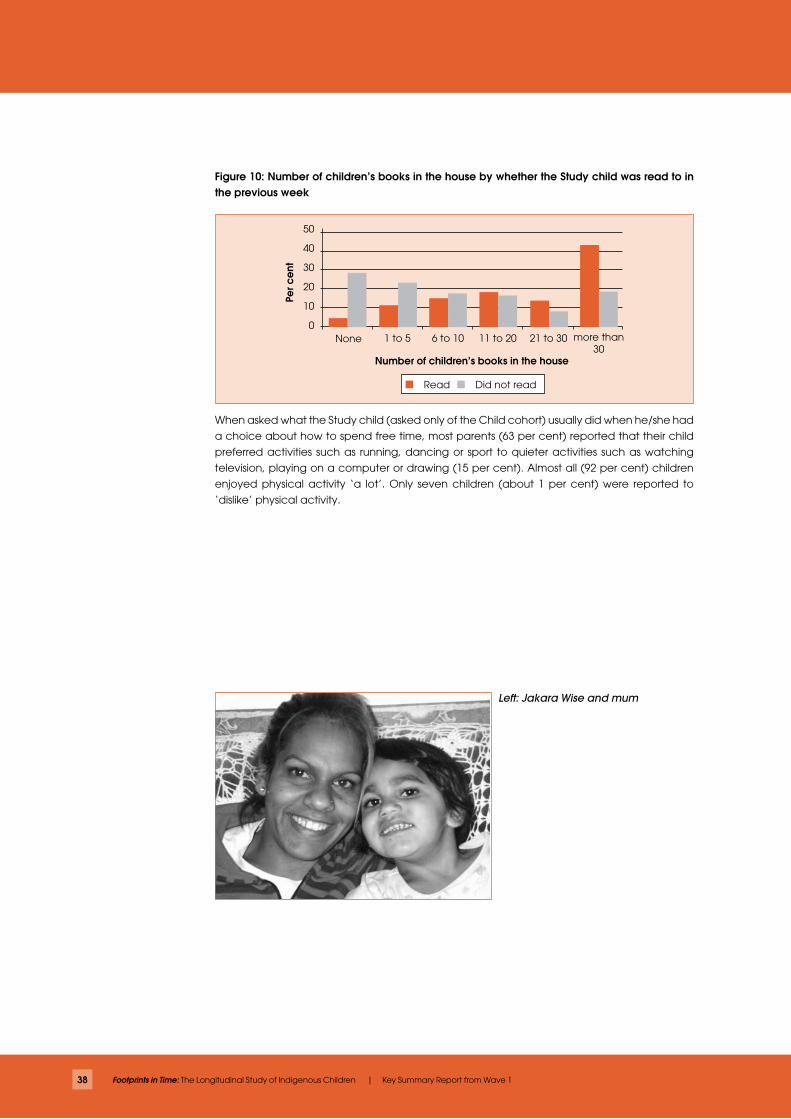
38 Footprints in Time: The Longitudinal Study of Indigenous Children | Key Summary Report from Wave 1
Figure 10: Number of children’s books in the house by whether the Study child was read to in the previous week
50
40
30
20
10
0None
Per c
ent
Read Did not read
1 to 5 11 to 206 to 10
Number of children’s books in the house
21 to 30 more than 30
When asked what the Study child (asked only of the Child cohort) usually did when he/she had
a choice about how to spend free time, most parents (63 per cent) reported that their child
preferred activities such as running, dancing or sport to quieter activities such as watching
television, playing on a computer or drawing (15 per cent). Almost all (92 per cent) children
enjoyed physical activity ‘a lot’. Only seven children (about 1 per cent) were reported to
‘dislike’ physical activity.
Left: Jakara Wise and mum
39
Box 5: What the parents say
How do Study children spend their time?
“When his dad and his brother are fixing stuff downstairs, like the mowers and bikes, he is right in there amongst it, with the tools, running off with his tools. Just follows them, and copies them. We take him to the library to get computer programs. Loves it. And the kids play area downstairs at the library—he goes mad, squealing, yelling. And he loves reading books, bringing the books home.”
“He loves to play football … he is just constantly football, football, football, football. If it’s not football it’s wrestling. And he loves his horses, goes to feed the horses with Poppy quite a bit. Just recently, one of his Poppy’s horses had a foal, so… he was getting all happy and laughing because it was trying to stand up and falling back down and then it got up and the legs were real jelly. He was like yeah carrying on because he’s full of energy as it is … he thought it was great.”
What do you enjoy doing with Study child?
“I love sitting down and drawing with her; love taking her to the park and playing outside and trying to make up bonding one on one time with her because she was taken away from me at birth and so I’m trying to spend as much time with her now.”
“Everything I do I love doing with her.”
“Playing, singing, take him for walk, reading a book to him, yarning.”
“Sitting down yarning, talking, telling him stories, taking him bush, taking him fishing.”
“Reading his books and playing outside with the ball and dancing to the Wiggles.”
What does Study child enjoy doing with you?
“Fight with me, kiss me, pull my hair and love me up.”
“Be everywhere I am, follow me around, help with cleaning, she likes it when I nurse her to sleep, just that togetherness she likes doing everything with me, she loves playing peek a boo—everyday.”
“The dishes, making beds, folding clothes.”
“Going for walks, sits on my shoulder when we go up town and out bush.”
“Listening to music, likes dancing, starting to learn how to write her name, talking about school.”
“Tormenting Nan, jumping on trampoline, ratting through drawers etc.”
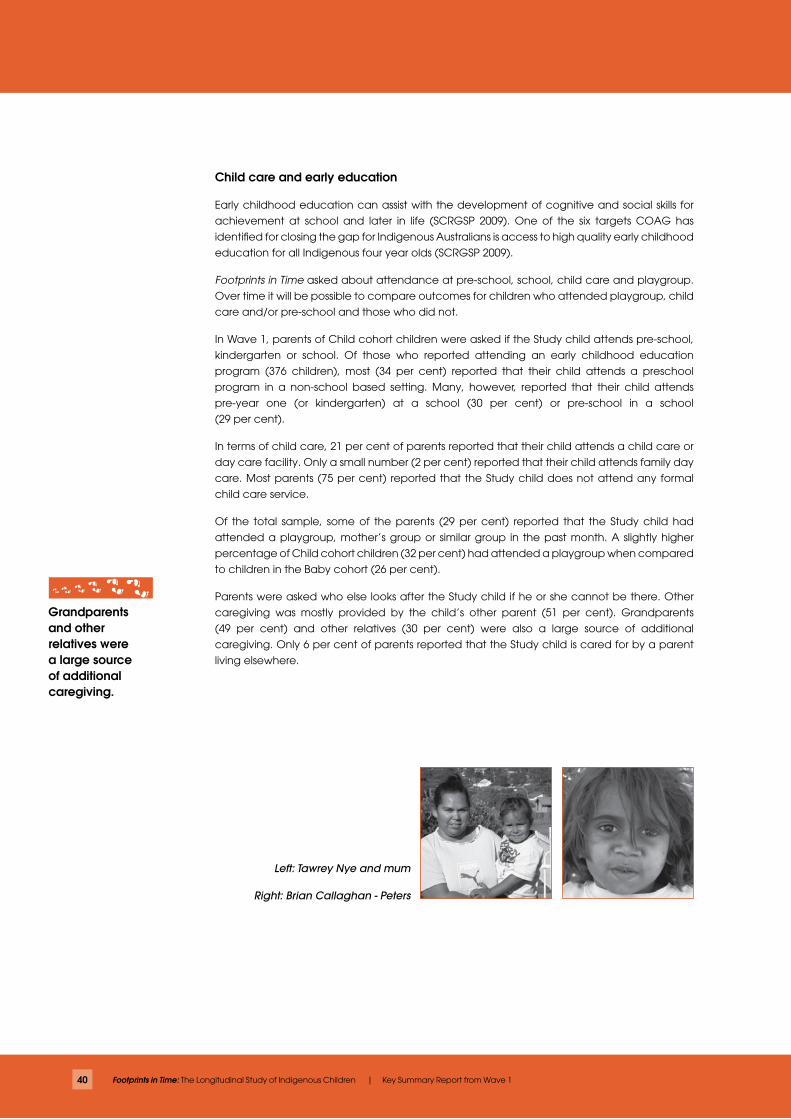
40 Footprints in Time: The Longitudinal Study of Indigenous Children | Key Summary Report from Wave 1
Child care and early education
Early childhood education can assist with the development of cognitive and social skills for
achievement at school and later in life (SCRGSP 2009). One of the six targets COAG has
identified for closing the gap for Indigenous Australians is access to high quality early childhood
education for all Indigenous four year olds (SCRGSP 2009).
Footprints in Time asked about attendance at pre-school, school, child care and playgroup.
Over time it will be possible to compare outcomes for children who attended playgroup, child
care and/or pre-school and those who did not.
In Wave 1, parents of Child cohort children were asked if the Study child attends pre-school,
kindergarten or school. Of those who reported attending an early childhood education
program (376 children), most (34 per cent) reported that their child attends a preschool
program in a non-school based setting. Many, however, reported that their child attends
pre-year one (or kindergarten) at a school (30 per cent) or pre-school in a school
(29 per cent).
In terms of child care, 21 per cent of parents reported that their child attends a child care or
day care facility. Only a small number (2 per cent) reported that their child attends family day
care. Most parents (75 per cent) reported that the Study child does not attend any formal
child care service.
Of the total sample, some of the parents (29 per cent) reported that the Study child had
attended a playgroup, mother’s group or similar group in the past month. A slightly higher
percentage of Child cohort children (32 per cent) had attended a playgroup when compared
to children in the Baby cohort (26 per cent).
Parents were asked who else looks after the Study child if he or she cannot be there. Other
caregiving was mostly provided by the child’s other parent (51 per cent). Grandparents
(49 per cent) and other relatives (30 per cent) were also a large source of additional
caregiving. Only 6 per cent of parents reported that the Study child is cared for by a parent
living elsewhere.
Left: Tawrey Nye and mum
Right: Brian Callaghan - Peters
Grandparents and other relatives were a large source of additional caregiving.
41
STRONG SOULS, SAFE COMMUNITIES: WELLBEING, RESILIENCE AND SUPPORT
Parental warmth
Parental warmth is an important factor in successful parenting (Baumrind 1996). Of parents
who had children in the older cohort, most reported warm relationships with their child. For
example, 93 per cent of parents indicated they ‘always’ or ‘often’ hugged their child for no
particular reason. Ninety-two per cent indicated that when the child does something really
well, they ‘always’ or ‘often’ go out of their way to say how pleased they are.
Many parents responded that they rarely (21 per cent) or never (35 per cent) sent the Study
child to the bedroom to manage his/her behaviour but did ensure the Study child completed
something he/she was asked to do (40 per cent). Very few parents (7 per cent) used smacking
to manage the Study child’s behaviour but responded that they did use verbal methods
(for example, yelling) if he/she did something wrong (34 per cent).15
Social and emotional wellbeing
About 1,500 parents agreed to talk about their feelings and were asked a series of questions
about ‘big worries, stress and sadness’. Concepts of stress do not always translate well, particularly
for families living in remote areas. Footprints in Time uses a small number of the questions
developed by the Menzies School of Health Research for their Aboriginal Birth Cohort Study. 16
The questions, which include parents being asked to report physical symptoms, were intended
to detect the frequency with which parents had been feeling depressed, anxious, angry
or impulsive.
Table 8 summarises the results for parents who report that they felt these things ‘a fair bit’ or
‘lots’. Around 21 per cent of parents reported getting ‘angry real quick’ and/or feeling ‘every
thing is hard work’ a ‘fair bit’ or ‘lots’.
Table 8: Frequency of big worries, stress and sadness
Fair bit/lots %
Get angry or wild real quick? 20.8
Felt everything is hard work? 18.9
Felt so worried your stomach got upset? 16.5
Stopped liking things that used to be fun? 15.8
Do silly things without thinking that you feel shame about the next day? 6.2
Felt so worried it is hard to breathe? 5.9
Felt so sad nothing could cheer you up? 5.8
93 per cent of parents indicated they ‘always’ or ‘often’ hugged their child for no particular reason.
42 Footprints in Time: The Longitudinal Study of Indigenous Children | Key Summary Report from Wave 1
Supportive families
Having a strong support base is important for a primary care giver when raising their child.
Research shows that mothers who have a strong support base, such as extended family
and friends, may be more consistent in their parenting style and more nurturing towards
their child (Rosario & McLoyd 2002). In Aboriginal and Torres Strait Islander households, the
extended family may play a much larger role in parenting than in non-Indigenous families
(Raising Children Network 2008).
Parents were asked a series of questions about the family and friends who support them as well
as their own personal and cultural resources.17 Around 71 per cent of parents said that they
have a strong family who help each other ‘always’, with a further 13 per cent of parents saying
that their family helps each other ‘most times’ (see Table 9).
Similarly, the majority of parents (74 per cent) felt that they always had someone to talk
to when they are sad or upset, or had an older person who always looked out for them
(71 per cent). Most parents felt that they had ‘lots’ of, or a ‘fair few’ friends (48 per cent and
34 per cent respectively).
Table 9: Feelings of support for parents from family and friends
Always/most times %
Sometimes/not really %
You are a good son or daughter to your family. 90.7 9.3
You know someone who is a really good person. 90.3 9.7
When you’re sad or upset you have a person that you can talk to.
87.9 12.1
You have a strong family who help each other. 84.7 15.3
You laugh and make jokes a lot. 84.2 15.8
You know lots about whitefella waysa. 83.9 16.2
You got an older person looking out for you. 83.0 17.0
You got lots of friends. 82.6 17.4
You are really into something. 82.1 17.9
You get used to big changes in your life fairly quickly. 80.7 19.3
When you get sad or upset, you’re able to find something that cheers you up.
72.6 27.4
People say that you are really good at something. 72.3 27.7
You know a lot about your Aboriginal or Torres Strait Islander family history and cultureb.
66.8 33.2
Notes: Percentages may not sum to 100 due to rounding.
For some items the response categories differ from ‘fair bit’ and ‘lots’.a Only asked of Aboriginal /Torres Strait Islander participants.b Non-Indigenous parents were asked: you understand a lot about Aboriginal of Torres Strait Islander
history and culture
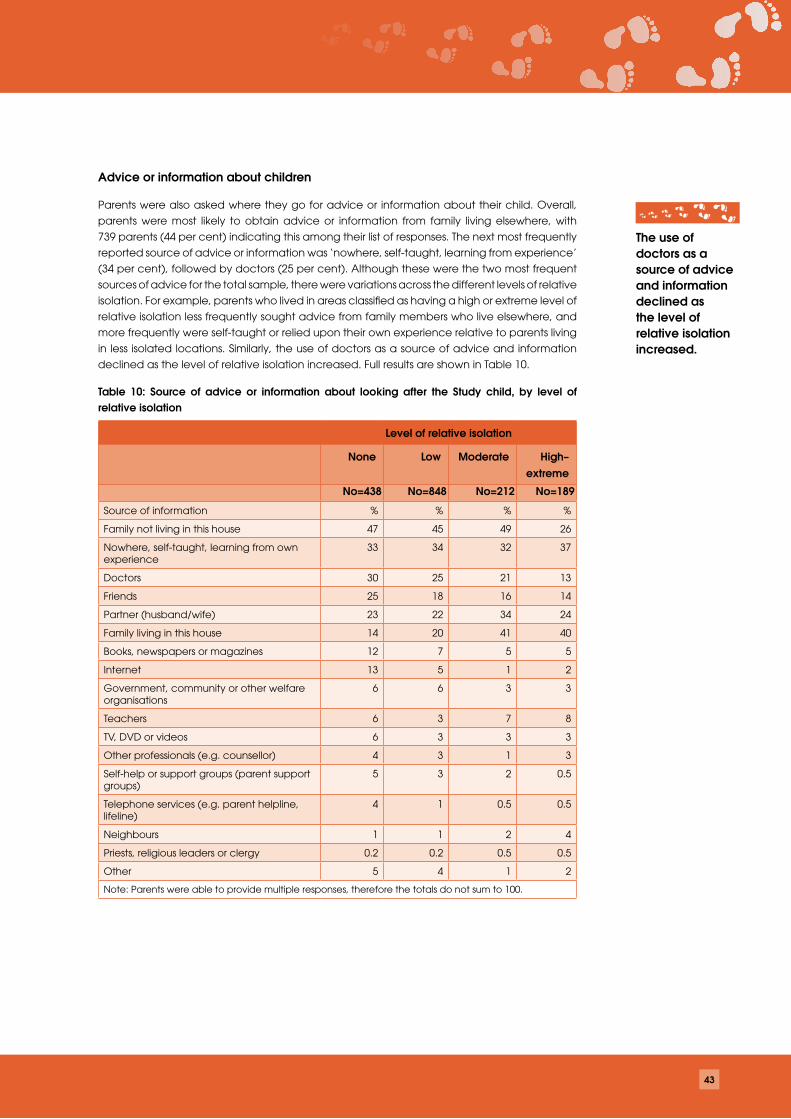
43
Advice or information about children
Parents were also asked where they go for advice or information about their child. Overall,
parents were most likely to obtain advice or information from family living elsewhere, with
739 parents (44 per cent) indicating this among their list of responses. The next most frequently
reported source of advice or information was ‘nowhere, self-taught, learning from experience’
(34 per cent), followed by doctors (25 per cent). Although these were the two most frequent
sources of advice for the total sample, there were variations across the different levels of relative
isolation. For example, parents who lived in areas classified as having a high or extreme level of
relative isolation less frequently sought advice from family members who live elsewhere, and
more frequently were self-taught or relied upon their own experience relative to parents living
in less isolated locations. Similarly, the use of doctors as a source of advice and information
declined as the level of relative isolation increased. Full results are shown in Table 10.
Table 10: Source of advice or information about looking after the Study child, by level of relative isolation
Level of relative isolation
None Low Moderate High–extreme
No=438 No=848 No=212 No=189
Source of information % % % %
Family not living in this house 47 45 49 26
Nowhere, self-taught, learning from own experience
33 34 32 37
Doctors 30 25 21 13
Friends 25 18 16 14
Partner (husband/wife) 23 22 34 24
Family living in this house 14 20 41 40
Books, newspapers or magazines 12 7 5 5
Internet 13 5 1 2
Government, community or other welfare organisations
6 6 3 3
Teachers 6 3 7 8
TV, DVD or videos 6 3 3 3
Other professionals (e.g. counsellor) 4 3 1 3
Self-help or support groups (parent support groups)
5 3 2 0.5
Telephone services (e.g. parent helpline, lifeline)
4 1 0.5 0.5
Neighbours 1 1 2 4
Priests, religious leaders or clergy 0.2 0.2 0.5 0.5
Other 5 4 1 2
Note: Parents were able to provide multiple responses, therefore the totals do not sum to 100.
The use of doctors as a source of advice and information declined as the level of relative isolation increased.
44 Footprints in Time: The Longitudinal Study of Indigenous Children | Key Summary Report from Wave 1
Major life events
Findings from the Western Australia Aboriginal Child Health survey (Zubrick et al. 2005) suggest
that the number of stressful life events that occur in a single period can impact on a family’s
ability to cope. For example, Zubrick et al. (2005) found that where fewer than three stressful
events occurred, around 15 per cent of 4 to 11 year-old children were at high risk of clinically
significant emotional or behavioural difficulties. The percentage of children at risk of emotional
or behavioural difficulties increased to 25 per cent for families who experienced between
three and six stressful events, while the percentage of children at risk of difficulties rose to
42 per cent in families who experienced seven or more stressful events.
In Footprints in Time, parents were asked 14 questions about things that might cause significant
stress, including whether they, or close family members, had been hurt, sick, had a family
member or friend pass away, had lost or found work, been humbugged18 and whether the
Study child or any other child had been badly scared by another’s behaviour. For many of
these questions, a follow-up question about whether the event had happened to someone
within or outside of the household was asked, which provides a way to gauge the direct
impact of the major life event on the Study child.
Around one-third of parents (544) had fewer than three major life events occur in the previous
12 months.19 Nearly half of the parents (831) reported experiencing three to six major life events
in the past year, and around one-fifth of parents (19 per cent) reported seven or more major
life events in the previous year. The most commonly reported major life event was pregnancy
or the birth of a child, which was experienced by 1,036 parents (62 per cent), followed by the
death of a close family member or friend (50 per cent). The least common event was any of
the Study child’s parents or carers losing a job (8 per cent). The frequency with which each
different type of major life event occurred is shown in Figure 11.
The most commonly reported major life event in the past year was pregnancy or the birth of a child.
Zahdein Pearson-Bowie
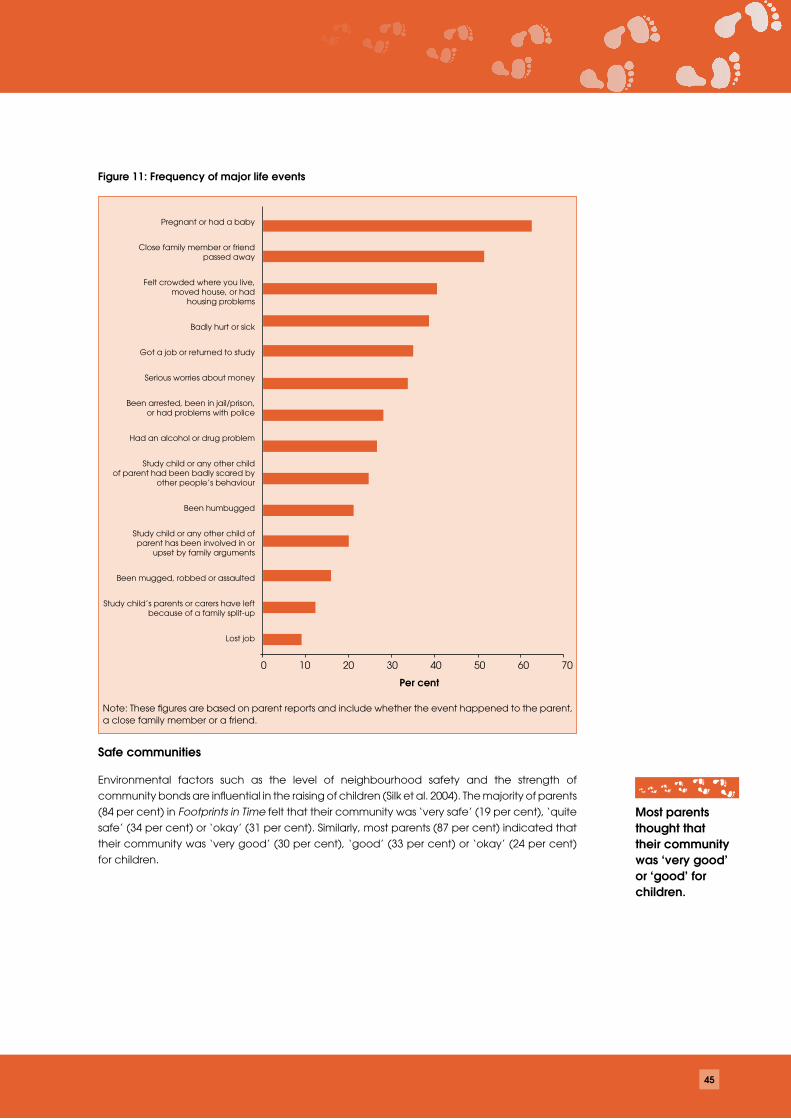
45
Figure 11: Frequency of major life events
Pregnant or had a baby
Close family member or friend passed away
Felt crowded where you live, moved house, or had
housing problems
Badly hurt or sick
Got a job or returned to study
Serious worries about money
Been arrested, been in jail/prison, or had problems with police
Had an alcohol or drug problem
Study child or any other child of parent had been badly scared by
other people’s behaviour
Been humbugged
Study child or any other child of parent has been involved in or
upset by family arguments
Been mugged, robbed or assaulted
Study child’s parents or carers have left because of a family split-up
Lost job
0 10 20 30 40 50 60 70
Note: These figures are based on parent reports and include whether the event happened to the parent, a close family member or a friend.
Safe communities
Environmental factors such as the level of neighbourhood safety and the strength of
community bonds are influential in the raising of children (Silk et al. 2004). The majority of parents
(84 per cent) in Footprints in Time felt that their community was ‘very safe’ (19 per cent), ‘quite
safe’ (34 per cent) or ‘okay’ (31 per cent). Similarly, most parents (87 per cent) indicated that
their community was ‘very good’ (30 per cent), ‘good’ (33 per cent) or ‘okay’ (24 per cent)
for children.
Most parents thought that their community was ‘very good’ or ‘good’ for children.
Per cent
46 Footprints in Time: The Longitudinal Study of Indigenous Children | Key Summary Report from Wave 1
Of the 222 parents who indicated that their community was ‘not so good’ (11 per cent) or
‘really bad’ (2 per cent), most reported it was due to alcohol issues, drugs, violence, crime or
speeding cars and heavy traffic. Others mentioned problems such as wild dogs who might
attack children, or broken and dirty playground equipment.
In terms of having good places for children to play in the community or neighbourhood,
858 parents (51 per cent) felt that there were ‘lots of parks and playgrounds’, or ‘a few places
that are good’ for children to play. A further 353 parents (21 per cent) thought there were
‘some places that are okay’. However, 27 per cent of parents felt there were ‘not many’ or no
places for children to play.
Feelings of unfair treatment or discrimination
Parents were asked whether they felt they had ever been subject to unfair treatment or
discrimination. The majority of parents (69 per cent) did not believe they had ever been treated
unfairly or discriminated against. Around 19 per cent of parents felt they had experienced
unfair treatment or discrimination ‘a little bit’, and 10 per cent of parents felt that they had
experienced discrimination a ‘fair bit’ (7 per cent) or ‘lots of times’ (5 per cent). Not all parents
provided information about their feelings on this question, with 289 parents not answering
this question.
Box 6: Parents’ hopes for their children
All parents want the best for their children. The Footprints in Time parents most wanted their
children to receive a good education and have the opportunity for a good career as well
as being healthy, happy, independent and successful.
Parents’ wishes for their children also included that they feel safe in their community and be
financially and emotionally secure. Also important was for children to have a strong sense
of cultural identity, pride in their cultural background, to have a good sense of ‘right and
wrong’—and to be a ‘good person’. Here’s what many parents identified as their main
hopes for their children.
“I want my kids to grow up (with) … old-fashioned morals, standards.”
“Be happy, learn his culture, get a good education and get a good job.”
“Good education so he can have an opportunity to do what ever he wants.”
“…having a choice in life, having her own thoughts, making her own decisions, and learning from herself.”
“To grow up knowing right from wrong, to know who his family is and where he comes from.”
Around 19 per cent of parents felt they had experienced unfair treatment or discrimination ‘a little bit’, and 10 per cent of parents felt that they had experienced discrimination a ‘fair bit’
47
Conclusion
The Wave 1 data of Footprints in Time provide a unique insight into the lives of Aboriginal and
Torres Strait Islander children.
While it is not possible in this report to summarise all of the data items or to examine all of the
relationships between variables, it is hoped that this preliminary overview will provide examples
of the types of rich information collected in the study as well as helping to generate further,
in-depth questions. Researchers are encouraged to apply for dataset access in order to
answer those questions and further explore factors that may contribute to improving outcomes
for Indigenous children.
Left: Roberta Dixon
Right: Dorothy Sabatino
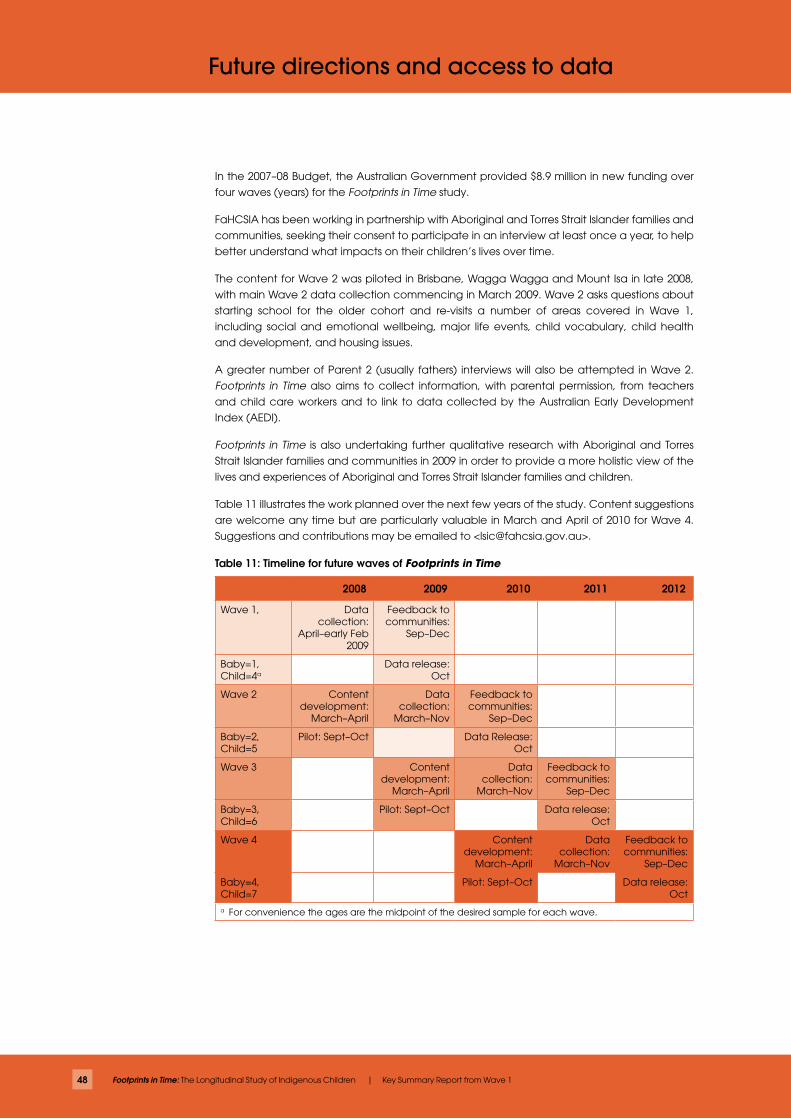
48 Footprints in Time: The Longitudinal Study of Indigenous Children | Key Summary Report from Wave 1
In the 2007–08 Budget, the Australian Government provided $8.9 million in new funding over
four waves (years) for the Footprints in Time study.
FaHCSIA has been working in partnership with Aboriginal and Torres Strait Islander families and
communities, seeking their consent to participate in an interview at least once a year, to help
better understand what impacts on their children’s lives over time.
The content for Wave 2 was piloted in Brisbane, Wagga Wagga and Mount Isa in late 2008,
with main Wave 2 data collection commencing in March 2009. Wave 2 asks questions about
starting school for the older cohort and re-visits a number of areas covered in Wave 1,
including social and emotional wellbeing, major life events, child vocabulary, child health
and development, and housing issues.
A greater number of Parent 2 (usually fathers) interviews will also be attempted in Wave 2.
Footprints in Time also aims to collect information, with parental permission, from teachers
and child care workers and to link to data collected by the Australian Early Development
Index (AEDI).
Footprints in Time is also undertaking further qualitative research with Aboriginal and Torres
Strait Islander families and communities in 2009 in order to provide a more holistic view of the
lives and experiences of Aboriginal and Torres Strait Islander families and children.
Table 11 illustrates the work planned over the next few years of the study. Content suggestions
are welcome any time but are particularly valuable in March and April of 2010 for Wave 4.
Suggestions and contributions may be emailed to <[email protected]>.
Table 11: Timeline for future waves of Footprints in Time
2008 2009 2010 2011 2012
Wave 1, Data collection:
April–early Feb 2009
Feedback to communities:
Sep–Dec
Baby=1, Child=4a
Data release: Oct
Wave 2 Content development:
March–April
Data collection:
March–Nov
Feedback to communities:
Sep–Dec
Baby=2, Child=5
Pilot: Sept–Oct Data Release: Oct
Wave 3 Content development:
March–April
Data collection:
March–Nov
Feedback to communities:
Sep–Dec
Baby=3, Child=6
Pilot: Sept–Oct Data release: Oct
Wave 4 Content development:
March–April
Data collection:
March–Nov
Feedback to communities:
Sep–Dec
Baby=4, Child=7
Pilot: Sept–Oct Data release: Oct
a For convenience the ages are the midpoint of the desired sample for each wave.
Future directions and access to data
49
Data access
The official public release of Wave 1 data was on 20 October 2009. Footprints in Time data
will be made available to researchers approved by FaHCSIA. There are strict security and
confidentiality protocols surrounding use of the data. The dataset is confidentialised and
personal details are removed. Prospective users will be required to complete a dataset
application and read and sign a Deed of Licence.
Queries about the study or the data should be forwarded to [email protected].
Queries about applying for the data or licensing arrangements should be sent to
The arrangements for access are very similar to those already applying for access to the
datasets for the Longitudinal Study of Australian Children (LSAC) and the Household, Income
and Labour Dynamics in Australia (HILDA) survey. However there is additional information that
Footprints in Time applicants need to provide.
Users affiliated with an organisation which has signed an Organisational Deed of Licence ��
will need to contact their Data Manager and sign a Deed of Confidentiality and the
Footprints in Time data protocols. A complete list of organisations with an Organisational
Deed of Licence is found at either:
<http://www.aifs.gov.au/growingup/data.html> or
<http://www.melbourneinstitute.com/hilda/data.html>.
Users from all other organisations will need to enter an Organisational Deed of Licence ��
or have individual users sign an Individual Deed of Licence.
For more information, refer to the Manual for the access to and use of FaHCSIA longitudinal ��
survey datasets, which can be found at the sites mentioned above.
Those who are interested in applying for the Footprints in Time data should read Section 9 and
Appendix A in the Manual before completing their application. Data Managers will also need
to become familiar with these new sections.
Protocols
There are three key interrelated protocols that Footprints in Time data users need to follow
when working with the data, in addition to the formal requirements set out in the manual and
the relevant licence deeds.
The first protocol requires applicants and licensed users to openly acknowledge their
standpoint in their application and in the reporting of data outputs in reports or publications.
This is a declaration of the context in which the data analysis is being generated, for example,
their institutional context and whether in a university, government department, community
organisation or cross-sector partnership. This will also require declaring one’s personal context,
50 Footprints in Time: The Longitudinal Study of Indigenous Children | Key Summary Report from Wave 1
such as cultural background, work background, depth of experience liaising with Aboriginal
and Torres Strait Islander people and prior research/publications in the area.
The second protocol is a demonstration of cultural competency. Cultural competency refers
to the need to respect, understand and acknowledge the benefits, values and realities of
Indigenous people and communities. This includes being mindful of Indigenous people’s right
to have different values, norms and aspirations to non-Indigenous people. Analysts should
recognise that Indigenous communities are diverse, with different languages, cultures, histories
and perspectives, as well as the diversity of individuals within these communities. Researchers
need to be cognisant of diversity by showing an understanding and appreciation of these
differences in the analysis, interpretation and reporting of the data.
The third protocol deals with the final research material. Data users need to provide FaHCSIA
with their final research material so that the department can honour its commitment to give
Aboriginal and Torres Strait Islander peoples and communities (particularly those involved in the
study) feedback on how the data is being used and a summary of research project findings.
This also allows FaHCSIA to make publicly available a bibliography of all final research material
using Footprints in Time data to encourage uptake of findings, avoid research duplication and
facilitate collaboration and the progressive building upon research findings.
It is important that the findings generated from the Footprints in Time data are made available
so they can contribute in the policy, planning, evaluation, management and delivery of
services. In accordance with the Deed of Licence, the final research material can also be used
across the Australian Government to support internal policy development and evaluation.
These unique Footprints in Time protocols have been developed in consultation with the
Data Protocol Subcommittee of Aboriginal members. Applicants need to provide a response
regarding adherence to the protocols in the data application form.
For further information please email <[email protected]>.
Learning more
More information on Footprints in Time and its progress can be found on the Footprints in Time
website at <http://www.fahcsia.gov.au/lsic>.
Left: Thomas Notlo
Right: Kyiesha Weldon - Barrett
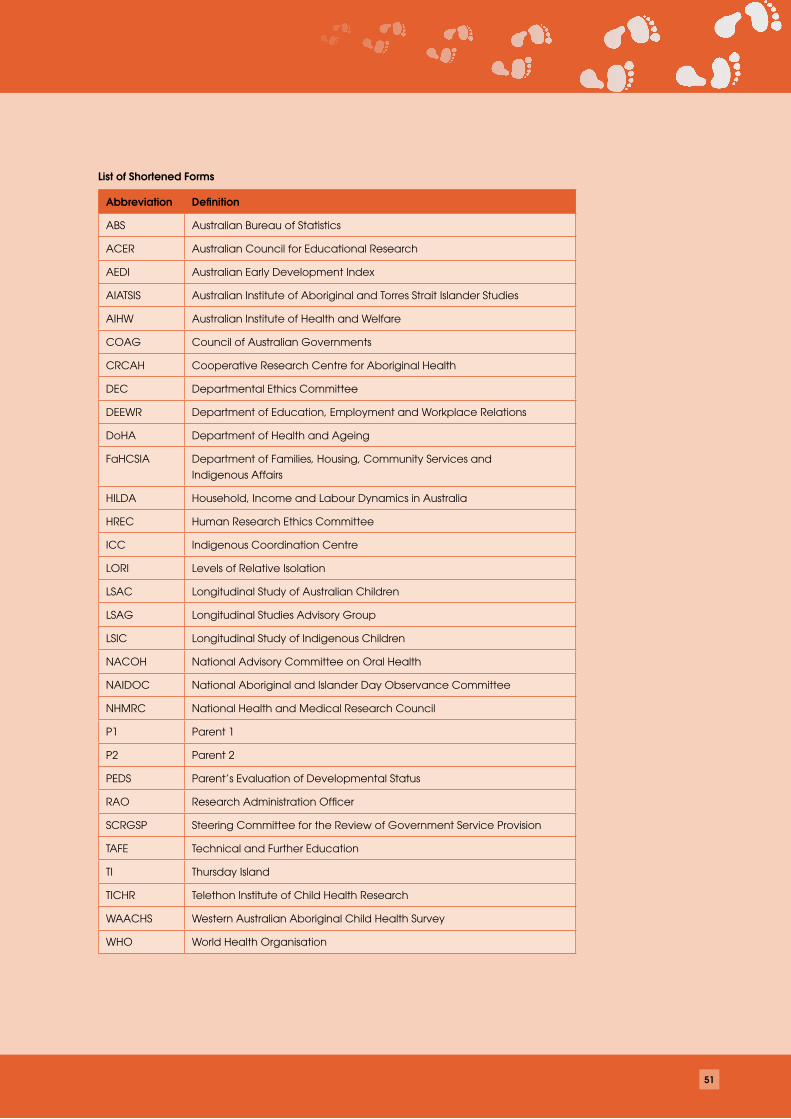
51
List of Shortened Forms
Abbreviation Definition
ABS Australian Bureau of Statistics
ACER Australian Council for Educational Research
AEDI Australian Early Development Index
AIATSIS Australian Institute of Aboriginal and Torres Strait Islander Studies
AIHW Australian Institute of Health and Welfare
COAG Council of Australian Governments
CRCAH Cooperative Research Centre for Aboriginal Health
DEC Departmental Ethics Committee
DEEWR Department of Education, Employment and Workplace Relations
DoHA Department of Health and Ageing
FaHCSIA Department of Families, Housing, Community Services and
Indigenous Affairs
HILDA Household, Income and Labour Dynamics in Australia
HREC Human Research Ethics Committee
ICC Indigenous Coordination Centre
LORI Levels of Relative Isolation
LSAC Longitudinal Study of Australian Children
LSAG Longitudinal Studies Advisory Group
LSIC Longitudinal Study of Indigenous Children
NACOH National Advisory Committee on Oral Health
NAIDOC National Aboriginal and Islander Day Observance Committee
NHMRC National Health and Medical Research Council
P1 Parent 1
P2 Parent 2
PEDS Parent’s Evaluation of Developmental Status
RAO Research Administration Officer
SCRGSP Steering Committee for the Review of Government Service Provision
TAFE Technical and Further Education
TI Thursday Island
TICHR Telethon Institute of Child Health Research
WAACHS Western Australian Aboriginal Child Health Survey
WHO World Health Organisation
Footprints in Time: The Longitudinal Study of Indigenous Children | Key Summary Report from Wave 152
Footprints in Time—the Longitudinal Study of Indigenous Children (LSIC) would never have
been possible without the support and trust of the Aboriginal and Torres Strait Islander families
who opened their doors to the researchers and generously gave their time to talk openly about
their lives. Our gratitude goes to them, and to the leaders and Elders of their communities who
are active guardians of their people’s wellbeing.
A special thanks goes to the LSIC Steering Committee and the Subcommittee members,
past and present, who, under the committed leadership of the chair Professor Mick Dodson
AM, actively participated in grappling with the many challenges the study had to face in its
development. Many of the members gave their time freely outside of committee meetings to
provide expert advice to assist in the study’s development.
Gratitude also goes to the many individuals and organisations, both government and non-
government, who provided advice throughout the process. These include:
Aboriginal Health and Medical Research Council of NSW
Aboriginal Health Research Ethics Committee
Aboriginal Hostels Limited
Aboriginal Justice Advisory Council
Australian Bureau of Statistics (ABS)
Australian Council for Educational Research
Australian Education Union
Australian Institute of Aboriginal and Torres Strait Islander Studies
Australian Institute of Health and Welfare
Central Australian Human Research Ethics Committee
Centrelink
Cooperative Research Centre for Aboriginal Health
Department of Education, Employment and Workplace Relations
Department of Families, Housing, Community Services and Indigenous Affairs Department of
Health and Ageing
Department of Health and Ageing’s Departmental Ethics Committee
Good Beginnings Australia
Human Research Ethics Committee: NT Department of Health & Community Services
Indigenous Coordination Centres
Acknowledgments
53
Kimberley Aboriginal Health Planning Forum Research Sub-Committee
Macquarie University
Menzies School of Health Research
Ms Adele Cox, Consultant
Ms Penny Tripcony, Consultant
Dr Margo Weir, Early Childhood and Indigenous Consultant
Mr Andrew Whitecross, FaHCSIA
National Aboriginal Community Controlled Health Organisation
National Health and Medical Research Council
Northern Territory Department of Health and Community Services
Office of Aboriginal and Torres Strait Islander Health
Queensland Aboriginal and Islander Health Council
Roy Morgan Research
Rumbalara Aboriginal Co-Operative
Secretariat of the National Aboriginal and Islander Child Care
Telethon Institute for Child Health Research
Torres Strait Regional Authority
Western Australian Aboriginal Health Information and Ethics Committee
We are also grateful to reviewers who provided comments on this report. The Footprints in
Time team are particularly grateful to Annemarie Nicol and Paula Mance (FaHCSIA, Research
Projects Section) who coordinated, wrote and re-wrote much of this report.
Finally, thanks go to all the staff at the Department of Families, Housing, Community Services
and Indigenous Affairs (FaHCSIA) who worked on the study throughout its development and
implementation, both in National Office and in the field. Many regularly gave up their personal
time and worked long hours to ensure the study’s success.
The study brings together people committed to making a positive difference in the lives
of Aboriginal and Torres Strait Islander children.
Footprints in Time: The Longitudinal Study of Indigenous Children | Key Summary Report from Wave 154
Australian Bureau of Statistics & Australian Institute of Health and Welfare 2008, The health
and welfare of Australia’s Aboriginal and Torres Strait Islander peoples, cat. no. 4704.0,
ABS & AIHW, Canberra.
Australian Bureau of Statistics 2006, Population Distribution, Aboriginal and Torres Strait
Islander Australians, 2006, ‘Table 1: Estimated Resident Population, Indigenous Status–2001
and 2006 ‘, data cube: Excel spreadsheet, cat. no. 4705.0, viewed 18 September 2009,
<http://www.abs.gov.au/AUSSTATS/[email protected]/DetailsPage/4705.02006?OpenDocument >
——2004, National Aboriginal and Torres Strait Islander Social Survey, 2002 , cat. no. 4714.0,
ABS, Canberra.
——2006, National Aboriginal and Torres Strait Islander Health Survey, 2004-05 , cat. no. 4715.0,
ABS, Canberra.
Australian Institute of Aboriginal and Torres Strait Islander Studies, 2000, Guidelines for Ethical
Research in Indigenous Studies, AIATSIS, Canberra.
Australian Institute of Health and Welfare 2009, A picture of Australia’s children 2009, cat. no.
PHE 112, AIHW, Canberra.
Bailie, RS & Wayte, KJ 2006, ‘Housing and health in Indigenous communities: key issues for
housing and health improvement in remote Aboriginal and Torres Strait Islander communities’,
Australian Journal of Rural Health, vol. 14, pp. 178–83.
Baumrind, D 1996, ‘The discipline controversy revisited’, Family Relations, vol. 45, no. 4, pp.
405–14.
Cairney, TA, Gunthorpe, SW, Paradies, Y, Sayers, S. ‘Strong Souls: the development and
validation of a culturally appropriate tool for assessment of social and emotional wellbeing in
Indigenous youth’, Australian & New Zealand Journal of Psychiatry, in Press.
Centre for Community Child Health, Royal Children’s Hospital 2005 Parent’s Evaluation of
Developmental Status (PEDS), the Australian Version, adapted with permission from Frances
Page Glascoe, Ellsworth and Vandermeer Press, Melbourne.
Council of Australian Governments 2009, Closing the Gap: national partnership agreement on
Indigenous early childhood development, COAG, Canberra.
Eades, S 2004, Maternal and child health care services: actions in the primary health care
setting to improve the health of Aboriginal and Torres Strait Islander women of childbearing
age, infants and young children, Aboriginal and Torres Strait Islander Primary Health Care
Review; Consultant Report no. 6, Menzies School of Health Research, Casuarina, NT.
McConvell, P 2008 ‘Language mixing and language shift in Indigenous Australia’, in J Simpson
& G Wigglesworth (eds), Children’s language and multilingualism: Indigenous language use at
home and school, Continuum International Publishing Group, London.
References
55
National Advisory Committee on Oral Health (NACOH) 2004, Healthy mouths healthy lives:
Australia’s national oral health plan 2004–2013, South Australian Department of
Health, Adelaide.
National Health and Medical Research Council (NHMRC) 2000, Nutrition in Aboriginal and
Torres Strait Islander peoples: an information paper, NHMRC, Canberra.
——2003, Dietary guidelines for children and adolescents in Australia incorporating the infant
feeding guidelines for health workers, NHMRC, Canberra.
——2003, Values and Ethics: Guidelines for Ethical Conduct in Aboriginal and Torres Strait
Islander Health Research, NHMRC, Canberra.
Raising Children Network 2008, Indigenous Parents, viewed 18 August 2009, <http://
raisingchildren.net.au/articles/indigenous_parents.html?highlight=indigenous>.
Rosario, C & McLoyd, V 2002, ‘Social support and parenting in poor, dangerous neighbourhoods’,
Child Development, vol. 73, no. 4, pp. 1310–21.
Steering Committee for the Review of Government Service Provision (SCRGSP) 2009, Overcoming
Indigenous disadvantage: key indicators 2009, Productivity Commission, Canberra.
Silk, J, Sessa, F, Sheffield, MA, Steinberg, L & Avenoli, S 2004, ‘Neighborhood cohesion as a
buffer against hostile maternal parenting’, Journal of Family Psychology, vol. 18, pp. 135–46.
Zubrick, SR, Lawrence, D, Mitrou, F, Silburn, SR & Eades, S 2003, The Western Australian Aboriginal
Child Health Survey: key findings from the survey field work, Telethon Institute for Child Health
Research, Perth.
Zubrick, SR, Silburn, SR, Lawrence, DM, Mitrou, FG, Dalby, RB, Blair, EM, Griffin, J, Milroy, H,
De Maio, JA, Cox, A & Li, J 2005, The Western Australian Aboriginal Child Health Survey: the
social and emotional wellbeing of Aboriginal children and young people, Curtin University of
Technology and Telethon Institute for Child Health Research, Perth.
World Health Organisation ‘Antenatal care’, viewed 2 Sept 2009, <http://apps.who.int/rhl/
pregnancy_childbirth/antenatal_care/en/index.html>.
Footprints in Time: The Longitudinal Study of Indigenous Children | Key Summary Report from Wave 156
PUBLICATIONS
Cooperative Research Centre for Aboriginal Health in collaboration with the Telethon
Institute for Child Health Research & the Department of Families, Community Services and
Indigenous Affairs 2006, Growing up in the Torres Strait region: a report from the Footprints
in Time trials, Occasional Paper no. 17, Department of Families, Community Services and
Indigenous Affairs, Canberra.
Cooperative Research Centre for Aboriginal Health in collaboration with the Telethon Institute
for Child Health Research & the Department of Families, Community Services and Indigenous
Affairs 2008, Stories on ‘growing up’ from Indigenous people in the ACT metro/Queanbeyan
region, Occasional Paper no. 20, Department of Families, Housing, Community Services and
Indigenous Affairs, Canberra.
Hunter, BH 2006, Benchmarking the Indigenous sub-sample of the Longitudinal Survey of
Australian Children: implications for the Longitudinal Study of Indigenous Children, Centre for
Aboriginal Economic Policy Research, Australian National University, Canberra.
Penman, R 2006, The ‘growing up’ of Aboriginal and Torres Strait Islander children: a literature
review, Occasional Paper No. 15, Department of Families, Community Services and Indigenous
Affairs, Canberra.
Penman, R 2006, Aboriginal and Torres Strait Islander views on research in their communities,
Occasional Paper No. 16, Department of Families, Community Services and Indigenous
Affairs, Canberra.
57
Endnotes
1 See page 48 for more information about Wave 2 and 3.
2 The Longitudinal Study of Australian Children (LSAC) is the first longitudinal study of
Australian children as they grow up. Data are being collected from two cohorts every
two years. The first cohort of 5,000 children was aged 0–1 years in 2003–4 and the second
cohort comprising 5,000 children was aged 4–5 years in 2003–4. Study informants include
the child (when of an appropriate age) and their parents, carers and teachers.
3 Some interviews were mistakenly completed in the wrong cohort. Parents of these children
will be interviewed with the correct cohort interview in subsequent waves.
4 Medicare and Centrelink information was provided to FaHCSIA under strict guidelines
concerning the use, privacy and security of the information.
5 The use of these records was restricted to those families who identified their children as
an Aboriginal or Torres Strait Islander on their Medicare and Centrelink registration. Such
self-identification is voluntary and some families choose not to identify their children in this
way.
6 A report summarising those consultations, Aboriginal and Torres Strait Islander views on
research in their communities, (Professor Robyn Penman, FaHCSIA Occasional Paper No.
16) was published in 2006.
7 FaHCSIA Occasional Paper No. 17 (2006) Growing up in the Torres Strait region: A report
from the Footprints in Time trials, Cooperative Research Centre for Aboriginal Health
(CRCAH) in collaboration with the Telethon Institute for Child Health Research (TICHR) and
FaCSIA.
8 The MacArthur Communicative Development Inventory.
9 Includes step-parents and foster or adoptive parents.
10 Parental language ability is self assessed, in contrast to the assessment of the Study child’s
literacy development.
11 This was self assessed and, as such, must be interpreted with caution.
12 Babies with birth weights over 5,000 grams (n=26) were removed from the analysis.
13 Parents were not asked how much or how many times the food was eaten during each
time period.
14 Parent’s Evaluation of Developmental Status (PEDS), the Australian Version. Centre
for Community Child Health, Royal Children’s Hospital, Melbourne 2005. Adapted with
permission from Frances Page Glascoe, Ellsworth and Vandermeer Press Ltd.
15 Based on the percentage of parents who reported the items ‘always’ or ‘often’.
16 These questions came from the Strong Souls questionnaire developed to assess the
emotional well-being of participants of the Aboriginal Birth Cohort study during the Wave
3 follow-up. Thomas A, Cairney, S, Gunthorpe, W, Paradies, Y, Sayers, S Strong Souls: the
development and validation of a culturally appropriate tool for assessment of social and
emotional wellbeing in Indigenous youth, Australian & New Zealand Journal of Psychiatry,
In Press.
17 Ibid.
18 Humbugging refers to the practice of harassing family and friends for money.
19 These may also be indirectly experienced by the parent through their relationship
with close family or friends who directly experienced the event.


Footprints in Time: The Longitudinal Study of Indigenous Children | Key Summary Report from Wave 160
score/fold
score/fold
08
The Longitudinal Study of Indigenous ChildrenFootprints in Time
20
Key Summary Report from Wave 1