Embed Size (px)
Citation preview
This PDF is a selection from an out-of-print volume from the National Bureauof Economic Research
Volume Title: Inquiries in the Economics of Aging
Volume Author/Editor: David A. Wise, editor
Volume Publisher: University of Chicago Press
Volume ISBN: 0-226-90303-6
Volume URL: http://www.nber.org/books/wise98-2
Publication Date: January 1998
Chapter Title: What Is Technological Change?
Chapter Author: David M. Cutler, Mark B. McClellan
Chapter URL: http://www.nber.org/chapters/c7080
Chapter pages in book: (p. 51 - 81)
2 What Is Technological Change? David M. Cutler and Mark B. McClellan
The rising cost of health care has been among the most vexing problems facing the public sector in the past three decades. Spending on health care accounts for nearly 20 percent of federal revenues and a similar share of state and local revenues. With real per capita health costs increasing by 4 to 5 percent annu- ally, understanding the determinants of health care cost growth has become a substantial public concern.
Efforts to limit cost growth in the public sector have typically focused on price mechanisms. By lowering rates for the services it pays for, the federal government has hoped to limit overall reimbursement for medical care. And yet health costs continue to rise. Real per enrollee Medicare costs increased by over 6 percent annually between 1991 and 1993.
In this paper we explore the causes of this cost growth in detail. We begin with a discussion of the growth of inpatient Medicare costs. We show that the price that Medicare pays for admissions has been falling over time but the technological intensity of the treatment has been increasing. Since more inten- sive technologies are reimbursed at a higher rate than less intensive technolog- ies, the growth of technology is at least partly responsible for the growth of Medicare costs.
To gain further insights into these trends, we then turn to a detailed analysis of expenditure growth for one particular condition-acute myocardial infarc- tions (AMIs), or heart attacks, in elderly Medicare beneficiaries. Section 2.2
David M. Cutler is professor of economics at Harvard University and a research associate of the National Bureau of Economic Research. Mark B. McClellan is assistant professor of economics and medicine at Stanford University and a faculty research fellow of the National Bureau of Eco- nomic Research.
The authors are grateful to Jeff Geppert, Helen Levy, and Elaine Rabin for exceptional research assistance, to Jon Gruber for helpful comments, and to the National Institute on Aging for re- search support.
51
52 David M. Cutler and Mark B. McClellan
reviews the technical details of AM1 treatment and reimbursement. The tech- nologies used in treating AM1 have progressed dramatically in the past decade. In the early 1980s, treatment for heart attacks consisted principally of medical management of the patient, primarily involving monitoring techniques, phar- macologic interventions, and counseling. During the 1980s, several new inten- sive technologies were implemented widely. These technologies, including cardiac catheterization, coronary artery bypass surgery, and coronary angio- plasty, have had major consequences for patient treatment. In section 2.3, we quantify their effects on Medicare expenditures. In 1984, about 11 percent of people with a heart attack received one or more of these intensive treatments. Over the next seven years, the use of these treatments nearly quadrupled. As a result, even though the price of particular treatments for AMIs was constant or even falling, spending on heart attacks rose by 4 percent annually.
In section 2.4, we begin to develop evidence on the nature of this technologi- cal change by comparing the growth of technology across metropolitan statisti- cal areas (MSAs). We consider a common contention-that new and cheaper technologies will substitute for older and more expensive technologies and thus lower costs. The most recent innovation for AM1 treatment, angioplasty, is substantially cheaper than bypass surgery; thus, substitution of angioplasty for bypass surgery could potentially reduce cost growth. Looking across MSAs, however, we find no evidence that areas with more rapid growth of angioplasty have had less rapid growth of bypass surgery. We thus conclude that angioplasty has added significantly to the cost of AM1 treatment by ex- tending intensive interventions to a larger segment of AM1 patients. We then look across MSAs to see whether some MSAs are technology “leaders” and others are “followers.” We find evidence that this is the case. Areas in which bypass surgery was more prevalent in 1984 are the first to adopt angioplasty, and they use this procedure more often.
In section 2.5, we begin to explore the sources of intensity growth within geographic areas by considering the contribution of technology acquisition by hospitals to intensity growth. We find that technology diffusion to new facili- ties accounts for much intensity growth but that more frequent use of intensive technologies within hospitals is also important, especially for the continued growth of relatively “established” technologies such as bypass surgery.
We conclude our exploration of technological change in the management of AM1 in the elderly with a review of some of the questions raised by our prelim- inary studies, suggesting a potential agenda for further research on the determi- nants of technological change in health care.
2.1 The Sources of Medicare Cost Increases
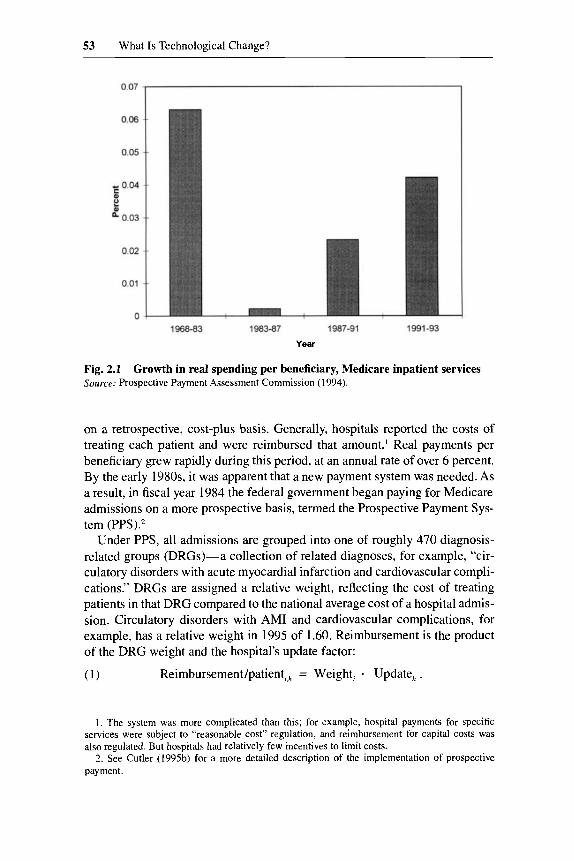
Figure 2.1 shows the growth of Medicare hospital payments per beneficiary from 1968 through 1993. The figure is concerning from the perspective of federal expenditures. From 1965 to the early 1980s, Medicare paid hospitals
53 What Is Technological Change?
Year
Fig. 2.1 Source: Prospective Payment Assessment Commission (1994).
Growth in real spending per beneficiary, Medicare inpatient services
on a retrospective, cost-plus basis. Generally, hospitals reported the costs of treating each patient and were reimbursed that amount.’ Real payments per beneficiary grew rapidly during this period, at an annual rate of over 6 percent. By the early 1980s, it was apparent that a new payment system was needed. As a result, in fiscal year 1984 the federal government began paying for Medicare admissions on a more prospective basis, termed the Prospective Payment Sys- tem (PPS).z
Under PPS, all admissions are grouped into one of roughly 470 diagnosis- related groups (DRGs)-a collection of related diagnoses, for example, “cir- culatory disorders with acute myocardial infarction and cardiovascular compli- cations.” DRGs are assigned a relative weight, reflecting the cost of treating patients in that DRG compared to the national average cost of a hospital admis- sion. Circulatory disorders with AM1 and cardiovascular complications, for example, has a relative weight in 1995 of 1.60. Reimbursement is the product of the DRG weight and the hospital’s update factor:
( 1 ) Reimbursement/patient,,, = Weight, - Update, .
1. The system was more complicated than this; for example, hospital payments for specific services were subject to “reasonable cost” regulation, and reimbursement for capital costs was also regulated. But hospitals had relatively few incentives to limit costs.
2. See Cutler (199%) for a more detailed description of the implementation of prospective payment.
54 David M. Cutler and Mark B. McClellan
The update factor is on the order of $4,000 per DRG unit for a typical hospi- tal.3 Thus, a typical hospital would receive about $6,400 for the circulatory disorder patient noted above. Hospitals receive approximately the same pay- ment for all patients in a given DRG, regardless of what services they perform.
It was hoped that prospective payment would solve the budget problem. To- tal reimbursement is given by
Reimbursement,, = Weight, Update,, . panena
(2)
By controlling the update factor, the government can, in principle, control the growth of total pen ding.^ As figure 2.1 shows, however, this has not been the case. While real cost growth was low for several years after the implementation of PPS, in recent years cost growth has again accelerated.
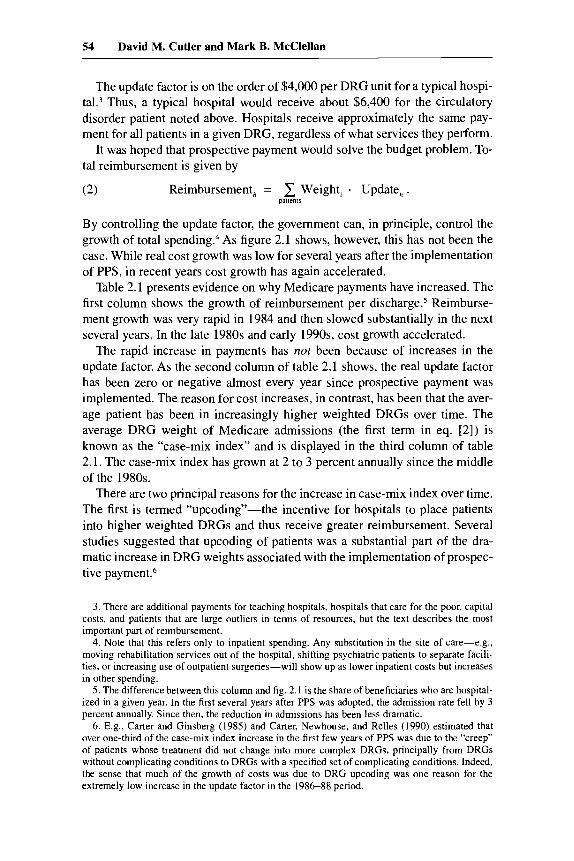
Table 2.1 presents evidence on why Medicare payments have increased. The first column shows the growth of reimbursement per di~charge.~ Reimburse- ment growth was very rapid in 1984 and then slowed substantially in the next several years. In the late 1980s and early 1990s, cost growth accelerated.
The rapid increase in payments has not been because of increases in the update factor. As the second column of table 2.1 shows, the real update factor has been zero or negative almost every year since prospective payment was implemented. The reason for cost increases, in contrast, has been that the aver- age patient has been in increasingly higher weighted DRGs over time. The average DRG weight of Medicare admissions (the first term in eq. [ 2 ] ) is known as the “case-mix index” and is displayed in the third column of table 2.1. The case-mix index has grown at 2 to 3 percent annually since the middle of the 1980s.
There are two principal reasons for the increase in case-mix index over time. The first is termed “upcoding”-the incentive for hospitals to place patients into higher weighted DRGs and thus receive greater reimbursement. Several studies suggested that upcoding of patients was a substantial part of the dra- matic increase in DRG weights associated with the implementation of prospec- tive payment.6
3. There are additional payments for teaching hospitals, hospitals that care for the poor, capital costs, and patients that are large outliers in terms of resources, but the text describes the most important part of reimbursement. 4. Note that this refers only to inpatient spending. Any substitution in the site of care-e.g..
moving rehabilitation services out of the hospital, shifting psychiatric patients to separate facili- ties, or increasing use of outpatient surgeries-will show up as lower inpatient costs but increases in other spending.
5. The difference between this column and fig. 2. I is the share of beneficiaries who are hospital- ized in a given year. In the first several years after PPS was adopted, the admission rate fell by 3 percent annually. Since then, the reduction in admissions has been less dramatic.
6. E.g., Carter and Ginsberg (1985) and Carter, Newhouse, and Relles (1990) estimated that over one-third of the case-mix index increase in the first few years of PPS was due to the “creep” of patients whose treatment did not change into more complex DRGs, principally from DRGs without complicating conditions to DRGs with a specified set of complicating conditions. Indeed, the sense that much of the growth of costs was due to DRG upcoding was one reason for the extremely low increase in the update factor in the 1986-88 period.
55 What Is Technological Change?
Table 2.1 Sources of Medicare Inpatient Hospital Cost Increases
Reimbursement/ Year Discharge (%) Update (%) Case-Mix Index (%)
1984 1985 1986 1987 1988 1989 I990 1991 1992
14.2 6.8 0.7 2.1 2.0 2.2 1.8 1.9 2.1
0.3 0.8
-2.1 -2.0 -2.4 -1.1
0.3a -0.4
0.2
5.6 2.9 2.6 3.5 2.7 2.2 2.7 1.9
Source: Prospective Payment Assessment Commission (1995). Note: Costs and update are in real terms relative to the GDP deflator. "Reflects 1.22 percent across-the-board reduction in DRG weights.
The second reason for increases in the case-mix index, and the one we focus on most heavily, is technological change. While reimbursement within a DRG does not depend on an individual patient's costs, DRGs do distinguish between patients who receive surgery and those who do not. Surgical DRGs generally have higher weights than medical DRGs for similar patients. As a result, when more patients receive intensive surgical treatments, the case-mix index will increase, as will Medicare payments. This is particularly important because technological change has been an integral feature of the U.S. health system for the past 50 years (Newhouse 1992).
We illustrate how technological change may affect growth of Medicare pay- ments using treatment for AMIs (heart attacks) in the elderly.
2.2 AM1 Treatments and Reimbursement: Technical Background
Acute myocardial infarction (AMI) exemplifies technological change in health care. AM1 is a common condition in the elderly (about 230,000 new cases per year), the cost involved is substantial (over $10,000 per case in one- year hospital costs alone), and treatment involves a variety of intensive techno- logies with important cost implications. In addition, patients diagnosed with an AM1 will always be hospitalized, so there are no consequential issues of changes in the site of care.
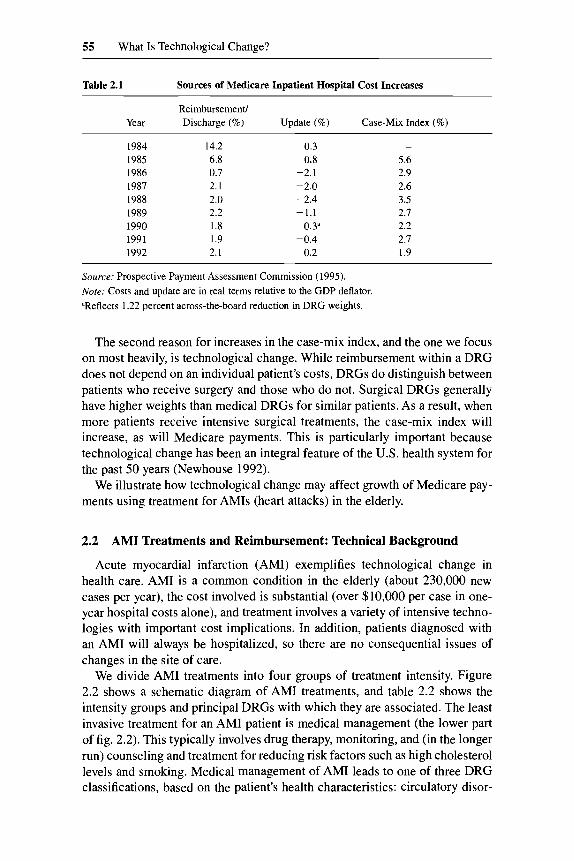
We divide AM1 treatments into four groups of treatment intensity. Figure 2.2 shows a schematic diagram of AM1 treatments, and table 2.2 shows the intensity groups and principal DRGs with which they are associated. The least invasive treatment for an AM1 patient is medical management (the lower part of fig. 2.2) . This typically involves drug therapy, monitoring, and (in the longer run) counseling and treatment for reducing risk factors such as high cholesterol levels and smoking. Medical management of AM1 leads to one of three DRG classifications, based on the patient's health characteristics: circulatory disor-
Catheterize Angioplasty (lm - other cardiovascular procedures in 1984) (112-angioplastyin 1991)
No Further Procedures (121,122,123-ifinitialadmission) (124 - cath with mmplex diagnosis) (125 - cath without complex diagnosis)
Medical Management (121 - AM1 with complications) (122 - AM1 without complications)
Fig. 2.2 Treatment of heart attacks
Table 2.2 Reimbursement for Patients with AMI, 1984 and 1991
Treatment DRG
Weight
1985 1991 Change (8
Medical management
Catheterization
Bypass surgery
Angioplasty
121 Circulatory disorders with AM1 and cardiovascular complications 122 Circulatory disorders with AM1 without cardiovascular complications 123 Circulatory disorders with AMI, expired
124 Circulatory disorders (no AMI) with catheterization and complex diagnosis 125 Circulatory disorders (no AMI) with catheterization without complex diagnosis
106 Coronary bypass with catheterization 107 Coronary bypass without catheterization
108 Cardiothoracic procedures except valve and bypass, with pump 11 2 Percutaneous cardiovascular procedures
1.8454
1.3509
1.1242
2.1969
1.6284
5.2077
3.9476
4.3301
,6210 - 12
,1667 ~ 14
,3920 24
,1973 ~ 46
0.7387 -55
5.4470 -5
4.9616 26
2.0163 -53
Source: Prospective Payment Assessment Commission (1985, 1991).
57 What Is Technological Change?
ders with AM1 and cardiovascular complications (DRG 121); circulatory disor- ders with AM1 without cardiovascular complications (DRG 122); and circula- tory disorders with AMI, expired (DRG 123). As table 2.2 shows, the weight of DRG 121 declined from 1.85 to 1.62, and the weight of DRG 122 declined from 1.35 to 1.17-roughly 12 to 14 percent. The weight of DRG 123 in- creased during this period, from 1.12 to 1.39.
An alternative to “medical” management of an AM1 is to use one or more invasive cardiac procedures (the upper branch of fig. 2.2). Invasive treatment begins with a cardiac catheterization, a diagnostic procedure that involves in- serting a catheter into the entrance of the blood vessels supplying the heart and injecting dye. This procedure documents areas of no flow or limited flow, which may be involved in the current or possible subsequent AMIs. Performing a cardiac catheterization requires a specialized cardiac catheterization labora- tory, with dedicated equipment and a specially trained staff of cardiologists and cardiac nurses.
Reimbursement for patients who undergo a catheterization is somewhat complicated. If a patient receives a catheterization during initial AM1 admis- sion, reimbursement is in one of the AM1 DRGs noted above (121, 122, or 123). If a patient is readmitted specifically for a catheterization, the readmis- sion is reimbursed in DRG 124 or 125-circulatory disorders (no AMI) with catheterization witwwithout complex diagnosis. As table 2.2 shows, the weights for both of these DRGs declined substantially between 1984 and 1991-by about 50 percent.
If the catheterization procedure detects important blockages in the arteries supplying the heart, more intensive revascularization procedures may be used to treat the blockages. The first, older technology is coronary artery bypass graft (CABG) surgery. CABG is a highly intensive, open-heart surgical proce- dure that involves grafting arteries or leg veins to bypass occluded or near- occluded regions of the heart’s blood flow. A more recent innovation in coro- nary revascularization, which is less intensive than CABG, is percutaneous transluminal coronary angioplasty (PTCA). In this procedure, a balloon-tipped catheter is inserted into the blocked artery and inflated, with the goal of restor- ing blood flow through the artery without having to undertake open-heart ~urgery.~
Patients who receive bypass surgery are placed in DRG 106 or 107, which are defined exclusively for patients who undergo CABG (the DRGs differ in whether catheterization was or was not performed on the same admission). DRG 106 had weights of 5.21 in 1984 and 5.45 in 1991, far above either medi- cal management or catheterization without further surgical procedures.
Reimbursement for angioplasty (PTCA) has a more complex regulatory his- tory, reflecting its relatively recent development. In 1984, angioplasty was a
7. Sometimes, PTCA procedures are performed in association with stent placement ( i t . , the insertion of a mesh tube into reopened artery to help prevent the artery from closing off again).
58 David M. Cutler and Mark B. McClellan
virtually new procedure. Patients who underwent angioplasty were placed in DRG 108-cardiothoracic procedures except valve and bypass, with pump- which included a variety of other invasive cardiac procedures, most of which were more intensive than angioplasty. The DRG weight, 4.33 in 1985, was high relative to average resource requirements for performing angioplasty. As angioplasty became more common, Medicare officials realized it was substan- tially overreimbursed. In fiscal year 1986, angioplasty was moved into DRG 112, with a much lower weight of 2.02 in 1991. Even with this lower weight, however, angioplasty is still reimbursed considerably more than medical man- agement of AM1 or catheterization without additional surgery. Thus, increases in the rate of angioplasty over time will lead to increases in Medicare spending, provided they result from use of angioplasty in patients who would have been treated medically rather than with CABG.
2.3 AM1 Treatments and Reimbursement, 1984-91
To examine the effects of these technological changes on Medicare costs, we assembled a data set consisting of essentially all elderly Medicare beneficiaries admitted with an AM1 between 1984 and 1991. The data set was created in several steps.*
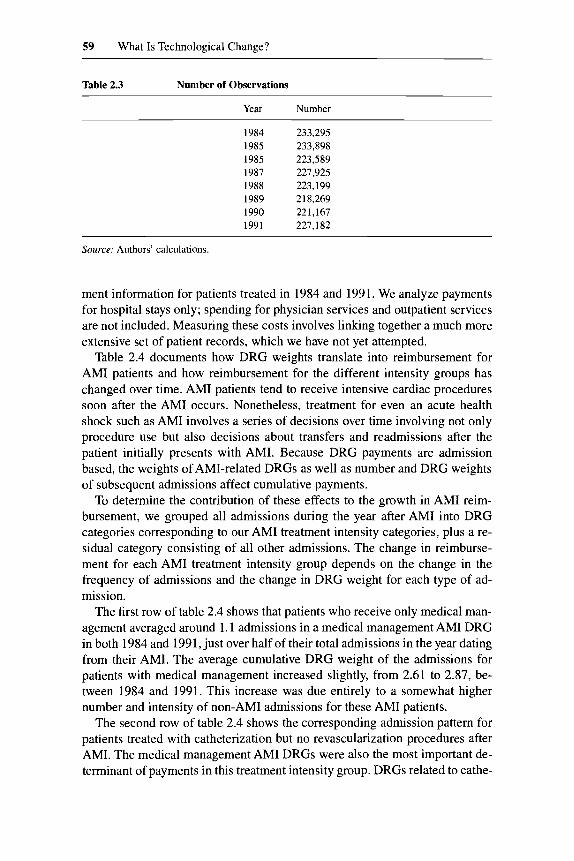
We began with all hospital claims for every Medicare beneficiary who had an AM1 in this time period. We excluded nonelderly patients, patients treated in HMOs, patients who did not have continuous Medicare enrollment follow- ing their AMIs (unreliable claims data), patients who were treated for their AMIs outside acute care U.S. hospitals, and patients whose lengths of stay (less than five days, discharged to home alive) made it very unlikely that they had “true” AMIs. We used reported procedure codes to identify use of cardiac procedures and secondary diagnoses at the time of initial AM1 admission to identify complicating conditions preceding the AMI. We used unique patient identifiers to link all hospital admissions for each patient over time, enabling us to identify the most intensive cardiac treatment received by each patient in the 90-day episode of care after the AMI. On average there were about 230,000 new AM1 patients admitted each year; this cohort size declined slightly during the time period of the study. Table 2.3 shows the number of patients by year.
Our data also contain information on the DRG assignment for each admis- sion and on the total DRG payments (including any outlier payments and hospital-specific adjustments) for each admission. We use this information to determine the total hospital payments for each patient in the year after AM1 and to determine the total weight of the DRG payments (without outlier and hospital-specific adjustments). For this section, we concentrate on reimburse-
8. These data were assembled as part of a larger project on the costs and benefits of intensive medical treatment in the elderly. See McClellan and Newhouse (1994) and McClellan, McNeil, and Newhouse (1994) for more detail.
59 What Is Technological Change?
Table 2.3 Number of Observations
Year Number
1984 233,295 1985 233,898 1985 223,589 1987 227,925 1988 223,199 1989 21 8,269 1990 22 1,167 1991 227,182
Source: Authors’ calculations.
ment information for patients treated in 1984 and 1991. We analyze payments for hospital stays only; spending for physician services and outpatient services are not included. Measuring these costs involves linking together a much more extensive set of patient records, which we have not yet attempted.
Table 2.4 documents how DRG weights translate into reimbursement for AM1 patients and how reimbursement for the different intensity groups has changed over time. AM1 patients tend to receive intensive cardiac procedures soon after the AM1 occurs. Nonetheless, treatment for even an acute health shock such as AM1 involves a series of decisions over time involving not only procedure use but also decisions about transfers and readmissions after the patient initially presents with AMI. Because DRG payments are admission based, the weights of AMI-related DRGs as well as number and DRG weights of subsequent admissions affect cumulative payments.
To determine the contribution of these effects to the growth in AM1 reim- bursement, we grouped all admissions during the year after AM1 into DRG categories corresponding to our AM1 treatment intensity categories, plus a re- sidual category consisting of all other admissions. The change in reimburse- ment for each AM1 treatment intensity group depends on the change in the frequency of admissions and the change in DRG weight for each type of ad- mission.
The first row of table 2.4 shows that patients who receive only medical man- agement averaged around 1.1 admissions in a medical management AM1 DRG in both 1984 and 1991, just over half of their total admissions in the year dating from their AMI. The average cumulative DRG weight of the admissions for patients with medical management increased slightly, from 2.6 1 to 2.87, be- tween 1984 and 1991. This increase was due entirely to a somewhat higher number and intensity of non-AM1 admissions for these AM1 patients.
The second row of table 2.4 shows the corresponding admission pattern for patients treated with catheterization but no revascularization procedures after AMI. The medical management AM1 DRGs were also the most important de- terminant of payments in this treatment intensity group. DRGs related to cathe-
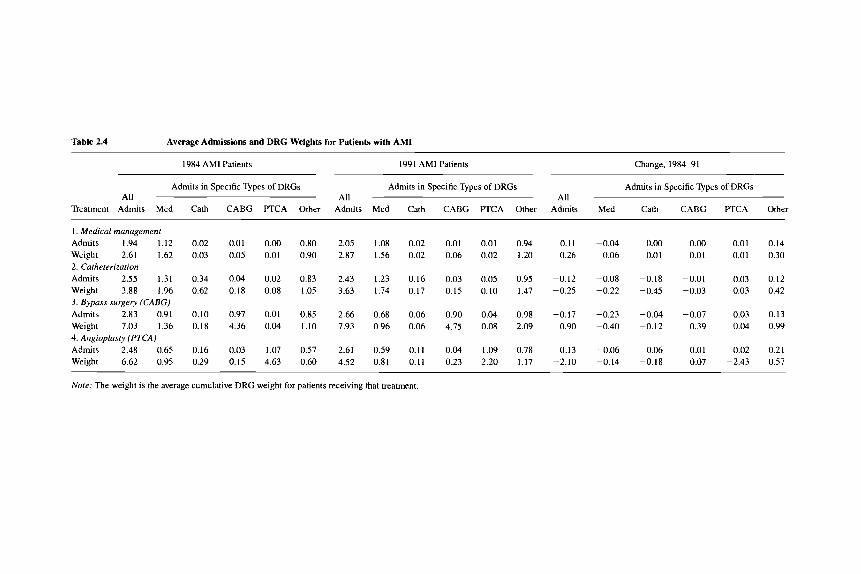
Table 2.4 Average Admissions and DRG Weights for Patients with AM1
1984 AM1 Patients 1991 AM1 Patients Change, 1984-91
Admits in Specific Types of DRGs Admits in Specific Types of DRGs Admits in Specific Types of DRGs All All All
Treatment Admits Med Cath CABG PTCA Other Admits Med Cath CABG PTCA Other Admits Med Cath CABG PTCA Other
I . Medical management Admits 1.94 1.12 Weight 2.61 1.62 2. Catheterization Admits 2.55 1.31 Weight 3.88 1.96 3. Bypass surgery (CABC) Admits 2.83 0.91 Weight 7.03 1.36 4. Angioplasgi (PTCA) Admits 2.48 0.65 Weight 6.62 0.95
0.02 0.01 0.00 0.80 2.05 1.08 0.02 0.03 0.05 0.01 0.90 2.87 1.56 0.02
0.34 0.04 0.02 0.83 2.43 1.23 0.16 0.62 0.18 0.08 1.05 3.63 1.74 0.17
0.10 0.97 0.01 0.85 2.66 0.68 0.06 0.18 4.36 0.04 1.10 7.93 0.96 0.06
0.16 0.03 1.07 0.57 2.61 0.59 0.11 0.29 0.15 4.63 0.60 4.52 0.81 0.11
0.01 0.06
0.03 0.15
0.90 4.75
0.04 0.23
0.01 0.02
0.05 0.10
0.04 0.08
1.09 2.20
0.94 0.11 -0.04 1.20 0.26 -0.06
0.95 -0.12 -0.08 1.47 -0.25 -0.22
0.98 -0.17 -0.23 2.09 0.90 -0.40
0.78 0.13 -0.06 1.17 -2.10 -0.14
0.00 -0.01
-0.18 -0.45
-0.04 -0.12
-0.06 -0.18
0.00 0.01 0.14 0.01 0.01 0.30
-0.01 0.03 0.12 -0.03 0.03 0.42
-0.07 0.03 0.13 0.39 0.04 0.99
0.01 0.02 0.21 0.07 -2.43 0.57
Nore: The weight is the average cumulative DRG weight for patients receiving that treatment.
61 What Is Technological Change?
terization accounted for a weight of 0.62 in 1984 but fell to 0.17 by 1991. In part, this fall was the result of a trend toward performing catheterization earlier after AMI. In 1984, almost one-third of patients treated with catheterization only were initially admitted in a medical management AM1 DRG and subse- quently readmitted in a catheterization DRG. By 1991, about one-seventh of patients followed this admission pattern; the remainder were treated with cath- eterization on their initial admission and thus only were admitted in the medi- cal management AM1 DRGs. Coupling this trend in admissions with the reduc- tion in DRG weights for both medical management and catheterization outside of an AMI, the result was a substantial reduction in payment for patients receiv- ing only catheterization; this reduction was only partially offset by more inten- sive admissions in other categ~ries .~
The last two rows of table 2.4 describe treatment and reimbursement pat- terns for patients receiving catheterization and revascularization. The cumula- tive DRG weight for patients receiving bypass increased, as a result of an in- crease in the average DRG weight for admissions in CABG DRGs and an increase in the intensity of admissions in the “other” DRG category (princi- pally more use of other intensive surgical procedures). The net result of these changes was 10 percent growth in the average DRG weight for AM1 patients receiving bypass, with a corresponding increase in payments for these patients. In contrast, the DRG weight for AM1 patients receiving angioplasty declined by over 40 percent, from 6.62 in 1984 (a level near that of bypass surgery) to 4.52 in 1991. This reduction was entirely attributable to the reduced weight of the DRG associated with angioplasty.
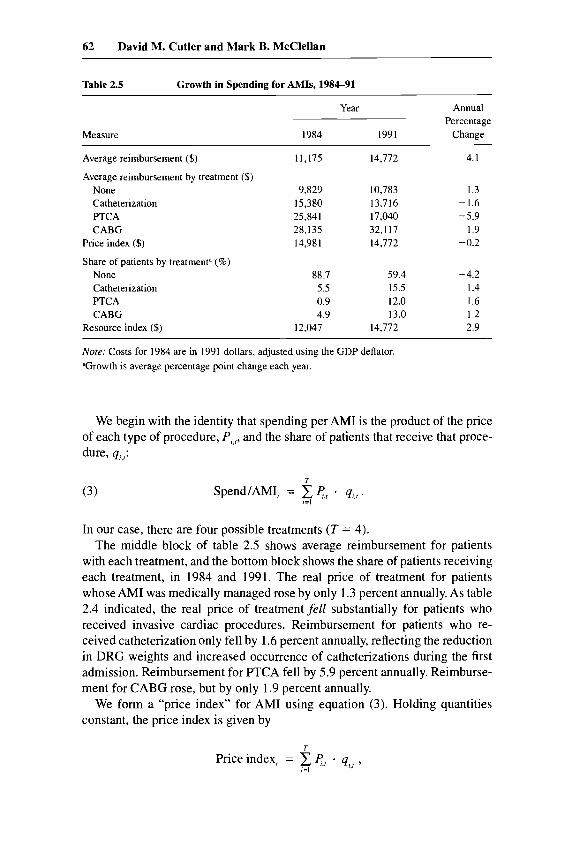
Table 2.5 summarizes how these DRG weights translate into Medicare pay- ments per AM1 patient in 1984 and 1991. As the first row shows, average spending on AMIs was $11,175 in 1984 and $14,722 in 1991 (both in $1991), implying an annual growth rate of 4.1 percent. By comparison, average spend- ing per Medicare beneficiary was $2,581 in 1984 and $3,226 in 1991, an an- nual growth rate of 3.2 percent.
This growth in treatment costs is substantial. With about 230,000 admissions annually, total reimbursement for heart attacks alone rose from $2.6 billion in 1984 to $3.4 billion in 1991, an increase of $0.8 billion. This is nearly 10 percent of the increase in all Medicare inpatient spending over this period. Indeed, Medicare spending on heart attacks alone was a third of the total amount that Medicaid spent on poor children in 1991.
The substantial increase in AM1 reimbursement occurred despite falling or flat DRG weights for all categories of intensive treatment, suggesting that shifts in the probabilities of treatment in each intensity category were the key factors in the growth of AM1 expense in the past decade. To demonstrate this hypothesis, we decompose spending growth into prices and quantities of pro- cedures.
9. In addition, as we discuss below, many more hospitals are performing catheterizations; fewer patients must be transferred (and hence readmitted) to undergo the procedure.
62 David M. Cutler and Mark B. McClellan
Table 2.5 Growth in Spending for AMIs, 1984-91
Measure
Year Annual
1984 1991 Change Percentage
Average reimbursement ($)
Average reimbursement by treatment ($) None Catheterization F’TCA CABG
Price index ($)
Share of patients by treatment” (%) None Catheterization PTCA CABG
Resource index ($)
11,175
9,829 15,380 25,841 28,135 14.981
88.7 5.5 0.9 4.9
12,047
14,712
10,783 13,716 17,040 32,117 14.772
59.4 15.5 12.0 13.0
14,772
4. I
1.3 -1.6 -5.9
I .9 -0.2
-4.2 1.4 1.6 1.2 2.9
Nore: Costs for 1984 are in 1991 dollars, adjusted using the GDP deflator. ”Growth is average percentage point change each year.
We begin with the identity that spending per AM1 is the product of the price of each type of procedure, P,,r, and the share of patients that receive that proce- dure, q,,r:
(3) T
SpendIAMI, = e,, - q,,, . ,=I
In our case, there are four possible treatments (T = 4). The middle block of table 2.5 shows average reimbursement for patients
with each treatment, and the bottom block shows the share of patients receiving each treatment, in 1984 and 1991, The real price of treatment for patients whose AM1 was medically managed rose by only 1.3 percent annually. As table 2.4 indicated, the real price of treatment fell substantially for patients who received invasive cardiac procedures. Reimbursement for patients who re- ceived catheterization only fell by 1.6 percent annually, reflecting the reduction in DRG weights and increased occurrence of catheterizations during the first admission. Reimbursement for PTCA fell by 5.9 percent annually. Reimburse- ment for CABG rose, but by only 1.9 percent annually.
We form a “price index” for AM1 using equation (3). Holding quantities constant, the price index is given by
T
Price index, = C cr . q,,i, !=I
63 What Is Technological Change?
where r i s quantity in some base year. Using 1991 quantities as weights sug- gests a price decline of 0.2 percent annually.’O This decline reflects the real reductions in the update factor, the regulatory changes in DRG relative weights, and the changes in admission patterns for AM1 patients we have de- scribed.
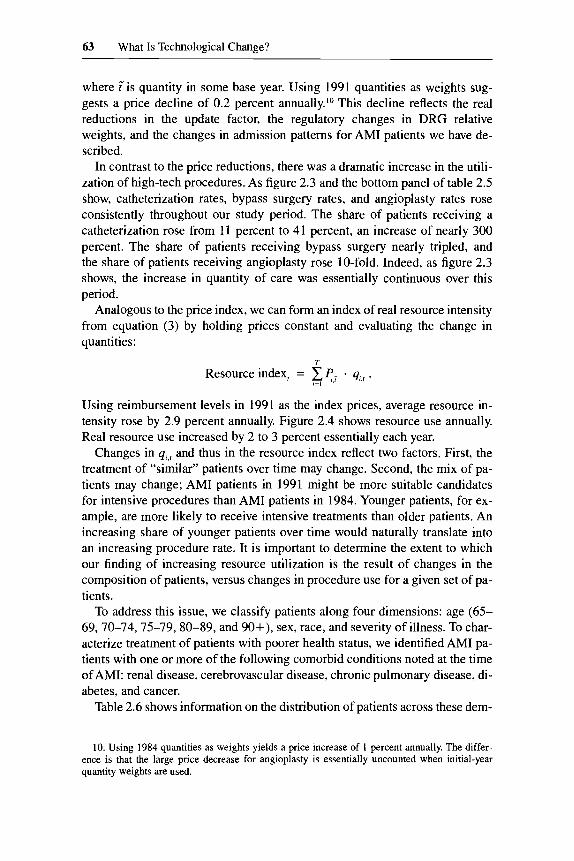
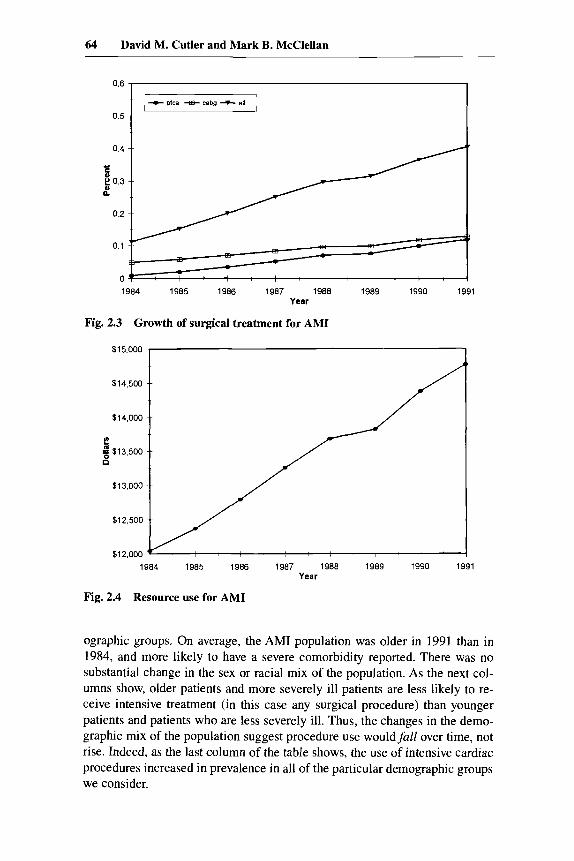
In contrast to the price reductions, there was a dramatic increase in the utili- zation of high-tech procedures. As figure 2.3 and the bottom panel of table 2.5 show, catheterization rates, bypass surgery rates, and angioplasty rates rose consistently throughout our study period. The share of patients receiving a catheterization rose from 11 percent to 4 1 percent, an increase of nearly 300 percent. The share of patients receiving bypass surgery nearly tripled, and the share of patients receiving angioplasty rose 10-fold. Indeed, as figure 2.3 shows, the increase in quantity of care was essentially continuous over this period.
Analogous to the price index, we can form an index of real resource intensity from equation (3) by holding prices constant and evaluating the change in quantities:
T
Resource index, = ZP,, - i=l
Using reimbursement levels in 1991 as the index prices, average resource in- tensity rose by 2.9 percent annually. Figure 2.4 shows resource use annually. Real resource use increased by 2 to 3 percent essentially each year.
Changes in q,,, and thus in the resource index reflect two factors. First, the treatment of “similar” patients over time may change. Second, the mix of pa- tients may change; AM1 patients in 1991 might be more suitable candidates for intensive procedures than AM1 patients in 1984. Younger patients, for ex- ample, are more likely to receive intensive treatments than older patients. An increasing share of younger patients over time would naturally translate into an increasing procedure rate. It is important to determine the extent to which our finding of increasing resource utilization is the result of changes in the composition of patients, versus changes in procedure use for a given set of pa- tients.
To address this issue, we classify patients along four dimensions: age (65- 69,70-74,75-79,80-89, and 90+), sex, race, and severity of illness. To char- acterize treatment of patients with poorer health status, we identified AM1 pa- tients with one or more of the following comorbid conditions noted at the time of AMI: renal disease, cerebrovascular disease, chronic pulmonary disease, di- abetes, and cancer.
Table 2.6 shows information on the distribution of patients across these dem-
10. Using 1984 quantities as weights yields a price increase of 1 percent annually. The differ- ence is that the large price decrease for angioplasty is essentially uncounted when initial-year quantity weights are used.
64 David M. Cutler and Mark B. McClellan
1984 1985 1986 1987 1988 1989 1990 1991 Year
Fig. 2.3 Growth of surgical treatment for AM1
$15,000 1
/
I r a $13,500
1984 1985 1986 1987 1988 1989 1990 1991 Year
Fig. 2.4 Resource use for AM1
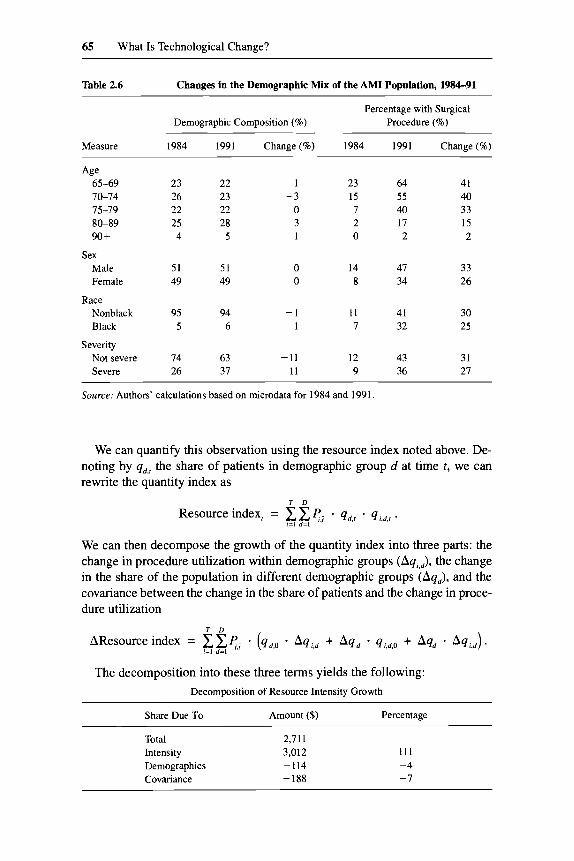
ographic groups. On average, the AM1 population was older in 1991 than in 1984, and more likely to have a severe comorbidity reported. There was no substantial change in the sex or racial mix of the population. As the next col- umns show, older patients and more severely ill patients are less likely to re- ceive intensive treatment (in this case any surgical procedure) than younger patients and patients who are less severely ill. Thus, the changes in the demo- graphic mix of the population suggest procedure use wouldfull over time, not rise. Indeed, as the last column of the table shows, the use of intensive cardiac procedures increased in prevalence in all of the particular demographic groups we consider.
65 What Is Technological Change?
Table 2.6 Changes in the Demographic M i x of the AM1 Population, 1984-91
Percentage with Surgical Demographic Composition (%) Procedure (%)
Measure 1984 1991 Change(%) 1984 1991 Change(%)
Age 65-69 70-74 75-79 80-89 90 +
Sex Male Female
Race Nonblack Black
Severity Not severe Severe
23 26 22 25 4
51 49
95 5
74 26
22 23 22 28
5
51 49
94 6
63 31
- I -3
0 3 1
0 0
-1 1
-11 11
23 64 15 55 7 40 2 17 0 2
14 47 8 34
11 41 7 32
12 43 9 36
41 40 33 15 2
33 26
30 25
31 27
~
Source: Authors' calculations based on microdata for 1984 and 1991.
We can quantify this observation using the resource index noted above. De- noting by qd.r the share of patients in demographic group d at time t , we can rewrite the quantity index as
T D
Resource index, = cxP.i * qd,, * qi,d,, . i=l d=l
We can then decompose the growth of the quantity index into three parts: the change in procedure utilization within demographic groups (Aqi.d), the change in the share of the population in different demographic groups (Aq,), and the covariance between the change in the share of patients and the change in proce- dure utilization
The decomposition into these three terms yields the following: Decomposition of Resource Intensity Growth
Share Due To Amount ($) Percentage
Total 2,7 11 Intensity 3,012 Demographics -114 Covariance -188
111 -4 -7
66 David M. Cutler and Mark B. McClellan
Demographic change has a small negative effect on growth in resource use for AM1 treatment. All of the growth in expenditures is due to increased intensity of treatment within demographic groups.
In summary: The experience of AM1 in the elderly illustrates extremely well the difficulties involved in Medicare cost containment. Since the mid- 1980s, reimbursement given the level of technology has fallen by about 0.2 percent annually. Payments for catheterization and angioplasty fell in real terms, and reimbursement for medical management and bypass surgery increased but only by a small amount. The dramatic increase in technology utilization, how- ever, more than made up for this price reduction. The share of patients who received invasive cardiac procedures tripled, and the resource intensity of the average AM1 case rose by almost 3 percent annually. Essentially all of this change was the result of increased procedure utilization for a given type of patient-within age, sex, race, and illness severity groups-rather than a shift in the distribution of patients. The result was a net increase in spending per patient of 4 percent annually.
The experience of AM1 demonstrates that simply reducing hospital fees will not lead to long-run cost containment if the volume of intensive procedures continues to grow. Rather, changes in the use of technology are the key to reducing health spending.”
In the remainder of this paper, we present further evidence on the nature of technological change in AM1 treatment. First, we examine the diffusion of intensive technologies for AM1 treatment across metropolitan areas. By com- paring growth rates of angioplasty and bypass, we address whether there is any evidence that the adoption of “cheaper” intensive treatments such as angi- oplasty leads to less expenditure growth than might otherwise have been ob- served, and whether there is any evidence that technology diffusion differs systematically across areas. Second, we examine the effect of technology adoption by hospitals on treatment decisions for their AM1 patients. This evi- dence is preliminary, but it suggests that more careful analysis of the determi- nants of technology diffusion may lead to a better understanding of how health care cost containment can be achieved.
2.4 The Nature of Technological Change: Comparisons across Metropolitan Areas
In the previous section, we showed that on net technological change led to increased health costs. Some have argued, however, that the introduction of technologies such as angioplasty-a less expensive and less morbid approach to revascularization-reduces health cost growth. If the growth of angioplasty substituted for the growth of bypass surgery, the introduction of this technol-
11. See Cutler (1 995a) for more discussion on the implications of this distinction for Medicare policy.
67 What Is Technological Change?
ogy would lead to lower health expenditures than if these patients had received bypass surgery. Conversely, to the extent that angioplasty patients would not have undergone bypass surgery, the adoption of angioplasty has added to ex- penditures.
The natural question, then, is whether the use of angioplasty substitutes for or complements the use of bypass surgery. To examine this issue, we use data on the change in the share of patients receiving each treatment in different metropolitan statistical areas (MSAs).’* If angioplasty and bypass surgery are substitutes, then MSAs in which angioplasty grew most rapidly will have rela- tively slower growth in bypass surgery. If the two are complements, then growth of the two procedures will be positively correlated across MSAs.
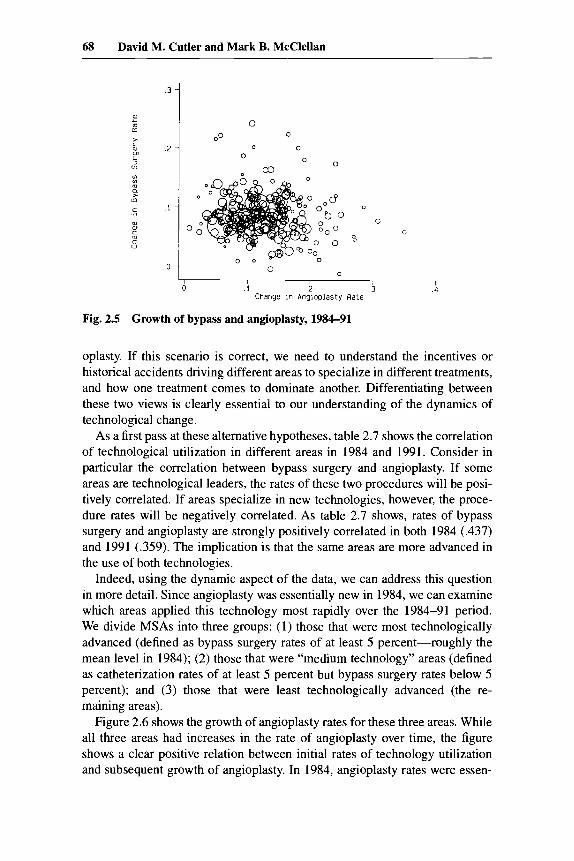
Figure 2.5 shows the growth in the rate of bypass surgery and angioplasty in different MSAs between 1984 and 1991, using data from 247 MSAs. The data are weighted by the number of patients in 1984. The figure does not sug- gest a strong correlation either positively or negatively. Some MSAs (such as Sioux Falls, S.D., and Lubbock, Tex.) have very rapid growth of angioplasty and less rapid growth of bypass surgery, and others (such as Little Rock, Ark., and Savannah, Ga.) have rapid growth of bypass surgery but not of angioplasty. On net, however, there appears to be little relation between the growth of the two procedures. Indeed, the correlation is only -.03. There is therefore no evidence that the growth of angioplasty has led to a reduction in bypass sur- gery, and thus a cost savings.
In addition, we can use area-level comparisons to examine two alternative views of technology diffusion. One is that some areas are technological “lead- ers” and others are “followers.” The leading areas of innovation-for example, areas with major medical facilities and major metropolitan areas-adopt tech- nologies first, then “follower” areas catch up. In this scenario, to understand why technological change is so rapid we would need to understand the incen- tives of the leaders-why they choose to innovate, in what directions they choose to innovate-and of followers-why they choose to imitate, and whom they choose to imitate.
An alternative view is that areas “specialize” differently. This hypothesis suggests that different areas will innovate in different ways, either as a result of an active effort to set themselves apart or as a result of different “random walks” in technology adoption. For example, cardiologists in some areas may concentrate on developing innovations in bypass surgery, or may happen to have a good series of experiences with patient outcomes, while cardiologists in other areas may have better experiences with medical management or angi-
12. The comparisons in this paper are based on simple population means; they are not “ad- justed for demographic differences across MSAs. We plan to estimate more general models in future work, but we have no reason to expect that these adjustments will have any substantial effect on our results. Like previous investigators, we find little variation in the demographic composition of AM1 patients across MSAs. Moreover, in the previous section we demonstrated that technologi- cal growth has been a general phenomenon, not confined to any particular demographic groups.
68 David M. Cutler and Mark B. McClellan
.3 -
.2 -
m u
U
> L m m L 3 (n
(0 Lo
a 1
m
m
m c
ol m c m c 0
0
00 0
0 0
0 0 -
.l -
0 -
I ”
0 0
0 0
Fig. 2.5 Growth of bypass and angioplasty, 1984-91
oplasty. If this scenario is correct, we need to understand the incentives or historical accidents driving different areas to specialize in different treatments, and how one treatment comes to dominate another. Differentiating between these two views is clearly essential to our understanding of the dynamics of technological change.
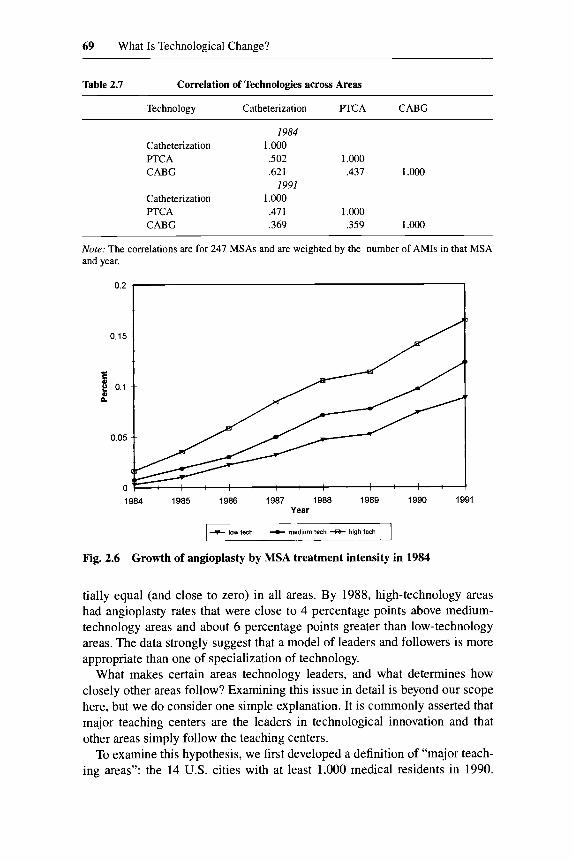
As a first pass at these alternative hypotheses, table 2.7 shows the correlation of technological utilization in different areas in 1984 and 1991. Consider in particular the correlation between bypass surgery and angioplasty. If some areas are technological leaders, the rates of these two procedures will be posi- tively correlated. If areas specialize in new technologies, however, the proce- dure rates will be negatively correlated. As table 2.7 shows, rates of bypass surgery and angioplasty are strongly positively correlated in both 1984 (.437) and 1991 (.359). The implication is that the same areas are more advanced in the use of both technologies.
Indeed, using the dynamic aspect of the data, we can address this question in more detail. Since angioplasty was essentially new in 1984, we can examine which areas applied this technology most rapidly over the 1984-91 period. We divide MSAs into three groups: (1) those that were most technologically advanced (defined as bypass surgery rates of at least 5 percent-roughly the mean level in 1984); (2) those that were “medium technology” areas (defined as catheterization rates of at least 5 percent but bypass surgery rates below 5 percent); and (3) those that were least technologically advanced (the re- maining areas).
Figure 2.6 shows the growth of angioplasty rates for these three areas. While all three areas had increases in the rate of angioplasty over time, the figure shows a clear positive relation between initial rates of technology utilization and subsequent growth of angiopiasty. In 1984, angioplasty rates were essen-
69 What Is Technological Change?
Table 2.7 Correlation of Technologies across Areas
Technology Catheterization F’TCA CABG
I984 Catheterization 1 .ooo PTCA .502 1.000 CABG .62 1 ,437 1.000
I991 Catheterization 1 .000 PTCA .411 1.000 CABG .369 .359 1 .Ooo
~ ~~~~
Note: The correlations are for 247 MSAs and are weighted by the number of AMIs in that MSA and year.
1984 1985 1986 1987 1988 1989 1990 1991 Year
+ low tech medium tech 43- hlgh tech
Fig. 2.6 Growth of angioplasty by MSA treatment intensity in 1984
tially equal (and close to zero) in all areas. By 1988, high-technology areas had angioplasty rates that were close to 4 percentage points above medium- technology areas and about 6 percentage points greater than low-technology areas. The data strongly suggest that a model of leaders and followers is more appropriate than one of specialization of technology.
What makes certain areas technology leaders, and what determines how closely other areas follow? Examining this issue in detail is beyond our scope here, but we do consider one simple explanation. It is commonly asserted that major teaching centers are the leaders in technological innovation and that other areas simply follow the teaching centers.
To examine this hypothesis, we first developed a definition of “major teach- ing areas”: the 14 U.S. cities with at least 1,000 medical residents in 1990.
70 David M. Cutler and Mark B. McClellan
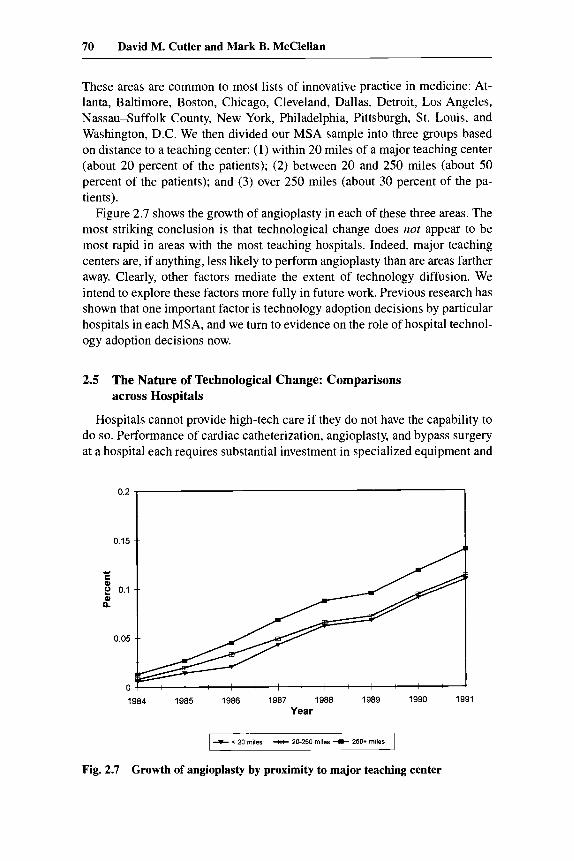
These areas are common to most lists of innovative practice in medicine: At- lanta, Baltimore, Boston, Chicago, Cleveland, Dallas, Detroit, LOS Angeles, Nassau-Suffolk County, New York, Philadelphia, Pittsburgh, St. Louis, and Washington, D.C. We then divided our MSA sample into three groups based on distance to a teaching center: (1) within 20 miles of a major teaching center (about 20 percent of the patients); (2) between 20 and 250 miles (about 50 percent of the patients); and (3) over 250 miles (about 30 percent of the pa- tients).
Figure 2.7 shows the growth of angioplasty in each of these three areas. The most striking conclusion is that technological change does not appear to be most rapid in areas with the most teaching hospitals. Indeed, major teaching centers are, if anything, less likely to perform angioplasty than are areas farther away. Clearly, other factors mediate the extent of technology diffusion. We intend to explore these factors more fully in future work. Previous research has shown that one important factor is technology adoption decisions by particular hospitals in each MSA, and we turn to evidence on the role of hospital technol- ogy adoption decisions now.
2.5 The Nature of Technological Change: Comparisons across Hospitals
Hospitals cannot provide high-tech care if they do not have the capability to do so. Performance of cardiac catheterization, angioplasty, and bypass surgery at a hospital each requires substantial investment in specialized equipment and
0.15 O'* 1 - 0 2 0.1
$
0.05
0 1984 1985 1986 1987 1988 1989 1990 1991
Year
+ < 20 miles -S- 20-250 miles + 250* miles I Fig. 2.7 Growth of angioplasty by proximity to major teaching center
71 What Is Technological Change?
staffing by medical and nursing personnel with the technical expertise to per- form the procedure. Thus, any examination of technological change must in- volve hospital-level analysis of the utilization of different types of care. While estimating the determinants of hospital-level ifivestment decisions is beyond our scope here, an important first step in this analysis is to determine the contri- bution of technology diffusion between and within hospitals to intensity growth in AM1 treatment. If increased procedure use largely reflects a one- time shift in the propensity of the hospital’s physicians to treat patients with intensive procedures, then the analysis of technological change should concen- trate on these adoption decisions. On the other hand, if most technology diffu- sion is within-hospital, then analyses should concentrate on how practices change within a hospital given the availability of intensive resources.
In previous work, McClellan (1993) and McClellan and Newhouse (1994) examined the differential use of intensive procedures in AM1 treatment across hospitals. Those papers documented that having and adopting the capacity to perform intensive procedures was associated with much higher rates of proce- dure use. These hospital-level differences in procedure use were not explained by observed or unobserved differences in patient mix across the hospitals. In this section, we quantify the contribution of new technology adoption by hos- pitals and of within-hospital diffusion (given the hospital’s technological capa- bilities) to the growth in AM1 treatment intensity.
Examining technological change at the hospital level requires a method for assigning patients to specific hospitals. There is more than one admitting hos- pital, however, when a patient is transferred or readmitted. To focus on the episode of care, we classify patients by the hospital they were initially admitted to. With this classification, inany patients will receive intensive surgery even if they were initially admitted to a nonintensive hospital. Understanding the propensity of these transfers and readmissions, however, is an important com- ponent of analyzing technological change.
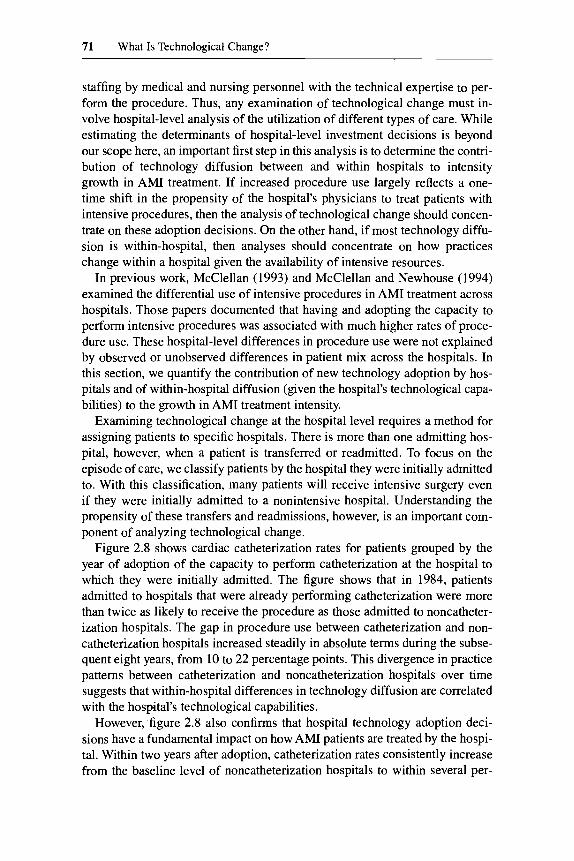
Figure 2.8 shows cardiac catheterization rates for patients grouped by the year of adoption of the capacity to perform catheterization at the hospital to which they were initially admitted. The figure shows that in 1984, patients admitted to hospitals that were already performing catheterization were more than twice as likely to receive the procedure as those admitted to noncatheter- ization hospitals. The gap in procedure use between catheterization and non- catheterization hospitals increased steadily in absolute terms during the subse- quent eight years, from 10 to 22 percentage points. This divergence in practice patterns between catheterization and noncatheterization hospitals over time suggests that within-hospital differences in technology diffusion are correlated with the hospital’s technological capabilities.
However, figure 2.8 also confirms that hospital technology adoption deci- sions have a fundamental impact on how AM1 patients are treated by the hospi- tal. Within two years after adoption, catheterization rates consistently increase from the baseline level of noncatheterization hospitals to within several per-
72 David M. Cutler and Mark B. McClellan
O 6 5 0 5
E B c 0 4
*
.- - N 'C
03
5 d .- I 0 2
E 0
0 1
+I985
0
1984 1985 1986 1987 1988 1989 1990
Year
Fig. 2.8 Catheterization rate by year of technology acquisition
centage points of the current catheterization rate at the hospitals adopting be- fore 1984. Moreover, even after several years of reequilibration, subsequent trends in catheterization rates remain higher than the preadoption trend. Thus, adoption not only had a one-time effect on the use of intensive procedures; it also affected subsequent technological change in the treatment of AM1 at the hospital.
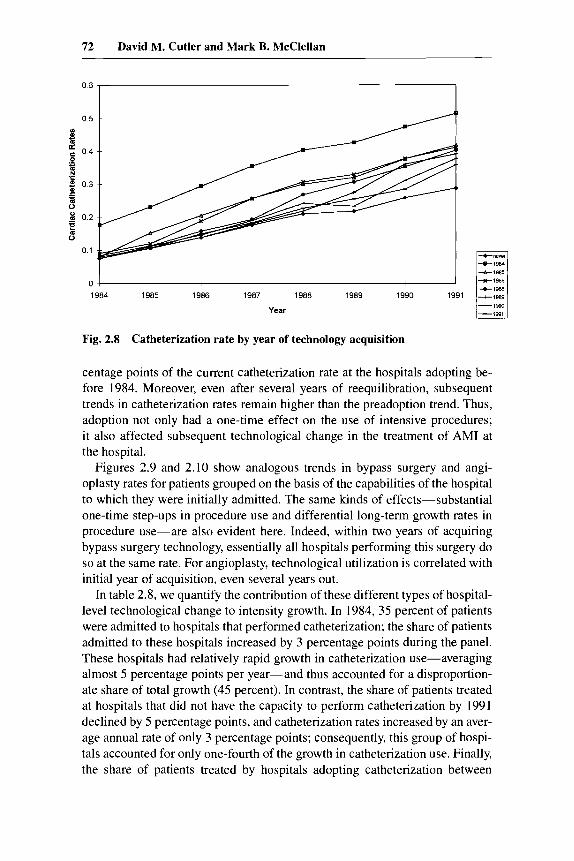
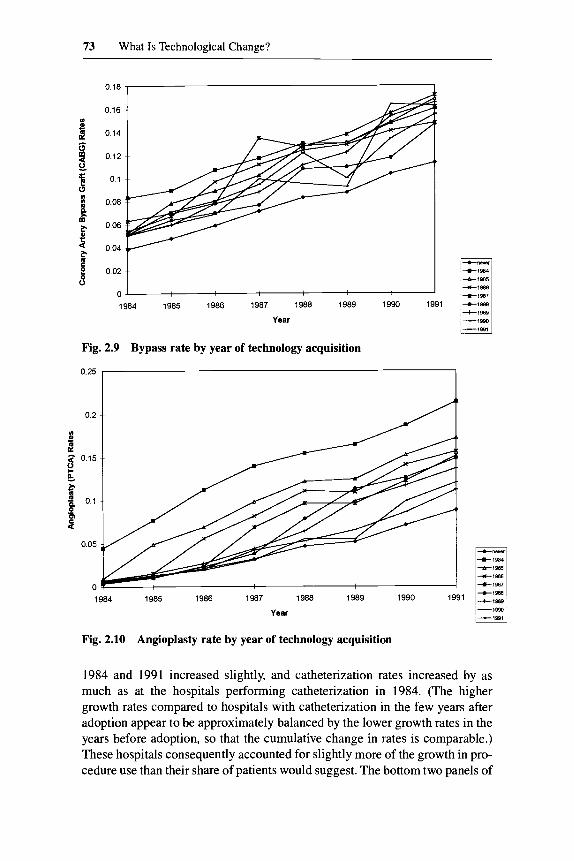
Figures 2.9 and 2.10 show analogous trends in bypass surgery and angi- oplasty rates for patients grouped on the basis of the capabilities of the hospital to which they were initially admitted. The same kinds of effects-substantial one-time step-ups in procedure use and differential long-term growth rates in procedure use-are also evident here. Indeed, within two years of acquiring bypass surgery technology, essentially all hospitals performing this surgery do so at the same rate. For angioplasty, technological utilization is correlated with initial year of acquisition, even several years out.
In table 2.8, we quantify the contribution of these different types of hospital- level technological change to intensity growth. In 1984, 35 percent of patients were admitted to hospitals that performed catheterization; the share of patients admitted to these hospitals increased by 3 percentage points during the panel. These hospitals had relatively rapid growth in catheterization use-averaging almost 5 percentage points per year-and thus accounted for a disproportion- ate share of total growth (45 percent). In contrast, the share of patients treated at hospitals that did not have the capacity to perform catheterization by 1991 declined by 5 percentage points, and catheterization rates increased by an aver- age annual rate of only 3 percentage points; consequently, this group of hospi- tals accounted for only one-fourth of the growth in catheterization use. Finally, the share of patients treated by hospitals adopting catheterization between
73 What Is Technological Change?
0 16
0 14
0 12
0 1
0 08
006
0 04
1984 1985 1986 1987 1988 1989 1990 1991
Year
Fig. 2.9 Bypass rate by year of technology acquisition
0'25 2 0.2
m s! a e
0.15
4
0.05
0 1984 1985 1986 1987 1988 1989 1990 1991
Year
Fig. 2.10 Angioplasty rate by year of technology acquisition
1984 and 1991 increased slightly, and catheterization rates increased by as much as at the hospitals performing catheterization in 1984. (The higher growth rates compared to hospitals with catheterization in the few years after adoption appear to be approximately balanced by the lower growth rates in the years before adoption, so that the cumulative change in rates is comparable.) These hospitals consequently accounted for slightly more of the growth in pro- cedure use than their share of patients would suggest. The bottom two panels of
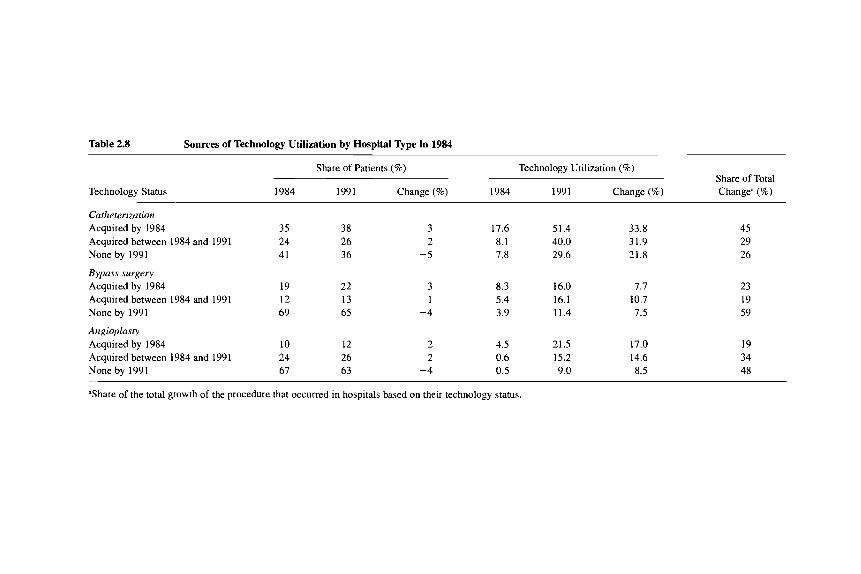
Table 2.8 Sources of Technology Utilization by Hospital Type in 1984
Technology Status
Share of Patients (%) Technology Utilization (%) Share of Total
1984 1991 Change (%) 1984 1991 Change (%) Changea (%)
Catheterization Acquired by 1984 Acquired between 1984 and 1991 None by 1991
Bypass surgery Acquired by 1984 Acquired between 1984 and 1991 None by 199 1
Angioplasty Acquired by 1984 Acquired between 1984 and 1991 None by 1991
35 24 41
19 12 69
10 24 67
38 26 36
22 13 65
12 26 63
3 2
-5
3 1
-4
2 2
-4
17.6 8.1 7.8
8.3 5.4 3.9
4.5 0.6 0.5
51.4 40.0 29.6
16.0 16.1 11.4
21.5 15.2 9.0
33.8 31.9 21.8
7.7 10.7 7.5
17.0 14.6 8.5
45 29 26
23 19 59
19 34 48
'Share of the total growth of the procedure that occurred in hospitals based on their technology status.
75 What Is Technological Change?
table 2.8, which show comparable statistics for bypass surgery and angioplasty, demonstrate qualitatively similar effects.
Figures 2.8 through 2.10 and table 2.8 demonstrate that both kinds of tech- nological change at hospitals-one-time changes in treatment decisions re- sulting from changes in technology availability and long-term changes in trends in treatment intensity associated with technology availability-contrib- ute substantially to technological change.
One might suspect that as technologies become more widespread across hospitals, within-hospital technological change would become relatively more important for further growth. Indeed, if we had analyzed a shorter panel of AM1 patients, then the share of growth associated with changes in technologi- cal capabilities at hospitals would have been smaller, because a smaller share of patients would have been treated by the smaller number of adopting hos- pitals.
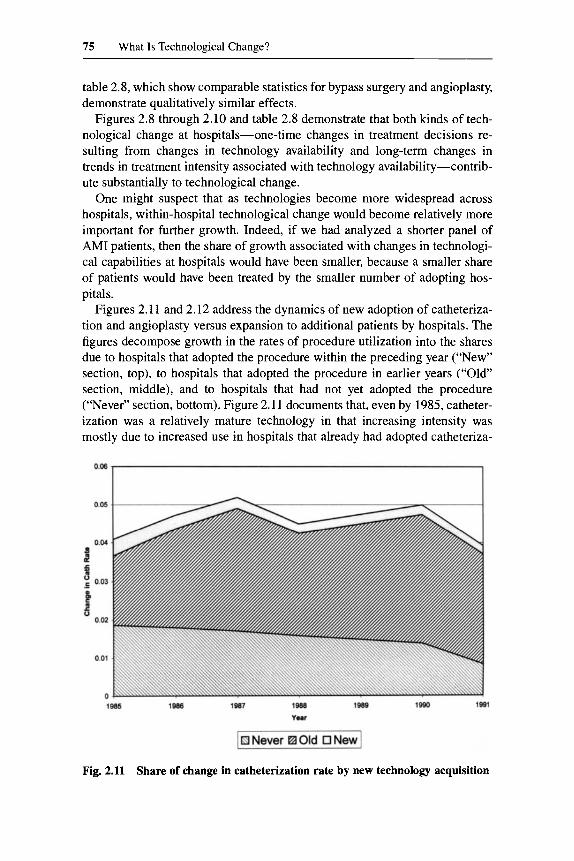
Figures 2.11 and 2.12 address the dynamics of new adoption of catheteriza- tion and angioplasty versus expansion to additional patients by hospitals. The figures decompose growth in the rates of procedure utilization into the shares due to hospitals that adopted the procedure within the preceding year (“New” section, top), to hospitals that adopted the procedure in earlier years (“Old” section, middle), and to hospitals that had not yet adopted the procedure (“Never” section, bottom). Figure 2.1 1 documents that, even by 1985, catheter- ization was a relatively mature technology in that increasing intensity was mostly due to increased use in hospitals that already had adopted catheteriza-
Fig. 2.11 Share of change in catheterization rate by new technology acquisition
76 David M. Cutler and Mark B. McClellan
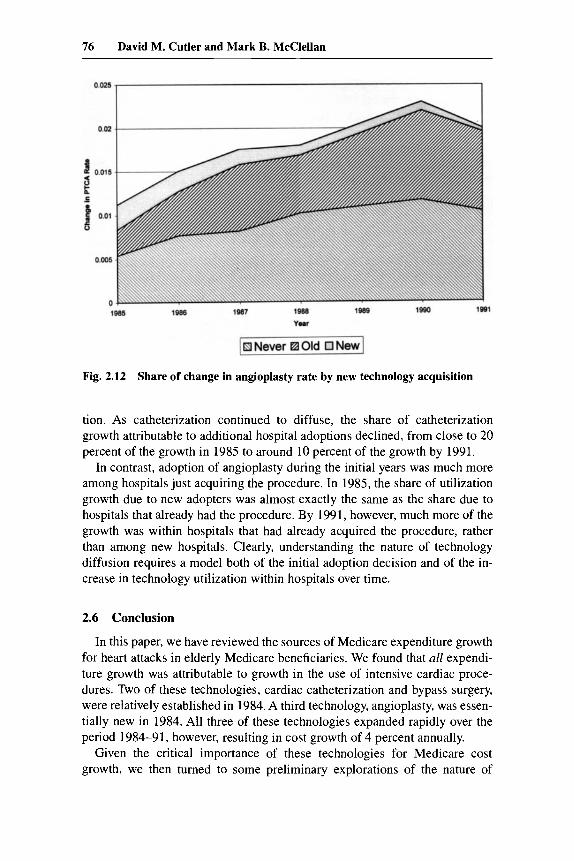
Fig. 2.12 Share of change in angioplasty rate by new technology acquisition
tion. As catheterization continued to diffuse, the share of catheterization growth attributable to additional hospital adoptions declined, from close to 20 percent of the growth in 1985 to around 10 percent of the growth by 1991.
In contrast, adoption of angioplasty during the initial years was much more among hospitals just acquiring the procedure. In 1985, the share of utilization growth due to new adopters was almost exactly the same as the share due to hospitals that already had the procedure. By 1991, however, much more of the growth was within hospitals that had already acquired the procedure, rather than among new hospitals. Clearly, understanding the nature of technology diffusion requires a model both of the initial adoption decision and of the in- crease in technology utilization within hospitals over time.
2.6 Conclusion
In this paper, we have reviewed the sources of Medicare expenditure growth for heart attacks in elderly Medicare beneficiaries. We found that all expendi- ture growth was attributable to growth in the use of intensive cardiac proce- dures. Two of these technologies, cardiac catheterization and bypass surgery, were relatively established in 1984. A third technology, angioplasty, was essen- tially new in 1984. All three of these technologies expanded rapidly over the period 1984-91, however, resulting in cost growth of 4 percent annually.
Given the critical importance of these technologies for Medicare cost growth, we then turned to some preliminary explorations of the nature of
77 What Is Technological Change?
changes in their use. Analysis across MSAs documented that angioplasty did not appear to be a cost-saving technology in the sense that its diffusion led to reductions in more intensive types of surgery. The analysis across MSAs also showed that certain areas appeared to be “leaders” and others “followers” in terms of trends in technology use, though more aggressive use of intensive technologies was not associated with being a medical center. We then turned to preliminary analyses at the hospital level, which showed not only that tech- nology adoption had a dramatic effect on treatment decisions for AM1 patients at the hospital at a point in time but also that adoption led to a fundamental shift in the growth rate of technology use at the hospital.
We have documented that both area- and hospital-level factors have substan- tial effects on technological change in the treatment of AMIs. What remains is to analyze how these factors are related, and thus to develop a more compre- hensive model of how technological change is mediated. Does earlier technol- ogy adoption by hospitals in an area, or more rapid changes in treatment pat- terns at hospitals that have adopted intensive technologies, contribute to more rapid growth in the “leading” areas? What area characteristics are associated with relatively rapid growth? How do these factors affect hospital technology adoption decisions? While such analyses have been conducted in other indus- tries (see the review in Griliches 19SS), they have rarely been addressed in this context. Answering such questions, however, appears crucial for understanding growth in health spending.
References
Carter, Grace, and Paul B. Ginsberg. 1985. The Medicare case mix index increase: Medical practice changes, aging, and DRG creep. Rand R-3292, Santa Monica, Ca- lif.: RAND, June.
Carter, Grace, Joseph P. Newhouse, and Daniel A. Relles. 1990. How much change in the DRG index is DRG creep? Journal of Health Economics 9 (4): 41 1-28.
Cutler, David M. 1995a. Cutting costs and improving health: Making reform work. Health Afsairs 15 (Spring): 161-72.
. 1995b. The incidence of adverse medical outcomes under prospective pay- ment. Econometrica 63 (I): 29-50.
Griliches, Zvi. 1988. Technology, education, andproductivity. New York: Blackwell. McClellan, Mark. 1993. The effect of hospital characteristics on medical treatment in-
tensity: Acute myocardial infarction in the elderly. Ph.D. diss., Massachusetts Insti- tute of Technology, Cambridge.
McClellan, Mark, Barbara J. McNeil, and Joseph P. Newhouse. 1994. Does more inten- sive treatment of acute myocardial infarction in the elderly reduce mortality? Journal of the American Medical Association 272: 859-66.
McClellan, Mark, and Joseph P. Newhouse. 1994. The costs and benefits of medical technology. Cambridge, Mass.: Harvard University. Mimeograph.
Newhouse, Joseph P. 1992. Medical care costs: How much welfare loss? Journal of Economic Perspectives 6 (Summer): 1-26.
78 David M. Cutler and Mark B. McClellan
Prospective Payment Assessment Commission. 1994-95. Annual report to Congress.
. 1985 and 1991. Medicare and the American Health Care System. Washington, Washington, D.C.: Prospective Payment Assessment Commission.
D.C.: Prospective Payment Assessment Commission.
Comment Jonathan Gruber
Cutler and McClellan’s paper focuses on what is, in my view, the most impor- tant topic in health economics today: the diffusion of new medical technolog- ies. The rapid rise in medical costs over the past 40 years, as medical spending has tripled as a share of GNP, is a natural source of concern to both academics and policymakers. Careful efforts to account for this cost increase by factors such as the aging of the population, increased incomes, or increased insurance coverage has left the majority of the increase unexplained. And this residual is generally attributed to “technological advance” in medicine.
This attribution, however, raises two critical questions. First, can we find direct evidence that technological advance is the culprit? As with any such exercise, labeling a residual by default is never very satisfying. So rather than calling the residual “technology,” we need to document that it is in fact new technologies that are driving medical costs upward. While, on one level, this is just an accounting exercise, it is also the crucial first step toward thinking about whether we want a policy response to rising costs, and how to design that policy response.
Second, what drives technological adoption and diffusion in the health care sector? While analysts such as Burt Weisbrod have written “big think” pieces conjecturing about the source of technological advance, there is strikingly little hard evidence on the critical factors driving diffusion.
This ambitious paper tries to tackle both of these questions. Ultimately, I think that the authors do a good job on the first, but they only scratch the surface of the second.
They begin by noting that price regulation in Medicare has not been able to slow cost growth in that program. Despite aggressive reimbursement reforms under Medicare’s Prospective Payment System (PPS), costs are rising just as fast now as they were in the years before price regulation. As McClellan (1993) showed, the main reason why costs keep rising for Medicare is that there has been a huge rise in surgical admissions, and surgical diagnosis-related groups (DRGs) are reimbursed more highly than nonsurgical DRGs.
This paper illustrates that point in more detail, within the context of a spe- cific illness, acute myocardial infarction (AMI). I think that the most interest- ing results in the paper are in table 2.5, which decomposes the 4.1 percent
Jonathan Gruber is professor of economics at the Massachusetts Institute of Technology and a faculty research fellow of the National Bureau of Economic Research.
79 What Is Technological Change?
annual increase in reimbursement for AM1 into price and treatment changes. The authors find that, if AM1 had been treated in a constant way over time, average reimbursement would have actually fallen. This is because Medicare, perhaps in reaction to increasing AM1 costs, lowered the reimbursement rate for some of the “high-tech” means of treating AMIs. As a result, the large rise in costs was driven solely by a shift in the treatment of AMIs toward more expensive interventions. Thus, this provides some of the first solid evidence for technological change as a source of medical cost increase.
I have two reactions to these interesting findings. First, on a picky note, there is potentially a price index problem here. The authors use the 1991 prices and distribution of treatments to calculate their price and quantity indexes. Given the dramatic shift in treatment styles from 1984 to 1991, I would be interested to see how sensitive their answers are to the base year chosen. But my guess is that the result would be relatively robust.
Second, and more important, this finding immediately raises the second question posed above: what was the source of this rapid technological change? Was it driven by innovations in medical treatment techniques that were exoge- nous to changes in Medicare pricing policy? Or was it an endogenous response to the reimbursement schedule set up by Medicare, which reimbursed intensive interventions much more highly? Health economists like to draw an analogy between trying to regulate medical costs and squeezing a pillow-if you try to do it by squeezing one end, you just get a larger response on the other side. In this case, the side that is being squeezed is treatment-specific prices, and the side where you may see the responses is changes in treatment technology.
So the key question is: would we have seen this dramatic change in the treatment of AM1 in the absence of PPS, or was it caused by the pricing struc- ture put in place by Medicare, as the “pillow” hypothesis would suggest? If technological advance was exogenous to Medicare policy, then this is an inter- esting descriptive exercise on why Medicare could not control costs, but it has little policy weight. But if it was an endogenous response, then it suggests that this type of pillow effect is critical, and that it must be incorporated in analyz- ing the net effects on the program of changing relative prices.
I bring this up because I think that the authors could do a lot more here. In particular, during their sample period we see dramatic changes in the relative reimbursements of these different treatments for AMI. For example, they re- port that in 1990 the reimbursement rate for angioplasty was halved. Did use of angioplasty respond? Did we see a slowing of the rapid move toward this new type of technology? More generally, the authors have a critical opportunity here to move beyond simply describing the technological change to ask what role reimbursement policy played.
The authors do spend some time trying to model the use of new technolog- ies, using variation in technology use across metropolitan statistical areas (MSAs). The most interesting question that they ask is whether the increased use of angioplasty actually saved Medicare money, since it is cheaper than
80 David M. Cutler and Mark B. McClellan
alternative treatments such as bypass surgery. This is important because it is popularly perceived that new medical technologies can be money saving, much like technology in other areas such as computers. But health economists are largely skeptical of this claim.
In fact, however, we have little existing evidence to support the skepticism of health economists. Cutler and McClellan attempt to provide such evidence by asking whether MSAs that saw increased use of relatively low cost angi- oplasty also saw decreased use of high-cost bypass surgery. They find that, in fact, there is no correlation across MSAs in the change in these two types of treatments-that is, places that starting using more angioplasty used no less bypass surgery.
This is a striking finding, but I think that it is not fully convincing. This is sort of like the tests of the physician-induced demand hypothesis, which posits that physicians will respond to negative income shocks by doing more proce- dures on their patients. Most tests of this view have generally proceeded by asking whether places with more surgeons have more surgery, and they have found that this is the case. But if there is some omitted area change that is correlated with taste for surgery, then this omission biases these tests toward finding a positive correlation between surgeon density and surgery rates. Simi- larly, in Cutler and McClellan’s data, if there is some omitted MSA-specific change that leads individuals to demand more intensive interventions, then it will bias the authors toward finding a positive correlation between angioplasty changes and bypass changes. This could mask a true substitution pattern be- tween the two types of treatment.
At a minimum, the authors need to control for demographic changes across areas. Another test might be to look at what was happening to bypass use right before angioplasty grew. That is, the authors could look at the difference in growth rates of bypass before and after the widespread availability of angi- oplasty. Were the MSAs that adopted angioplasty the ones in which bypass was growing most rapidly anyway?
In the final table, the authors try another accounting exercise, which is to decompose the total change in technology utilization into utilization in hospi- tals that had the technology in 1984, those that acquired it between 1984 and 1991, and those that did not have it by 1991. The authors highlight the fact that, for catheterization, over half of the change was in hospitals that had the technology in 1984. The more striking finding, to my mind, is the rapid growth in catheterization at hospitals that did not have a catheterization lab by 1991. In fact, for revascularization, the majority of the growth occurs at hospitals that cannot do revascularization!
The key to understanding these potentially confusing findings is the role of transfers and readmits. That is, the hospital to which the authors refer is the hospital to which the person is admitted. If the patient is then transferred or discharged and readmitted within the 90-day window to some hospital that has
81 What Is Technological Change?
catheterization or revascularization capability, the patient can get the inten- sive treatment.
I think that the huge role of transfers and readmits here is interesting and should not be overlooked, and it suggests two further directions for the analy- sis. First, the authors could examine transfer and readmit patterns. For ex- ample, what is the maximum distance that most patients are transferred, or the farthest hospital to which they are readmitted? This could have important implications for the finding that being near a teaching hospital is not associated with higher use of expensive technology. This finding could simply result from the fact that even individuals far from a teaching hospital are transferred there for care.
Second, they could look at within-MSA technology adoption decisions. That is, the authors could turn to a within-area model of “leaders” and “followers,” versus “specialization.” Is there a “medical arms race,” whereby one hospital’s adoption of a technology triggers its adoption at nearby hospitals? Or do these technologies have more of a public goods feature, where some hospitals spe- cialize in their use, and other hospitals transfer patients to the hospitals that have the technology? Once again, testing this runs into the same types of omitted-variables bias problems encountered by the earlier results on technol- ogy substitution. But if the authors can deal with these problems this might be a fruitful direction to pursue in answering the second question, about what drives technological advance in the medical care marketplace.
Reference
McClellan, Mark. 1993. The effect of hospital characteristics on medical treatment in- tensity: Acute myocardial infarction in the elderly. Ph.D. diss., Massachusetts Insti- tute of Technology, Cambridge.