Embed Size (px)
Citation preview

MOBILITY REDUCTION OF CO2 USING CO2 SOLUBLE SURFACTANTS
by
William James McLendon
BS in Chemistry, University of Arizona, 2004
Submitted to the Graduate Faculty of
Swanson School of Engineering in partial fulfillment
of the requirements for the degree of
Master of Science
University of Pittsburgh
2012

ii
UNIVERSITY OF PITTSBURGH
SWANSON SCHOOL OF ENGINEERING
This thesis was presented
by
William James McLendon
It was defended on
July 24th, 2012
and approved by
Erick J. Beckman, PhD, Professor, Department of Chemical and Petroleum Engineering
Stephen R. Little, PhD, Chair of the Department of Chemical and Petroleum Engineering
Thesis Advisor: Robert M. Enick, PhD, Professor, Department of Chemical and Petroleum Engineering

iii
MOBILITY REDUCTION OF CO2 USING CO2 SOLUBLE SURFACTANTS
William J. McLendon, MS
University of Pittsburgh, 2012
Addition of slightly CO2-soluble, brine-soluble, surfactants to high pressure CO2 for EOR may facilitate in-situ
generation of CO2-in-brine foams for mobility control. These non-ionic surfactants have been demonstrated to
dissolve in CO2 to concentrations of 0.1wt% at resevoir conditions and stabilize CO2-in-brine foams in a high
pressure windowed cell. One such surfactant is Huntsman SURFONIC® N, a branched nonylphenol ethoxylates
with averages of 12 (N-120) or 15(N-150) ethylene oxide repeat units in the hydrophile. SURFONIC® N-120 was
selected for mobility reduction studies involving flow of CO2 into brine-saturated porous media.
Transient mobility measurements were conducted using a water-wet Berea core (104mD), water-wet
Bentheimer sandstone core (~1500mD), and several SACROC carbonate cores (3.6 and 8.9mD). The CO2 was
injected into brine-saturated cores at superficial velocity of 10 ft/day, and surfactant was either not used (control),
dissolved only in brine at 0.07wt%, dissolved only in CO2 at ~0.07wt%, or dissolved in brine and CO2 at 0.07wt%.
In general, in-situ foam generation in relatively high permeability sandstone was evidenced during the first few pore
volumes of CO2 injected by pressure drops that were 2-3 times greater than control tests regardless of what phase
CO2 was in. Mobility reduction was more modest (20–50% increases in pressure drop) in lower permeability
SACROC cores (3.6 and 8.9mD) when surfactant was dissolved in CO2. With surfactant dissolved in brine ,pressure
drops increased by a factor of 2–3 when CO2 was injected into an 8.9mD core.
High pressure CT imaging of in-situ foam generation was conducted by injecting high pressure CO2 into
5wt% KI-brine-saturated Berea sandstone (3-8mD). Tests with no surfactant (control), or with surfactant dissolved
either brine or CO2 at ~0.07wt%. At lower superficial velocities (0.47ft/day), in-siti foam generation was obvious
only when surfactant was dissolved in brine. Higher flow rates (4.7ft/day) preferential flow of CO2 through high
permeability layers and viscous fingering within layers that occurred during control tests was suppressed by addition
of surfactant to either CO2 or brine. The most distinct CO2 foam front occurred with surfactant dissolved in brine.

iv
TABLE OF CONTENTS
PREFACE…………………………………………………………………………………………………………ix 1.0 INTRODUCTION……………………………………………………………………………………………1 2.0 OBJECTIVE……………………………………………………………………………………………….....4
3.0 EXPERIMENTAL………………………………………………………………………………………….10
3.1 TRANSIENT MOBILITY (PRESSURE DROP) MEASUREMENTS: CO2 INVADING BRINE-SATURATED BEREA SANDSTONE…………………………………………………………………….10 3.2 CT IMAGING OF CO2 INVADING BRINE-SATURATED POLYSTRENE CORE……………….11
4.0 RESULTS……………………………………………………………………………………………………12
4.1 TRANSIENT MOBILITY MEASUREMENTS………………………………………...…………12
4.2 CT IMAGING………………………………………………………………...……………………18
5.0 CONCLUSIONS…………………………………………………………………………………...……….28
BIBLIOGRAPHY……………………………………………………………………………………………….30

v
LIST OF TABLES
Table 1. Conditions for CT imaging displacements, 23 oC 2200 or 2300 psi, CO2 invading a 5wt% KI brine-saturated Berea sandstone core; *permeability values for all cores not measured, those cores were estimated to be ~ 20% porous and ~5 mD ………………………………………………………….......19

vi
LIST OF FIGURES
Figure 1. Branched nonylphenol ethoxylate……………………………………………………………………….…4 Figure 2. The solubility of SURFONIC® N-120 and N-150 in CO2 at 25 oC……………………………………....5 Figure 3. The solubility of SURFONIC® N-120 and N-150 in CO2 at 58………………………………………...5 Figure 4. Foam stability associated with Huntsman SURFONIC® N-120 and N-150 surfactants at 1300 psia and 25 oC……....6 Figure 5. Pressure drop across a 6” long, 1” diameter, 104 md Berea sandstone core…………………………...….7 Figure 6a. CT slices of CO2 within PS cores (~30 mD), ~2700 psi and 23oC……………………………………………..8 Figure 6b. Mean Computed Tomography Number (CTN) along the length of the 6” PS core………………………9 Figure 7a. Displacement of brine, either 5wt% NaCl or SACROC brine, with CO2 at 21oC, 2700 psi. Bentheimer sandstone core (25% porosity, 1550 mD, 2.03” length, 1” diameter). CO2 injection rate 1mL/min, 10 ft/day……………………………………………………………………………………………………................13 Figures 7b. Displacement of brine, either 5wt% NaCl or SACROC brine, with CO2 at 21oC, 2700 psi. Bentheimer sandstone core (25% porosity, 1550 mD, 2.03” length, 1” diameter). CO2 injection rate 1mL/min, 10 ft/day………………………………………………………………………………………………………………14 Figure 8. Displacement of SACROC brine with CO2 at 21oC, 2700psi…………………….……………………….15 Figure 9. Displacement of SACROC brine (6.6wt% NaCl, 1.2wt% CaCl2, 0.4wt% MgCl2) with CO2 at 21oC, 2700 psi. SACROC carbonate core (8.9mD, porosity 16.5 %, 2.6” length, 1” diameter)…………………………..16 Figure 10. Displacement of 5wt% NaCl brine with CO2 at 21oC, 2700 psi. SACROC carbonate core (3.6mD, porosity 14% porosity, 2” length, 1” diameter). Superficial velocity of 10 ft/day. Control tests with no surfactant, and a test with surfactant in CO2………………………………………………………………………...17 Figure 11: Low flow rate test (0.2 ml/min, 0.47 ft/day) in low permeability Berea sandstone (4.7 mD) control….20 Figure 12: Low flow rate test (0.2 ml/min, 0.47 ft/day) in low permeability Berea sandstone (3.2 mD); surfactant N-150 in brine……………………………………………………………………………………………..21

vii
LIST OF FIGURES
Figure 13. Low flow rate test (0.2 ml/min, 0.47 ft/day) in low permeability Berea sandstone (3.0 mD); surfactant N-150 in CO2………………………………………………………………………………………………22 Figure 14. High flow rate test (2.0 ml/min, 4.7 ft/day) in low permeability Berea sandstone (6.0 mD); control test…………………………………………………………………………………………………………………….23 Figure 15. High flow rate test (2.0 ml/min, 4.7 ft/day) in low permeability Berea sandstone (5.0 mD); Surfactant N-120 in brine……………………………………………………………………………………………..24 Figure 16. High flow rate test (2.0 ml/min, 4.7 ft/day) in low permeability Berea sandstone (3.9 mD); surfactant N-150 in brine……………………………………………………………………………………………..25 Figure 17. High flow rate test (2.0 ml/min, 4.7 ft/day) in low permeability Berea sandstone (7.6 mD); surfactant N-120 in CO2………………………………………………………………………………………………26 Figure 18. High flow rate test (2.0 ml/min, 4.7 ft/day) in low permeability Berea sandstone (6.1 mD); surfactant N-120 in CO2……………………………………………………………………………………………..27

viii
PREFACE
I would like to thank first and foremost Dr. Robert M. Enick, who game me the opportunity and helped drive
me to achieve success. A special thanks to Dr. T.R. McLendon whos’ guidance and tuteledge have helped me get
trhought this research and through life. Further, a special thanks for Huntsman for supporting the post-doctoral
work of Peter Koronaios and providing the surfactant samples and also Kinder Morgan for providing us with
SACROC cores, crude oil, and produced brine samples. I also appreciate the the generous financial support of this
research project provided by the US DOE via the National Energy Technology Laboratory’s Regional University
Alliance, NETL RUA. This technical effort was performed in support of the National Energy Technology
Laboratory's on-going research in "Novel Surfactant-Based Concepts for Improved Mobility Control of CO2 Floods"
under RES contract DE-FE0004000.4.650.920.001. I would like to acknowledge the technical contributions of
Bryan Tennant (CT imaging).

1
1.0 INTRODUCTION
Mobility control during CO2 floods is typically realized using the water-alternating-gas process (WAG), while
various types of gels can be employed to block thief zones. A recent literature review (Enick and Olsen, 2011)
indicates that there have been extensive studies of chemically-based techniques for the near-wellbore diversion of
CO2 from watered-out zones and/or improving in-depth mobility control throughout the formation. The most
notable concept is the in-situ generation of CO2-in-brine foams via the alternating injection of aqueous surfactant
solutions and CO2 gas (SAG). Numerous laboratory studies and about a dozen pilot-scale tests indicated that these
foams were used primarily for either near-wellbore conformance control in lateyed formations by generating strong
foam in watered-out zones, or (in fewer cases) for in-depth mobility control by generating weaker foam that would
inhibit fingering in the oil-bearing zone (Enick and Olsen 2011). To some degree, both conformance control and
mobility control could be accomplished with SAG.
In an attempt to provide operators with an additional option for generating foams in-situ, suirfactant can be
dissolved in CO2 rather than brine. The injection of a CO2-surfactant solution would ensure that the surfactant
would be available for foam generation in the porous medium wherever the CO2 was flowing, rather than depending
on CO2 flowing into the same portions of the formation invaded by a previously injected aqueous surfactant solution
during SAG. The CO2-surfactant solution would also be capable of generating foam with in-situ brine, possibly
reducing or even eliminating the need for alternating injections of brine; this would be of particular interest to
operators that only employ continuous CO2 to recover oil. The identification of CO2-soluble foaming surfactants
would also enable one to conduct an in-situ foam generation mobility control process in which surfactant was
present in the alternating CO2 and brine slugs, thereby enhancing the likelihood that foams would form in-situ.
The notion of dissolving a surfactant into CO2 during an enhanced oil recovery process for the purpose of
generating CO2-in-brine mobility control foam or conformance control foam was suggested by Bernard and Holm in
their 1967 patent (Bernard and Holm 1967), but data validating the solubility of surfactants in CO2 was not
provided. Dense CO2 is indeed a feeble solvent for compounds with polar segments, and the identification of
surfactants that could dissolve at appreciable concentrations in CO2 and stabilize CO2-in-brine foams is a
2
challenging design problem. The CO2-insolubility of most surfactants, particularly ionic surfactants, was addressed
Schievelbein’s patent suggested that a co-solvent could be avoided if non-ionic hydrocarbon-based surfactants were
considered. Schievelbein recommended using at least 0.2wt% (2000 ppm) of an ethoxylated alkyl or ethoxylated
alkyl aryl (i.e. alkyl phenol) hydrocarbons that contain an alkyl chain with an average of 7 to 15 carbons and an
average of between 1 to 7 ethoxide (i.e. ethylene oxide or EO) units (Schievelbein 1991). Typically, surfactants
with such short EO tails are likely to be brine-insoluble or brine-dispersible. This lack of solubility in the aqueous
phase makes such surfactants unlikely stabilize CO2-in-brine foams, which are readily formed when the surfactant is
more soluble in the aqueous phase than in the dense CO2.
There has been a great deal of renewed interest in CO2-soluble surfactants for both petroleum and chemical
engineering applications during the last decade. As a result, commercially available, brine-soluble, non-ionic
surfactants have been identified that are not only slightly soluble in CO2 (e.g. several tenths of a weight percent), but
also capable of stabilizing CO2-in-brine foams. Johnston and coworkers (Dhanuka et al. 2006) noted that Dow
2,6,8-trimethyl-4-nonyl ether (90% active, 10%water) was an effective foaming agent. Johnston and co-workers
also investigated the ability of di-block and tri-block surfactants with siloxane-based, fluorocarbon-based and
polyalkyloxide-based CO2-philic segments to stabilize CO2-in-water emulsions (daRocha et al. 2001). Our research
group established that oligo(vinyl acetate) (OVAc) is extremely CO2-philic and suitable for incorporation into CO2-
soluble ionic surfactants (Fan et al. 2005). Tan and Cooper (2005) used polyethylene oxide (PEO) as the hydrophile
during their design of tri-block OVAc-b-PEO-b-OVAc surfactants capable of stabilizing CO2 foams.
In 2008, researchers from the University of Texas at Austin and Dow Oil & Gas used a proprietary non-ionic
surfactant at a concentration of ~0.1wt% in CO2 to recover oil from a core (Le et al. 2008). They found that the
injection of the CO2-surfactant solution into the waterflooded core without the use of alternating water slugs yielded
higher oil recovery than WAGS (water-alternating -gas with surfactant dissolved in the CO2), and SAG (surfactant-
alternating-CO2 with surfactant dissolved in the water). Recently, the same type of surfactant was tested by Dow
Oil & Gas in a SACROC pilot flood operated by Kinder Morgan (Sanders 2010; Sanders, Jones et al. 2010). The
results indicated that a reduction in CO2 injection at a constant pressure occurred while 30% of the CO2 was diverted
dissolve siloxane-based surfactants, which – like CO2 – have very low solubility parameters (Irani 1989). In 1991,
by Irani’s patent (Irani et al. 1989). Irani suggested that a co-solvent should be added to the CO2 in an attempt to
Tergitol TMN surfactants were CO2-soluble (Ryoo 2003) and that TMN 6 (Mw = 552) poly(ethylene glycol)8.33

3
into zones that had previously not seen CO2. Both of these trends indicated that reduced-mobility CO2-in-brine
foams had formed in-situ. The University of Texas at Austin and Dow Oil & Gas presented a study of the
morphologies, stabilities, and viscosities of high-pressure carbon dioxide-in-water foams formed with water-soluble,
branched, nonionic hydrocarbon surfactants that did not contain an aromatic or cyclic functionality (Adkins, Chen,
Chan, et al. 2010). The surfactant solubility in dense CO2 was not presented, however. Foams were formed by
dissolving the surfactant in the brine and then co-injecting this aqueous surfactant solution along with high pressure
CO2 into a sand pack with hydrophilic pores. Most of the surfactants did form foams at 24oC, and the surfactants
with high cloud point temperatures (for 1wt% aqueous solutions) yielded foams at the highest temperatures. They
also described a new, non-ionic, glycerin-based, twin-tailed, water-soluble, ethoxylated surfactant for stabilizing
CO2-in-water emulsions used for CO2 flooding sweep improvement (Sanders, Nguyen et al. 2010). Johnston and
co-workers investigated a biocompatible, water-soluble, nonionic, ethoxylated surfactant, polyoxyethylene (20)
sorbitan monooleate (polysorbate 80, Tween 80) for stabilizing CO2-in-water and water-in-CO2 emulsions and
double-emulsions (Torino et al. 2010).
Recently, NETL and the University of Pittsburgh presented a studied numerous commercially available,
inexpensive, non-ionic surfactants that were capable of dissolving in CO2 in dilute concentration at typical minimum
miscibility pressure (MMP) conditions and, upon mixing with brine in a high pressure windowed cell, stabilizing
CO2-in-brine foams (Xing et al. 2010). These slightly CO2-soluble, water-soluble surfactants include branched
alkylphenol ethoxylates, branched alkyl ethoxylates, a fatty acid-based surfactant, and a predominantly linear
ethoxylated alcohol. Many of the surfactants were between 0.02 - 0.06wt% soluble in CO2 at 1500 psia and 25 oC,
and most demonstrated some capacity to stabilize foam. The most stable foams were realized with branched
alkylphenol ethoxylates, several of which were studied in high pressure small angle neutron scattering (HP SANS)
tests. HP SANS analysis of foams residing in a small windowed cell demonstrated that the nonylphenol ethoxylate
Huntsman SURFONIC® N-150 (an average of 15 EO groups in the ethoxylate tail) generated foams with a greater
concentration of droplets and a broader distribution of droplet sizes than the shorter chain analogues with 9–12
ethoxylates.
4
2.0 OBJECTIVE
In this work, the efficacy of one of the types of non-ionic surfactants recently assessed by our group, a branched
nonylpheol ethoxylate (e.g. Huntsman SURFONIC® N-120 and N-150 shown in Figure 1), is assessed as a CO2-
soluble mobility control additive using transient mobility experiments and CT imaging.
Figure 1. Branched nonylphenol ethoxylate; Huntsman SURFONIC® N-120 and N-150, xaverage = 12 and 15, respectively. This is a representative alkyl tail; the tails of the commercial surfactant consist of mixed C9 isomers); The pour points of N-120 ad N-150 are 2.8 oC and 17.2 oC, respectively.
We have previously determined the solubility of both surfactants in CO2 at 25 oC and 58 oC. The results, shown
in Figures 2 and 3 (Xing et al. 2010; Xing et al. 2011), were obtained via a standard non-sampling technique in
which the solubility was measured during the very slow expansion of a transparent, single-phase, high pressure
mixture of known amounts of CO2 and the surfactant.. The dew point pressure, shown by the markers in Figures 2
and 3, correspond to the pressure value at which a cloud (i.e. very fine mist) of a second phase, a surfactant-rich
liquid, first appeared and prevented one from discerning objects behind the 1 inch diameter sample volume.
Both surfactants have also been shown to stabilize CO2-in-brine foams in agitated, windowed, high pressure
phase behavior cells (Xing et al. 2010). In these experiments equal amounts of brine and dense CO2 were mixed
vigorously along with the amount of surfactant that could be dissolved in the CO2 at test conditions. After mixing
ceased, foam initially filled the entire cell. The rate of collapse of the CO2-in-brine foam, which was quantified by
measuring the rate of appearance of a clear brine phase below the foam and, in some cases, the appearance of a clear
CO2 phase aboave the foam.

5
Figure 2. The solubility of SURFONIC® N-120 and N-150 in CO2 at 25 oC (Xing et al. 2010)
Figure 3. The solubility of SURFONIC® N-120 and N-150 in CO2 at 58 oC (Xing et al. 2010)
The branched nonylphenol ethoxylates yielded foams that were more stable than most of the other candidate
surfactants, as shown in Figure 4. In-situ foam formation was also verified with transient mobility tests with a Berea
1000 1500 2000 2500 3000 3500 4000 4500 5000 5500 6000
0.00 0.05 0.10 0.15 0.20 0.25
Pre
ssur
e (p
si)
Surfactant concentration wt%
Huntsman N 150
Huntsman N 120
1000
2000
3000
4000
5000
6000
7000
8000
0.00 0.05 0.10 0.15 0.20 0.25
Pre
ssur
e (p
si)
Surfactant concentration wt%
Huntsman N 120
Huntsman N 150
sandstone core (104 mD) (Xing et al. 2011).

6
Figure 4. Foam stability associated with Huntsman SURFONIC® N-120 and N-150 surfactants at 1300 psia and 25 oC, with a
brine (5wt%NaCI)/CO2 volume ratio 1:1; 0.03% N-120 and N-150 based on CO2 mass. At t=0 min, 100% of the CO2 (top phase) and 100% of the brine (bottom phase) were in the foam. At t = ~120 min., 100% of the CO2 and 20% of the brine were in the CO2-in-brine foam, and 80% of the brine was in the excess brine phase. No excess CO2 phase appeared up to 300 min. (Xing et al. 2010)
High pressure CO2 was injected into the brine-saturated core and the corresponding pressure drop vs pore volumes
injected (PVI) were recorded for experiments with no surfactant, surfactant only in the CO2, surfactant only in the
brine, and surfactant in both the brine and CO2 Figure 5. The signature of in-situ foam generation is a significant
increase in the pressure drop vs PVI results relative to the control displacement in which no surfactant is used
(Farajzadeh et al. 2009). The pressure drop values when surfactant was dissolved in the CO2 or the brine were at
-100
-80
-60
-40
-20
0
20
40
60
80
100
0 20 40 60 80 100 120 140 160 180 200 220 240 260 280 300
% o
f the
CO
2 (+%
) and
brin
e (-
%)
Time (min)
Huntsman N 120 top,(0.03wt%)
Huntsman N 120 bottom,(0.03wt%)
Huntsman N 150 top,(0.03wt%)
Huntsman N 150 bottom,(0.03wt%)

7
least twice those attained when pure CO2 was injected into the same brine-saturated core. The greatest increase in
pressure was realized when the surfactant was present in both the CO2 and brine.
Figure 5. Pressure drop across a 6” long, 1” diameter, 104 md Berea sandstone core. 25 oC, ~2700 psi, 1 cm3/min volumetric flow rate (superficial velocity of 10 ft/day) (Xing et al. 2011)
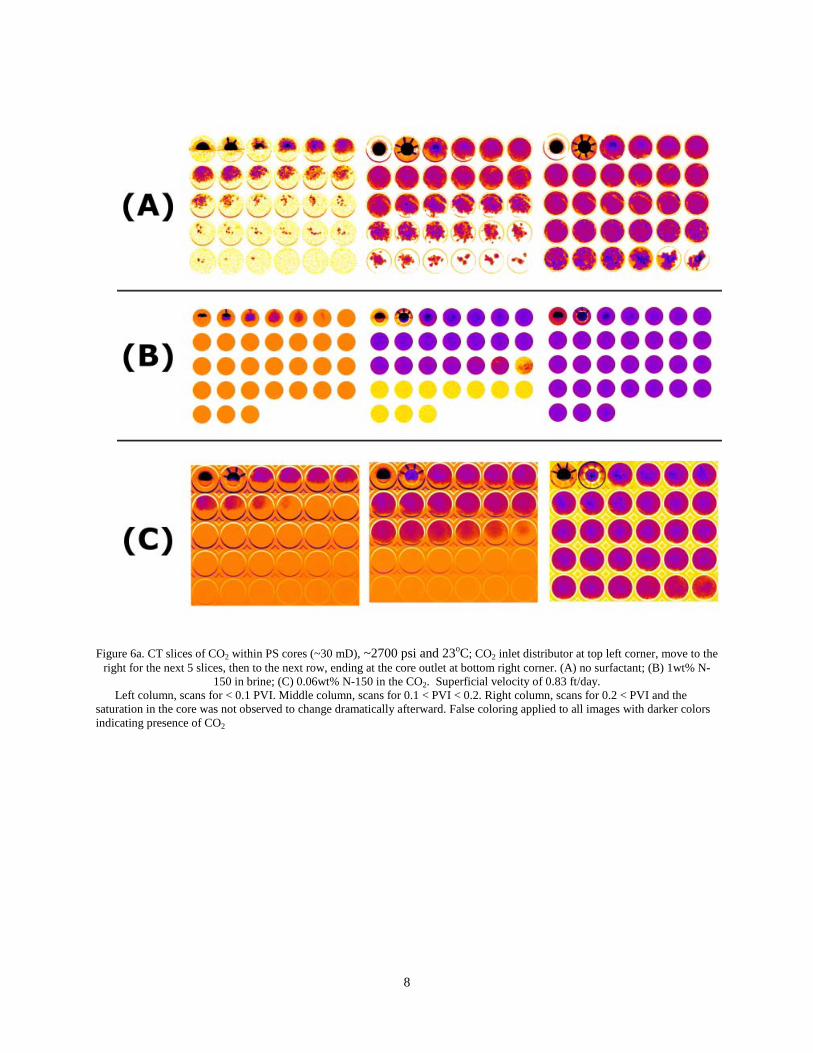
CT imaging was also conducted with qa branched nonylphenol ethoxylate (Xing et al. 2011). In these tests, high
pressure CO2 invaded a polystyrene (PS) core (~30 mD) initially saturated with 5wt% KI brine because KI has a
greater attenuation than NaCl (Wellington and Vinegar 1988), which created a greater contrast between brine and
CO2 in the scans. Further, the surfactant used in the CT imaging study was capable of stabilizing CO2-in-5wt% TDS
brine, whether the dissolved ion pair was NaCl or KI (Xing et al. 2011). The results indicated that despite the oil-
wet nature of this medium, a sharp foam front propagated through the core and CO2 fingers that formed in the
absence of a surfactant (row A, Figure 6) were completely suppressed by foams formed due to the addition of
0.06wt% N-150 to the CO2 (row C, Figure 6) or 1wt% N-150 to the brine (row B, Figure 6).
0
50
100
150
200
250
0 0.5 1 1.5
Pre
ssur
e dr
op (c
mH
2O)
Pore volumes of CO2 injected (PVI)
dry core, CO2 only CO2, brine
0.06% N150 in CO2, 0.06wt% N150 in brine
0.06% N150 in CO2, brine
CO2, 0.06wt% N150 in brine
8
Figure 6a. CT slices of CO2 within PS cores (~30 mD), ~2700 psi and 23oC; CO2 inlet distributor at top left corner, move to the right for the next 5 slices, then to the next row, ending at the core outlet at bottom right corner. (A) no surfactant; (B) 1wt% N-
150 in brine; (C) 0.06wt% N-150 in the CO2. Superficial velocity of 0.83 ft/day. Left column, scans for < 0.1 PVI. Middle column, scans for 0.1 < PVI < 0.2. Right column, scans for 0.2 < PVI and the
saturation in the core was not observed to change dramatically afterward. False coloring applied to all images with darker colors indicating presence of CO2

9
Figure 6b. Mean Coputed Tomography Number (CTN) along the length of the 6” PS core with CO2 and brine with the legend indicating the number of PV injected at the beginning of each scan. Lower CTN indicates lower brine saturation and higher CO2 saturation. (A) No surfactant (B) Surfactant dissolved in the brine (C) Surfactant dissolved in the injected CO2. In this study, additional transient mobility tests and CT imaging tests were conducted with the Huntsman
SURFONIC® N-120 and N-150 surfactants. A synthetic SACROC brine (6.6wt% NaCl, 1.2wt% CaCl2, 0.4wt% MgCl2)
was also used in some of the mobility tests.

10
3.0 EXPERIMENTAL
3.1 TRANSIENT MOBILITY (PRESSURE DROP) MEASUREMENTS; CO2 INVADING BRINE-SATURATED BEREA SANDSTONE.
Flow-through-porous medium apparatus, rated to 4000 psi (27.7 MPa), was used to collect the pressure drop data for
CO2 flowing through a dry core, and for neat CO2 or CO2/surfactant solutions flowing into an initially brine-
saturated or surfactant solution-saturated core at room temperature (~23oC). The core was wrapped in aluminum
foil and then placed within a Buna-N sleeve. The core and sleeve were then placed inside the Temco [Model
DCHR-1.0] core holder. Water was used as the overburden fluid to prevent annular flow of the fluids between the
core and the inner surface of the sleeve. The overburden water pressure was maintained at ~500 psi (~3.5 MPa)
above the CO2 pressure by using a manual water pump [High Pressure Equipment Company Model 62-6-10]. CO2
was initially pressurized to the desired pressure of ~2700 psia with a gas booster [Haskel Model AGD-75-C8],
filling the windowed stirred cell [104 cm3, Thar Technologies Model R100], the core within the holder, the separator
used to collect water that is displaced from the core, and the two coupled positive displacement pumps [Quizix, 270
cm3 per cylinder, Model C-6000-10K]. If surfactants were to be dissolved in the CO2, the surfactants were loaded
into the stirred cell prior to pressurization and mixed with CO2 with the magnetically coupled stirrer until the
solution was transparent.
During a mobility test, the first positive displacement pump was then engaged at a constant discharge
volumetric flow rate, which resulted in the displacement of neat CO2 from the pump into the continuously stirred
cell. For tests conducted with surfactant initially dissolved in the CO2 retained within the stirred cell, this resulted in
a small amount of dilution of the surfactant solution. For example, the pore volume of a Berea core (104 mD) was
only ~13 cm3 and the stirred cell volume was 104 cm3; therefore the injection of a pore volume of CO2 into the
stirred cell during the mobility test would reduce the surfactant concentration from 0.060wt% to 0.053wt%. The
CO2 or CO2/surfactant solution leaving the stirred cell flowed into the core. The core effluent was directed into the
separator [Swagelok, 300 cm3, Model 316L-50DF4-500] in which brine displaced from the core would accumulate.
The CO2 leaving the top of the separator was then received by the second positive displacement pump, which was
11
engaged at the same flow rate as the first pump but in the receiving mode. The CO2 pressure was measured using
the recycle pump analog transducers [Sensata Technologies] and the pressure transducers [Swagelok Model PTI-S-
AG400-12AV] and the pressure drop along the core sample was measured by a differential pressure transducer
[Validyne Model DP303-26]. The data acquisition was achieved using the Quizix and Validyne controllers and the
National Instruments LabVIEW software. The cores usedin the transient mobility tests include a water-wet Berea
sandstone (104 mD), a water-wet Bentheimer sandstone (1550 mD), and two mixed wettability SACROC carbonate
cores (8.9 mD and 3.6mD).
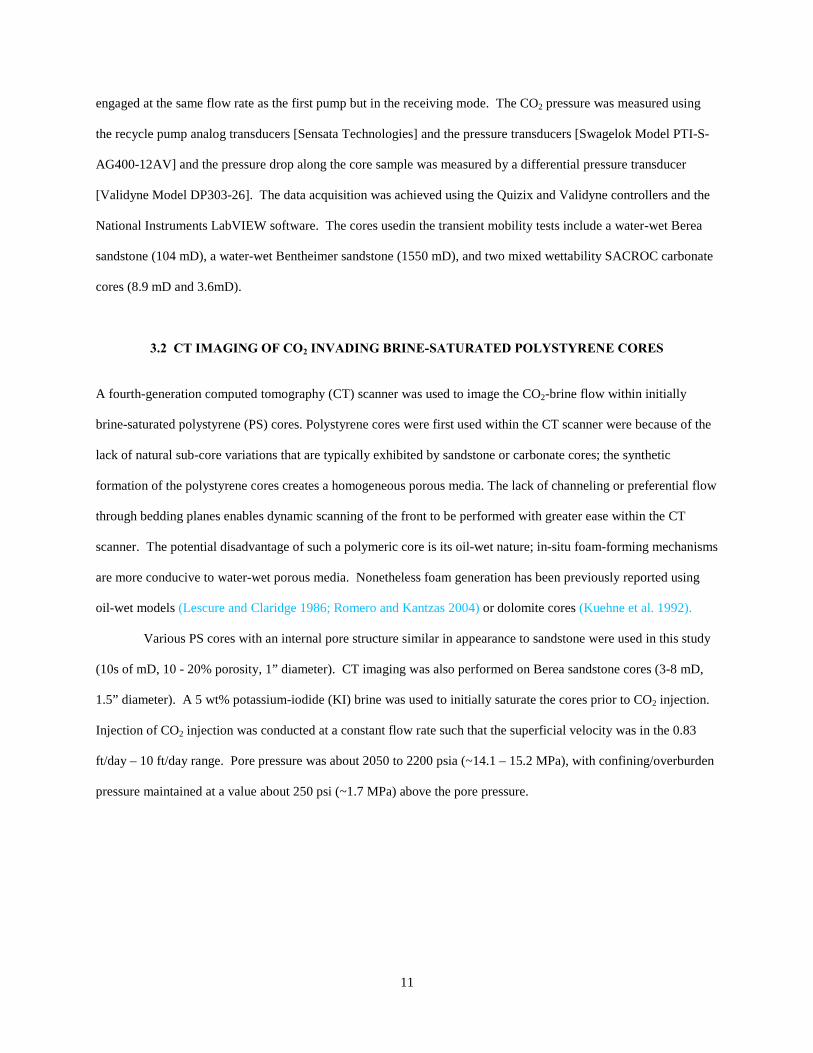
3.2 CT IMAGING OF CO2 INVADING BRINE-SATURATED POLYSTYRENE CORES
A fourth-generation computed tomography (CT) scanner was used to image the CO2-brine flow within initially
brine-saturated polystyrene (PS) cores. Polystyrene cores were first used within the CT scanner were because of the
lack of natural sub-core variations that are typically exhibited by sandstone or carbonate cores; the synthetic
formation of the polystyrene cores creates a homogeneous porous media. The lack of channeling or preferential flow
through bedding planes enables dynamic scanning of the front to be performed with greater ease within the CT
scanner. The potential disadvantage of such a polymeric core is its oil-wet nature; in-situ foam-forming mechanisms
are more conducive to water-wet porous media. Nonetheless foam generation has been previously reported using
oil-wet models (Lescure and Claridge 1986; Romero and Kantzas 2004) or dolomite cores (Kuehne et al. 1992).
Various PS cores with an internal pore structure similar in appearance to sandstone were used in this study
(10s of mD, 10 - 20% porosity, 1” diameter). CT imaging was also performed on Berea sandstone cores (3-8 mD,
1.5” diameter). A 5 wt% potassium-iodide (KI) brine was used to initially saturate the cores prior to CO2 injection.
Injection of CO2 injection was conducted at a constant flow rate such that the superficial velocity was in the 0.83
ft/day – 10 ft/day range. Pore pressure was about 2050 to 2200 psia (~14.1 – 15.2 MPa), with confining/overburden
pressure maintained at a value about 250 psi (~1.7 MPa) above the pore pressure.

12
4.0 RESULTS
4.1 TRANSIENT MOBILITY MEASUREMENTS
The pressure drop vs PVI profiles of the mobility tests conducted with a very high permeability (1500 mD)
Bentheimer sandstone at a high superficial velocity (10 ft/day) indicate that foams were generated within the core
whether the Huntsman SURFONIC N-120 surfactant was dissolved only in the CO2, only in the brine, or in both the
CO2 and the brine, Figure 7. The pressure drop across the core was roughly 2-3 times greater when surfactant was
present relative to the control test that employed no surfactant in the CO2 or the brine. This result, coupled with the
similar results for a ~100 mD Berea sandstone shown in Figure 6, indicte that CO2-soluble surfactants seem to be
capable of generatibng foams within relatively high permeability sandstone ( >100 mD) at a high superficial velocity
(10 ft/day).
Similar experiments were then conducted on a mixed wettability SACROC carbonate core (8.9 mD) at a
superficial velocity of 10 ft/day. The results for the control test (no surfactant) and the experiments involving a
0.08wt% solution of Huntsman SURFONIC® N-120 or N-150 dissolved in the CO2 are shown in Figure 8. The
increase in the pressure drop at equivalent PVI are more modest; a 20 – 50% increase in ΔP was observed when the
surfactant was dissolved in the CO2. When the surfactant was dissolved at 0.08wt% in the SACROC brine used to
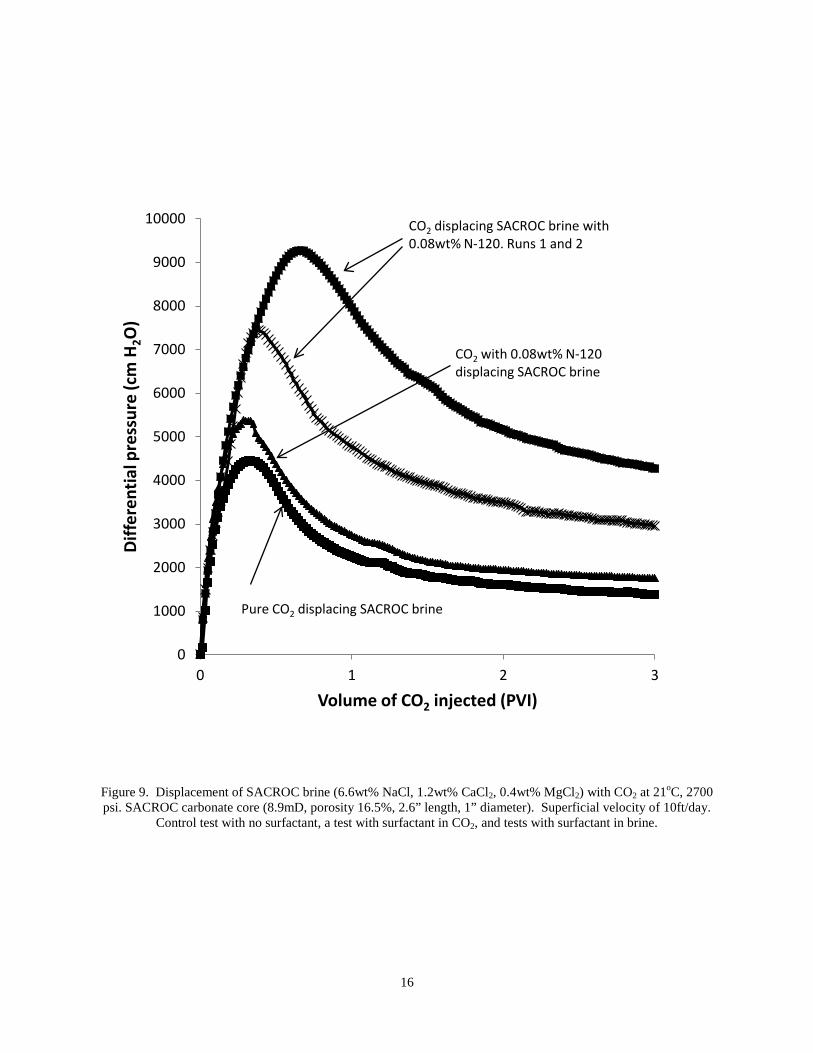
saturate the core, more substantial increases in pressure drop were observed, Figure 9. The pressure drop values
increased by a factor of 2-3 when the surfactant was dissolved in the brine.
When a lower permeability SACROC core was used (3.6 mD) in conjunction with the surfactant dissolved in
the CO2, modest increases in pressure drop (~15 – 50%) were observed at equivalent PVI relative to the results
obtained using no surfactant, Figure 10. (Tests with the surfactant dissolved in the brine that initially saturates this
3.6 mD core will be added to Figure 10 in the conference presentation).

13
Figures 7a. Displacement of brine, either 5wt% NaCl or SACROC brine, with CO2 at 21oC, 2700 psi. Bentheimer sandstone core (25% porosity, 1550 mD, 2.03” length, 1” diameter). CO2 injection rate 1mL/min, 10 ft/day.
0
10
20
30
40
50
60
0 0.5 1 1.5
Diff
eren
tial p
ress
ure
(cm
H2O
)
Volume of CO2 injected (pore volumes)
CO2 displacing 5wt% brine
CO2 with 0.08wt% N120 displacing 5wt% NaCl brine
CO2 displacing 5wt% NaCl brine containing 0.08wt% N120

14
Figures 7b. Displacement of brine, either 5wt% NaCl or SACROC brine, with CO2 at 21oC, 2700 psi. Bentheimer sandstone core (25% porosity, 1550 mD, 2.03” length, 1” diameter). CO2 injection rate 1mL/min, 10 ft/day.
0
10
20
30
40
50
60
0 0.5 1 1.5
Diff
eren
tial p
ress
ure
(cm
H2O
)
Volume of CO2 injected (pore volumes)
CO2 displacing 5wt% brine
CO2 with 0.08wt% N120 displacing SACROC brine
CO2 displacing SACROC brine containing 0.08wt% N120
CO2 with 0.08wt% N120 displacing SACROC brine containing 0.08wt% N120

15
Figure 8. Displacement of SACROC brine (6.6wt% NaCl, 1.2wt% CaCl2, 0.4wt% MgCl2) with CO2 at 21oC, 2700 psi. SACROC carbonate core (8.9mD, porosity 16.5%, 2.6” length, 1” diameter). Superficial velocity of 10 ft/day.
Control test with no surfactant, and tests with surfactant in CO2.
0
1000
2000
3000
4000
5000
6000
0 0.5 1 1.5 2 2.5
Diff
eren
tial
pre
ssur
e (c
m H
2O)
Volume of CO2 injected (PVI)
CO2 displacing SACROC brine
CO2 with 0.08wt% N120 displacing SACROC brine (Run 2)
CO2 with 0.08wt% N150 displacing SACROC brine
CO2 with 0.08wt% N120 displacing SACROC brine (Run 1)
16
Figure 9. Displacement of SACROC brine (6.6wt% NaCl, 1.2wt% CaCl2, 0.4wt% MgCl2) with CO2 at 21oC, 2700 psi. SACROC carbonate core (8.9mD, porosity 16.5%, 2.6” length, 1” diameter). Superficial velocity of 10ft/day.
Control test with no surfactant, a test with surfactant in CO2, and tests with surfactant in brine.
0
1000
2000
3000
4000
5000
6000
7000
8000
9000
10000
0 1 2 3
Diff
eren
tial
pre
ssur
e (c
m H
2O)
Volume of CO2 injected (PVI)
CO2 displacing SACROC brine with 0.08wt% N-120. Runs 1 and 2
CO2 with 0.08wt% N-120 displacing SACROC brine
Pure CO2 displacing SACROC brine

17
Figure 10. Displacement of 5wt% NaCl brine with CO2 at 21oC, 2700 psi. SACROC carbonate core (3.6mD, porosity 14% porosity, 2” length, 1” diameter). Superficial velocity of 10 ft/day. Control tests with no surfactant, and a test with surfactant in
CO2.
0
500
1000
1500
2000
2500
3000
3500
4000
0 1 2 3
Diff
eren
tial p
ress
ure
(cm
H2O
)
Volume of CO2 injected (PVI)
CO2 displacing 5wt NaCl% brine, Tests 1 and 2
Dry core, CO2 flow
0.08wt% N-120 in CO2, displacing 5wt NaCl % brine

18
4.2 CT IMAGING
The first set of CT tests (designated SS 103, 104 and 108) were relatively low flow rate tests (0.47 ft/day) conducted
with in Berea sandstone (3 - 5 mD) to assess the effects of no surfactant (SS 103, Figure 11), SURFONIC® N-150
dissolved only in the brine that initially saturated the core (SS 103, Figure 12), and SURFONIC® N-150 dissolved
only in the CO2 that is injected into the core (SS 108, Figure 13). The cross-sectional images of control test results
with no surfactant (SS 103, Figure 11) illustrate the preferential flow of CO2 through high permeability planes
within the core. The plot of mean CT number vs slice number/position down the length of the core shows a gradual
increase from a low CTN number (CO2-rich) to higher average CT number (brine-rich). No sharp transition is
evident from a CO2-rich region to a brine-rich region that would be characteristic of foam, and none was expected.
When the surfactant was dissolved in the brine (SS 104, Figure 12), however, the cross-sectional plots illustrate a
more uniform distribution of CO2 in the cross-section, especially near the core inlet. The mean CT number vs length
data display a relatively sharp increase from low values to high values. Both of these results indicate that foam was
generated at a relatively low flow rate when the surfactant was dissolved in the brine, and the foam was capable or
propagating through the core. When the surfactant was dissolved only in the CO2 (SS 108, Figure 13), however, the
results were comparable to the trends observed in the control experiment (SS 103, Figure 11), indicating that little if
any foam was generated in the Berea sandstone at a lower superficial velocity.
The second set of CT tests (designated SS 106, 113, 107, 112, 109) correspond to relatively high flow rate tests
(superficial velocity of 4.7 ft/day) in Berea sandstone (4 – 8 mD) with no surfactant (control, SS 106, Figure 14),
SURFONIC® N-120 in the brine (SS 113, Figure 15), SURFONIC® N-150 in the brine (SS 107, Figure 16),
SURFONIC® N-120 in the CO2 (SS 112, Figure 17), and SURFONIC® N-150 in the CO2 (SS 109, Figure 18). As
expected, the displacement with no surfactant present id characterized by the lack of a foam front and by the flow of
CO2 through the higher permeability bedding planes (Figure 14). Upon the addition of surfactant to the brine, foams
are generated in-situ, Figures 15 and 16. The foam formed with SURFONIC® N-150 present in the brine, Figure 16,
is particularly distinct as evidenced by a nearly step-like change in average CT number from low values that
correspond to the CO2-rich foam to high values that correspond to the brine, and by cross-sectional slices that

19
appear to be completely swept by the CO2 behind the front. When the surfactant was present only in the injected
CO2, foam-like fronts were also generated, especially near the core inlet, Figures 17 and 18. The foam-front was not
as distinct as that observed when the SURFONIC® N-150 present only in the brine, Figure 16. (No CT imaging
tests have yet been conducted with surfactant in both the brine and the CO2.). CT tests in Berea SS are summarized
in Table 1.
Table 1. Conditions for CT imaging displacements, 23 oC 2200 or 2300 psi, CO2 invading a 5wt% KI brine-saturated Berea sandstone core; *permeability values for all cores not measured, those cores were estimated to be ~
20% porous and ~5 mD
CT test
Surfact Phase surfact.
dissolved in
Surfact Conc Wt%
Injection rate
ml/min
Superficial velocity ft/day
Core Diam inches
Core length inches
Core perm mD
Core porosity
%
Core PV ml
SS 103
none - - 0.2 0.47 1.99 6.05 4.7 19.9 61.27
SS 104
N-150 brine 0.10 0.2 0.47 1.99 6.21 3.2 19.4 61.39
SS 108
N-150 CO2 0.06 0.2 0.47 1.99 6.13 3.0 19.8 61.41
SS 106
none - - 2.0 4.7 1.97 6.12 6.0 18.0 55.32
SS 113
N-120 brine 0.10 2.0 4.7 2.01 5.16 5* 20* 53.10
SS 107
N-150 brine 0.02 2.0 4.7 1.99 6.10 3.9 19.6 60.82
SS 112
N-120 CO2 0.06 2.0 4.7 1.99 6.13 7.6 19.8 60.88
SS 109
N-120 CO2 0.06 2.0 4.7 1.99 6.08 6.1 19.5 60.32

20
Figure 11. Low flow rate test (0.2 ml/min, 0.47 ft/day) in low permeability Berea sandstone (4.7 mD); control test with no surfactant and no foam; Above: plots of mean CT number for the cross-section vs position at at various PVI; low values are CO2-
rich, high values are brine-rich. Below: Montages of cross-sectional slices (left to right) correspond to 0 PVI (wet), 0.183 PVI, and 3.34 PVI; purple is CO2-rich. Inlet distributor at top left corner, move to the right for the next 5 slices, then to the next row,
ending at the core outlet at bottom right corner.

21
Figure 12. Low flow rate test (0.2 ml/min, 0.47 ft/day) in low permeability Berea sandstone (3.2 mD); surfactant N-150 in brine;
Above: plots of mean CT number for the cross-section vs position at at various PVI; low values are CO2-rich, high values are brine-rich. Below: Montages of cross-sectional slices (left to right) correspond to 0 PVI (wet), 0.060 PVI, and 1.30 PVI; purple is CO2-rich. Inlet distributor at top left corner, move to the right for the next 5 slices, then to the next row, ending at the core outlet
at bottom right corner.

22
Figure 13. Low flow rate test (0.2 ml/min, 0.47 ft/day) in low permeability Berea sandstone (3.0 mD); surfactant N-150 in CO2;
Above: plots of mean CT number for the cross-section vs position at at various PVI; low values are CO2-rich, high values are brine-rich. Below: Montages of cross-sectional slices (left to right) correspond to 0 PVI (wet), 0.060 PVI, and 1.30 PVI; purple is CO2-rich. Inlet distributor at top left corner, move to the right for the next 5 slices, then to the next row, ending at the core outlet
at bottom right corner.

23
Figure 14. High flow rate test (2.0 ml/min, 4.7 ft/day) in low permeability Berea sandstone (6.0 mD); control test with no surfactant and no foam; Above: plots of mean CT number for the cross-section vs position at at various PVI; low values are CO2-rich, high values are brine-rich. Below: Montages of cross-sectional slices (left to right) correspond to 0 PVI (wet), 0.25 PVI, and 8.9 PVI; purple is CO2-rich. Inlet distributor at top left corner, move to the right for the next 5 slices, then to the next row, ending
at the core outlet at bottom right corner.

24
Figure 15. High flow rate test (2.0 ml/min, 4.7 ft/day) in low permeability Berea sandstone (~5 mD); surfactant N-120 in brine; Above: plots of mean CT number for the cross-section vs position at at various PVI; low values are CO2-rich, high values are
brine-rich. Below: Montages of cross-sectional slices (left to right) correspond to 0 PVI (wet), 0.24 PVI, and 1.30 PVI; purple is CO2-rich. Inlet distributor at top left corner, move to the right for the next 5 slices, then to the next row, ending at the core outlet
at bottom right corner.

25
Figure 16. High flow rate test (2.0 ml/min, 4.7 ft/day) in low permeability Berea sandstone (3.9 mD); surfactant N-150 in brine; Above: plots of mean CT number for the cross-section vs position at at various PVI; low values are CO2-rich, high values are brine-rich. Below: Montages of cross-sectional slices (left to right) correspond to 0.07 PVI, 0.30 PVI, and 0.53 PVI; purple is
CO2-rich. Inlet distributor at top left corner, move to the right for the next 5 slices, then to the next row, ending at the core outlet at bottom right corner.

26
Figure 17. High flow rate test (2.0 ml/min, 4.7 ft/day) in low permeability Berea sandstone (7.6 mD); surfactant N-120 in CO2; Above: plots of mean CT number for the cross-section vs position at at various PVI; low values are CO2-rich, high values are
brine-rich. Below: Montages of cross-sectional slices (left to right) correspond to 0 PVI (wet), 0.10 PVI, and 3.45 PVI; purple is CO2-rich. Inlet distributor at top left corner, move to the right for the next 5 slices, then to the next row, ending at the core outlet
at bottom right corner.

27
Figure 18. High flow rate test (2.0 ml/min, 4.7 ft/day) in low permeability Berea sandstone (6.1 mD); surfactant N-120 in CO2; Above: plots of mean CT number for the cross-section vs position at at various PVI; low values are
CO2-rich, high values are brine-rich. Below: Montages of cross-sectional slices (left to right) correspond to 0 PVI (wet), 0.033 PVI, and 1.596 PVI; purple is CO2-rich. Inlet distributor at top left corner, move to the right for the next 5
slices, then to the next row, ending at the core outlet at bottom right corner.
28
5.0 CONCLUSIONS
Commercially available, water-soluble, slightly CO2-soluble nonionic surfactants capable of dissolving sufficiently
in dense CO2 to generate and stabilize CO2-in-brine foams have recently been identified. Our prior studies (Xing et
al. 2010; Xing et al. 2011) detailed the solubility of numerous non-ionics in CO2 and assessed their ability to
stabilize foams in a high pressure windowed vessel. The transient mobility tests and CT imaging analysis results of
this study have indicated that foams can also be generated in porous media when the CO2-surfactant solution flows
into a core initially saturated with brine. Two highly branched nonylphenol ethoxylates with an average of 12 or 15
ethylene oxide groups in the hydrophilic tail, Huntsman SURFONIC® N-120 and N-150, were selected for the study.
The mobility results for the water-wet, relatively high permeability sandstones (104 mD Berea, and 1550 mD
Bentheimer) at a superficial velocity of 10 ft/day indicated that foams were readily generated in-situ when the
surfactant was dissolved in the CO2, the brine, or both the CO2 and the brine. The pressure drop across the core
increased by roughly a factor of 2-3 during the injection of the first few pore volumes of CO2, and the magnitude of
the mobility decrease was comparable whether the surfactant was present in the CO2 or the brine. When mixed
wettability SACROC carbonate cores (3.6 and 8.9 mD) were used, however, the mobility decrease was more modest
relative to the control test with no surfactant when the surfactant was dissolved in the CO2, as evidenced by 20 – 50
% increases in pressure drop. Stronger foams (2 – 3-fold increases in pressure drop) were generated when the
surfactant was present in the brine phase in the only SACROC core tested under these conditions (8.9 mD).
CT imaging indicated the in-situ foam formation and propagation occurred at low flow rates (0.47 ft/day) in
Berea sandstone (4 – 8 mD) most readily if the surfactant is present in the brine. Foam formation was not apparent
when the surfactant was dissolved in the CO2. At higher flow rates (4.7 ft/day), however, foam formation and
propagation was observed whether the surfactant was dissolved in the CO2 or the brine.
These results indicate that commercially available, non-ionic, slightly CO2-soluble, water-soluble surfactants
appear to be promising chemicals for improving mobility control during CO2 floods. CO2-soluble surfactants
provide operators with the opportunity to inject the surfactant dissolved in the injected CO2, or (because they are

29
also water-soluble) dissolved in both in brine slugs and CO2 slugs, rather than relying solely on the alternating
injection of aqueous surfactant solutions and CO2 (SAG) to form conformance and/or mobility control foams.

30
BIBLIOGRAPHY Adkins, S.S; Chen, X.; Chan, I.; Torino, E.; Nguyen, Q.; Sanders, A.; Johnston, K.; Morphology and Stability of CO2-in-Water Foams with Nonionic Hydrocarbon Surfactants; Langmuir 2010; 26(8) 5335–5348 Bernard, G.; Holm, L.; Method for recovering oil from subterranean formations; U.S. Patent 3,342,256; issued Sept. 19, 1967 daRocha, S.; Psathus, P.; Klein, E.; Johnston, K.; Concentrated CO2 in Water Emulsions with Nonionic Polymeric Surfactants; Journal of Colloid and Interface Science 2001; (239) 241-253 Dhanuka, V.; Dickson, J.; Ryoo, W.; Johnston. K.; High internal phase CO2-in-water emulsions stabilized with a branched nonionic hydrocarbon surfactant; Journal of Colloid and Interface Science 2006; (298) 406-418 Enick, R.; Olsen, D.; Mobility and Conformance Control for Carbon Dioxide Enhanced Oil Recovery (CO2-EOR) via Thickeners, Foams, and Gels – A Detailed Literature Review of 40 Years of Research; DOE/NETL-2012/1540, Activity 4003.200.01, 2011 Fan, X.; Potluri, V.; McLeod, M.; Wang, Y.; Liu, J.; Enick, R. M.; Hamilton, A.; Roberts, C.; Johnson, J; Beckman, E.; Oxygenated Hydrocarbon Ionic Surfactants Exhibit CO2 Solubility; J. Am. Chem. Soc. 2005; 127(33)11754-11762 Farajzadeh, R.; Andrianov, A.; Zitha, P.L.J.; Foam Assisted Enhanced Oil Recovery at Miscible and Immiscible Conditions; presented at the 2009 SPE Kuwait International Petroleum Conference and Exhibition; held in Kuwait City, Kuwait, December 14-16, 2009; SPE-126410-MS; doi: 10.2118/126410-MS Irani, C.; Solubilizing surfactants in miscible drive solvents; U.S. Patent 4,828,029; issued May 9, 1989 Kuehne, D.L.; Frazier, R.H.; Cantor, J.; Horn Jr., W.: “Evaluation of Surfactants for CO2 Mobility Control in Dolomite Reservoirs,” SPE/DOE 24177, presented at the SPE/DOE Eighth Symposium on Enhanced Oil Recovery, held in Tulsa, Oklahoma, April 22-24, 1992. Le, V.; Nguyen, Q.; Sanders, A.; A novel foam concept with CO2 dissolved surfactants; presented at the 2008 SPE/DOE Improved Oil Recovery Symposium, Tulsa, OK, April 19-23, 2008; SPE-113370 Lescure, B.M.; Claridge, E.L.: “CO2 Foam Flooding Performance vs. Rock Wettability,” SPE 15445, presented at the SPE 61st
Annual Technical Conference and Exhibition, held in New Orleans, LA, October 5-8, 1986. Romero,L.; Kantzas, A.: “The Effect of Wettability and Pore Geometry on Foamed Gel Blockage Performance in Gas and Water Producing Zones,” SPE 89388, presented at the 2004 SPE/DOE Fourteenth Symposium on Improved Oil Recovery, held in Tulsa, OK, April 17-21, 2004. Ryoo, W.; Webber, S.; Johnston, K.; Water in Carbon Dioxide Microemulsions with Methylated Branched Hydrocarbon Surfactants; Ind. Eng. Chem. Res.2003; (42) 6348-6358 Sanders, A.; Nguyen, Q.; Nguyen. N.; Adkins, S.; Johnston, K.P.; Twin-tailed surfactants for creating CO2-in-water macroemulsions for sweep enhancement in CO2 EOR; presented at the Abu Dhabi International Petroleum Exhibition and Conference, held in Abu Dhabi, UAE, November 1-4, 2010; SPE-137689-MS; doi: 10.2118/137689-MS Sanders, A.; Successful Implementation of CO2 Foam for Conformance Control, Dow Oil & Gas, The 4th Annual Wyoming CO2 Conference, Casper, WY, June 29 and 30, 2010 (oral presentation only) Sanders A.; Jones, R.; Mann, T.; Patton, L.; Linroth, M.; Nguyen, Q.; Successful Implementation of CO2-Foam for Conformance Control; presentation and slides distributred at the 2010 CO2 Conference, Midland Texas, December 9-10, 2010.

31
Schievelbein, V.; Method of decreasing mobility of dense carbon dioxide in subterranean formations; U.S. Patent 5,033,547; issued July 23, 1991 Tan, B.; Cooper, A.; Functional Oligo (vinyl acetate) CO2-philes for Solubilization and Emulsification; JACS 2005; 127(25) 8938-8539 Torino, E.; Reverchon, E.; Johnston, K.P.; Carbon Dioxide/Water, Water/Carbon Dioxide Emulsions and Double Emulsions Stabilized With a Nonionic Biocompatible Surfactant; J. Colloid Interface Science 2010; (348) 469-478 Wellington, S.L.; Vinegar, H.J.; Surfactant-Induced Mobility Control for Carbon Dioxide Studied with Computerized Tomography; Surfactant-Based Mobility Control 1988; (17) 344-358; ACS Symposium Series 1988,(373)
Xing, D.; Wei, B.; McLendon, W.; Enick, R.; McNulty, S.; Trickett,K.; Mohamed, A.; Cummings, S.; Eastoe, J.; Rogers, S.; Crandall, D.; Tennant, B.; McLendon, T.; Romanov, V.; Soong, Y.; CO2-soluble, Non-ionic, Water-soluble Surfactants that Stabilize CO2-in-Brine Foams; paper SPE 129907 presented at the 2010 SPE Improved Oil Recovery Symposium held in Tulsa, Oklahoma, USA, 24–28 April 2010 Xing, D.; Wei, B.; McLendon, W.; Enick, R.; McNulty, S.; Trickett,K.; Mohamed, A.; Cummings, S.; Eastoe, J.; Rogers, S.; Crandall, D.; Tennant, B.; McLendon, T.; Romanov, V.; Soong, Y.; CO2-soluble, Non-ionic, Water-soluble Surfactants that Stabilize CO2-in-Brine Foams; revised paper SPE 129907 submitted to SPEJ 2011