Embed Size (px)
Citation preview

Metric Radio Emission Associated With X-rayPlasmoid EjectionsM. R. Kundu1, A. Nindos1;2, N. Vilmer3, K.{L. Klein3, K. Shibata4, M. Ohyama11 Astronomy Department, University of Maryland, College Park, MD 20742.3 Observatoire de Paris, Section de Meudon, DASOP, CNRS-UMR 8645, F-92195Meudon, France.4 Kwasan and Hida Observatories, Kyoto University, Yamashina, Kyoto 607-8417,Japan.AbstractIn this paper we report the �rst detection of metric/decimetric radio emis-sion associated with two soft X{ray plasmoid ejecta events that occurred dur-ing two limb ares observed by the Yohkoh SXT. In the �rst event a loopstarted to rise slowly (� 10 km/sec) before the beginning of the hard X{rayimpulsive phase of the are. At about the onset of the impulsive are, therewas acceleration of the ejecta, resulting in a speed of 130 km/sec and �nally to� 200 km/sec. The associated radio emission was observed with the Nan�cayradioheliograph (NRH) in the frequency range of 230{450 MHz. It was an un-polarized continuum that lasted 8{10 min. The 410 MHz source was locatedclose to the height where the plasmoid was last identi�ed in the SXT images.In the second event an eruption resulted in the expansion of a large{scaleloop{like feature and the development of two plasmoid ejecta which moved indi�erent directions. The speed of the ejecta was 60{100 km/sec. In this event,the associated radio emission was a long{lasting (about 2 hours) continuumobserved from 450 to 164 MHz. The onset of the low frequency emission wasdelayed with respect to the onset of the high frequency emission. In bothcases the radio sources were located above the soft X-ray ejecta in the generaldirection of the prolongation of the ejecta movement. In both cases the radioemission is attributed to the radiation of non thermal electrons acceleratedin close relationship with the propagation of the X-ray plasmoid. We discusspossible scenarios and we indicate that magnetic reconnection which leads tothe production of the soft X{ray plasmoid ejecta may also provide the stagefor the acceleration of these electrons.1 IntroductionThe discovery of compact impulsive hard X-ray sources above the soft X-ray aringloops in some impulsive limb ares (Masuda 1994; Masuda et al. 1995) led tothe revival of the reconnection model of solar ares. Speci�cally, it is possible to2Current address: Section of Astrogeophysics, Physics Department, University of Ioannina,Ioannina, GR-45110, Greece. 1

interpret the above{the{loop{top hard X{ray source as due to magnetic reconnectionoccuring above the soft X{ray loop. Such magnetic reconnection process responsiblefor solar ares is intrinsic to some are models such as the Carmichael{Sturrock{Hirayama{Kopp{Pneuman (CSHKP) model of ares (Carmichael 1964; Sturrock1966; Hirayama 1974; Kopp & Pneuman 1976) which can account for the post{ are loop prominence systems, X{ray arcades as well as the creation of cusp{shapedmagnetic structures. A consequence of impulsive ares resulting from magneticreconnection process as in CSHKP model is that one expects a plasmoid ejection totake place above the soft X{ray aring loop. It turns out that such plasmoid ejectahave been found (Shibata et al. 1995) in all eight of Masuda's compact impulsivelimb ares; the ejecta had apparent velocities of 50{400 km/sec. This �nding ledShibata et al. (1995) to suggest that impulsive ares occur through a magneticreconnection process, for example as proposed in CSHKP model.As a follow up of this suggestion, Ohyama & Shibata (1997,1998) studied severalplasmoid ejection events and derived their physical parameters. They found thatthe acceleration of the ejected loop occurs just before or at about the onset of theimpulsive phase of the are. The temperature, mass and apparent velocity of theejected material are 6{14 MK, 2� 4� 1013 gr and 200{500 km/sec respectively; thekinetic energy is smaller than its thermal energy, which also is smaller than thatof the aring loop. It will clearly be of interest to �nd if this acceleration processresults in the production of nonthermal energetic electrons which may be responsiblefor radio burst emission. Since the height of X{ray plasmoid ejecta may reach valuesas large as 2 � 5 � 105 km high in the corona, it is logical to look for radio burstemission in the meter wavelength domain.The environment of the soft X{ray plasmoid ejections is quite di�erent fromthe environments investigated in other studies of the relationship between soft X{ray moving features and their associated radio emission. For example, Kundu etal. (1994, 1995a, 1995b) and Raulin et al. (1996a, 1996b) studied metric typeIII emission produced by beams of electrons associated with soft X{ray jets and aring X{ray bright points. On the other hand, Gopalswamy et al. (1997) studieda plasmoid which was produced after a soft X{ray eruption. Gopalswamy et al.(1997) speculated that a possible moving type IV burst was located in the vicinityof the X{ray plasmoid. Klein et al. (1999) studied a rapidly expanding or disruptingsoft X{ray stucture which produced a plasma blob similar to the plasmoid ejecta ofthe 1993 November 11 event. The speed of that ejected blob was high (about 770km/sec) and the shock waves that were produced were detected in type II metricemission.The best radio telescope for such observations is the Nan�cay (France) metricradioheliograph which operates at 5 frequencies: 164, 236.6 (henceforth referred toas 237 MHz), 327, 410 and 435 MHz. For the time period of observations of theplasmoid ejections reported by Ohyama & Shibata (1997,1998), the Nan�cay radiohe-liograph (NRH; The Radioheliograph Group 1993) operated as two one{dimensionalarrays, East{West and North{South. Its spatial resolution is frequency{dependent;2

it also varies as a function of time in course of the year. In general, its spatial reso-lution ranges from approximately 10 to several minutes of arc. Among the di�erentplasmoid ejections studied by Ohyama & Shibata (1997,1998), only two of themcorresponded to time periods when the Nan�cay (France) metric radioheliograph wasoperating: (1) 1993 November 11, (2) 1993 February 17.2 The 1993 November 11 eventThe X{ray plasmoid ejection was associated with a are which occurred near theeastern limb. The event was observed by Yohkoh soft X{ray telescope (SXT).Ohyama & Shibata (1997) studied the physical conditions and morphological evo-lution of the ejecta and are. Their Fig. 2 shows the evolution of the event asit appears in SXT images. They found that a loop which formed near the main aring loop between 10:55:49 and 11:04:21 UT, started to rise slowly at about 11:05UT. The upward motion started after its footpoint brightened. Our �gure 1 showsthe height of the ejecta as a function of time and also the soft X{ray light curve(from GOES satellite) and the hard X{ray light curves from the L (14{23 keV)and M1 (23{33 keV) channels of the HXT (Hard X{ray Telescope) instrument onboard Yohkoh. Fig. 1 shows that the loop started to rise slowly (at � 10 km/sec,the \pre are slow rise") long before the hard X{ray impulsive phase of the are. Atabout 11:15 UT, it suddenly accelerated to � 130 km/sec just before or at about theonset of the impulsive phase (the \main rise"). After a couple of minutes it reacheda velocity of 200 km/sec. The motion of the plasmoid ejecta could be followed inSXT partial frame images (PFIs) until about 11:26 UT, although with decreasedintensity. At the same time the main aring loop also started to rise with a speedof about 8{10 km/sec. Its intensity increased until 11:26 UT. That loop could befollowed in PFIs until about 11:30 UT and its projected height was always an orderof magnitude smaller than the projected height of the ejecta.Ohyama & Shibata (1997) computed the plasma parameters of the ejected ma-terial. They found that it was already heated to 11:3�4 MK before the \main rise".The electron density of the ejecta (4:5� 109� 1:4� 1010 cm�3) was larger than thetypical density of the active region corona. The mass of the ejecta was about 1014gr. Ohyama & Shibata (1997) suggested that magnetic reconnection may alreadybe occurring in the pre are phase, leading to heating of the ejected material andcausing chromospheric evaporation.The 23{33 keV hard X{ray time pro�le of Fig. 1 shows an impulsive burstbetween 11:15 and 11:19 UT, with a maximum at 11:17:40 UT. Microwave emissionfrom 950 MHz to 9 GHz was reported in Solar Geophysical Data Reports (597-II)during the same time interval, but no counterpart was detected by the NRH, i.e. atfrequencies below 432 MHz. Hard X{ray and microwave emission, which re ect thepresence of energetic electrons in the low corona, occur at the time the soft X-rayplasmoid is observed to accelerate its ascent (see �gure 1). While at energies above3

23 keV the count rates fall to background after 11:19 UT, a gradual rise occurs inthe 14{23 keV channel, together with the plasmoid's ascent to greater altitude. Thesoft X-ray ux continues to rise after the end of the hard X-ray burst above 23 keV,albeit more slowly than before. The soft X-ray ux would be expected to decay afterthe hard X-ray burst in the light of earlier studies involving hard X-rays �25 keV(Dennis and Zarro 1993). The slower rise observed in the present case is due to thesuperposition of a new episode of energy release, with a signature at h� < 23 keV,on the decay of the impulsive soft X-ray emission. This new episode is associatedwith decimetric emission in a well de�ned frequency range �230{450 MHz (see Fig.1, top panel for the 410 MHz NRH emission). Tremsdorf Observatory data indicatethat there was no counterpart at 640 MHz. Hence the radio emission had a highfrequency cuto� between 432 and 640 MHz. The brightest radio emission occursbetween 11:27 and 11:28 UT, during the decay of the 14{23 keV X-rays and close tothe maximum of the soft X-ray GOES ux. In the frequency range between 230 and450 MHz, the radio emission evolution from its onset to the time of maximum wassimilar at each frequency. But the lower frequency emission decayed more slowly.Analysis of the NRH data at 237 and 410 MHz with 0.2 s time resolution shows nosigni�cant �ne structure on time scales shorter than 10 s during the radio emissionenhancement. The similar behavior over a band of 200 MHz and the absence of�ne structure show that the emission, including the brightening between 11:27 and11:28 UT, is a continuum. Its clear cuto� towards lower frequencies suggests thatthe emission is coming from a well con�ned nonthermal electron population, whileits roughly simultaneous onset with the second 14-23 keV hard X{ray peak mayindicate a common source of energetic electrons. No signi�cant circular polarizationwas observed by the NRH at any frequency.For the computation of the heliographic positions of the radio sources from theone-dimensional NRH scans, a pre-event scan was subtracted from the are datain order to better reveal the faint radio source. This was especially necessary forthe observations with the north-south array, where the source under study wasdi�cult to see due to the quiet Sun background emission at higher frequencies andthe presence of a noise storm above the western limb at lower frequencies. Thenthe centroid positions and half widths of the radio sources were extracted from theone-dimensional scans by gaussian �ts. The centroid position of the noise stormwas scanned at 164 MHz between 11:00 and 11:30 UT to detect ionospheric gravitywaves. We applied a correction of 0:8� (164 MHz)2f2 arcmin to the east-west positionsat 11:27 UT, where f is the observing frequency. The north-south positions werenot signi�cantly perturbed during the time interval of interest. The corrected one-dimensional centroid positions and half widths were used for the computation ofthe heliographic positions of the radio sources. During the whole event the radiosource size (full width at half maximum of the gaussian) was more than twice thebeam dimension. This may be due to unresolved internal structure. The width ofthe crosses in Figure 2 is hence a measure of the extent of the sources, not of theantenna beam. 4

11:00 11:10 11:20 11:30-24
-26
-28
-30
-32
-34
Cha
nnel
NRH 237 MHz11:10 11:20 11:30
-45
-50
-55
Cha
nnel
W
NRH 410 MHz
Figure 1: The time evolution of the 1993 November 11 event. Top panel: Grey{scale representation of the one{dimensional brightness distribution as a function oftime and position observed at 410 MHz near the eastern solar limb by the NRH.The vertical axis denotes distance from disk center (located in channel 0) along theterrestrial east-west direction (east is up). Integration time is 10 s. Second panel:The height of the plasmoid ejecta as a function of time. Squares, triangles anddiamonds indicate data taken with full, half and quarter resolution, respectively(from Ohyama & Shibata 1997). Third panel: the soft X{ray ux time pro�le (fromGOES satellite). The other two panels show the time pro�les of the hard X{rayemission observed with the HXT in the energy ranges of 14{23 keV and 23{33 keV.5

The radio sources at all NRH frequencies are located above the eastern solarlimb. The location of the radio sources observed between 435 and 327 MHz is in thegeneral direction of the prolongation of the ejecta movement. The centroid positionsand half widths of the radio sources at the time of brightest emission (� 11:27:30 UT)are plotted in Figure 2 on the SXT partial frame image taken at 11:18:19 UT. Thatimage was the most suitable image to show the ejected plasmoid. The 237 MHzsource is broader, presumably due to confusion in the north-south images with thenoise storm above the western limb. Confusion with the noise storm source probablyalso shifts the centroid of the 237 MHz source southward, as seen in Figure 2. Thereis no signi�cant di�erence of the source heights at 435, 410, and 327 MHz. The237 MHz source seems to lie somewhat higher, but its intrinsic complexity suggeststhat its centroid position shown in Fig. 2 may be too uncertain to be used for thestudy of the dispersion of the source positions with frequency. The 410 MHz sourceis about 1:6�105 km above the photosphere, close to the height where the plasmoidis last identi�ed in the SXT observations (Figure 1). The timing of the continuumemission as well as the location of the 410 MHz source suggest a strong relationshipbetween the X-ray ejecta and the appearance of the radio emission, since the radioemission occurs at about the time when the X-ray structure reaches the height ofthe radio sources.3 The 1993 February 17 eventThe second event that we studied was associated with a are that occurred close tothe west limb. This event was presented by Shibata et al. (1994). The soft X{raymorphology of the event is presented in Fig. 3 while the time pro�les of the softX{ray and hard X{ray emission as well as the height of the ejecta as a functionof time and the associated radio emission are shown in Fig. 4. The top left panelof Fig. 3 shows a loop{like feature in the west{central part of the image. Its sizewas about 4� 104 km and it erupted after 10:35:22 UT. The eruption lasted untilabout 10:46 UT. The resulting expanding loop (labeled \L" in Fig. 3 and \Loop"in Fig. 4) initially seems to have an X{type or cusp{like structure. The expansionvelocity was about 60{70 km/sec. At 10:38:22 UT, material is seen to erupt fromthe northwestern edge of the expanding loop{like feature. This ejecta is labeled \F"in Fig. 3 and \Front" in Fig. 4 and its velocity was about 100 km/sec. A secondaryejection feature occurred after 10:39 UT just above the main soft X{ray loop. Thisejecta is labeled \B" in Fig. 3 and \Blob" in Fig. 4. The blob could be followeduntil about 10:46 UT and its velocity was about 70 km/sec. The size of the blobwas about 104 km. The event was also observed in hard X{rays with the HXT (seeFig. 4). The 23{33 keV HXT observations show that the burst starts at about10:35 UT, approximately at the time when the soft X{ray eruption started. The23{33 keV hard X{ray emission has a maximum at about 10:36 UT and then decayssmoothly until about 10:45 UT. At lower photon energies (14-23 keV) the initial6
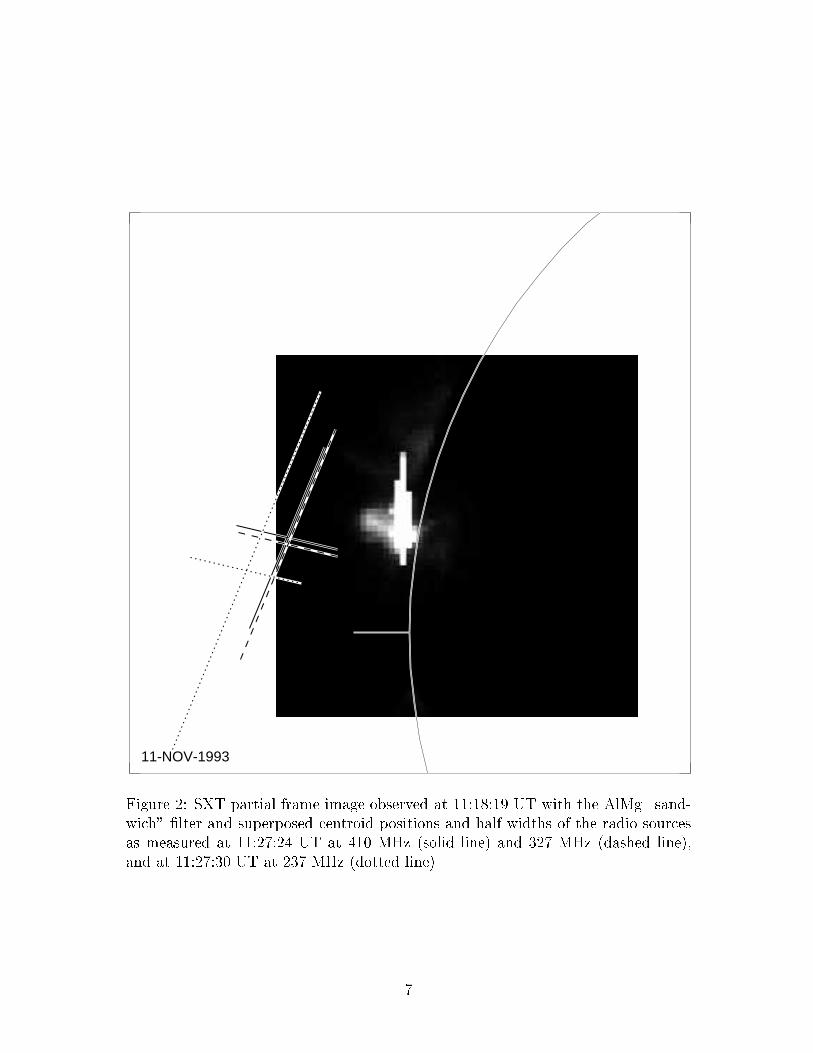
11-NOV-1993Figure 2: SXT partial frame image observed at 11:18:19 UT with the AlMg \sand-wich" �lter and superposed centroid positions and half widths of the radio sourcesas measured at 11:27:24 UT at 410 MHz (solid line) and 327 MHz (dashed line),and at 11:27:30 UT at 237 MHz (dotted line).7

Figure 3: SXT partial{frame images which show the 1993 February 17 ejecta. Northis up and West to the right.decay is followed by a nearly constant count rate level from 10:40 to 10:45 UT, afterwhich the emission decays until about 10:55 UT. Enhanced microwave emission isreported during the same time interval as the hard X-ray burst.The time evolution of the radio emission at 237 and 410 MHz is displayed in thegrey-scale plots of Fig. 4 and in the ux density time pro�les of Fig. 5. The emissionconsists of a long{lasting broadband continuum (\storm continuum" or \stationarytype IV burst") and superposed bursts near the western edge of the NRH �eld ofview. The total duration of the radio emission was about 2 hours. A group oftype III/U bursts at 10:40 UT (Artemis spectrograph, Space Res. Dept. of ParisObservatory, courtesy of M.Poqu�erusse) occurred near central meridian, and wasprobably not related to the X-ray ejecta at the western limb. The continuum, notmuch brighter than the quiet Sun, consists of components with di�erent temporalevolution (Fig. 4). At all frequencies the emission spreads westward (downwardin the grey-scale plots) in the course of the event due to the brightening of a newsource. The decimetric and metric radio emission starts only in the decay phase ofthe impulsive X-ray burst. Its onset is accompanied by a new rise of the soft X-ray8

NRH 237 MHzNRH 410 MHz
Figure 4: Same as in Fig. 1 for the 1993 February 17 event. The only exceptionis that we present the radio emission at two frequencies: 237 MHz and 410 MHz.In the panels that show the radio emission, the vertical axes represent the distancefrom disk center along the terrestrial east-west direction (east is up). The length ofthe vertical axis is about 140 at each frequency. Integration time is 10 s. The centerof the solar disk is in channel 0. Only the western limb is shown.9

10:40 11:00 11:20 Universal time (17-Feb-93)
Rel
ativ
e flu
x de
nsity
(lin
ear
scal
e)
410 MHz
327 MHz
237 MHz
164 MHz
GOES0.05-0.4 nm
Figure 5: Flux density of the decimetric and metric radio emission in the region ofthe storm continuum sources (integration time: 10 s) and of the soft X-ray emission(integration time: 3 s). The soft X-ray time histories represent the ux (dashed line)and its time derivative (solid line) computed after smoothing over 15 points. At 237MHz the solid line represents the lower source (i.e. the eastern source in the greyscale plot of Fig. 4) and the dotted line shows the higher source. The backgroundshading distinguishes di�erent intervals during the event as discussed in the text.10

ux (see the GOES plots of �gs. 4, 5).The NRH data showed no evidence for perturbations of the radio source positionsby ionospheric gravity waves during the event. We extracted the one{dimensionalsource centroid positions and half widths by �tting a gaussian or the sum of agaussian and a straight line to the one{dimensional NRH data. In the scans madewith the north-south array of the NRH, the weak continuum emission is di�cult toseparate from the quiet Sun. An average one-dimensional scan computed between10:30 and 10:38 UT was subtracted in order to better reveal the continuum source.The sizes of the extracted sources (at half maximum) are typically three times thebeam width of the arrays. The positions of the radio sources with respect to thesoft X{ray ejecta are shown in Fig. 6.The ux density time history (Fig. 5) shows a sequence of events during whichthe storm continuum extends stepwise to successively lower frequencies. The di�er-ent time intervals are marked by di�erent background shadings in Fig. 5:� The earliest emission occurs at decimetric waves from about 10:37 to 10:50 UT.Fig. 6 (top left panel) shows that the location of the 410 and 327 MHz sourcesis just above the ejecta. The sources are aligned in the direction of the soft X{ray ejecta and show a dispersion of source heights that is typical of the plasmaemission process for storm continuum radiation. The radiation is unpolarizedat 410 and 327 MHz. The only low-frequency counterpart is a partially right-hand polarized short burst at 237 MHz from a high coronal source (dashed-dotted cross).� In a second step (�10:50 - 11 UT, Fig. 5) the storm continuum makes a morepronounced rise at 327 MHz, and starts at 237 MHz. The sources at 410, 327,and 237 MHz form a compact con�guration (Fig.6 , top right panel).� Near 11:00 new rises in emission occur from 410 to 237 MHz. The dispersionof the source centroid positions tends to decrease from 10:44 to 11:12 UT. Thissuggests that the radio emission comes from a structure which is directed outof the plane of the sky such that di�erent radio sources at di�erent frequencieseventually have similar plane-of-the-sky positions. The strong 164 MHz burstsbetween �11:13 and 11:17 belong to a type III group according to Artemisspectrograph data. They come from a high coronal source far south of thestorm continuum complex (Fig. 6, middle left panel, dotted cross). Lessintense type III bursts occurred at a similar position earlier (near 10:57 UT:Fig. 5).� At 164 MHz the storm continuum emission starts around 11:20 UT. The onsetis masked in the time pro�les (Fig. 5) by the type III bursts. The ux densityat 327 MHz and higher frequencies, which was decreasing at the end of theprevious period, shows bursts superposed on a roughly constant background.This is also the case for the 237 MHz source seen previously. However, a new11

10:44 UT 10:56 UT11:12 UT 11:36 UT11:52 UT 12:20 UTFigure 6: Centroid positions and half widths of radio sources during the 1993February 17 event superposed on the Yohkoh-SXT partial frame image obtainedat 10:42:52 UT with the AlMg �lter. This is the SXT image where the expandingcoronal structures are best seen. Centroid positions and half widths of radio sourcesare plotted as solid (410 MHz), dashed (327 MHz), dashed-dotted (237 MHz) anddotted lines (164 MHz). The time labels indicate the middle of the 4{minute inter-vals used for the determination of the radio source parameters.12

237 MHz source brightens (dashed line in �gure 5); the evolution of this newsource is similar to the evolution of the 164 MHz source. The westward spreadof the 237 MHz emission in the grey scale plots of Fig. 4 re ects in fact thepresence of the new source. Fig. 6 (middle right panel) shows that at 11:36UT, the 164 MHz source is located above the others and the 237 MHz sourceappears broader than before in the east{west array scans due to the rise ofthe new emission. The two 237 MHz sources can be distinguished later on inthe east-west scans, but form a single broad source in the north-south scans.At 11:52 UT (Fig. 6, bottom left panel) there is a group of sources from410 to 237 MHz just above the expanding soft X-ray structures and anothergroup (237 and 164 MHz) at greater projected height. The latter sources areabout 10% right-hand circularly polarized. The two groups of sources may beassociated with emission from two magnetic ux tubes which have di�erentorientations with respect to the observer. The con�guration is similar duringthe decay of the continuum (e.g. Fig.6, bottom right panel). Now the 410 MHzsource can no longer be reliably distinguished from the quiet Sun in the north-south scans of the NRH.Comparison of the radio time histories with the derivative of the soft X-ray uxin Fig. 5 suggests some relationship between the stepwise evolution of the stormcontinuum and the temporal evolution of energy release to the soft X-ray plasma.While the �rst decimetric signatures of the continuum coincide with a post-impulsivesoft X-ray brightening as indicated by the second peak in the derivative, the changesat 10:50 and 11:00 UT occur together with changes in the slope of the decaying softX-ray ux.4 DiscussionIn both events that we studied, the plasmoid ejecta were associated with met-ric/decimetric emission. In this range the radio emission started signi�cantly af-ter the impulsive hard X-ray and microwave bursts. It was accompanied either bydistinct rises of the soft X-ray emission or by changing slopes in its time history,suggesting new energy releases.In the two cases studied here, the radio sources are located above the soft X{rayejecta in the general direction of the prolongation of the ejecta movement. We sug-gest that the radio emission comes from plasma emissions of non-thermal electronsproduced in connection with the propagation of the plasmoid. Plasma emission isindeed the natural explanation of the frequency dispersion of source heights on 1993February 17. Frequency dispersion of source heights is less pronounced for the 1993November 11 event. However, the average density at the easternmost edge of theplasmoid derived from the analysis by the �lter ratio technique (Hara et al. 1992)of SXT images obtained in the Al.1{�lter at 11:25:57 UT and in the Be119{�lterat 11:26:29 UT is 2:5 � 109 cm�3 in good consistency with the ambient electron13

density required for fundamental plasma emission at 410 MHz, thus supporting thesuggestion that the radio emission arises from plasma emission of electrons producedby the propagating plasmoid. To obtain this density estimate, we extrapolated theBe images linearly to the time of the Al.1 image. The resulting emission measuresare then converted to densities assuming the �lling factor to be unity and a range ofthickness at each location comparable with the apparent width of the plasmoid. Thecomputation of the emission measures are performed using a Fe/H abundance in thecorona which is 4 times larger than the photospheric value (White et al. 2000).As stated above, we thus need energetic electrons of several tens of keV to pro-duce the continuum radiation and therefore we must have some means of acceleratingelectrons to energies in excess of 10 keV. The observations at long decimetric/metricwavelengths show that this electron acceleration and injection to increasing coronalheights is linked in the present cases to the propagation of the plasmoid.The plasmoid associated events studied here, as well as another one analyzed byKliem et al. (2000), appear to occur in an initially well con�ned structure. Theprominent features in the SXT images are too dense (� 4 � 109 cm�3 at the time ofthe impulsive hard X-ray emission) for the propagation of radio waves at frequenciesbelow about 600 MHz. The clear low-frequency cuto� of the microwave spectrumshows conversely that electrons accelerated during the impulsive phase are onlyinjected into dense structures in the low corona. Radio emission at long decimetricand metric wavelengths is the signature of distinct later episodes of energy conversionthat appears to occur at greater heights than the impulsive energy release and seemsto be associated with the propagation of the plasmoid.This late coronal energy release is extended in time. This is shown by theassociation of the metric/decimetric radio emission with the gradual production of14-23 keV hard X-rays on 11 November 1993 and by the long duration of the stormcontinuum on 17 February 1993. As the lifetime of electrons of 10 keV to some tens ofkeV which likely generate this emission is a few tens of seconds or less (cf. Raulin andKlein 1994, Klein 1998) in the low corona, radiating electrons must be continuouslyproduced during the time extended coronal energy release. However, as suggested bythe observations of 17 February 1993, the delayed acceleration itself may consist ofseveral distinct episodes. The radio emission proceeds indeed in successive steps of 10{ 20 minute duration, each of them extending to lower frequencies than the precedingone, and this evolution is associated with di�erent behaviors of the slope of the softX-ray time pro�le. The last of these episodes, when the storm continuum appearsat 164 MHz, shows the emissions at 237MHz and 164 MHz in a distinct coronalstructure while emissions at 410 MHz, 327 MHz, and also 237 MHz are still producedin the structure which was radiating earlier. The extension of the emission towardslower frequencies proceeds as if the accelerators acting during successive intervalswere able to inject particles into a growing range of magnetic structures, startingwith relatively compact loops in the low active region corona and extending to loopswhich lie successively farther out. This is physically di�erent from e.g. a type IIburst, whose frequency drift is ascribed to a shock wave propagating through regions14

of decreasing ambient density. We note that the microwave spectra of the plasmoid-associated event of 5 October 1992 show similar evidence of a stepwise progressiontowards lower frequencies already during the impulsive phase (Figure 1 of Kliemet al. 2000), in general coincidence with distinct episodes of electron accelerationseen in hard X-rays. For the two events studied here, the close relationship betweenthe time and location of the long decimetric radio source and the position of theplasmoid at the time of the �rst appearance of the radio source strongly suggeststhat a possible injection of energetic electrons in a range of magnetic structuresmay be associated with the propagation of the plasmoid. This may be due eitherto the successive opening of or access to previously closed magnetic �elds abovethe active region in the course of the plasmoid's ascent or to its interaction on itsway outwards with increasingly larger scale magnetic �eld lines creating new coronalsites of nonthermal electron production.There are however di�erences in the behaviour of the radio emission at long deci-metric and metric wavelengths during the three plasmoid-associated events studiedso far: - no emission at all below 600 MHz (5 October 1992; Kliem et al. 2000;Aurass, pers. comm. 2000), - delayed emission lasting �10 min (11 November1993) and 2 hrs (17 February 1993) (present study). One may speculate that thethree events refer to a range of physical environments at great altitude, each withdi�erent ability to accelerate electrons. We note also that the moving soft X-raystructures (plasmoids and loops) are fastest (�500 km s�1) for the metric/decimetricradio-silent event of 5 October 1992, and slowest (�100 km s�1) for the long-durationevent of 17 February 1993. This is further evidence that the acceleration process isnot directly related with the macroscopic speed of the plasma structures, e.g. it isnot due to the propagation of a large-scale shock wave. Regarding the two eventsstudied here, the comparison of the soft X-ray behaviour gives some clues to un-derstanding the di�erence seen at radio wavelengths (total duration and temporalevolution) as well as some good arguments for the speculation that the di�erent be-haviours of reported plasmoid associated events may be due to the di�erent physicalenvironments. The total duration of the soft X-ray are is only about 1.5 hours forthe 1993 November 11 event, but more than 4.5 hours on 1993 February 17. Onlyone ejecta is observed in the 1993 November 11 event while in the 1993 February17 event there is a large{scale expanding loop{like feature and two separate ejecta(named \front" and \blob" in section 3) moving in di�erent directions, as well as asystem of post- are loops that are observed at increasing heights from 11:57 to 12:23UT. The observations hence suggest that prolonged coronal electron acceleration isassociated with prolonged plasma heating and that both processes may be associ-ated with the ambient magnetic structure. Indeed, the observations on previousdays of SXR connections between the aring active region of the 1993 February 17event and neighbouring active regions suggest the presence of large scale loops inconnection with this event: during the propagation outwards, the plasmoids maythus encounter a stronger pre-existing magnetic ux which could prevent fast propa-gation (the plasmoid associated with this event is the slowest one), but which could15

also lead to many more and long lasting interactions.Klein et al. (1999) also reported decimetric/metric radio emission in associationwith the propagation of a fast plasma blob. However, contrary to the case studiedhere, the speed of the ejecta was quite high and the shock wave which was createdresulted in the generation of a decimetric/metric type II burst. In the presentevents where the speeds of the plasmoid are much smaller the decimetric/metricradio emission produced are continua and no type II bursts are associated with theejecta. This is probably due to the fact that the velocities of the ejecta in theevents that we studied are smaller (about 100{200 km/sec in the 1993 Novemberevent and about 60{110 km/sec in the 1993 February 17 event) and no fast coronalmagnetohydrodynamic shock can be produced.5 ConclusionsThe two events that we studied provide the �rst detections of long decimetric/metricradio emission associated with X{ray plasmoid ejections. The observations can besummarized as follows:� impulsive HXR and microwave emissions are observed without counterpartsat long dm-m waves.� emission at long dm-m wavelengths is seen when the ejected structure attainsthe appropriate height in the corona.� radio emission sources are located in the direction of propagation of the ejectain close temporal and spatial relationship with the arrival of the ejected struc-ture at appropriate heights.� time-extended emission proceeds to lower frequencies in a stepward mannerfor the long duration event.Time-extended acceleration and injection of energetic electrons in a growingrange of magnetic structures is thus linked to the propagation of the plasmoid.This coronal acceleration of electrons may arise when the plasmoid propagatingoutwards encounters and interacts with increasingly more extended magnetic �eldlines thus creating new coronal sites of production of nonthermal electrons. Thetime extended production of nonthermal electrons, over an extended height range isnot compatible with the acceleration by a single propagating exciter such as a risingpoint of reconnection or a coronal shock wave (whatever its nature).6 ACKNOWLEDGMENTSThis research at the University of Maryland was carried out with support fromNSF grants ATM 96{12738, ATM 99{09809, INT 98{19917 and NASA grants NAG16
5{8192 and NAG 5{7901. AN would like to thank Dr. S. M. White for valu-able discussions and advice. KLK acknowledges data supplied by H. Aurass andM. Poqu�erusse. The Nan�cay Radio Observatory is funded by the French Ministryof Education, the CNRS and the R�egion Centre.
17

REFERENCESA REACTUALISER EN FONCTION DES MODIFICATIONSCarmichael, H. 1964 in Proc. AAS{NASA Symp. on the \Physics of Solar Flares",ed. W. N. Hess, NASA{SP 50, p. 451.Dennis, B.R., & Zarro, D.M., 1993, Sol. Phys., 146, 177.Dulk, G. A., 1971, Australian J. Phys., 24, 177.Duncan, R. A. 1979, Sol. Phys., 63, 389.Feldman, U. 1992, Physica Scripta, 46, 202.Gopalswamy, N., Kundu, M. R., Manoharan, P. K., Raoult, A., Nitta, N., & Zarka,P. 1997, ApJ, 486, 1036.Hara, H. et al. 1992, PASJ, 44, L135.Hirayama, T. 1974, Sol. Phys., 34, 323.Klein, K.-L., 1998, in Proc. Euroconf. on \Three-dimensional Structure of SolarActive Regions", ed. C.E. Alissandrakis, B. Schmieder, Astron. Soc. Pac.Conf. Series 155, p. 182.Klein, K.{L., Khan, J. I., Vilmer, N., Delouis, J.{M., & Aurass, H. 1999, A&A,346, L53.Kliem, B., Karlick�y, M., Benz, A.O., 2000, A&A, 360, 715.Kopp, R. A., & Pneuman, G. W. 1976, Sol. Phys., 50, 85.Kundu, M. R., Gopalswamy, N., White, S., Cargill, P., Schmahl, E. J., & Hildner,E. 1989, ApJ, 347, 505.Kundu, M. R., et al. 1994, ApJ, 427, L59.Kundu, M. R., Raulin, J.{P., Pick, M., & Strong, K. T. 1995a, ApJ, 444, 922.Kundu, M. R., Raulin, J.{P., Nitta, N., et al. 1995b, ApJ, 447, L135.Lampe, M., & Papadopoulos, K. 1977, ApJ, 212, 886.Masuda, S. 1994, Ph. D. Thesis, University of Tokyo.Masuda, S., Kosugi, T., Hara, H., Sakao, T., Shibata, K., & Tsuneta, S. 1995,PASJ, 47, 677.Meyer, J.{P. 1985, ApJS, 57, 173. 18

Nindos, A., Kundu, M. R., White, S. M., Shibasaki, K., & Gopalswamy, N. 2000,ApJS, in press.Ohyama, M., & Shibata, K. 1997, PASJ, 49, 249.Ohyama, M., & Shibata, K. 1998, ApJ, 499, 934.Raulin J.P., & Klein, K.-L., 1994, A&A, 281, 536.Raulin, J.{P., Kundu, M. R., Nitta, N., & Raoult, A., 1996, ApJ, 472, 874.Raulin, J.{P., Kundu, M. R., Hudson, H. S., Nitta, N., & Raoult, A. 1996, A&A,306, 299.Shibata, K., et al. 1994, ASJ meeting abstract, S28P.Shibata, K. et al. 1995, ApJ, 451, L83.Stewart, R. T. 1972, Proc. Astron. Soc. Australia, 2, 100.Sturrock, P. A. 1966, Nature, 211, 695.The Radioheliograph Group 1993, Adv. Space Res., 13(9), 411.White, S. M., Thomas, R., Brosius, J. W., & Kundu, M. R. 2000, ApJ, 534, 203.
19

![Aibo progr amming - Ricardo A. Tellez · 2008-05-25 · Objects Communication Subjects are referred b y the subject[] arr ay and observ ers b y observ er[] To send a message 1. Initialize](https://img.pdfslide.us/doc/110x75/5e631763ab06e55e5b0a38a0/aibo-progr-amming-ricardo-a-2008-05-25-objects-communication-subjects-are-referred.jpg)