Embed Size (px)
Citation preview
The future of Economic Statistics
Assessing prospects of sustainable development in Asia and the Pacific
Chiba, Japan
Zhenqian Huang
• Using statistics for analyzing sustainable development
• SDG progress
• SDG investment needs assessment
• Data issues
Outline
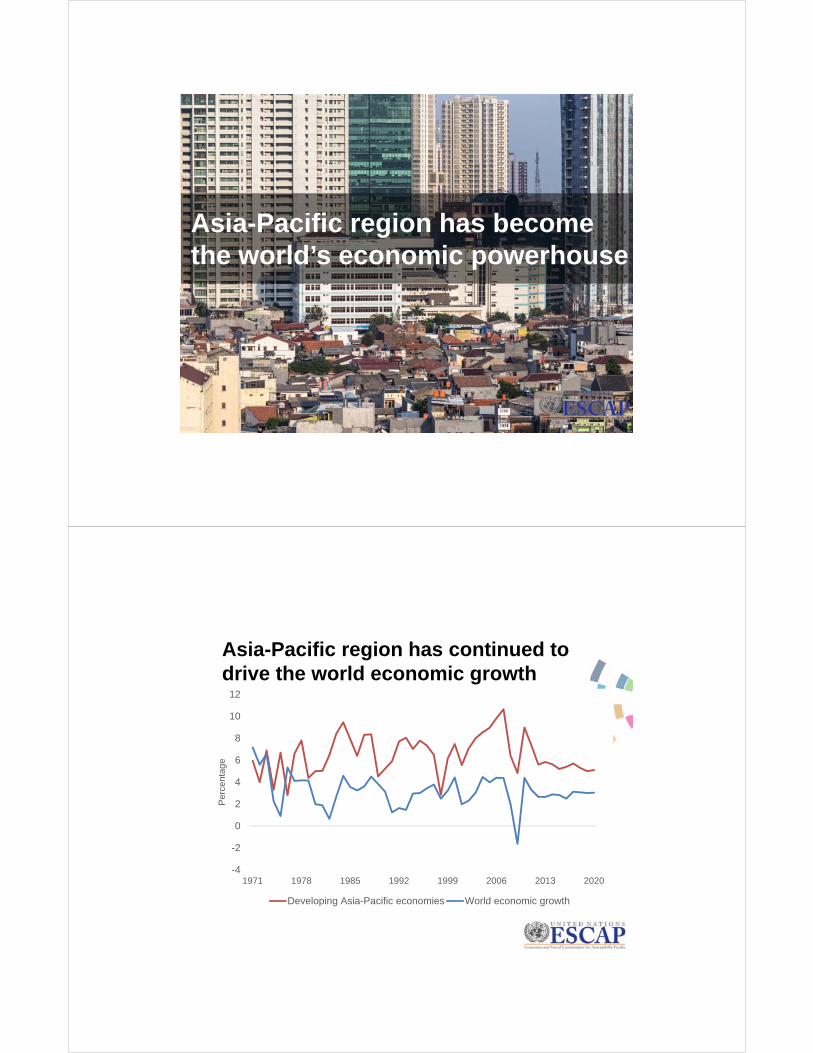
Asia-Pacific region has become the world’s economic powerhouse
Asia-Pacific region has continued todrive the world economic growth
-4
-2
0
2
4
6
8
10
12
1971 1978 1985 1992 1999 2006 2013 2020
Per
cent
age
Developing Asia-Pacific economies World economic growth
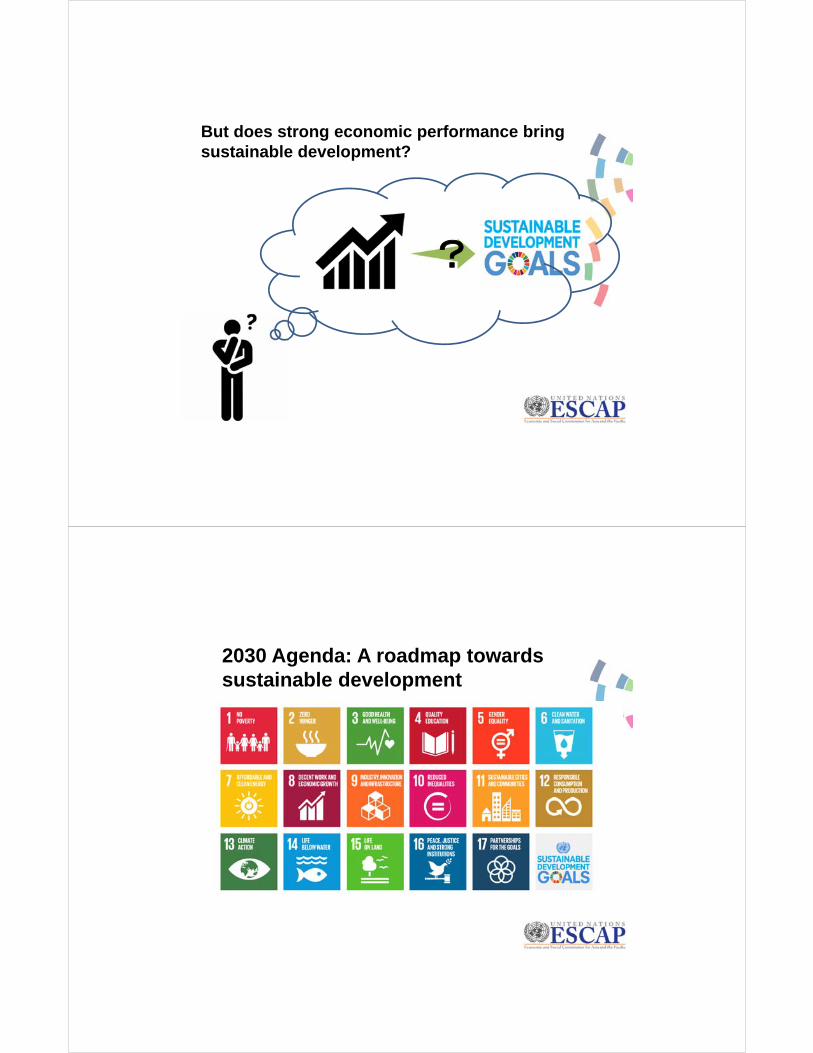
But does strong economic performance bring sustainable development?
?
2030 Agenda: A roadmap towards sustainable development
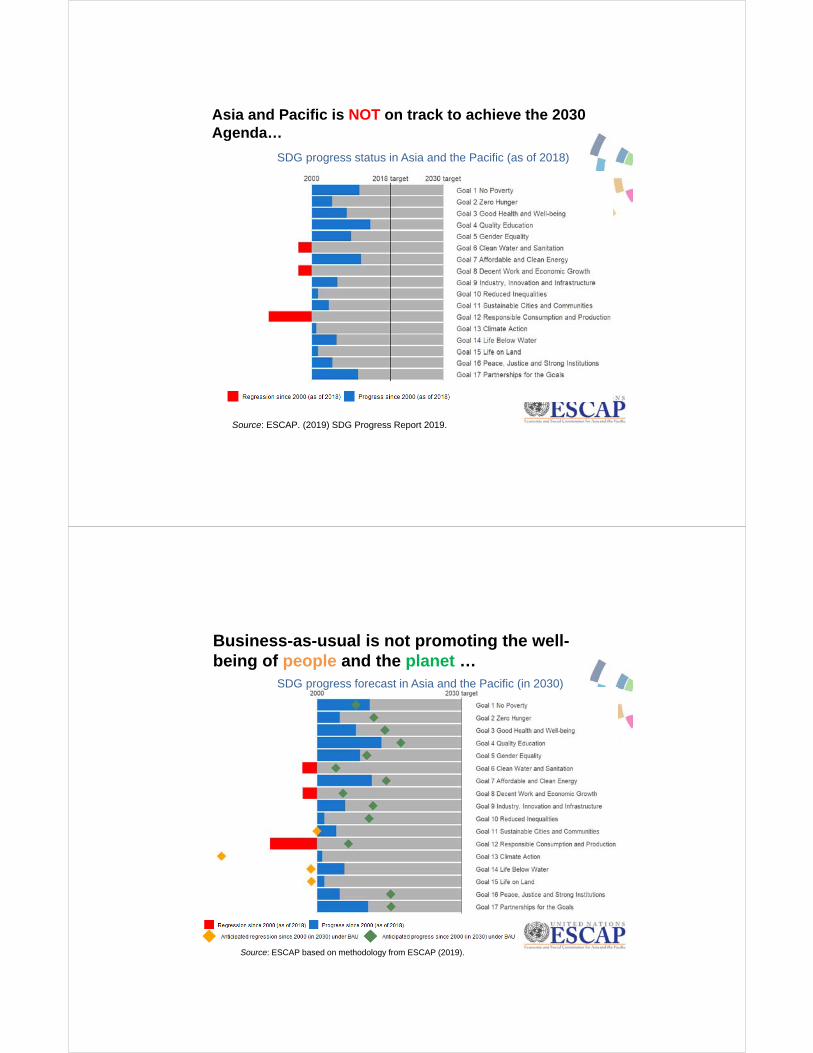
Asia and Pacific is NOT on track to achieve the 2030 Agenda…
SDG progress status in Asia and the Pacific (as of 2018)
Source: ESCAP. (2019) SDG Progress Report 2019.
Business-as-usual is not promoting the well-being of people and the planet …
Source: ESCAP based on methodology from ESCAP (2019).
SDG progress forecast in Asia and the Pacific (in 2030)
How did we get here?
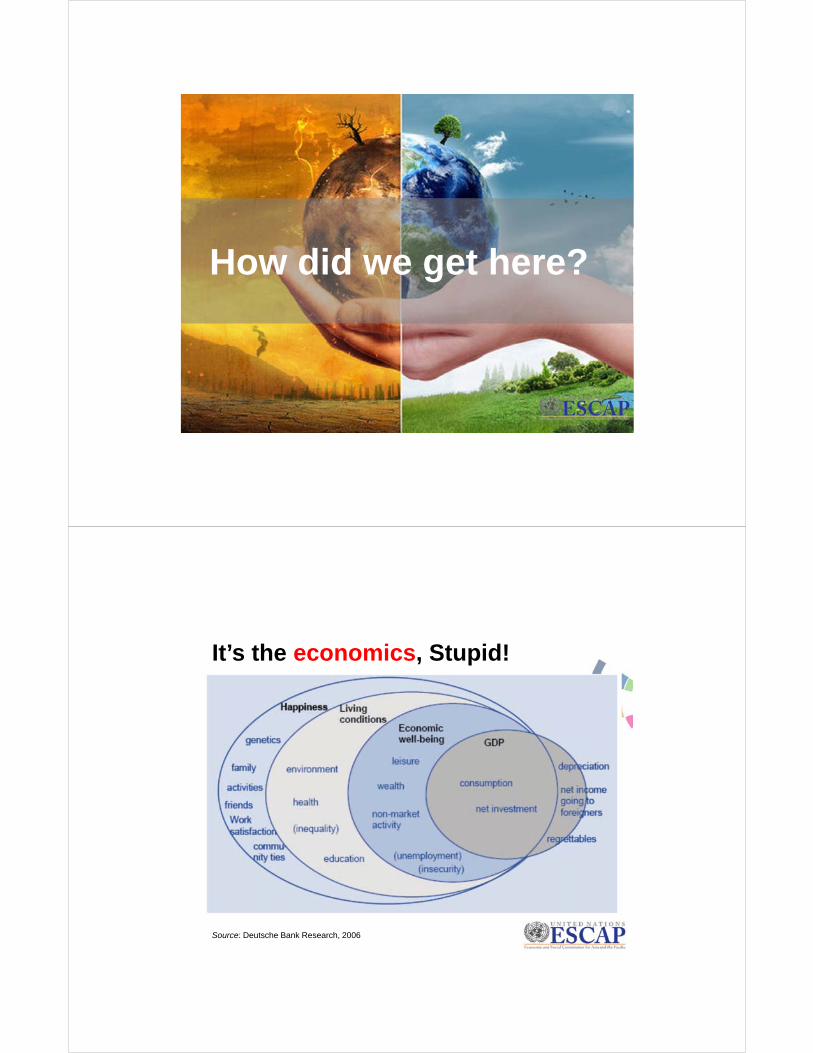
It’s the economics, Stupid!
Source: Deutsche Bank Research, 2006
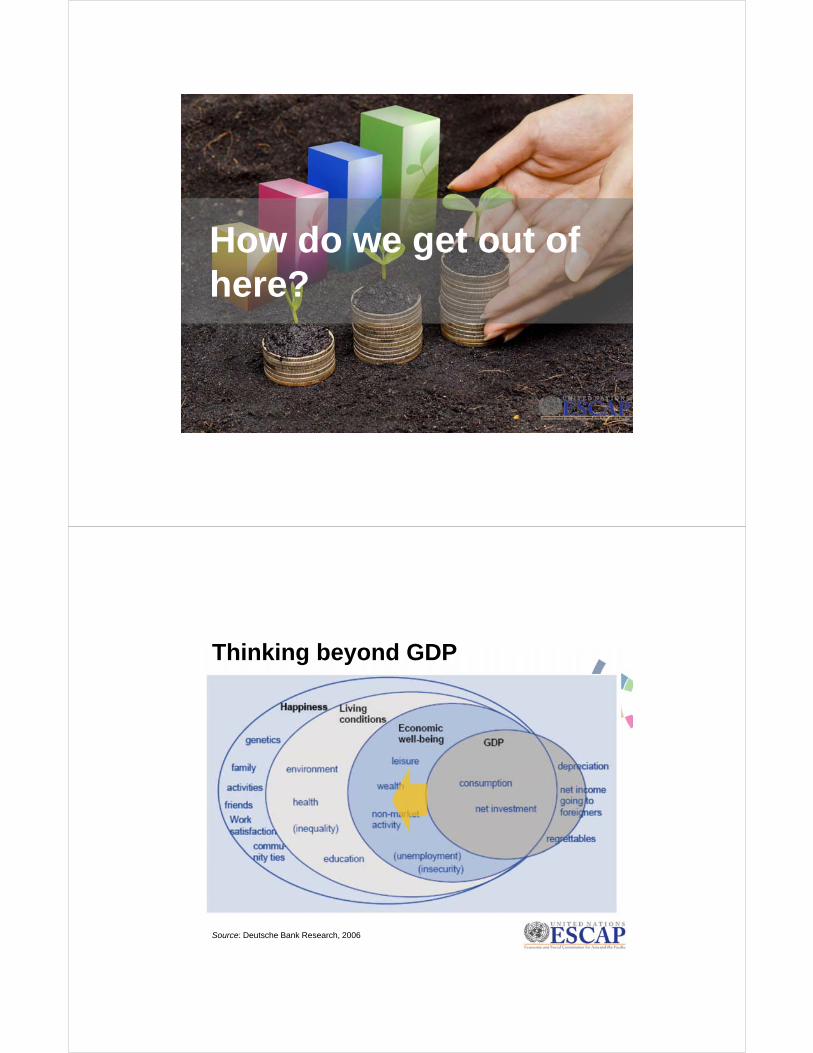
How do we get out of here?
Source: Deutsche Bank Research, 2006
Thinking beyond GDP
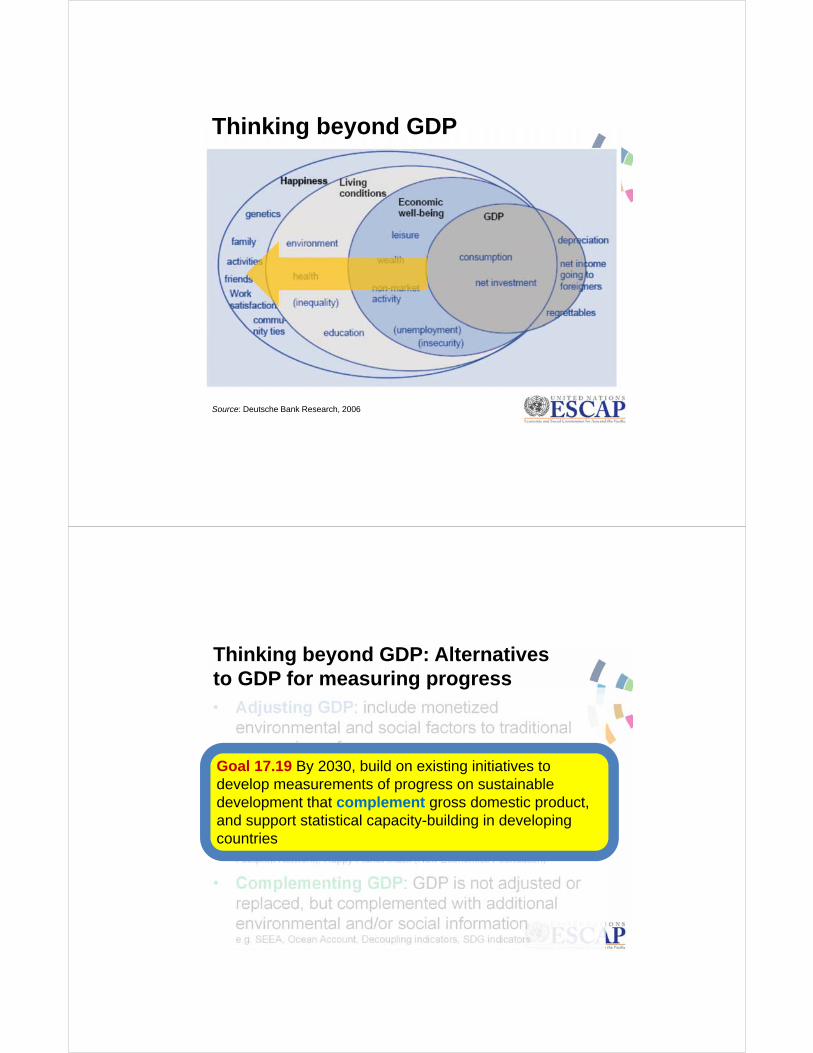
Source: Deutsche Bank Research, 2006
Thinking beyond GDP
• Adjusting GDP: include monetized environmental and social factors to traditional economic performance measurese.g. Measure of Economic Welfare (Tobin & Nordhaus, 1972), Index of Sustainable Economic Welfare (Daly & Cobb, 1989), Genuine Progress Indicator (Cobb et al., 1995)
• Replacing GDP: indicators that try to assess well-being more directly than GDPe.g. HDI (UNDP), Better Life Index (OECD), Ecological Footprint (WWF & Global Footprint Network), Happy Planet Index (New Economics Foundation)
• Complementing GDP: GDP is not adjusted or replaced, but complemented with additional environmental and/or social informatione.g. SEEA, Ocean Account, Decoupling indicators, SDG indicators
Goal 17.19 By 2030, build on existing initiatives to develop measurements of progress on sustainable development that complement gross domestic product, and support statistical capacity-building in developing countries
Thinking beyond GDP: Alternatives to GDP for measuring progress
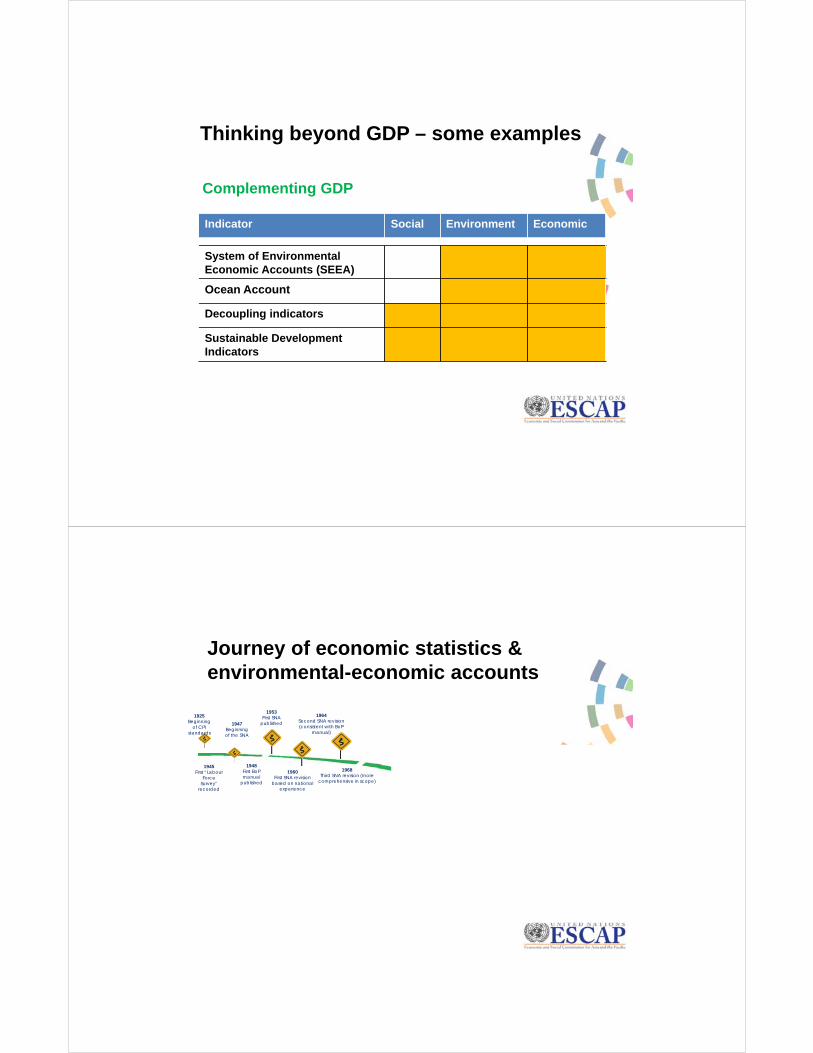
Thinking beyond GDP – some examples
Indicator Social Environment Economic
System of Environmental Economic Accounts (SEEA)
Ocean Account
Decoupling indicators
Sustainable Development Indicators
Complementing GDP
1925Beginning
of CPI standards
1945First “Labour
Force Survey”
recorded
1947Beginning of the SNA
1948First BoPmanual
published
1953First SNA
published
1960First SNA revision
based on national experience
1964Second SNA revision (consistent with BoP
manual)
1968Third SNA revision (more
comprehensive in scope)
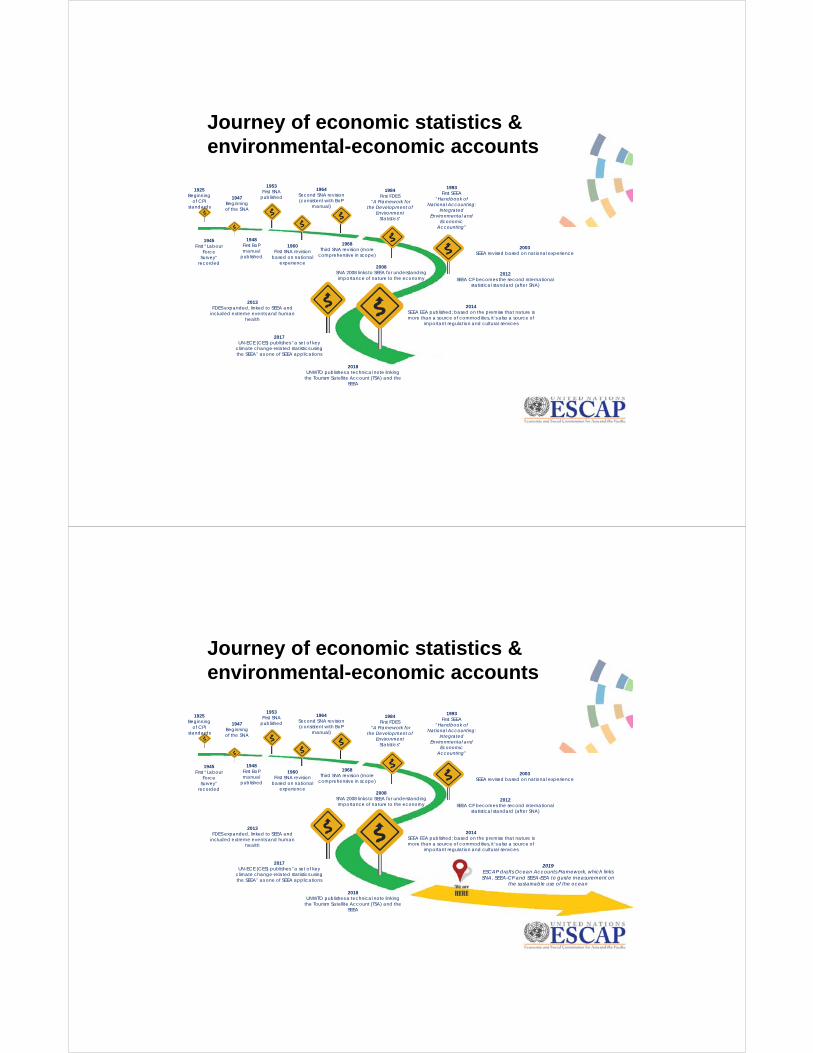
Journey of economic statistics & environmental-economic accounts
1925Beginning
of CPI standards
1945First “Labour
Force Survey”
recorded
1947Beginning of the SNA
1948First BoPmanual
published
1953First SNA
published
1960First SNA revision
based on national experience
1964Second SNA revision (consistent with BoP
manual)
1968Third SNA revision (more
comprehensive in scope)
2003SEEA revised based on national experience
2013FDES expanded, linked to SEEA and
included extreme events and human health
2012SEEA CF becomes the second international
statistical standard (after SNA)
2017UN-ECE (CES) publishes “a set of key
climate change-related statistics using the SEEA” as one of SEEA applications
2018UNWTO publishes a technical note linking
the Tourism Satellite Account (TSA) and the SEEA
1993First SEEA
“Handbook of National Accounting:
Integrated Environmental and
Economic Accounting”
2008SNA 2008 links to SEEA for understanding importance of nature to the economy
2014SEEA EEA published; based on the premise that nature is more than a source of commodities, it’s also a source of
important regulation and cultural services
1984First FDES
“A Framework for the Development of
Environment Statistics”
Journey of economic statistics & environmental-economic accounts
2019ESCAP drafts Ocean Accounts Framework, which links SNA, SEEA-CF and SEEA-EEA to guide measurement on
the sustainable use of the ocean
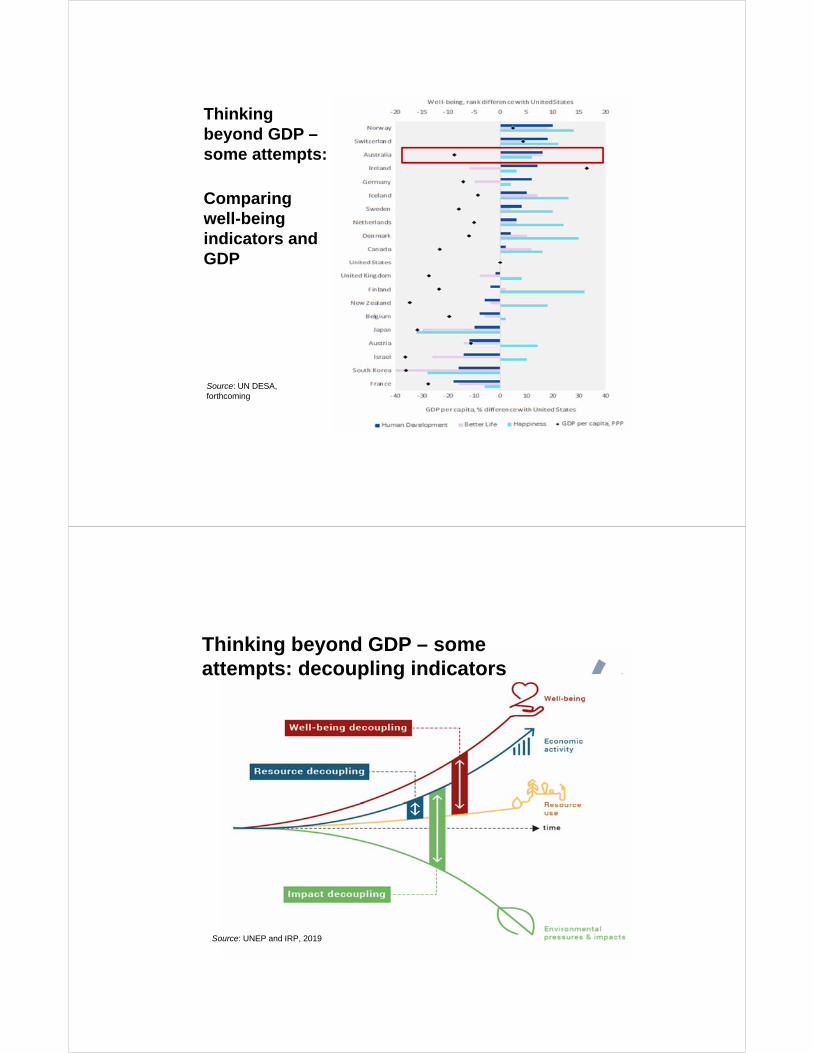
Thinking beyond GDP –some attempts:
Comparing well-being indicators and GDP
Source: UN DESA, forthcoming
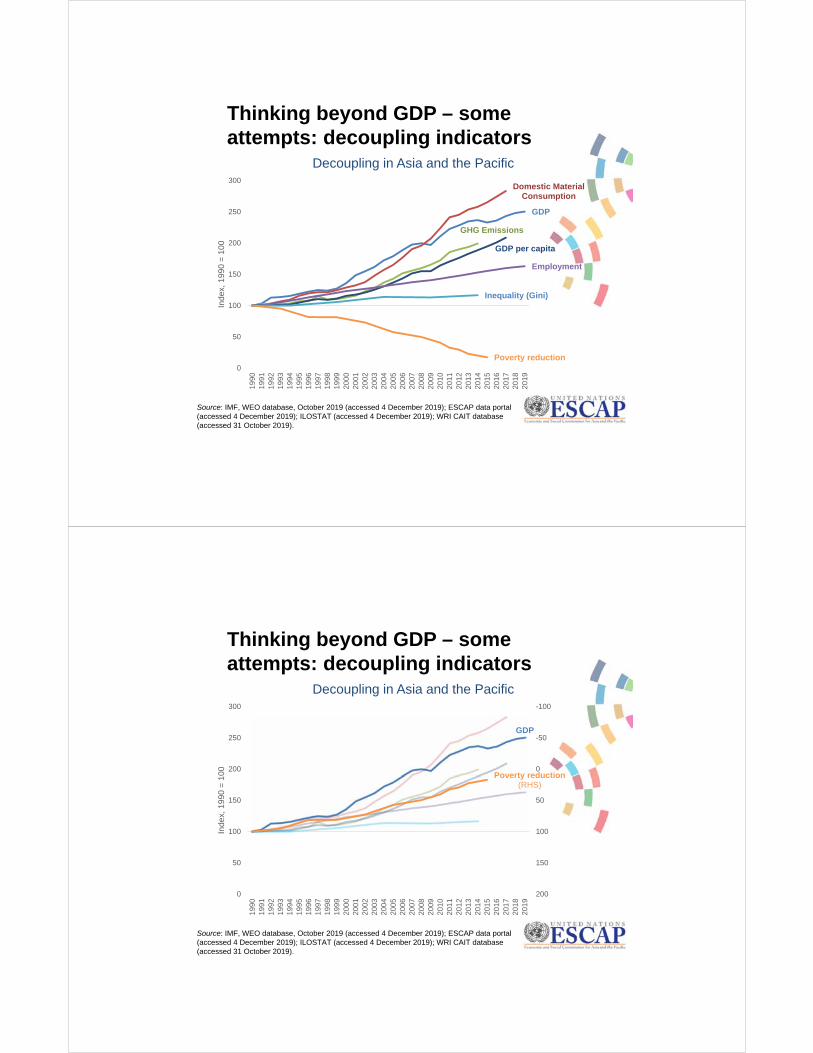
Thinking beyond GDP – some attempts: decoupling indicators
Source: UNEP and IRP, 2019
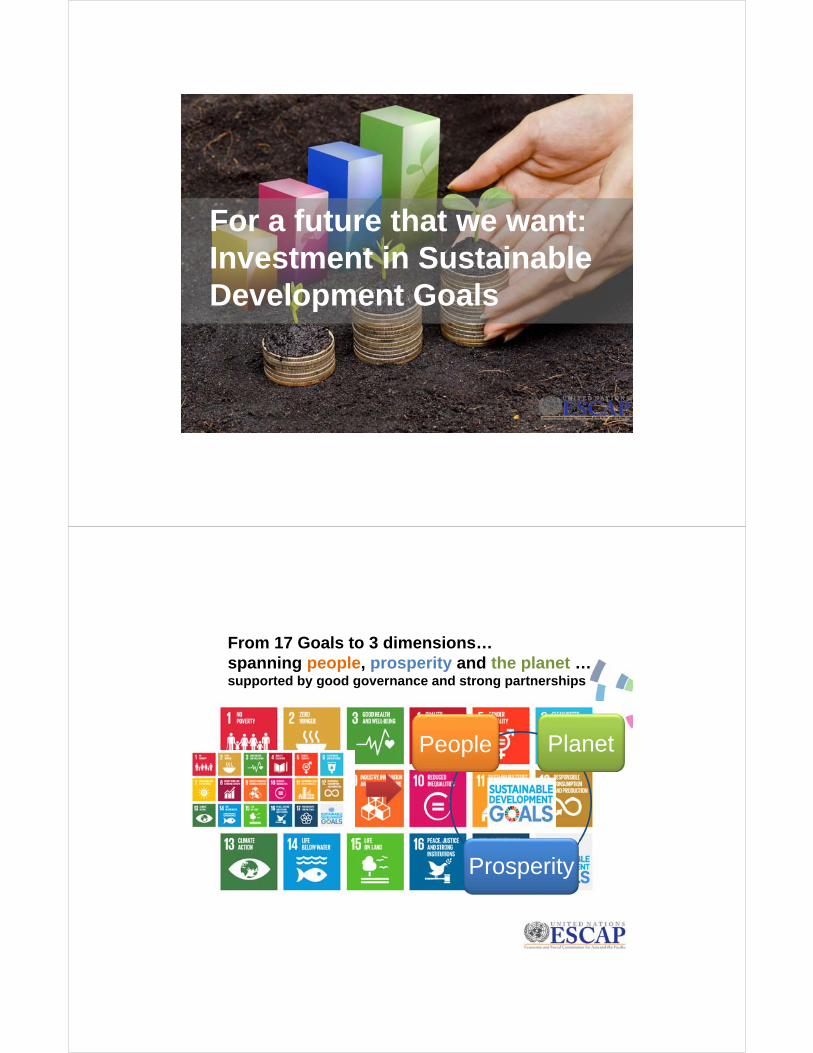
Thinking beyond GDP – some attempts: decoupling indicators
Decoupling in Asia and the Pacific
Source: IMF, WEO database, October 2019 (accessed 4 December 2019); ESCAP data portal (accessed 4 December 2019); ILOSTAT (accessed 4 December 2019); WRI CAIT database (accessed 31 October 2019).
GDP
Domestic Material Consumption
GHG Emissions
GDP per capita
Employment
Inequality (Gini)
Poverty reduction0
50
100
150
200
250
300
1990
1991
1992
1993
1994
1995
1996
1997
1998
1999
2000
2001
2002
2003
2004
2005
2006
2007
2008
2009
2010
2011
2012
2013
2014
2015
2016
2017
2018
2019
Inde
x, 1
990
= 1
00
Thinking beyond GDP – some attempts: decoupling indicators
Decoupling in Asia and the Pacific
Source: IMF, WEO database, October 2019 (accessed 4 December 2019); ESCAP data portal (accessed 4 December 2019); ILOSTAT (accessed 4 December 2019); WRI CAIT database (accessed 31 October 2019).
GDP
Poverty reduction(RHS)
-100
-50
0
50
100
150
2000
50
100
150
200
250
300
1990
1991
1992
1993
1994
1995
1996
1997
1998
1999
2000
2001
2002
2003
2004
2005
2006
2007
2008
2009
2010
2011
2012
2013
2014
2015
2016
2017
2018
2019
Inde
x, 1
990
= 1
00
For a future that we want: Investment in Sustainable Development Goals
From 17 Goals to 3 dimensions… spanning people, prosperity and the planet … supported by good governance and strong partnerships
People Planet
Prosperity
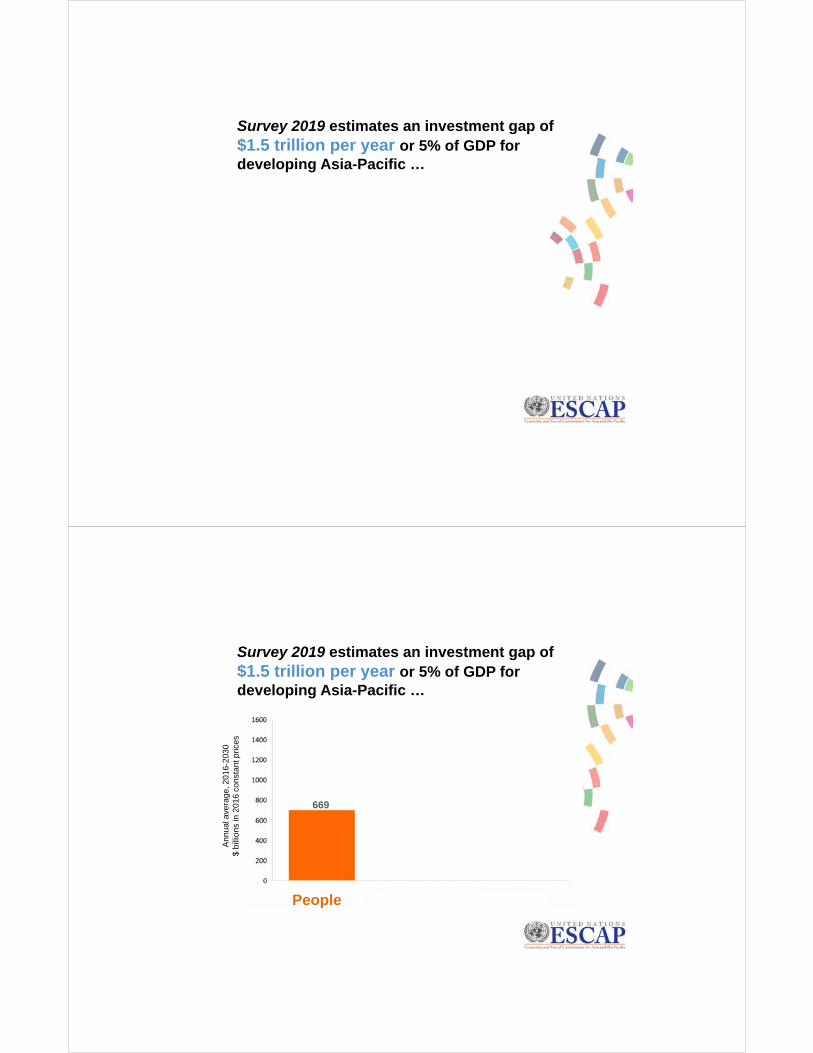
Survey 2019 estimates an investment gap of $1.5 trillion per year or 5% of GDP for developing Asia-Pacific …
Survey 2019 estimates an investment gap of $1.5 trillion per year or 5% of GDP for developing Asia-Pacific …
Ann
ual a
vera
ge, 2
016-
2030
$
billi
ons
in 2
016
cons
tant
pric
es
669
People Prosperity Planet
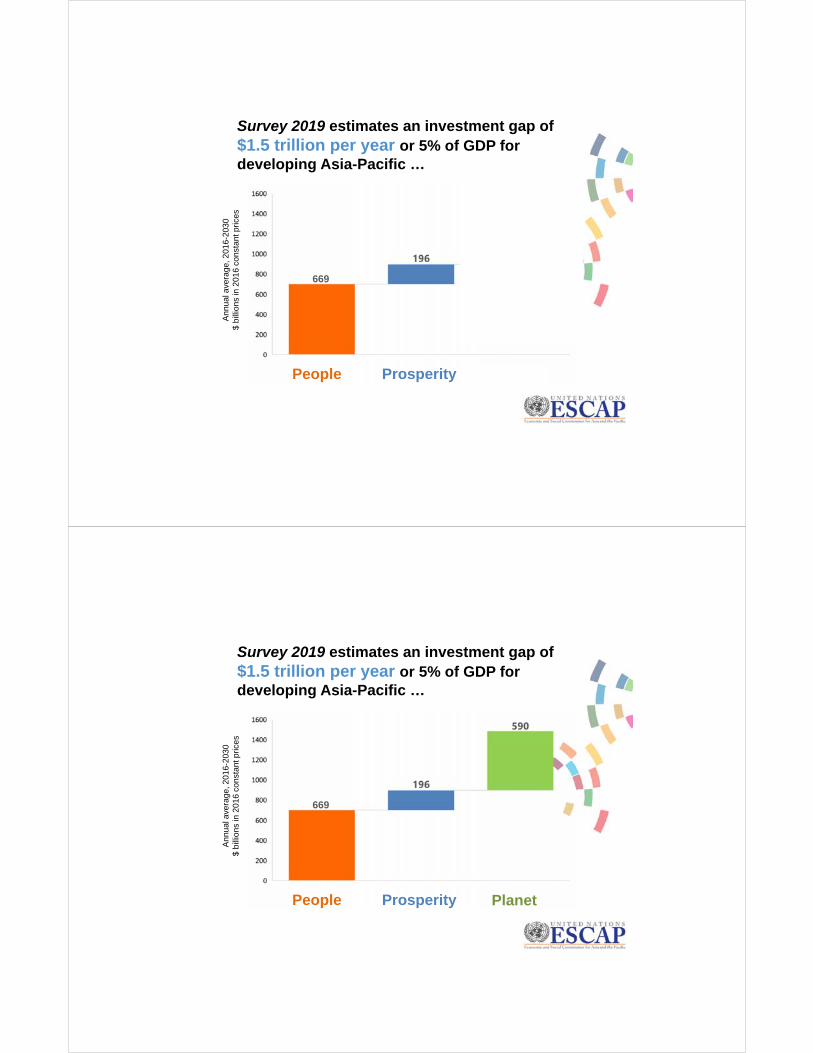
Survey 2019 estimates an investment gap of $1.5 trillion per year or 5% of GDP for developing Asia-Pacific …
Ann
ual a
vera
ge, 2
016-
2030
$
billi
ons
in 2
016
cons
tant
pric
es
669
People Prosperity Planet
Survey 2019 estimates an investment gap of $1.5 trillion per year or 5% of GDP for developing Asia-Pacific …
Ann
ual a
vera
ge, 2
016-
2030
$
billi
ons
in 2
016
cons
tant
pric
es
669
People Prosperity Planet
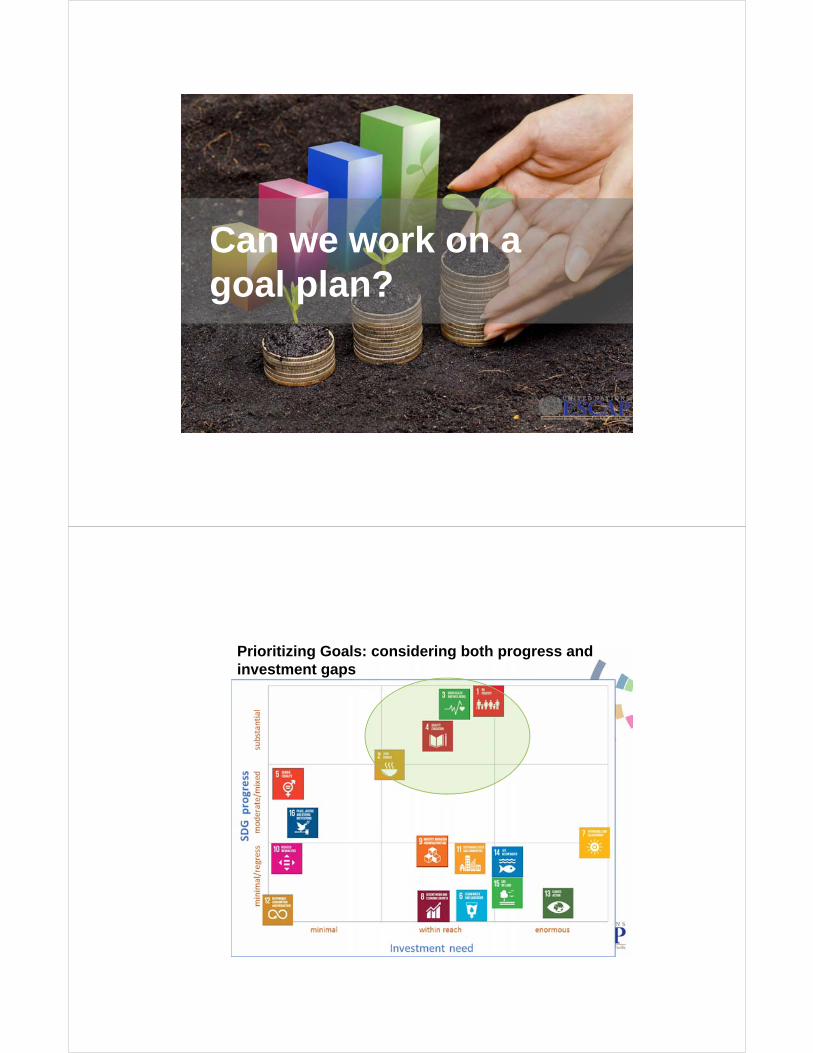
Can we work on a goal plan?
Prioritizing Goals: considering both progress and investment gaps
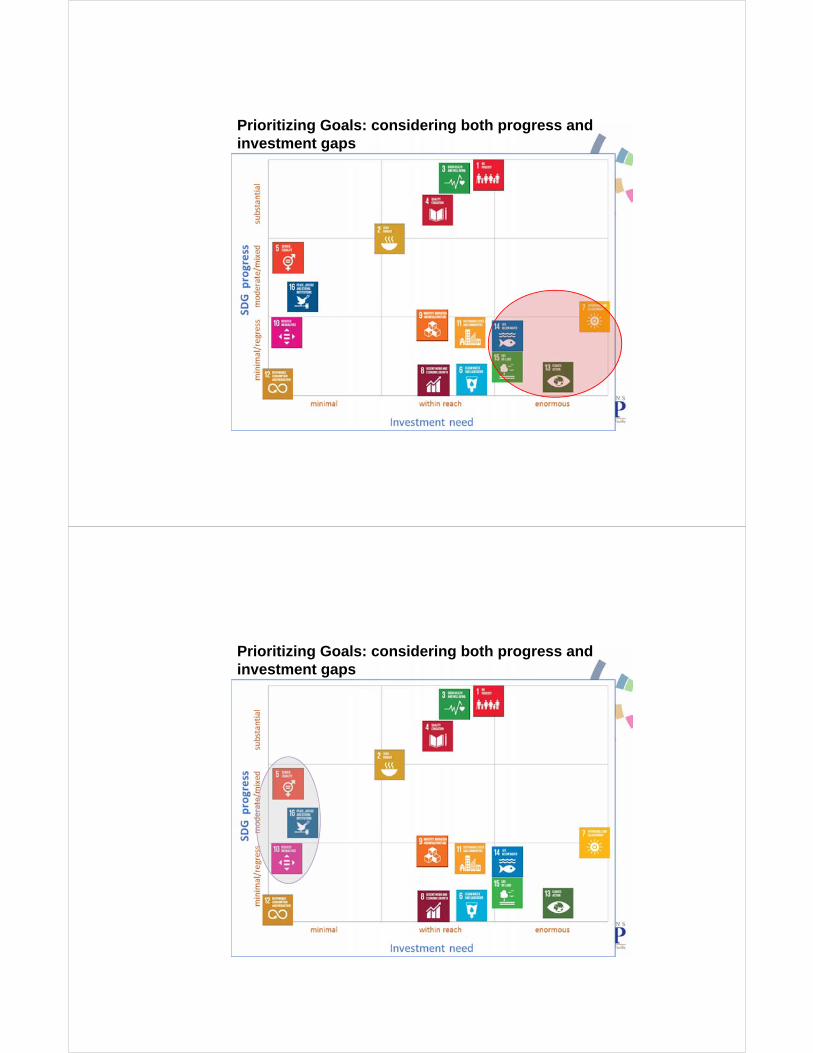
Prioritizing Goals: considering both progress and investment gaps
Prioritizing Goals: considering both progress and investment gaps
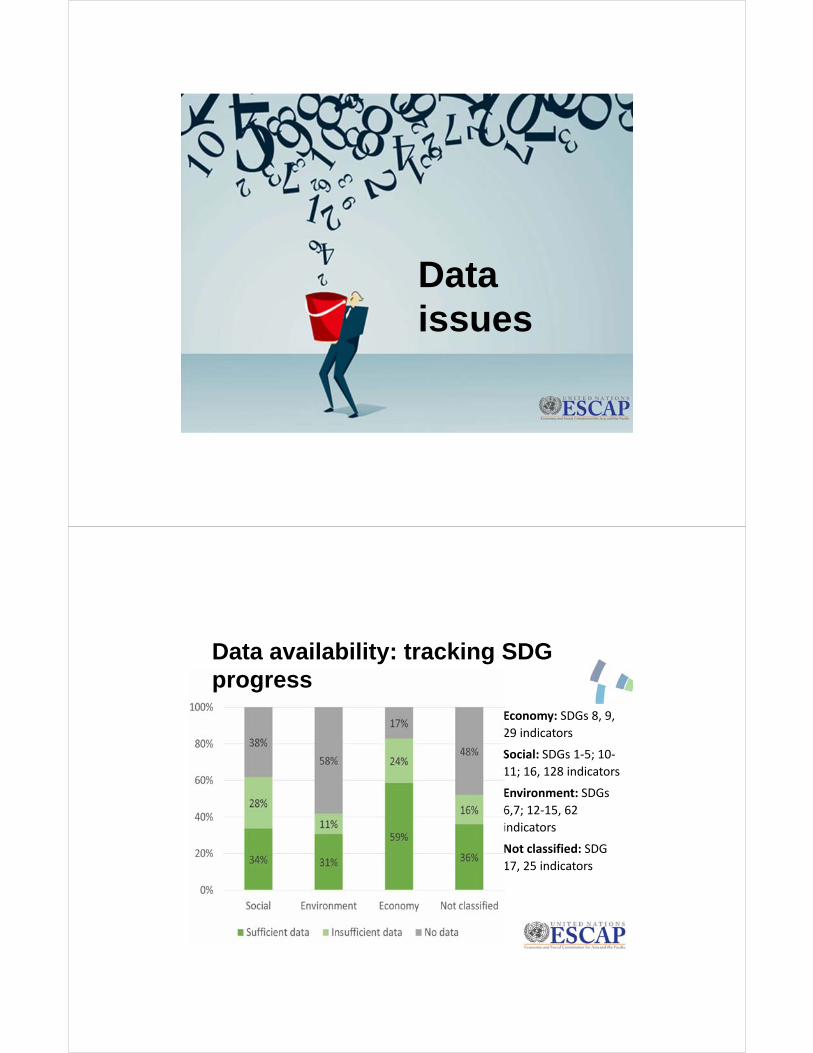
Data issues
Economy: SDGs 8, 9,
29 indicators
Social: SDGs 1‐5; 10‐
11; 16, 128 indicators
Environment: SDGs
6,7; 12‐15, 62
indicators
Not classified: SDG
17, 25 indicators
Data availability: tracking SDG progress
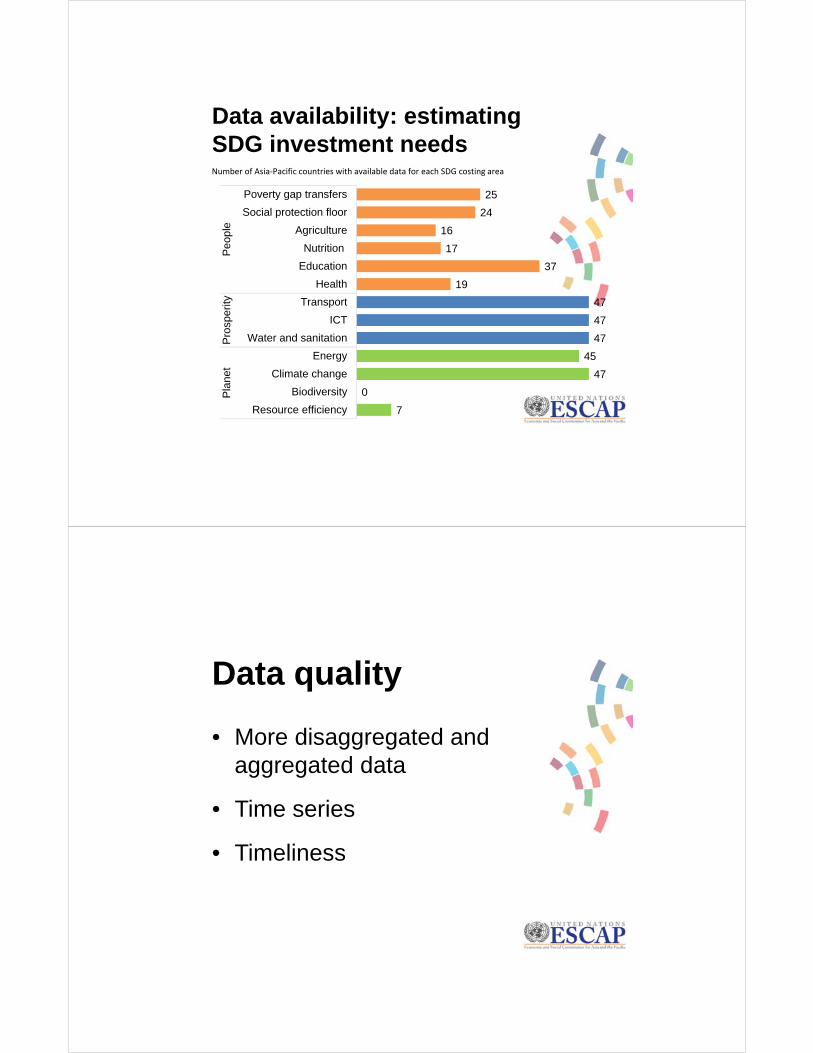
Data availability: estimating SDG investment needs
7
0
47
45
47
47
47
19
37
17
16
24
25
Resource efficiency
Biodiversity
Climate change
Energy
Water and sanitation
ICT
Transport
Health
Education
Nutrition
Agriculture
Social protection floor
Poverty gap transfers
Pla
net
Pro
sper
ityP
eopl
e
Number of Asia‐Pacific countries with available data for each SDG costing area
Data quality
• More disaggregated and aggregated data
• Time series
• Timeliness
Challenges for data users
• Difficulty to compare data and assess progress overtime
• Need capacity to understand broader sustainable development indicators and their interlinkages
• Lack of clarity to aggregate and interpret data for policy analysis
• Need knowledge of models to identify future trends and run scenario analysisE.g. Central Banks attempt to include climate indicators into macroeconomic models
• Require better coordination between Government agencies in using data for policy initiatives
Takeaway messages
TAKEAWAY MESSAGES• New economics of sustainable development will
need to think beyond GDP
• Various efforts have been made to explore alternatives to complement GDP and assess progress
• Good statistics can allow policymakers to operationalize SDG framework, e.g. identify needed interventions, and prioritize SDG investment areas
• Actions are needed to improve availability and quality of data and to enhance the capacity of data users
For a future that we want!
Please visit www.unescap.org/publications/economic-and-social-survey-asia-and-pacific-2019