Embed Size (px)
Citation preview
2. Studies of Cancer in Humans
Major epidemiological studies of cancer in relation to arsenic in drinking-waterinclude ecological studies and fewer case–control and cohort studies. For most otherknown human carcinogens, the major source of causal evidence arises from case–controland cohort studies, with little, if any, evidence from ecological studies. In contrast, forarsenic in drinking-water, ecological studies provide important information on causalinference, because of large exposure contrasts and limited population migration. As aconsequence of widespread exposure to local or regional water sources, ecologicalmeasures provide a strong indication of individual exposure. Moreover, in the case ofarsenic, the ecological estimates of relative risk are often so high that potential con-founding with known causal factors cannot explain the results. Hence, in the review thatfollows, ecological studies are presented in detail.
2.1 Cancer of the urinary bladder and kidney
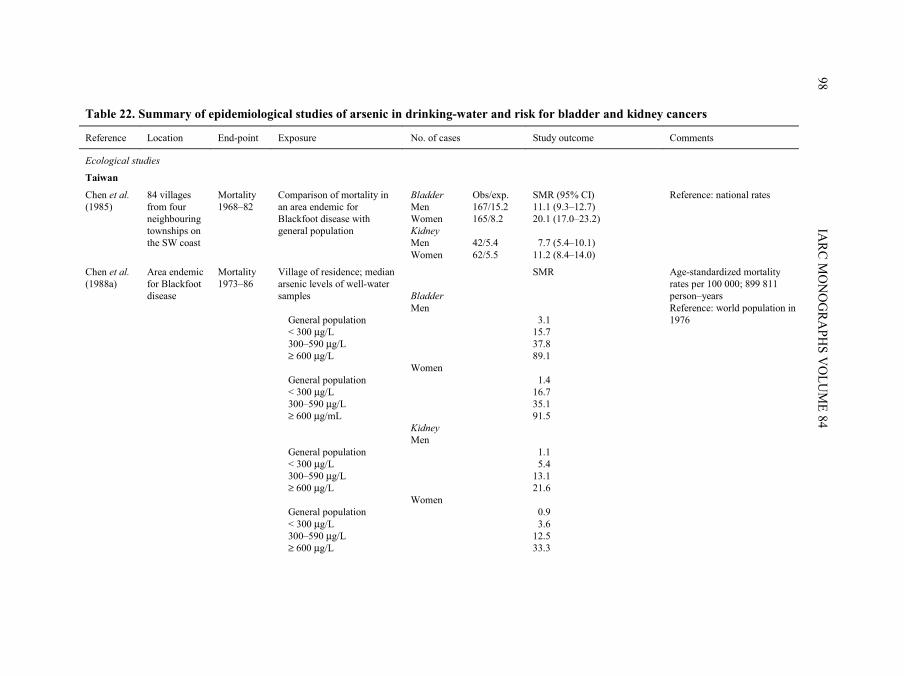
The findings of epidemiological studies on arsenic in drinking-water and the risk forcancers of the urinary bladder and kidney are summarized in Table 22.
Historically, several case reports have related cancers of the urinary tract with medi-cinal arsenic treatments or arsenic-related diseases such as Bowen disease. In 1953, aseries of 27 cases with multiple skin cancers attributed to arsenical medicines wasreported (Sommers & McManus, 1953). Of these cases, 10 were diagnosed as also havinginternal cancers at various sites, three of which were urinary tract tumours. Graham andHelwig (1959) first investigated an association between Bowen disease and primaryinternal cancers. Twenty-eight (80%) of 35 cases had primary internal cancers, two ofwhich were malignant tumours of the bladder and one a tumour of the kidney. Cuzicket al. (1982) examined a cohort of subjects in the United Kingdom who had takenFowler’s solution (potassium arsenite) between 1945 and 1969. After further follow-up ofthe cohort through 1990 (Cuzick et al., 1992), a threefold increase in mortality frombladder cancer (standardized mortality ratio [SMR], 3.07; 95% confidence interval [CI],1.01–7.3) was reported, strengthening the evidence on bladder cancer reported previously(Cuzick et al., 1982).
Bergoglio (1964) published the first report of bladder cancer associated with arsenicin drinking-water in the Province of Cordóba in Argentina. He identified 2355 deathsbetween 1949 and 1959 in nine towns of a highly exposed region and found that cancerwas the cause of death of 24%; 11% of these cancer deaths involved cancers of the urinarytract. Biagini (1972) followed 116 patients with arsenic-related skin lesions in the sameregion and found that 12.5% of the cancer deaths were patients with urinary tract cancers.
ARSENIC IN DRINKING-WATER 97
pp97-166.qxd 11/10/2004 10:47 Page 97
IARC M
ON
OG
RAPH
S VO
LUM
E 8498
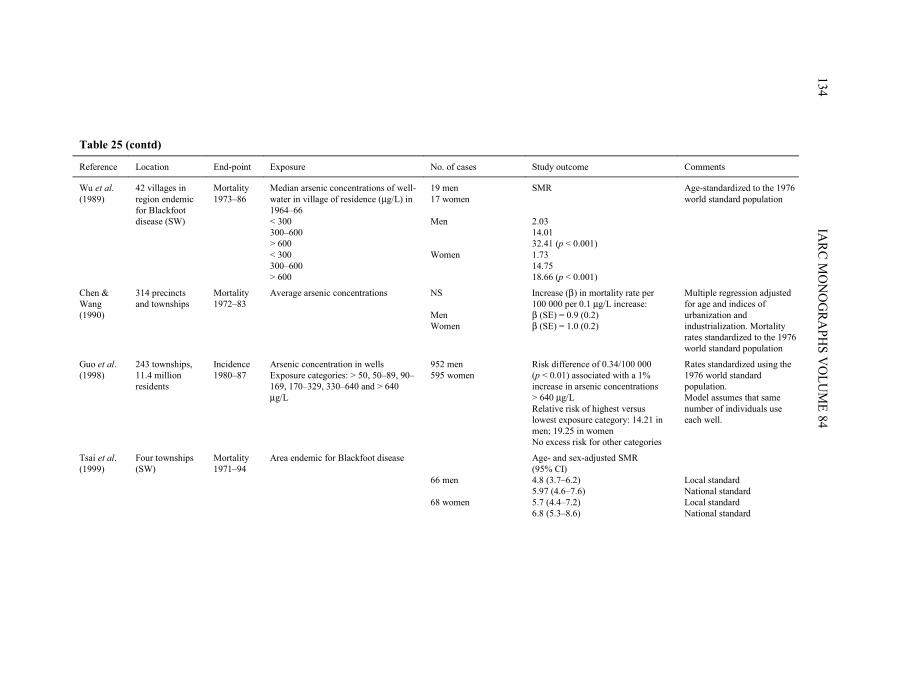
Table 22. Summary of epidemiological studies of arsenic in drinking-water and risk for bladder and kidney cancers
Reference Location End-point Exposure No. of cases Study outcome Comments
Ecological studies
Taiwan
Chen et al. (1985)
84 villages from four neighbouring townships on the SW coast
Mortality 1968–82
Comparison of mortality in an area endemic for Blackfoot disease with general population
Bladder Men Women Kidney Men Women
Obs/exp. 167/15.2 165/8.2 42/5.4 62/5.5
SMR (95% CI) 11.1 (9.3–12.7) 20.1 (17.0–23.2) 7.7 (5.4–10.1) 11.2 (8.4–14.0)
Reference: national rates
Chen et al. (1988a)
Area endemic for Blackfoot disease
Mortality 1973–86
Village of residence; median arsenic levels of well-water samples General population < 300 µg/L 300–590 µg/L ≥ 600 µg/L General population < 300 µg/L 300–590 µg/L ≥ 600 µg/mL General population < 300 µg/L 300–590 µg/L ≥ 600 µg/L General population < 300 µg/L 300–590 µg/L ≥ 600 µg/L
Bladder Men Women Kidney Men Women
SMR 3.1 15.7 37.8 89.1 1.4 16.7 35.1 91.5 1.1 5.4 13.1 21.6 0.9 3.6 12.5 33.3
Age-standardized mortality rates per 100 000; 899 811 person–years Reference: world population in 1976
pp97-166.qxd 11/10/2004 10:47 Page 98
ARSEN
IC IN D
RINK
ING
-WATER
99
Table 22 (contd)
Reference Location End-point Exposure No. of cases Study outcome Comments
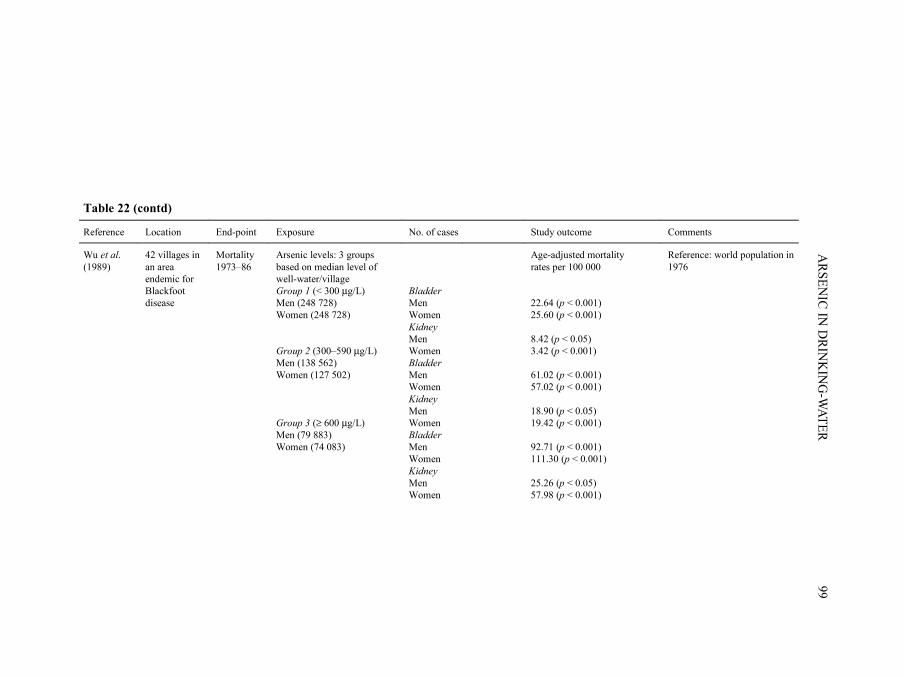
Wu et al. (1989)
42 villages in an area endemic for Blackfoot disease
Mortality 1973–86
Arsenic levels: 3 groups based on median level of well-water/village Group 1 (< 300 µg/L) Men (248 728) Women (248 728) Group 2 (300–590 µg/L) Men (138 562) Women (127 502) Group 3 (≥ 600 µg/L) Men (79 883) Women (74 083)
Bladder Men Women Kidney Men Women Bladder Men Women Kidney Men Women Bladder Men Women Kidney Men Women
Age-adjusted mortality rates per 100 000 22.64 (p < 0.001) 25.60 (p < 0.001) 8.42 (p < 0.05) 3.42 (p < 0.001) 61.02 (p < 0.001) 57.02 (p < 0.001) 18.90 (p < 0.05) 19.42 (p < 0.001) 92.71 (p < 0.001) 111.30 (p < 0.001) 25.26 (p < 0.05) 57.98 (p < 0.001)
Reference: world population in 1976
pp97-166.qxd 11/10/2004 10:47 Page 99
IARC M
ON
OG
RAPH
S VO
LUM
E 84100
Table 22 (contd)
Reference Location End-point Exposure No. of cases Study outcome Comments
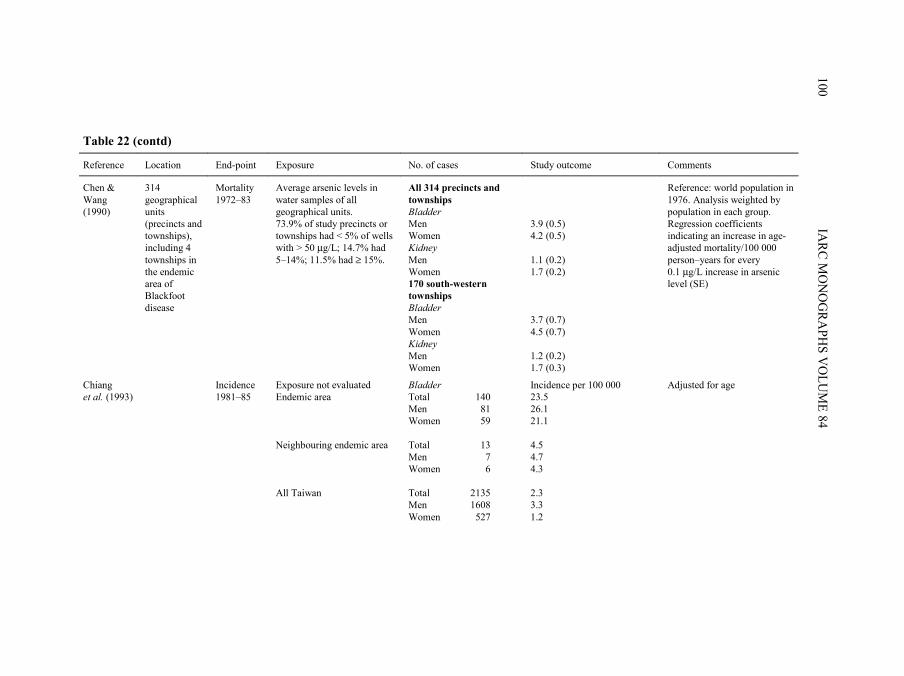
Chen & Wang (1990)
314 geographical units (precincts and townships), including 4 townships in the endemic area of Blackfoot disease
Mortality 1972–83
Average arsenic levels in water samples of all geographical units. 73.9% of study precincts or townships had < 5% of wells with > 50 µg/L; 14.7% had 5–14%; 11.5% had ≥ 15%.
All 314 precincts and townships Bladder Men Women Kidney Men Women 170 south-western townships Bladder Men Women Kidney Men Women
3.9 (0.5) 4.2 (0.5) 1.1 (0.2) 1.7 (0.2) 3.7 (0.7) 4.5 (0.7) 1.2 (0.2) 1.7 (0.3)
Reference: world population in 1976. Analysis weighted by population in each group. Regression coefficients indicating an increase in age-adjusted mortality/100 000 person–years for every 0.1 µg/L increase in arsenic level (SE)
Chiang et al. (1993)
Incidence 1981–85
Exposure not evaluated Endemic area Neighbouring endemic area All Taiwan
Bladder Total Men Women Total Men Women Total Men Women
140 81 59 13 7 6 2135 1608 527
Incidence per 100 000 23.5 26.1 21.1 4.5 4.7 4.3 2.3 3.3 1.2
Adjusted for age
pp97-166.qxd 11/10/2004 10:47 Page 100
ARSEN
IC IN D
RINK
ING
-WATER
101
Table 22 (contd)
Reference Location End-point Exposure No. of cases Study outcome Comments
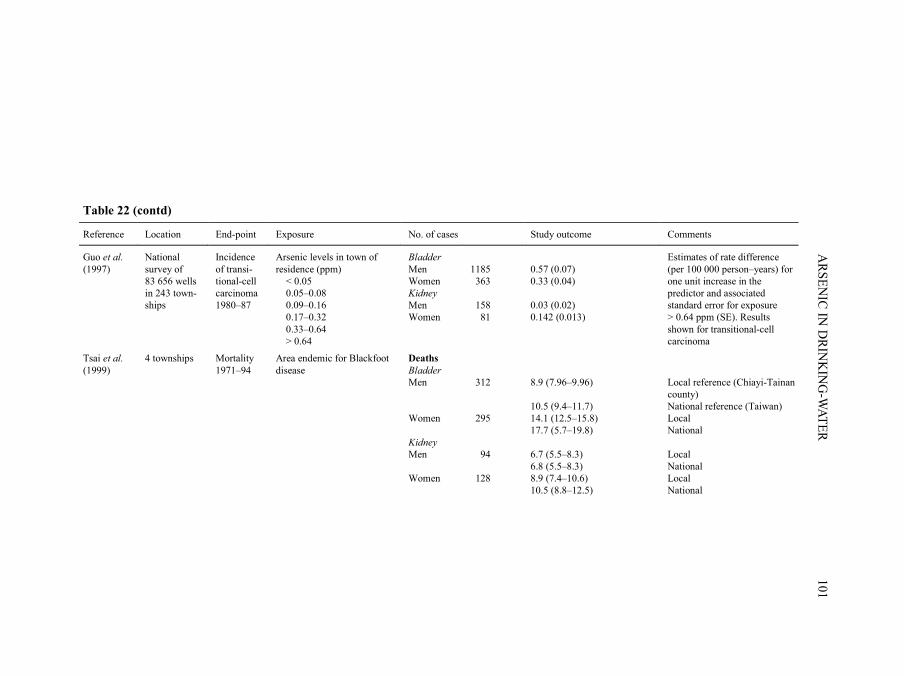
Guo et al. (1997)
National survey of 83 656 wells in 243 town-ships
Incidence of transi-tional-cell carcinoma 1980–87
Arsenic levels in town of residence (ppm) < 0.05 0.05–0.08 0.09–0.16 0.17–0.32 0.33–0.64 > 0.64
Bladder Men Women Kidney Men Women
1185 363 158 81
0.57 (0.07) 0.33 (0.04) 0.03 (0.02) 0.142 (0.013)
Estimates of rate difference (per 100 000 person–years) for one unit increase in the predictor and associated standard error for exposure > 0.64 ppm (SE). Results shown for transitional-cell carcinoma
Tsai et al. (1999)
4 townships Mortality 1971–94
Area endemic for Blackfoot disease
Deaths Bladder Men Women Kidney Men Women
312 295 94 128
8.9 (7.96–9.96) 10.5 (9.4–11.7) 14.1 (12.5–15.8) 17.7 (5.7–19.8) 6.7 (5.5–8.3) 6.8 (5.5–8.3) 8.9 (7.4–10.6) 10.5 (8.8–12.5)
Local reference (Chiayi-Tainan county) National reference (Taiwan) Local National Local National Local National
pp97-166.qxd 11/10/2004 10:47 Page 101
IARC M
ON
OG
RAPH
S VO
LUM
E 84102
Table 22 (contd)
Reference Location End-point Exposure No. of cases Study outcome Comments
South America
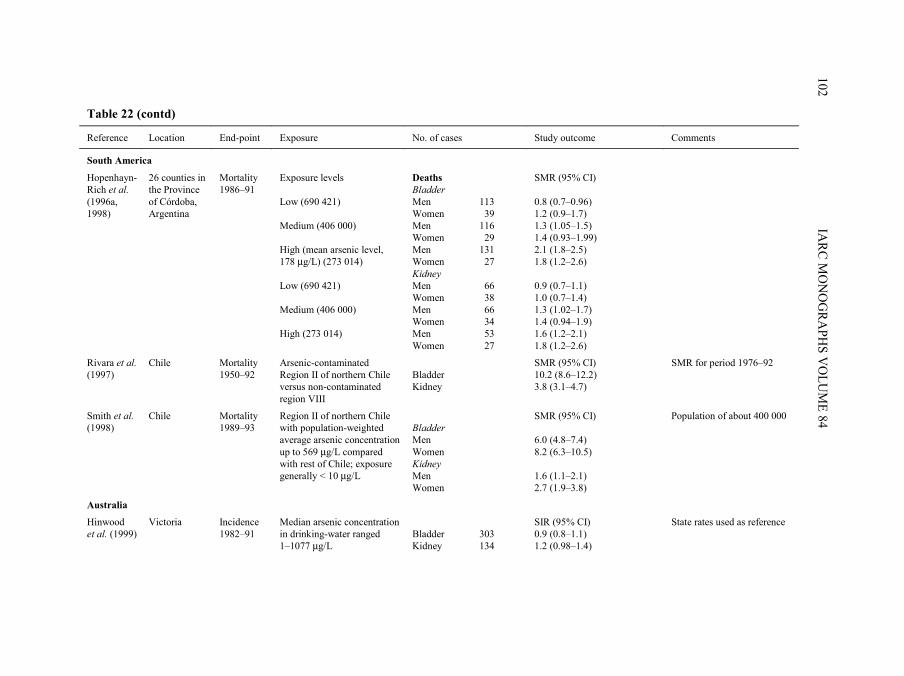
Hopenhayn-Rich et al. (1996a, 1998)
26 counties in the Province of Córdoba, Argentina
Mortality 1986–91
Exposure levels Low (690 421) Medium (406 000) High (mean arsenic level, 178 µg/L) (273 014) Low (690 421) Medium (406 000) High (273 014)
Deaths Bladder Men Women Men Women Men Women Kidney Men Women Men Women Men Women
113 39 116 29 131 27 66 38 66 34 53 27
SMR (95% CI) 0.8 (0.7–0.96) 1.2 (0.9–1.7) 1.3 (1.05–1.5) 1.4 (0.93–1.99) 2.1 (1.8–2.5) 1.8 (1.2–2.6) 0.9 (0.7–1.1) 1.0 (0.7–1.4) 1.3 (1.02–1.7) 1.4 (0.94–1.9) 1.6 (1.2–2.1) 1.8 (1.2–2.6)
Rivara et al. (1997)
Chile Mortality 1950–92
Arsenic-contaminated Region II of northern Chile versus non-contaminated region VIII
Bladder Kidney
SMR (95% CI) 10.2 (8.6–12.2) 3.8 (3.1–4.7)
SMR for period 1976–92
Smith et al. (1998)
Chile Mortality 1989–93
Region II of northern Chile with population-weighted average arsenic concentration up to 569 µg/L compared with rest of Chile; exposure generally < 10 µg/L
Bladder Men Women Kidney Men Women
SMR (95% CI) 6.0 (4.8–7.4) 8.2 (6.3–10.5) 1.6 (1.1–2.1) 2.7 (1.9–3.8)
Population of about 400 000
Australia
Hinwood et al. (1999)
Victoria Incidence 1982–91
Median arsenic concentration in drinking-water ranged 1–1077 µg/L
Bladder Kidney
303 134
SIR (95% CI) 0.9 (0.8–1.1) 1.2 (0.98–1.4)
State rates used as reference
pp97-166.qxd 11/10/2004 10:47 Page 102
ARSEN
IC IN D
RINK
ING
-WATER
103
Table 22 (contd)
Reference Location End-point Exposure No. of cases Study outcome Comments
Case–control studies
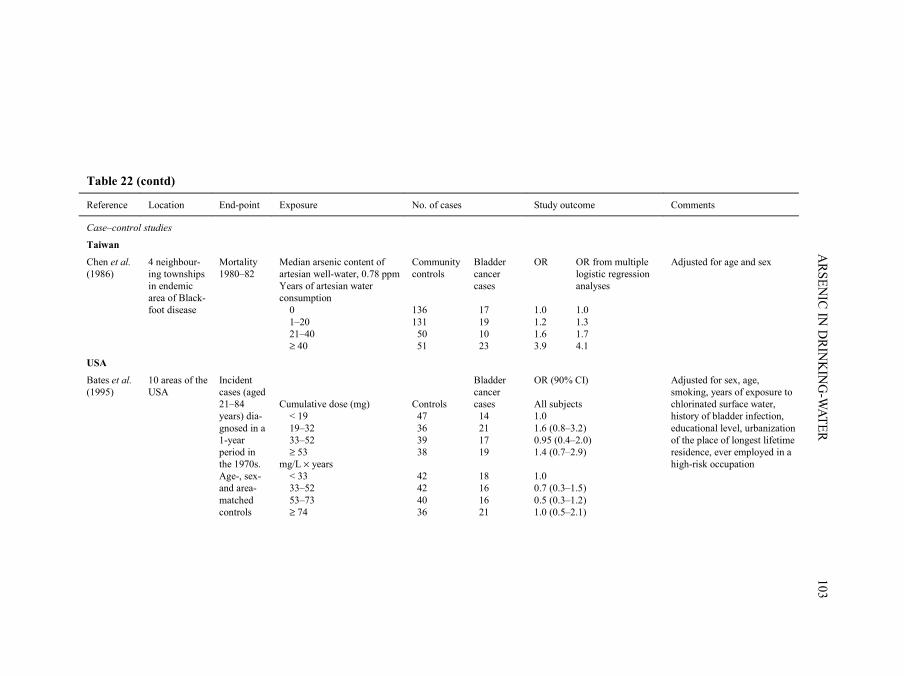
Taiwan
Chen et al. (1986)
4 neighbour-ing townships in endemic area of Black-foot disease
Mortality 1980–82
Median arsenic content of artesian well-water, 0.78 ppm Years of artesian water consumption 0 1–20 21–40 ≥ 40
Community controls 136 131 50 51
Bladder cancer cases 17 19 10 23
OR OR from multiple logistic regression analyses 1.0 1.0 1.2 1.3 1.6 1.7 3.9 4.1
Adjusted for age and sex
USA
Bates et al. (1995)
10 areas of the USA
Incident cases (aged 21–84 years) dia-gnosed in a 1-year period in the 1970s. Age-, sex- and area-matched controls
Cumulative dose (mg) < 19 19–32 33–52 ≥ 53 mg/L × years < 33 33–52 53–73 ≥ 74
Controls 47 36 39 38 42 42 40 36
Bladder cancer cases 14 21 17 19 18 16 16 21
OR (90% CI) All subjects 1.0 1.6 (0.8–3.2) 0.95 (0.4–2.0) 1.4 (0.7–2.9) 1.0 0.7 (0.3–1.5) 0.5 (0.3–1.2) 1.0 (0.5–2.1)
Adjusted for sex, age, smoking, years of exposure to chlorinated surface water, history of bladder infection, educational level, urbanization of the place of longest lifetime residence, ever employed in a high-risk occupation
pp97-166.qxd 11/10/2004 10:47 Page 103
IARC M
ON
OG
RAPH
S VO
LUM
E 84104
Table 22 (contd)
Reference Location End-point Exposure No. of cases Study outcome Comments
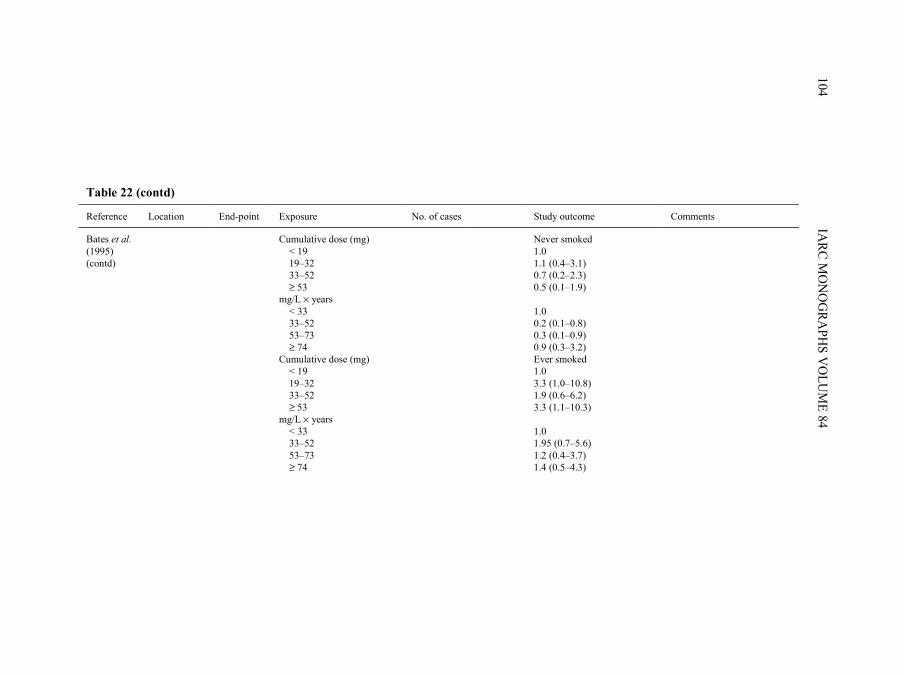
Bates et al. (1995) (contd)
Cumulative dose (mg) < 19 19–32 33–52 ≥ 53 mg/L × years < 33 33–52 53–73 ≥ 74 Cumulative dose (mg) < 19 19–32 33–52 ≥ 53 mg/L × years < 33 33–52 53–73 ≥ 74
Never smoked 1.0 1.1 (0.4–3.1) 0.7 (0.2–2.3) 0.5 (0.1–1.9) 1.0 0.2 (0.1–0.8) 0.3 (0.1–0.9) 0.9 (0.3–3.2) Ever smoked 1.0 3.3 (1.0–10.8) 1.9 (0.6–6.2) 3.3 (1.1–10.3) 1.0 1.95 (0.7–5.6) 1.2 (0.4–3.7) 1.4 (0.5–4.3)
pp97-166.qxd 11/10/2004 10:47 Page 104
ARSEN
IC IN D
RINK
ING
-WATER
105
Table 22 (contd)
Reference Location End-point Exposure No. of cases Study outcome Comments
Europe
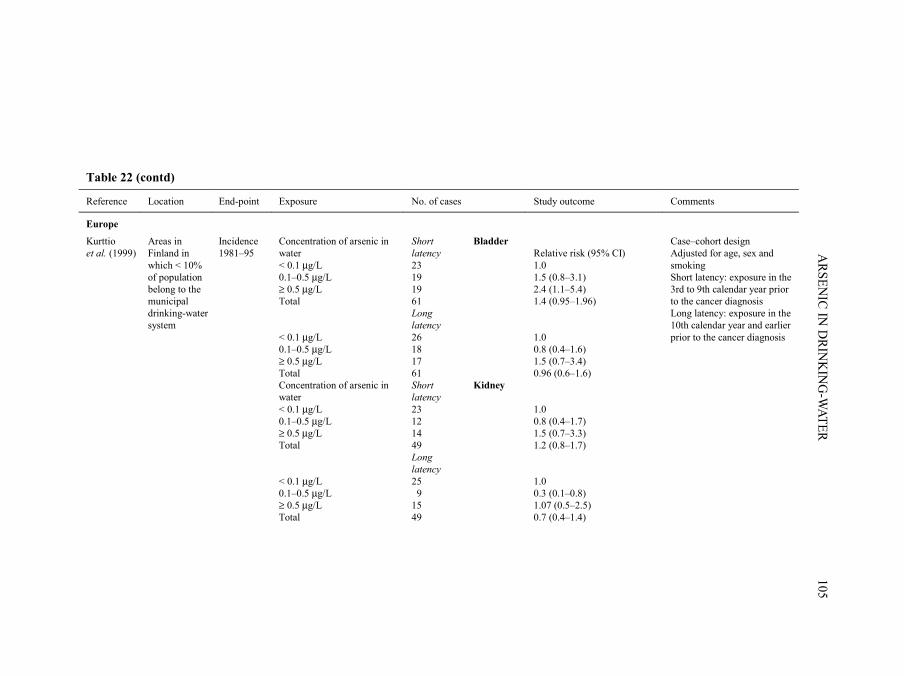
Kurttio et al. (1999)
Areas in Finland in which < 10% of population belong to the municipal drinking-water system
Incidence 1981–95
Concentration of arsenic in water < 0.1 µg/L 0.1–0.5 µg/L ≥ 0.5 µg/L Total < 0.1 µg/L 0.1–0.5 µg/L ≥ 0.5 µg/L Total Concentration of arsenic in water < 0.1 µg/L 0.1–0.5 µg/L ≥ 0.5 µg/L Total < 0.1 µg/L 0.1–0.5 µg/L ≥ 0.5 µg/L Total
Short latency 23 19 19 61 Long latency 26 18 17 61 Short latency 23 12 14 49 Long latency 25 9 15 49
Bladder Kidney
Relative risk (95% CI) 1.0 1.5 (0.8–3.1) 2.4 (1.1–5.4) 1.4 (0.95–1.96) 1.0 0.8 (0.4–1.6) 1.5 (0.7–3.4) 0.96 (0.6–1.6) 1.0 0.8 (0.4–1.7) 1.5 (0.7–3.3) 1.2 (0.8–1.7) 1.0 0.3 (0.1–0.8) 1.07 (0.5–2.5) 0.7 (0.4–1.4)
Case–cohort design Adjusted for age, sex and smoking Short latency: exposure in the 3rd to 9th calendar year prior to the cancer diagnosis Long latency: exposure in the 10th calendar year and earlier prior to the cancer diagnosis
pp97-166.qxd 11/10/2004 10:47 Page 105
IARC M
ON
OG
RAPH
S VO
LUM
E 84106
Table 22 (contd)
Reference Location End-point Exposure No. of cases Study outcome Comments
Cohort studies
Taiwan
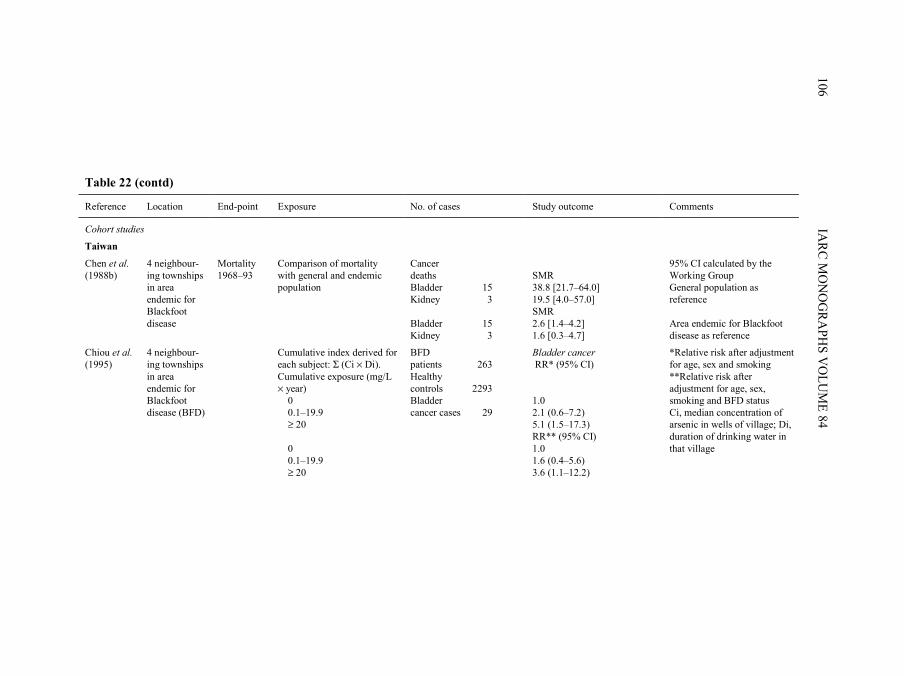
Chen et al. (1988b)
4 neighbour-ing townships in area endemic for Blackfoot disease
Mortality 1968–93
Comparison of mortality with general and endemic population
Cancer deaths Bladder Kidney Bladder Kidney
15 3 15 3
SMR 38.8 [21.7–64.0] 19.5 [4.0–57.0] SMR 2.6 [1.4–4.2] 1.6 [0.3–4.7]
95% CI calculated by the Working Group General population as reference Area endemic for Blackfoot disease as reference
Chiou et al. (1995)
4 neighbour-ing townships in area endemic for Blackfoot disease (BFD)
Cumulative index derived for each subject: Σ (Ci × Di). Cumulative exposure (mg/L × year) 0 0.1–19.9 ≥ 20 0 0.1–19.9 ≥ 20
BFD patients Healthy controls Bladder cancer cases
263 2293 29
Bladder cancer RR* (95% CI) 1.0 2.1 (0.6–7.2) 5.1 (1.5–17.3) RR** (95% CI) 1.0 1.6 (0.4–5.6) 3.6 (1.1–12.2)
*Relative risk after adjustment for age, sex and smoking **Relative risk after adjustment for age, sex, smoking and BFD status Ci, median concentration of arsenic in wells of village; Di, duration of drinking water in that village
pp97-166.qxd 11/10/2004 10:47 Page 106
ARSEN
IC IN D
RINK
ING
-WATER
107
Table 22 (contd)
Reference Location End-point Exposure No. of cases Study outcome Comments
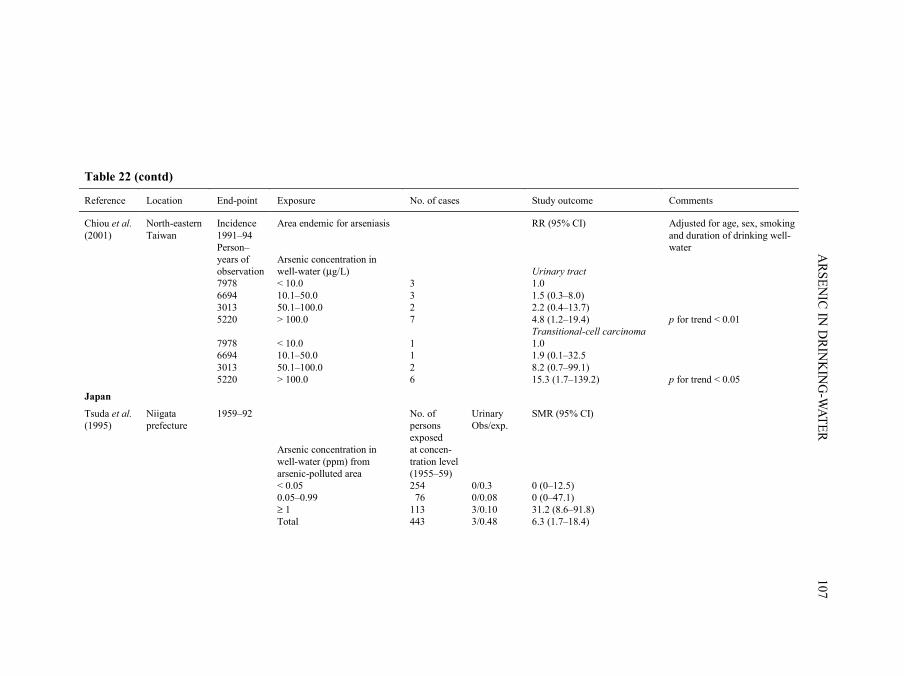
Chiou et al. (2001)
North-eastern Taiwan
Incidence 1991–94 Person–years of observation 7978 6694 3013 5220 7978 6694 3013 5220
Area endemic for arseniasis Arsenic concentration in well-water (µg/L) < 10.0 10.1–50.0 50.1–100.0 > 100.0 < 10.0 10.1–50.0 50.1–100.0 > 100.0
3 3 2 7 1 1 2 6
RR (95% CI) Urinary tract 1.0 1.5 (0.3–8.0) 2.2 (0.4–13.7) 4.8 (1.2–19.4) Transitional-cell carcinoma 1.0 1.9 (0.1–32.5 8.2 (0.7–99.1) 15.3 (1.7–139.2)
Adjusted for age, sex, smoking and duration of drinking well-water p for trend < 0.01 p for trend < 0.05
Japan
Tsuda et al. (1995)
Niigata prefecture
1959–92 Arsenic concentration in well-water (ppm) from arsenic-polluted area < 0.05 0.05–0.99 ≥ 1 Total
No. of persons exposed at concen-tration level (1955–59) 254 76 113 443
Urinary Obs/exp. 0/0.3 0/0.08 3/0.10 3/0.48
SMR (95% CI) 0 (0–12.5) 0 (0–47.1) 31.2 (8.6–91.8) 6.3 (1.7–18.4)
pp97-166.qxd 11/10/2004 10:47 Page 107
IARC M
ON
OG
RAPH
S VO
LUM
E 84108
Table 22 (contd)
Reference Location End-point Exposure No. of cases Study outcome Comments
USA
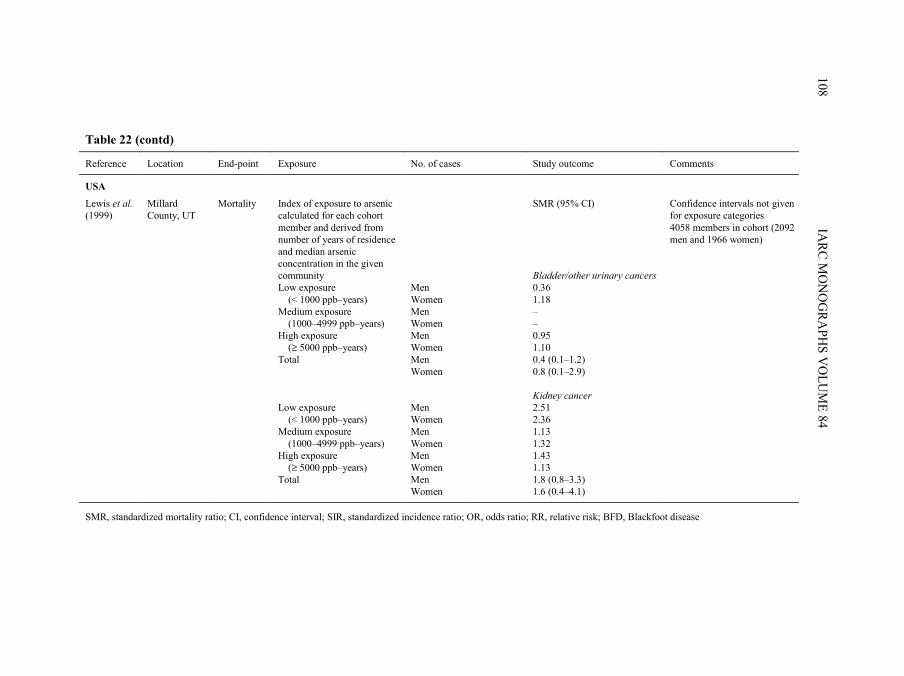
Lewis et al. (1999)
Millard County, UT
Mortality Index of exposure to arsenic calculated for each cohort member and derived from number of years of residence and median arsenic concentration in the given community Low exposure (< 1000 ppb–years) Medium exposure (1000–4999 ppb–years) High exposure (≥ 5000 ppb–years) Total Low exposure (< 1000 ppb–years) Medium exposure (1000–4999 ppb–years) High exposure (≥ 5000 ppb–years) Total
Men Women Men Women Men Women Men Women Men Women Men Women Men Women Men Women
SMR (95% CI) Bladder/other urinary cancers 0.36 1.18 – – 0.95 1.10 0.4 (0.1–1.2) 0.8 (0.1–2.9) Kidney cancer 2.51 2.36 1.13 1.32 1.43 1.13 1.8 (0.8–3.3) 1.6 (0.4–4.1)
Confidence intervals not given for exposure categories 4058 members in cohort (2092 men and 1966 women)
SMR, standardized mortality ratio; CI, confidence interval; SIR, standardized incidence ratio; OR, odds ratio; RR, relative risk; BFD, Blackfoot disease
pp97-166.qxd 11/10/2004 10:47 Page 108
More systematic studies were conducted in various parts of the world, the most exten-sive being in Taiwan, China.
2.1.1 Studies in Taiwan, China
There are two areas in Taiwan, China, where exposure to arsenic is endemic. One islocated in the south-western coastal area where Blackfoot disease, a unique peripheralvascular disease induced by long-term ingestion of arsenic from artesian well-water, isendemic. Eighty-four villages constitute the four Blackfoot disease-endemic townships ofPeimen, Hsuehchia, Putai and Ichu, and artesian wells and patients with Blackfoot diseasewere also found in the two neighbouring townships of Yensui and Hsiaying (Wu et al.,1989). Residents in the south-western endemic areas in Taiwan drank artesian well-waterwith high concentrations of arsenic from the early 1910s to the late 1970s. The concen-trations of arsenic in artesian well-water, tested by Natelson’s method in 1964–66 in 42villages of the six townships, ranged from 10 to 1752 µg/L, and were mostly above100 µg/L (Kuo, 1968; Tseng et al., 1968). As well-water was the only source of drinking-water in the endemic area, all residents of a given village consumed the water from asmall number of shared wells in their daily home and working environments. Mostresidents were engaged in fishing, salt production and farming, and the migration rate waslow. More than 90% of residents had lived in the study area all their lives. As the studypopulation lived in a small area, they shared similar dietary patterns, lifestyle,socioeconomic status and health care facilities. The piped water supply system usingsurface water was first implemented in the south-western endemic area, but its coveragewas not complete until the late 1970s (Wu et al., 1989).
Another area with exposure to arsenic is located in the Lanyang Basin in north-eastern Taiwan (Chiou et al., 2001), and is comprised of four townships: Chiaohsi (fourvillages), Chuangwei (seven villages), Wuchieh (three villages) and Tungshan (fourvillages). Residents in this area of endemic arseniasis used river water for drinking andcooking before the Second World War, and started to use water from tubewells in theirhouses in the late 1940s. The concentrations of arsenic in the water of 3901 wells in theendemic area was tested from 1991 to 1994 by hydride generation combined with flameatomic absorption spectrometry, and ranged from undetectable (< 0.15 µg/L) to 3.59 ng/L,but were mostly between 10 and 100 µg/L, with a median of 27.3 µg/L. A piped watersupply system using surface water was first implemented in the endemic area in late 1997,and its coverage was almost complete in 2001. Residents in the endemic area wereengaged in farming, and most of them had lived in the area all their lives.
(a) Ecological studiesChen et al. (1985) reported an elevation in mortality from cancers of the urinary
bladder and kidney during the period 1968–82 in endemic areas of Blackfoot disease(four neighbouring townships comprising 84 villages) compared with the generalpopulation of Taiwan. The arsenic content of well-water ranged from 0.35 to 1.14 ppm
ARSENIC IN DRINKING-WATER 109
pp97-166.qxd 11/10/2004 10:47 Page 109
[mg/L] with a median of 0.78 ppm, while shallow well-water contained arsenic atconcentrations ranging from 0 to 0.3 ppm with a median of 0.04 ppm (Chen et al., 1962).The SMRs for bladder cancer and kidney cancer increased with the prevalence ofBlackfoot disease. Similarly, the SMRs for cancers of the bladder and kidney were highestin villages where only artesian wells were in use and lowest in those villages usingshallow wells. The high SMRs for bladder and kidney cancer were not readily explainedby the higher rate of cigarette smoking in the Blackfoot disease-endemic area comparedwith all of Taiwan (40% versus 32%).
Chen et al. (1988a) briefly described a dose–response relationship between medianarsenic levels in artesian well-water in the 84 villages studied by Chen et al. (1985) andrates of mortality from bladder cancer. The study period (1973–86) covered 899 811person–years of observation, and exposure was stratified into three categories (< 300,300–590 and ≥ 600 µg/L arsenic) based on concentrations from a survey of over 83 000wells, including 313 townships in all of Taiwan, conducted from 1962 to 1964.
Wu et al. (1989) examined age-adjusted mortality rates for various cancers in an areaof south-western Taiwan that comprised 42 villages in six townships (27 villages studiedby Chen et al. (1988a) and another 15 villages). The arsenic content of the 155 wellssampled, measured in 1964–66, ranged from 10 to 1750 µg/L. The villages were classifiedaccording to median arsenic levels in water into three exposure groups (< 300, 300–590and ≥ 600 µg/L). Death certificates were used to ascertain cause of death during the period1973–86. A dose–response relationship was found with concentration of arsenic in waterfor cancers of the bladder and kidney for both men and women.
Chen and Wang (1990) further investigated cancer mortality rates throughout Taiwanin 1972–83. Of 361 administrative areas, 314 were included in the study followingmeasurements of arsenic contents in well-water in 1974–76. Exposure measurementswere derived from a national water survey of over 83 000 wells throughout Taiwan. About19% of the wells contained levels of arsenic above 50 µg/L, and most of them were innorth-western and south-eastern Taiwan. Indices of urbanization and industrializationwere included in the analysis to adjust for the possible confounding effect of differingsocioeconomic characteristics between the 314 precincts and townships. Mortality datawere used to evaluate 21 malignant neoplasms, using population-weighted regression.Results were presented for increases in mortality per 100 000 that were calculated to occurfor every 0.1-mg/L increase in arsenic concentration in water.
Chiang et al. (1993) showed that the age-adjusted incidence of bladder cancer in theperiod 1981–85 in the Blackfoot disease-endemic area of Taiwan was higher than that ina neighbouring area of Taiwan and in the country as a whole.
Guo et al. (1997) used tumour registry data and the exposure data from the 1974–76nationwide water-quality survey used by Chen and Wang (1990), which included concen-trations of arsenic in drinking-water from 243 townships with about 11.4 million resi-dents. The annual incidence of cancers of the bladder and kidney for townships in1980–87 and subcategories of those cancer diagnoses were regressed against a model thatincluded six variables for the proportion of wells in each of six categories of arsenic
IARC MONOGRAPHS VOLUME 84110
pp97-166.qxd 11/10/2004 10:47 Page 110
concentration in each township. Sex-specific models were adjusted for age and includedan urbanization index and the annual number of cigarettes sold per capita. Regressionmodels were weighted by the total population of each township. A total of 1962 bladder,726 kidney, 170 ureter and 57 urethral cancers were included. The investigators foundassociations of high arsenic concentrations (more than 0.64 ppm) in both sexes withtransitional-cell carcinomas of the bladder, kidney and ureter, and all urethral cancerscombined, but they did not present relative risk estimates.
Tsai et al. (1999) compared mortality in people aged over 40 years in the Blackfootdisease-endemic area of Taiwan with both local and national references for the period1971–94. Greater mortality was found for men and women with cancers of the bladderand kidney.
(b) Case–control studyIn a retrospective case–control study using death certificates from 1980–82, Chen
et al. (1986) examined the relationship between exposure to high concentrations ofarsenic in artesian well-water and mortality from internal malignancies, includingtumours of the bladder (n = 69) in four townships from the Blackfoot disease-endemicarea. Controls (n = 368) were selected by random sampling from the same geographicalareas as the cases and were frequency-matched on age and sex. The response rate was93% for proxies of cases and 92% for matched controls. Adjustment for age, sex and othervariables (smoking, tea drinking, vegetarianism and frequency of consumption of vege-tables and fermented beans) was performed by logistic regression analysis. The resultsindicated increasing trends in odds ratios with increasing duration of intake of artesianwell-water containing arsenic. The highest risks were seen for over 40 years of exposure,with an odds ratio of 4.1 for bladder cancer in a multivariate analysis. Smoking, alcoholconsumption and other potential risk factors evaluated in the study did not confound theassociation between arsenic and cancer.
(c) Cohort studiesChen et al. (1988b) studied the association between arsenic in artesian well-water in
relation to Blackfoot disease and cancer from a multiple risk factor perspective. The studyarea included the four townships in south-western Taiwan where high rates of Blackfootdisease had been described. Levels of arsenic were reported to be high in water, soil andfood, and estimates of ingestion of arsenic by local residents were up to 1 mg per day. Thestudy examined mortality in a cohort of people who had or had since developed Blackfootdisease in 1968, totalling 789 patients and 7578 person–years of observation through1984. Follow-up started in 1968, since this was the year that registration of deaths inTaiwan was computerized and completeness and quality of death certificate registrationwas improved. Mortality of persons who had died (n = 457) and were not lost to follow-up (n = 84) was compared with that of the general population of Taiwan using age- andsex-specific mortality rates from 1968 through 1983. The SMRs for cancers of the bladderand kidney (men and women combined) were 38.8 [95% CI, 21.7–64.0] and 19.5
ARSENIC IN DRINKING-WATER 111
pp97-166.qxd 11/10/2004 10:47 Page 111
[95% CI, 4.0–57.0], respectively. The latter result, however, is based on only three deaths.SMRs were also calculated using all residents in the Blackfoot disease-endemic area,which includes people exposed to arsenic. These much lower SMRs were 2.6 [95% CI,1.4–4.2] for bladder cancer and 1.6 [95% CI, 0.3–4.7] for kidney cancer, indicating thatpatients with Blackfoot disease had somewhat higher rates for these cancers than theresidents in the arsenic-exposed region combined.
Chiou et al. (1995) investigated the relationship between incidence of internal cancersand arsenic in relation to Blackfoot disease in 2256 subjects from 1986 to 1993. Patientswith Blackfoot disease (n = 263) and a referent group of 2293 residents of the same regionwere followed for 7 years. In contrast to many other studies that evaluate mortality,incident cancer was the outcome of interest. Follow-up occurred many years afterexposure to elevated concentrations of arsenic in drinking-water had ended. Informationon exposure to other risk factors was gathered by individual interviews. Several measuresof exposure were evaluated, including average concentration of arsenic in artesian wellsand cumulative exposure to arsenic from drinking artesian well-water. Relative risks werecalculated using Cox’s proportional hazard regression analysis. After controlling for theeffects of age, sex and smoking in the regression analysis, a dose–response relationshipwas observed between exposure to arsenic from drinking well-water and the incidence ofbladder cancer. Patients with Blackfoot disease were found to be at increased risk evenafter adjustment for cumulative exposure to arsenic.
Chiou et al. (2001) studied the incidence of urinary tract cancers among 8102 residentsin the arsenic-endemic area in north-eastern Taiwan from 1991 to 1994. Levels of arsenicin the drinking-water ranged from less than 0.15 µg/L (undetectable) to 3590 µg/L.Exposure for each member of the cohort was assessed by measuring concentrations ofarsenic in the well associated with the individual’s household at one point in time only,although most households had used their current wells for at least 10 years (Chen & Chiou,2001). Using the general population as referent, the standardized incidence ratio (SIR) forbladder cancer was 1.96 (95% CI, 0.9–3.6), while that for kidney cancer was 2.8 (95% CI,1.3–5.4). These results were based on 10 subjects with bladder cancer and nine with kidneycancer. A dose–response relationship was observed between urinary tract cancers,particularly transitional-cell carcinoma, after adjusting for age, sex and smoking.
2.1.2 Studies in Japan
A retrospective cohort study was conducted in a small Japanese population, which,between 1955 and 1959, used well-water contaminated with arsenic from a factoryproducing King’s yellow (As2O3; Tsuda et al., 1995). The levels of arsenic measured in34 of 54 wells tested in the area around the factory ranged from undetectable to3000 µg/L, with 11 wells having levels exceeding 1000 µg/L. A total of 454 residentswere enlisted in the cohort. Death certificates, autopsy records and medical records wereobtained for the period 1 October 1959 to 30 September 1987. Smoking and occupationalhistories were ascertained from residents or close relatives. Expected numbers of deaths
IARC MONOGRAPHS VOLUME 84112
pp97-166.qxd 11/10/2004 10:47 Page 112
were based on sex-, age- and cause-specific mortality in Niigata Prefecture from 1960 to1989. Exposure was grouped into high (≥ 500 µg/L), medium (50–500 µg/L ) and low(< 50 µg/L), based on the arsenic content of the well-water. The SMR for urinary-tractcancer in the high-exposure group was 31.2 (95% CI, 8.6–91.8) based on three observeddeaths versus 0.1 expected. Two of these were deaths from bladder cancer and one fromcancer of the renal pelvis. [Excluding the cancer of the renal pelvis, the SMR for bladdercancer alone would be at least 20.]
2.1.3 Studies in South America
(a) ArgentinaAs early as the beginning of the twentieth century, physicians noted an increase in the
incidence of clinical skin alterations due to arsenic in well-water in certain areas of theProvince of Córdoba, Argentina (Hopenhayn-Rich et al., 1996a). In a study of 2355 deathsin 1949–59 in a highly exposed region, Bergoglio (1964) found that 24% of deaths in theexposed region were due to cancer compared with 15% in the Province of Córdoba. In a14-year follow-up of 116 patients diagnosed with arsenic-related skin lesions, 30.5% diedof cancer, and 12.5% of these deaths were due to cancers of the urinary tract (Biagini,1972). This was later contrasted with bladder cancer mortality in all of Argentina in 1980,with 2.9% of all cancer deaths attributable to bladder cancer (Hopenhayn-Rich et al.,1996a).
These early reports led to an ecological study on bladder cancer mortality for theperiod 1986–91 comparing counties categorized as previously having had high, mediumand low concentrations of arsenic in water in Córdoba, Argentina (Hopenhayn-Rich et al.,1996a). The majority of reported cases of arsenic-related skin lesions were residents oftwo counties that were classified as having high exposure since there were extensivereports of elevated concentrations of arsenic in the water there. The average concentrationof arsenic in water tested in these counties was 178 µg/L. The medium-exposure groupcomprised six counties based on some reports of elevated arsenic levels in the water andthe occurrence of a few cases of skin lesions. The remaining 16 rural counties wereclassified as having low exposure. Clear trends in mortality from bladder cancer wereobserved. Increasing trends were also observed for mortality from kidney cancer as expo-sure to arsenic increased (Hopenhayn-Rich et al., 1998). No differences were foundbetween the exposure groups for chronic obstructive pulmonary disease, suggesting thatthe trends for bladder and kidney cancer were not attributable to confounding by smoking.
(b) ChileChile is a long and narrow country divided into geopolitical units called regions (like
provinces in other countries), which are numbered sequentially from north to south,starting with Region I. Region II is thus located in the northern part of Chile, in an aridzone where the Atacama Desert is situated. At the time of the 1992 Census, the populationin Region II was about 420 000. About 90% of the population live in the cities and towns
ARSENIC IN DRINKING-WATER 113
pp97-166.qxd 11/10/2004 10:47 Page 113
in this Region, and more than half of the population lives in the city of Antofagasta (Smithet al., 1998). In view of the extremely low level of rainfall and the inability to obtain waterfrom wells, each city and town obtains drinking-water from rivers which originate in theAndes mountains, located on the eastern border of the Region. Many of these rivers arenaturally contaminated with inorganic arsenic, some at very high concentrations. This hasresulted in widespread exposure of the population of Region II to varying levels of arsenicin the drinking-water. In 1955–70, the majority of the population of Region II wasexposed to very high levels of arsenic in drinking-water (see Table 17). Prior to 1955, thedrinking-water supply in the main city of Antofagasta had an arsenic concentration ofabout 90 µg/L. A growing population, and the consequent increased need for water, led tosupplementation of the drinking-water supply at Antofagasta with water from the Toconceand Holajar Rivers, which, unknown at the time, had arsenic concentrations of 800 µg/Land 1300 µg/L, respectively. The concentration of arsenic in the drinking-water atAntofagasta, together with that of neighbouring Mejillones, which shared the samesupply, increased to an average of 870 µg/L. As shown in Table 17, the other towns in theregion, with the exception of Taltal, also had high concentrations of arsenic in thedrinking-water for variable periods. The population-weighted average concentration ofarsenic in drinking-water for the entire region was about 580 µg/L over a period ofapproximately 15 years (1955–70). With the introduction in 1970 of a water-treatmentplant, the concentration of arsenic in the water at Antofagasta initially dropped to260 µg/L, and further reductions occurred as a result of improvements to the treatmentplant. At present, levels of arsenic in water in Antofagasta are about 40 µg/L. Other citiesand towns also implemented water-treatment strategies or used alternative sources thatreduced arsenic levels. By the late 1980s, all of the towns with populations over 1000 hadconcentrations of arsenic in drinking-water of less than 100 µg/L, with the exception ofSan Pedro de Atacama (population about 3700, some of whom still drink the contami-nated water). In contrast, most water sources in the rest of Chile have had low concen-trations of arsenic (less than 10 µg/L) (Ferreccio et al., 2000).
Evidence of chronic arsenic toxicity in Region II was noted in the 1960s with theemergence of classic dermatological manifestations (Borgoño & Greiber, 1971; Zaldívar,1974; Zaldívar et al., 1978). In 1969, in a study of 180 residents in Antofagasta, abnormalskin pigmentation was found in 144 of the participants, 43.7% of whom also had hyper-keratoses (Borgoño et al., 1977). Evidence of effects on the respiratory and cardiovascularsystem, together with skin lesions, was also reported by Zaldívar et al. (1978), whoconducted a series of studies concerning the effects of arsenic in Antofagasta during thehigh-exposure period.
Two ecological mortality studies were conducted on kidney and bladder cancer inRegion II. Rivara et al. (1997) conducted a study comparing mortality for both sexes com-bined in Region II with that in Region VIII for the period 1950–92. SMRs for bladdercancer and kidney cancer were 10.2 (95% CI, 8.6–12.2) and 3.8 (95% CI, 3.1–4.7),respectively.
IARC MONOGRAPHS VOLUME 84114
pp97-166.qxd 11/10/2004 10:47 Page 114
Smith et al. (1998) also investigated cancer mortality in Region II for the years1989–93, using mortality rates in the rest of Chile (excluding Region II) in 1992, a censusyear, for reference. SMRs were calculated for men and women over the age of 30 years,using 10-year age groupings. The results indicated marked increases in mortality frombladder cancer and kidney cancer in Region II. Data on smoking obtained from a nationalsurvey of stratified random samples carried out in 1990, comparing the two largest citiesof Antofagasta and Calama with the rest of Chile, were included. No overall increases inmortality from chronic obstructive pulmonary disease were observed in Region II: theSMR for men was 1.0 (0.8–1.1) and mortality among women was lower than expected(SMR, 0.6; 0.4–0.7). In addition, not only did the national survey not find higher rates ofsmoking in Region II, but in Antofagasta, 76.4% of respondents reported being non-smokers at that time compared with 75.1% of respondents in the rest of Chile. The pro-portion of people who smoked more than one pack per day was lower in Antofagasta(0.8%) and Calama (1.1%) than in the rest of Chile (1.5%). The SMRs for other causesof death excluding cancers of the bladder, kidney, lung, liver and skin were 1.0 (95% CI,0.99–1.05) for men and 1.0 (95% CI, 0.97–1.03) for women.
2.1.4 Studies in the USA
Some ecological studies have been reported in the USA but they are not informativein view of the relatively small contrasts in exposure between counties.
(a) Case–control studyBates et al. (1995) linked 71 cases of bladder cancer and 160 controls from a sub-
sample of residents of Utah from the large national bladder cancer study conducted in1978 (Cantor et al., 1987) to levels of arsenic in water supplies. Exposures ranged from0.5 to 160 µg/L, but most concentrations were very low, with only 1.1% of sampleshaving concentrations greater than 50 µg/L. The findings did not provide evidence for anoverall increase in the incidence of bladder cancer with the two indices of exposure used.However, among smokers only, there was an increase in risk for the highest category ofcumulative dose of arsenic.
(b) Cohort studyLevels of arsenic in drinking-water and mortality were investigated in a cohort of
members of the Church of Jesus Christ of Latter-day Saints in Millard County, UT (Lewiset al., 1999). The cohort was assembled from an earlier study that consisted of 2073 parti-cipants (Southwick et al., 1983). Most of these individuals had a history of at least 20 yearsof exposure in their respective places of residence. The cohort was expanded to include allpersons who lived for any length of time in the study area, resulting in a total combinedcohort of 4058 members. More than 70% of the cohort had reached the age of 60 years atthe end of the follow-up period or by the time of their deaths. Approximately 7% of thecohort was lost to follow-up. Arsenic concentrations in the drinking-water supplies were
ARSENIC IN DRINKING-WATER 115
pp97-166.qxd 11/10/2004 10:47 Page 115
based on measurements maintained by the state of Utah dating back to 1964. The mediandrinking-water concentrations ranged from 14 to 166 ppb [µg/L], with wide variability ineach town. An index of exposure to arsenic was calculated from the number of years ofresidence and the median concentration of arsenic in drinking-water in a given community,and was categorized as low (< 1000 ppb–years), medium (1000–4999 ppb–years) and high(> 5000 ppb–years). Data on confounding factors were not available; however, Churchmembers are prohibited from using tobacco and consuming alcohol or caffeine. SMRs forkidney cancer were increased in the low- and high-exposure groups among men and in thelow- and medium-exposure groups among women. The overall SMRs for cancers of thebladder and other urinary organs were below unity for both sexes, but these results werebased on only three and two bladder cancers in men and women, respectively. [TheWorking Group noted that there were several problems in the interpretation of this study.The exposure assessment was ecological in nature because of relatively low exposures.There was widespread variability in water concentrations, which adds to the uncertainty ofthe study. Furthermore, the findings are influenced by lower rates of smoking for the cohortcompared with all of Utah. This is manifest in the SMRs for non-malignant respiratorydisease (SMR for men, 0.7; 95% CI, 0.5–0.9; SMR for women, 0.9; 95% CI, 0.7–1.2) andfor mortality from chronic bronchitis, emphysema and asthma (SMR for men, 0.6; 95% CI,0.4–0.9; SMR for women, 0.5; 95% CI, 0.1–1.2). For these reasons, the study is uninfor-mative with regard to the relationship between exposure to arsenic and mortality frombladder and kidney cancer.]
2.1.5 Studies in Europe
In a type of case–control study known as case–cohort, Kurttio et al. (1999) investigatedthe association between low exposure to arsenic in well-water in Finland and the risk forcancers of the bladder and kidney. Cases of bladder and kidney cancer were identified from1981 to 1995 within a registry-based cohort of the population who had lived at an addressoutside the municipal drinking-water system during 1967–80. The final study populationconsisted of 61 cases of bladder cancer and 49 cases of kidney cancer and an age- and sex-matched random sample of 275 subjects from the population register. The daily dose ofarsenic in drinking-water was calculated from the concentration of arsenic in well-waterand its reported consumption in the 1970s. Cumulative dose was defined as the integral ofduration and intensity of exposure to arsenic from well-water. For the shorter latencyperiod of 3–9 years prior to diagnosis of bladder cancer, cumulative dose was estimatedfrom the beginning of use of well-water until 2 years before the diagnosis of cancer. Forthe longer latency period, the cumulative dose was calculated until 10 years beforediagnosis. The concentrations of arsenic in the wells of the reference cohort ranged fromless than 0.05 to 64 µg/L (median, 0.14 µg/L). After adjusting for age, sex and smoking, anincreasing trend of arsenic in drinking-water and incidence of bladder cancer was observedwith shorter latency but not with longer latency, whereas no evidence of an associationbetween kidney cancer and arsenic in well-water was observed.
IARC MONOGRAPHS VOLUME 84116
pp97-166.qxd 11/10/2004 10:47 Page 116
2.1.6 Studies in Australia
Two geographical areas in Victoria, Australia, were selected for study because ofreports of concentrations of arsenic in the soil above 100 µg/g and/or concentrations inwater above 10 µg/L (Hinwood et al., 1999). Median concentrations of arsenic in waterwere reported for various towns and showed a wide range up to a median of 1077 µg/Lfor Ballarat, which had a population of 43 947 in 1986. However, the extent to which con-taminated water was used for drinking was not known. The authors noted that “highpercentages of the population may be relying on alternative drinking-water sources suchas bottled water and tank rain water”. Cancer incidence was assessed for the period1982–91 using the Victorian Cancer Registry. SIRs were estimated for the exposed popu-lation in 22 areas of Victoria, using cancer incidence rates for all of the State of Victoriaas reference. SIRs for both bladder and kidney cancers were close to unity. [The WorkingGroup noted that no information was presented on the actual use of water contaminatedwith arsenic for drinking by the population.]
2.2 Liver and lung cancer
2.2.1 Liver cancer
A previous IARC monograph on arsenic noted reports of liver angiosarcoma due tomedicinal exposure to Fowler’s solution (IARC, 1980). A summary of the findings of epi-demiological studies on arsenic in drinking-water and risk for liver cancer, mainly hepato-carcinoma, are shown in Table 23.
(a) Taiwan, China(i) Ecological studies
Chen et al. (1985) studied the mortality from liver cancer during the period 1968–82among residents in 84 villages exposed to arsenic of four townships in south-westerncoastal Taiwan. Increased mortality was observed among both men and women. There wasan exposure–response relationship between SMR and prevalence of Blackfoot disease. Anexposure–response gradient for mortality from liver cancer was noted in evaluating the riskin areas with shallow wells (presumably with low exposure to arsenic), both shallow andartesian wells (intermediate exposure) and artesian wells only (highest exposure). Invillages with artesian wells, the SMR was approximately 2.0 [CI not reported] for livercancer.
Chen et al. (1988a) and Wu et al. (1989) reported the age-adjusted mortality rates forliver cancer for men and women in 42 villages in south-western Taiwan and calculatedage-adjusted cancer mortality during the period 1973–86 within three groups of villagesstratified by exposure concentration (< 300 µg/L, 300–590 µg/L and ≥ 600 µg/L arsenic)tested in 1964–66. Age-adjusted mortality rates (per 100 000 person–years) from livercancer for residents of all ages in Taiwan (referent) increased with increasing concen-
ARSENIC IN DRINKING-WATER 117
pp97-166.qxd 11/10/2004 10:47 Page 117
IARC M
ON
OG
RAPH
S VO
LUM
E 84118
Table 23. Summary of epidemiological studies on arsenic in drinking-water and risk for liver cancer
Reference Location End-point Exposure No. of cases Study outcome Comments
Ecological studies
Taiwan
Chen et al. (1985)
84 villages on the SW coast
Mortality 1968–82, all ages
Endemic area for chronic arsenic toxicity (Blackfoot disease)
Men Women
305 146
Age- and sex-adjusted SMR (95% CI) 1.7 (1.5–1.9) 2.3 (1.9–2.7)
Mid-year population: 141 733 in 1968, 120 607 in 1982; national rate in 1968–82 used as the standard for estimation of SMR
Chen et al. (1988a)
42 villages on the SW coast
Mortality 1973–86, all ages
Average arsenic (1962–64) General population < 300 µg/L 300–590 µg/L ≥ 600 µg/mL General population < 300 µg/L 300–590 µg/L ≥ 600 µg/mL
Men Women
Age-adjusted SMR 28.0 32.6 42.7 68.8 8.9 14.2 18.8 31.8
899 811 person–years, rate per 100 000, age-standardized to 1976 world population
Wu et al. (1989)
42 villages on the SW coast
Mortality 1973–86, age ≥ 20
Average arsenic (1962–64) < 300 µg/L 300–590 µg/L ≥ 600 µg/mL < 300 µg/L 300–590 µg/L ≥ 600 µg/mL
Men Women
54 42 27 25 16 10
47.8 67.7 86.7 p for trend < 0.05 21.4 24.2 31.8 p for trend < 0.05
Men, 257 935 person–years; women, 234 519 person–years; rate per 100 000, age-standardized to 1976 world population
pp97-166.qxd 11/10/2004 10:47 Page 118
ARSEN
IC IN D
RINK
ING
-WATER
119
Table 23 (contd)
Reference Location End-point Exposure No. of cases Study outcome Comments
Chen & Wang (1990)
Taiwan Mortality 1972–83, all ages
National survey of 83 656 wells (1974–76); average arsenic for each of 314 precincts or townships
Men Women Men Women
β (SE) from regression 6.8 (1.3) 2.0 (0.5) Percentiles of age-adjusted mortality rate/100 000 person–years 25th 21.8 50th 27.0 75th 34.1 25th 7.0 50th 8.7 75th 11.6
Regression coefficient (β) estimates increase in age-adjusted mortality per 100 000 per 100 µg/L arsenic increase in water
Tsai et al. (1999)
SW Taiwan, 4 townships
Mortality 1971–94, all ages
Arsenic-exposed area Men Women
631 224
SMR (95% CI) 1.8 (1.7–1.98) 1.9 (1.6–2.1)
Men, 1 508 623 person–years; women, 1 404 759 person–years; national rates in 1971–94 used as the standard for estimation of SMR
South America
Rivara et al. (1997)
Region II and VIII, northern Chile
Mortality 1976–92
Arsenic-contaminated Region II
Relative risk 1.2 (0.99–1.6)
Population: 411 000 in Region II, 1 700 000 in Region VIII. Antofagasta (Region II) versus Region VIII.
Hopenhayn-Rich et al. (1998)
Córdoba Province, Argentina, 26 counties
Mortality 1986–91, age ≥ 20
County group Men Low exposure (341 547) Medium exposure (201 546) High exposure (135 209)
186 142 98
SMR 1.5 (1.3–1.8) 1.8 (1.5–2.1) 1.8 (1.5–2.2)
National rate in 1989 used as the standard for estimation of SMR
Women Low exposure (348 874) Medium exposure (204 454) High exposure (137 805)
173 125 90
1.7 (1.4–1.96) 1.9 (1.6–2.2) 1.9 (1.5–2.4)
pp97-166.qxd 11/10/2004 10:47 Page 119
IARC M
ON
OG
RAPH
S VO
LUM
E 84120
Table 23 (contd)
Reference Location End-point Exposure No. of cases Study outcome Comments
Smith et al. (1998)
Region II, Northern Chile
Mortality 1989–93, age ≥ 30
5-year intervals, 420 µg/L average
Men Women
48 37
SMR 1.1 (0.8–1.5) 1.1 (0.8–1.5)
National rates in 1991 used as the standard estimation of SMR; arsenic concentration is population-weighted average for major cities or towns in Region II, 1950–74
Australia
Hinwood et al. (1999)
Victoria Incidence 1982–91
Median concentration of arsenic in drinking-water ranged 1–1077 µg/L
749
SIR (95% CI) 0.5 (0.3–0.8)
State rates in 1982–91 used as the standard for estimation of SIR
Cohort studies
Chen et al. (1988b)
SW Taiwan Mortality Area endemic for Blackfoot disease
17 SMR: 4.66 (p < 0.001) compared with national standard; 2.48 (p < 0.01) compared with regional standard
789 patients with Blackfoot disease followed from 1968 to 1984. National and regional rates in 1968–83 used as the standard for estimation of SMR
Tsuda et al. (1995)
Niigata Prefecture, Japan
Mortality, 1959–92, all ages
Level of arsenic < 0.05 mg/L 0.05–0.99 mg/L ≥ 1.0 mg/L Total
0 0 2 2
SMR 0.0 (0–4.4) 0.0 (0–15.1) 7.2 (1.3–26.1) 1.5 (0.3–5.5)
113 persons who drank from industrially contaminated wells in 1955–59, then followed for 33 years; rates in Niigata Prefecture in 1960–89 used as the standard for estimation of SMR
Lewis et al. (1999)
Millard County, UT, USA
Mortality Arsenic in well-water ranged 3.5–620 µg/L
Men Women
3 7
SMR 0.9 (0.2–2.5) 1.4 (0.6–2.9)
State rates in 1950–92 used as the standard for estimation of SMR.
Nakadaira et al. (2002)
Niigata Prefecture, Japan
Mortality Industrially contaminated well-water in the town of Nakajo
1 O/E = 0.7 86 patients with chronic arsenic poisoning. National rates in 1959–92 used as the standard for estimation of SMR
pp97-166.qxd 11/10/2004 10:47 Page 120
ARSEN
IC IN D
RINK
ING
-WATER
121
Table 23 (contd)
Reference Location End-point Exposure No. of cases Study outcome Comments
Case–control study
Chen et al. (1986)
SW Taiwan, 4 townships
Mortality Duration of consumption of artesian well-water containing high levels of arsenic
65 cases 368 controls
Age- and gender-adjusted ORs by years of consuming high-arsenic artesian well-water: Never 1.00 1–20 years 0.85 21–40 years 1.24 > 40 years 2.67
ORs calculated using subjects who never consumed artesian well-water as referent Mantel-Haenszel χ2 value: 9.01 (p < 0.01)
SMR, standardized mortality ratio; CI, confidence interval; SIR, standardized incidence ratio; O/E, observed/expected; OR, odds ratio
pp97-166.qxd 11/10/2004 10:47 Page 121
trations of arsenic in water for both men and women in the first study (Chen et al., 1988a),as well as for residents aged 20 years or older in the second study (Wu et al., 1989).
Chen and Wang (1990) analysed nationwide cancer mortality in Taiwan usingmeasurements of arsenic concentrations in water from 83 656 wells located in 314precincts and townships from 1974 to 1976. Using a multiple regression approach, theauthors compared age-adjusted mortality for all ages during the period 1972–83 witharsenic concentrations in these locations. A significant association with concentration ofarsenic was found for liver cancer in both men and women. Using multiple linearregression models, a regression coefficient indicating the change in age-adjusted morta-lity per 100 000 person–years for every 0.1 µg/L increase in arsenic in well-water wascalculated, after adjusting for indices of industrialization and urbanization.
Tsai et al. (1999) studied mortality from liver cancer in four townships exposed toarsenic in south-western Taiwan during the period 1971–94. SMRs were calculated usingtwo comparison groups: mortality in the whole of Taiwan and mortality in the twocounties in which the four townships are located. Although differences in nutrition, socio-economic status or other factors between populations in south-western Taiwan and theremainder of the country may influence their respective cancer rates, Tsai et al. (1999)provided evidence that such differences are relatively unimportant. SMRs in both men andwomen, using both regional and national references, were all close to 1.8.
(ii) Case–control studyChen et al. (1986) carried out a case–control study on liver cancer and consumption
of artesian well-water with high concentrations of arsenic in four townships of south-western Taiwan. A total of 65 cases of liver cancer, identified from death certificates, and368 healthy controls were studied. Information on consumption of arsenic-contaminatedartesian well-water, cigarette smoking, habitual alcohol and tea drinking, and consump-tion of vegetables and fermented beans was obtained through interview using a standar-dized questionnaire. Unconditional logistic regression was used to estimate multivariate-adjusted odds ratios for developing liver cancer and various risk factors. There was anexposure–response relationship between the duration of consumption of artesian well-water with high arsenic content and risk for liver cancer.
(b) JapanCohort study
Tsuda et al. (1995) found excess mortality from liver cancer among a cohort of 113persons exposed to levels of arsenic above 1.0 mg/L from industrially contaminateddrinking-water in villages of Niigata Prefecture, Japan. The expected number of deaths wasbased on sex-, age- and cause-specific mortality in Niigata Prefecture in 1960–89. Basedon a subgroup of 86 study patients, Nakadaira et al. (2002) did not find excess mortalityfrom liver cancer (SMR, 0.7 [95% CI, 0.02–3.9]; one case observed and 1.42 expected).[The small number of liver cancer deaths limited further analysis by severity of chronicarsenic poisoning.] [See complete comment by the Working Group in Section 2.1.2.]
IARC MONOGRAPHS VOLUME 84122
pp97-166.qxd 11/10/2004 10:47 Page 122
(c) Australia Hinwood et al. (1999) investigated the association between arsenic in drinking-water
and liver cancer incidence in Victoria, Australia, in 1982–91. This study included 22 areaswhere the median arsenic concentration in drinking-water ranged from 14 to 166 µg/L.Using the incidence rate in Victoria, an SIR of 0.5 (95% CI, 0.3–0.8) was observed forliver cancer. [The small number of liver cancer deaths limited further analysis by severityof chronic arsenic poisoning.]
(d) South AmericaEcological studies
Rivara et al. (1997) compared the mortality from liver cancer in Antofagasta inRegion II with that in Region VIII of Chile in 1976–92. The relative risk for liver cancerwas 1.2 (95% CI, 0.99–1.6) in arsenic-exposed Region II compared with the control area,Region VIII. [The data source and statistical analysis were not clearly described.]
Smith et al. (1998) examined liver cancer mortality during the period 1989–93 amongpersons 30 years of age and over in Region II of northern Chile. Concentrations of arsenicin drinking-water were well documented and had been high in all major populationcentres of Region II, especially before 1975. The population-weighted average in theyears 1950–74 was 420 µg/L, with a maximum of 870 µg/L in Antofagasta, the largestcity, between 1955 and 1969. SMRs for Region II were calculated using the national rateas the standard, and for liver cancer, were 1.1 for both men and women.
Hopenhayn-Rich et al. (1998) examined SMRs for liver cancer during the period1986–91 among residents aged 20 years or older in the 26 counties of Córdoba Province,Argentina. They grouped counties into three strata according to the concentration ofarsenic in drinking-water. The low- and intermediate-exposure groups were defined quali-tatively. In the highest exposure group comprising two counties, the concentration ofarsenic in drinking-water ranged from 40 to 433 µg/L in the towns of one county and from50 to 353 µg/L in those of the other. Separate average concentrations in each county were181 and 174 µg/L. SMRs were calculated using sex- and age-specific rates for Argentinaas the referent. Increased mortality from liver cancer was observed for men and women,but SMRs were not related to exposure to arsenic.
(e) USACohort study
Lewis et al. (1999) reported the association between arsenic in drinking-water andmortality from liver cancer in a cohort of residents of Millard County, UT, where themedian concentration of arsenic in drinking-water ranged from 14 to 166 µg/L. [Thelimitations of this study are cited in Section 2.1.4.]
ARSENIC IN DRINKING-WATER 123
pp97-166.qxd 11/10/2004 10:47 Page 123
2.2.2 Lung cancer
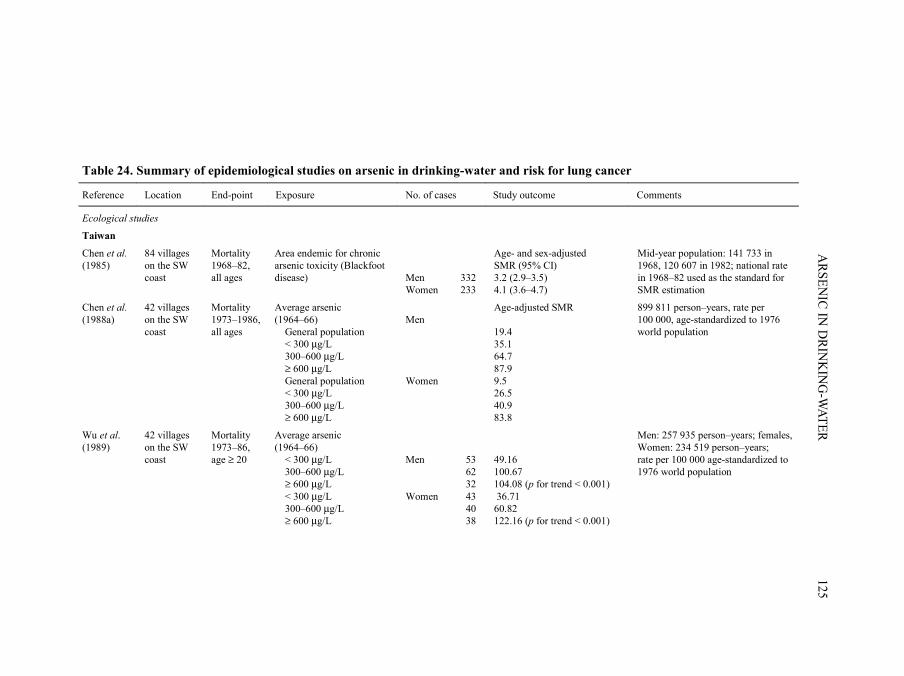
A summary of the findings of epidemiological studies on arsenic in drinking-waterand risk for lung cancer are shown in Table 24.
(a) Taiwan, China(i) Ecological studies
In the study of Chen et al. (1985) (described in Section 2.1), increased mortality fromlung cancer was observed among men and women in 1968–82 in an area endemic forBlackfoot disease. There was an exposure–response relationship between the SMR andthe prevalence of Blackfoot disease. The exposure–response gradient for mortality fromlung cancer was noted in evaluating the risk in areas with shallow wells (presumably withlow exposure to arsenic), both shallow and artesian wells (intermediate exposure) andartesian wells only (highest exposure). In villages with artesian wells, SMRs wereapproximately 5.0 [CIs not reported] for lung cancer.
In the studies of Chen et al. (1988a) and Wu et al. (1989) (described in Section 2.1),age-adjusted mortality rates (per 100 000 person–years) from lung cancer increased withincreasing concentrations of arsenic in water for both men and women, for residents of allages in Taiwan (referent) (Chen et al., 1988a), as well as for residents aged 20 years orolder (Wu et al., 1989).
In the analysis of Chen and Wang (1990) (described in Section 2.1.1), regressioncoefficients (SE) for lung cancer showed a significant association with concentration ofarsenic for lung cancer in both men and women.
In the study of Tsai et al. (1999) (described in Section 2.1.1) using national andregional rates as standard, SMRs for lung cancer were also increased for both sexes.
(ii) Cohort studyChiou et al. (1995) (described in Section 2.1.1) followed 2556 subjects in an area
endemic for Blackfoot disease of south-western Taiwan for periods ranging up to approxi-mately 7 years from 1986 to 1993, including 263 patients with Blackfoot disease and 2293healthy individuals. Results, adjusted for cigarette smoking habits, showed an increasedrisk for lung cancer in relation to increasing average concentrations of arsenic and toincreasing cumulative exposure to arsenic.
(iii) Case–control studyChen et al. (1986) (described in Section 2.1.1) studied a total of 76 cases of lung
cancer and 368 healthy controls and observed a dose–response relationship between theduration of consumption of artesian well-water containing high levels of arsenic and riskfor lung cancer, showing the highest age- and gender-adjusted odds ratio for those whoconsumed artesian well-water for more than 40 years compared with those who neverconsumed artesian well-water.
IARC MONOGRAPHS VOLUME 84124
pp97-166.qxd 11/10/2004 10:47 Page 124
ARSEN
IC IN D
RINK
ING
-WATER
125
Table 24. Summary of epidemiological studies on arsenic in drinking-water and risk for lung cancer
Reference Location End-point Exposure No. of cases Study outcome Comments
Ecological studies
Taiwan
Chen et al. (1985)
84 villages on the SW coast
Mortality 1968–82, all ages
Area endemic for chronic arsenic toxicity (Blackfoot disease)
Men Women
332 233
Age- and sex-adjusted SMR (95% CI) 3.2 (2.9–3.5) 4.1 (3.6–4.7)
Mid-year population: 141 733 in 1968, 120 607 in 1982; national rate in 1968–82 used as the standard for SMR estimation
Chen et al. (1988a)
42 villages on the SW coast
Mortality 1973–1986, all ages
Average arsenic (1964–66) General population < 300 µg/L 300–600 µg/L ≥ 600 µg/L General population < 300 µg/L 300–600 µg/L ≥ 600 µg/L
Men Women
Age-adjusted SMR 19.4 35.1 64.7 87.9 9.5 26.5 40.9 83.8
899 811 person–years, rate per 100 000, age-standardized to 1976 world population
Wu et al. (1989)
42 villages on the SW coast
Mortality 1973–86, age ≥ 20
Average arsenic (1964–66) < 300 µg/L 300–600 µg/L ≥ 600 µg/L < 300 µg/L 300–600 µg/L ≥ 600 µg/L
Men Women
53 62 32 43 40 38
49.16 100.67 104.08 (p for trend < 0.001) 36.71 60.82 122.16 (p for trend < 0.001)
Men: 257 935 person–years; females, Women: 234 519 person–years; rate per 100 000 age-standardized to 1976 world population
pp97-166.qxd 11/10/2004 10:47 Page 125
IARC M
ON
OG
RAPH
S VO
LUM
E 84126
Table 24 (contd)
Reference Location End-point Exposure No. of cases Study outcome Comments
Chen & Wang (1990)
Taiwan Mortality 1972–83, all ages
National survey of 83 656 wells (1974–76); average arsenic for each of 314 precincts or townships
Men Women Men Women
β (SE) from regression 5.3 (0.9) 5.3 (0.7) Percentiles of age-adjusted mortality rate/100 000 person–years 25th 11.8 50th 16.2 75th 20.7 25th 5.2 50th 7.4 75th 10.4
Regression coefficient (β) estimates increase in age-adjusted mortality per 100 000 per 100 µg/L arsenic increase in water
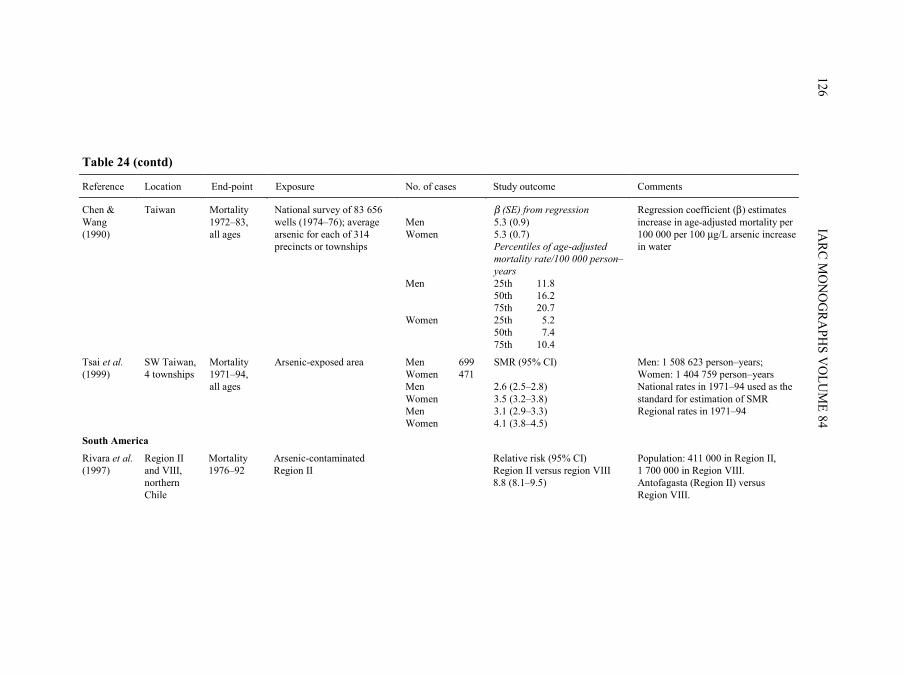
Tsai et al. (1999)
SW Taiwan, 4 townships
Mortality 1971–94, all ages
Arsenic-exposed area Men Women Men Women Men Women
699 471
SMR (95% CI) 2.6 (2.5–2.8) 3.5 (3.2–3.8) 3.1 (2.9–3.3) 4.1 (3.8–4.5)
Men: 1 508 623 person–years; Women: 1 404 759 person–years National rates in 1971–94 used as the standard for estimation of SMR Regional rates in 1971–94
South America
Rivara et al. (1997)
Region II and VIII, northern Chile
Mortality 1976–92
Arsenic-contaminated Region II
Relative risk (95% CI) Region II versus region VIII 8.8 (8.1–9.5)
Population: 411 000 in Region II, 1 700 000 in Region VIII. Antofagasta (Region II) versus Region VIII.
pp97-166.qxd 11/10/2004 10:47 Page 126
ARSEN
IC IN D
RINK
ING
-WATER
127
Table 24 (contd)
Reference Location End-point Exposure No. of cases Study outcome Comments
Hopenhayn-Rich et al. (1998)
Córdoba Province, Argentina, 26 counties
Mortality 1986–91, age ≥ 20
County group: Low exposure Medium exposure High exposure Low exposure Medium exposure High exposure
Men Women
826 914 708 194 138 156
0.92 (0.85–0.98) 1.5 (1.4–1.6) 1.8 (1.6–1.9) 1.2 (1.1–1.4) 1.3 (1.1–1.6) 2.2 (1.8–2.5)
Population: low exposure, 341 547, medium exposure, 201 006; high exposure, 135 209; national rate in 1989 used as the standard for SMR estimation
Smith et al. (1998)
Region II, northern Chile
Mortality 1989–93, age ≥ 30
5-year intervals, 420 µg/L average
Men Women
544 154
SMR 3.8 (3.5–4.1) 3.1 (2.7–3.7)
National rates in 1991 used as the standard for estimation of SMR; arsenic concentration is population- weighted average for major cities or towns in Region II, 1950–74
Australia
Hinwood et al. (1999)
Victoria Incidence 1982–91
Median arsenic concentration in drinking-water ranging 1–1077 µg/L
20 SIR (95% CI) 1.0 (0.9–1.1)
State rates in 1982–91 used as the standard for estimation of SIR
Cohort studies
Chen et al. (1988b)
SW Taiwan Mortality 1968–83
Area endemic for Blackfoot disease
28 SMR: 10.49 (p < 0.001) compared with national standard; 2.84 (p < 0.01) compared with regional standard
789 patients with Blackfoot disease followed from 1968 to 1984. National and regional rates in 1968–83 used as the standard for estimation of SMR
Tsuda et al. (1995)
Niigata Prefecture, Japan
Mortality, 1959–92, all ages
Arsenic level: < 0.05 mg/L 0.05–0.99 mg/L ≥ 1.0 mg/L Total
0 1 8 9
SMR 0.0 (0–2.4) 2.3 (0.1–13.4) 15.7 (7.4–31.0) 3.7 (1.8–7.0)
113 persons who drank from industrially contaminated wells in 1955–59, then followed for 33 years; rates in Niigata Prefecture in 1960–89 used as the standard for estimation of SMR
pp97-166.qxd 11/10/2004 10:47 Page 127
IARC M
ON
OG
RAPH
S VO
LUM
E 84128
Table 24 (contd)
Reference Location End-point Exposure No. of cases Study outcome Comments
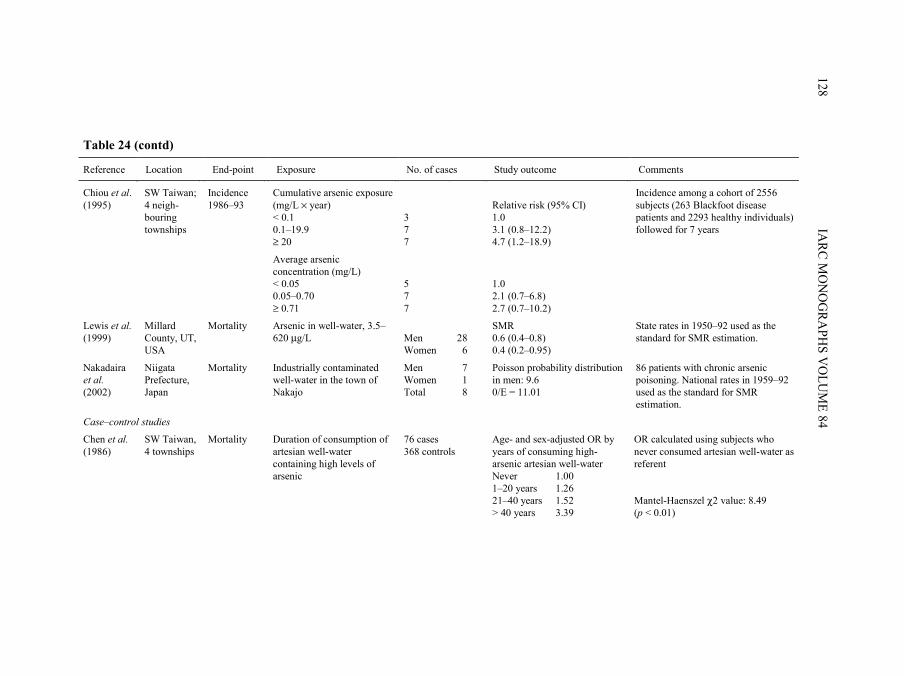
Chiou et al. (1995)
SW Taiwan; 4 neigh-bouring townships
Incidence 1986–93
Cumulative arsenic exposure (mg/L × year) < 0.1 0.1–19.9 ≥ 20
3 7 7
Relative risk (95% CI) 1.0 3.1 (0.8–12.2) 4.7 (1.2–18.9)
Incidence among a cohort of 2556 subjects (263 Blackfoot disease patients and 2293 healthy individuals) followed for 7 years
Average arsenic concentration (mg/L) < 0.05 0.05–0.70 ≥ 0.71
5 7 7
1.0 2.1 (0.7–6.8) 2.7 (0.7–10.2)
Lewis et al. (1999)
Millard County, UT, USA
Mortality Arsenic in well-water, 3.5–620 µg/L
Men Women
28 6
SMR 0.6 (0.4–0.8) 0.4 (0.2–0.95)
State rates in 1950–92 used as the standard for SMR estimation.
Nakadaira et al. (2002)
Niigata Prefecture, Japan
Mortality Industrially contaminated well-water in the town of Nakajo
Men Women Total
7 1 8
Poisson probability distribution in men: 9.6 0/E = 11.01
86 patients with chronic arsenic poisoning. National rates in 1959–92 used as the standard for SMR estimation.
Case–control studies
Chen et al. (1986)
SW Taiwan, 4 townships
Mortality Duration of consumption of artesian well-water containing high levels of arsenic
76 cases 368 controls
Age- and sex-adjusted OR by years of consuming high-arsenic artesian well-water Never 1.00 1–20 years 1.26 21–40 years 1.52 > 40 years 3.39
OR calculated using subjects who never consumed artesian well-water as referent Mantel-Haenszel χ2 value: 8.49 (p < 0.01)
pp97-166.qxd 11/10/2004 10:47 Page 128
ARSEN
IC IN D
RINK
ING
-WATER
129
Table 24 (contd)
Reference Location End-point Exposure No. of cases Study outcome Comments
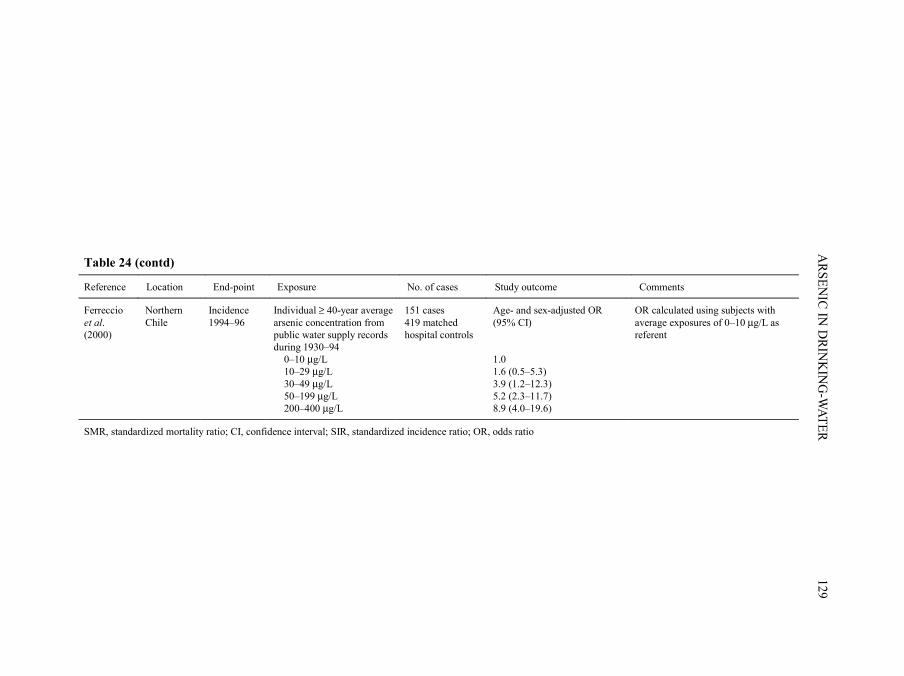
Ferreccio et al. (2000)
Northern Chile
Incidence 1994–96
Individual ≥ 40-year average arsenic concentration from public water supply records during 1930–94 0–10 µg/L 10–29 µg/L 30–49 µg/L 50–199 µg/L 200–400 µg/L
151 cases 419 matched hospital controls
Age- and sex-adjusted OR (95% CI) 1.0 1.6 (0.5–5.3) 3.9 (1.2–12.3) 5.2 (2.3–11.7) 8.9 (4.0–19.6)
OR calculated using subjects with average exposures of 0–10 µg/L as referent
SMR, standardized mortality ratio; CI, confidence interval; SIR, standardized incidence ratio; OR, odds ratio
pp97-166.qxd 11/10/2004 10:47 Page 129
(b) JapanCohort study
Tsuda et al. (1995) (described in Section 2.1.2) found excess mortality from lungcancer among a cohort of 113 persons exposed to levels of arsenic above 1.0 mg/L fromindustrially contaminated drinking-water in villages of Niigata Prefecture, Japan. Theexpected number of deaths was based on sex-, age- and cause-specific mortality in NiigataPrefecture in 1960–89. Based on a subgroup of 86 study patients, Nakadaira et al. (2002)did not find excess mortality from lung cancer.
(c) AustraliaHinwood et al. (1999) investigated the association between levels of arsenic in
drinking-water and lung cancer incidence in Victoria, Australia, during the period1982–91. This study included 22 areas where median concentrations of arsenic indrinking-water ranged from 14 to 166 µg/L. Using the incidence rate in Victoria, an SIRof 1.0 was observed for lung cancer.
(d) South America(i) Ecological studies
Rivara et al. (1997) compared the mortality from lung cancer in 1976–92 betweenAntofagasta in Region II with that in Region VIII of Chile. The relative risk for lungcancer was higher in Antofagasta compared with Region VIII. [The data source and statis-tical analysis were not clearly described.]
Smith et al. (1998) (described in Section 2.2.1) found elevated SMRs of about 3 forlung cancer for both sexes in Region II, using the national rate as standard.
In the study of Hopenhayn-Rich et al. (1998) (described in Section 2.2.1), significantincreases in the incidence of lung cancer associated with increasing exposure to arsenicwere observed for lung cancer.
(ii) Case–control studyFerreccio et al. (2000) conducted a case–control study of incident lung cancer cases in
northern Chile. Eligible cases included all lung cancer cases admitted to public hospitals inRegions I, II and III of Chile from November 1994 to July 1996. Eighty to ninety per centof all cancer patients in the north of Chile are admitted to public hospitals, and a total of151 cases participated. Controls were selected from all patients admitted to any publichospital in the study region and frequency-matched to cases by age and sex. Two controlseries were selected: cancers other than lung cancer and non-cancer controls [no responserates were indicated for cases and controls]. Potential biases in control selection wereassessed by several approaches including comparisons with geographical distribution ofthe general population based on census data. Information regarding residential history,socioeconomic status, occupational history (to ascertain employment in copper smelting)and smoking was obtained by questionnaire interview. Historical exposure to arsenic in
IARC MONOGRAPHS VOLUME 84130
pp97-166.qxd 11/10/2004 10:47 Page 130
drinking-water was estimated by linking information on residential history with a databaseof information on arsenic concentrations in public water supplies collected for the years1950–94. Arsenic concentrations in the year prior to 1950 were based on concentrations inthe 1950s. Average concentration of arsenic in the place of residence was assigned to eachsubject on a year-by-year basis for the period 1930–94. Population coverage of publicwater systems in the main cities in Regions I and II was over 90% and was between 80 and90% in the major cities of Region III. The coverage in smaller cities varied between 64 and91%. Odds ratios were calculated using unconditional logistic regression, adjusted for age,sex, socioeconomic status, smoking and working in a copper smelter. Results from theanalysis based on average exposures during 1930–94 and using all controls showed anincrease in the odds ratio with concentration of arsenic. Evidence for a synergistic effect ofarsenic in water and smoking was found for those who both smoked and had high concen-trations of arsenic in their drinking-water (results not shown).
(e) USACohort study
Lewis et al. (1999) reported the association between arsenic in drinking-water andlung cancer mortality in a cohort of residents of Millard County, UT, where the medianconcentration of arsenic in drinking-water ranged from 14 to 166 µg/L. The SMRs forlung cancer for both men and women were below unity. [Limitations of this study havebeen cited in Section 2.1.4.]
2.3 Skin cancer
The recognition of arsenic as a carcinogen originally came from case seriesdescribing skin cancers following ingestion of arsenical medicine, and exposure toarsenical pesticide residues and arsenic-contaminated drinking-water. Hutchinson (1888)noted skin cancers among patients treated for psoriasis and other ailments with arsenic-containing compounds (e.g. Fowler’s Solution containing 1% potassium arsenite).Neubauer (1947) summarized 143 skin cancer cases among arsenic-treated patients. Over50% of the skin cancers developed in patients treated for 10 years or less and lesionsdeveloped after 3–40 years, and on average after 18 years. Clinical reports have describedan association of chronic arsenicism with skin cancer in vineyard workers of the Moselleregion, Germany (Roth, 1957; Grobe, 1977). Numerous cases of skin cancer have beendocumented from communities with arsenic-contaminated drinking-water. These include,but are not limited to, case reports from Silesia (Neubauer, 1947), North America (Wagneret al., 1979), Taiwan, China (Yeh, 1973), Argentina (Bergoglio, 1964), Mexico (Cebríanet al., 1983), Chile (Zaldívar, 1974; Zaldívar et al., 1981) and, more recently, Bangladesh(Kurokawa et al., 2001), West Bengal, India (Saha, 2001) and Malaysia (Jaafar et al.,1993). The characteristic arsenic-associated skin tumours include squamous-cell carci-noma arising in keratoses (including Bowen disease) and multiple basal-cell carcinomas
ARSENIC IN DRINKING-WATER 131
pp97-166.qxd 11/10/2004 10:47 Page 131
(e.g. Neubauer, 1947; Neuman & Schwank, 1960; Yeh et al., 1968). Therefore, thissection focuses on these non-melanoma skin cancers. In addition, ecological studies ofskin cancer based on mortality rates in areas with low exposure to arsenic such as the USAor exposure imputed from soil levels are not considered here. Findings of epidemiologicalstudies on arsenic in drinking-water and risk for skin cancer are summarized in Table 25.
2.3.1 Taiwan, China
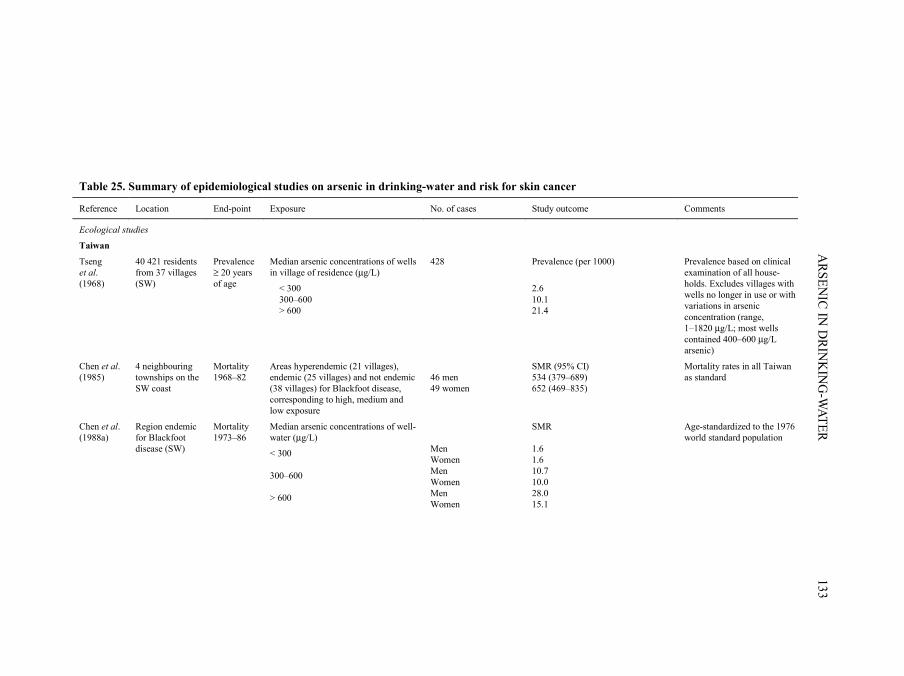
(a) Ecological studies(i) Study based on prevalence of skin cancer
In 1965, Tseng et al. (1968) completed a skin cancer prevalence survey on the south-west coast of Taiwan, a region known to have arsenic-contaminated artesian wells that wereintroduced into the region in 1910–20. A house-to-house examination was conducted offamily members from 37 villages: 10 in Chai-yi County, 25 in Tainan County and two in asuburb of Tainan City. The study covered a total population of 40 421 inhabitants. A total of428 skin cancers were identified, 238 of which were sent for histopathological review. Thestudy was based on clinical diagnoses. In the survey region, 142 water samples from 114wells were tested for arsenic. Arsenic concentrations ranged from 1 µg/L to 1820 µg/L, andthe majority of wells in the endemic region contained between 400 and 600 µg/L arsenic.Skin cancer prevalence was computed according to the median arsenic concentrations pervillage, categorized as < 300 µg/L, 300–600 µg/L and > 600 µg/L. Villages with eitherwide-ranging arsenic concentrations or residents who no longer drank the water weredeemed to be indeterminate in the analysis. Prevalence rates of skin cancer (based on clini-cal diagnosis) for inhabitants residing in low- (< 300 µg/L), medium- (300–600 µg/L) andhigh- (> 600 µg/L) arsenic areas represented over an eightfold difference from the highestto the lowest category.
(ii) Studies based on incidence of skin cancerGuo et al. (1998, 2001) correlated incidence rates of skin cancer with levels of arsenic
in well-water for 243 townships in Taiwan (with a total of about 11.4 million residents).Skin cancers were identified from the National Cancer Registry Program from 1980 to1987 by a hospital-based registry covering both clinical and pathological diagnoses ofskin cancers (reporting is not mandatory by law) (Guo et al., 1998). Arsenic concen-trations were provided by a national survey of wells conducted by the Taiwan ProvincialInstitute of Environmental Sanitation and published in 1977. The investigators modelledthe percentage of the population living in townships with drinking-water concentrationsof < 50, 50–89, 90–169, 170–329, 330–640 and > 640 µg/L arsenic. The models assumethat the same number of individuals drank from each well within a township. The resultsfor all skin cancers combined estimated a relative risk for the highest versus lowest expo-sure category of about 14 in men and 19 in women, with no excess detected in the othercategories (Guo et al., 1998).
IARC MONOGRAPHS VOLUME 84132
pp97-166.qxd 11/10/2004 10:47 Page 132
ARSEN
IC IN D
RINK
ING
-WATER
133
Table 25. Summary of epidemiological studies on arsenic in drinking-water and risk for skin cancer
Reference Location End-point Exposure No. of cases Study outcome Comments
Ecological studies
Taiwan
Tseng et al. (1968)
40 421 residents from 37 villages (SW)
Prevalence ≥ 20 years of age
Median arsenic concentrations of wells in village of residence (µg/L)
< 300 300–600 > 600
428 Prevalence (per 1000)
2.6 10.1 21.4
Prevalence based on clinical examination of all house-holds. Excludes villages with wells no longer in use or with variations in arsenic concentration (range, 1–1820 µg/L; most wells contained 400–600 µg/L arsenic)
Chen et al. (1985)
4 neighbouring townships on the SW coast
Mortality 1968–82
Areas hyperendemic (21 villages), endemic (25 villages) and not endemic (38 villages) for Blackfoot disease, corresponding to high, medium and low exposure
46 men 49 women
SMR (95% CI) 534 (379–689) 652 (469–835)
Mortality rates in all Taiwan as standard
Chen et al. (1988a)
Region endemic for Blackfoot disease (SW)
Mortality 1973–86
Median arsenic concentrations of well-water (µg/L)
< 300 300–600 > 600
Men Women Men Women Men Women
SMR 1.6 1.6 10.7 10.0 28.0 15.1
Age-standardized to the 1976 world standard population
pp97-166.qxd 11/10/2004 10:47 Page 133
IARC M
ON
OG
RAPH
S VO
LUM
E 84134
Table 25 (contd)
Reference Location End-point Exposure No. of cases Study outcome Comments
Wu et al. (1989)
42 villages in region endemic for Blackfoot disease (SW)
Mortality 1973–86
Median arsenic concentrations of well-water in village of residence (µg/L) in 1964–66 < 300 300–600 > 600 < 300 300–600 > 600
19 men 17 women Men Women
SMR 2.03 14.01 32.41 (p < 0.001) 1.73 14.75 18.66 (p < 0.001)
Age-standardized to the 1976 world standard population
Chen & Wang (1990)
314 precincts and townships
Mortality 1972–83
Average arsenic concentrations NS Men Women
Increase (β) in mortality rate per 100 000 per 0.1 µg/L increase: β (SE) = 0.9 (0.2) β (SE) = 1.0 (0.2)
Multiple regression adjusted for age and indices of urbanization and industrialization. Mortality rates standardized to the 1976 world standard population
Guo et al. (1998)
243 townships, 11.4 million residents
Incidence 1980–87
Arsenic concentration in wells Exposure categories: > 50, 50–89, 90–169, 170–329, 330–640 and > 640 µg/L
952 men 595 women
Risk difference of 0.34/100 000 (p < 0.01) associated with a 1% increase in arsenic concentrations > 640 µg/L Relative risk of highest versus lowest exposure category: 14.21 in men; 19.25 in women No excess risk for other categories
Rates standardized using the 1976 world standard population. Model assumes that same number of individuals use each well.
Tsai et al. (1999)
Four townships (SW)
Mortality 1971–94
Area endemic for Blackfoot disease 66 men 68 women
Age- and sex-adjusted SMR (95% CI) 4.8 (3.7–6.2) 5.97 (4.6–7.6) 5.7 (4.4–7.2) 6.8 (5.3–8.6)
Local standard National standard Local standard National standard
pp97-166.qxd 11/10/2004 10:47 Page 134
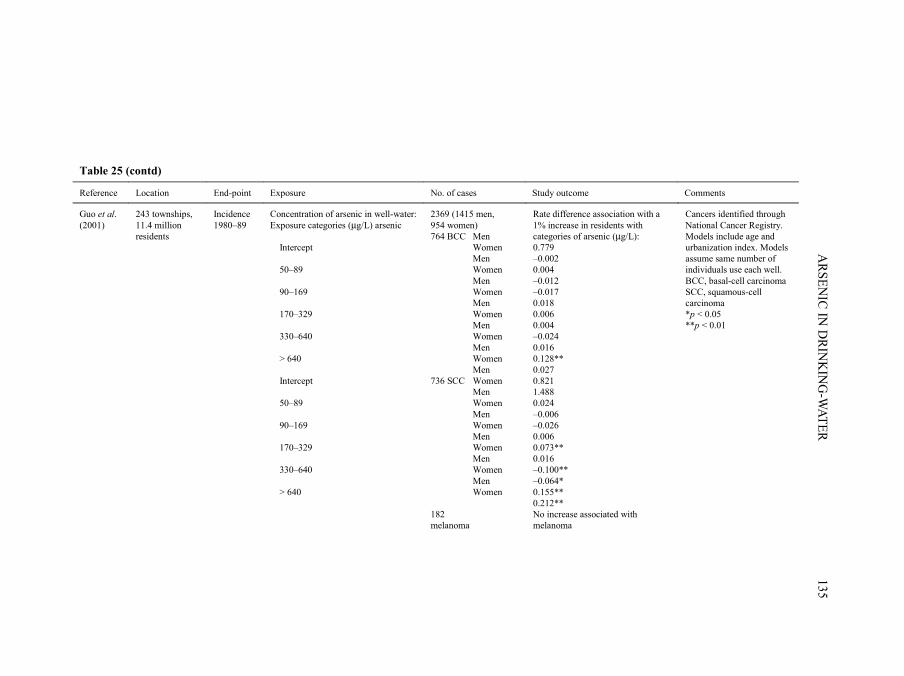
ARSEN
IC IN D
RINK
ING
-WATER
135
Table 25 (contd)
Reference Location End-point Exposure No. of cases Study outcome Comments
Guo et al. (2001)
243 townships, 11.4 million residents
Incidence 1980–89
Concentration of arsenic in well-water: Exposure categories (µg/L) arsenic Intercept 50–89 90–169 170–329 330–640 > 640 Intercept 50–89 90–169 170–329 330–640 > 640
2369 (1415 men, 954 women) 764 BCC Men Women Men Women Men Women Men Women Men Women Men Women Men 736 SCC Women Men Women Men Women Men Women Men Women Men Women 182 melanoma
Rate difference association with a 1% increase in residents with categories of arsenic (µg/L): 0.779 –0.002 0.004 –0.012 –0.017 0.018 0.006 0.004 –0.024 0.016 0.128** 0.027 0.821 1.488 0.024 –0.006 –0.026 0.006 0.073** 0.016 –0.100** –0.064* 0.155** 0.212** No increase associated with melanoma
Cancers identified through National Cancer Registry. Models include age and urbanization index. Models assume same number of individuals use each well. BCC, basal-cell carcinoma SCC, squamous-cell carcinoma *p < 0.05 **p < 0.01
pp97-166.qxd 11/10/2004 10:47 Page 135
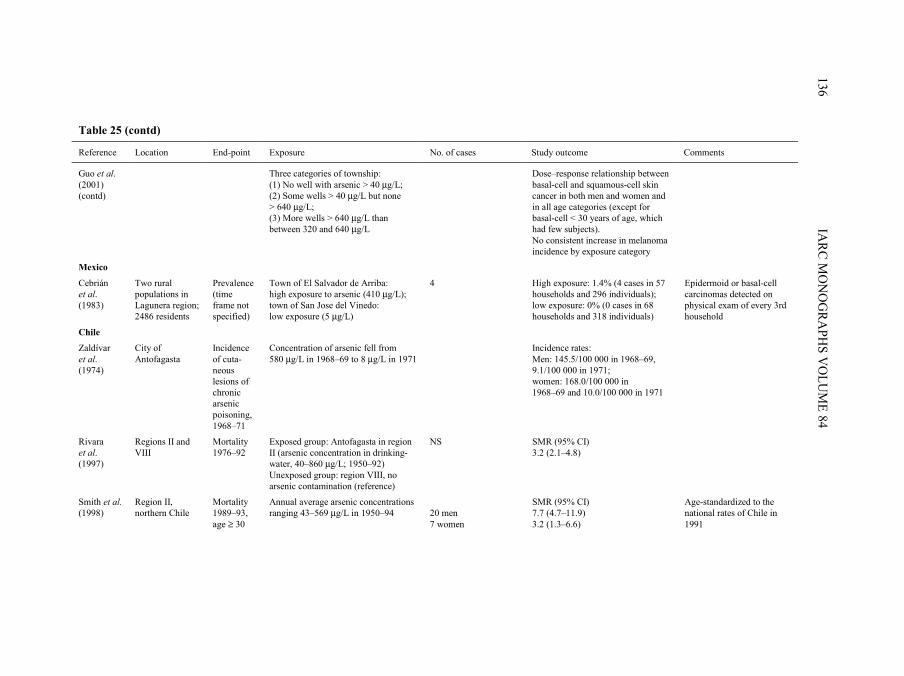
IARC M
ON
OG
RAPH
S VO
LUM
E 84136
Table 25 (contd)
Reference Location End-point Exposure No. of cases Study outcome Comments
Guo et al. (2001) (contd)
Three categories of township: (1) No well with arsenic > 40 µg/L; (2) Some wells > 40 µg/L but none > 640 µg/L; (3) More wells > 640 µg/L than between 320 and 640 µg/L
Dose–response relationship between basal-cell and squamous-cell skin cancer in both men and women and in all age categories (except for basal-cell < 30 years of age, which had few subjects). No consistent increase in melanoma incidence by exposure category
Mexico
Cebrián et al. (1983)
Two rural populations in Lagunera region; 2486 residents
Prevalence (time frame not specified)
Town of El Salvador de Arriba: high exposure to arsenic (410 µg/L); town of San Jose del Vinedo: low exposure (5 µg/L)
4 High exposure: 1.4% (4 cases in 57 households and 296 individuals); low exposure: 0% (0 cases in 68 households and 318 individuals)
Epidermoid or basal-cell carcinomas detected on physical exam of every 3rd household
Chile
Zaldívar et al. (1974)
City of Antofagasta
Incidence of cuta-neous lesions of chronic arsenic poisoning, 1968–71
Concentration of arsenic fell from 580 µg/L in 1968–69 to 8 µg/L in 1971
Incidence rates: Men: 145.5/100 000 in 1968–69, 9.1/100 000 in 1971; women: 168.0/100 000 in 1968–69 and 10.0/100 000 in 1971
Rivara et al. (1997)
Regions II and VIII
Mortality 1976–92
Exposed group: Antofagasta in region II (arsenic concentration in drinking-water, 40–860 µg/L; 1950–92) Unexposed group: region VIII, no arsenic contamination (reference)
NS SMR (95% CI) 3.2 (2.1–4.8)
Smith et al. (1998)
Region II, northern Chile
Mortality 1989–93, age ≥ 30
Annual average arsenic concentrations ranging 43–569 µg/L in 1950–94
20 men 7 women
SMR (95% CI) 7.7 (4.7–11.9) 3.2 (1.3–6.6)
Age-standardized to the national rates of Chile in 1991
pp97-166.qxd 11/10/2004 10:47 Page 136
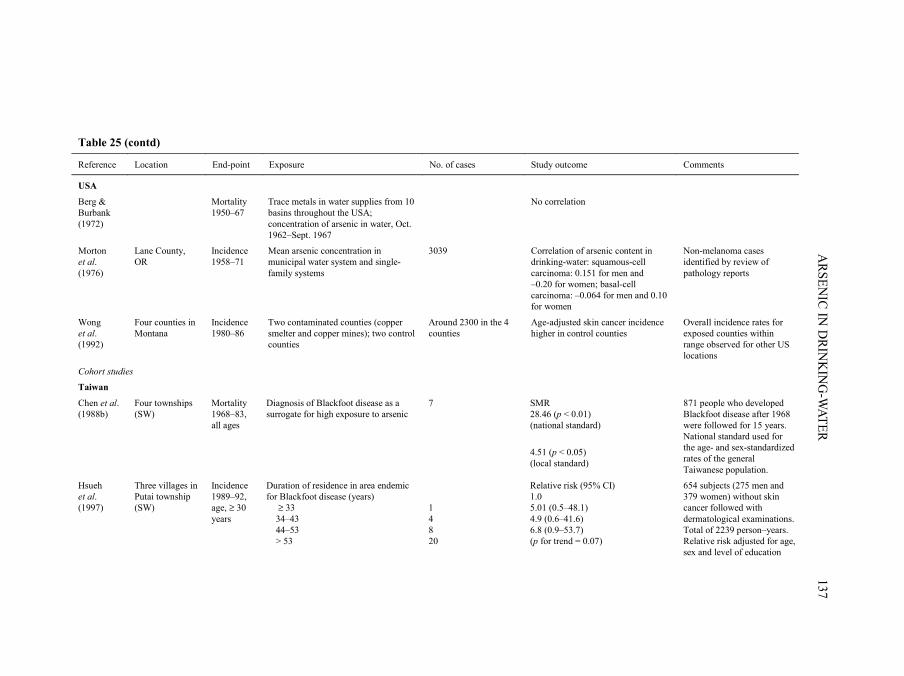
ARSEN
IC IN D
RINK
ING
-WATER
137
Table 25 (contd)
Reference Location End-point Exposure No. of cases Study outcome Comments
USA
Berg & Burbank (1972)
Mortality 1950–67
Trace metals in water supplies from 10 basins throughout the USA; concentration of arsenic in water, Oct. 1962–Sept. 1967
No correlation
Morton et al. (1976)
Lane County, OR
Incidence 1958–71
Mean arsenic concentration in municipal water system and single-family systems
3039 Correlation of arsenic content in drinking-water: squamous-cell carcinoma: 0.151 for men and –0.20 for women; basal-cell carcinoma: –0.064 for men and 0.10 for women
Non-melanoma cases identified by review of pathology reports
Wong et al. (1992)
Four counties in Montana
Incidence 1980–86
Two contaminated counties (copper smelter and copper mines); two control counties
Around 2300 in the 4 counties
Age-adjusted skin cancer incidence higher in control counties
Overall incidence rates for exposed counties within range observed for other US locations
Cohort studies
Taiwan
Chen et al. (1988b)
Four townships (SW)
Mortality 1968–83, all ages
Diagnosis of Blackfoot disease as a surrogate for high exposure to arsenic
7 SMR 28.46 (p < 0.01) (national standard)
4.51 (p < 0.05) (local standard)
871 people who developed Blackfoot disease after 1968 were followed for 15 years. National standard used for the age- and sex-standardized rates of the general Taiwanese population.
Hsueh et al. (1997)
Three villages in Putai township (SW)
Incidence 1989–92, age, ≥ 30 years
Duration of residence in area endemic for Blackfoot disease (years) ≥ 33 34–43 44–53 > 53
1 4 8 20
Relative risk (95% CI) 1.0 5.01 (0.5–48.1) 4.9 (0.6–41.6) 6.8 (0.9–53.7) (p for trend = 0.07)
654 subjects (275 men and 379 women) without skin cancer followed with dermatological examinations. Total of 2239 person–years. Relative risk adjusted for age, sex and level of education
pp97-166.qxd 11/10/2004 10:47 Page 137
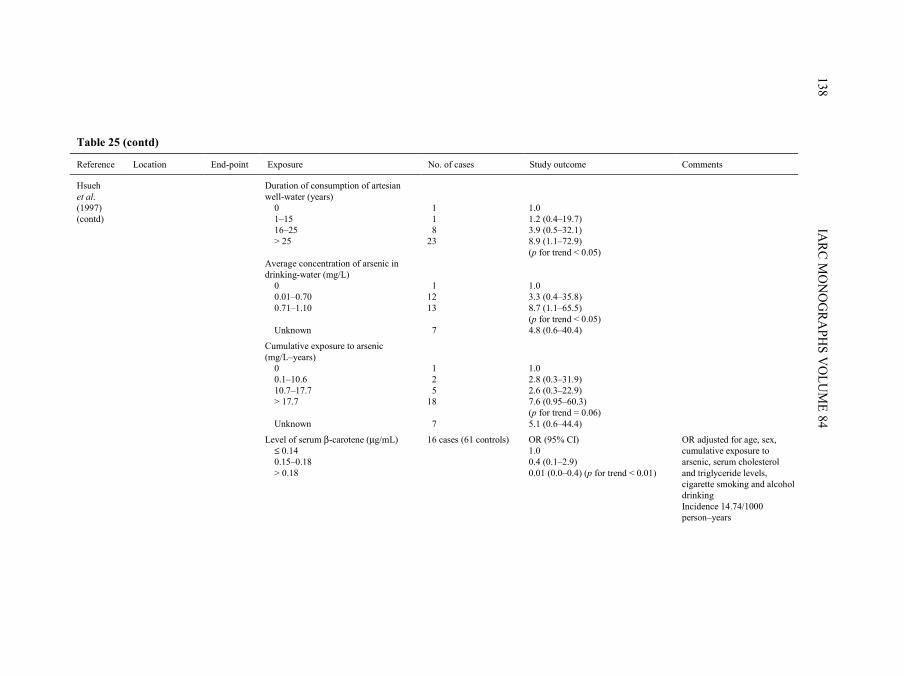
IARC M
ON
OG
RAPH
S VO
LUM
E 84138
Table 25 (contd)
Reference Location End-point Exposure No. of cases Study outcome Comments
Hsueh et al. (1997) (contd)
Duration of consumption of artesian well-water (years) 0 1–15 16–25 > 25
1 1 8 23
1.0 1.2 (0.4–19.7) 3.9 (0.5–32.1) 8.9 (1.1–72.9) (p for trend < 0.05)
Average concentration of arsenic in drinking-water (mg/L) 0 0.01–0.70 0.71–1.10 Unknown
1 12 13 7
1.0 3.3 (0.4–35.8) 8.7 (1.1–65.5) (p for trend < 0.05) 4.8 (0.6–40.4)
Cumulative exposure to arsenic (mg/L–years) 0 0.1–10.6 10.7–17.7 > 17.7 Unknown
1 2 5 18 7
1.0 2.8 (0.3–31.9) 2.6 (0.3–22.9) 7.6 (0.95–60.3) (p for trend = 0.06) 5.1 (0.6–44.4)
Level of serum β-carotene (µg/mL) ≤ 0.14 0.15–0.18 > 0.18
16 cases (61 controls) OR (95% CI) 1.0 0.4 (0.1–2.9) 0.01 (0.0–0.4) (p for trend < 0.01)
OR adjusted for age, sex, cumulative exposure to arsenic, serum cholesterol and triglyceride levels, cigarette smoking and alcohol drinking Incidence 14.74/1000 person–years
pp97-166.qxd 11/10/2004 10:47 Page 138
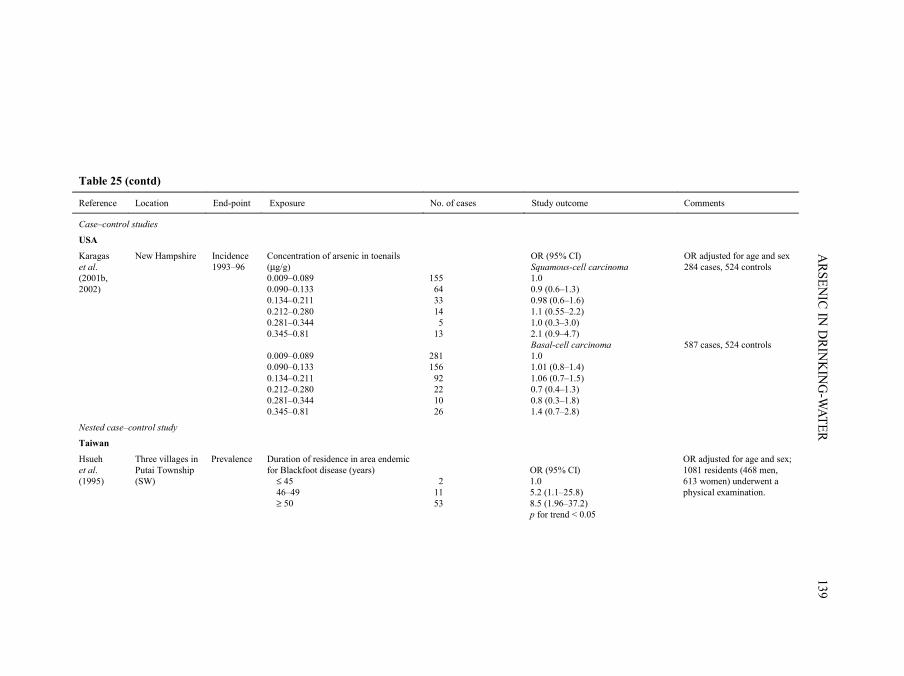
ARSEN
IC IN D
RINK
ING
-WATER
139
Table 25 (contd)
Reference Location End-point Exposure No. of cases Study outcome Comments
Case–control studies
USA
Karagas et al. (2001b, 2002)
New Hampshire Incidence 1993–96
Concentration of arsenic in toenails (µg/g) 0.009–0.089 0.090–0.133 0.134–0.211 0.212–0.280 0.281–0.344 0.345–0.81
155 64 33 14 5 13
OR (95% CI) Squamous-cell carcinoma 1.0 0.9 (0.6–1.3) 0.98 (0.6–1.6) 1.1 (0.55–2.2) 1.0 (0.3–3.0) 2.1 (0.9–4.7)
OR adjusted for age and sex 284 cases, 524 controls
0.009–0.089 0.090–0.133 0.134–0.211 0.212–0.280 0.281–0.344 0.345–0.81
281 156 92 22 10 26
Basal-cell carcinoma 1.0 1.01 (0.8–1.4) 1.06 (0.7–1.5) 0.7 (0.4–1.3) 0.8 (0.3–1.8) 1.4 (0.7–2.8)
587 cases, 524 controls
Nested case–control study
Taiwan
Hsueh et al. (1995)
Three villages in Putai Township (SW)
Prevalence Duration of residence in area endemic for Blackfoot disease (years) ≤ 45 46–49 ≥ 50
2 11 53
OR (95% CI) 1.0 5.2 (1.1–25.8) 8.5 (1.96–37.2) p for trend < 0.05
OR adjusted for age and sex; 1081 residents (468 men, 613 women) underwent a physical examination.
pp97-166.qxd 11/10/2004 10:47 Page 139
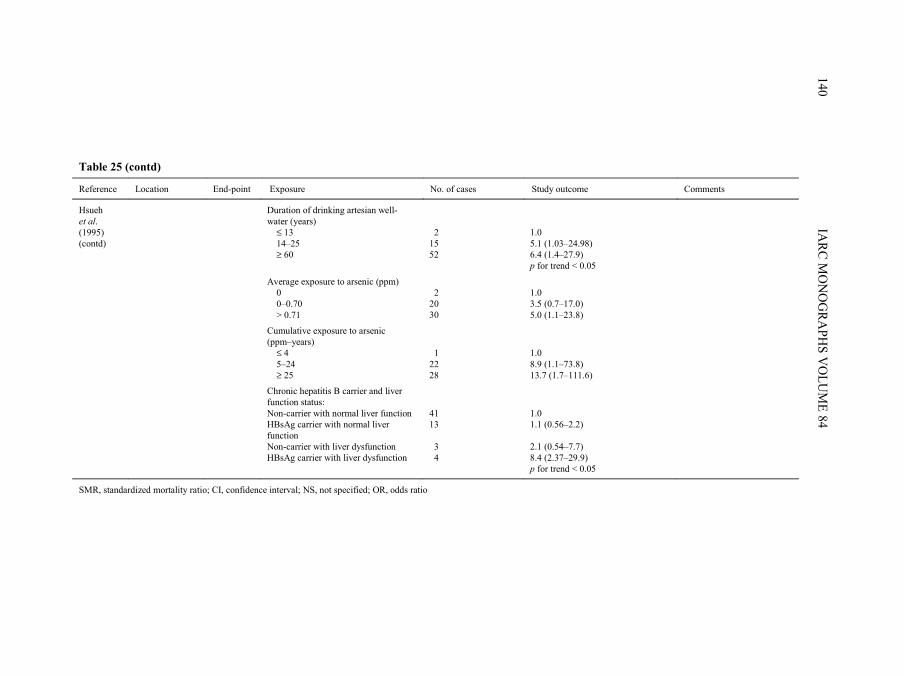
IARC M
ON
OG
RAPH
S VO
LUM
E 84140
Table 25 (contd)
Reference Location End-point Exposure No. of cases Study outcome Comments
Hsueh et al. (1995) (contd)
Duration of drinking artesian well-water (years) ≤ 13 14–25 ≥ 60
1.0 5.1 (1.03–24.98) 6.4 (1.4–27.9) p for trend < 0.05
Average exposure to arsenic (ppm) 0 0–0.70 > 0.71
2 15 52
2 20 30
1.0 3.5 (0.7–17.0) 5.0 (1.1–23.8)
Cumulative exposure to arsenic (ppm–years) ≤ 4 5–24 ≥ 25
1 22 28
1.0 8.9 (1.1–73.8) 13.7 (1.7–111.6)
Chronic hepatitis B carrier and liver function status: Non-carrier with normal liver function HBsAg carrier with normal liver function Non-carrier with liver dysfunction HBsAg carrier with liver dysfunction
41 13 3 4
1.0 1.1 (0.56–2.2) 2.1 (0.54–7.7) 8.4 (2.37–29.9) p for trend < 0.05
SMR, standardized mortality ratio; CI, confidence interval; NS, not specified; OR, odds ratio
pp97-166.qxd 11/10/2004 10:47 Page 140
In a second study, the incidence rates of each major histological type of skin cancer(basal-cell, squamous-cell and melanoma) were modelled using the previously definedexposure categories (Guo et al., 2001). The model included the percentage of residents incategories of age (30–49, 50–69 and > 69 years) and urbanization index as covariates. Inthis analysis, they found a statistically significant increase in squamous-cell skin cancerin the highest category (> 640 µg/L arsenic) in both men and women. Similarly, for basal-cell carcinoma, there was also a positive association in the highest exposure category.Melanoma was unrelated to any category of exposure to arsenic. In a post-hoc analysis,the investigators created three exposure groups: townships with no well containing levelsof arsenic above 40 µg/L, townships with some wells containing more than 40 µg/Larsenic but none above 640 µg/L and townships with more wells containing more than640 µg/L than between 320 and 640 µg/L. A dose–response relation between basal-celland squamous-cell skin cancer rates was observed in both men and women and in all agecategories (except for basal-cell cancer below age 30 years, which had few subjects).Again, no association was seen for melanoma. [The Working Group noted that the repor-ting of incident skin cancer may have been incomplete.]
(iii) Studies based on mortality from skin cancerA series of studies conducted in Taiwan, China (Chen et al., 1985, 1988a; Wu et al.,
1989; Chen & Wang, 1990; Tsai et al., 1999) (described in Section 2.1.1) analysed skincancer mortality in relation to levels of arsenic in well-water. The overall SMRs in thefour counties were 534 in men and 652 in women, with 100 as the referent value. Therewas also a gradient of increasing SMRs for skin cancer in areas not endemic or hyper-endemic for Blackfoot disease (Chen et al., 1985). A subsequent report (Chen et al.,1988a) presented SMRs for skin cancer grouped by the median levels of arsenic in well-water measured in 1962–64 into < 300, 300–600 and > 600 µg/L. The age-standardizedmortality rates for skin cancer increased in the three categories for both genders (Chenet al., 1988a). Wu et al. (1989) published age-adjusted mortality rates from skin cancerfor the years 1973–86 for the four townships endemic for Blackfoot disease plus 15villages in the townships of Yensui and Hsiaying. Using the same data on well-watercontents and the classification described above, skin cancer mortality rates also increasedin men and women with increasing median concentrations of arsenic. Subsequently, Chenand Wang (1990) used data on wells measured from 1974 to 1976 from 314 precincts andtownships throughout Taiwan. Based on a multiple regression analysis (adjusted forurbanization and age), a 0.1-µg/L increase in arsenic corresponded to an increase of 0.9(SE, 0.2) and 1.0 (SE, 0.2) per 100 000 in skin cancer mortality in men and women,respectively. More recently, Tsai et al. (1999) computed SMRs for the period 1971–94 forthe four townships endemic for Blackfoot disease by applying both local (Chiayi County)and national (Taiwan) rates as the standards. The SMRs for skin cancer were approxi-mately 5.0 for men and women, using both local and national standards.
ARSENIC IN DRINKING-WATER 141
pp97-166.qxd 11/10/2004 10:47 Page 141
(b) Cohort studies Chen et al. (1988b) conducted a retrospective cohort study of 871 patients who met
clinical criteria of Blackfoot disease after January 1968. From 1968 to 1983, seven deathcertificates identified the underlying cause of death as skin cancer. SMRs for skin cancerwere computed using both the area endemic for Blackfoot disease and the whole ofTaiwan as the population standards. The age-standardized observed versus expectednumber of skin cancer deaths was around 28 using Taiwan as the standard and 4.5 usingthe Blackfoot disease townships as the standard. [Use of the national population as thestandard may provide a better estimate of excess risk than use of the local population forwhom arsenic concentrations in well-water were elevated.]
Hsueh et al. (1997) established a cohort of residents living in three villages (Homei,Fuhsin and Hsinming) in Putai Township, one of the regions of the south-west coast ofTaiwan endemic for Blackfoot disease. Arsenic-contaminated well-water had existed inthese villages for over 50 years, with reported values ranging from 700 to 930 µg/L. Thegovernment introduced a new water system in the 1960s, with relatively low penetrationuntil the 1970s. Well-water remained in use for agriculture and aquaculture. The 1571residents aged 30 years or older who lived for at least 5 days a week in the villages wererecruited to take part in the study. Of these, 1081 (68.8%) participated in a physical exa-mination (468 men and 613 women). The 1015 study subjects who did not have aprevalent skin cancer comprised the cohort. Of these, 275 men and 379 women (64%)underwent regular examinations for dermatological conditions. Thirty-three incident skincancers developed during the follow-up period from September 1989 through December1992, with a total of 2239 person–years and a rate of 14.74/1000 person–years. Publichealth nurses interviewed cohort members on length of residence, history of drinkingwell-water and other potentially confounding factors. An index for cumulative exposureto arsenic was derived for each subject using concentrations of arsenic in well-water foreach village of residence measured in the 1960s. These data were multiplied by theduration of consumption of well-water in each village of residence and totalled for eachresidence. Dermatologists diagnosed clinically the skin cancers that occurred in thecohort, and 91% of clinically diagnosed carcinomas were confirmed histologically.Fasting blood samples and urine samples were collected at the time of interview. Serumwas analysed for β-carotene and urine for arsenic metabolites from 16 skin cancer cases[48%] and 61 age- and sex-matched controls. Cox proportional hazard regression wasused to analyse data on exposure to arsenic in relation to incidence of skin cancer adjustedfor age, sex and educational level. Conditional logistic regression analysis was used toassess the effects of β-carotene and urinary metabolites on the risk for skin cancer. Riskfor skin cancer was significantly related to duration of living in the area endemic forBlackfoot disease, duration of consumption of artesian well-water, average concentrationof arsenic and index for cumulative exposure to arsenic. There was evidence of a reducedrisk for skin cancer in the highest two tertiles of β-carotene versus the lowest tertile afteradjustment for multiple potential confounders. Also, compared with controls, cases of
IARC MONOGRAPHS VOLUME 84142
pp97-166.qxd 11/10/2004 10:47 Page 142
skin cancer had higher total urinary concentration of arsenic, percentage of MMA andratio of MMA to inorganic arsenic and a lower percentage of DMA and ratio of DMA toMMA (not shown in Table 25).
Hsueh et al. (1995) conducted a nested case–control study within the cohort study ofHsueh et al. (1997). A total of 66 prevalent skin cancers were identified after clinicalexamination. Age- and sex-adjusted prevalence odds ratios were computed for the samevariables of exposure to arsenic included in the cohort analysis: duration of living in thearea endemic for Blackfoot disease, duration of drinking artesian well-water, and averageand cumulative exposure to arsenic. Significant increases in risk for each exposure groupwere shown. In addition, a significantly elevated risk for skin cancer was observed amongchronic hepatitis B carriers with liver dysfunction.
2.3.2 Mexico
Ecological study based on prevalence of skin cancerCebrían et al. (1983) reported results from a household survey of two rural Mexican
towns in the Region of Lagunera. Towns were selected on the basis of levels of arsenic indrinking-water, one town with a high level of arsenic (average, 410 µg/L) and the otherwith a low level of arsenic (average, 5 µg/L). The towns are located 37 km apart, and theirpopulations were of comparable size (1488 and 998 inhabitants, respectively) and socio-economic and environmental conditions. A questionnaire and physical examination wereadministered to all family members of every third household in each community.Seventy-five per cent of the residents had lived in these communities since birth. Afterclinical diagnosis, prevalence of epidermoid or basal-cell carcinoma (referred to asulcerative lesions) was 1.4% in the exposed town, whereas no case was observed in thecontrol town. The 20 water samples tested from the exposed town between 1975 and 1978had arsenic concentrations ranging from 160 to 590 µg/L (standard deviation [SD],114 µg/L), indicating significant variability. The control town showed little variability(SD, 7 µg/L) in the 18 samples collected over the same period.
2.3.3 Chile
Ecological study based on incidence of cutaneous lesions Zaldívar et al. (1981) investigated the incidence of cutaneous lesions (leukoderma,
melanoderma, hyperkeratosis, and squamous-cell carcinoma) in residents of Antofagastain arsenic-contaminated Region II from 1968 to 1971. Among 457 patients, about 70%were children aged 0–15 years. Incidence rates decreased from 1968–69 to 1971 due to afilter plant which started operation in 1970.
Ecological studies based on mortality from skin cancer In an ecological analysis, Rivara et al. (1997) compared mortality rates from skin
cancer in 1976–92 between Antofagasta and the unexposed control Region VIII of Chile.
ARSENIC IN DRINKING-WATER 143
pp97-166.qxd 11/10/2004 10:47 Page 143
The SMR for skin cancer was 3.2 (95% CI, 2.1–4.8). In a later study, Smith et al. (1998)compared sex- and site-specific mortality for the years 1989–93 in Region II of Chile withnational mortality rates. The SMR for skin cancer was 7.7 (95% CI, 4.7–11.9) among menand 3.2 (95% CI, 1.3–6.6) among women.
2.3.4 USA
(a) Ecological studyBerg and Burbank (1972) showed no correlation between trace metals from 10 water
basins throughout the USA and mortality rates in 1950–67, using concentrations ofarsenic measured in 1962–67.
Morton et al. (1976) studied the incidence of histologically confirmed basal-cell andsquamous-cell skin cancers (in situ and invasive) for the period 1958–71 in Lane County,OR, USA. They identified skin cancers by reviewing the pathology records of facilitiesserving residents of the county and the biopsy files of two of five dermatologists. Watersamples were tested from selected points throughout the county from public watersystems and from a number of single-family systems. Single-family systems werereported to have been over-sampled in regions suspected of having a problem witharsenic. Within a given region, arsenic values ranged from undetectable to 2150 µg/L. Thecorrelation between census tract estimates of arsenic in drinking-water and incidence ofsquamous-cell carcinoma was 0.151 in men and –0.20 in women; for the incidence ofbasal-cell carcinoma, the correlation was –0.064 in men and 0.10 in women. [A majorweakness of the study is the misclassification of exposure because of widely varyingconcentrations of arsenic within a census tract.]
Wong et al. (1992) studied approximately 2300 incident cases of skin cancer in fourcounties in Montana (two contaminated and two controls) in 1980–86. Contaminationarose from copper smelters and mines. No difference in incidence rates was observedbetween exposed counties and the rest of the country.
(b) Case–control studies Karagas et al. (1998, 2001b, 2002) designed a case–control study of basal-cell and
squamous-cell skin cancers in the population of New Hampshire to evaluate the effects oflow to moderate levels of exposure to arsenic. About 40% of the population relied onprivate, unregulated water systems; over 10% of the private supplies contained levels ofarsenic above the WHO recommended level of 10 µg/L and 1% of supplies overall con-tained > 50 µg/L. A biomarker of internal dose was chosen to determine exposure levels.Earlier studies had indicated the reliability of concentrations of arsenic in toenails as ameasure of exposure > 1 µg/L arsenic through drinking-water (Karagas et al., 1996, 2000)and reproducibility of concentrations over a period of 3–6 years (Garland et al., 1993;Karagas et al., 2001a). Cases of basal-cell and squamous-cell skin cancer diagnosed from1 July 1993 to 30 June 1995 were identified through a statewide network of dermatologists,dermatopathologists and pathologists, with participation rates of over 90% (Karagas et al.,
IARC MONOGRAPHS VOLUME 84144
pp97-166.qxd 11/10/2004 10:47 Page 144
2001b). Because of the high incidence of basal-cell carcinoma, incident cases of basal-cellcarcinoma were randomly selected in a 2:1 ratio to cases of squamous-cell carcinoma. Tominimize detection bias, cases of squamous-cell carcinoma were restricted to invasivedisease only (cases of in-situ carcinomas were excluded). A 2:1 ratio of controls tosquamous-cell carcinoma cases was randomly selected from population lists (driver’slicence files for cases < 65 years and Medicare enrollment lists for cases ≥ 65 years),frequency-matched to the combined distribution of the basal-cell and squamous-cell carci-noma cases. To be eligible to participate, subjects were required to speak English and havea working telephone. Of the 1143 potential case subjects, 896 took part in the study (78%)and, of the 820 potential controls, 540 (66%) enrolled. The analysis included the 587 casesof basal-cell carcinoma, 284 cases of squamous-cell carcinoma and 524 controls (97% ofsubjects) who contributed a toenail sample for arsenic analysis. Study participants under-went a personal interview to obtain information on confounding factors such as exposureand sensitivity to sun, history of radiation treatment and other medical and lifestyle factors.Age- and sex-adjusted odds ratios were computed using logistic regression analysis accor-ding to percentiles of arsenic concentrations in toenails based on the control distribution. Inthis categorical analysis, concentrations of arsenic appeared to be unrelated to risk forsquamous-cell and basal-cell carcinomas except for the highest category (the top 97thpercentile; concentrations above 0.344 µg/g) versus concentrations below the median.
An analysis using continuous exposure variables was presented separately (Karagaset al., 2002). A quadratic and two-segment linear model fitted the data for both squamous-cell carcinoma and basal-cell carcinoma. The point at which the dose–response appearedto increase was at 0.105 µg/g (95% CI, 0.093–0.219 µg/g) for squamous-cell carcinomausing a maximum likelihood estimation of the change point for the two-segment linearmodel. After the change point, a 1% increase in arsenic concentration in toenails wasrelated to a 0.61% increase in risk for squamous-cell carcinoma. The quadratic model forboth squamous-cell carcinoma and basal-cell carcinoma produced a consistent nadir orchange point of 0.088 and 0.091, respectively. However, it was not possible to estimate atwo-segment model for basal-cell carcinoma because of sparse data at the extremes.Based on a regression analysis of concentrations of arsenic in water and toenails, a changepoint of 0.105 µg/g in toenails translated to 1–2 µg/L in water, with the 95% confidenceinterval ranging from < 1 to 10–20 µg/L.
2.4 Other organ sites
Studies on cancer at other organ sites are summarized in Table 26.Neubauer (1947) summarized cancers that had been reported in patients treated with
medicinal arsenic. His report of 143 published cases included patients who developedcutaneous tumours and other malignancies such as cancers of the stomach (one case),tongue (two cases, one who also had cancer of oral mucosa), oesophagus (two cases),uterus (one case) and urethra (two cases including one papilloma of the ureter). Amongpatients who had not developed cutaneous tumours, other reported malignancies included
ARSENIC IN DRINKING-WATER 145
pp97-166.qxd 11/10/2004 10:47 Page 145
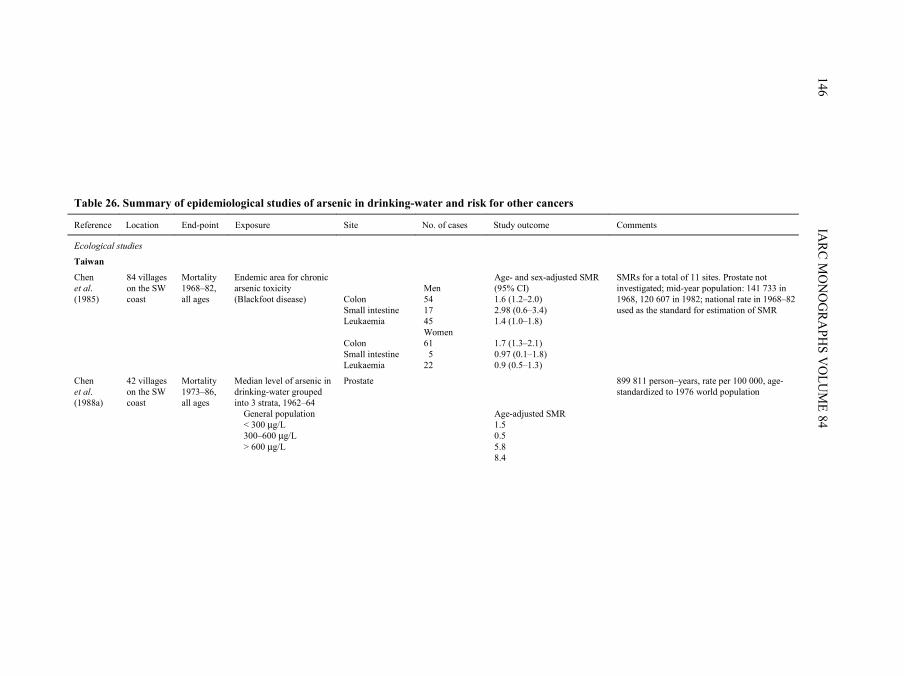
IARC M
ON
OG
RAPH
S VO
LUM
E 84146
Table 26. Summary of epidemiological studies of arsenic in drinking-water and risk for other cancers
Reference Location End-point Exposure Site No. of cases Study outcome Comments
Ecological studies
Taiwan
Chen et al. (1985)
84 villages on the SW coast
Mortality 1968–82, all ages
Endemic area for chronic arsenic toxicity (Blackfoot disease)
Colon Small intestine Leukaemia Colon Small intestine Leukaemia
Men 54 17 45 Women 61 5 22
Age- and sex-adjusted SMR (95% CI) 1.6 (1.2–2.0) 2.98 (0.6–3.4) 1.4 (1.0–1.8) 1.7 (1.3–2.1) 0.97 (0.1–1.8) 0.9 (0.5–1.3)
SMRs for a total of 11 sites. Prostate not investigated; mid-year population: 141 733 in 1968, 120 607 in 1982; national rate in 1968–82 used as the standard for estimation of SMR
Chen et al. (1988a)
42 villages on the SW coast
Mortality 1973–86, all ages
Median level of arsenic in drinking-water grouped into 3 strata, 1962–64 General population < 300 µg/L 300–600 µg/L > 600 µg/L
Prostate Age-adjusted SMR 1.5 0.5 5.8 8.4
899 811 person–years, rate per 100 000, age-standardized to 1976 world population
pp97-166.qxd 11/10/2004 10:47 Page 146
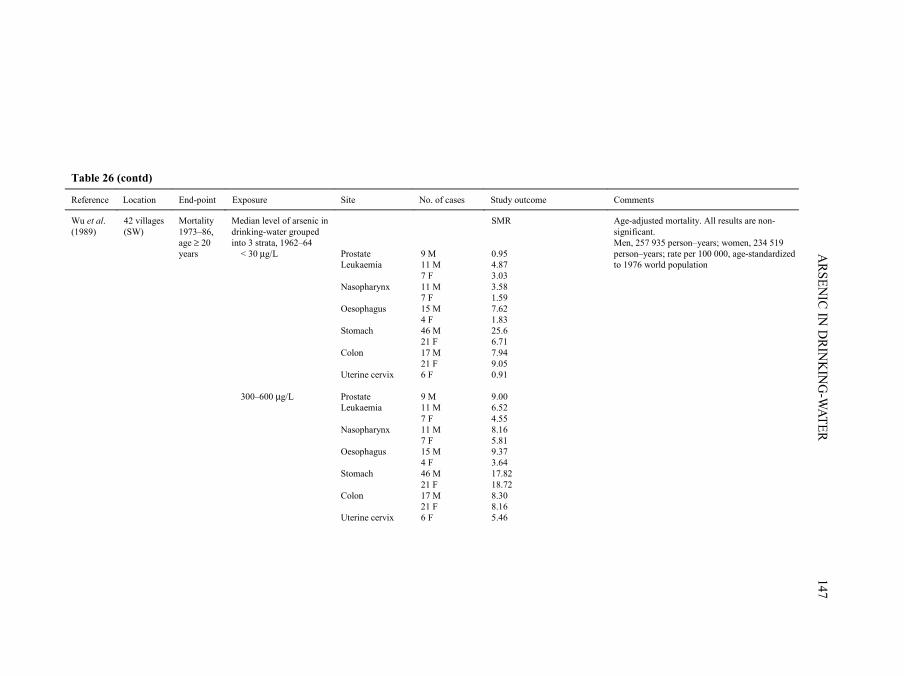
ARSEN
IC IN D
RINK
ING
-WATER
147
Table 26 (contd)
Reference Location End-point Exposure Site No. of cases Study outcome Comments
Wu et al. (1989)
42 villages (SW)
Mortality 1973–86, age ≥ 20 years
Median level of arsenic in drinking-water grouped into 3 strata, 1962–64 < 30 µg/L 300–600 µg/L
Prostate Leukaemia Nasopharynx Oesophagus Stomach Colon Uterine cervix Prostate Leukaemia Nasopharynx Oesophagus Stomach Colon Uterine cervix
9 M 11 M 7 F 11 M 7 F 15 M 4 F 46 M 21 F 17 M 21 F 6 F 9 M 11 M 7 F 11 M 7 F 15 M 4 F 46 M 21 F 17 M 21 F 6 F
SMR 0.95 4.87 3.03 3.58 1.59 7.62 1.83 25.6 6.71 7.94 9.05 0.91 9.00 6.52 4.55 8.16 5.81 9.37 3.64 17.82 18.72 8.30 8.16 5.46
Age-adjusted mortality. All results are non-significant. Men, 257 935 person–years; women, 234 519 person–years; rate per 100 000, age-standardized to 1976 world population
pp97-166.qxd 11/10/2004 10:47 Page 147
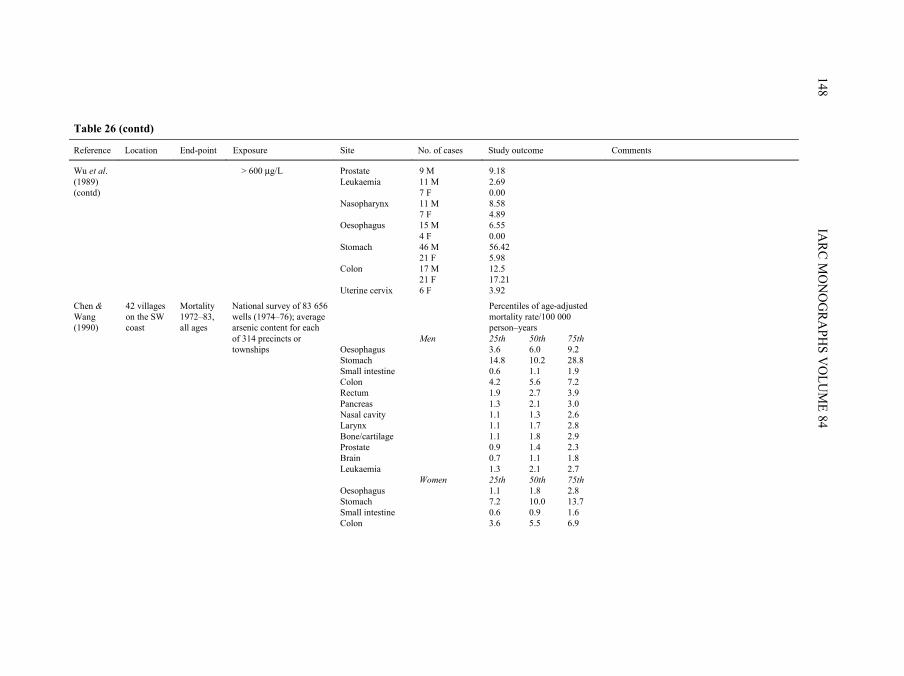
IARC M
ON
OG
RAPH
S VO
LUM
E 84148
Table 26 (contd)
Reference Location End-point Exposure Site No. of cases Study outcome Comments
Wu et al. (1989) (contd)
> 600 µg/L Prostate Leukaemia Nasopharynx Oesophagus Stomach Colon Uterine cervix
9 M 11 M 7 F 11 M 7 F 15 M 4 F 46 M 21 F 17 M 21 F 6 F
9.18 2.69 0.00 8.58 4.89 6.55 0.00 56.42 5.98 12.5 17.21 3.92
Percentiles of age-adjusted mortality rate/100 000 person–years
Men 25th 50th 75th Oesophagus 3.6 6.0 9.2 Stomach 14.8 10.2 28.8 Small intestine 0.6 1.1 1.9 Colon 4.2 5.6 7.2
Chen & Wang (1990)
42 villages on the SW coast
Mortality 1972–83, all ages
National survey of 83 656 wells (1974–76); average arsenic content for each of 314 precincts or townships
Rectum 1.9 2.7 3.9 Pancreas 1.3 2.1 3.0 Nasal cavity 1.1 1.3 2.6 Larynx 1.1 1.7 2.8 Bone/cartilage 1.1 1.8 2.9
Prostate 0.9 1.4 2.3 Brain 0.7 1.1 1.8 Leukaemia 1.3 2.1 2.7 Women 25th 50th 75th Oesophagus 1.1 1.8 2.8 Stomach 7.2 10.0 13.7 Small intestine 0.6 0.9 1.6 Colon 3.6 5.5 6.9
pp97-166.qxd 11/10/2004 10:47 Page 148
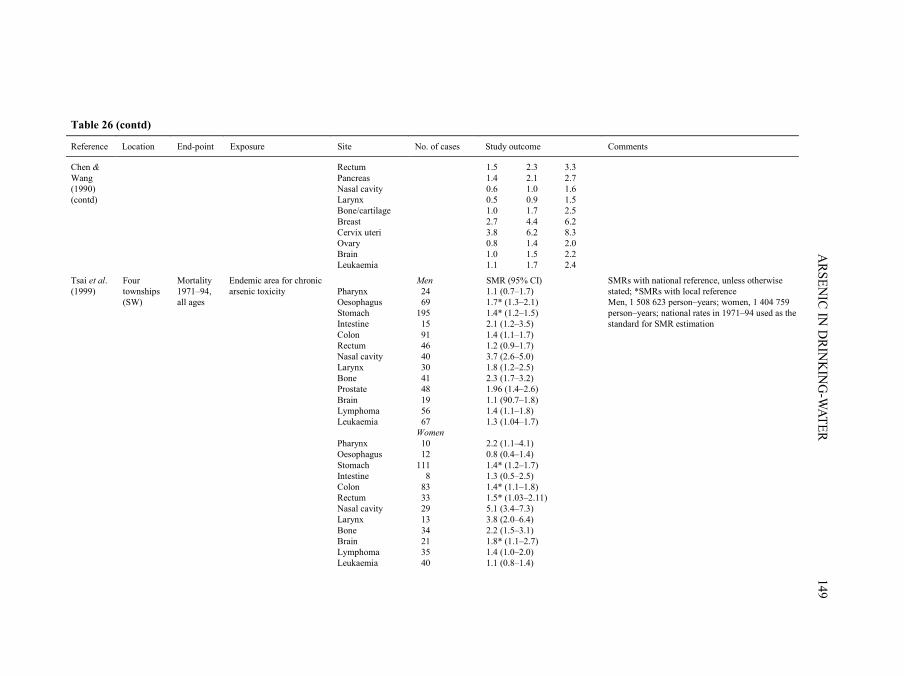
ARSEN
IC IN D
RINK
ING
-WATER
149
Table 26 (contd)
Reference Location End-point Exposure Site No. of cases Study outcome Comments
Rectum 1.5 2.3 3.3 Pancreas 1.4 2.1 2.7 Nasal cavity 0.6 1.0 1.6
Chen & Wang (1990) (contd) Larynx 0.5 0.9 1.5 Bone/cartilage 1.0 1.7 2.5 Breast 2.7 4.4 6.2 Cervix uteri 3.8 6.2 8.3 Ovary 0.8 1.4 2.0 Brain 1.0 1.5 2.2 Leukaemia 1.1 1.7 2.4
Men SMR (95% CI) Tsai et al. (1999)
Endemic area for chronic arsenic toxicity Pharynx 24 1.1 (0.7–1.7)
Four townships (SW)
Mortality 1971–94, all ages Oesophagus 69 1.7* (1.3–2.1)
Stomach 195 1.4* (1.2–1.5) Intestine 15 2.1 (1.2–3.5) Colon 91 1.4 (1.1–1.7) Rectum 46 1.2 (0.9–1.7) Nasal cavity 40 3.7 (2.6–5.0)
SMRs with national reference, unless otherwise stated; *SMRs with local reference Men, 1 508 623 person–years; women, 1 404 759 person–years; national rates in 1971–94 used as the standard for SMR estimation
Larynx 30 1.8 (1.2–2.5) Bone 41 2.3 (1.7–3.2) Prostate 48 1.96 (1.4–2.6) Brain 19 1.1 (90.7–1.8) Lymphoma 56 1.4 (1.1–1.8) Leukaemia 67 1.3 (1.04–1.7) Women Pharynx 10 2.2 (1.1–4.1) Oesophagus 12 0.8 (0.4–1.4) Stomach 111 1.4* (1.2–1.7) Intestine 8 1.3 (0.5–2.5) Colon 83 1.4* (1.1–1.8) Rectum 33 1.5* (1.03–2.11) Nasal cavity 29 5.1 (3.4–7.3) Larynx 13 3.8 (2.0–6.4)
Bone 34 2.2 (1.5–3.1) Brain 21 1.8* (1.1–2.7)
Lymphoma 35 1.4 (1.0–2.0) Leukaemia 40 1.1 (0.8–1.4)
pp97-166.qxd 11/10/2004 10:47 Page 149
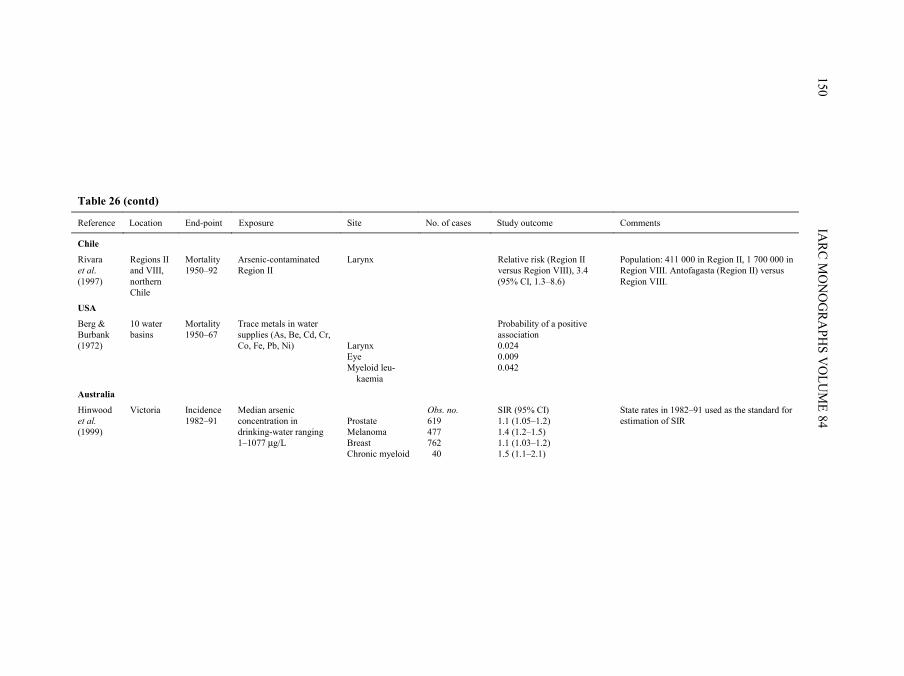
IARC M
ON
OG
RAPH
S VO
LUM
E 84150
Table 26 (contd)
Reference Location End-point Exposure Site No. of cases Study outcome Comments
Chile
Rivara et al. (1997)
Regions II and VIII, northern Chile
Mortality 1950–92
Arsenic-contaminated Region II
Larynx Relative risk (Region II versus Region VIII), 3.4 (95% CI, 1.3–8.6)
Population: 411 000 in Region II, 1 700 000 in Region VIII. Antofagasta (Region II) versus Region VIII.
USA
Berg & Burbank (1972)
10 water basins
Mortality 1950–67
Trace metals in water supplies (As, Be, Cd, Cr, Co, Fe, Pb, Ni)
Larynx Eye Myeloid leu- kaemia
Probability of a positive association 0.024 0.009 0.042
Australia
Hinwood et al. (1999)
Victoria Incidence 1982–91
Median arsenic concentration in drinking-water ranging 1–1077 µg/L
Prostate Melanoma Breast Chronic myeloid
Obs. no. 619 477 762 40
SIR (95% CI) 1.1 (1.05–1.2) 1.4 (1.2–1.5) 1.1 (1.03–1.2) 1.5 (1.1–2.1)
State rates in 1982–91 used as the standard for estimation of SIR
pp97-166.qxd 11/10/2004 10:47 Page 150
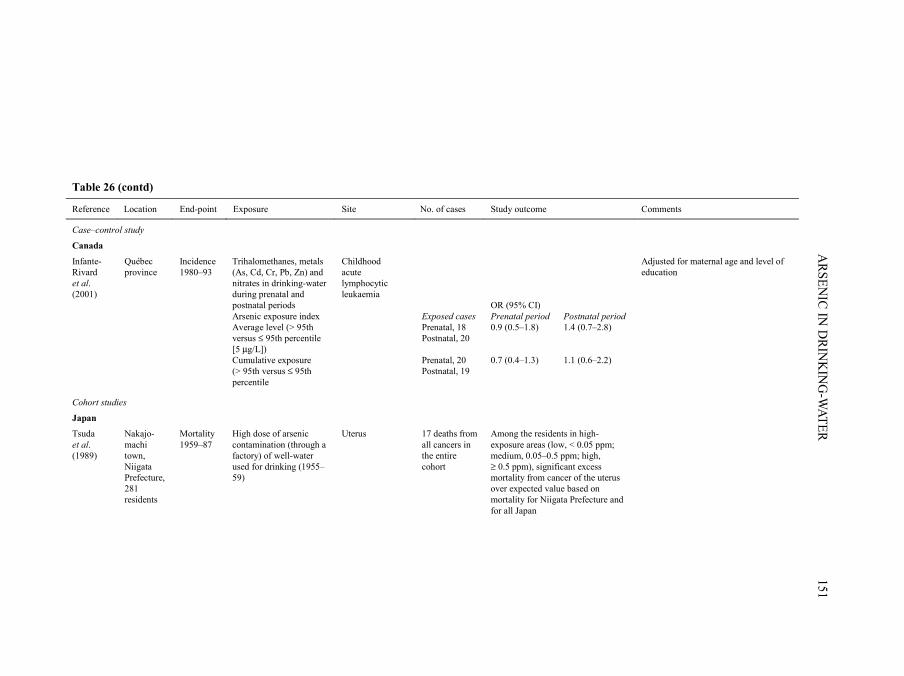
ARSEN
IC IN D
RINK
ING
-WATER
151
Table 26 (contd)
Reference Location End-point Exposure Site No. of cases Study outcome Comments
Case–control study
Canada
Infante-Rivard et al. (2001)
Québec province
Incidence 1980–93
Trihalomethanes, metals (As, Cd, Cr, Pb, Zn) and nitrates in drinking-water during prenatal and postnatal periods Arsenic exposure index Average level (> 95th versus ≤ 95th percentile [5 µg/L]) Cumulative exposure (> 95th versus ≤ 95th percentile
Childhood acute lymphocytic leukaemia
Exposed cases Prenatal, 18 Postnatal, 20 Prenatal, 20 Postnatal, 19
OR (95% CI) Prenatal period 0.9 (0.5–1.8) 0.7 (0.4–1.3)
Postnatal period 1.4 (0.7–2.8) 1.1 (0.6–2.2)
Adjusted for maternal age and level of education
Cohort studies
Japan
Tsuda et al. (1989)
Nakajo-machi town, Niigata Prefecture, 281 residents
Mortality 1959–87
High dose of arsenic contamination (through a factory) of well-water used for drinking (1955–59)
Uterus 17 deaths from all cancers in the entire cohort
Among the residents in high-exposure areas (low, < 0.05 ppm; medium, 0.05–0.5 ppm; high, ≥ 0.5 ppm), significant excess mortality from cancer of the uterus over expected value based on mortality for Niigata Prefecture and for all Japan
pp97-166.qxd 11/10/2004 10:47 Page 151
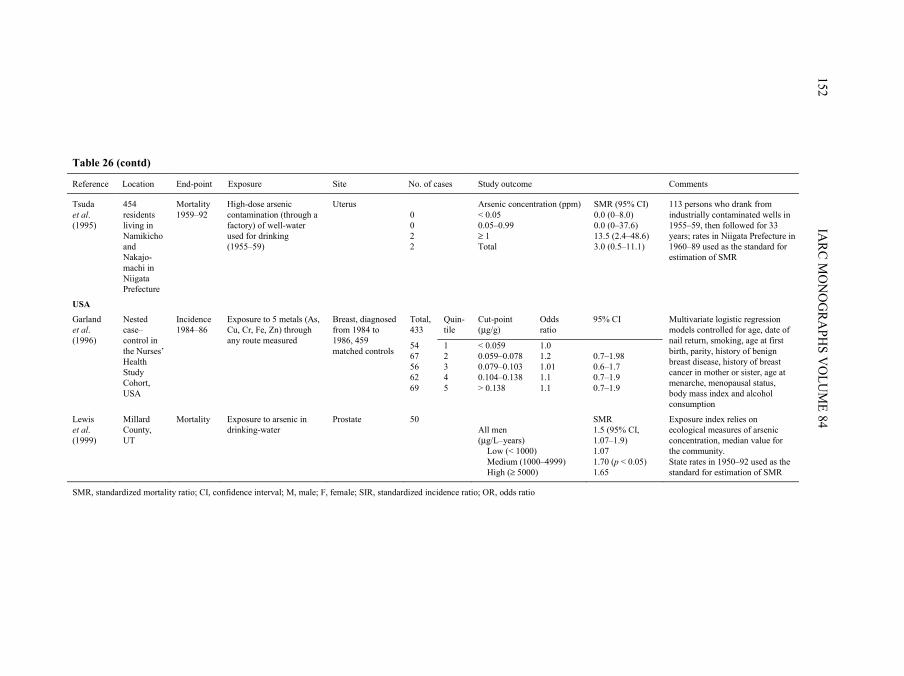
IARC M
ON
OG
RAPH
S VO
LUM
E 84152
Table 26 (contd)
Reference Location End-point Exposure Site No. of cases Study outcome Comments
Tsuda et al. (1995)
454 residents living in Namikicho and Nakajo-machi in Niigata Prefecture
Mortality 1959–92
High-dose arsenic contamination (through a factory) of well-water used for drinking (1955–59)
Uterus 0 0 2 2
Arsenic concentration (ppm) < 0.05 0.05–0.99 ≥ 1 Total
SMR (95% CI) 0.0 (0–8.0) 0.0 (0–37.6) 13.5 (2.4–48.6) 3.0 (0.5–11.1)
113 persons who drank from industrially contaminated wells in 1955–59, then followed for 33 years; rates in Niigata Prefecture in 1960–89 used as the standard for estimation of SMR
USA
Total, 433
Quin-tile
Cut-point (µg/g)
Odds ratio
95% CI
54 1 < 0.059 1.0 67 2 0.059–0.078 1.2 0.7–1.98 56 3 0.079–0.103 1.01 0.6–1.7 62 4 0.104–0.138 1.1 0.7–1.9
Garland et al. (1996)
Nested case–control in the Nurses’ Health Study Cohort, USA
Incidence 1984–86
Exposure to 5 metals (As, Cu, Cr, Fe, Zn) through any route measured
Breast, diagnosed from 1984 to 1986, 459 matched controls
69 5 > 0.138 1.1 0.7–1.9
Multivariate logistic regression models controlled for age, date of nail return, smoking, age at first birth, parity, history of benign breast disease, history of breast cancer in mother or sister, age at menarche, menopausal status, body mass index and alcohol consumption
Lewis et al. (1999)
Millard County, UT
Mortality Exposure to arsenic in drinking-water
Prostate 50 All men (µg/L–years) Low (< 1000) Medium (1000–4999) High (≥ 5000)
SMR 1.5 (95% CI, 1.07–1.9) 1.07 1.70 (p < 0.05) 1.65
Exposure index relies on ecological measures of arsenic concentration, median value for the community. State rates in 1950–92 used as the standard for estimation of SMR
SMR, standardized mortality ratio; CI, confidence interval; M, male; F, female; SIR, standardized incidence ratio; OR, odds ratio
pp97-166.qxd 11/10/2004 10:47 Page 152
cancers of the breast (two cases, one case who had keratoses present), pancreas (one casewho had keratoses present) and mouth (one patient who had treatment to the mouth forsyphilis). A report of seven cases of cancer following treatment with Fowler’s solution(Jackson & Grainge, 1975) included one case of bilateral breast cancer and one case ofcolon cancer. Multiple skin cancers were present in both cases. The literature alsoincludes cases of meningioma and intestinal malignancies associated with ingestion ofarsenic (IARC, 1987). [Case reports have helped to identify the role of ingestion ofarsenic in the occurrence of skin cancer and could provide leads to occurrences of othermalignancies. However, without an appropriate comparison group, it is unclear whetherany of the cases represent an excess over the norm.]
2.4.1 Taiwan, China
Ecological studiesChen et al. (1985) (described in Section 2.1.1) reported SMRs in the four-county
region in South-West Taiwan that is endemic for Blackfoot disease using mortality ratesfor the whole country as the standard. The analyses were based on mortality data obtainedfrom the Department of Health for the period 1968–82. To estimate dose, SMRs werecomputed for regions that were hyperendemic (21 villages), endemic (25 villages) and notendemic (38 villages) for Blackfoot disease. Age-standardized mortality rates for the fourcounties were elevated compared with national rates for cancer of the colon in both menand women. Age- and sex-standardized mortality rates for colon cancer were higher inendemic areas than in non-endemic areas, but were lower in the hyperendemic areascompared with other areas. SMRs for leukaemia were of borderline statisticalsignificance in men and close to unity in women. The SMR for cancer of the smallintestine also was increased in men but not in women, and was not statistically significantin either sex [Prostate cancer was not investigated in this report.] (Chen et al., 1985). Asubsequent report used the median concentrations of arsenic in well-water measured in1962–64 grouped into levels of < 300, 300–600 and ≥ 600 µg/L. A dose-related gradientin age-adjusted mortality was noted for prostate cancer. In the ≥ 600-µg/L group, the age-standardized mortality rate for prostate cancer was 5.6 times higher than that of thegeneral population of Taiwan (Chen et al., 1988a) (study described in Section 2.1.1).
Wu et al. (1989) (study described in Section 2.1.1) published age-adjusted mortalityrates for the years 1973–86 in 27 townships in the four counties endemic for Blackfootdisease together with 15 additional villages in the townships of Yensui and Hsiaying.Using the same data on well-water content and the classification scheme described above(Chen et al., 1988a), a dose-related trend in mortality from prostate cancer was againobserved (Mantel-Haenszel test for trend, p < 0.05). The authors also noted dose-relatedincreases in mortality rates from nasopharyngeal and colon cancer in men, which,however, were not statistically significant. In this analysis, leukaemia and oesophageal,stomach or uterine cancers did not appear to be related to levels of arsenic (Wu et al.,1989).
ARSENIC IN DRINKING-WATER 153
pp97-166.qxd 11/10/2004 10:47 Page 153
In a later study, Chen and Wang (1990) (described in Section 2.1.1) used data onarsenic in well-water measured from 1974 to 1976 in 314 precincts and townshipsthroughout Taiwan. Based on a multiple regression analysis (adjusted for urbanization andage), mortality rates from prostate cancer significantly increased with higher average levelof arsenic. Age-adjusted mortality rates for cancers of the nasal cavity also correlated withaverage arsenic concentration in men and women for all precincts and townships and forthe south-western townships. Cancers of the oesophagus, stomach, small intestine, colon,rectum, pancreas, larynx, bone and cartilage, breast, cervix, ovary and brain andleukaemia were not significantly correlated. [The regression estimates were onlypresented for statistically significant results.]
Based on data from death certificates for the period 1971–94, Tsai et al. (1999)(described in Section 2.1.1) computed SMRs for the four townships that are endemic forBlackfoot disease using local (Chiayi County) and national (Taiwan) rates as the standard.Applying national rates, SMRs were elevated for cancers of the intestine, colon andprostate in men, cancers of the nasal cavity and larynx in both men and women, lym-phoma in men and women, leukaemia in men and cancers of the pharynx and bone inwomen. These SMRs were similarly elevated using the local mortality rates as thestandard. In addition, using the local rates as the standard, higher SMRs were found forcancers of the oesophagus in men, cancers of the stomach in men and women and cancersof the colon, rectum and brain in women for the four townships.
[Data from South-West Taiwan indicate a consistent pattern of increases in mortalityfrom prostate cancer in areas with high contamination by arsenic, and there is evidence ofa dose-related effect. These studies do not specifically address the issue of dose of expo-sure, nor do they raise issues of latency and duration. These issues cannot be addressedusing mortality as an end-point for prostate cancer since the disease has a low case-fatalityrate. One possible source of bias is that prostate cancer often goes undetected, and ahigher mortality rate in regions with known exposure to arsenic could occur if screeningfor cancer deaths is enhanced in the region.]
2.4.2 Chile
Ecological studyRivara et al. (1997) compared the mortality rates for various cancers in 1976 between
Antofagasta in Region II and the non-contaminated Region VIII. An elevated risk ofcancer of the larynx was observed in the arsenic-exposed Region II. Among the variousother cancers (17 sites) investigated, no other elevated SMRs were reported.
2.4.3 Japan
Cohort studies From about 1945 to 1959, wells in the small town of Nakajo-machi in Niigata
Prefecture became contaminated with arsenic (up to 3000 µg/L) from a factory producing
IARC MONOGRAPHS VOLUME 84154
pp97-166.qxd 11/10/2004 10:47 Page 154
King’s yellow (As203). Two uterine cancer deaths occurred from 1959 to 1992 in thehighest exposure category (≥ 500 µg/L), with an SMR for uterine cancer of around 3.0using the age- and cause-specific mortality rates from Niigata Prefecture (Tsuda et al.,1989, 1995). [No other cancer sites were discussed.]
2.4.4 North America
(a) Cohort studiesGarland et al. (1996) conducted a nested case–control study in the USA to investigate
the relationship between concentrations of arsenic and other trace elements in toenails andthe incidence of breast cancer. Cases and controls were selected from the Nurses’ HealthStudy cohort comprising 121 700 nurses aged 30–55 years living in 11 states of the USA.Toenail samples were obtained from 72% of 94 115 cohort members in 1982. A total of62 641 women provided toenail clippings and did not have a diagnosis of breast canceras of 1982. The nested study was based on the 433 women who had a diagnosis of breastcancer reported in mailed questionnaires in 1984 and 1986 and an age-matched controlgroup. Compared with the quintile, the adjusted odds ratio for breast cancer was 1.1(95% CI, 0.7–1.9) for the highest quintile of arsenic.
Lewis et al. (1999) reported SMRs for various cancers using a retrospective cohort ofresidents from Millard County, UT, USA. Of the multiple types of cancers examined,mortality was only elevated for prostate cancer [The limitations of this study have beencited in Section 2.1.4.].
(b) Case–control studies Infante-Rivard et al. (2001) conducted a population-based case–control study of child-
hood leukaemia (occurring before the age of 9 years) in Québec Province, Canada. Casesincluded individuals who were newly diagnosed with childhood leukaemia from 1980 to1993. Of 510 eligible cases, 491 participated (96.3%) and, of 588 controls, 493 took part(83.8%). The investigators sought drinking-water test data from 1970 onward through apostal questionnaire that yielded usable data from 112 of 202 municipalities (55%). Addi-tional data was provided from the Ministry of Municipal Distribution Systems in 1986.Further analysis of tap-water was performed by the study investigators and covered 103 ofthe municipalities. These data were linked to information on residential history derivedfrom interviews with the subjects’ parents, and the value used for exposure to arsenic wasthat of the subjects’ municipalities of residence for the closest year when data wereavailable. Values from multiple test results were averaged over a given year, and indivi-duals with private water systems were assigned the arsenic value of their municipality ofresidence. Separate exposure variables were computed for subjects’ pre- and postnatalperiods and included average arsenic levels and cumulative exposure. A logistic regressionanalysis included maternal age and level of schooling. The odds ratio for childhoodleukaemia above versus less than or equal to the 95th percentile (5 µg/L arsenic) was 0.9(95% CI, 0.5–1.8) for prenatal exposure and 1.4 (95% CI, 0.7–2.7) for postnatal exposure.
ARSENIC IN DRINKING-WATER 155
pp97-166.qxd 11/10/2004 10:47 Page 155
For cumulative exposure (above versus less than or equal to the 95th percentile), the oddsratios were 0.7 (95% CI, 0.4–1.3) for prenatal exposure and 1.1 (95% CI, 0.6–2.2) for post-natal exposure. [The study does not provide evidence of a link between childhoodleukaemia and exposure to arsenic through drinking-water either prenatally or postnatally.However, the drinking-water concentrations were relatively low (95% were below 5 µg/L)and the estimates were imprecise. Furthermore, the exposure estimates are subject to mis-classification, but there is no discussion on the variability of arsenic concentrations withinmunicipalities and the fraction of residents that used private systems that were assumed tocontain the same concentrations of arsenic as the public systems.]
2.4.5 Australia
Ecological study
In an ecological study using incidence data from the Victoria Cancer Registry for theyears 1982–91, Hinwood et al. (1999) calculated SMRs for 14 cancer sites (in addition toliver, lung, bladder and kidney) in 22 postcode areas characterized by a level of arsenic inwater > 0.01 mg/L in most areas. Incidence rates for all of Victoria were used as thestandard. Cancer sites that showed elevated rates with 95% CIs that excluded 1.0 wereprostate, melanoma, breast and chronic myeloid leukaemia. [The Working Group notedthat no information was presented on the actual use of water contaminated with arsenicfor drinking by the population.]
IARC MONOGRAPHS VOLUME 84156
pp97-166.qxd 11/10/2004 10:47 Page 156