Embed Size (px)
Citation preview

Diagnostic certainty as a source of medical practice variation in coronary heart disease: 1
Results from a cross-national experiment of clinical decision making 2
3
Karen E. Lutfey, Ph.D.1, 2
4
Carol L. Link, Ph.D.2 5
Lisa D. Marceau, M.P.H.2 6
Richard W. Grant, M.D. M.P.H.3 7
Ann Adams, Ph.D.4
8
Sara Arber, Ph.D5 9
Johannes Siegrist, Ph.D. 6 10
Markus Bönte, M.A. 7
11
Olaf von dem Knesebeck, Ph.D.7 12
John B. McKinlay, Ph.D.2
13
14
Published in Medical Decision Making, 2009, 29 (5): 606-618. 15
16
17
1Corresponding author. Tel: (617) 923-7747 ext. 313; email: [email protected] 18
2New England Research Institutes, Watertown, MA, USA 19
3Massachusetts General Hospital and Harvard Medical School, Boston, MA 20
4University of Warwick, Coventry, UK 21
5University of Surrey, Guildford, UK 22
6Dusseldorf University, Dusseldorf, Germany 23
7University of Hamburg, Hamburg, Germany 24
25
26

2
Diagnostic certainty as a source of medical practice variation in coronary heart disease: 1
Results from a cross-national experiment of clinical decision making 2
3
4
Abstract 5
We examined physician diagnostic certainty as one reason for cross-national medical 6
practice variation. Data are from a factorial experiment conducted in the United States, the 7
United Kingdom, and Germany, estimating 384 generalist physicians’ diagnostic and treatment 8
decisions for videotaped vignettes of actor patients depicting a presentation consistent with 9
coronary heart disease (CHD). Despite identical vignette presentations, we observed significant 10
differences across health care systems, with US physicians being the most certain and German 11
physicians the least certain (p < .0001). Physicians were least certain of a CHD diagnoses when 12
patients were younger and female (p < .0086), and there was additional variation by health care 13
system (as represented by country) depending on patient age (p < .0100) and race (p < .0021). 14
Certainty was positively correlated with several clinical actions, including test ordering, 15
prescriptions, referrals to specialists, and time to follow-up. 16
17
Key words: clinical decision making; medical practice variation; health disparities 18
19
20
21

3
Variations in the provision of healthcare and associated health disparities are a topic of 1
longstanding concern for policymakers, clinical providers, and health researchers alike. While 2
differences in clinical decision making (CDM) have been observed for many conditions (1), 3
coronary heart disease has received particular attention and has been shown repeatedly to result 4
in differential diagnostic and treatment decisions by physicians (2, 3). Differences have been 5
observed in the use of coronary revascularization services (4), hospitalization for hypertension 6
(5), history taking (6), as well as gender differences in attributions of cardiac-related symptoms 7
(7). 8
These variations in medical practice occur as a function of patient characteristics such as 9
race (4, 5), age (5, 7, 8), socioeconomic status (9-11), gender (12-14), and comorbidity status 10
(15), as well as provider and system attributes such as gender (16), attitudes toward aging (17), 11
perceptions of pressure from patients (18); and practice culture (19). Studies of the United 12
States, including especially the RAND Health Services Utilization Study (20) and the Dartmouth 13
Atlas of Health Care (21, 22) project, have consistency documented geographic variations in 14
healthcare and worked over the last two decades to understand why it occurs. Similar differences 15
have been observed cross-nationally among the US, France, and England (23); the US and 16
Canada (24); the United States and United Kingdom (25), among Eastern European countries 17
(26), and in the SYMPHONY trial, a study of 37 countries (27). 18
How physicians process complex and varied sources of information has been a topic of 19
interest for decades. Classic studies underscore the importance of threshold models for 20
conceptualizing the triggers that prompt physicians to do further testing, and if warranted, 21
provide treatment (28, 29). More recently, related literature in social psychology and economics 22
examines how physicians’ cognitive processing—particularly prejudice, stereotyping, 23
discrimination, and uncertainty—may bias their assessments of patients and decisions about their 24

4
treatment (30-32). Low health literacy also contributes to difficulties in chronic illness 1
management, and such challenges to doctor-patient communication may exacerbate physician 2
uncertainty (33, 34). This literature, which is quite focused on providing micro-level 3
explanations for observed variation, is often not equipped to also provide information about 4
cross-national differences. 5
We build on these two literatures by examining how physicians’ diagnostic certainty 6
functions in clinical decision making for coronary heart disease (CHD). Using cross-national 7
experiment data, we are able to simultaneously (1) address the role of diagnostic certainty in 8
observed variations and (2) estimate relative contributions of patient, provider, and health care 9
system influences on clinical decision making. 10
From a Bayesian decision theory perspective, these variations in clinical decision making 11
should be determined in part by the prevalence of the relevant condition in the larger population. 12
In cross-national studies, for example, women have slightly higher prevalence of angina relative 13
to men (despite higher mortality rates among men), a difference that should influence individual 14
clinical decisions (35-37). Research on the socially constructed aspects of health statistics, 15
however, suggests that biases in clinical decision making and medical treatment contribute 16
independently to differences in some types of health statistics (38). Additional work has shown 17
women have poorer outcomes after acute myocardial infarction (39) and in cardiovascular and 18
diabetes care (13, 14), both after adjusting for covariates. From this perspective, differences in 19
rates may not only reflect epidemiologic differences in underlying disease, but also cumulative 20
interactions between patients and physicians. 21
Using data from a video vignette experiment, we examine the magnitude and sources of 22
variation in CDM for identical presentations of CHD in three different health care systems: (1) 23
the free market medical system in the United States, (2) the government-based National Health 24

5
Service of the United Kingdom (40), and (3) the non-profit insurer based system used in 1
Germany (41). This work expands existing social psychological research on CDM to include 2
cross-national comparisons, as well as providing specific evidence for how uncertainty operates 3
in CDM. Building on earlier work showing physicians in different countries had comparable 4
rates of correct diagnoses, we find that diagnostic certainty has independent and unique effects 5
on clinical decision making (25). We address the following research questions: (1) How certain 6
were physicians of their diagnoses of CHD, and how did that vary by health care system? (2) 7
Which types of physicians were the most certain? (3) Which types of patients elicited the highest 8
certainty levels among physicians? (4) How did these patient and provider effects vary across 9
three countries? (5) How was diagnostic certainty associated with subsequent patient 10
management, such as information seeking, test ordering, prescribing, lifestyle recommendations, 11
and referrals/follow-up? 12
13
DATA AND METHODS 14
We conducted a factorial experiment to simultaneously measure the effects of: (a) patient 15
attributes (age, gender, race and socioeconomic status); (b) physician characteristics (gender and 16
years of clinical experience); and (c) separate healthcare systems (the US, the UK, or Germany) 17
on physician diagnostic certainty and subsequent medical decision making when providers are 18
presented with identical signs and symptoms indicative of CHD. Experiments were conducted in 19
the US (Massachusetts), the UK (the West Midlands, SE London and Surrey), and Germany 20
(Northern Rhine / Westfalia region) (42). A full factorial of combinations of patient age (55 vs. 21
75), gender, race (white vs. black in the US; white vs. Afro Caribbean in the UK; and white only 22
in Germany) and SES (lower vs. higher social class, depicted by occupation as a cleaner/janitor 23
vs. a teacher) was used for the videotaped vignette scenarios (24 = 16 unique vignettes). The 24

6
decision to omit the race factor from the German experiment was based on discussions with our 1
German colleagues, who advised us that the physicians in our sampling area saw few Black 2
patients in their everyday practices. Audios for the vignettes were dubbed into German and 3
backtranslated to ensure accuracy. One of the 16 combinations was shown to each physician. 4
CHD was selected for the vignettes because: a) it is among the most common and costly 5
problems presented by older patients to primary care providers (43); b) it represents a clinically 6
well-defined medical condition; c) it admits a range of diagnostic, therapeutic and lifestyle 7
actions; and d) its reported prevalence differs among the US, the UK, and Germany. Scripts for 8
the vignettes were developed from several tape-recorded role-playing sessions with experienced 9
clinical advisors, and professional actors were trained (under experienced physician supervision) 10
to realistically portray a patient presenting with the signs/symptoms of disease to a primary care 11
provider. Patients in the vignette presented with signs and symptoms that were consistent with 12
CHD, including chest pain worsening with exertion, pain in the back between the shoulder 13
blades, stress, and elevated blood pressure. All patients included a non-verbal “Levine’s fist,” a 14
well-known gesture indicative of cardiac pain. Because CHD is a spectrum condition, and live 15
patients do not typically present as clear-cut textbook cases of specific conditions, the vignette 16
also built in several red herring symptoms potentially indicative of a gastrointestinal diagnosis. 17
To this end, the patient also complained of indigestion, feeling worse after a large or spicy meal, 18
having pain similar to heartburn but unresponsive to antacids, and feeling full and “gassy.” This 19
was done not to specifically make the physicians’ diagnostic task more difficult, but to more 20
accurately represent how actual patients present, based on advice from our clinical advisors. The 21
vignette also incorporated references to the patient’s mood, including the spouse’s report that the 22
patient has been difficult to be around and the patient’s self-report of feeling irritated and having 23
decreased energy (see Appendix A for an illustrative excerpt from the vignette). 24

7
After viewing the videotaped vignette, physicians were asked, “What do you think is 1
going on with this patient?”, and for each possibility, they were asked for their level of certainty 2
on a scale of 0-100 (where 0 = no certainty and 100 = complete certainty). Physicians were asked 3
through an open-ended question from the interviewer to list their full set of differential 4
diagnoses, and if CHD was present anywhere on that list they were counted as having considered 5
the condition and the accompanying certainty level was included in the present analysis. 6
Physicians were also asked how they would manage the patient in terms of asking for addition 7
information, performing physical examination, ordering tests, prescribing medications, giving 8
lifestyle advice, and referring to other physicians. 9
Based on the theoretical approach outlined above and our concerns about the social 10
construction of epidemiologic base rates, we do not appeal to population rates of disease to 11
ascertain the “correctness” of a given diagnosis. Rather, we assume that while a physician’s 12
diagnostic priors (among many other sources of learning) may inform decision making, patient-13
specific clinical information should be used above and beyond those pre-existing base rates. 14
Therefore, the vignette for this study was purposely designed to present a set of signs and 15
symptoms sufficient to trigger a CHD diagnosis, regardless the epidemiologic prevalence in any 16
sub-group of the population. In this sense, the vignette provides sufficient information to suspect 17
the condition, regardless of the social characteristics of the patient. 18
The study used a probability sample of physicians selected from within each of four strata 19
within each country. To be eligible for selection, physicians had to: (a) be internists or family 20
practitioners in the US and in Germany, or general practitioners in the UK (to most accurately 21
capture the types of non-specialist physicians most likely to treat undiagnosed cases of CHD in 22
each country); (b) be trained at an accredited medical school in the country in which they 23
practiced (no international medical graduates were included); and (c) be currently in clinical 24

8
practice more than half-time. Within each country, physicians were stratified into four equal cells 1
by gender and level of experience, with “less” experience defined as those with 12 years since 2
graduation from medical school in the US or UK ( 7 years since licensure in Germany) and 3
those with “more” experience having 22 years since graduation from medical school in the US 4
or UK (≥17 years since licensure in Germany). These cutoff dates were chosen to act as a proxy 5
for clinical experience (which has been shown to affect clinical decision making, as discussed 6
above); to standardize as much as possible the amounts of clinical experience across countries; 7
and to create a clear separation between the strata. Twelve strata of physician characteristics 8
(gender, years of clinical experience [<12 or >22 years] and health care system 9
[US/UK/Germany]) were defined, with 32 physicians included in each stratum from each 10
country. This configuration generated a total of 384 physicians required to complete the design 11
the experiment (16 vignettes x 12 physician strata x 2 replications = 384)(Table 1). 12
Screening telephone calls were conducted to identify eligible subjects and an hour-long 13
appointment was scheduled for the interviewer to come to the physician’s place of work to show 14
the vignette and administer related questions. The interviews were conducted in 2001-2 (128 15
throughout Massachusetts, 64 from The Midlands and 64 throughout Surrey and SE London, 16
England) and in 2005-6 in Germany; no more than one physician was selected from each 17
practice. Each physician subject was provided a modest stipend to partially offset lost revenue 18
[$100 (US), £50 (UK), 100 Euros (Germany)] and to acknowledge his or her participation. 19
Quality control interviews and site visits were conducted and selected tape-recorded interviews 20
were reviewed by supervisors on a regular basis. 21
Analysis of variance was used to test the main effects and two-way interactions of the 22
design variables (patient gender, race, age, and SES, and physician gender and level of 23
experience) on the diagnostic certainty (0-100, with 0 for not at all certain and 100 for 24

9
completely certain). If the physician did not make a CHD diagnosis, his or her certainty for these 1
diagnoses was set to 0. To determine the effect of certainty on clinical decision making, logistic 2
regression was used for dichotomous variables (e.g., whether or not an EKG was ordered) and 3
analysis of covariance was used for continuous variables (e.g., number of days to next 4
appointment). Each model included as explanatory variables the design variables, certainty, and 5
the interaction of the design variables and certainty. Using backwards elimination, non-6
significant effects (at the 0.05 level) other than certainty were removed from the model, leaving a 7
parsimonious model. Due to the challenges of multiple testing, we emphasize consistency across 8
results and focus on identifying general patterns of physician certainty and treatment decisions. 9
Furthermore, the results we observe at the p < .01 level are unlikely to change. To facilitate 10
interpretation, we present actual p-values, unadjusted for multiple testing. To further facilitate 11
interpretation of results, we indicate in Tables 2 and 3 the number of expected and observed 12
significant results. 13
14
RESULTS 15
1. How certain were physicians and how did that vary by practice setting (country)? 16
Across all three countries, the vast majority of physicians correctly considered CHD 17
(74.2% in Germany, 88.3% in the UK, 95.3% in the US, and 85.9% overall, p < .0001), yet there 18
were also significant differences in how many physicians failed to consider CHD in each health 19
care system, with a 21.1% difference in rates between Germany and the US. 20
Physicians’ certainty levels for CHD diagnosis varied from 0 to 100, with an average of 21
52.1 (see Figure 1). Again, there was significant variation across countries, with the US 22
physicians having the highest average certainty (57.9), followed by the UK (46.4) and Germany 23
(38.9) (p<.0001)(Table 2). Using Tukey’s Method of multiple comparisons, we found that the 24

10
level of certainty in the US was significantly higher than that in either the UK or Germany, while 1
the certainty levels were statistically comparable in the UK and Germany. 2
3
2. Which physicians were the most certain? 4
We next examined whether physician characteristics (gender and years of experience) 5
were associated with certainty, independent of the health care system in which providers 6
practiced (Table 2). While there were no significant main effects for physician characteristics, 7
we did observe an interaction between patient race and physician level of experience (Figure 2a). 8
With white patients, physicians had comparable certainty levels (54.1 vs. 53.0, less and more 9
experienced, respectively). With black patients, however, more experienced physicians had 10
increased certainty (56.9) while those with less experience were less certain (44.5). 11
12
3. With which patients were physicians most certain? 13
Independent of health care system differences, physician certainty varied significantly 14
according to the gender of the patient, with physicians reporting higher average certainty levels 15
with male versus female patients (51.8 vs. 43.7, p = .0058) and by age with higher certainty for 16
older patients (53.1 vs. 42.4, p = .0003). We also observed an interaction between patient age and 17
gender, such that physicians were much less certain in making a CHD diagnosis for younger 18
women (34.5) with otherwise identical symptom presentation (p = .0086) (Figure 2b). There 19
were no main effects of patient race or SES on certainty (Table 2). 20
21
4. How did patient and provider effects vary across countries? 22
In addition to the main effect differences between countries, we also observed variation 23
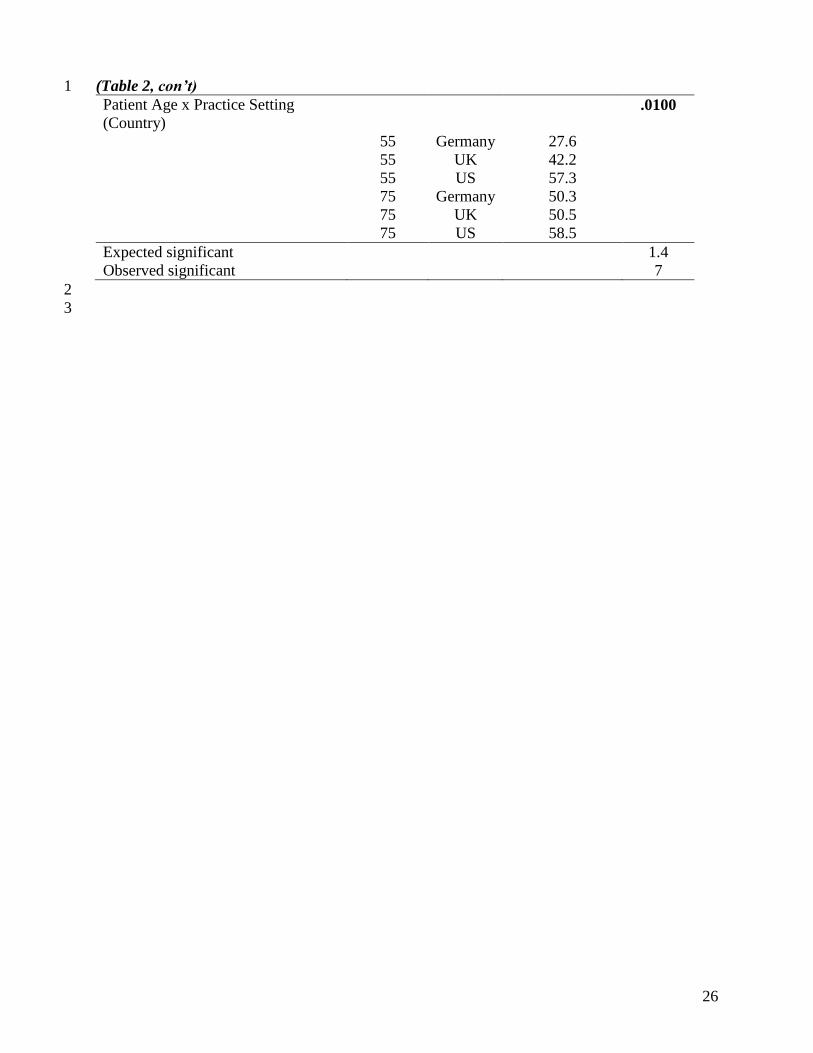
between countries according to characteristics of the presenting patient (Table 2). First, we 24

11
observed an interaction between patient age and health care system, with US physicians having 1
comparable diagnostic certainty for younger (55-year-old) and older (77-year-old) patients (57.3 2
vs. 58.5), German physicians having the greatest difference in certainty for the two types of 3
patients (27.6 vs. 50.3), and UK physicians falling in between (42.2 vs. 50.5) (p = .0100) (Figure 4
2c). Second, there was an interaction between health care system and patient race. While 5
physicians in the US and UK had similar certainty levels for black patients (51.2 vs. 50.3), their 6
certainty levels diverged when the patient was white, with US physicians having increased 7
certainty and UK physicians being less certain (42.5 vs. 64.7, p = .0015) (Figure 2d). 8
9
5. What was the effect of certainty on clinical decision making? 10
In turn, physicians’ diagnostic certainty for CHD significantly influenced their 11
subsequent diagnostic and therapeutic clinical actions (Tables 3a and 3b). Logistic regression 12
results showed that for each ten point increase in certainty for a CHD diagnosis, physicians were 13
less likely to ask questions about the patient’s psychological state (OR 0.91, p = .0163) or social 14
environment (OR 0.88, p = .0062), but they were more likely to ask about other general 15
information (OR 1.10, p = .0232) (Table 3b). We also observed an interaction of patient SES and 16
certainty on the odds of asking questions about smoking. As the certainty of the CHD diagnosis 17
increased, physicians were more likely to ask lower SES patients about smoking (OR 1.14, p = 18
.0065), but certainty had no effect on the likelihood of physicians asking upper SES patients 19
about smoking. 20
Certainty was also significant for test ordering behavior. For example, as certainty of a 21
CHD diagnosis increased, physicians from the US and the UK were significantly more likely to 22
order at least one diagnostic test for CHD (p <.0001), while this relationship did not hold for 23
German physicians (Table 3a). Furthermore, as certainty increased, UK and US physicians 24

12
ordered greater numbers of CHD-related tests (p < .0001), while certainty did not significantly 1
affect the number of CHD-related tests that the German physicians ordered (Table 3a). 2
However, increased certainty was associated with increased likelihood of physicians from all 3
three countries ordering stress tests and ECG/EKG tests (p < .0001), and this effect was the 4
strongest in the US (OR 1.95, p<.0001)(Table 3b). 5
Increased certainty was associated with higher odds of writing a CHD-appropriate 6
prescription (beta blockers, calcium channel blockers, aspirin, and short acting nitrates) (OR 7
1.53, p <. 0001) in all three countries. Higher certainty of a CHD diagnosis also increased the 8
odds of a physician referring the patient to a cardiologist (OR 1.23, p < .0001). Finally, 9
increased certainty was significant for predicting how soon a physician would request to see the 10
patient again (p = .0003), with a repeat visit requested 0.44 days sooner per 10 point increase in 11
certainty. 12
13
DISCUSSION 14
We observed significant differences between health care systems, with US physicians 15
having the highest levels of certainty. As expected, physicians were least certain of their CHD 16
diagnoses with younger female patients (12, 44). In addition, there was racial variation 17
depending on the physician’s level of experience and variation by health care system depending 18
on patient age and race. Increased certainty was associated with differences in information 19
seeking as well as increased test ordering, prescriptions, referrals to cardiologists, and shorter 20
time to follow up. 21
Previous studies of medical practice variation have largely focused on either system-level 22
social and economic patterns in CDM or on physicians’ individual-level cognitive processing as 23
mechanisms that may generate such variation. The factorial design of our experiment allowed for 24
unconfounded estimates of the simultaneous effects of patient characteristics, provider attributes, 25

13
and healthcare systems (as represented by country) on physicians’ certainty of CHD diagnoses 1
and their subsequent clinical actions. With our analytic approach, we were able to capture 2
physicians at all points on the certainty spectrum rather than excluding those who did not list 3
CHD among their differential diagnosis selections. While those who did not consider CHD 4
among their differential diagnosis selections did not provide an explicit certainty value, we know 5
their certainty concerning the presence of CHD was low because they were allowed to list a full 6
set of diagnoses (we recognize that physicians may have high certainty that CHD is absent from 7
the vignette, but this is beyond the scope of the present analysis). Therefore, if they were treated 8
as missing they would not be missing at random. By increasing the variability, our estimates are 9
rendered more conservative due to a decrease in power. 10
The sample size of 384 allows us to detect a difference in certainty of 12 points with 97% 11
power, assuming a standard deviation of 30 (which, assuming a unimodal Beta distribution of 0-12
1, is the upper bound of a standard deviation). That is, a true 12 point difference in certainty 13
between two groups will be detected 97 percent of the time at = 0.05. Because the experiment 14
was replicated, a pure error term with 192 degrees of freedom was used to test all effects using 15
analysis of variance. Due to the omission of the race factor for the German experiment 16
(explained above), only the US and UK data are considered for the effect of patient race on 17
certainty. For all other analyses, all data were considered. 18
The main effects related to patient characteristics (decreased certainty with female and 19
younger patients) partially corroborate Bayesian perspectives and studies of uncertainty and 20
statistical discrimination (31, 45) suggesting that when physicians are uncertain, they are likely 21
to make diagnostic decisions that are consistent with existing epidemiologic base rates. In this 22
case prior assumptions overwhelm the presenting patient-specific data, thereby contributing to 23
the reification of some types of existing health statistics. Most importantly, these findings extend 24

14
previous work by showing that certainty—not simply identifying a diagnosis, but having 1
diagnostic certainty about that condition—has an independent effect on clinical actions (46). 2
Therefore, these results suggest that having CHD on the differential diagnosis list is necessary, 3
but not sufficient, for physicians to take appropriate therapeutic actions; this result is consistent 4
with the notion that physicians need to pass certainty thresholds in order to order more tests or 5
treat a patient (28). By extension, improving disparities in CHD outcomes is not just a matter of 6
physicians learning to more appropriately consider CHD in specific populations (for example, 7
women), but also to be able to do so with sufficient certainty to trigger appropriate clinical 8
actions to improve morbidity and mortality outcomes. 9
However, these perspectives do not fully explain our results and the persistence of some 10
between-health care system differences implies that features of the broader sociological, cultural, 11
and organizational environments are also relevant to decision making. Beyond diagnostic 12
certainty, observed cross-national variation in CHD diagnosis and treatment may also be a 13
function of differences in a series of influences that are beyond the scope of the present analysis 14
or our study more generally. These include both patients’ and physicians’ cultural expectations 15
for medical practice and treatment as well as biological variations in the prevalence of CHD and 16
related conditions at a population level, such that physicians in different healthcare systems may 17
be differentially equipped to identify CHD with certainty. For example, previous research has 18
shown cross-cultural differences in the relationship between symptoms and underlying 19
conditions (47, 48). Other possible explanations include funding mechanisms, expectations for 20
physicians to achieve diagnostic certainty in a brief period of time, modes of practice, and access 21
to resources across the three countries. For example, economic reimbursement policies may 22
translate to more pressure on US physicians to achieve a firm diagnosis and management plan 23
during the initial patient consultation so they can be paid, whereas in the UK and Germany 24

15
physicians may tend to make these decisions over a series of consultations close together in time. 1
Similarly, ready availability of technological equipment in Massachusetts in conjunction with a 2
fear of lawsuits for missed diagnoses may lead to increased testing in the US relative to 3
physicians in the UK or Germany, while increased rates of referral among UK and German 4
physicians (25) may explain lower rates of testing and prescription treatment relative to the US. 5
Increased regulation in the UK with pay-for-performance may also contribute to the U.K. 6
physicians’ higher certainty relative to their German counterparts, where professional pressures 7
and regulations are not yet as explicit as in the U.S. (49). Most generally, physician learning is 8
known to be related to the local context of practice, such that physicians may either self-select 9
into environments with practice styles like their own, or they may adapt to the local culture—10
either type of pattern could exist within the local contexts that were selected from each country 11
for this study. 12
Every study represents a balance between internal and external validity. We recognize 13
that our vignette-based approach has some limitations compared to studies of behavior in natural 14
interaction—the most obvious being that physicians do not directly interact with the patient in 15
the vignette. For present purposes, vignettes offer several key advantages over alternative 16
methods: (1) they allow for the manipulation of several variables at once and the measurement of 17
unconfounded effects, thereby “isolating physicians’ decision making from other factors in the 18
environment” (50); (2) standardization of case mix; (3) vignette-based studies allow for the 19
collection of a large amount of information simultaneously from a large number of subjects; (4) 20
make efficient use of time; and (5) are cost-effective (for example, standardized patients would 21
have been prohibitively expensive in this context). In a direct comparison of vignettes, 22
standardized patients, and chart abstraction, Peabody and colleagues (51) validated the use of 23
vignettes for studying quality of outpatient care, and studies comparing vignettes with 24

16
standardized patients and other methods corroborate the result that vignettes are ecologically 1
valid for studies of medical decision making (50, 52, 53). 2
We took four precautionary steps in an attempt to minimize possible threats to external 3
validity and compensate for the artificial aspects of the experimental situation (i.e., that 4
physicians may behave differently with a videotaped patient under experimental conditions 5
compared with real patients in an everyday clinical setting). First, considerable effort was 6
devoted to ensuring the clinical authenticity of the videotaped presentation. Expert clinical 7
consultants were actively involved in all stages of the process, from early stages of role-playing 8
and script development to final stages of film shooting, where they oversaw vignette filming to 9
determine face and content validity. Second, the doctors viewed the tapes in the context of their 10
practice day (often during their lunch periods) to maximize the likelihood that they encountered 11
real patients before and after they viewed the patient in the videotape, and also so they were in a 12
physical setting they associated with decision making. Third, the doctors were specifically 13
instructed at the outset to view the patient as one of their own patients and to respond as they 14
would typically respond in their own practice. In the U.S., 90.6% of the doctors considered the 15
vignettes to be very or reasonably typical, 91.4% in the U.K. and 81.3% in Germany. 16
Our study has limitations that underscore the need for additional research. First, 17
questions remain about how physicians cognitively process these cues from patients. Previous 18
research in cognitive psychology has suggested that physicians often rely on pattern recognition 19
as well as more analytic types of processing, such as Bayesian decision making, when evaluating 20
patient cues (54, 55). However, these questions are beyond the scope of the present study and 21
these data do not allow us to specify the exact cognitive and psychological processes physicians 22
use when interpreting information from the vignettes. A similar study of US physicians (with the 23
same CHD vignette) primed physicians to determine whether the under-diagnosis of CHD in 24

17
some patient populations was due to physicians not considering that diagnosis, or considering it 1
and then eliminating it from their differential diagnosis (56). Also beyond the scope of this study, 2
but potentially related, is the question of differences in clinical decision making practices 3
between family practitioners and internists, despite both groups being likely to treat the type of 4
patient depicted in the vignette. 5
While the cross-national component of our study identified persistent differences between 6
countries, there remains limited generalizability from each group of physicians to the entire 7
population of physicians in their respective countries. In terms of statistical and clinical 8
significance, our results are relatively modest and therefore limited in their ability to explain the 9
wide range of cross-national variations that have been identified in existing literature. However, 10
the possible explanations outlined above build on our current results and are promising avenues 11
for future inquiry. 12
In summary, our findings underscore the role of uncertainty during the clinical decision 13
making process in contributing to, or amplifying, CHD-related disparities. To the extent that 14
inequalities are generated from within healthcare systems, researchers and policy makers should 15
continue to develop interventions targeted at the level of the patient-physician encounter while 16
also considering which broader, system-level factors influence individual physician behaviors. 17
Because diagnostic certainty is so important for understanding subsequent clinical actions, our 18
results also highlight the need for interventions to not only increase diagnostic accuracy, but also 19
to increase certainty in order to lead to optimal therapeutic actions. 20
21
22

18
Acknowledgement: Financial support for this study was provided entirely by a grant from 1
National Institutes of Health, National Institute on Aging (Grant #AG16747). The study 2
sponsors had no involvement in the study design; in the collection, analysis, and interpretation of 3
data; in the writing of the report; or in the decision to submit the paper for publication. 4
5
REFERENCES 6
1. Institute of Medicine. Unequal Treatment: Confronting Racial and Ethnic Disparities in 7
Healthcare. Washington, D.C.: The National Academies Press; 2003. 8
2. Ayanian JZ, Epstein AM. Differences in the use of procedures between women and men 9
hospitalized for coronary heart disease. N Engl J Med 1991;325(4):221-5. 10
3. Schwartz LM, Fisher ES, Tosteson NA, Woloshin S, Chang CH, Virnig BA, et al. 11
Treatment and health outcomes of women and men in a cohort with coronary artery disease. 12
Arch Intern Med 1997;157(14):1545-51. 13
4. Popescu I, Vaughan-Sarrazin MS, Rosenthal GE. Differences in mortality and use of 14
revascularization in black and white patients with acute MI admitted to hospitals with and 15
without revascularization services. JAMA 2007;297(22):2489-95. 16
5. Holmes JS, Arispe IE, Moy E. Heart disease and prevention: race and age differences in 17
heart disease prevention, treatment, and mortality. Med Care 2005;43(3 Suppl):I33-41. 18
6. James TL, Feldman J, Mehta SD. Physician variability in history taking when evaluating 19
patients presenting with chest pain in the emergency department. Acad Emerg Med 20
2006;13(2):147-52. 21
7. Martin R, Gordon EE, Lounsbury P. Gender disparities in the attribution of cardiac-22
related symptoms: contribution of common sense models of illness. Health Psychol 23
1998;17(4):346-57. 24

19
8. McKinlay JB, Potter DA, Feldman HA. Non-medical influences on medical decision-1
making. Soc Sci Med 1996;42(5):769-76. 2
9. Armstrong DL, Strogatz D, Wang R. United States coronary mortality trends and 3
community services associated with occupational structure, among blacks and whites, 1984-4
1998. Soc Sci Med 2004;58(11):2349-61. 5
10. Fincher C, Williams JE, MacLean V, Allison JJ, Kiefe CI, Canto J. Racial disparities in 6
coronary heart disease: a sociological view of the medical literature on physician bias. Ethn Dis 7
2004;14(3):360-71. 8
11. McKinlay JB, Link CL, Freund KM, Marceau LD, O’Donnell AB, Lutfey KE. Sources of 9
Variation in Physician Adherence with Clinical Guidelines: Results from a Factorial Experiment. 10
Journal of General Internal Medicine 2007;22(3):289-96. 11
12. Arber S, McKinlay JB, Adams A, Marceau LD, Link CL, O’Donnell AB. Patient 12
Characteristics and Inequalities in Doctors’ Diagnostic and Management Strategies relating to 13
CHD: A Video-simulation Experiment. Social Science and Medicine 2006;62(1):103-15. 14
13. Bird CE, Fremont AM, Bierman AS, Wickstrom S, Shah M, Rector T, et al. Does quality 15
of care for cardiovascular disease and diabetes differ by gender for enrollees in managed care 16
plans? Womens Health Issues 2007;17(3):131-8. 17
14. Fremont AM, Correa-de-Araujo R, Hayes SN. Gender disparities in managed care: it's 18
time for action. Womens Health Issues 2007;17(3):116-9. 19
15. Wexler DJ, Grant RW, Meigs JB, Nathan DM, Cagliero E. Sex disparities in treatment of 20
cardiac risk factors in patients with type 2 diabetes. Diabetes Care 2005;28(3):514-20. 21
16. Britt H, Bhasale A, Miles DA, Meza A, Sayer GP, Angelis M. The sex of the general 22
practitioner: a comparison of characteristics, patients, and medical conditions managed. Med 23
Care 1996;34(5):403-15. 24

20
17. Collins E, Katona C, Orrell M. Management of depression in the elderly by general 1
practitioners: II. Attitudes to ageing and factors affecting practice. Fam Pract 1995;12(1):12-7. 2
18. Armstrong D, Fry J, Armstrong P. Doctors' perceptions of pressure from patients for 3
referral. BMJ 1991;302(6786):1186-8. 4
19. Curoe A, Kralewski J, Kaissi A. Assessing the cultures of medical group practices. J Am 5
Board Fam Pract 2003;16(5):394-8. 6
20. Brook RH, Park RE, Chassin MR, Kosecoff J, Keesey J, Solomon D. Do Patient, 7
Physician, and Hospital Characteristics Affect Appropriateness and Outcome of Selected 8
Procedures? Santa Monica, CA: RAND; 1991. 9
21. Goodman DC, Grumbach K. Does having more physicians lead to better health system 10
performance? JAMA 2008;299(3):335-7. 11
22. Wennberg JE, Fisher ES, Skinner JS. Geography and the debate over Medicare reform. 12
Health Aff (Millwood) 2002;Suppl Web Exclusives:W96-114. 13
23. Weisz D, Gusmano MK, Rodwin VG. Gender and the treatment of heart disease in older 14
persons in the United States, France, and England: a comparative, population-based view of a 15
clinical phenomenon. Gend Med 2004;1(1):29-40. 16
24. Pilote L, Saynina O, Lavoie F, McClellan M. Cardiac procedure use and outcomes in 17
elderly patients with acute myocardial infarction in the United States and Quebec, Canada, 1988 18
to 1994. Med Care 2003;41(7):813-22. 19
25. McKinlay J, Link C, Arber S, Marceau L, O’Donnell A, Adams A, et al. How do Doctors 20
in Different Countries Manage the Same Patient? Results of a Factorial Experiment Health 21
Services Research 2006;41(6):2182-2200. [Erratum in 41(6):2303.]. 22
26. Gurjeva OS, Bukhman G, Murphy S, Cannon CP. Treatment and outcomes of eastern 23
Europeans with coronary syndromes in OPUS-TIMI 16. Int J Cardiol 2005;100(1):101-7. 24

21
27. Kramer JM, Newby LK, Chang WC, Simes RJ, Van de Werf F, Granger CB, et al. 1
International variation in the use of evidence-based medicines for acute coronary syndromes. Eur 2
Heart J 2003;24(23):2133-41. 3
28. Pauker SG, Kassirer JP. The threshold approach to clinical decision making. N Engl J 4
Med 1980;302(20):1109-17. 5
29. Pauker SG, Kassirer JP. Decision analysis. N Engl J Med 1987;316(5):250-8. 6
30. van Ryn M. Research on the provider contribution to race/ethnicity disparities in medical 7
care. Med Care 2002;40(1 Suppl):I140-51. 8
31. Balsa AI, McGuire TG, Meredith LS. Testing for statistical discrimination in health care. 9
Health Serv Res 2005;40(1):227-52. 10
32. Lutfey KE, Ketcham JD. Patient and provider assessments of adherence and the sources 11
of disparities: evidence from diabetes care. Health Serv Res 2005;40(6 Pt 1):1803-17. 12
33. Villaire M, Mayer G. Chronic illness management and health literacy: an overview. J 13
Med Pract Manage 2007;23(3):177-81. 14
34. Safeer RS, Keenan J. Health literacy: the gap between physicians and patients. Am Fam 15
Physician 2005;72(3):463-8. 16
35. Bittner V. Angina pectoris: reversal of the gender gap. Circulation 2008;117(12):1505-7. 17
36. Hemingway H, Langenberg C, Damant J, Frost C, Pyorala K, Barrett-Connor E. 18
Prevalence of angina in women versus men: a systematic review and meta-analysis of 19
international variations across 31 countries. Circulation 2008;117(12):1526-36. 20
37. Shaw LJ, Lewis JF, Hlatky MA, Hsueh WA, Kelsey SF, Klein R, et al. Women's 21
Ischemic Syndrome Evaluation: current status and future research directions: report of the 22
National Heart, Lung and Blood Institute workshop: October 2-4, 2002: Section 5: gender-23
related risk factors for ischemic heart disease. Circulation 2004;109(6):e56-8. 24

22
38. McKinlay JB. Some contributions from the social system to gender inequalities in heart 1
disease. J Health Soc Behav 1996;37(1):1-26. 2
39. Marrugat J, Gil M, Sala J. Sex differences in survival rates after acute myocardial 3
infarction. J Cardiovasc Risk 1999;6(2):89-97. 4
40. Light DW. Universal health care: lessons from the British experience. Am J Public 5
Health 2003;93(1):25-30. 6
41. Altenstetter C. Insights from health care in Germany. Am J Public Health 2003;93(1):38-7
44. 8
42. Fisher RA. Statistical Methods, Experimental Design and Scientific Inference. New 9
York: Oxford University Press; 1990. 10
43. Cohen JW, Krauss NA. Spending and Service Use Among People with the Fifteen Most 11
Costly Medical Conditions. Health Affairs 2003;22 (2):129-38. 12
44. Arber S, McKinlay JB, Adams A, Marceau LD, Link CL, O’Donnell AB. Influence of 13
Patient Characteristics on Doctors’ Questioning and Lifestyle Advice for Coronary Heart 14
Disease: A UK/US Video Experiment. British Journal of General Practice 2004;54(506):673-678 15
45. Balsa AI, McGuire TG. Statistical discrimination in health care. J Health Econ 16
2001;20(6):881-907. 17
46. Lutfey KE, Link CL, Grant RW, Marceau LD, McKinlay JB. Is certainty more important 18
than diagnosis for understanding race and gender disparities?: An experiment using coronary 19
heart disease and depression case vignettes. Health Policy 2008. 20
47. Staniland JR, Clamp SE, de Dombal FT, Solheim K, Hansen S, Ronsen K, et al. 21
Presentation and diagnosis of patients with acute abdominal pain: comparisons between Leeds, 22
U.K. and Akershus county, Norway. Ann Chir Gynaecol 1980;69(6):245-50. 23

23
48. Wigton RS. Social Judgement Theory and Medical Judgement. Thinking and Reasoning 1
1996;2(2/3):175-90. 2
49. Campbell S, Reeves D, Kontopantelis E, Middleton E, Sibbald B, Roland M. Quality of 3
primary care in England with the introduction of pay for performance. N Engl J Med 4
2007;357(2):181-90. 5
50. Veloski J, Tai S, Evans AS, Nash DB. Clinical vignette-based surveys: a tool for 6
assessing physician practice variation. Am J Med Qual 2005;20(3):151-7. 7
51. Peabody JW, Luck J, Glassman P, Dresselhaus TR, Lee M. Comparison of vignettes, 8
standardized patients, and chart abstraction: a prospective validation study of 3 methods for 9
measuring quality. JAMA 2000;283(13):1715-22. 10
52. Dresselhaus TR, Peabody JW, Lee M, Wang MM, Luck J. Measuring compliance with 11
preventive care guidelines: standardized patients, clinical vignettes, and the medical record. J 12
Gen Intern Med 2000;15(11):782-8. 13
53. Robra BP, Kania H, Kuss O, Schonfisch K, Swart E. [Determinants of hospital 14
admission--investigation by case vignettes]. Gesundheitswesen 2006;68(1):32-40. 15
54. Brooks LR, LeBlanc VR, Norman GR. On the difficulty of noticing obvious features in 16
patient appearance. Psychol Sci 2000;11:112–7. 17
55. Eva KW, Brooks LR. The underweighting of implicitly generated diagnoses. Acad Med 18
2000;75(Supplement):81–83. 19
56. Lutfey KE, Eva KW, Gerstenberger E, Link CL, McKinlay JB. The Cognitive Basis of 20
Diagnostic and Treatment Disparities in Coronary Heart Disease: Results of a Factorial 21
Experiment. Unpublished manuscript 2008. 22
23
24

24
1
Table 1. Physician Enrollment in Study. 2 3
4
5
6
7
8
9
*“Less” experience is defined as those with 12 years since graduation from medical school in 10
the US or UK ( 7 years since licensure in Germany). 11 **
“More” experience is defined as having 22 years since graduation from medical school in the 12
US or UK (≥17 years since licensure in Germany). 13
US
(N=128 in
Massachusetts)
UK
(N=64 from The
Midlands; N=64 from
Surrey/SE London)
Germany
(N=128)
Level of experience
Less* More
** Less More Less More Total
Male 32 32 32 32 32 32 192
Female 32 32 32 32 32 32 192
Total 64 64 64 64 64 64 384
Response
rate
64.9%
59.6%
65.0%

25
Table 2: Analysis of variance results for certainty regarding CHD (main effects and 1
significant [p < 0.05] two way interactions). 2 3
Experimental Factor Mean
Certainty
p-value
Patient Gender .0058
Male 51.8
Female 43.7
Patient Age, years .0003
55 42.4
75 53.1
Patient Race (UK / US only) .4024
Black 50.7
White 53.6
Patient SES .1998
Lower 45.9
Upper 49.6
Physician Gender .7221
Male 48.3
Female 47.2
Physician Experience .1575
Less 45.7
More 49.8
Practice Setting (Country) <.0001
Germany 38.9
UK 46.4
US 57.9
Patient Gender x Patient Age .0086
Male 55 50.3
75 53.3
Female 55 34.5
75 52.9
Patient Race x Practice Setting
(Country)
.0021
(UK/US only for p-value) Germany White 38.9
UK Black 50.3
UK White 42.5
US Black 51.2
US White 64.7
Patient Race x Level of Experience
(UK / US only)
.0500
Black less 44.5
Black more 56.9
White less 54.1
White more 53.0
4
26
(Table 2, con’t) 1
Patient Age x Practice Setting
(Country)
.0100
55 Germany 27.6
55 UK 42.2
55 US 57.3
75 Germany 50.3
75 UK 50.5
75 US 58.5
Expected significant 1.4
Observed significant 7
2
3

27
Table 3. Effect of Certainty regarding CHD on Clinical Decision Making. 1
3a. Continuous Variables (Change per 10 point increase in certainty). 2 3
4
Variable Change per 10
point increase in
certainty
95% confidence
interval
P
Number of questions -0.04 -0.15, 0.07 .4178
Number of examinations 0.06 -0.02, 0.14 .1137
Number of tests for CHD
Germany 0.02 -0.06, 0.10 .5815
UK 0.56 0.48, 0.64 <.0001
US 0.39 0.31, 0.47 <.0001
Time to next appointment (days) -0.44 -0.68, -0.20 .0003
Number of pieces of lifestyle advice -0.02 -0.07, 0.03 .5360
Expected significant .25
Observed significant 3
5
6

28
Table 3. Effect of Certainty regarding CHD on Clinical Decision Making. 1
3b. Dichotomous Variables (Odds ratio per 10 point increase in certainty). 2
Variable OR per 10
point
increase in
certainty
95% confidence
interval
p
Information seeking
4 or more questions 1.00 0.92, 1.08 .9332
Questions about:
pathology 0.96 0.89, 1.03 .2704
medical history 1.06 0.98, 1.14 .1675
pain 1.03 0.96, 1.11 .4437
smoking
lower SES patient 1.14 1.04, 1.25 .0065
upper SES patient 1.00 0.91, 1.09 .9417
alcohol 0.96 0.87, 1.05 .3215
psychological state 0.91 0.84, 0.98 .0163
social questions 0.88 0.81, 0.96 .0062
general questions 1.10 1.01, 1.19 .0232
Physical Examination
Complete physical 0.99 0.90, 1.09 .8828
Test ordering
Order tests for CHD
Germany 1.06 0.97, 1.17 .1714
UK 1.86 1.53, 2.24 <.0001
US 1.91 1.56, 2.33 <.0001
Stress test 1.34 1.22, 1.47 <.0001
ECG/EKG
Germany 1.46 1.28, 1.66 <.0001
UK 1.31 1.18, 1.45 <.0001
US 1.95 1.61, 2.36 <.0001
Prescription writing
CHD appropriate prescription 1.53 1.38, 1.70 <.0001
Referrals
Referral to cardiologist 1.23 1.12, 1.36 <.0001
Referral to other medical
professional
0.93 0.85, 1.00 .0641
Advice giving
Advice about:
Diet 0.97 0.91, 1.04 .4291
Smoking 1.00 0.92, 1.09 .9896
Alcohol 0.94 0.86, 1.02 .1446
Relaxation 0.91 0.81, 1.03 .1434
Exercise 1.07 0.94, 1.22 .3009
Weight 0.99 0.85, 1.17 .9424
Expected significant 1.1
Observed significant 12

29
Appendix A. Illustrative excerpt from vignette script for CHD. 1 2
Doctor: So, what brings you here today? 3
4
Patient: Actually, I’ve been having a fair amount of indigestion. 5
6
Doctor: Indigestion? 7
8
Patient: Yes. 9
10
Doctor: Can you describe it? 11
12
Patient: Yes, I just sort of get this feeling right here (rubs chest/stomach area) … it’s not 13
really a pain, actually. It’s just really uncomfortable. It’s usually after a big meal, if I’ve 14
eaten too much, or if the food’s particularly spicy, maybe. I sometimes feel kind of sick, too. 15
16
Doctor: Spicy foods, mostly, or does this happen after other foods too. 17
18
Patient: Actually, it’s probably more common after a big meal, and especially if I have to 19
rush to get somewhere afterwards. I get sort of queasy. It’s really uncomfortable. 20
21
Doctor: How long has this been going on? 22
23
Patient: About three months. 24
25
Doctor: Would you say this is something new, or has this kind of thing happened before? 26
Patient: No, this is new. Now, sometimes I do get heartburn, but that usually goes away 27
with antacids. 28
29
Doctor: How is this similar or different from the heartburn? 30
31
Patient: Well, the heartburn’s right here too (massaging the same spot), but it burns. This 32
other stuff is just, um, just a bad feeling. It’s hard to describe. 33
34
Doctor: Tell me about the last time this happened. Where were you? 35
36
Patient: (pauses, thinking) The last time? We had just gone out for a meal and were 37
walking to the car, quickly I remember, it was chilly. And I started to get the feeling. 38
39
Doctor: What did you do? 40
41
Patient: I stopped. And tried to get a deep breath in. 42
43
Doctor: Did that seem to help? 44
45
Patient: Yes, a bit. My [wife/husband] came over and asked if I was OK. I said, sure, I’m fine 46
and we got into the car. After a few minutes of driving, the feeling began to go away. 47
48