Embed Size (px)
Citation preview

0
Localiza Rent a Car S.A.2Q06 – Public Meeting

1
The car rental market > US$ 30 BL
• Traded around US$ 11 billion(2005)growth estimate of 2.8% p.a.(2004 and 2009)72% of the consolidatedmarket (2001)33% of the revenue is fromairports
EUROPEEUROPE
• traded US$ 19 billion (2005)growth estimate of 3.6% p.a (2004 and 2009)92% of the consolidated market(2004)50% of the revenue is fromairports
USAUSA
• Traded around R$ 2.91 billion(2005)historical average growth of 12%p.a. (2000 and 2005)33% of the consolidated market(2005)
BRAZILBRAZIL

2
Overview of the rental car industry
Car makers exit and entrance of private equity funds:
Sale of Hertz by Ford
Sale of Europcar by Volkswagen
Access of capital market (USA):
Avis – senior notes and floating rate notes
Hertz – IPO
New players in the Brazilian fleet rental market:
ALD – Societe Generale
ARVAL – BNP Paribas
Brazilian car rental market under consolidation process
Increase of new cars prices, in line with inflation

3
Recent Achievements – 2Q06
67th stock of IBrX – Brazilian index
Best IR performance on IPO (IR Magazine Awards 2006)
Best car franchiser in Brazil in 2006 (“Pequenas Empresas, Grandes Negócios”
Magazine)
One of the 50 most admired HRs in Brazil (Gestão and RH Editoras’s research)

4
Integrated business platform
Synergies:
cost reduction,
cross selling,
bargaining power
195 agencies in 8 countries7,004 cars
15 points of sale79% sold to final consumer
127 agencies19,650 cars
12,584 cars
In 1H06: 12 new own agencies and 2 new used cars points of saleIn 1H06: 12 new own agencies and 2 new used cars points of sale

5
Competitive advantages
BargainingPower
More competitiveness
Market shareincrease
Gains of scale
Strong brandGeographical distribution
Integrated platformYield management
Know-how IT

6
Growth Opportunities
Air Traffic
GDPelasticity
Consolidation
Credit cards
Replacement
Fleet outsourcing

7
Strategies
Short-term:
Maintain profitability(Net margin, ROE and EBITDA margin)
EVA
Long-term:
Increase business volume through organic growth and the opening of new agencies, leveraging on growth and consolidation opportunities and obtaining gains of scale

8
2Q06 Results Presentation(R$ million - USGAAP)
Localiza Rent a Car S.A.

9
2T06 Highlights
68.4% utilization rate in car rental.
43.3% increase in car rental business volume
33.7% increase in fleet rental business volume
63,7% increase in car rental EBITDA (excluding used cars segment)
44.5% increase in fleet rental EBITDA (excluding used cars segment)
67th stock in IBrX – Brazilian index
Highest profitability among stocks of Novo Mercado in 2Q06 (source: Economática)

10
Car rental performance(R$ million, USGAAP)
Daily rentals (thousands)
Used Cars Car Rental
EBITDA
Net revenue
72
117
179
36 39
347410
641
154 162
31
Net income
53
78
17 24
35%
64% 64%
43%1,839
2,4133,411
740 1,059
2003 2004 2005 2Q05 2Q06
3452
80
15 24
(2.9)
1,1
(2.3)
2.5
(0.3)2003 2004 2005 2Q05 2Q06
155 197271
58 79
192213
370
96 83
2003 2004 2005 2Q05 2Q06
5384
126
21 35
19
33
53
15 4
2003 2004 2005 2Q05 2Q06

11
(R$ milion, USGAAP)
Fleet rental performace
EBITDA
Daily (millions)
Used cars Rented cars
7890 103
23 33
Net income
Net revenues
179218 227
47 72
36 3727
14 16
34%35%
48%45%
3,119 2,8063,351
765 1,022
2003 2004 2005 2Q05 2Q06
120 128 149
35 47
5990
78
1225
2003 2004 2005 2Q05 2Q06
74 83 95
22 32
47
8
11
2003 2004 2005 2Q05 2Q06
51 57 63
16 23
(35,7)
(1,6) (6,7)
(14,8) (19,8)2003 2004 2005 2Q05 2Q06

12
(R$ million, USGAAP)
EBITDA margin per segment
2003 2004 2005 2Q05 2Q06
Margin Margin Margin Margin Margin
Rentals 34,3% 42.6% 46.3% 36.4% 44.1%
Used car sales 9.7% 15.3% 14.4% 15.5% 5.3%
TOTAL 20.7% 28.4% 27.9% 23.1% 24.2%
Rentals 61.2% 65.2% 63.6% 63.8% 68.2%
Used car sales 7.3% 8.2% 10.5% 10.8% 5.6%
TOTAL 43.4% 41.7% 45.3% 50.1% 46.2%
Rental 46% 51.5% 52.5% 46.6% 53.1%Used car sales 9.2% 13.2% 13.7% 14.6% 5.4%Franchising 43.6% 41.5% 47.6% 29.4% 54.5%
TOTAL 28.6% 33.1% 32.6% 29.4% 31.2%Con
solid
ated
Flee
tren
tal
Car
rent
al

13
Consolidated Performance(R$ milion, USGAAP)
EBITDA
Pro forma result disregarding mark-to-market (MTM) of derivatives contracts
Margin
Daily rentals Net revenue
Net income
13.0% * 14.3% 12.2% 15.4% 17.4%
527628
869
201 233
38%
24% 31%
35%
16%
4,959 5,2196,762
1,5042,082
2003 2004 2005 2Q05 2Q06
129170
225
44 68
23
40
61
166
2003 2004 2005 2Q05 2Q06
276 325421
93 125
251303
448
108 108
2003 2004 2005 2Q05 2Q06
6991
107
31 41
2003 2004 2005 2Q05 2Q06
152
210
286
60 74

14
-1,0
(R$ million, USGAAP)
Net income evolution
Net Income2Q05
Net Income2Q06
31.3
+32.9Revenues
-18.5Costs
-0.3
Depreciation-7.6 +7.4
SG&A+33.0 -9.8
InterestTaxes
40.9
-3.5
-0.1-8.7
Rental = + 24 millionUsed car sales = - 10.9 milion
+0.8
EBITDA variation = + 14 million
Other itens variation = - 4.4 milion
-0.8
StockOption
-1.1
+30.7%
15
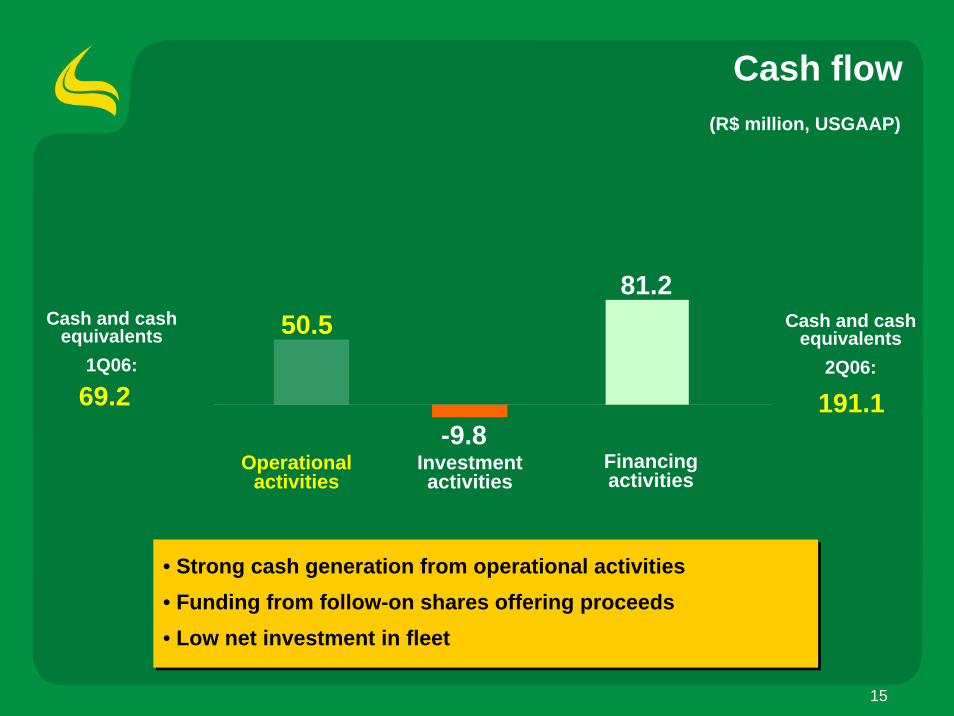
Financingactivities
Operationalactivities
Investmentactivities
(R$ million, USGAAP)
Cash flow
69.2
50.5
-9.8
81.2
191.1
Cash and cashequivalents
1Q06:
Cash and cashequivalents
2Q06:
• Strong cash generation from operational activities• Funding from follow-on shares offering proceeds• Low net investment in fleet
• Strong cash generation from operational activities• Funding from follow-on shares offering proceeds• Low net investment in fleet

16
Net debt (R$ million) USGAAP
(R$ million, USGAAP)
Indebtedness
Rating S&P - BrA / Positive outlook
2003 2004 2005 2Q05 2Q06
Net debt / fleet 22% 46% 60% 51.2% 32%
Net debt / equity 0.36 0.96 1.37 1.03 0.46
87281
539366.7 272.5
2003 2004 2005 2Q05 2Q06
The Company is prepared to a new growth cycleThe Company is prepared to a new growth cycle

17
Fleet : investment and growth
Fleet growth (thousand)Net investment
Sales Purchases
Quantity - thousandInvestment - (R$ million, USGAAP)
2003 2004 2005 2Q05 2Q06
(R$ milion, USGAAP)
37 190 242 124 13
15,718,8
4,6
22,226,1
9,315,5
4,2
15,1
4,2
2003 2004 2005 2Q05 2Q06 2003 2004 2005 2Q05 2Q06
-0.4 +6.2 +7.3 +4.7 02003 2004 2005 2Q05 2Q06
251 303
448
108 108
288
493
690
232121

18
Value Added to the shareholder
In the last 3 years, the spread between ROIC and WACC presented low volatilityIn the last 3 years, the spread between ROIC and WACC presented low volatility
1,781 44,486 57,384 81,229
24.1%18.4%
15.8%12.9%
24.6%
29.3%
24.1% 22.0%
2003 2004 2005 1H06
EVA Nominal WACC ROIC
R$ / thousand
2003 2004 2005 1H06 ChangeAverage Price per car R$ 16.4 18.6 23.4 25.9 +57.9%IPCA (Brazilian inflation index) 9.3% 7.6% 5.75% 1.5% +26.2%Average CDI (Brazilian interbank rate) 23.3% 16.2% 19.0% 15.6% -7.7 p.p.Brazil risk 8.4% 5.4% 4.0% 2.5% -5.9 p.p.Real WACC (excluding inflationaryeffects
14.3% 10.9% 10.5% 9.2% -5.1 p.p.
Nominal WACC
ROIC

19
ROE – Return on equity
OBS: the year of 2006 was annualized based on the results of 1H06, already considering proceeds from the primary offer.ROE was calculated dividing net income by the current year’s average equity, not considering the profit of the year itself.It was not considered the mark-to-market of derivative contracts in 2003 net income.
2006 ROE may be higher than 30%, despite the R$150 million capital increase2006 ROE may be higher than 30%, despite the R$150 million capital increase
38.6% 38.9%36.7%
30.8%
20,0%
30,0%
40,0%
2003 2004 2005 2006(estimated)

20
RENT3 X IBOVESPA
10
15
20
25
30
35
40
45
50
0
20
40
60
80
100
120
Volume RENT3 RENT3 IBOVESPA
Performance RENT3
Average daily volume traded in 2T06 R$ 15.1 MM
Performance RENT3 2Q06: + 13% X IBOV 2Q06: -3%
12/31/0528.63
06/30/0641.5

21
Perspectives
Minimum utilization rate of 65% in car rental business
35% increase in car rental business volume
25% increase in fleet rental business volume

22
Disclaimer – Information and Projections
The material that follows is a presentation of general background information about LOCALIZA as of the date of the presentation. It is information in summary form and does not purport to be complete. It is not intended to be relied upon as advice to potential investors. No representation or warranty, express or implied, is made concerning, and no reliance should be placed on, the accuracy, fairness, or completeness of the information presented herein.
This presentation contains statements that are forward-looking within the meaning of Section 27A of the Securities Act of 1933 and Section 21E of the Securities Exchange Act of 1934. Such forward-looking statements are only predictions and are not guarantees of future performance. Investors are cautioned that any such forward-looking statements are and will be, as the case may be, subject to many risks, uncertainties and factors relating to the operations and business environments of LOCALIZA and its subsidiaries that may cause the actual results of the companies to be materially different from any future results expressed or implied in such forward-looking statements.
Although LOCALIZA believes that the expectations and assumptions reflected in the forward-looking statements are reasonable based on information currently available to LOCALIZA’s management, LOCALIZA cannot guarantee future results or events. LOCALIZA expressly disclaims a duty to update any of the forward-looking statement.
It is not allowed to offer or sell in the United States securities not registered or exempted from registration, in accordance with the Securites Act of 1933. Any securities offering to be conducted in United States must be made through an offering memorandum, which can be obtained with the underwriters. The offering memo must contain or include reference to detailed information about LOCALIZA and its business and financial results, in addition to its financial statements.
This presentation does not constitute an offering, invitation or offering request or acquisition of any type of securities. Neither this presentation nor anything here included represent the terms of a contract or commitment of any kind.

23
Thank You!
Investor Relations Localiza:www.localiza.com/riphone: +5531 3247-7039