Embed Size (px)
Citation preview


A N S T O E - 7 4 7
ENVIRONMENTAL and EFFLUENT MONITORING at ANSTO SITES, 2001
i i
CONTENTS
ABSTRACT i
SUMMARY v
FIGURESFigure 1 Location of Lucas Heights Science and Technology Centre and
Off-site Sampling Points xFigure 2 Location of Stormwater, Air and External Radiation
Monitoring Points at Lucas Heights Science and Technology Centre xiFigure 3 Little Forest Burial Ground - Location of Trenches
and Groundwater Bores xiiFigure 4 Location of Sampling Zones at Potter Point Ocean Outfall and
the Royal National Park xiii
1 INTRODUCTION 1
2 POTENTIAL ENVIRONMENTAL EXPOSURE PATHWAYSAND CRITICAL GROUPS 2
2.1 Atmospheric Discharges from the Lucas Heights Site 22.2 Low-Level Liquid Effluent Discharges from the Lucas Heights Site 32.3 The Little Forest Burial Ground 42.4 The National Medical Cyclotron 5
3 ENVIRONMENTAL MONITORING AT THELUCAS HEIGHTS SITE 6
3.1 Woronora River 63.2 Forbes Creek 63.3 Potter Point Biological Monitoring 73.4 Stormwater 83.5 Surface Waters 93.6 Gamma Survey of Effluent Discharge Pipeline 103.7 The Little Forest Burial Ground 113.8 Iodine-131 in Air 133.9 Meteorological Monitoring 143.10 External Gamma Radiation 15
4 EFFLUENT MONITORING AT THELUCAS HEIGHTS SITE 16
4.1 Airborne Effluent Stack Discharges 164.2 Low-level Liquid Effluent Discharges 18
5 EFFLUENT MONITORING AT THE NATIONAL MEDICAL CYCLOTRON 20
6 OFFSHORE MONITORING AT POTTER POINT 206.1 Modelling of Effluent Transport 21
A N S T O E - 7 4 7
ENVIRONMENTAL and EFFLUENT MONITORING at ANSTO SITES, 2001
i i i
6.2 Effluent Studies in 2001 21
7 DISCHARGE AUTHORISATIONS 227.1 Airborne Discharge Authorisation 237.2 Application of the Annual Notification Levels 237.3 Liquid Effluent Authorisations 25
8 POTENTIAL PUBLIC EXPOSURE FROM ANSTO OPERATIONS 268.1 Airborne Emissions 268.2 Low-Level Liquid Effluent 278.3 External Radiation at the Lucas Heights Science and Technology Centre 278.4 The Little Forest Burial Ground 27
9 CONCLUSIONS 28
10 ACKNOWLEDGMENTS 28
11 REFERENCES 29
12 BIBLIOGRAPHY 31
TABLES
Table 1 Environmental Monitoring Schedule, 2001 34Table 2 Tritium in Woronora Estuary Water Station E5.9, 2001 36Table 3 Tritium in Forbes Creek Water Samples, 2001 37Table 4 Radioactivity in Fish from Potter Point and the Royal National Park, 2001 37Table 5 Radioactivity in Algae from Potter Point and the Royal National Park, 2001 38Table 6 Radioactivity in Barnacles from Potter Point and
the Royal National Park, 2001 38Table 7a Tritium in Composite Water Samples from LHSTC Stormwater
Bunds, 2001 39Table 7b Tritium in Weekly Water Samples from MDP Bund C, 2001 40Table 7c Radioactivity in Composite Water Samples from MDP Bund C, 2001 41Table 8 Radioactivity in Sediment from Stormwater Bunds, 2001 42Table 9a Tritium in Weekly Water Samples from MDP+ 60m, 2001 43Table 9b Radioactivity in Composite Water Samples from MDP+ 60m, 2001 44Table 10 Radioactivity in Water from SPCC Sampling Points, 2001 45Table 11 Tritium in Water from Bardens Creek Weir, 2001 46Table 12a Gamma Dose-rate Survey of Effluent Discharge Pipeline, 2001 47Table 12b Radioactivity in Soil near the ANSTO Effluent Pipeline, 2001 47Table 13 Gamma Dose-rate Survey of Burial Trenches at
Little Forest Burial Ground, 2001 48Table 14a Radioactivity in Soil from the Little Forest Burial Ground, 2001 48Table 14b Radioactivity in Groundwater from the Little Forest Burial Ground, 2001 49Table 15 Radioactivity in Creeks North of the Little Forest Burial Ground, 2001 50
A N S T O E - 7 4 7
ENVIRONMENTAL and EFFLUENT MONITORING at ANSTO SITES, 2001
i v
Table 16 Particulates in Air at the Little Forest Burial Ground, 2001 50Table 17 Ambient Iodine-131 in Air at LHSTC, 2001 51Table 18a External Gamma Radiation at LHSTC (ARPANSA
Dosimeter Results), 1997 to 2001 52Table 18b External Gamma Radiation at LHSTC. Comparison of ARPANSA
and ANSTO Dosimeter Results, 2001 53Table 19a Airborne Radioactivity Discharges from Individual Discharge Points
at LHSTC, January - March 2001 54Table 19b Airborne Radioactivity Discharges from Individual Discharge Points
at LHSTC, April - June 2001 55Table 19c Airborne Radioactivity Discharges from Individual Discharge Points
at LHSTC, July - September 2001 56Table 19d Airborne Radioactivity Discharges from Individual Discharge Points
at LHSTC, October - December 2001 57Table 20 Radioactivity in Groundwater from the Vicinity of Building 27, 2001 58Table 21 Radioactivity in Liquid Effluent Discharged from LHSTC
to the Sydney Water Sewer, 2001 59Table 22 Non-Radioactive Component of Liquid Effluent Discharged from
LHSTC to the Sydney Water Sewer, 1997 to 2001 60Table 23a Airborne Emissions of Iodine-123 from the National Medical Cyclotron, 2001 61Table 23b Average Concentration of Radionuclides in Liquid Effluent
from the National Medical Cyclotron, 2001 61Table 24 Estimated Effective Doses from LHSTC Airborne Discharges, 2001 62
APPENDICES
Appendix 1 Measurement of Radioactivity 63Appendix 2 Radionuclide Symbols and Half-lives 66
GLOSSARY OF TERMS 67
LIST OF ACRONYMS AND ABBREVIATIONS 71
A N S T O E - 7 4 7
ENVIRONMENTAL and EFFLUENT MONITORING at ANSTO SITES, 2001
v
ENVIRONMENTAL AND EFFLUENT MONITORING AT ANSTO SITES, 2001
SUMMARYThe Australian Nuclear Science and Technology Organisation (ANSTO) is a science andtechnology agency of the Commonwealth Government of Australia. It has a staff ofapproximately 800 and is located at the Lucas Heights Science and Technology Centre (theLHSTC or Lucas Heights site), some 40 km south west of Sydney city centre. The scienceand technology centre occupies 70 hectares and is surrounded by a 1.6 km buffer zone.
ANSTO operates several national facilities including Australia’s only nuclear reactor, theresearch reactor HIFAR (the High Flux Australian Reactor). The reactor is used to produceradioactive products for use in medicine and industry. The organisation also operates theNational Medical Cyclotron (NMC), an accelerator facility used to produce certain short-liferadioisotopes for nuclear medicine procedures. The NMC is located in the grounds of theRoyal Prince Alfred Hospital in Camperdown, an inner west suburb of Sydney.
ANSTO operations are regulated by the Australian Radiation Protection and Nuclear SafetyAgency (ARPANSA) under the Australian Radiation Protection and Nuclear Safety Act1998.
ANSTO’s Health, Safety and Environment Policy contains the principles that form the basisof its environmental management system. This policy commits ANSTO to undertaking itsactivities in a manner that protects human health and the environment and is consistent withnational and international standards. In terms of environmental protection, ANSTO providesverifiable evidence of the fulfilment of the policy through a program of monitoring and audit,and publication of these results by means of its annual Environmental and EffluentMonitoring reports. The monitoring program is also designed to detect and quantify anyaccidental releases of radioactive materials, should they occur.
Monitoring undertaken includes:
liquid effluent prior to discharge to the sewer;airborne discharges;groundwater, soil and air from the “Little Forest Burial Ground1”;external gamma radiation at the Lucas Heights site perimeter and local residences;meteorological measurements at Lucas Heights;stormwater run-off from the Lucas Heights site;water quality at local creeks; andseawater and marine biota at the Potter Point Ocean Outfall.
ANSTO is reviewing various aspects of its environmental monitoring and dose assessmentprogram. This includes a re-evaluation of the potential exposure pathways and of the criticalgroups that might be affected by radiological doses from airborne and liquid effluentdischarges.
Groundwater flow and quality are also being assessed at the Lucas Heights site, with a set ofgroundwater bores installed in 2000 and a monitoring program trialed in 2001. In addition, aprogram to monitor the non-radiological quality of stormwater flowing from the site has been
1 See page 4 for an explanation of this term.

A N S T O E - 7 4 7
ENVIRONMENTAL and EFFLUENT MONITORING at ANSTO SITES, 2001
v i
developed to cover the construction period of the Replacement Research Reactor. The resultsfrom these investigations will be included in future reports as they are integrated into theANSTO environmental management system.
This report summarises the results from the environmental and effluent surveys carried out atthe Lucas Heights and NMC sites during 2001, and assesses the environmental effects ofradioactive discharges, focussing on any potential effect on local residents. Results obtainedin previous years have been published in the annual monitoring reports, which are availablefrom local libraries or on request from ANSTO’s Communications Manager. ANSTO’scontact details are included inside the front cover of this report.
In future, the results of ANSTO’s environmental and effluent monitoring will be reportedagainst fiscal years rather than calendar years. The next monitoring report in this series willcover the eighteen-month period running up to the end of the 2002-2003 fiscal year. In theinterim, a “Health, Safety and Environment ” brochure covering the 2001-2002 fiscal yearwill be published, and this will include an update on the monitoring data.
The environmental and effluent monitoring results for 2001 show that ANSTO operationscomplied with effluent discharge authorisations and relevant environmental regulations forboth the Lucas Heights and the NMC sites.
Liquid Effluent from the Lucas Heights SiteANSTO has an Agreement with Sydney Water Corporation that allows ANSTO to dischargetreated liquid effluent from the Lucas Heights site to the sewer as long as the dischargescomply with:
drinking water quality concentrations for radioactivity at the Cronulla Sewage TreatmentPlant andconcentration limits for non-radiological components of the effluent.
During 2001, radionuclide concentrations in liquid effluent discharged to the sewer werebelow the limits specified in the Trade Wastewater Agreement with Sydney Water. Thecombined monthly concentration quotients for gross alpha, gross beta and tritiumradioactivity in liquid effluent ranged from 0.12 to 0.30 with an average for the year of 0.18,which is less than 20% of the required limit. Concentrations of the non-radioactivecomponents of liquid effluent discharged to the Sydney Water sewer also met the standardsfor acceptance specified in the discharge Agreement.
Airborne DischargesFormal reporting to ARPANSA against a new Airborne Radioactive Discharge Authorisationcommenced in July 2001. The authorisation incorporates a multi-layer system of radiologicalprotection, designed to ensure that doses to the public are kept as low as reasonablyachievable (the ALARA principle). Annual notification levels are set for each discharge pointat the Lucas Heights site and NMC, such that the maximum possible off-site dose to thepublic would be less than 0.02 mSv per year.
On-site and public doses resulting from airborne discharges from the Lucas Heights sitecontinued to be very low in 2001. At the 1.6 km exclusion zone boundary the estimated dosesbased on stack emission and meteorological data were less than 0.01 mSv per year. This iswell below the ALARA objective of 0.02 mSv per year and much lower than the public doselimit of 1 mSv per year and the natural background in Australia of around 1.5 to 2 mSv peryear (Webb et al, 1999).

A N S T O E - 7 4 7
ENVIRONMENTAL and EFFLUENT MONITORING at ANSTO SITES, 2001
v i i
All airborne emissions were below the ARPANSA annual notification levels in 2001, and thecalculated effective doses for the LHSTC confirm that ANSTO met the ALARA objective fordoses to the public.
Stormwater and Surface Waters at the Lucas Heights SiteStormwater drainage from the Lucas Heights site complied with the NSW Protection of theEnvironment Operations Act (1997) limits for gross alpha and gross beta radioactivity inClass C surface waters. Sampling included the on-site stormwater bunds and off-site samplingpoints on the three small creeks receiving most of the run-off from the site. Levels of tritiumand gamma activity found in stormwater were also low in comparison with the relevantAustralian drinking water guidelines (NH&MRC, 1996).
Surface water samples collected off-site at the confluence of Mill Creek and Bardens Creek,and from the Woronora River and Forbes Creek, contained only natural background levels ofradioactivity.
Since the levels of detected activity are very low and stormwater does not enter any knownhuman drinking water supply, it is concluded that there are no health consequences to humansfrom the measured radioactivity in the Lucas Heights site stormwater.
Little Forest Burial GroundBetween 1960 and 1968 the Australian Atomic Energy Commission (AAEC) used a smallarea locally known as Little Forest (see Figure 1) for the disposal by burial of solid waste withlow levels of radioactivity and beryllium oxide (non-radioactive) that originatedpredominantly from the Lucas Heights site.
The environmental monitoring program at the Little Forest Burial Ground (LFBG) is based onthe potential exposure pathways and includes the collection of groundwater, soil and airborneparticles. Monitoring results at the LFBG in 2001 indicate that radioactivity levels weresimilar to those of previous years.
Tritium concentrations in LFBG groundwater were below levels considered safe for drinkingwater in Australia. The gross alpha and gross beta concentrations in the groundwater werebelow the levels prescribed for surface waters in New South Wales. In fact, the majority ofgross alpha and gross beta results were below the more restrictive level of 0.5 Bq/L set in theAustralian drinking water guidelines.
Gamma spectrometry of the unfiltered LFBG groundwater samples showed only smallconcentrations of natural potassium-40 and uranium-238 progeny and, in one sampling hole,low levels of cobalt-60 (at less than 1% of the Australian drinking water guidelineconcentration). These extremely low levels of radioactivity are of no consequence to thehealth of humans.
A high-volume air sampler was used to collect airborne dust particles at the LFBG in 2001.Quarterly samples of air were collected on filters by sampling for approximately 4-6 hoursevery two weeks. Dry, relatively windy sampling days were chosen to maximise thecollection of particles. The nuclides of interest are beryllium and plutonium; however, neitherwas detected in 2001.
Extra monitoring of soil and dose rates was undertaken at the LFBG in response to atrespassing incident. The results showed no measurable radioactivity above naturalbackground levels. External gamma radiation doses over the disposal area were measured
A N S T O E - 7 4 7
ENVIRONMENTAL and EFFLUENT MONITORING at ANSTO SITES, 2001
v i i i
using a hand-held meter and showed only background levels. The radiological exposures tomembers of the public from the LFBG continue to be assessed as negligible.
External Gamma Radiation at the Lucas Heights SiteDuring the year, thermoluminescent dosimeters measured ambient gamma radiation at variouslocations around the Lucas Heights site perimeter fence and at three private residences in thenearby suburbs of Barden Ridge, Engadine and Woronora. Measurements at the three localresidences showed an average external dose of about 0.75 mSv per year. The local absorbeddoses in air were consistent with levels recorded in Australian capital cities (using similardosimeters) in surveys carried out by the then Australian Radiation Laboratory and reportedby the United Nations Scientific Committee on the Effects of Atomic Radiation (UNSCEAR,1993). These results indicate that the external gamma radiation levels at residential locationsin the vicinity of the Lucas Heights site are not noticeably affected by ANSTO’s operations.
The absorbed dose to air at Location 2 on the southern sector of the Lucas Heights siteperimeter fence has in recent years been affected by nearby stored radioactive material.Comprehensive dose-rate surveys conducted inside and outside the perimeter fence, togetherwith a consideration of occupancy factors, indicate that shielding of the storage building isappropriate. This part of the site is not readily accessed by the general public and isapproximately 1.8 kilometres away from any residential areas. Other locations exhibitednormal background dose rates.
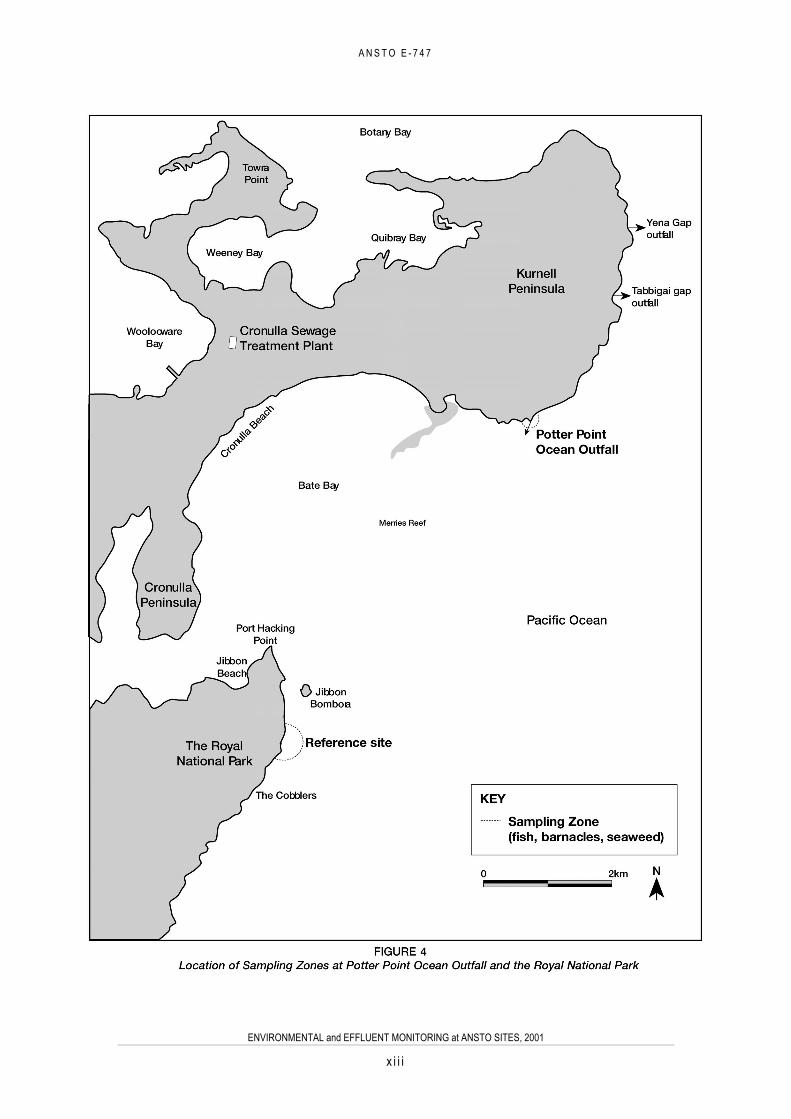
Potter Point Ocean OutfallTreated sewage effluent from the Sutherland Shire, including low-level effluent from theLHSTC, passes through the Cronulla Sewage Treatment Plant and is discharged at PotterPoint. Seawater and biological sampling programs were continued at the Potter Point oceanoutfall during 2001. This monitoring is aimed at assessing potential doses to members of thepublic who may swim in the ocean off Potter Point and/or eat fish caught in the vicinity of theoutfall.
Fish, algae (seaweed) and barnacles are collected from Potter Point because these organismsrepresent different levels in the food chain leading to humans and also because algae andbarnacles are known to concentrate a variety of elements from their environment.
The radioactivity measured in marine biota from Potter Point was of natural origin apart fromthe low concentrations of iodine-131 found in algae. No man-made radionuclides weredetected in fish or barnacles from Potter Point in 2001 or in any samples collected from thereference site in the Royal National Park. The small concentrations of iodine-131 found inalgae from Potter Point were of no radiological significance to humans.
The Cronulla Sewage Treatment Plant was upgraded to provide tertiary treatment from July2001. Liquid effluent travelling between Lucas Heights and the sewage plant was studied ontwo occasions in 2001 to determine whether the upgrade had had any effect on dilutionfactors or transit times. During the first investigation the level of tritium in the effluentreleased was too low to permit its detection in the treatment plant or in seawater near theoutfall. On the second occasion tritium was measured both in samples collected in thetreatment plant and at the outfall. The estimated dilution factor for radionuclides betweenANSTO and the outlet of the sewage treatment plant was 253. This compares with dilutionfactors of typically 25 prior to the plant upgrade. The enhanced values following the upgradeare consistent with an increase in the average residence time of sewage within the plant froma few hours to about 18 hours.
A N S T O E - 7 4 7
ENVIRONMENTAL and EFFLUENT MONITORING at ANSTO SITES, 2001
i x
The National Medical CyclotronThe radiopharmaceutical products made at the National Medical Cyclotron are relativelyshort-lived, with half-lives ranging from minutes to hours. As a consequence, the smallamounts of liquid effluent discharged to the sewer and airborne emissions from the NMChave limited impact on the environment or humans. All airborne and liquid emissions met theprescribed discharge levels in 2001.
ConclusionsIt is concluded that there is no adverse impact on the health of the community as aconsequence of ANSTO’s operations at the Lucas Heights Science and Technology Centre orat the National Medical Cyclotron.
The estimated potential doses to members of the general public from airborne discharges atthe Lucas Heights site are only a very small fraction, less than half a per cent, of the radiationdose received by everyone each year from naturally occurring sources of radiation. Themonitoring results from the Potter Point Ocean Outfall confirm that the potential radiationdose to members of the general public as a result of ANSTO’s discharges to the sewer is verylow. The potential dose is less than 0.2% of the National Health and Medical ResearchCouncil recommended dose limits for members of the public. The levels of detectedradioactivity in stormwater from the Lucas Heights site are low in comparison with therelevant Australian drinking water guidelines and have no health consequences.
A N S T O E - 7 4 7
ENVIRONMENTAL and EFFLUENT MONITORING at ANSTO SITES, 2001
x
A N S T O E - 7 4 7
ENVIRONMENTAL and EFFLUENT MONITORING at ANSTO SITES, 2001
x i

A N S T O E - 7 4 7
ENVIRONMENTAL and EFFLUENT MONITORING at ANSTO SITES, 2001
x i i
A N S T O E - 7 4 7
ENVIRONMENTAL and EFFLUENT MONITORING at ANSTO SITES, 2001
x i i i

A N S T O E - 7 4 7
ENVIRONMENTAL and EFFLUENT MONITORING at ANSTO SITES, 2001
1
1 INTRODUCTION
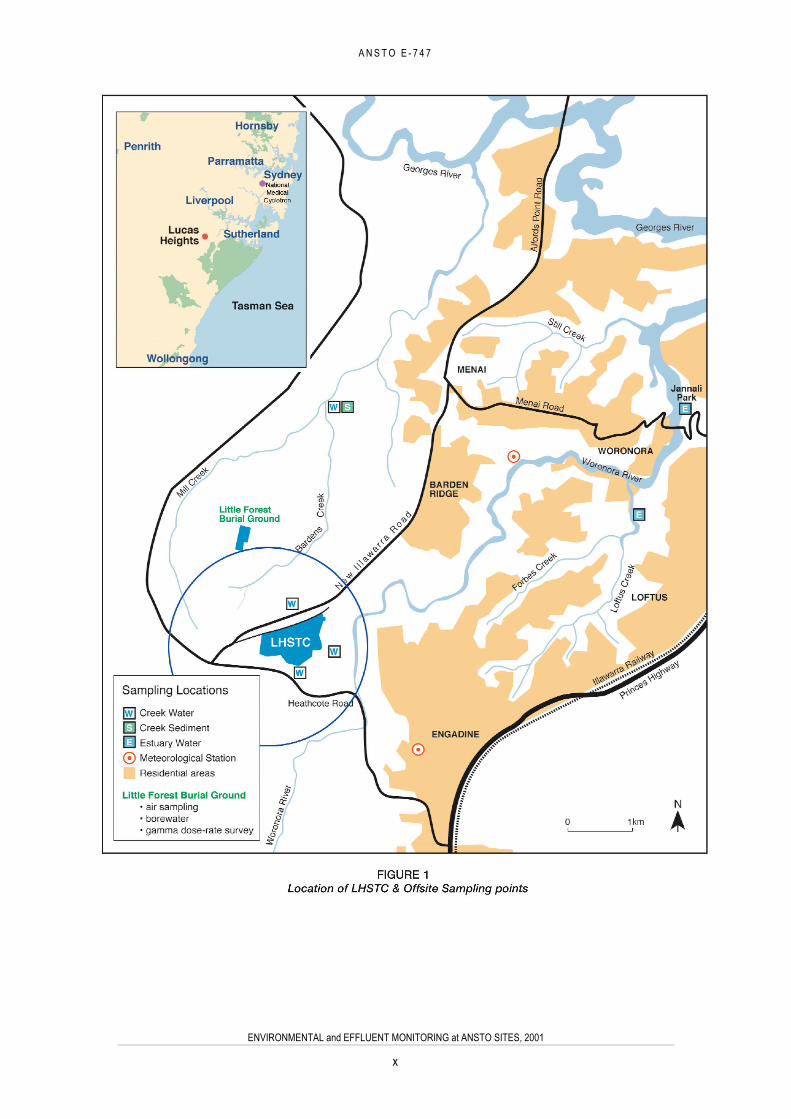
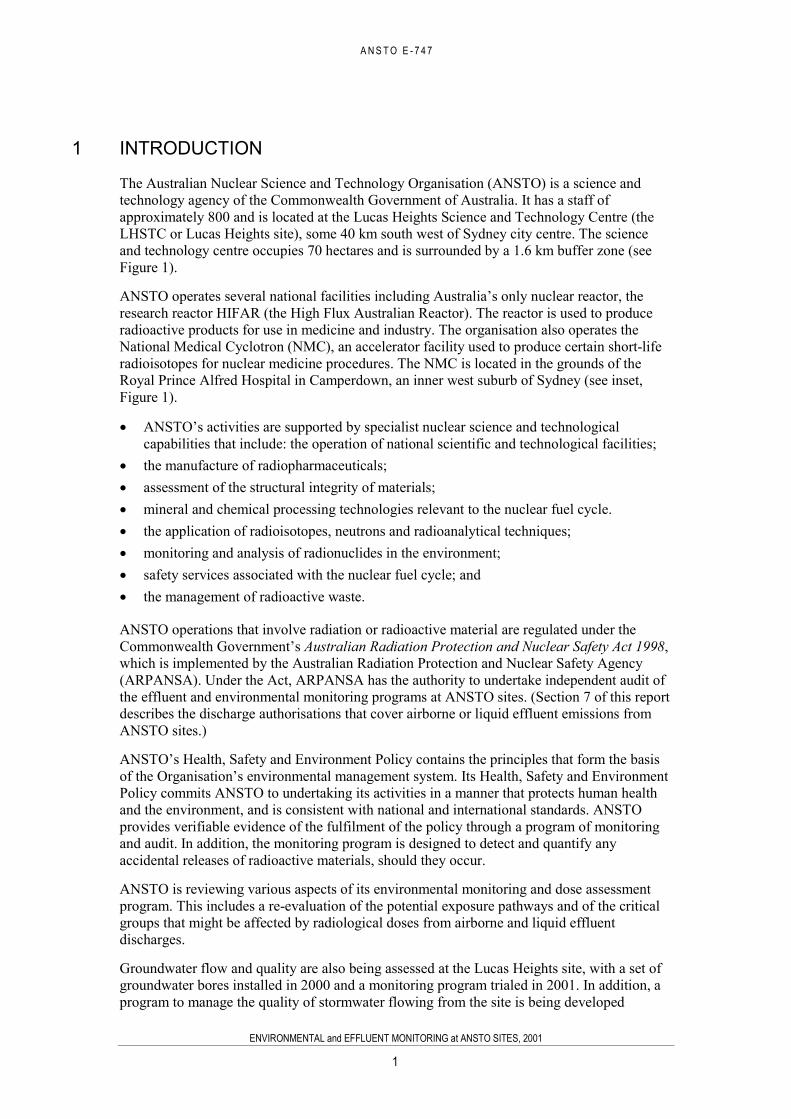
The Australian Nuclear Science and Technology Organisation (ANSTO) is a science andtechnology agency of the Commonwealth Government of Australia. It has a staff ofapproximately 800 and is located at the Lucas Heights Science and Technology Centre (theLHSTC or Lucas Heights site), some 40 km south west of Sydney city centre. The scienceand technology centre occupies 70 hectares and is surrounded by a 1.6 km buffer zone (seeFigure 1).
ANSTO operates several national facilities including Australia’s only nuclear reactor, theresearch reactor HIFAR (the High Flux Australian Reactor). The reactor is used to produceradioactive products for use in medicine and industry. The organisation also operates theNational Medical Cyclotron (NMC), an accelerator facility used to produce certain short-liferadioisotopes for nuclear medicine procedures. The NMC is located in the grounds of theRoyal Prince Alfred Hospital in Camperdown, an inner west suburb of Sydney (see inset,Figure 1).
ANSTO’s activities are supported by specialist nuclear science and technologicalcapabilities that include: the operation of national scientific and technological facilities;the manufacture of radiopharmaceuticals;assessment of the structural integrity of materials;mineral and chemical processing technologies relevant to the nuclear fuel cycle.the application of radioisotopes, neutrons and radioanalytical techniques;monitoring and analysis of radionuclides in the environment;safety services associated with the nuclear fuel cycle; andthe management of radioactive waste.
ANSTO operations that involve radiation or radioactive material are regulated under theCommonwealth Government’s Australian Radiation Protection and Nuclear Safety Act 1998,which is implemented by the Australian Radiation Protection and Nuclear Safety Agency(ARPANSA). Under the Act, ARPANSA has the authority to undertake independent audit ofthe effluent and environmental monitoring programs at ANSTO sites. (Section 7 of this reportdescribes the discharge authorisations that cover airborne or liquid effluent emissions fromANSTO sites.)
ANSTO’s Health, Safety and Environment Policy contains the principles that form the basisof the Organisation’s environmental management system. Its Health, Safety and EnvironmentPolicy commits ANSTO to undertaking its activities in a manner that protects human healthand the environment, and is consistent with national and international standards. ANSTOprovides verifiable evidence of the fulfilment of the policy through a program of monitoringand audit. In addition, the monitoring program is designed to detect and quantify anyaccidental releases of radioactive materials, should they occur.
ANSTO is reviewing various aspects of its environmental monitoring and dose assessmentprogram. This includes a re-evaluation of the potential exposure pathways and of the criticalgroups that might be affected by radiological doses from airborne and liquid effluentdischarges.
Groundwater flow and quality are also being assessed at the Lucas Heights site, with a set ofgroundwater bores installed in 2000 and a monitoring program trialed in 2001. In addition, aprogram to manage the quality of stormwater flowing from the site is being developed

A N S T O E - 7 4 7
ENVIRONMENTAL and EFFLUENT MONITORING at ANSTO SITES, 2001
2
particularly to cover the construction period of the Replacement Research Reactor. The resultsfrom these investigations will be included in future reports, as they are integrated into theANSTO Environmental Management System.
This report summarises the results from the environmental and effluent surveys carried out atthe LHSTC and NMC sites during 2001, and assesses the environmental effects of radioactivedischarges, focusing on any potential effect on local residents. Results obtained in previousyears have been published annually as public documents within the series Environmental andEffluent Monitoring at ANSTO Sites, copies of which are available from the Sutherland ShireCentral Library or on request from ANSTO’s Communications Manager.
In future, the results of ANSTO’s environmental and effluent monitoring will be reportedagainst fiscal years rather than calendar years. The next monitoring report in this series willcover the eighteen month period running up to the end of the 2002-2003 fiscal year. In theinterim, a “Health, Safety and Environment ” brochure covering the 2001-2002 fiscal yearwill be published and this will include an update of the monitoring data.
ANSTO’s contact details are included inside the front cover of this report while units andprefixes are printed inside the back cover. Definitions of terms used throughout this reportmay be found in the Glossary.
2 POTENTIAL ENVIRONMENTAL EXPOSURE PATHWAYSAND CRITICAL GROUPS
The concepts of exposure pathways (the possible avenues by which members of the publiccould be exposed to radioactivity originating from nuclear sites) and critical groups (theindividuals most likely to be exposed to radiation) have been used at AAEC/ANSTO since themid-1960s. The concepts have broad acceptance and are applied internationally forradiological dose estimation. Discharge levels are derived following consideration of allpotential environmental exposure pathways, and are set so that dose rates to the critical groupdo not exceed prescribed limits. This approach has formed the basis for determining approvedlevels for both airborne and liquid discharges of radioactive effluent at the Lucas Heightsfacility over many years (see Hoffmann and Loosz, 1994).
The main ways in which radionuclides from ANSTO sites can enter the environment and leadto radiation exposure, particularly of members of the general public, are by:
atmospheric emissions that primarily result in external radiation doses from short-lived,radioactive gases;wash-out or deposition of airborne radionuclides that can enter the food chain, forexample in drinking water or on foodstuffs;discharge of low-level liquid effluent into the sea via Sydney’s sewerage system. Theseradionuclides may then be taken up by marine plants and animals such as fish, or beaccidentally ingested by swimmers or surfers; anddirect or indirect contamination of groundwater or soil.
The same general pathways would apply to any abnormal atmospheric or liquid releases.
2.1 ATMOSPHERIC DISCHARGES FROM THE LUCAS HEIGHTS SITEAtmospheric discharges from the Lucas Heights site have been regulated since 1968 whenexpansion of radioisotope production made it necessary to consider possible exposure

A N S T O E - 7 4 7
ENVIRONMENTAL and EFFLUENT MONITORING at ANSTO SITES, 2001
3
pathways for airborne releases of radionuclides, such as noble (inert) gases and iodine-131.Noble gases, including argon-41 from HIFAR, and radioisotopes of xenon (Xe-133, Xe-135and Xe-135m) and krypton (Kr-85) from production of radiopharmaceuticals, are the majorcontributors to the small public dose arising from ANSTO’s operations. (See Section 7 formore detail on discharge authorisations and applicable limits.)
Typical exposure pathways for potential transfer of deposited airborne radioactivity tohumans usually include ingestion of contaminated drinking water and foodstuffs. However, inthe case of ANSTO’s airborne discharges, the ingestion pathway for deposited airborneradioactivity to humans is not considered to be significant, for the following reasons:
the (small) ANSTO contribution to public dose is dominated by external radiation fromshort-lived noble gases, which are inert and cannot be concentrated in the food chain;there is little or no commercial food production or processing in the immediateneighbourhood of the Lucas Heights site; andthe small creeks receiving run-off from the site are not used as sources of drinking water.
The computer code PC-CREAM (see Section 7.2) has been approved by ARPANSA formodelling the movement of ANSTO’s airborne effluent releases and assessing the resultingdose to people. Dose assessments using PC-CREAM have shown that the small ANSTOcontribution to public dose is largely due to external radiation from noble gases. Nevertheless,other exposure pathways, such as inhalation of radionuclides and ingestion of locally grownvegetables, are included in the dose assessment.
There is the potential for iodine-131 and other radionuclides to be deposited onto grazing landand concentrated in the food chain that gives rise to milk production. The levels ofradioactivity in locally produced milk were routinely assessed in the past (see Hoffmann andLoosz, 1994) but, with the nearest registered dairy herd now some thirteen kilometres fromANSTO, this pathway is no longer considered significant.
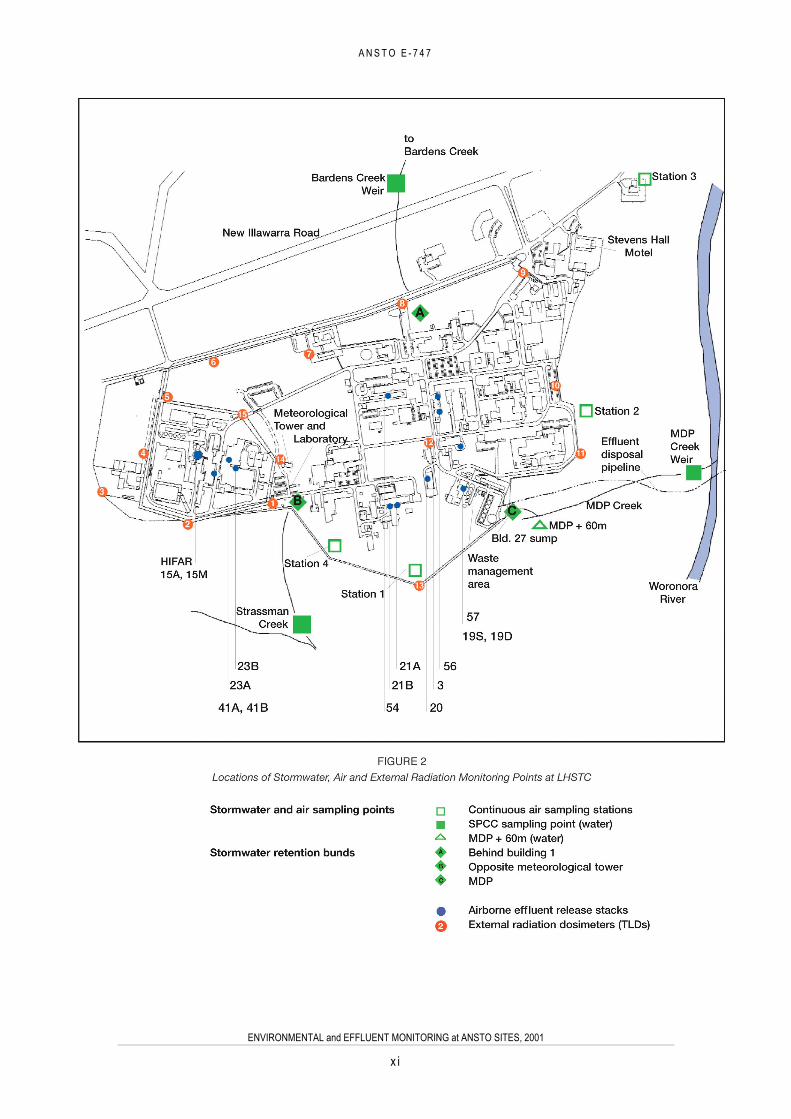
The major critical group for exposure to airborne activity is people living close to the LucasHeights site perimeter at the Stevens Hall Motel. Continuous samplers (to monitor ambientlevels of iodine-131 in air) are positioned near the site perimeter fence at locations near boththe motel and the closest suburban residences. (See Figure 2 for the location of Stevens HallMotel and the air sampling stations, and Section 3.8 for results.) Levels of integrated externalradiation at the Lucas Heights site and in nearby suburban locations were also measuredduring 2001 using dosimeters issued by ARPANSA. (Results of this monitoring are discussedin Section 3.10.)
2.2 LOW-LEVEL LIQUID EFFLUENT DISCHARGES FROM THE LUCASHEIGHTS SITE
The AAEC/ANSTO released liquid effluent containing low levels of radioactivity into theupper reaches of the Woronora Estuary from 1961 to 1980. Since then, low-level liquideffluent from the Lucas Heights site has been pumped to the sewer. Along with other effluentfrom the Sutherland Shire, this effluent passes through the Cronulla Sewage Treatment Plant(Cronulla STP) and is discharged into the sea at the Potter Point outfall. In July 2001 theCronulla STP was upgraded to provide tertiary treatment of sewage, which has greatlyreduced the levels of plant nutrients in discharges to the ocean at the Potter Point outfall.
Various activities at the Lucas Heights site produce radioactive liquid waste. After treatmentand storage, the major contributor to radioactivity in the low-level effluent discharged to thesewer is typically tritium. (See Appendix 1 for more information on tritium and other relevant
A N S T O E - 7 4 7
ENVIRONMENTAL and EFFLUENT MONITORING at ANSTO SITES, 2001
4
radionuclides. The liquid effluent discharge authorisations and applicable limits are discussedin Section 7.)
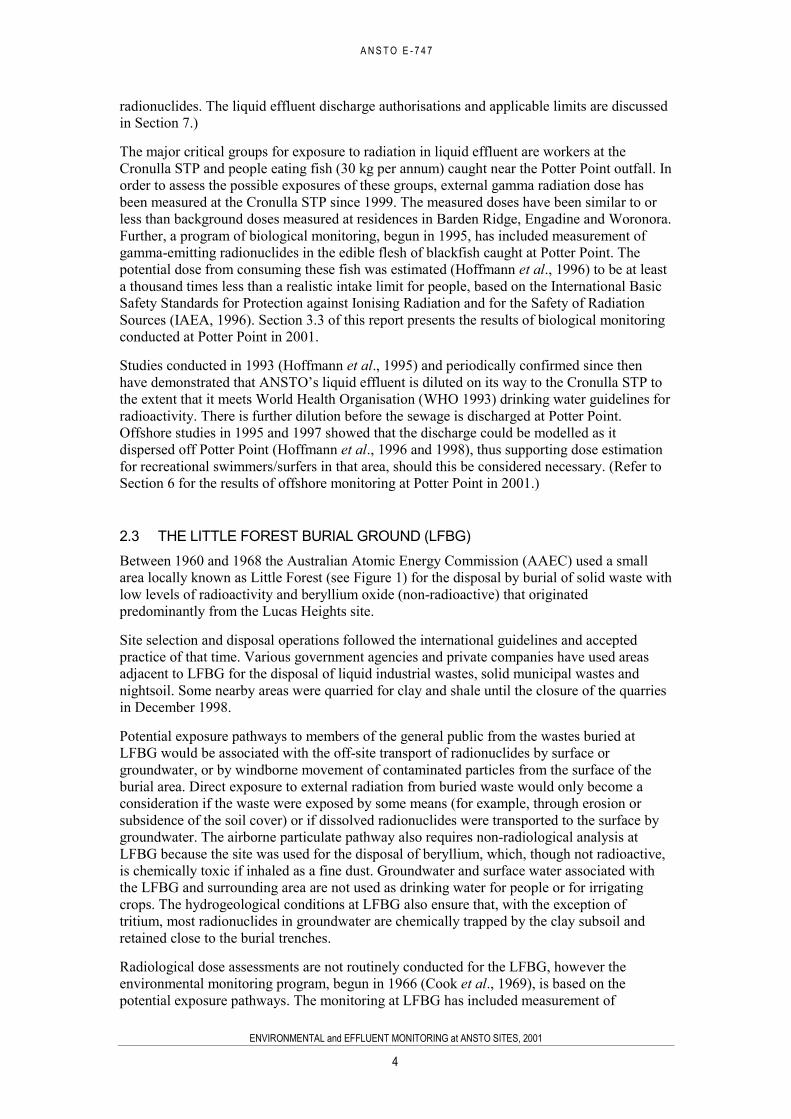
The major critical groups for exposure to radiation in liquid effluent are workers at theCronulla STP and people eating fish (30 kg per annum) caught near the Potter Point outfall. Inorder to assess the possible exposures of these groups, external gamma radiation dose hasbeen measured at the Cronulla STP since 1999. The measured doses have been similar to orless than background doses measured at residences in Barden Ridge, Engadine and Woronora.Further, a program of biological monitoring, begun in 1995, has included measurement ofgamma-emitting radionuclides in the edible flesh of blackfish caught at Potter Point. Thepotential dose from consuming these fish was estimated (Hoffmann et al., 1996) to be at leasta thousand times less than a realistic intake limit for people, based on the International BasicSafety Standards for Protection against Ionising Radiation and for the Safety of RadiationSources (IAEA, 1996). Section 3.3 of this report presents the results of biological monitoringconducted at Potter Point in 2001.
Studies conducted in 1993 (Hoffmann et al., 1995) and periodically confirmed since thenhave demonstrated that ANSTO’s liquid effluent is diluted on its way to the Cronulla STP tothe extent that it meets World Health Organisation (WHO 1993) drinking water guidelines forradioactivity. There is further dilution before the sewage is discharged at Potter Point.Offshore studies in 1995 and 1997 showed that the discharge could be modelled as itdispersed off Potter Point (Hoffmann et al., 1996 and 1998), thus supporting dose estimationfor recreational swimmers/surfers in that area, should this be considered necessary. (Refer toSection 6 for the results of offshore monitoring at Potter Point in 2001.)
2.3 THE LITTLE FOREST BURIAL GROUND (LFBG)Between 1960 and 1968 the Australian Atomic Energy Commission (AAEC) used a smallarea locally known as Little Forest (see Figure 1) for the disposal by burial of solid waste withlow levels of radioactivity and beryllium oxide (non-radioactive) that originatedpredominantly from the Lucas Heights site.
Site selection and disposal operations followed the international guidelines and acceptedpractice of that time. Various government agencies and private companies have used areasadjacent to LFBG for the disposal of liquid industrial wastes, solid municipal wastes andnightsoil. Some nearby areas were quarried for clay and shale until the closure of the quarriesin December 1998.
Potential exposure pathways to members of the general public from the wastes buried atLFBG would be associated with the off-site transport of radionuclides by surface orgroundwater, or by windborne movement of contaminated particles from the surface of theburial area. Direct exposure to external radiation from buried waste would only become aconsideration if the waste were exposed by some means (for example, through erosion orsubsidence of the soil cover) or if dissolved radionuclides were transported to the surface bygroundwater. The airborne particulate pathway also requires non-radiological analysis atLFBG because the site was used for the disposal of beryllium, which, though not radioactive,is chemically toxic if inhaled as a fine dust. Groundwater and surface water associated withthe LFBG and surrounding area are not used as drinking water for people or for irrigatingcrops. The hydrogeological conditions at LFBG also ensure that, with the exception oftritium, most radionuclides in groundwater are chemically trapped by the clay subsoil andretained close to the burial trenches.
Radiological dose assessments are not routinely conducted for the LFBG, however theenvironmental monitoring program, begun in 1966 (Cook et al., 1969), is based on thepotential exposure pathways. The monitoring at LFBG has included measurement of

A N S T O E - 7 4 7
ENVIRONMENTAL and EFFLUENT MONITORING at ANSTO SITES, 2001
5
radioactivity in soil, plants, groundwater, and airborne dust sampled from the site, as well assurface water from creeks draining the area (see Hoffmann, 1990). These samples have shownno detectable beryllium in windborne dust, or tritium in water sampled from creeks drainingthe area, for at least a decade. External gamma radiation dose over the disposal area has beensurveyed, using a hand-held meter, since 1993. Soil sampling is triggered only when a dosethree times background is recorded; this last occurred at a point over the burial trenches in1993. The plants and soil covering burial trenches at LFBG are regularly inspected and anysign of deterioration is remedied.
2.4 THE NATIONAL MEDICAL CYCLOTRONThe National Medical Cyclotron (NMC) provides isotopes for research, clinical evaluationsand routine nuclear medicine procedures. It is owned and operated by ANSTO and is locatedadjacent to the Royal Prince Alfred Hospital in Camperdown, Sydney (see Figure 1 inset).
The NMC is primarily used to produce radiopharmaceuticals for use in two diagnosticimaging systems - positron emission tomography (PET) and single photon emission computedtomography (SPECT). The radionuclides produced by the NMC are typically of a very shorthalf-life (particularly for PET), ranging from minutes to a number of days, and must beadministered to the patient very soon after they are produced. The NMC was therefore locatedphysically close to major Sydney hospitals to minimise the delay between production andpatient use.
SPECT radiopharmaceuticals produced at the NMC include:gallium-67, used to diagnose soft-tissue tumours and some inflammatory lesions, with ahalf-life of 78 hours;thallium-201, used to assess heart conditions, with a half-life of 74 hours; andiodine-123, used to diagnose certain thyroid diseases, with a half-life of 13 hours.
PET radiopharmaceuticals produced at the NMC include:fluorine-18, used to diagnose brain disease and to assess the spread of cancers, with ahalf-life of 110 minutes;nitrogen-13, used for the early detection of coronary disease, with a half-life of 10minutes; andoxygen-18, used to study oxygen metabolism, with a half-life of 2 minutes.
The pathways through which radionuclides from the NMC may enter the environment arevery similar to those discussed with relation to the Lucas Heights site, namely:
atmospheric discharges of short-lived isotopes such as iodine-123;discharges to the Sydney Water sewerage system of low-level liquid effluent, typicallycontaining thallium-201, thallium-202, gallium-67, cobalt-57, zinc-65 and iodine-123.
The longest-lived radioisotope discharged to air from the NMC is gallium-67 with a half-lifeof 78 hours. In the case of liquid effluent, cobalt-57 has the longest half-life at around 271days. Liquid effluent discharged to the Sydney sewerage system ultimately enters the seaoffshore via the deep ocean outfalls. There is therefore not likely to be any significantenvironmental pathway to humans, such as through the consumption of seafood.
A N S T O E - 7 4 7
ENVIRONMENTAL and EFFLUENT MONITORING at ANSTO SITES, 2001
6
3 ENVIRONMENTAL MONITORING AT THE LUCASHEIGHTS SITE
The monitoring program at Lucas Heights involves measurement of the radioactivity in localenvironmental samples, as well as the liquid and airborne effluent discharged from the site.(Details of the effluent monitoring programs are presented in Section 4 of this report. Effluentmonitoring at the National Medical Cyclotron site is reported in Section 5.)
Samples of sediment, groundwater, biota, air and surface water were collected during 2001 atthe sites shown in Figures 1 to 4 and analysed for radioactivity. Sampling locations includedthe Woronora River, Mill Creek, Bardens Creek, Forbes Creek, Potter Point ocean outfall,stormwater outlets, creeks draining the Lucas Heights site and the Little Forest BurialGround. The on-site meteorological station has been in operation since 1958 and collects dataall year round. External gamma radiation levels at the perimeter of the Lucas Heights site, aswell as local residences, have been measured since 1994.
The environmental sample collection and preparation schedule is shown in Table 1. Furtherdetail about the collection, preparation and analysis of environmental samples was publishedin Hoffmann et al., 2001. For information on the major radionuclides detected, includingnaturally occurring radioactivity in environmental samples, please refer to Appendix 1.Appendix 2 lists the radionuclide symbols and half-lives used throughout this report.
Environmental survey results for 2001 are presented in Tables 2 to 18b. Results areinterpreted against state or national guidelines, such as:
The NSW Regulations associated with the Protection of the Environment Operations Act,1997; andThe National Health and Medical Research Council and Australian Water ResourcesCouncil (NH&MRC and AWRC) Australian Drinking Water Guidelines, 1996.
It should be noted that the environmental water samples discussed in this section are notrequired to meet guidelines for radioactivity concentrations in drinking water. Suchguidelines are used as indicative levels simply to provide context for the results of tests for thepresence of tritium and other radionuclides in non-class C waters. In previous years, resultswere compared with the WHO 1993 guidelines. Both the Australian and WHO guidelines usea similar methodology to assess the dose from radioisotopes present in drinking water.
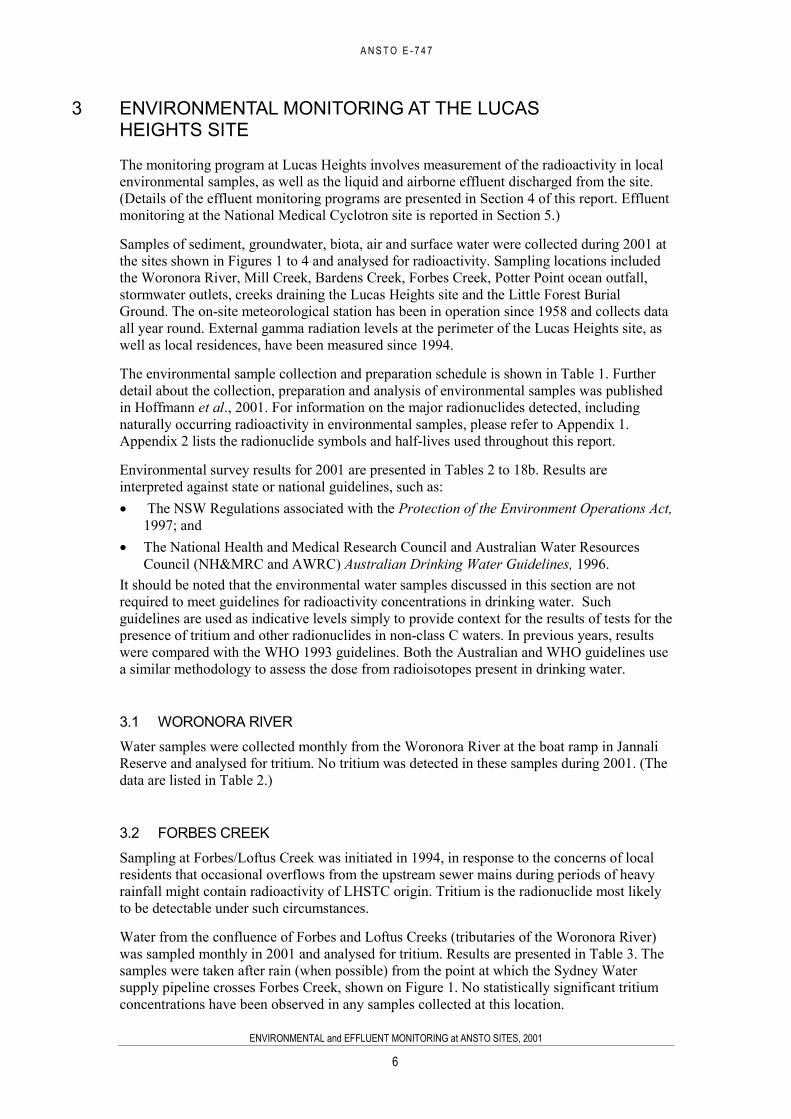
3.1 WORONORA RIVERWater samples were collected monthly from the Woronora River at the boat ramp in JannaliReserve and analysed for tritium. No tritium was detected in these samples during 2001. (Thedata are listed in Table 2.)
3.2 FORBES CREEKSampling at Forbes/Loftus Creek was initiated in 1994, in response to the concerns of localresidents that occasional overflows from the upstream sewer mains during periods of heavyrainfall might contain radioactivity of LHSTC origin. Tritium is the radionuclide most likelyto be detectable under such circumstances.
Water from the confluence of Forbes and Loftus Creeks (tributaries of the Woronora River)was sampled monthly in 2001 and analysed for tritium. Results are presented in Table 3. Thesamples were taken after rain (when possible) from the point at which the Sydney Watersupply pipeline crosses Forbes Creek, shown on Figure 1. No statistically significant tritiumconcentrations have been observed in any samples collected at this location.

A N S T O E - 7 4 7
ENVIRONMENTAL and EFFLUENT MONITORING at ANSTO SITES, 2001
7
3.3 POTTER POINT BIOLOGICAL MONITORINGThe biological monitoring at Potter Point is designed to give the best chance of detectinghuman-produced radionuclides in the marine environment. Fish, algae (seaweed) andbarnacles are collected because these organisms represent different levels in the food chainleading to humans (ie. water to seaweed to fish to people) and also because the algae andbarnacles are efficient at concentrating a variety of radionuclides from the water.
The sampling locations at Potter Point and the reference (background) site in the RoyalNational Park are shown in Figure 4, and the results for fish flesh, green algae and barnaclesare given in Tables 4, 5 and 6. See Section 6 for details of the offshore monitoring programconducted at Potter Point.
The species collected from Potter Point were blackfish or luderick (Girella sp.), green algae(mainly Enteromorpha sp. or Ulva sp.) and surf barnacles (mainly Tesseropera rosea).
The approximate quantities collected in 2001 were blackfish, 0.6 kg fresh weight; green algae,1.6 kg; and barnacles, 1.2 kg. Collections were conducted with authorisation from the NSWDepartment of Fisheries.
Fish were filleted and skinned, while the algae and barnacles were left whole and unwashed.Samples were dried, ground and analysed for gamma-emitting radioisotopes. The upgradingof the Cronulla Sewage Treatment Plant to remove important plant nutrients (tertiarytreatment) affected sampling by greatly reducing the amount of algae (Enteromorpha sp.)growing near the outfall. In October 2001, Ulva sp. was the main type of green alga sampledat Potter Point and in the Royal National Park.
The radioactivity of the biological samples is expressed as becquerels per kilogram freshweight. Gamma spectrometry of samples collected from Potter Point and the comparison sitesome 6.5 kilometres away, showed typical levels of naturally occurring radioisotopes, whichare commonly found in marine specimens. These included beryllium-7, potassium-40 (foundin all biological samples) and progeny of the uranium-238 and thorium-232 decay series, suchas lead-210 and thorium-234.
Three fish samples were collected at Potter Point during the year (see Table 4). The filletedflesh was analysed by gamma spectrometry and all sample spectra were checked for thepresence of anthropogenic (man-made) radionuclides. None were detected. The minimumdetectable activities (95% confidence) are therefore quoted for relevant radionuclides such asiodine-131, cobalt-60 and caesium-137. Any other anthropogenic radionuclides would bereported and discussed if they were noted in the sample spectra.
Green algae sampled from the shore near the Potter Point ocean outfall in March and October2001 contained iodine-131 as well as the expected natural radioactivity (see Table 5). Noother anthropogenic radionuclides were detected. There was a decline in the amounts of bothiodine-131 and cobalt-60 detected in green algae in 2001, compared with levels found overthe past few years of sampling.
In 2001, no gamma radioactivity, other than that of natural origin, was detected in any of thefour barnacle samples collected from Potter Point (see Table 6).
Iodine-131 is a beta- and gamma-emitting radionuclide with a relatively short half-life ofabout eight days. It is an important medical isotope used in hospitals for the treatment ofthyroid cancer and is also produced at the Lucas Heights site by ANSTO’s commercial arm,Australian Radiopharmaceuticals and Industrials. ANSTO’s liquid effluent is not therefore theonly source of iodine-131 entering the sewerage system in the Sutherland Shire, since localhospitals and medical practices using nuclear medicines may also be sources.
A N S T O E - 7 4 7
ENVIRONMENTAL and EFFLUENT MONITORING at ANSTO SITES, 2001
8
The small concentrations of iodine-131 found in green algae from Potter Point are consideredof no health significance to humans. Even though blackfish are known to eat such algae, noiodine-131 was detected in the fish sampled in 2001.
As in previous years, since 1995 when the current biological sampling began at Potter Point,no human-produced radionuclides were detected in any of the biological samples collectedfrom the site in the Royal National Park, where only natural levels of radiation are expected.
3.4 STORMWATERConcrete stormwater retention dams (bunds) on the three main stormwater outlet points forthe Lucas Heights site retain stormwater/groundwater seepage temporarily before its releaseoff-site. They enable the on-site containment and treatment of any small accidental spills orreleases of contaminated liquid that could otherwise enter the site stormwater system. Theyare also used as environmental monitoring points. The locations of the stormwater bunds areshown in Figure 2.
The stormwater bunds are inspected and discharged daily by Waste Operations staff.
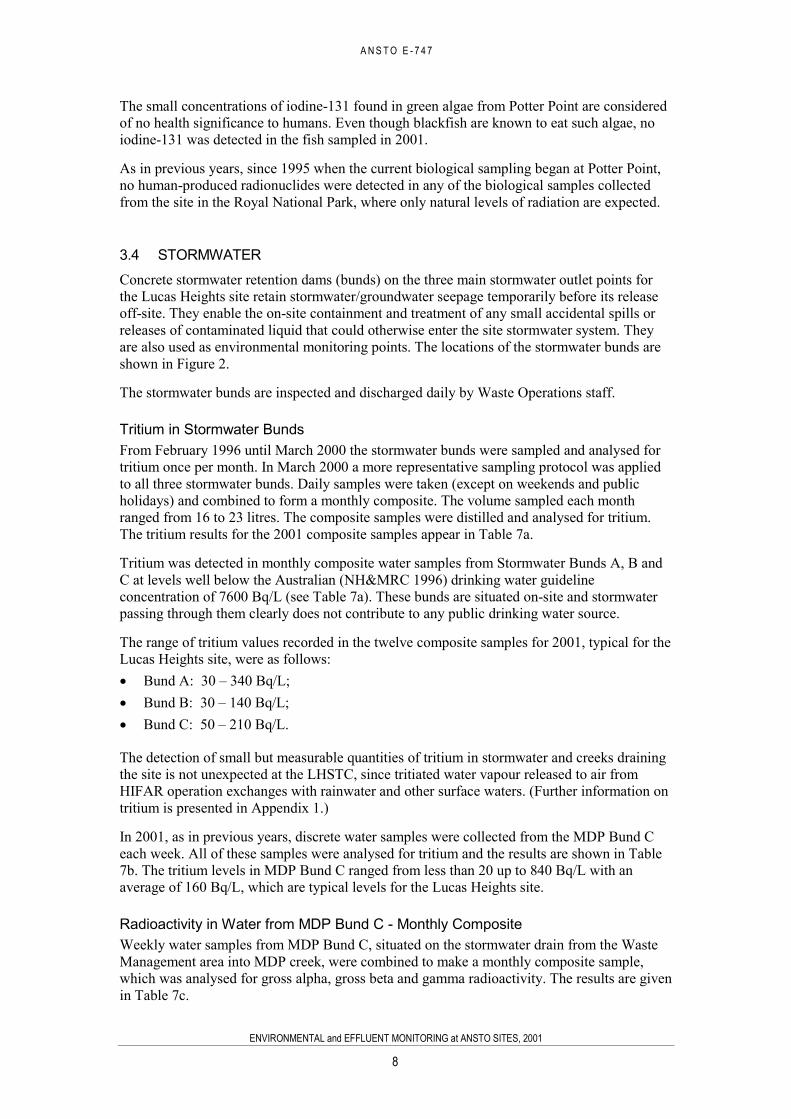
Tritium in Stormwater BundsFrom February 1996 until March 2000 the stormwater bunds were sampled and analysed fortritium once per month. In March 2000 a more representative sampling protocol was appliedto all three stormwater bunds. Daily samples were taken (except on weekends and publicholidays) and combined to form a monthly composite. The volume sampled each monthranged from 16 to 23 litres. The composite samples were distilled and analysed for tritium.The tritium results for the 2001 composite samples appear in Table 7a.
Tritium was detected in monthly composite water samples from Stormwater Bunds A, B andC at levels well below the Australian (NH&MRC 1996) drinking water guidelineconcentration of 7600 Bq/L (see Table 7a). These bunds are situated on-site and stormwaterpassing through them clearly does not contribute to any public drinking water source.
The range of tritium values recorded in the twelve composite samples for 2001, typical for theLucas Heights site, were as follows:
Bund A: 30 – 340 Bq/L;Bund B: 30 – 140 Bq/L;Bund C: 50 – 210 Bq/L.
The detection of small but measurable quantities of tritium in stormwater and creeks drainingthe site is not unexpected at the LHSTC, since tritiated water vapour released to air fromHIFAR operation exchanges with rainwater and other surface waters. (Further information ontritium is presented in Appendix 1.)
In 2001, as in previous years, discrete water samples were collected from the MDP Bund Ceach week. All of these samples were analysed for tritium and the results are shown in Table7b. The tritium levels in MDP Bund C ranged from less than 20 up to 840 Bq/L with anaverage of 160 Bq/L, which are typical levels for the Lucas Heights site.
Radioactivity in Water from MDP Bund C - Monthly CompositeWeekly water samples from MDP Bund C, situated on the stormwater drain from the WasteManagement area into MDP creek, were combined to make a monthly composite sample,which was analysed for gross alpha, gross beta and gamma radioactivity. The results are givenin Table 7c.

A N S T O E - 7 4 7
ENVIRONMENTAL and EFFLUENT MONITORING at ANSTO SITES, 2001
9
The average gross alpha/beta activities of the monthly MDP Bund C composite samples for2001 (including less-than values) were gross alpha less than 0.03 Bq/L; gross beta 0.73 Bq/L.These values are well below the relevant limits for Class C waters (gross alpha, 1.1 Bq/L andgross beta, 11.1 Bq/L) under the Protection of the Environment Operations Act (1997).
Gamma spectrometry performed on the monthly composite samples showed low butdetectable caesium-137 concentrations in ten of the twelve samples. The only other significantgamma-emitters detected were potassium-40 and beryllium-7 (both of natural origin) andoccasional traces of cobalt-60. The latter radionuclide was probably associated withsuspended sediment in the unfiltered samples.
The average weekly concentration of caesium-137 in MDP bund water was less than 0.020Bq/L, or 0.2% of the Australian guideline value for caesium-137 in drinking water(NH&MRC 1996). Similar low levels of caesium-137 have been detected in previous years.
Sediment from Stormwater BundsSediment that has accumulated in the stormwater bunds is removed at least once each year.These sediments are analysed for gross alpha, gross beta and gamma radioactivity. Resultspertaining to sediment collected from the three bunds in 2001 are given in Table 8. Grossalpha/beta activities found in 2001 corresponded to normal levels for similar sandy soils ofthe Sydney region. Gamma-emitters detected included naturally occurring potassium-40,beryllium-7 and progeny of the uranium-238 and thorium-232 decay series. Smallconcentrations of fission or activation products were also detected. The extremely lowactivities found do not have any health consequences for humans or the environment.
3.5 SURFACE WATERS
MDP Creek (MDP+60m)Stormwater and groundwater from the southeast corner of the site drain into MDP creek (seeFigure 2). Historically, the water from this area has been sampled from a natural pool aboutsixty metres below the actual stormwater outlet itself, known as MDP+60m.
The weekly MDP+60m sample was combined to make a composite sample for each month.The monthly samples were analysed for gross alpha, gross beta and gamma- emitters. Eachweekly sample was also separately analysed for tritium.
Tritium in Water from MDP+60m - WeeklyTritium results for the weekly MDP+60m water samples are shown in Table 9a and variedfrom less than 20 up to 470 Bq/L. The average tritium concentration of weekly samples forthe year was 110 Bq/L, which is less than 2% of the Australian drinking water guidelineconcentration (NH&MRC 1996).
Radioactivity in MDP+60m - Monthly CompositeGross alpha and gross beta radioactivity results for monthly composite MDP+60m watersamples were at background levels throughout the year (see Table 9b). The average activitieswere less than 0.04 Bq/L for gross alpha and 0.33 Bq/L for gross beta. These are well belowthe relevant NSW regulations limits for Class C waters: 1.1 Bq/L for gross alpha and 11.1Bq/L for gross beta activity.
Gamma spectrometry of the MDP+60m creek water composite samples showed low levels ofthe natural radionuclides potassium-40 and beryllium-7, as well as caesium-137 in nine of thetwelve samples. The maximum observed concentration of caesium-137 represents less than

A N S T O E - 7 4 7
ENVIRONMENTAL and EFFLUENT MONITORING at ANSTO SITES, 2001
1 0
0.3% of the Australian drinking water guideline concentration (NH&MRC 1996). No othergamma-emitters were detected.
SPCC Creek Sampling PointsSampling locations on Strassman Creek, Bardens Creek and MDP Creek (shown in Figure 2)are known as the “SPCC” creek sampling points because they were originally selected in1975 by the State Pollution Control Commission (1). Stormwater from the Lucas Heights siteflows into these small local streams, which are classified as Class C waters under theregulations associated with the NSW Protection of the Environment Operations Act, 1997.
The results of gross alpha and gross beta analyses conducted on the SPCC creek samples areshown in Table 10. Note that the gross beta results include the contribution of naturalpotassium-40 activity. All results for 2001 were well below the limits for gross alpha andgross beta activity in the relevant NSW regulations. Although drinking water standards do notstrictly apply to stormwater, the results were also below the more restrictive Australianguideline value of 0.5 Bq/L for gross alpha and gross beta activity in drinking water(NH&MRC 1996, as amended September 2001).
Bardens Creek WeirIn addition to the monthly sampling (see above), weekly water samples were also collectedfrom the flume weir on Bardens Creek. The results of tritium analyses performed on thesesamples are shown in Table 11. The average weekly concentration at this location was lessthan 50 Bq/L, or less than 1% of the NH&MRC 1996 guideline concentration. It should benoted that water from Bardens Creek is not part of any known drinking water supply.
Surface-water and Stormwater SummaryTritium and gamma activity concentrations found in stormwater at the Lucas Heights site andassociated watercourses were consistently below 2% of the Australian drinking waterguideline values. Gross alpha/beta results were substantially below the limits specified in therelevant NSW regulations for Class C waters. Since the levels of detected activity wereminimal, and the stormwater does not enter any known human drinking water supply, it isconcluded that there are no environmental or health consequences to humans from themeasured radioactivity in stormwater from the Lucas Heights site.
3.6 GAMMA SURVEY OF EFFLUENT DISCHARGE PIPELINEThe pipeline through which liquid effluent from ANSTO is discharged to the Sydney Watersewer is shown in Figure 2. In addition to the regular inspection and maintenance of thepipeline, surveys of the dose rates along the accessible sections of pipeline were carried out in2001 in order to detect any past or present leaks. The results are summarised in Table 12a.Gamma dose rates at pipe joints were recorded using an Eberline PRM-7 dose-rate meter. Themeasurement tolerance on such instruments is typically 20%. The measured dose ratesranged from 0.05 to 0.13 Sv/hour and were principally due to natural background radiation.
Staff observed a small weep in a pipe joint during routine environmental sampling on 30 July2001. This was immediately repaired and the Environmental Monitoring Group collected soilsamples and measured gamma dose rates around the pipe joint. The soils were analysed forgross alpha, beta and gamma activity and the results are given in Table 12b. Localised soilcontamination of anticipated radionuclides, such as cobalt-60 and caesium-137 (less than 0.3
1 Now the NSW Environment Protection Authority
A N S T O E - 7 4 7
ENVIRONMENTAL and EFFLUENT MONITORING at ANSTO SITES, 2001
1 1
Bq/g dry weight in each case) was found in samples from directly underneath the leak and atnear-background levels a metre downhill. The maximum levels found were less than a tenthof the relevant IAEA exemption level (IAEA 1996).
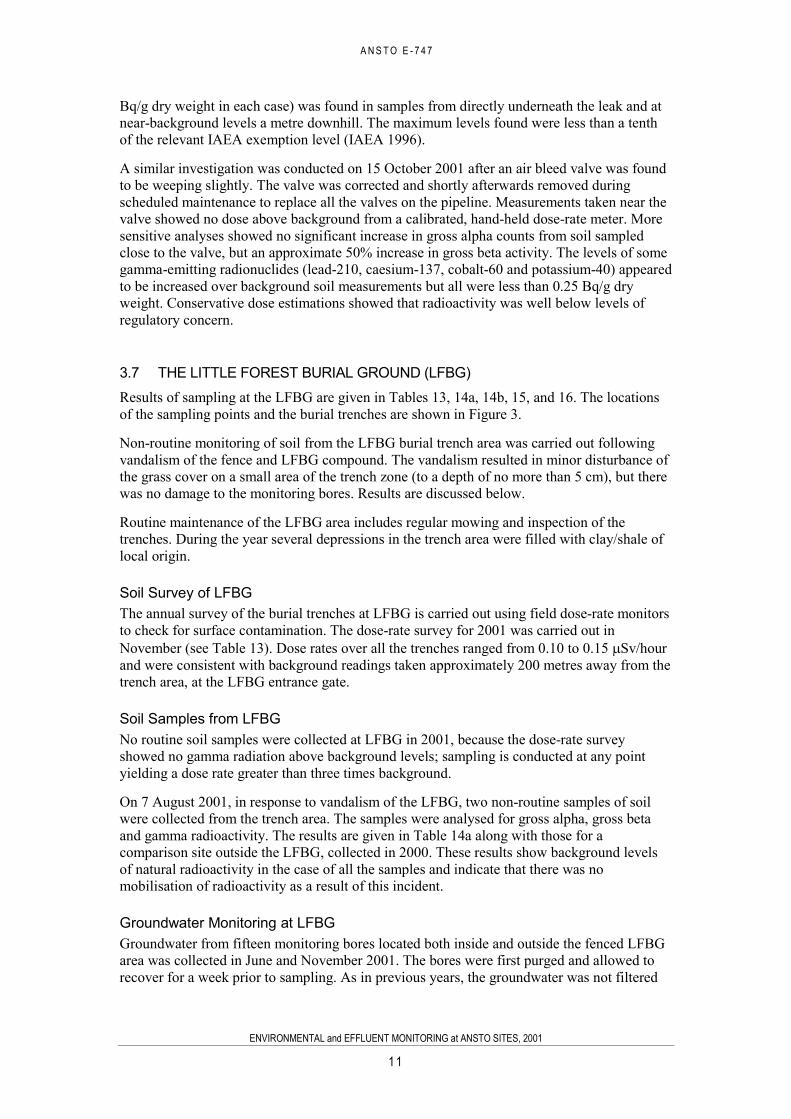
A similar investigation was conducted on 15 October 2001 after an air bleed valve was foundto be weeping slightly. The valve was corrected and shortly afterwards removed duringscheduled maintenance to replace all the valves on the pipeline. Measurements taken near thevalve showed no dose above background from a calibrated, hand-held dose-rate meter. Moresensitive analyses showed no significant increase in gross alpha counts from soil sampledclose to the valve, but an approximate 50% increase in gross beta activity. The levels of somegamma-emitting radionuclides (lead-210, caesium-137, cobalt-60 and potassium-40) appearedto be increased over background soil measurements but all were less than 0.25 Bq/g dryweight. Conservative dose estimations showed that radioactivity was well below levels ofregulatory concern.
3.7 THE LITTLE FOREST BURIAL GROUND (LFBG)Results of sampling at the LFBG are given in Tables 13, 14a, 14b, 15, and 16. The locationsof the sampling points and the burial trenches are shown in Figure 3.
Non-routine monitoring of soil from the LFBG burial trench area was carried out followingvandalism of the fence and LFBG compound. The vandalism resulted in minor disturbance ofthe grass cover on a small area of the trench zone (to a depth of no more than 5 cm), but therewas no damage to the monitoring bores. Results are discussed below.
Routine maintenance of the LFBG area includes regular mowing and inspection of thetrenches. During the year several depressions in the trench area were filled with clay/shale oflocal origin.
Soil Survey of LFBGThe annual survey of the burial trenches at LFBG is carried out using field dose-rate monitorsto check for surface contamination. The dose-rate survey for 2001 was carried out inNovember (see Table 13). Dose rates over all the trenches ranged from 0.10 to 0.15 Sv/hourand were consistent with background readings taken approximately 200 metres away from thetrench area, at the LFBG entrance gate.
Soil Samples from LFBGNo routine soil samples were collected at LFBG in 2001, because the dose-rate surveyshowed no gamma radiation above background levels; sampling is conducted at any pointyielding a dose rate greater than three times background.
On 7 August 2001, in response to vandalism of the LFBG, two non-routine samples of soilwere collected from the trench area. The samples were analysed for gross alpha, gross betaand gamma radioactivity. The results are given in Table 14a along with those for acomparison site outside the LFBG, collected in 2000. These results show background levelsof natural radioactivity in the case of all the samples and indicate that there was nomobilisation of radioactivity as a result of this incident.
Groundwater Monitoring at LFBGGroundwater from fifteen monitoring bores located both inside and outside the fenced LFBGarea was collected in June and November 2001. The bores were first purged and allowed torecover for a week prior to sampling. As in previous years, the groundwater was not filtered

A N S T O E - 7 4 7
ENVIRONMENTAL and EFFLUENT MONITORING at ANSTO SITES, 2001
1 2
prior to analysis, which meant that any radioactivity (natural or otherwise) bound tosuspended sediments in the samples would be included in the analysis.
The MB series of bores were drilled in 1986 and first sampled in 1988, whilst BHF, BH10,OS2 and OS3 are from a much older series of bores that are neither screened nor lined.
The groundwaters were analysed for tritium, gross alpha, gross beta and gamma radioactivity.Results are listed in Table 14b, with shaded areas indicating the three bores located outsidethe fenced area that were sampled. Note that there are no liquid or airborne emissions, assuch, from the LFBG, therefore no discharge authorisation exists. For the purposes ofcomparison, however, national guidelines for surface waters and/or drinking water areprovided.
Gamma-emitters in LFBG GroundwaterApart from traces of cobalt-60 found in MB16, located in the centre of the trench area, onlynatural potassium-40 and progeny of the U-238 series were occasionally detected in LFBGbore waters. The maximum concentration of cobalt-60 was less than 1% of the Australiandrinking water guideline value of 20 Bq/L (NH&MRC 1996).
Gross Alpha/Beta Activity in LFBG GroundwaterThe gross alpha activity found in groundwater from LFBG ranged from less than 0.02 up to0.16 Bq/L. The gross beta values ranged from 0.04 to 0.54 Bq/L. The results were all belowthe limits for Class C surface waters of 1.1 Bq/L (alpha) and 11.1 Bq/L (beta) under the NSWregulations associated with the Protection of the Environment Operations Act, 1997. Thegross alpha and gross beta activity levels were also at or below the more restrictive Australiandrinking water guideline level of 0.5 Bq/L.
Tritium in LFBG GroundwaterThe range of tritium concentrations measured in 2001 was similar to values observed inprevious years, with detectable tritium levels in thirteen out of fifteen bores sampled. BoresOS3, MB13 and MB16 usually display the most significant tritium concentrations, withMB16, located in the centre of the trenches, having the highest levels. However, in November2001 the greatest concentration of tritium (5690 Bq/L) was observed in BH10. Similar levelswere last recorded in this bore in 1997 and 1998. The tritium concentration in BH10 was stillbelow the level of 7600 Bq/L, which is considered safe for Australian drinking water.
MB19 and MB21, two of the three bores sampled outside the fenced area contained very low,but detectable, levels of tritium.
Streams Draining the LFBG areaSamples of surface water and sediment were collected from Mill Creek and Bardens Creek,which drain the area around the LFBG, near their confluence. This sampling location isapproximately two kilometres distant from the LFBG (see Figure 1). The results of grossalpha, gross beta, tritium and gamma analyses on these samples are given in Table 15. Noradioactivity above environmental background levels was found.
Airborne Particle Sampling at the LFBGThe airborne particulate pathway requires special consideration at LFBG because the site wasalso used for the disposal of stable beryllium oxide from 1960 to 1968. This beryllium is notradioactive but would be chemically toxic if inhaled as a fine dust.
A N S T O E - 7 4 7
ENVIRONMENTAL and EFFLUENT MONITORING at ANSTO SITES, 2001
1 3
An Ecotech high-volume air sampler was operated at the Little Forest Burial Ground onceevery two weeks for four to six hours during normal working hours. Sampling was notperformed during wet weather when airborne dust levels would have been negligible.
The results are given in Table 16. At the end of each three-month sampling period, theexposed filter was divided into four equal portions. Two of these were used for beryllium andplutonium analyses; the remaining two portions were stored. Beryllium and plutonium werenot detected on the filter portions analysed in 2001.
Wind Conditions at the LFBGWind-speed conditions at the LFBG are assumed to be similar to those measured at the nearbyLucas Heights meteorological tower. In 2001, during periods of air sampling at the LFBG, theaverage wind speed at Lucas Heights was 3.4 metres per second. This information wasobtained from 15-minute averages of wind-speed data recorded at a height of 10 metres on theANSTO meteorological tower during the actual periods that sampling was undertaken. Forfurther information on the meteorological monitoring carried out at Lucas Heights see Section3.9.
The wind-speed threshold for increased re-suspension of dust particles from the ground intemperate Australian conditions is normally considered to be about 5 to 6 metres per second.However, this depends on local conditions, including soil moisture, age of the particles andtheir bonding to the ground surface, vegetation cover and local turbulence. Nigel Holmes andAssociates (1991) reported that 5.6 metres per second was the critical wind-speed thresholdfor dust generation from an exposed surface, such as the nearby Lucas Heights WasteManagement Centre.
The LFBG has an established vegetation cover consisting of grass and scattered shrubs, whichminimises the potential for dust generation. Analysis of all wind-speed data from LucasHeights for the period April 1991 to April 2002 showed that wind speeds exceeded 5.6 metresper second in only 3.3% of the time during that period (Clark, G.H., 1997 and Clark, G.H.,unpublished data, 2002).
The LFBG is a stable, grass-covered area that rarely experiences winds capable of significantdust generation. Under ordinary circumstances, the possibility that contaminated airborneparticles could be transported off-site is remote. Radiological exposures to members of thepublic from the LFBG continue to be assessed as negligible.
3.8 IODINE-131 IN AIRFour continuous air-sampling stations are situated along the eastern boundary of the site(where suburban residences are closest) to monitor concentrations of ambient iodine-131 inair. The locations of these samplers are shown in Figure 2. Iodine-131 is a nuclide ofparticular interest since it can be incorporated into the food chain, unlike inert noble gases.
At each station the air is sampled by means of a vacuum pump that draws air through a pair ofMaypacks (activated charcoal filter cartridges), so that duplicate samples are available. Air issampled at a rate of approximately 35 cubic metres per day. Filters are replaced and analysedweekly, with airflow rates through the filters being checked at the same time. Calculations ofiodine-131 activity give maximum levels of activity using a conservative set of assumptions.The Maypacks are screened for iodine-131 activity using an 8 x 4 inch sodium iodide gammadetector.
A N S T O E - 7 4 7
ENVIRONMENTAL and EFFLUENT MONITORING at ANSTO SITES, 2001
1 4
No iodine-131 was detected in ambient air at the site boundary during 2001. All results werebelow the detectable level of 0.0025 Bq/m3 (see Table 17). The minimum detectable levelwould correspond to an annual dose of less than 0.01 mSv per year(2) to a member of ahypothetical critical group living at Stevens Hall Motel and receiving continuous exposure toiodine-131 at a concentration of 0.0025 Bq/m3. Since the fifty-two measurements in 2001showed no detectable iodine-131, the average annual dose to the public from iodine-131 isclearly far less than 0.01 mSv.
3.9 METEOROLOGICAL MONITORINGIn common with many other nuclear facilities, ANSTO undertakes an extensive program ofmeteorological measurements. The prime reason for such a program is to allow estimates tobe made of the downwind concentration of any airborne pollutants, particularly radionuclides,released from the Lucas Heights site through routine operations or under accident conditions.The data collected from this program provide the necessary input to the atmosphericdispersion model called PC-CREAM, which is used to compute the effective dose to anindividual due to the routine airborne or accidental release of radionuclides from the LucasHeights site. (See Section 7.2 for further information regarding PC-CREAM.)
The meteorological data are collected and analysed continuously. The long-term climatologydata for Lucas Heights are updated and published approximately every five years. The mostrecent report available is Clark, G.H., An Updated Analysis of the Lucas Heights Climatology– 1975 to 1996, 1997. The on-site meteorological tower and associated laboratory are shownin Figure 2.
Two off-site meteorological stations are also used to measure the influence of the local terrainon wind flow, dispersion patterns and temperatures. These stations (shown in Figure 1) arelocated at the Boys Town School (Engadine) and at the “Shackels Estate” in the WoronoraRiver valley.
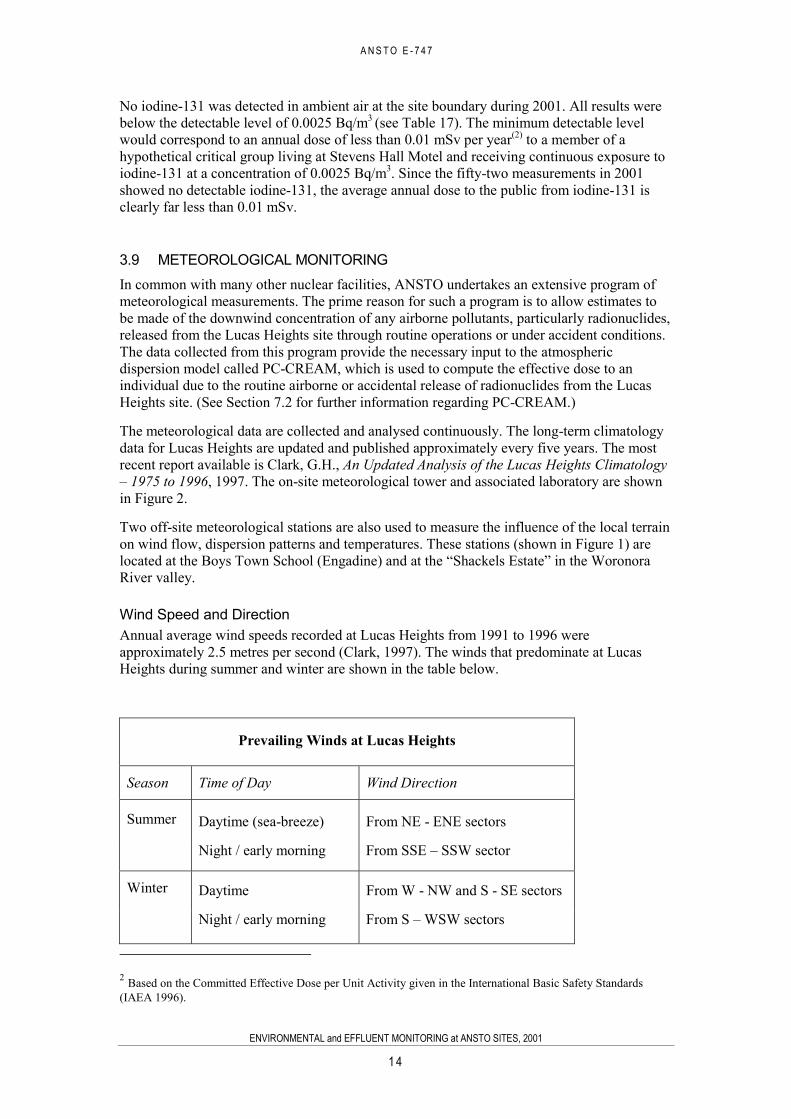
Wind Speed and DirectionAnnual average wind speeds recorded at Lucas Heights from 1991 to 1996 wereapproximately 2.5 metres per second (Clark, 1997). The winds that predominate at LucasHeights during summer and winter are shown in the table below.
Prevailing Winds at Lucas Heights
Season Time of Day Wind Direction
Summer Daytime (sea-breeze) From NE - ENE sectors
Night / early morning From SSE – SSW sector
Winter Daytime From W - NW and S - SE sectors
Night / early morning From S – WSW sectors
2 Based on the Committed Effective Dose per Unit Activity given in the International Basic Safety Standards(IAEA 1996).
A N S T O E - 7 4 7
ENVIRONMENTAL and EFFLUENT MONITORING at ANSTO SITES, 2001
1 5
Winds during autumn and spring represent a transition between those of summer and winterseasons, with sea breezes observed later in the afternoon.
The influence of local topography on wind speeds and directions is very marked in the LucasHeights area. Low wind speeds at the Woronora River valley floor are associated with thedrainage of cool air into the valley at night (Clark, 1997). Winds on the plateau and ridges arestronger and steadier.
Rainfall and EvaporationThe total rainfall at Lucas Heights during the year 2001 was 898 mm recorded on 120 raindays. The wettest month was January with 191 mm, and the maximum 24-hour rainfall was147 mm recorded on 31 January. The total annual rainfall measured at Lucas Heights since1958 has varied from 556 mm to 1658 mm. The total evaporation for the year, measuredusing a Class A evaporation pan, was 1162 mm with a maximum 24-hour value of 10.8 mm.
TemperatureThere are only small differences in recorded temperature between the stations on the ridgesand plateau above the Woronora River valley. However, the valley generally has higherdaytime temperatures due to trapping of warm air, and lower night temperatures due to coolair drainage.
The coldest month at Lucas Heights during 2001 was July with an average middaytemperature of 15.6 C, while the warmest month was January when the average middaytemperature was 26.8 C. The minimum temperature was 3.1 C recorded in July and themaximum was 41.6 C recorded in January.
3.10 EXTERNAL GAMMA RADIATIONThermoluminescent dosimeters (TLD) were used to measure the external gamma radiation inand around the Lucas Heights site during 2001.
The dosimeters, issued by ARPANSA, are the same as those used for personal monitoring andconsist of calcium sulphate thermoluminescent material with three filtered areas and an openwindow.
Figure 2 shows the locations of Dosimeters 1 to 15 at the Lucas Heights site.
ARPANSA Thermoluminescent Dosimeter ResultsTable 18a shows the integrated annual absorbed doses to air, in millisieverts, as monitored bythe ARPANSA dosimeters for the calendar year 2001, and compares these figures with resultsobtained since 1997. Measurements were made over quarterly monitoring periods, thedosimeters were returned to ARPANSA for measurement, and the readings were reported toANSTO as annual absorbed dose to air in terms of milligrays (mGy). The absorbed dose wasthen converted to effective dose (millisieverts) using the conservative conversion factor ofone (3).
Annual doses measured at or within the Lucas Heights site perimeter fence in 2001, apartfrom those at Location 2, ranged from 0.56 mSv to 1.21 mSv. The external gamma dose at
3 UNSCEAR (1993) use conversion factors of 0.72 Sv per Gy for adults, 0.80 for children and 0.93 for infants.

A N S T O E - 7 4 7
ENVIRONMENTAL and EFFLUENT MONITORING at ANSTO SITES, 2001
1 6
Location 2 (on the inner perimeter fence) has been slightly elevated since 1997, when storedradioactive materials were relocated to the area. Comprehensive dose-rate surveys conductedinside and outside the perimeter fence, together with a consideration of occupancy factors,indicate that shielding of the storage building is appropriate. This location is about 1.8kilometres away from any residential areas and there is no public occupancy of the area.
Table 18a also shows the annual absorbed dose to air measured outside three homes in thevicinity of the Lucas Heights site (Locations 16, 17 and 18). This dose, due to environmentalradiation, averaged 0.75 mSv at the three locations in 2001. The annual doses measured atthese local residences have remained constant (within measurement tolerances) since theintroduction of TLD monitoring in 1994.
In July 1999 an additional dosimeter was placed at the Cronulla Sewage Treatment Plant(Location 19) and the annual effective doses measured at this location have remained atbackground levels since monitoring commenced.
When converted to an hourly rate, the local environmental dose figures (Table 18a)correspond with the average hourly absorbed dose rate to air from terrestrial gamma radiation,recorded in Australian capital cities in surveys carried out by the Australian RadiationLaboratory (now ARPANSA) and reported by the United Nations Scientific Committee onthe Effects of Atomic Radiation (UNSCEAR 1993). This means that the external gamma doserates at residences near the Lucas Heights site are at normal background levels.
ANSTO Thermoluminescent Dosimeter ResultsDual monitoring was carried out using two sets of dosimeters placed at the same locations.The environmental dosimeters used by ANSTO contain lithium fluoride and calcium fluoridethermoluminescent materials with energy compensation filters. They were analysed atANSTO using a Harshaw 6600 TLD reader. Table 18b shows the data obtained from theANSTO and ARPANSA dosimeters. As in previous years, the results from the two types ofTLD show no significant difference.
4 EFFLUENT MONITORING AT THE LUCAS HEIGHTS SITE
Descriptions of the liquid and airborne effluent sampling and analysis programs are given inthe following sections and results are discussed. Refer to Section 7 for information on theairborne and liquid effluent discharge authorisations applicable to the Lucas Heights andNMC sites.
In 2001, results of ANSTO’s effluent monitoring programs were also checked by theEnvironmental and Radiation Health Branch of ARPANSA, based in Melbourne.
4.1 AIRBORNE EFFLUENT STACK DISCHARGESAirborne emissions from ANSTO are subject to regulation by ARPANSA. A new airbornedischarge authorisation was issued by ARPANSA in May 2001 and reporting against theFacility Licence Conditions and associated stack notification system commenced from 1 July2001. The stack notification system includes four-weekly, quarterly and annual notificationlevels of radioactivity for each emission source.
In 2001, as in previous years, the authorised airborne emissions from LHSTC stacks weresampled continuously, with weekly analysis and data collection. The effluent airstreamsamples were analysed for gamma-emitters, noble (inert) gases, tritiated water vapour and

A N S T O E - 7 4 7
ENVIRONMENTAL and EFFLUENT MONITORING at ANSTO SITES, 2001
1 7
gross alpha/beta activity and the results were reported to ARPANSA on a four-weekly andquarterly basis. The locations of the discharge stacks are shown in Figure 2.
Lucas Heights Site Stack Sampling and AnalysisDuring 2001, fifteen sampling points on twelve discharge stacks at the Lucas Heights sitewere monitored on a weekly basis. The effluent airstreams were sampled using filtercartridges (Maypacks) connected to vacuum pumps. The Maypacks consist of a charcoalsection to trap gases and vapours, and a particulate filter. Critical orifices are used tostandardise the flow of air through Maypack sampling assemblies.
The Maypack cartridges are initially analysed by gamma spectrometry, and the particulatefilters for gross alpha/beta activity. The cartridges and the filters are then stored for fourweeks. Some of the particulate filters are measured again for gross alpha and gross betaactivity to confirm whether any particulate activity previously measured was principally dueto short-lived radioisotopes.
Tritiated water in the airborne discharges is sampled using a tritium trap. A proportion of thestack airstream is drawn through a series of four Dreschel bottles filled with demineralisedwater, trapping the tritiated water. A liquid scintillation counter is then used to measure thetritium activity in the sample. Noble gases in airborne effluent are measured in situ by agamma spectrometer as the effluent passes through a 250 mL sampling flask.
Lucas Heights Airborne Emission DataTables 19a, 19b, 19c and 19d present the 2001 airborne emission data for the individual stackrelease points at the Lucas Heights site, showing total releases over quarterly periods. Theinformation contained in the above tables is drawn from the quarterly reports sent toARPANSA.
The emission of noble gases from radiopharmaceutical production (Stack 54) remained low in2001 due to process modification that was carried out in the latter half of 2000. Tritiumdischarges returned to usual levels after the HIFAR major maintenance shutdown in 2000.There have been no formal notifications to ARPANSA during the reporting period, howeverANSTO and ARPANSA negotiated the merging of the notification levels for HIFAR Stacks15A and 15M (essentially argon-41 releases) to reflect normal operating conditions.
The possible doses to members of the public as a result of airborne releases from the LucasHeights site were estimated from the airborne discharge data for the 2001 calendar year usingthe PC-CREAM atmospheric dispersion model. See Section 7.2 for further information onPC-CREAM, and Section 8 for discussion of the potential public doses from ANSTOoperations.
It should be noted that the on-site and public doses resulting from the discharges are very low.At the 1.6 km exclusion zone boundary the estimated doses were less than 0.01 mSv per year,well below the annual 0.2 mSv ALARA objective for off-site doses and much lower than thepublic dose limit of 1 mSv/year, and the natural background in Australia of 1.5 to 2 mSv/year(Webb et al, 1999).
Independent Check of Stack Monitoring ProgramANSTO monitored the Lucas Heights site stack discharges on a weekly basis, with four-weekly and quarterly reporting to ARPANSA. Independent confirmation of thesemeasurements was undertaken by a peer laboratory, the Environmental and Radiation HealthBranch, ARPANSA. These independent checks confirmed that ANSTO's stack monitoringsystem operated correctly in 2001.

A N S T O E - 7 4 7
ENVIRONMENTAL and EFFLUENT MONITORING at ANSTO SITES, 2001
1 8
4.2 LOW-LEVEL LIQUID EFFLUENT DISCHARGESThe Waste Operations group at ANSTO is responsible for the handling, treatment, monitoringand authorised discharge of liquid effluent arising from operations at the Lucas Heights site.The Waste Operations facilities are located on the southeast corner of the site (see Figure 2).
Liquid effluent at the Lucas Heights site falls into the following categories:liquids from radioactive laboratories, which have a low level of radioactivity;trade effluent from laboratories and workshops in which radioactive and toxic materialsare not handled;leachate from the nearby Waste Services NSW land-fill operations; andsewage.
Treatment and DischargeThe low-activity liquid effluent produced at The Lucas Heights site goes through an alum-based chemical treatment process for removal of radionuclides. The trade waste effluent istested and chemically treated if necessary. Waste Services effluent is tested for ammonialevels before being accepted as trade waste. Sewage is partially treated at the on-site plant.
The trade waste effluent, treated low-activity effluent and sewage are then combined in theeffluent plant holding tanks. The levels of radioactivity in each holding tank are checked forcompliance with the current Trade Wastewater Agreement, prior to discharge into the SydneyWater sewer. Such discharges are made almost every working day.
The effluent from the Lucas Heights site, along with sewage from the rest of the SutherlandShire, passes through the Cronulla Sewage Treatment Plant, which was upgraded to providetertiary treatment from July 2001. Section 5 discusses the subsequent changes to effluentflows and residence times within the upgraded plant.
SamplingAll effluent is sampled and analysed prior to discharge to the sewer to ensure compliance withthe Trade Wastewater Agreement. Pipeline composite samples are also collected duringdischarge to the effluent pipeline as specified in the Trade Wastewater Agreement. Thesampling period for collection of these “pipeline composite” samples changed in July 2001when a revised Trade Wastewater Agreement came into effect. Previously, one compositesample was collected every fifteen discharge-days, but from July the sampling period wasdecreased to one every four discharge-days.
Groundwater in the Vicinity of Building 27Purely as a precaution, groundwater seepage from the general vicinity of the intermediatewaste and spent fuel storage facility (Building 27) is routinely collected and pumped into theeffluent holding tanks. The levels of gamma-emitting isotopes and tritium in the groundwaterare monitored monthly for gamma and tritium radioactivity (see Table 20). Consistent withresults in previous years, no statistically significant gamma activity was detected ingroundwater from Building 27 Sump in 2001. Tritium levels remained stable with an averageof 340 Bq/L, which is less than 5% of the Australian drinking water guideline level of 7600Bq/L (NH&MRC 1996).
Radioactivity in Liquid EffluentRadioactivity levels in liquid effluent discharged to the Sydney Water sewer in 2001 aresummarised in Table 21. The average gross alpha, gross beta and tritium concentrations ineffluent were calculated from the individual pipeline composite results for each month. The

A N S T O E - 7 4 7
ENVIRONMENTAL and EFFLUENT MONITORING at ANSTO SITES, 2001
1 9
total volume of liquid effluent discharged per month is also given; the average was 7568 cubicmetres.
Table 21 also shows the monthly average concentration quotients for gross alpha, gross betaand tritium activity in the effluent, calculated as required by the relevant Trade WastewaterAgreement (see Section 7.3). The concentrations of alpha-emitters found were below thedetection limits and, for this reason, alpha quotients are reported as “less-than” values.
The levels of radioactivity in liquid effluent discharges from the Lucas Heights site were wellbelow the concentrations required, ensuring that drinking water quality guidelines were met atthe Cronulla STP.
Non-Radioactive Components of Liquid EffluentThe pipeline composite samples were all analysed for the following non-radioactivecomponents: suspended solids; pH; ammonia; biological oxygen demand, grease and zinc.
The non-radiological liquid effluent results are listed in Table 22 as yearly averages recordedfrom 1997 through to 2001. The maximum and minimum values observed are given inbrackets where possible. The concentration limits are also listed against each component.
From 29 March 2001 ANSTO recommenced acceptance of the leachate waste stream from thenearby Waste Services NSW land-fill site, which increased the average ammonia levels inANSTO discharges from 15% to 19% of the 100 ppm limit.
Liquid Effluent Compliance with Trade Wastewater AgreementProportional samples of all liquid effluent discharges were collected and analysed for grossalpha and gross beta radioactivity, pH, biological oxygen demand (BOD), grease, suspendedsolids, ammonia and zinc to confirm compliance with the Sydney Water Trade WastewaterAgreement. A volume-weighted composite sample was also produced from all pipelinesamples each month. This monthly composite sample was analysed for gross alpha/beta,tritium and gamma radioactivity and also assessed for compliance with the Agreement.
Under the terms of the Sydney Water Trade Wastewater Agreement, the average monthlyquotient term (based on the Activity Concentration Equivalents at the ANSTO dischargepoint, see Section 7.3) for gross alpha, gross beta and tritium radioactivity in liquid effluentmust be less than 1. In 2001, the average quotient was less than 0.18, representing less than20% of the authorised limit. Individual monthly quotients ranged from less than 0.12 to lessthan 0.30. All quotients for 2001 samples were below the limit, demonstrating compliancewith the Sydney Water discharge agreement.
Analysis of the monthly composite effluent samples for the year 2001 for the beta-emittingradionuclides, radium-228 and lead-210, showed that concentrations of these nuclides werejust at or below detectable levels. Therefore, as permitted under the discharge agreement, thegross alpha and gross beta activities continue to be reported in terms of the less restrictiveradionuclides, radium-226 and strontium-90.
In the case of non-radiological components of the effluent, 95% of all samples analysed mustbe less than or equal to the Sydney Water Standards for Acceptance of Liquid Trade Wastesto Sewers (shown in Table 22). All samples in 2001 complied with these standards.
Compliance Auditing of Liquid Effluent DischargesIn 2001 ARPANSA obtained random retention samples of the monthly pipeline compositefrom ANSTO’s Waste Operations section and carried out independent analyses. Theseanalyses confirmed that discharges were in compliance with the Sydney Water TradeWastewater Agreement. In addition, Sydney Water also collected random liquid effluent

A N S T O E - 7 4 7
ENVIRONMENTAL and EFFLUENT MONITORING at ANSTO SITES, 2001
2 0
samples from the ANSTO discharge pipeline at Lucas Heights, to independently assesscompliance with its requirements for the acceptance of liquid trade waste. No non-conformances were raised as a result of these audits in 2001, by either Sydney Water orARPANSA.
5 EFFLUENT MONITORING AT THE NATIONALMEDICAL CYCLOTRON
The airborne and liquid effluent monitoring results for the NMC in 2001 are detailed inTables 23a and 23b, respectively. The tables also list the ARPANSA notification levels forairborne discharges and liquid effluent discharge limits as prescribed by the NSWEnvironment Protection Authority (EPA) and in the Trade Waste Agreement with SydneyWater. See Section 7 for discussion of the relevant discharge authorisations.
The NMC airborne emissions are monitored daily using Maypack charcoal filters. Totalmonthly iodine-123 activity discharged to air from the NMC ranged from 0.86 to 6.7 GBq(Table 23a). The total iodine-123 activity discharged in 2001 was less than 32% of the annualnotification level. The total amounts of fluorine-18, gallium-67 and thallium-201 dischargedover the year were orders of magnitude below the relevant annual notification levels.
For liquid effluent discharges from the NMC, the average concentrations of radionuclidesdischarged to sewer each month were all less than 8% of the NSW EPA limits for thallium-201, thallium-202, gallium-67, zinc-65 and iodine-123.
All the individual airborne and liquid effluent emissions from the NMC during 2001 werewell within the prescribed concentration limits.
The airborne and liquid effluent emissions from the National Medical Cyclotron during 2001were also below the ARPANSA-approved notification levels and NSW EPA limits,respectively. Due to the short-lived nature of the radioisotopes concerned, the impact onhumans and the environment from NMC emissions is considered to be negligible.
6 OFFSHORE MONITORING AT POTTER POINT
Treated effluent from the upgraded Cronulla Sewage Treatment Plant is discharged from asubmerged cliff-face outfall at Potter Point, located at the northern end of Bate Bay on theSouthern Sydney coastline of NSW (see Figure 4).
Some public interest groups have in the past expressed concern that treated liquid effluentdischarged to the sewer from the Lucas Heights site may have radiological implications forswimmers and surfers in the vicinity of the Potter Point ocean outfall.
In order to address these concerns ANSTO has carried out a program of investigations atPotter Point since 1995, with the following objectives:
to measure the transit times and dilution factors for liquid effluent travelling betweenLucas Heights and the Cronulla Sewage Treatment Plant (Cronulla STP);to study the dispersion of tritium in the vicinity of the outfall; andto continue the biological monitoring program at Potter Point outfall.
See Section 3.3 of this report for the results of the Potter Point biological monitoring program.
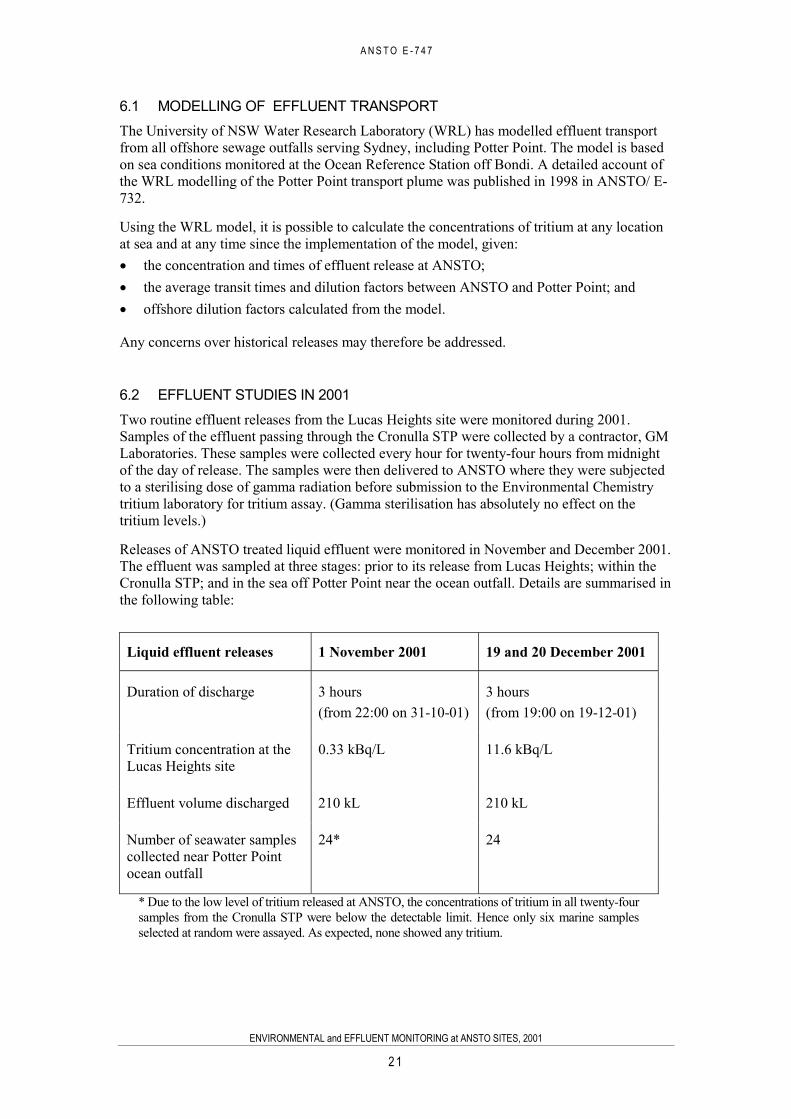
A N S T O E - 7 4 7
ENVIRONMENTAL and EFFLUENT MONITORING at ANSTO SITES, 2001
2 1
6.1 MODELLING OF EFFLUENT TRANSPORTThe University of NSW Water Research Laboratory (WRL) has modelled effluent transportfrom all offshore sewage outfalls serving Sydney, including Potter Point. The model is basedon sea conditions monitored at the Ocean Reference Station off Bondi. A detailed account ofthe WRL modelling of the Potter Point transport plume was published in 1998 in ANSTO/ E-732.
Using the WRL model, it is possible to calculate the concentrations of tritium at any locationat sea and at any time since the implementation of the model, given:
the concentration and times of effluent release at ANSTO;the average transit times and dilution factors between ANSTO and Potter Point; andoffshore dilution factors calculated from the model.
Any concerns over historical releases may therefore be addressed.
6.2 EFFLUENT STUDIES IN 2001Two routine effluent releases from the Lucas Heights site were monitored during 2001.Samples of the effluent passing through the Cronulla STP were collected by a contractor, GMLaboratories. These samples were collected every hour for twenty-four hours from midnightof the day of release. The samples were then delivered to ANSTO where they were subjectedto a sterilising dose of gamma radiation before submission to the Environmental Chemistrytritium laboratory for tritium assay. (Gamma sterilisation has absolutely no effect on thetritium levels.)
Releases of ANSTO treated liquid effluent were monitored in November and December 2001.The effluent was sampled at three stages: prior to its release from Lucas Heights; within theCronulla STP; and in the sea off Potter Point near the ocean outfall. Details are summarised inthe following table:
Liquid effluent releases 1 November 2001 19 and 20 December 2001
Duration of discharge 3 hours(from 22:00 on 31-10-01)
3 hours(from 19:00 on 19-12-01)
Tritium concentration at theLucas Heights site
0.33 kBq/L 11.6 kBq/L
Effluent volume discharged 210 kL 210 kL
Number of seawater samplescollected near Potter Pointocean outfall
24* 24
* Due to the low level of tritium released at ANSTO, the concentrations of tritium in all twenty-foursamples from the Cronulla STP were below the detectable limit. Hence only six marine samplesselected at random were assayed. As expected, none showed any tritium.
A N S T O E - 7 4 7
ENVIRONMENTAL and EFFLUENT MONITORING at ANSTO SITES, 2001
2 2
Investigation on 1 November 2001The level of tritium in the wastewater available for release was a low value of 0.33 kBq/L.Since the upgrade of the Cronulla STP, the in-line dilution factor has increased to around 250.Therefore, the maximum expected tritium concentration at the Cronulla STP would be around1.3 Bq/L, which is well below the limit of detection (10 Bq/L). It is therefore not surprisingthat no tritium was observed in the effluent samples collected at the treatment plant. Clearlythere is further dilution and dispersion between the treatment plant and the outfall, andbetween the outfall and the sampling point in the ocean. For the record, six of the twenty-fourseawater samples were assayed. No tritium was found.
Investigation on 19-20 December 2001The effluent, with a tritium concentration of 11.6 kBq/L, was discharged between 19:00 and22:00 hours on 19 December 2001. Twenty-four samples were collected for tritium assay athourly intervals commencing at midnight on 19 December. Seawater samples were collectedat three sites at hourly intervals between 08:10 and 15:00 hours (twenty-four samples in total)on 20 December. The locations were as follows:
Site 1: 34 degrees 02.518 minutes S 151 degrees 12.836 minutes E (+/-15 metres);Site 2: 34 degrees 02.599 minutes S 151 degrees 12.809 minutes E(+/- 15 metres);Site 3: 34 degrees 02.689 minutes S 151 degrees 12.816 minutes E(+/- 16 metres).
These locations equate to distances of 72 metres, 144 metres and 306 metres at a bearing of178 degrees (almost due south) from the Potter Point ocean outfall.
The tritium released from ANSTO was first detected within the Cronulla STP at 09:00 hourson 20 December and reached a peak of 46 Bq/L at 18:00 hours. There was still measurabletritium in the plume when sampling ceased at 24:00 hours. This corresponds to a transit timebetween Lucas Heights and the sampling point within the Cronulla STP of about 21 hours anda dilution factor of 11600/46, or 253. These values compare with typically 11 hours transittime and dilution factors of around 25, prior to the plant upgrade. The apparent increase in thetransit time from 11 to 21 hours was due to the relocation of the sample collection pointwithin the re-engineered plant.
Since the upgrading of the plant to permit tertiary treatment, the mean residence time ofsewage and LHSTC effluent within the Cronulla STP has increased from a few hours to about18 hours. Dilution of the effluent has also substantially increased.
7 DISCHARGE AUTHORISATIONS
To ensure protection of the public and the environment in general, liquid and airborneemissions from ANSTO sites are subject to regulation by ARPANSA. ANSTO holds licencesissued by ARPANSA for specific conducts at controlled facilities and for dealing withradioactive sources. The licences contain conditions to ensure that discharges to theenvironment are effectively controlled. Compliance with these requirements also ensuresearly detection and notification of increases in emissions to the environment.
In 2001 ANSTO complied with:Site Facility Licence conditions, reporting requirements and any special conditionsprescribed by its regulator, ARPANSA;the ANSTO Airborne Radioactive Discharge Authorisation, May 2001;

A N S T O E - 7 4 7
ENVIRONMENTAL and EFFLUENT MONITORING at ANSTO SITES, 2001
2 3
all provisions of relevant NSW acts and regulations; andin the case of liquid effluent, provisions of the Sydney Water Trade Waste ServiceAgreements Nos. 4423 (1999 and 2001) and 13966 (1994) for the LHSTC and NMCsites, respectively.
Summaries of annual levels of radioactivity in authorised discharges from the LHSTC andNMC sites are presented in this and previous environmental monitoring reports. The airborneand liquid effluent discharge authorisations are discussed below.
7.1 AIRBORNE DISCHARGE AUTHORISATIONIn May 2001 ARPANSA issued ANSTO with an Airborne Radioactive DischargeAuthorisation, applicable to all airborne emissions from ANSTO controlled sites, ie. theLucas Heights site and the NMC. The discharge authorisation is subject to review byARPANSA after 31 December 2001 following receipt and consideration of public comment.For further information on licence conditions, refer to the ANSTO Licence ConditionsHandbook, Section 2.4, issued by ARPANSA.
The purpose of the discharge authorisation is to ensure that the radiation dose to a member ofthe public, arising from routine airborne radioactive discharges at the Lucas Heights site andthe NMC, is as low as reasonably achievable (the ALARA principle) and below the relevantALARA objectives agreed with the Chief Executive Officer (CEO) of ARPANSA.
The ALARA objective for radiation dose to a member of the public from all operations ateither the LHSTC or NMC sites, is 0.020 mSv per year. This is 2% of the annual effectivedose limit for members of the general public recommended by the NH&MRC (1995) andspecified in the NSW Radiation Control Regulation (1993).
In the case of the Lucas Heights site, the ALARA objective is subdivided as follows:
0.010 mSv per year due to the HIFAR research reactor operation;0.010 mSv per year due to radiopharmaceutical production;less than 0.001 mSv per year due to all other activites at the Lucas Heights site.
The licence holder (ANSTO) is also required to demonstrate through monitoring,performance assessments or other evidence, that they are effectively controlling airbornedischarges to the environment. For practical implementation of the ALARA objectives theairborne discharge authorisation incorporates a system of notification levels for dischargesources. A notification level is:
a level set well below the agreed dose constraint to ensure the regulator is informed of anychange in emission with the potential to significantly impact on public exposure;subject to periodic review to maintain relevance in the face of changing technology andoperations.
The discharge authorisation incorporates requirements for formal systems of reporting and therequirement to make application for approval of changes.
7.2 APPLICATION OF THE ANNUAL NOTIFICATION LEVELSAnnual notification levels for each discharge location at the Lucas Heights site and NMC areset such that the maximum possible exposure to a member of the public from all sources atLucas Heights would be less than 0.02 mSv per year. This is more than ten times less than thesite dose constraint of 0.3 mSv per year, that was applicable prior to July 2001 and ensuresthat any event reported to ARPANSA will still be well below the agreed ALARA objective.
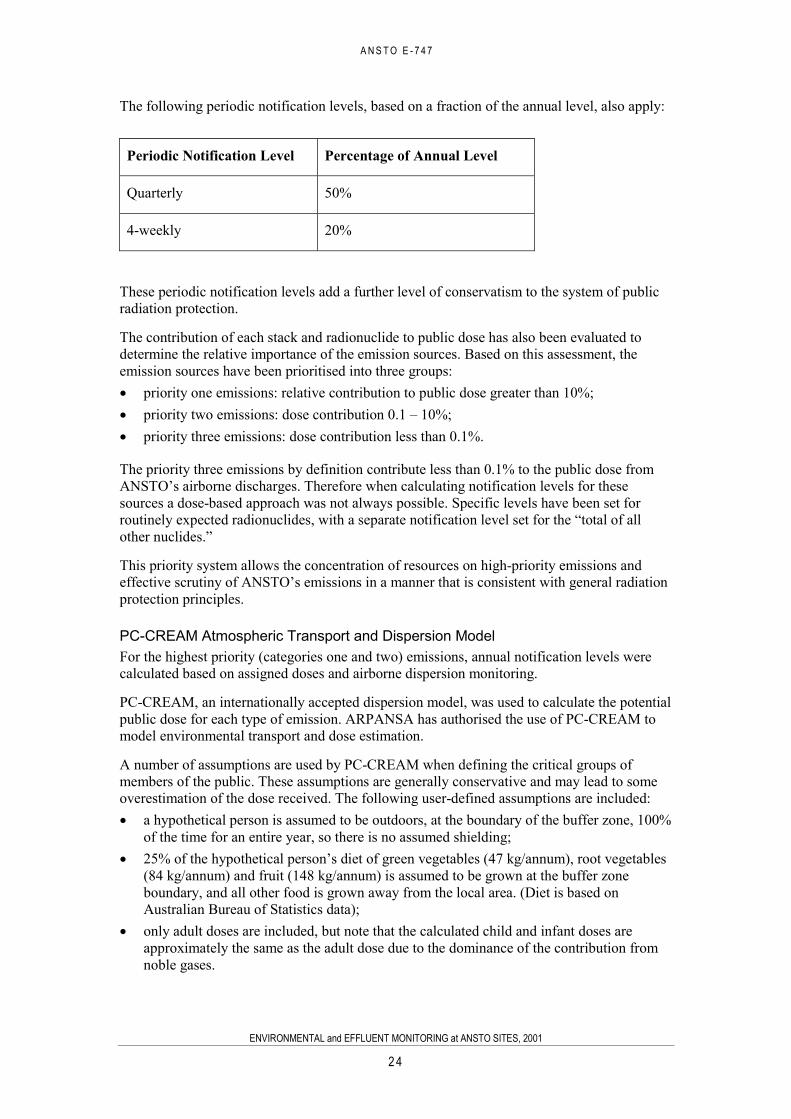
A N S T O E - 7 4 7
ENVIRONMENTAL and EFFLUENT MONITORING at ANSTO SITES, 2001
2 4
The following periodic notification levels, based on a fraction of the annual level, also apply:
Periodic Notification Level Percentage of Annual Level
Quarterly 50%
4-weekly 20%
These periodic notification levels add a further level of conservatism to the system of publicradiation protection.
The contribution of each stack and radionuclide to public dose has also been evaluated todetermine the relative importance of the emission sources. Based on this assessment, theemission sources have been prioritised into three groups:
priority one emissions: relative contribution to public dose greater than 10%;priority two emissions: dose contribution 0.1 – 10%;priority three emissions: dose contribution less than 0.1%.
The priority three emissions by definition contribute less than 0.1% to the public dose fromANSTO’s airborne discharges. Therefore when calculating notification levels for thesesources a dose-based approach was not always possible. Specific levels have been set forroutinely expected radionuclides, with a separate notification level set for the “total of allother nuclides.”
This priority system allows the concentration of resources on high-priority emissions andeffective scrutiny of ANSTO’s emissions in a manner that is consistent with general radiationprotection principles.
PC-CREAM Atmospheric Transport and Dispersion ModelFor the highest priority (categories one and two) emissions, annual notification levels werecalculated based on assigned doses and airborne dispersion monitoring.
PC-CREAM, an internationally accepted dispersion model, was used to calculate the potentialpublic dose for each type of emission. ARPANSA has authorised the use of PC-CREAM tomodel environmental transport and dose estimation.
A number of assumptions are used by PC-CREAM when defining the critical groups ofmembers of the public. These assumptions are generally conservative and may lead to someoverestimation of the dose received. The following user-defined assumptions are included:
a hypothetical person is assumed to be outdoors, at the boundary of the buffer zone, 100%of the time for an entire year, so there is no assumed shielding;25% of the hypothetical person’s diet of green vegetables (47 kg/annum), root vegetables(84 kg/annum) and fruit (148 kg/annum) is assumed to be grown at the buffer zoneboundary, and all other food is grown away from the local area. (Diet is based onAustralian Bureau of Statistics data);only adult doses are included, but note that the calculated child and infant doses areapproximately the same as the adult dose due to the dominance of the contribution fromnoble gases.
A N S T O E - 7 4 7
ENVIRONMENTAL and EFFLUENT MONITORING at ANSTO SITES, 2001
2 5
Other assumptions are intrinsic to PC-CREAM and cannot be altered by the user; forexample, that the effective release height for airborne effluent is the same as the stack height,so that buoyancy, velocity and building wake effects are not included.
7.3 LIQUID EFFLUENT AUTHORISATIONSRoutine discharges of treated, low-level liquid effluent from the LHSTC and NMC sites aremade to the sewer under the terms of Trade Wastewater Agreements, negotiated with SydneyWater Corporation Pty. Ltd.
The Lucas Heights SiteIn 2001, discharges from the Lucas Heights site complied with:
acceptable discharge levels for radioactive pollutants listed in Schedule 1 of theAgreement (at the ANSTO composite sampling and discharge point);World Health Organisation (WHO) Guidelines for Drinking-Water Quality (1993)reference activity concentrations for radionuclides in drinking water (at the CronullaSewage Treatment Plant); andconcentration limits for non-radioactive components of the effluent.
When monitoring liquid effluent at the ANSTO point of release to the sewer, all dischargesmust be below the relevant activity concentration equivalents (ACE) for specificradionuclides. These ACE values allow for dilution between the Lucas Heights site and theCronulla STP.
Where more than one radionuclide is present, the sum is taken of the average concentrationsof all radionuclides on release (expressed as a fraction of the relevant ACE). The monthlyconcentration quotient is calculated as the sum of a mixture of unspecified alpha and betaradionuclides and tritium, where the sum must be no greater than one. Refer to Table 21 forthe ACE values and a summary of 2001 liquid effluent discharges.
Within the terms of the Trade Wastewater Agreement, it is assumed that all alpha and betaradioactivity comes from the most restrictive nuclide of each type as defined in the Schedule,unless that nuclide can be shown to be an insignificant fraction of the effluent. ThereforeANSTO also tests composite samples of liquid effluent (proportionately sampled from alldischarges for the month) specifically for the beta-emitters radium-228 and lead-210. As inprevious years, the results of these analyses were just at, or below, the limit of detection,indicating that these radionuclides are not present in ANSTO effluent in significantproportions. Therefore, reporting of the gross (unspecified) beta activity of liquid effluentcontinues, using the strontium-90 ACE, while the gross alpha activity is reported against theradium-226 ACE. See Hoffmann et al. (2001, Section 3.1) for further details on the abovecalculations.
ANSTO’s Agreement with Sydney Water (No. 4423) for the Lucas Heights site was reviewedin 2001 and changes were implemented from 1 July. The significant changes were as follows:
the sampling period for collection of composite effluent samples from all discharges wasamended to every four discharge-days (previously fifteen discharge-days);hourly pH measurements were to be taken during discharges to sewer;the ammonia concentration limit was increased to 100 ppm (previously 40 ppm); andthe suspended solids concentration limit was increased from 200 to 600 ppm.
A N S T O E - 7 4 7
ENVIRONMENTAL and EFFLUENT MONITORING at ANSTO SITES, 2001
2 6
The National Medical Cyclotron SiteThe airborne emissions from the NMC are regulated by ARPANSA under the ANSTOAirborne Radioactivity Discharge Authorisation (see Section 7.1). The site’s liquid wastedischarges to the Sydney Water sewer are covered by a Trade Waste Agreement (No.13966,1994) that incorporates limits set by the NSW EPA for specific radionuclides in thedischarges. These emissions are routinely monitored and the results for 2001 are discussed inSection 5.
8 POTENTIAL PUBLIC EXPOSURE FROM ANSTO OPERATIONS
The results of the effluent and environmental monitoring programs and subsequent doseassessments are discussed below.
8.1 AIRBORNE EMISSIONSAs indicated in Section 7.1, the discharge authorisation for airborne emissions from ANSTOsites is based on limiting the radiation doses received by members of the public to levels wellbelow the agreed ALARA objective of 0.02 mSv per year for off-site doses.
The Lucas Heights SiteAs indicated in Section 7.2, the PC-CREAM atmospheric transport, dispersion and dosimetrymodel is used to evaluate potential doses to members of the public at various receptorlocations, based on measured stack discharges and local meteorological data. Table 24 showsthe estimated effective doses due to airborne discharges from the Lucas Heights site in 2001at specified locations and distances from the reactor.
The results show that the potential effective doses to critical group members of the publicwithin the 1.6-kilometre-radius buffer zone were calculated to be less than 0.01 mSv per yearin 2001. For people residing at the boundary of the 1.6-kilometre buffer zone and beyond, themost exposed individual was also estimated to receive less than 0.01 mSv/year. These resultsconfirm that the ALARA objective of 0.02 mSv/y for off-site doses was met.
Ambient levels of iodine-131 at the Lucas Heights site were continuously monitored at theperimeter fence. Since all of the iodine-131 measurements were below the detectable limit,the average potential dose to the public is calculated to be less than 0.01 mSv per year. Thisfigure is consistent with the results obtained from the PC-CREAM model and represents 1%of the recommended annual public dose limit of 1 mSv (NH&MRC 1995).
Exposure to background radiation varies significantly between individuals and communities,and depends on factors such as local geological conditions and height above sea level,lifestyle, diet and type of dwelling. The global average for adult exposure to radiation fromnatural sources is estimated to be 2.4 mSv per year (UNSCEAR 2000). The equivalent valuefor Australia is estimated at around 1.5 to 2 mSv per year (Webb et al., 1999).
The estimated potential dose to members of the general public from airborne discharges at theLucas Heights site is only a very small fraction, less than 0.5%, of the radiation dose receivedby everyone each year from naturally occurring sources of radiation.
The National Medical Cyclotron SiteConventional models for atmospheric transport and dispersion such as PC-CREAM cannot beused for the NMC because the complex urban environment, characterised by buildings of
A N S T O E - 7 4 7
ENVIRONMENTAL and EFFLUENT MONITORING at ANSTO SITES, 2001
2 7
various dimensions, produces unpredictable airflow patterns. Atmospheric dispersionmeasurements around the NMC were studied (Clark et al 1994) using an atmospheric tracerrelease, sampling and analysis system. Aspects of the meteorology and wind flow patterns atthe NMC were also studied (Clark and Bartsch, 1994). The measured dilution factors wereapplied to a hypothesised accident scenario involving the release of iodine-123 and xenon-123from the Cyclotron emission stack. The impact on nearby receptors was calculated to be lessthan 10% of the 1 mSv recommended annual public dose limit (NH&MRC 1995). Releasesfrom the Cyclotron under normal operating conditions are very much lower and areconsidered to have insignificant impact on health.
8.2 LOW-LEVEL LIQUID EFFLUENTThe studies conducted by ANSTO at the Cronulla Sewage Treatment Plant and the PotterPoint ocean outfall area from 1995 through to 2001 determined the dilution effects onradionuclides contained in the treated effluent discharged by ANSTO to the sewer. Thepredictions of the Unisearch WRL plume transport and dilution model have been confirmedusing these measurements. If required, the model may be used to calculate tritiumconcentrations in the sea near Potter Point at any time since 1995.
The levels of radioactivity found in fish, algae and barnacles collected near the Potter Pointoutfall, as well as tritium measured in the ocean a short distance from the outfall, arenegligible. They do not pose any health risk to members of the public using the ocean in thevicinity of the outfall or ingesting seafood from the area. The potential dose is estimated to beless than 0.2% of the recommended dose limits for members of the public (NH&MRC 1995).Since the upgrade of the Cronulla STP to tertiary treatment, dilution of the effluent hassubstantially increased, so that the chance of any potential radiological consequences toswimmers (always extremely small) is reduced even further.
Radioactivity in liquid effluent discharges from the NMC to the sewer conforms with thelimits in the Trade Waste Agreement with Sydney Water. These discharges are of short-lived,low level effluent.
8.3 EXTERNAL RADIATION AT THE LUCAS HEIGHTS SCIENCE ANDTECHNOLOGY CENTRE
The levels of external gamma radiation at the Lucas Heights site and private residences inBarden Ridge, Engadine and Woronora were measured by thermoluminescent dosimeters.The local absorbed doses in air were consistent with levels recorded in Australian capitalcities (using similar dosimeters) in Australian surveys carried out by the Australian RadiationLaboratory and reported by UNSCEAR (1993).
These results indicate that the external gamma radiation levels at residential locations in thevicinity of the Lucas Heights site are not noticeably affected by ANSTO’s operations.
8.4 THE LITTLE FOREST BURIAL GROUNDThe 2001 environmental survey results for the Little Forest Burial Ground (LFBG) show asimilar range of values to those observed in the past. Tritium was detected in groundwaternear the burial trenches and at low levels in several other monitoring bores within the fencedarea. Of the fifteen bores sampled, thirteen contained detectable tritium at levels that werebelow the Australian (NH&MRC 1996) drinking water guideline value.
A N S T O E - 7 4 7
ENVIRONMENTAL and EFFLUENT MONITORING at ANSTO SITES, 2001
2 8
Gamma spectrometry of the unfiltered LFBG groundwater showed only small concentrationsof natural potassium-40 and uranium-238 progeny and, in one bore, low levels of cobalt-60(at less than 1% of the NH&MRC 1996 guideline value).
The gross alpha and gross beta activities measured in LFBG groundwater were well belowlevels considered safe for Australian drinking water.
The three groundwater bores that were sampled outside the LFBG fenced area showed lowlevels of tritium and environmental background levels of naturally occurring radioactivity.Surface water sampled from Mill and Bardens Creeks also contained insignificant levels ofradioactivity.
These results confirm that potential radiation exposure to members of the public fromgroundwater and surface water in the vicinity of LFBG is negligible. It should be noted thatcontaminants from other non-radioactive wastes (disposed of by other agencies) in the areasadjacent to LFBG make the groundwater unsuitable for human consumption.
Sampling of airborne particulates at LFBG was regularly carried out using a high-volume airsampler. The air filters were analysed for the presence of beryllium and plutonium, but neitherwas detected in 2001. Based on these and previous surveys, it is concluded that possibleradiation exposure to members of the general public via the inhalation pathway is alsonegligible.
Extra soil, air and dose monitoring was carried out in response to minor vandalism at theLFBG and the results clearly showed that there was no resultant mobilisation of radioactivity.
External radiation readings over the trenches were consistent with normal background levels.Radiation readings around the LFBG site boundary fence were also at background levels,confirming that possible doses to members of the public from external radiation can also beregarded as negligible.
9 CONCLUSIONS
The principal sources of potential radiation exposure to members of the public from routineANSTO operations at the Lucas Heights site and NMC are from airborne emissions and low-level liquid effluent discharges to the sewer. ANSTO complied with all relevantCommonwealth and New South Wales regulations and international guidelines during 2001.It is concluded that there is no impact on the health of the community as a consequence ofoperations at the Lucas Heights Science and Technology Centre or the National MedicalCyclotron.
10 ACKNOWLEDGEMENTS
For their contributions to and critical review of this document the authors thank Dr JohnFerris and Dr Peter Airey. Thanks also to Dr John Harries, Mr Werner Reynolds, Mr LubiDimitrovski and Mr David Woods.
Thanks to Ms Jennifer Harrison for her assistance in analysis of environmental samples, to MrGeoff Clark for providing meteorological data for the Lucas Heights site, and to Mr TomKluss and Mr Ron Syzmczak for their contribution in relation to the Potter Point offshoresampling program.
A N S T O E - 7 4 7
ENVIRONMENTAL and EFFLUENT MONITORING at ANSTO SITES, 2001
2 9
Dosimeter readings for external gamma radiation at the Lucas Heights site (Tables 18a and18b), airborne effluent release data (Tables 19a to 19d, and 24) and public dose estimateswere supplied by Safety Division.
Details of the environmental monitoring at the National Medical Cyclotron (Tables 23a and23b) were also supplied by Safety Division.
Liquid effluent release data (Tables 21 and 22) and details of waste treatment were suppliedby Waste Operations, Nuclear Technology Division.
11 REFERENCES
ANSTO Licence Conditions Handbook. Revision 1, Section 2.4: Airborne RadioactivityDischarge Authorisation for the Australian Nuclear Science and Technology Organisation,May 2001. Australian Radiation Protection And Nuclear Safety Agency.
Australian Nuclear Science and Technology Organisation and Sydney Water Corporation PtyLtd, Consent to Discharge Industrial Trade Wastewater, Risk Index 3, Agreement No. 4423,Property Number 3972483 (Ongoing agreement, renegotiated 1999 and 2001).
Australian Nuclear Science and Technology Organisation and Sydney Water Corporation PtyLtd, Consent to Discharge Industrial Trade Wastewater, Agreement No. 13966 (1994).
Clark, G.H., Bartsch, F.J.K., Muller, H.H., Stone, D.J.M. (1994) Atmospheric tracer tests andAssessment of a potential accident at the National Medical Cyclotron, Camperdown, N.S.W.,Australia. ANSTO/ E-710, Australian Nuclear Science & Technology Organisation.
Clark, G.H, Bartsch, F.J.K. (1994) General Aspects of the meteorology and wind flowpatterns at the National medical Cyclotron Site, Camperdown, N.S.W., Australia. ANSTO E--714, Australian Nuclear Science & Technology Organisation.
Clark, G.H. (June 1997) An Updated Analysis of the Lucas Heights Climatology 1975 to1996, ANSTO/E-731, Environment Division, Australian Nuclear Science & TechnologyOrganisation.
Clark, G.H., unpublished data, 2002, Environment Division, Australian Nuclear Science &Technology Organisation (ANSTO), personal communication, May 2002.
Cole-Clark, B. E. Estimates of Erosion on Potato Land on Krasnozems at Dorrigo NSWUsing the Caesium-137 Technique. Australian Journal of Soil Research, Vol. 31, pp 209-23,1993.
Commonwealth of Australia (1998), Australian Radiation Protection and Nuclear Safety Act1998, Commonwealth Government Printer, Canberra.
Cook, J. E., Dudaitis, A., Giles, M. S., (1969) Environmental survey at AAEC ResearchEstablishment, Lucas Heights. Results for 1965, 1966 and 1967.AAEC/E-151, Supplement No. 1.
Cox, D.R. Potter Point Outfall Modelling, 27 May 1997. Unisearch Ltd Water ResearchLaboratory, University of NSW. WRL Technical Report 97/17.
Gordon Gilmore, John Hemingway, 1995. Practical Gamma-Ray Spectrometry. John Wiley& Sons, West Sussex, England.
A N S T O E - 7 4 7
ENVIRONMENTAL and EFFLUENT MONITORING at ANSTO SITES, 2001
3 0
Hoffmann, E.L., Arthur, A., (1990). Environmental Survey at Lucas Heights ResearchLaboratories, 1989. ANSTO/E-694.
Hoffmann, E.L., Loosz, T., (1994). Environmental Survey at Lucas Heights ResearchLaboratories, 1991. ANSTO/E-708.
Hoffmann, E.L., Camilleri, A., Loosz, T., Farrar, Y., (1995). Environmental and EffluentMonitoring at Lucas Heights Research Laboratories, 1994. ANSTO/E-717.
Hoffmann, E.L., Loosz, T., Farrar, Y., (1996). Environmental and Effluent Monitoring atLucas Heights Science & Technology Centre, 1995. ANSTO/E-725.
Hoffmann, E.L., Loosz, T., Farrar, Y., (1998). Environmental and Effluent Monitoring atLucas Heights Science & Technology Centre, 1997. ANSTO/E-732.
Hoffmann, E.L., Loosz, T., Mokhber-Shahin, L., (2001). Environmental and EffluentMonitoring at ANSTO Sites, 2000. ANSTO/E-745.
International Atomic Energy Agency, (1996). International Basic Safety Standards forProtection against Ionising Radiation and for the Safety of Radiation Sources. Jointlysponsored by the FAO, IAEA, ILO, OECD/NEA, PAHO and WHO. Safety Series No 115,IAEA, Vienna.
International Organisation for Standardisation, (ISO). Water Quality - Determination oftritium activity concentration - Liquid scintillation counting method. ISO 9698:1989 (E).Geneva, Switzerland.
International Organisation for Standardisation, (ISO). Water Quality - Measurement of grossalpha activity in non-saline water - Thick source method. ISO 9696:1992 (E). Geneva,Switzerland.
International Organisation for Standardisation, (ISO). Water Quality - Measurement of grossbeta activity in non-saline water - Thick source method. ISO 9697:1992 (E). Geneva,Switzerland.
National Health and Medical Research Council (NH&MRC 1995). Recommendations forLimiting Exposure to Ionising Radiation and National Standard for Limiting OccupationalExposure to Ionising Radiation. Radiation Health Series No.39, June 1995. AustralianGovernment Publishing Service, Canberra, ACT.
National Health and Medical Research Council & Australian Water Resources Council(NH&MRC and AWRC), 1996. Australian Drinking Water Guidelines 1996. AustralianGovernment Publishing Service, Canberra, amended 2001.
Nigel Holmes and Associates (1991), Air Quality Assessment, Lucas Heights Regional Depot.Prepared for NSW Waste Services.
Protection of the Environment Operations Act 1997, No.156 as amended. GovernmentGazette, NSW Government Printery, Australia.
Radiation Control Regulation, 1993, under the Radiation Control Act, 1990. GovernmentGazette No.94, 27 August 1993. NSW Government Printery, Australia.
Sydney Water Corporation Pty Ltd. Sydney Water Trade Waste Policy & Management Plan,August 1995. Standards for Acceptance of Liquid Trade Wastes to Sewers.
United Nations Scientific Committee on the Effects of Atomic Radiation (UNSCEAR 1993).Sources and Effects of Ionising Radiation. Report to the General Assembly, with scientificannexes. United Nations, New York.

A N S T O E - 7 4 7
ENVIRONMENTAL and EFFLUENT MONITORING at ANSTO SITES, 2001
3 1
United Nations Scientific Committee on the Effects of Atomic Radiation (UNSCEAR 2000).Sources, Effects and Risks of Ionising Radiation. Report to the General Assembly, 2000,United Nations, New York.
Webb, D.V., Solomon, S.B., Thomson, J.E.M. Background Radiation Levels and MedicalExposure Levels in Australia. Radiation Protection in Australasia (1999), March 1999,volume 16, No.1.
World Health Organisation (WHO) 1993. Guidelines for Drinking-Water Quality. Volume 1:Recommendations, 2nd Edition, Geneva.
World Health Organisation (WHO) 1996. Guidelines for Drinking-Water Quality. Volume 2:Health Criteria And Other Supporting Information, 2nd Edition, Geneva.
12 BIBLIOGRAPHY
Aarkrog, A., et al., A Comparison of Doses from 137Cs and 210Po in Marine Food: A MajorInternational Study. Journal of Environmental Radioactivity, Vol. 34, No.1, pp. 69-90, 1997.Elsevier Science Ltd, Printed in Ireland.
Australian Nuclear Science and Technology Organisation (ANSTO), September 1989.Radioactive Airborne Effluent Working Party on a Revised Radioactive Effluent DischargeLimit for the Lucas Heights Research Laboratories. M.C.E. Petersen, G.H. Clark, G.M.Bailey, F.M. May. ANSTO/DR25.
Australian Nuclear Science and Technology Organisation. ANSTO Health and Safety andEnvironment Policy. ANSTO Policy Manual, APOL 2.2, Revision 2, 2000.
Australian Nuclear Science and Technology Organisation. ANSTO Quality Policy. ANSTOPolicy Manual, APOL 1.1, Revision 2, 1998.
ANSTO Safety and Reliability Report. Estimates of Doses from Routine Emissions ofRadionuclides to Atmosphere from HIFAR during the Financial Years 1996/97 and 1997/98.SD/SR/TN 98-7 Revision 1, August 1998.
Australian Radiation Laboratory (ARL), April 1990. A Nation-Wide Survey of Radon andGamma Radiation Levels in Australian Homes. M.K. Langroo, K.N. Wise, J.C. Duggleby,L.H. Kotler. ARL/TR090, ISSN 0157-1400.
Clean Waters Act 1972, Regulations as amended, Government Gazette, NSW GovernmentPrintery, Australia.
Commonwealth of Australia (1999), Australian Radiation Protection and Nuclear SafetyRegulations 1999, Commonwealth Government Printer, Canberra.
Elliott, G.L, Campbell, B.L, Loughran, R.J. Correlation of Erosion Measurements and SoilCaesium-137 Content. Appl. Radiat. Isotopes, Vol.41(8), pp 713-17, 1990. Int. J. Radiat.Appl. Instrum. Part A. Pergamon Press, Great Britain.
Fry, R.M.,1966. Reformulation of the Lucas Heights Liquid Effluent Discharge Authorisation.AAEC/E156. Australian Atomic Energy Commission.
Harries, J.R. and Calf, G.E. (1980). Tritium Measurements in the Tasman Sea and theSouthern Ocean. Australian Journal of Marine and Freshwater Research. Vol 31, No.6,pp737-45.
A N S T O E - 7 4 7
ENVIRONMENTAL and EFFLUENT MONITORING at ANSTO SITES, 2001
3 2
International Atomic Energy Agency (1996), Health and Environmental Aspects of NuclearFuel Cycle Facilities, IAEA-TECDOC-918, IAEA, Vienna.
International Atomic Energy Agency, 1985. Sediment Kds and Concentration Factors forRadionuclides in the Marine Environment, Technical Reports Series No.247, IAEA, Vienna.
International Atomic Energy Agency (IAEA), 1981. Shallow Ground Disposal of RadioactiveWastes - A Guidebook. Safety Series No. 53, Vienna.
International Commission on Radiological Protection (ICRP), 1975. Report of the Task Groupon Reference Man. ICRP Publication 23. Pergamon Press, Oxford.
International Commission on Radiological Protection (ICRP), 1990(a). Recommendations.ICRP Publication 60, Pergamon Press, Oxford.
Kathren, R.L., 1984. Radioactivity in the Environment - Sources, Distribution andSurveillance. pp 160-162. University of Washington Joint Centre for Graduate Study,Richland, Washington. Harwood Academic Publishers.
National Health and Medical Research Council (NH&MRC), 1989. Recommended RadiationProtection Standards for Individuals Exposed to Ionising Radiation. Radiation Health SeriesNo.27.
National Institute for Occupational Safety and Health (NIOSH), 1977. Manual of AirSampling Data, Sheet 9 (SDS). Washington, DC.
National Radiological Protection Board (NRPB), 1991. Committed Equivalent Organ Dosesand Committed Effective Doses from Intakes of Radionuclides. Part I, Chapter 4.3.3, Table4.1. Report NRPB-R245, Chilton, UK.
Nuclear Energy Agency and International Atomic Energy Agency (1999), EnvironmentalActivities in Uranium Mining and Milling. OECD, France.
NSW Dairy Corporation. List of registered dairies closest to the Lucas Heights site. Personalcommunication, N. Spooner, June 2000.
Radioactive Substances Regulations, 1959 under the Radioactive Substances Act, 1957.Regulations as amended. Government Gazette, NSW Government Printery, Australia.
Radiological and Environmental Sciences Laboratory (RESL), 1982. Analytical ChemistryBranch Procedures Manual.(Editors Bodnar, L.Z., Percival, D. R.) Analytical ChemistryBranch, US Department of Energy , Idaho. IDO/12096
Standards Association of Australia (SAA), 1990. Methods for Sampling and Analysis ofAmbient Air. Method 9.6: Determination of Total Suspended Particulates (TSP) - HighVolume Sampler Gravimetric Method. AS 3580.9.3-1990, Sydney.
Standards Association of Australia (SAA), 1990. Waters - Determination of Gross Alpha andGross Beta Activities. AS 3550.5-1990, Sydney.
Wilson, A.R.W., 1957. Radiation survey - Lucas Heights. AAEC/K116. Australian AtomicEnergy Commission.
Wilson, A.R.W., 1959. Safe Levels for the Discharge of Radioactive Effluent into theWoronora Estuary. AAEC/K260. Australian Atomic Energy Commission.
Worksafe Australia. Exposure Standards for Atmospheric Contaminants in the OccupationalEnvironment. Guidance note NOHSC: 3008 (1995). Australian Government Printery Service,Canberra.

A N S T O E - 7 4 7
ENVIRONMENTAL and EFFLUENT MONITORING at ANSTO SITES, 2001
3 3
Worksafe Australia, 1995. National Standard for Limiting Exposure to Ionising Radiation.Guidance note NOHSC:1013(1995). Australian Government Printery Service, Canberra.

A N S T O E - 7 4 7
ENVIRONMENTAL and EFFLUENT MONITORING at ANSTO SITES, 2001
34
TABLE 1
ENVIRONMENTAL MONITORING SCHEDULE, 2001
SAMPLE LOCATION (1) FREQUENCY COLLECTIONDETAILS
SAMPLEPREPARATION &ANALYSIS
Stormwater MDP+60m:60m down-streamof MDP BUND
Weekly, plusmonthlycomposite.
2 x 5 L sampledwith polyethylenebottle.
250mL aliquot of theweekly sample distilledfor tritium analysis.Weekly samples bulkedinto two monthlycomposites: 4 -5L for analysis; 8 - 10L for .Remainder acidified &stored.
Bund C: MDP Weekly, plusmonthlycomposite.
2 x 5 L sampledwith polyethylenebottle.
Tritium, & analysesas above.
Bunds A, B & C Daily samples(working daysonly) combinedinto a monthlycomposite.
1 L sampled withpolyethylene bottleinto 30 L drum.
Subsampled - 250 mLdistilled for tritiumanalysis. One L acidified& stored.
Estuarywater
Woronora River:station E5.9 atJannali Park
Monthly 250 mL, sampled bypolyethylene bottleat surface.
Distilled for tritiumanalysis.
Creekwater Bardens CreekWeir
Weekly 250 mL sampledfrom weir overflow.
Distilled for tritiumanalysis.
SPCC points:Bardens Ck Weir;MDP Ck Weir;Strassman Ck
Monthly 3 L sampled afterrain.
Gross analysis on 2L(ISO method). Remaining1 L acidified & stored.
Forbes Creek Monthly 1 L sampled afterrain.
250 mL distilled fortritium analysis.Remainder acidified &stored.
Bardens and MillCreeks: station T2near confluence
Yearly 5 L water from eachcreek (above thejunction of the twocreeks).
Evaporated and countedfor . 250 mLdistilled for tritiumanalysis. Remainderacidified & stored.
Notes:1. Sampling locations are shown on Figures 1 through 4.
Continued next page...

A N S T O E - 7 4 7
ENVIRONMENTAL and EFFLUENT MONITORING at ANSTO SITES, 2001
35
TABLE 1 Continued...
SAMPLE LOCATION (1) FREQUENCY COLLECTIONDETAILS
SAMPLEPREPARATION &ANALYSIS
Groundwater
Little ForestBurial Ground
Twice yearly Bores are pumpeddry & allowed torefill. 7 L sampledfrom the centre ofthe bore, avoidingbottom sediments.
Decanted, evaporatedand counted for .250 mL distilled fortritium analysis. 2 Llitres acidified &stored.
Sump near Bld 27 Monthly 1 L ground waterseepage collectedwith clean sponge.
Distilled for tritiumanalysis. Gammaspectrometry of 500mLin Marinelli beaker.Remainder acidified &stored.
Airborneparticulates
Little ForestBurial Ground:trench area
Quarterly:particulates areaccumulated for~ 4 hours every2 weeks over 3months.
Airborneparticulates werecollected on 400cm2
filter paper usingEcotech air samplerat 60 m3 per hour.
Quarterly sampledivided into four equalparts: one analysed forberyllium by ICPMS,another put aside for ayearly composite,analysed for 239/240Pu.Remaining two portionsare stored.
Ambientiodine-131in air
Stations 1, 2 ,3 &4: along the easternboundary ofLHSTC
Continuoussamples,changedweekly.
Collected onactivated charcoalfilters (Maypacks).
Gamma spectrometryof Maypacks using a20 x 10 cm NaI crystal.
Soil/sediment
Stormwater bundsA, B & C
Yearly, orwhenever bundsare emptied.
Bund water isdrained. 2 kgsampled randomlyfrom accumulatedsediments.
Soils/sediments aredried, ashed and sieved,then counted for activity.
Little ForestBurial Ground
If indicated byannual dose ratesurvey.
1 kg, sampled fromsurface.
As above.
Effluent dischargepipeline
If indicated bysix-monthly doserate survey.
1 kg, sampled fromsurface.
As above.
Bardens and MillCreeks: Station T2
Yearly 1 kg sampled fromeach creek bed(upstream of theirconfluence).
As above.
Notes:1. Sampling locations are shown on Figures 1 through 4.
Continued next page...

A N S T O E - 7 4 7
ENVIRONMENTAL and EFFLUENT MONITORING at ANSTO SITES, 2001
36
TABLE 1 Continued...
SAMPLE LOCATION (1) FREQUENCY COLLECTIONDETAILS
SAMPLEPREPARATION &ANALYSIS
MarineBiologicalSamples
Potter PointOcean Outfall
The RoyalNational Park
Twice yearly
Twice yearly
Barnacles, algae &fish, collected nearthe outfall.
Barnacles, algae &fish.
Gamma spectrometry ofdried and groundsamples.
As above
GammaDose RateSurvey
Effluent dischargepipeline
Twice yearly Pipe joints andground surveyedusing an EberlinePRM-7 doseratemeter. Soil issampled if >3 timesthe background dose.
If collected, soils aresieved and ashed, thencounted for activity.
Little ForestBurial Ground
Yearly Burial trenches weresurveyed at groundlevel with EberlinePRM-7 doseratemeter. Soil sampledif >3 times thebackground dose.
As above
ExternalGammaRadiation
LHSTC perimeter:15 sites; plusLocal suburbs:3 sites
Quarterly Two types ofThermoluminescentDosimeter (TLD)badges, exposed toambient gammaradiation.
Personal-type TLDs sentto ARL for analysis.Environmental TLDsanalysed at ANSTO.Results reported aseffective dose inmSv/year.
Notes1. Sampling locations are shown on Figures 1 through 4.
TABLE 2
TRITIUM IN WORONORA ESTUARY WATER (1)
STATION E5.9, 2001
Date Tritium (2)
(Bq/L)9-1-01 < 10 (3)
23-2-01 < 1021-3-01 < 1010-4-01 < 1016-5-01 < 10
5-6-01 < 103-7-01 < 10
28-8-01 < 1011-9-01 < 10
30-10-01 < 1020-11-01 < 10
4-12-01 < 10Notes:1. Refer to Figure 1 for the Woronora Estuary sampling point.2. The Australian guideline value for tritium in drinking water is
7600 Bq/L (NH&MRC, 1996).3. Values quoted as "less than" figures were below the stated minimum
detectable activity, calculated with 95 % confidence.
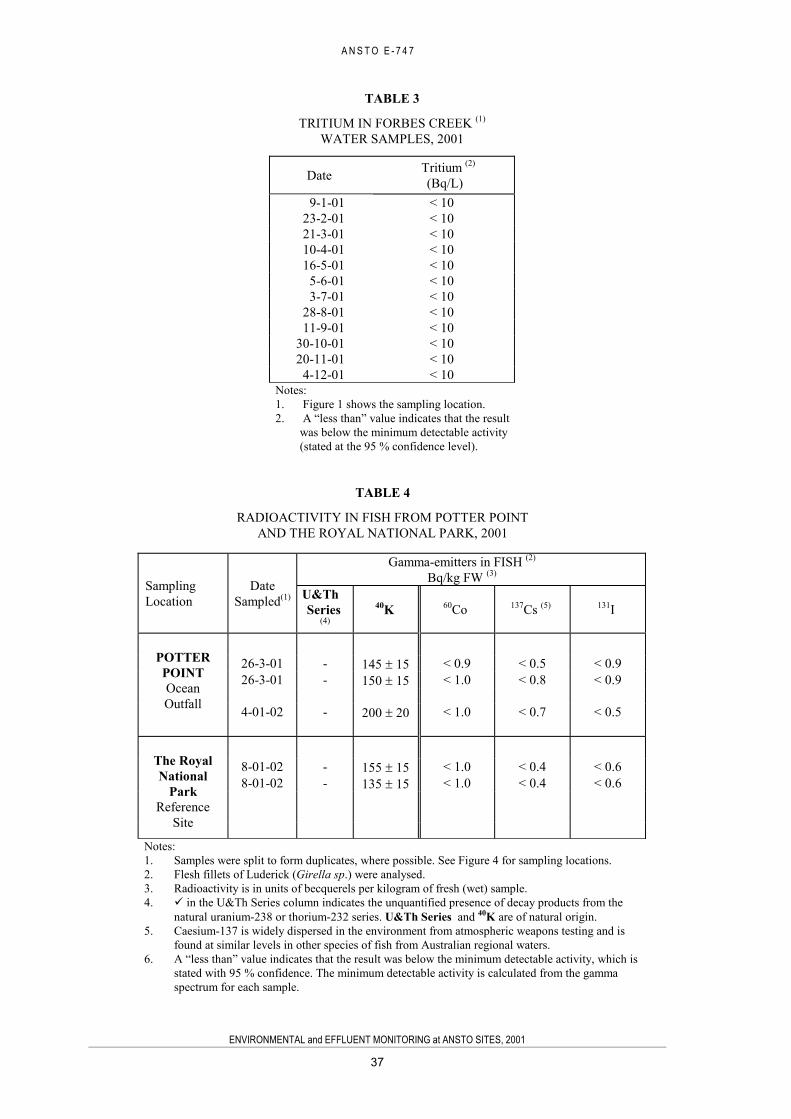
A N S T O E - 7 4 7
ENVIRONMENTAL and EFFLUENT MONITORING at ANSTO SITES, 2001
37
TABLE 3
TRITIUM IN FORBES CREEK (1)
WATER SAMPLES, 2001
Date Tritium (2)
(Bq/L)9-1-01 < 10
23-2-01 < 1021-3-01 < 1010-4-01 < 1016-5-01 < 10
5-6-01 < 103-7-01 < 10
28-8-01 < 1011-9-01 < 10
30-10-01 < 1020-11-01 < 10
4-12-01 < 10Notes:1. Figure 1 shows the sampling location.2. A “less than” value indicates that the result
was below the minimum detectable activity(stated at the 95 % confidence level).
TABLE 4
RADIOACTIVITY IN FISH FROM POTTER POINTAND THE ROYAL NATIONAL PARK, 2001
Gamma-emitters in FISH (2)
Bq/kg FW (3)
SamplingLocation
DateSampled(1) U&Th
Series(4)
40K 60Co 137Cs (5) 131I
26-3-01 - 145 15 < 0.9 < 0.5 < 0.926-3-01 - 150 15 < 1.0 < 0.8 < 0.9
POTTERPOINTOceanOutfall 4-01-02 - 200 20 < 1.0 < 0.7 < 0.5
8-01-02 - 155 15 < 1.0 < 0.4 < 0.68-01-02 - 135 15 < 1.0 < 0.4 < 0.6
The RoyalNational
ParkReference
Site
Notes:1. Samples were split to form duplicates, where possible. See Figure 4 for sampling locations.2. Flesh fillets of Luderick (Girella sp.) were analysed.3. Radioactivity is in units of becquerels per kilogram of fresh (wet) sample.4. in the U&Th Series column indicates the unquantified presence of decay products from the
natural uranium-238 or thorium-232 series. U&Th Series and 40K are of natural origin.5. Caesium-137 is widely dispersed in the environment from atmospheric weapons testing and is
found at similar levels in other species of fish from Australian regional waters.6. A “less than” value indicates that the result was below the minimum detectable activity, which is
stated with 95 % confidence. The minimum detectable activity is calculated from the gammaspectrum for each sample.
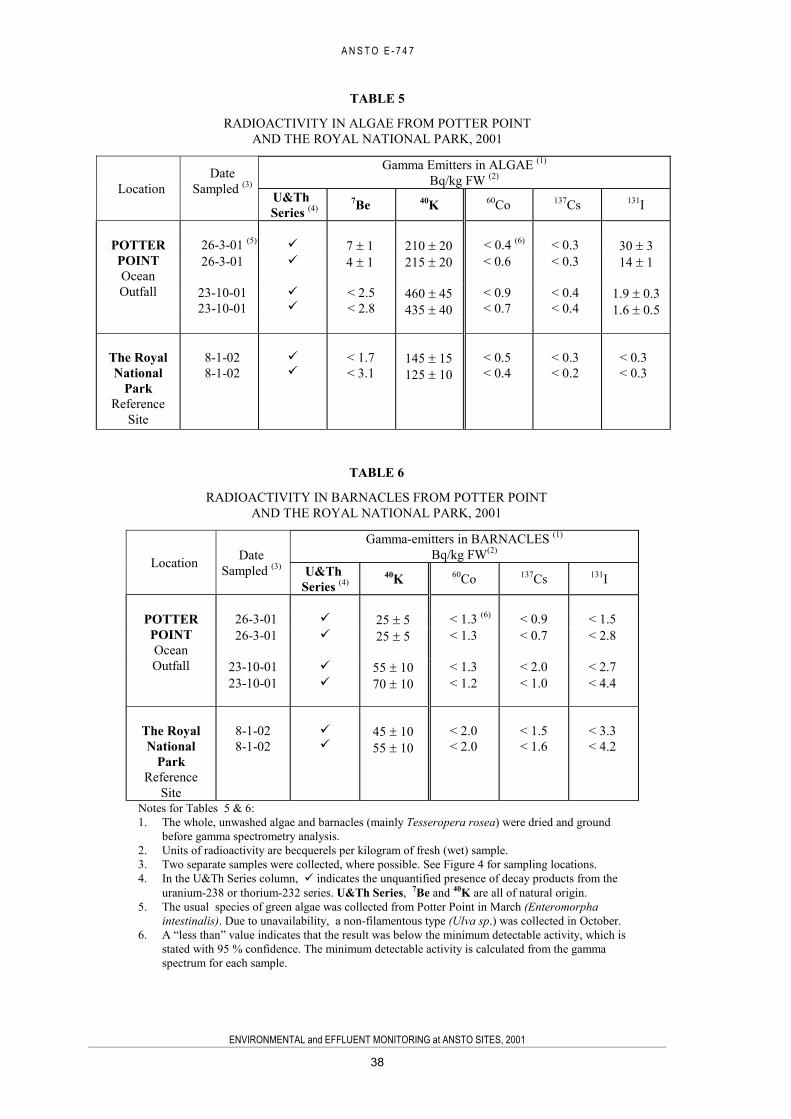
A N S T O E - 7 4 7
ENVIRONMENTAL and EFFLUENT MONITORING at ANSTO SITES, 2001
38
TABLE 5
RADIOACTIVITY IN ALGAE FROM POTTER POINTAND THE ROYAL NATIONAL PARK, 2001
Gamma Emitters in ALGAE (1)
Bq/kg FW (2)
LocationDate
Sampled (3)
U&Th Series (4)
7Be 40K 60Co 137Cs 131I
26-3-01 (5) 7 1 210 20 < 0.4 (6) < 0.3 30 326-3-01 4 1 215 20 < 0.6 < 0.3 14 1
23-10-0123-10-01
< 2.5< 2.8
460 45435 40
< 0.9< 0.7
< 0.4< 0.4
1.9 0.31.6 0.5
POTTERPOINTOceanOutfall
The RoyalNational
ParkReference
Site
8-1-028-1-02
< 1.7< 3.1
145 15125 10
< 0.5< 0.4
< 0.3< 0.2
< 0.3< 0.3
TABLE 6
RADIOACTIVITY IN BARNACLES FROM POTTER POINTAND THE ROYAL NATIONAL PARK, 2001
Gamma-emitters in BARNACLES (1)
Bq/kg FW(2)
Location DateSampled (3) U&Th
Series (4)40K 60Co 137Cs 131I
26-3-01 25 5 < 1.3 (6) < 0.9 < 1.526-3-01 25 5 < 1.3 < 0.7 < 2.8
23-10-01 55 10 < 1.3 < 2.0 < 2.7
POTTERPOINTOceanOutfall
23-10-01 70 10 < 1.2 < 1.0 < 4.4
The RoyalNational
ParkReference
Site
8-1-028-1-02
45 1055 10
< 2.0< 2.0
< 1.5< 1.6
< 3.3< 4.2
Notes for Tables 5 & 6:1. The whole, unwashed algae and barnacles (mainly Tesseropera rosea) were dried and ground
before gamma spectrometry analysis.2. Units of radioactivity are becquerels per kilogram of fresh (wet) sample.3. Two separate samples were collected, where possible. See Figure 4 for sampling locations.4. In the U&Th Series column, indicates the unquantified presence of decay products from the
uranium-238 or thorium-232 series. U&Th Series, 7Be and 40K are all of natural origin.5. The usual species of green algae was collected from Potter Point in March (Enteromorpha
intestinalis). Due to unavailability, a non-filamentous type (Ulva sp.) was collected in October.6. A “less than” value indicates that the result was below the minimum detectable activity, which is
stated with 95 % confidence. The minimum detectable activity is calculated from the gammaspectrum for each sample.
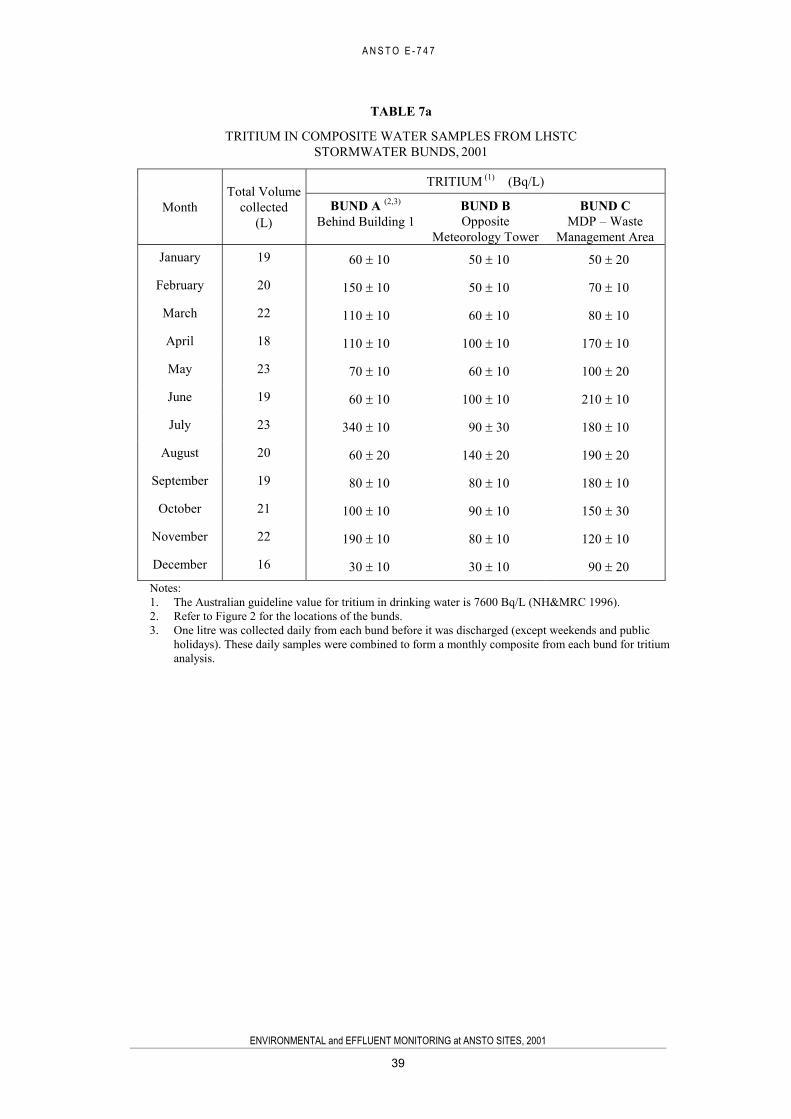
A N S T O E - 7 4 7
ENVIRONMENTAL and EFFLUENT MONITORING at ANSTO SITES, 2001
39
TABLE 7a
TRITIUM IN COMPOSITE WATER SAMPLES FROM LHSTCSTORMWATER BUNDS, 2001
TRITIUM (1) (Bq/L)
MonthTotal Volume
collected(L)
BUND A (2,3)
Behind Building 1BUND BOpposite
Meteorology Tower
BUND CMDP – Waste
Management AreaJanuary 19 60 10 50 10 50 20
February 20 150 10 50 10 70 10
March 22 110 10 60 10 80 10
April 18 110 10 100 10 170 10
May 23 70 10 60 10 100 20
June 19 60 10 100 10 210 10
July 23 340 10 90 30 180 10
August 20 60 20 140 20 190 20
September 19 80 10 80 10 180 10
October 21 100 10 90 10 150 30
November 22 190 10 80 10 120 10
December 16 30 10 30 10 90 20Notes:1. The Australian guideline value for tritium in drinking water is 7600 Bq/L (NH&MRC 1996).2. Refer to Figure 2 for the locations of the bunds.3. One litre was collected daily from each bund before it was discharged (except weekends and public
holidays). These daily samples were combined to form a monthly composite from each bund for tritiumanalysis.
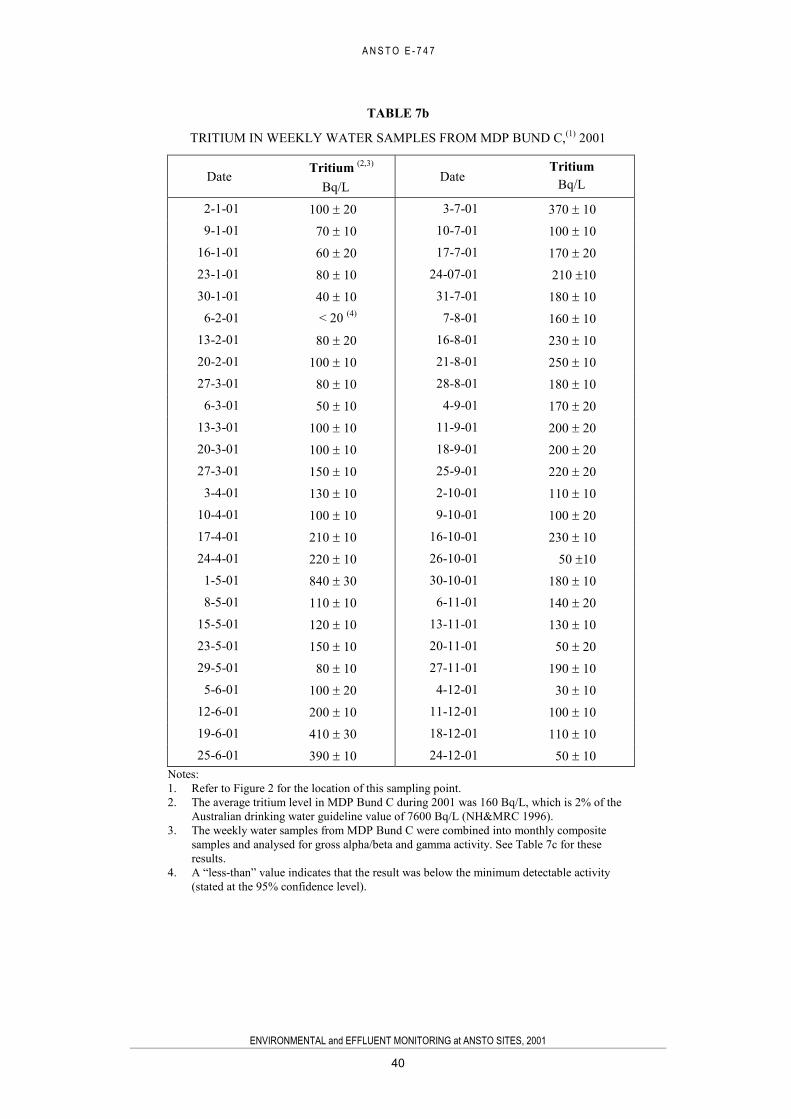
A N S T O E - 7 4 7
ENVIRONMENTAL and EFFLUENT MONITORING at ANSTO SITES, 2001
40
TABLE 7b
TRITIUM IN WEEKLY WATER SAMPLES FROM MDP BUND C,(1) 2001
Tritium (2,3) TritiumDate
Bq/LDate Bq/L
2-1-01 100 20 3-7-01 370 109-1-01 70 10 10-7-01 100 10
16-1-01 60 20 17-7-01 170 2023-1-01 80 10 24-07-01 210 1030-1-01 40 10 31-7-01 180 10
6-2-01 < 20 (4) 7-8-01 160 1013-2-01 80 20 16-8-01 230 1020-2-01 100 10 21-8-01 250 1027-3-01 80 10 28-8-01 180 10
6-3-01 50 10 4-9-01 170 2013-3-01 100 10 11-9-01 200 2020-3-01 100 10 18-9-01 200 2027-3-01 150 10 25-9-01 220 20
3-4-01 130 10 2-10-01 110 1010-4-01 100 10 9-10-01 100 2017-4-01 210 10 16-10-01 230 1024-4-01 220 10 26-10-01 50 10
1-5-01 840 30 30-10-01 180 108-5-01 110 10 6-11-01 140 20
15-5-01 120 10 13-11-01 130 1023-5-01 150 10 20-11-01 50 2029-5-01 80 10 27-11-01 190 10
5-6-01 100 20 4-12-01 30 1012-6-01 200 10 11-12-01 100 1019-6-01 410 30 18-12-01 110 1025-6-01 390 10 24-12-01 50 10
Notes:1. Refer to Figure 2 for the location of this sampling point.2. The average tritium level in MDP Bund C during 2001 was 160 Bq/L, which is 2% of the
Australian drinking water guideline value of 7600 Bq/L (NH&MRC 1996).3. The weekly water samples from MDP Bund C were combined into monthly composite
samples and analysed for gross alpha/beta and gamma activity. See Table 7c for theseresults.
4. A “less-than” value indicates that the result was below the minimum detectable activity(stated at the 95% confidence level).

A N S T O E - 7 4 7
ENVIRONMENTAL and EFFLUENT MONITORING at ANSTO SITES, 2001
41
TABLE 7c
RADIOACTIVITY IN COMPOSITEWATER SAMPLES FROM MDP BUND C, 2001
RADIOACTIVITY (Bq/L )
Gamma EmittersMonthlyComposite(1)
Gross (2) Gross (3)7Be (4) 40K 137Cs (5) 60Co
January 0.02 0.01 0.72 0.02 0.26 0.04 0.11 0.03 0.075 0.008 0.031 0.006
February 0.02 0.01 0.52 0.01 0.19 0.03 < 0.15 (6) 0.007 0.003 LLD
March 0.02 0.01 0.43 0.01 0.07 0.03 0.08 0.04 0.007 0.003 LLD
April 0.04 0.01 0.53 0.02 0.13 0.03 0.12 0.05 0.040 0.005 LLD
May 0.04 0.01 1.02 0.02 LLD (7) < 0.22 0.030 0.004 LLD
June 0.03 0.01 0.47 0.01 LLD 0.11 0.05 0.007 0.003 LLD
July 0.02 0.01 0.40 0.01 LLD < 0.09 LLD LLD
August 0.03 0.01 0.40 0.01 LLD < 0.19 LLD LLD
September 0.02 0.01 0.47 0.01 LLD < 0.25 0.012 0.003 LLD
October 0.02 0.01 0.80 0.02 LLD < 0.20 0.021 0.003 LLD
November 0.02 0.01 0.96 0.02 0.31 0.05 0.11 0.05 0.041 0.005 LLD
December 0.04 0.01 0.74 0.02 0.22 0.05 0.15 0.05 0.185 0.018 LLDNotes:
1. Refer to Figure 2 for the sampling location. MDP Bund C was sampled weekly for tritium analysis (see Table7b). The remainder of the weekly samples were combined to make a monthly composite water sample for grossalpha, beta and gamma analysis.
2. The NSW Regulations (Prot. Env. Op. Act, 1997) limits for radioactivity in class C waters as follows:3. Gross alpha ( ) 1.1 Bq/L; Gross beta ( ) 11.1 Bq/L.4. The gross beta results include the contribution from potassium-40 (a natural beta-gamma emitter).5. 7Be and 40K are of natural origin.6. In 2001, the average concentration of 137Cs in MDP Bund Composites was < 0.035 Bq/L, which is < 0.4 % of
the Australian guideline value for 137Cs in drinking water: 10.5 Bq/L (NH&MRC, 1996).7. A less-than value indicates that a small peak was evident in the sample spectrum but the result was not
statistically significant (that is, was not above the background). The minimum detectable activity is thereforeknown precisely and is quoted at the 95 % confidence level.
8. LLD indicates that no gamma peak was seen in the sample spectrum so that the result is definitely less than thelimit of detection but, in this case, the minimum detectable activity is not known precisely and an approximatedetection limit is appropriate. Indicative limits of detection are: 60Co < 0.01; 7Be < 0.10 ; 137Cs < 0.01, all inBq/L.

A N S T O E - 7 4 7
ENVIRONMENTAL and EFFLUENT MONITORING at ANSTO SITES, 2001
42
TABLE 8
RADIOACTIVITY IN SEDIMENT FROM STORMWATER BUNDS, 2001
RADIOACTIVITY in SEDIMENT, Bq/g DW(2)Location (1) Date
Gross Gross Gamma Emitters
BUND A:Behind Building 1
27-4-01 0.32 0.07 0.23 0.02
U & Th series7Be = 0.14 0.014
137 Cs = 0.0032 0.000640K = 0.22 0.02
BUND B:Opposite
MeteorologicalTower
27-4-01 0.25 0.07 0.28 0.02
U & Th series7 Be = 0.34 0.03
137Cs = 0.0029 0.000660Co = 0.018 0.002
40K = 0.20 0.02
BUND C:MDP
(on StormwaterOutlet No.1)
27-4-01 0.31 0.07 0.31 0.02
U & Th series7 Be = 0.069 0.008
137Cs = 0.036 0.00360Co = 0.022 0.002
241Am = 0.0017 0.000440K = 0.094 0.012
Notes:1.See Figure 2 for the location of the stormwater bunds.2.Refers to the radioactivity per gram (dry weight) of sample.

A N S T O E - 7 4 7
ENVIRONMENTAL and EFFLUENT MONITORING at ANSTO SITES, 2001
43
TABLE 9a
TRITIUM IN WEEKLY WATER SAMPLES FROMMDP + 60m,(1) 2001
Tritium (2,3) TritiumDate Bq/L Date Bq/L
2-1-01 80 20 3 -7-01 200 109-1-01 70 10 10-7-01 470 20
16-1-01 80 10 17-7-01 170 1023-1-01 70 10 24-07-01 140 1030-1-01 70 10 31-7-01 160 10
6-2-01 < 20 (4) 7-8-01 170 1013-2-01 70 10 16-8-01 180 1020-2-01 70 10 21-8-01 180 1027-2-01 90 10 28-8-01 160 10
6-3-01 40 10 4-9-01 160 1013-3-01 90 10 11-9-01 110 1020-3-01 90 10 18-9-01 120 1027-3-01 90 10 25-9-01 100 10
3-4-01 100 10 2-10-01 80 1010-4-01 90 10 9-10-01 100 2017-4-01 110 10 16-10-01 70 1024-4-01 210 10 26-10-01 90 10
1-5-01 110 10 30-10-01 100 208-5-01 50 10 6-11-01 80 10
15-5-01 100 10 13-11-01 80 1023-5-01 80 10 20-11-01 50 2029-5-01 70 10 27-11-01 110 10
5-6-01 90 20 4-12-01 70 1012-6-01 180 10 11-12-01 50 1019-6-01 270 10 18-12-01 70 1025-6-01 140 10 24-12-01 50 10
Notes:1. Refer to Figure 2 for the location of this sampling point, 60m downstream of
Stormwater Outlet No. 1 on MDP Creek.2. The average tritium level during 2001 was about 110 Bq/L, representing < 2 % of
the Australian drinking water guideline value of 7600 Bq/L (NH&MRC 1996).3. The weekly water samples were combined to make monthly composite samples,
then analysed for gross alpha/beta and gamma activity. See Table 9b for theseresults.
4. A “less-than” value indicates that the result was below the minimum detectableactivity (stated at the 95% confidence level).
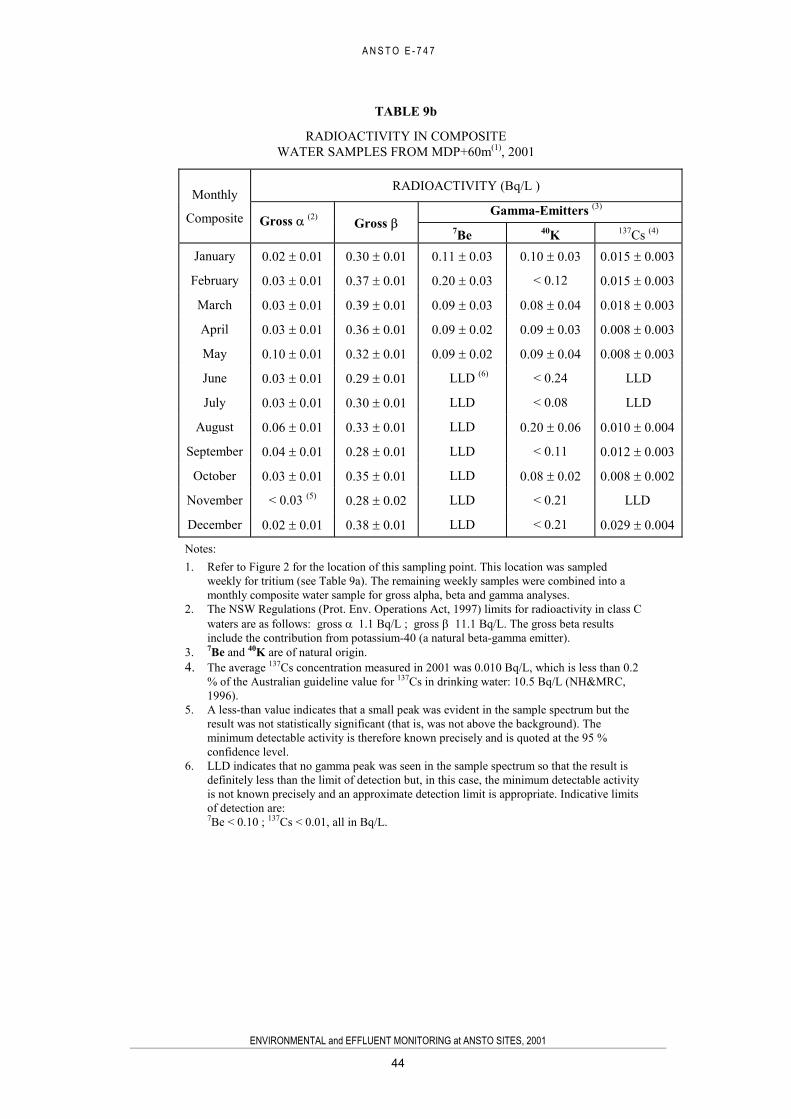
A N S T O E - 7 4 7
ENVIRONMENTAL and EFFLUENT MONITORING at ANSTO SITES, 2001
44
TABLE 9b
RADIOACTIVITY IN COMPOSITEWATER SAMPLES FROM MDP+60m(1), 2001
RADIOACTIVITY (Bq/L )
Gamma-Emitters (3)Monthly
Composite Gross (2) Gross 7Be 40K 137Cs (4)
January 0.02 0.01 0.30 0.01 0.11 0.03 0.10 0.03 0.015 0.003
February 0.03 0.01 0.37 0.01 0.20 0.03 < 0.12 0.015 0.003
March 0.03 0.01 0.39 0.01 0.09 0.03 0.08 0.04 0.018 0.003
April 0.03 0.01 0.36 0.01 0.09 0.02 0.09 0.03 0.008 0.003
May 0.10 0.01 0.32 0.01 0.09 0.02 0.09 0.04 0.008 0.003
June 0.03 0.01 0.29 0.01 LLD (6) < 0.24 LLD
July 0.03 0.01 0.30 0.01 LLD < 0.08 LLD
August 0.06 0.01 0.33 0.01 LLD 0.20 0.06 0.010 0.004
September 0.04 0.01 0.28 0.01 LLD < 0.11 0.012 0.003
October 0.03 0.01 0.35 0.01 LLD 0.08 0.02 0.008 0.002
November < 0.03 (5) 0.28 0.02 LLD < 0.21 LLD
December 0.02 0.01 0.38 0.01 LLD < 0.21 0.029 0.004
Notes:1. Refer to Figure 2 for the location of this sampling point. This location was sampled
weekly for tritium (see Table 9a). The remaining weekly samples were combined into amonthly composite water sample for gross alpha, beta and gamma analyses.
2. The NSW Regulations (Prot. Env. Operations Act, 1997) limits for radioactivity in class Cwaters are as follows: gross 1.1 Bq/L ; gross 11.1 Bq/L. The gross beta resultsinclude the contribution from potassium-40 (a natural beta-gamma emitter).
3. 7Be and 40K are of natural origin.4. The average 137Cs concentration measured in 2001 was 0.010 Bq/L, which is less than 0.2
% of the Australian guideline value for 137Cs in drinking water: 10.5 Bq/L (NH&MRC,1996).
5. A less-than value indicates that a small peak was evident in the sample spectrum but theresult was not statistically significant (that is, was not above the background). Theminimum detectable activity is therefore known precisely and is quoted at the 95 %confidence level.
6. LLD indicates that no gamma peak was seen in the sample spectrum so that the result isdefinitely less than the limit of detection but, in this case, the minimum detectable activityis not known precisely and an approximate detection limit is appropriate. Indicative limitsof detection are:7Be < 0.10 ; 137Cs < 0.01, all in Bq/L.

A N S T O E - 7 4 7
ENVIRONMENTAL and EFFLUENT MONITORING at ANSTO SITES, 2001
45
TABLE 10
RADIOACTIVITY IN WATER FROM SPCC (1) SAMPLING POINTS, 2001
RADIOACTIVITY (2) (Bq/L)
Strassman Creek Bardens Creek Weir MDP Creek WeirDate
Gross Gross Gross Gross Gross Gross
1-2-01 < 0.02 (3) 0.07 0.01 < 0.02 0.09 0.01 0.03 0.01 0.29 0.01
27-2-01 < 0.02 0.05 0.01 < 0.02 0.07 0.01 < 0.02 0.28 0.01
22-3-01 < 0.02 0.05 0.01 < 0.03 0.06 0.01 < 0.03 0.28 0.01
27-4-01 < 0.02 0.04 0.01 < 0.02 0.05 0.01 < 0.03 0.27 0.01
18-5-01 < 0.02 0.06 0.01 < 0.02 0.06 0.01 < 0.01 0.25 0.01
22-6-01 < 0.02 0.05 0.01 0.02 0.01 0.04 0.01 < 0.02 0.26 0.01
30-7-01 < 0.02 0.05 0.01 < 0.02 0.04 0.01 < 0.01 0.22 0.01
28-8-01 0.02 0.01 0.04 0.01 < 0.02 0.05 0.01 < 0.02 0.20 0.01
25-9-01 < 0.02 0.04 0.01 < 0.02 0.06 0.01 0.02 0.01 0.23 0.01
22-10-01 < 0.02 0.04 0.01 < 0.02 0.04 0.01 < 0.02 0.22 0.01
30-11-01 < 0.02 0.05 0.01 < 0.02 0.05 0.01 < 0.01 0.24 0.01
19-12-01 0.02 0.01 0.08 0.01 < 0.02 0.06 0.01 < 0.02 0.27 0.01
Notes:1. See Figure 2 for the location of the former SPCC (now NSW EPA) sampling points.2. The NSW Regulations (Prot. Env. Operations Act 1997) specify limits for radioactivity in class C waters as
follows: gross alpha < 1.1 Bq/L ; gross beta < 11.1 Bq/L. All gross beta results include the contribution fromthe naturally-occurring beta-gamma emitter, potassium-40.
3. Values which are quoted as "less than" figures were below the stated minimum detectable activity (calculatedwith 95 % confidence).

A N S T O E - 7 4 7
ENVIRONMENTAL and EFFLUENT MONITORING at ANSTO SITES, 2001
46
TABLE 11
TRITIUM IN WATER FROM BARDENS CREEK WEIR (1)
(at SPCC sampling point), 2001
Date Tritium (2)
Bq/L Date TritiumBq/L
2-1-01 50 10 3-7-01 30 10
9-1-01 50 10 10-7-01 170 10
16-1-01 40 10 17-7-01 80 10
23-1-01 60 10 24-07-01 30 10
30-1-01 40 10 31-7-01 170 20
6-2-01 < 30 (3) 7-8-01 40 10
13-2-01 60 10 16-8-01 60 20
20-2-01 50 10 21-8-01 50 10
27-2-01 100 10 28-8-01 70 10
6-3-01 30 10 4-9-01 30 10
13-3-01 40 10 11-9-01 40 10
20-3-01 30 10 18-9-01 30 10
27-3-01 50 10 25-9-01 40 10
3-4-01 60 10 2-10-01 30 10
10-4-01 50 10 9-10-01 50 10
17-4-01 40 10 16-10-01 40 10
24-4-01 50 20 26-10-01 40 10
1-5-01 80 10 30-10-01 30 10
8-5-01 30 10 6-11-01 30 10
15-5-01 30 10 13-11-01 70 10
23-5-01 40 10 20-11-01 140 20
29-5-01 50 10 27-11-01 90 10
5-6-01 40 10 4-12-01 40 10
12-6-01 70 10 11-12-01 40 10
19-6-01 30 10 18-12-01 30 10
25-6-01 40 10 24-12-01 60 10
Notes:1. See Figure 2 for the location of this sampling point.2. The average weekly tritium concentration at Bardens Creek weir during 2001 was 50
Bq/L, which less than 1% of the Australian drinking water guidelines value of7600Bq/L (NH&MRC, 1996).
3. Values which are quoted as "less than" figures were below the stated minimumdetectable activity (calculated with 95 % confidence).

A N S T O E - 7 4 7
ENVIRONMENTAL and EFFLUENT MONITORING at ANSTO SITES, 2001
47
TABLE 12a
GAMMA DOSE-RATE SURVEY OF EFFLUENT DISCHARGE PIPELINE, 2001
Dose-rate ( Sv/hour) BackgroundDose-rateDate Location (1,2)
Ground BelowJoint
Pipe Joint ( Sv/hour)
28-5-01 Joints #1-22 0.06 – 0.11 0.06 – 0.12 0.06 – 0.12
16-10-01 Joints #1-22 0.06 – 0.13 0.06 – 0.12 0.06 – 0.12
Notes:1. Survey of exposed portions of pipeline between LHSTC and the Sydney Water sewer connection,
using a calibrated Eberline PRM-7 gamma dose-rate meter.2. The survey excluded joints numbered 18 & 19 which are inaccessible.
TABLE 12b
RADIOACTIVITY IN SOIL NEAR THE ANSTO EFFLUENT PIPELINE, 2001
RADIOACTIVITY, Bq/g DW (2)
Gamma EmittersLocation (1) DateGross Gross
Am-241 Tc-99m Cs-137 Co-60 K-40
Soil underpipe joint # 6 1-8-01 0.57 0.07 0.53 0.02 0.017 0.002 0.27 0.081 0.26 0.026 0.12 0.012 0.074 0.010
1m downhillof joint #6 1-8-01 0.57 0.07 0.30 0.02 0.004 0.001 < 0.001 0.095 0.010 0.010 0.001 0.082 0.012
Comparison:7m upslopeof joint #6 3-8-01 0.43 0.07 0.26 0.02 < 0.002 < 0.001 0.008 0.001 < 0.002 0.069 0.008
Notes:1. See Figure 2 for the approximate location of the effluent pipeline. These soil samples were collected in response
to a small leak from the liquid effluent disposal pipeline. See Section 3.6 for discussion.2. Soils were ashed prior to gamma spectrometry. Results are reported in terms of radioactivity per gram of dry sample.
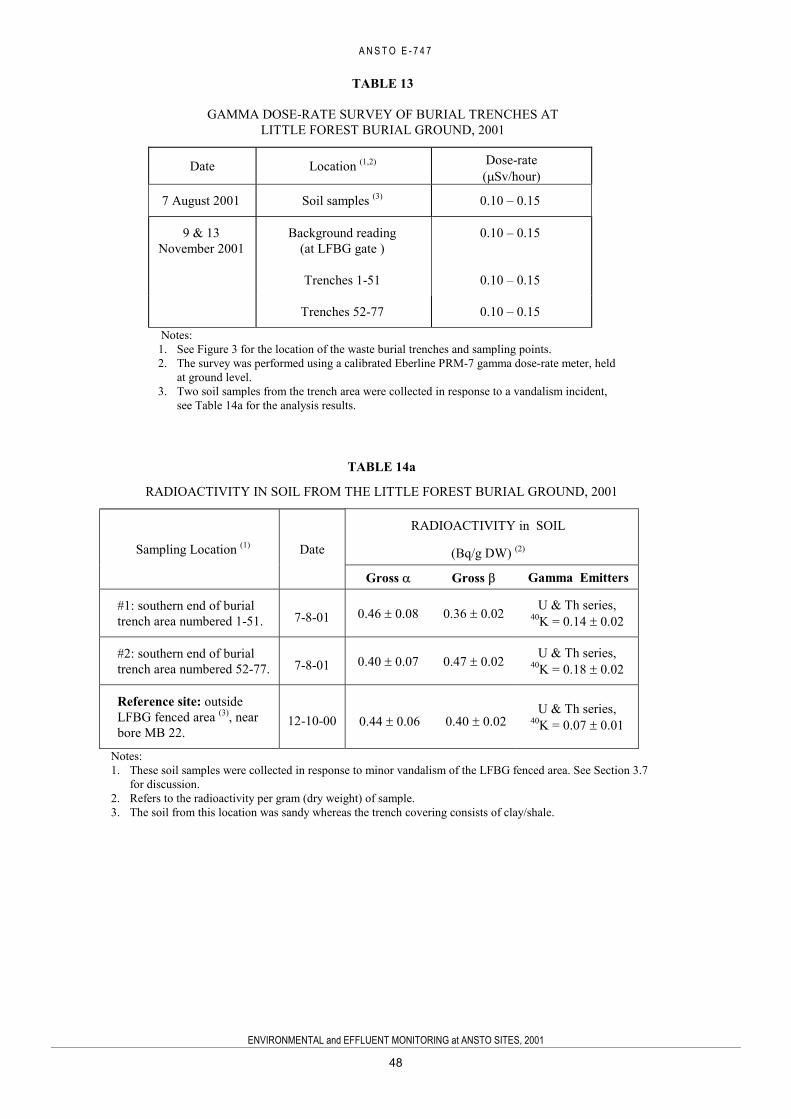
A N S T O E - 7 4 7
ENVIRONMENTAL and EFFLUENT MONITORING at ANSTO SITES, 2001
48
TABLE 13
GAMMA DOSE-RATE SURVEY OF BURIAL TRENCHES ATLITTLE FOREST BURIAL GROUND, 2001
Date Location (1,2) Dose-rate( Sv/hour)
7 August 2001 Soil samples (3) 0.10 – 0.15
9 & 13November 2001
Background reading(at LFBG gate )
0.10 – 0.15
Trenches 1-51 0.10 – 0.15
Trenches 52-77 0.10 – 0.15
Notes:1. See Figure 3 for the location of the waste burial trenches and sampling points.2. The survey was performed using a calibrated Eberline PRM-7 gamma dose-rate meter, held
at ground level.3. Two soil samples from the trench area were collected in response to a vandalism incident,
see Table 14a for the analysis results.
TABLE 14a
RADIOACTIVITY IN SOIL FROM THE LITTLE FOREST BURIAL GROUND, 2001
RADIOACTIVITY in SOIL
(Bq/g DW) (2)Sampling Location (1) Date
Gross Gross Gamma Emitters
#1: southern end of burialtrench area numbered 1-51. 7-8-01 0.46 0.08 0.36 0.02 U & Th series,
40K = 0.14 0.02
#2: southern end of burialtrench area numbered 52-77. 7-8-01 0.40 0.07 0.47 0.02 U & Th series,
40K = 0.18 0.02
Reference site: outsideLFBG fenced area (3), nearbore MB 22.
12-10-00 0.44 0.06 0.40 0.02U & Th series,
40K = 0.07 0.01
Notes:1. These soil samples were collected in response to minor vandalism of the LFBG fenced area. See Section 3.7
for discussion.2. Refers to the radioactivity per gram (dry weight) of sample.3. The soil from this location was sandy whereas the trench covering consists of clay/shale.

A N S T O E - 7 4 7
ENVIRONMENTAL and EFFLUENT MONITORING at ANSTO SITES, 2001
49
TABLE 14b
RADIOACTIVITY IN GROUNDWATER FROM THE LITTLE FOREST BURIAL GROUND, 2001
RADIOACTIVITY (2,3) Bq /LGamma Emitters Bore (1) Date
Sampled 3H Gross Gross 40K Others
BHF 8-6-01 340 10 0.03 0.01 0.15 0.01 0.25 0.10 Trace U-238 series
BH10 “ 150 20 < 0.03 0.06 0.01 0.22 0.11 Trace U-238 series
OS2 “ 800 20 0.03 0.01 0.11 0.01 < 0.30 Trace U-238 series
OS3 “ 660 30 0.03 0.01 0.25 0.01 < 0.30 Trace U-238 series
MB11 “ < 10 0.04 0.01 0.04 0.01 < 0.56 Trace U-238 series
MB12 “ < 20 < 0.02 0.04 0.01 < 0.30 Trace U-238 series
MB13 “ 1080 30 < 0.02 0.07 0.01 < 0.30 Trace U-238 series
MB14 “ < 10 0.03 0.01 0.13 0.01 < 0.28 Trace U-238 series
MB15 “ < 10 0.06 0.01 0.12 0.01 < 0.30 Trace U-238 series
MB16 (4) “ 2280 30 0.06 0.01 0.34 0.01 < 0.30 60Co 0.10 0.02
MB17 “ 600 20 < 0.02 0.06 0.01 < 0.30 Trace U-238 series
MB18 “ < 10 0.04 0.01 0.09 0.01 < 0.52 Trace U-238 series
MB19 (5) “ < 30 < 0.03 0.20 0.01 0.26 0.11 N.D.
MB20 “ < 10 0.03 0.01 0.21 0.01 < 0.30 N.D.
MB21 “ < 10 0.04 0.01 0.14 0.01 < 0.59 Trace U-238 series
BHF 9-11-01 290 20 0.04 0.01 0.16 0.01 < 0.56 N.D
BH10 “ 5690 50 0.09 0.04 0.15 0.04 < 0.49 Trace U-238 series
OS2 13-11-01 900 30 0.03 0.01 0.12 0.01 < 0.57 N.D
OS3 9-11-01 1520 30 0.07 0.01 0.54 0.02 < 0.31 N.D
MB11 “ 30 10 0.04 0.01 0.11 0.01 < 0.31 N.D
MB12 13-11-01 < 30 0.03 0.01 0.10 0.01 < 0.63 N.D
MB13 9-11-01 1750 30 0.03 0.01 0.12 0.01 < 0.31 N.D
MB14 “ 30 10 0.06 0.01 0.18 0.02 < 0.31 N.D
MB15 “ 30 10 0.03 0.01 0.08 0.01 < 0.34 N.D
MB16 “ 3570 60 0.10 0.01 0.49 0.01 < 0.29 60Co 0.18 0.03
MB17 “ 570 10 0.02 0.01 0.05 0.01 < 0.30 N.D
MB18 “ 60 10 < 0.02 0.07 0.01 < 0.47 N.D
MB19 23-11-01 100 20 0.16 0.05 0.53 0.06 < 0.31 N.D
MB20 23-11-01 < 20 0.03 0.01 0.30 0.02 < 0.49 N.D
MB21 “ 40 10 0.04 0.01 0.19 0.02 < 0.35 N.DNotes:1. See Figure 3 for the location of the groundwater monitoring bores at the Little Forest Burial Ground.2. The Australian Drinking Water Guidelines (NH&MRC, 1996) recommend screening levels for gross alpha and gross beta
activity of < 0.5 Bq/L (excluding potassium-40 beta activity). The gross beta results above include the contribution from naturalpotassium-40. The Australian guideline value for tritium in drinking water is 7600 Bq/L (NH&MRC 1996).
3. A “less than” value indicates that the result was below the minimum detectable activity (stated at the 95% confidence level).“N.D.” indicates that no other statistically significant radioactivity was detected.
4. The maximum 60Co level in MB16 was < 1 % of the Australian drinking water guideline value of 20 Bq/L (NH&MRC 1996).5. Shading indicated those bores that are outside the fenced area of the LFBG.
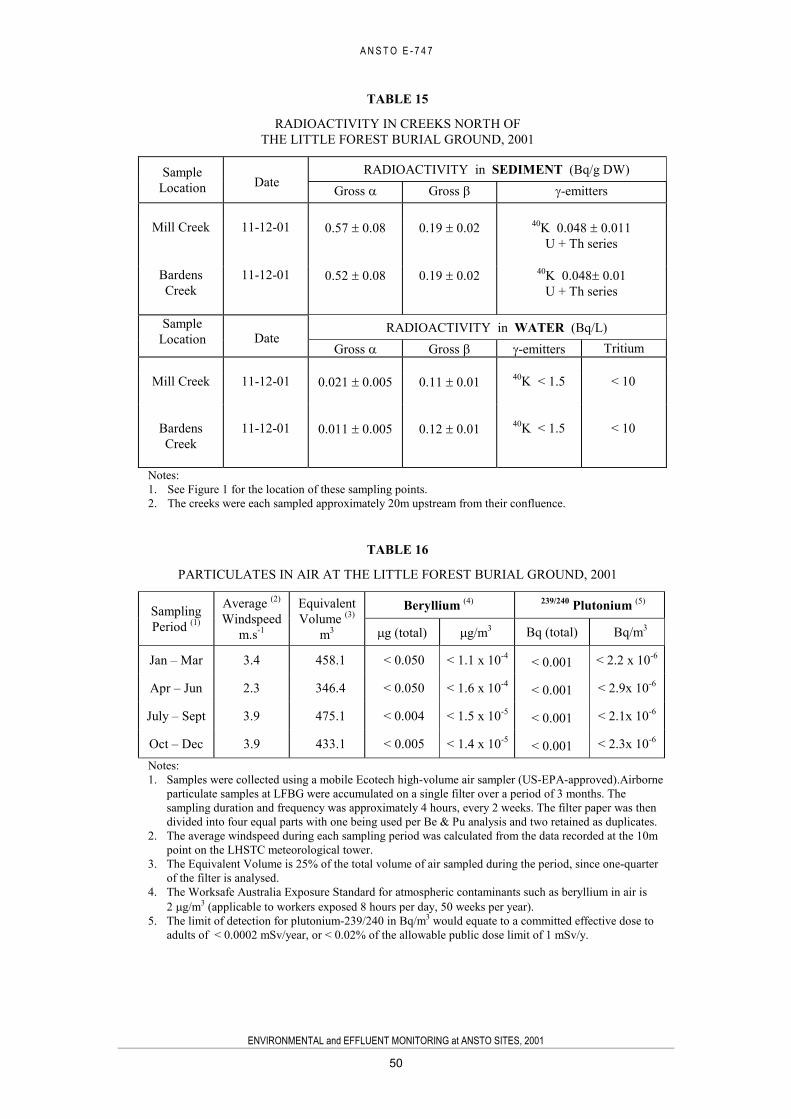
A N S T O E - 7 4 7
ENVIRONMENTAL and EFFLUENT MONITORING at ANSTO SITES, 2001
50
TABLE 15
RADIOACTIVITY IN CREEKS NORTH OFTHE LITTLE FOREST BURIAL GROUND, 2001
RADIOACTIVITY in SEDIMENT (Bq/g DW)SampleLocation Date
Gross Gross -emitters
Mill Creek 11-12-01 0.57 0.08 0.19 0.02 40K 0.048 0.011U + Th series
BardensCreek
11-12-01 0.52 0.08 0.19 0.02 40K 0.048 0.01U + Th series
RADIOACTIVITY in WATER (Bq/L)SampleLocation Date
Gross Gross -emitters Tritium
Mill Creek 11-12-01 0.021 0.005 0.11 0.01 40K < 1.5 < 10
BardensCreek
11-12-01 0.011 0.005 0.12 0.01 40K < 1.5 < 10
Notes:1. See Figure 1 for the location of these sampling points.2. The creeks were each sampled approximately 20m upstream from their confluence.
TABLE 16
PARTICULATES IN AIR AT THE LITTLE FOREST BURIAL GROUND, 2001
Beryllium (4) 239/240 Plutonium (5)SamplingPeriod (1)
Average (2)
Windspeedm.s-1
EquivalentVolume (3)
m3 g (total) g/m3 Bq (total) Bq/m3
Jan – Mar 3.4 458.1 < 0.050 < 1.1 x 10⁻⁴ < 0.001 < 2.2 x 10⁻⁶
Apr – Jun 2.3 346.4 < 0.050 < 1.6 x 10⁻⁴ < 0.001 < 2.9x 10⁻⁶
July – Sept 3.9 475.1 < 0.004 < 1.5 x 10⁻⁵ < 0.001 < 2.1x 10⁻⁶
Oct – Dec 3.9 433.1 < 0.005 < 1.4 x 10⁻⁵ < 0.001 < 2.3x 10⁻⁶
Notes:1. Samples were collected using a mobile Ecotech high-volume air sampler (US-EPA-approved).Airborne
particulate samples at LFBG were accumulated on a single filter over a period of 3 months. Thesampling duration and frequency was approximately 4 hours, every 2 weeks. The filter paper was thendivided into four equal parts with one being used per Be & Pu analysis and two retained as duplicates.
2. The average windspeed during each sampling period was calculated from the data recorded at the 10mpoint on the LHSTC meteorological tower.
3. The Equivalent Volume is 25% of the total volume of air sampled during the period, since one-quarterof the filter is analysed.
4. The Worksafe Australia Exposure Standard for atmospheric contaminants such as beryllium in air is2 g/m3 (applicable to workers exposed 8 hours per day, 50 weeks per year).
5. The limit of detection for plutonium-239/240 in Bq/m3 would equate to a committed effective dose toadults of < 0.0002 mSv/year, or < 0.02% of the allowable public dose limit of 1 mSv/y.

A N S T O E - 7 4 7
ENVIRONMENTAL and EFFLUENT MONITORING at ANSTO SITES, 2001
51
TABLE 17
AMBIENT IODINE-131 IN AIR AT LHSTC, 2001
Sampled during theweek ending:
Iodine-131(1,2)
Air ConcentrationBq / m3
Sampled during theweek ending:
Iodine-131 Air Concentration
Bq / m3
2-1-01 < 0.0025 3-7-01 < 0.002510-1-01 < 0.0025 12-7-01 < 0.002516-1-01 < 0.0025 17-7-01 < 0.002523-1-01 < 0.0025 24-7-01 < 0.002530-1-01 < 0.0025 31-7-01 < 0.0025
6-2-01 < 0.0025 7-8-01 < 0.002513-2-01 < 0.0025 16-8-01 < 0.002520-2-01 < 0.0025 21-8-01 < 0.002527-2-01 < 0.0025 28-8-01 < 0.0025
6-3-01 < 0.0025 4-9-01 < 0.002513-3-01 < 0.0025 11-9-01 < 0.002520-3-01 < 0.0025 18-9-01 < 0.002527-3-01 < 0.0025 25-9-01 < 0.0025
3-4-01 < 0.0025 2-10-01 < 0.002510-4-01 < 0.0025 9-10-01 < 0.002517-4-01 < 0.0025 16-10-01 < 0.002524-4-01 < 0.0025 26-10-01 < 0.0025
1-5-01 < 0.0025 30-10-01 < 0.00258-5-01 < 0.0025 6-11-01 < 0.0025
15-5-01 < 0.0025 13-11-01 < 0.002523-5-01 < 0.0025 20-11-01 < 0.002529-5-01 < 0.0025 27-11-01 < 0.0025
5-6-01 < 0.0025 4-12-01 < 0.002512-6-01 < 0.0025 13-12-01 < 0.002519-6-01 < 0.0025 18-12-01 < 0.002526-6-01 < 0.0025 24-12-01 < 0.0025
Notes:1. Four air samplers are located along the eastern boundary of the LHSTC site, where suburban
residences are closest (see Figure 2). Results are calculated making the conservativeassumptions that:(a) all iodine-131 activity was released during the first day of the 7 day sampling period;(b) all the activity was concentrated at one sampling point.
2. A person with continuous exposure to iodine-131 at a concentration of 0.0025 Bq/m3 wouldreceive an effective dose of less than 0.01 mSv per year (IAEA, 1994).
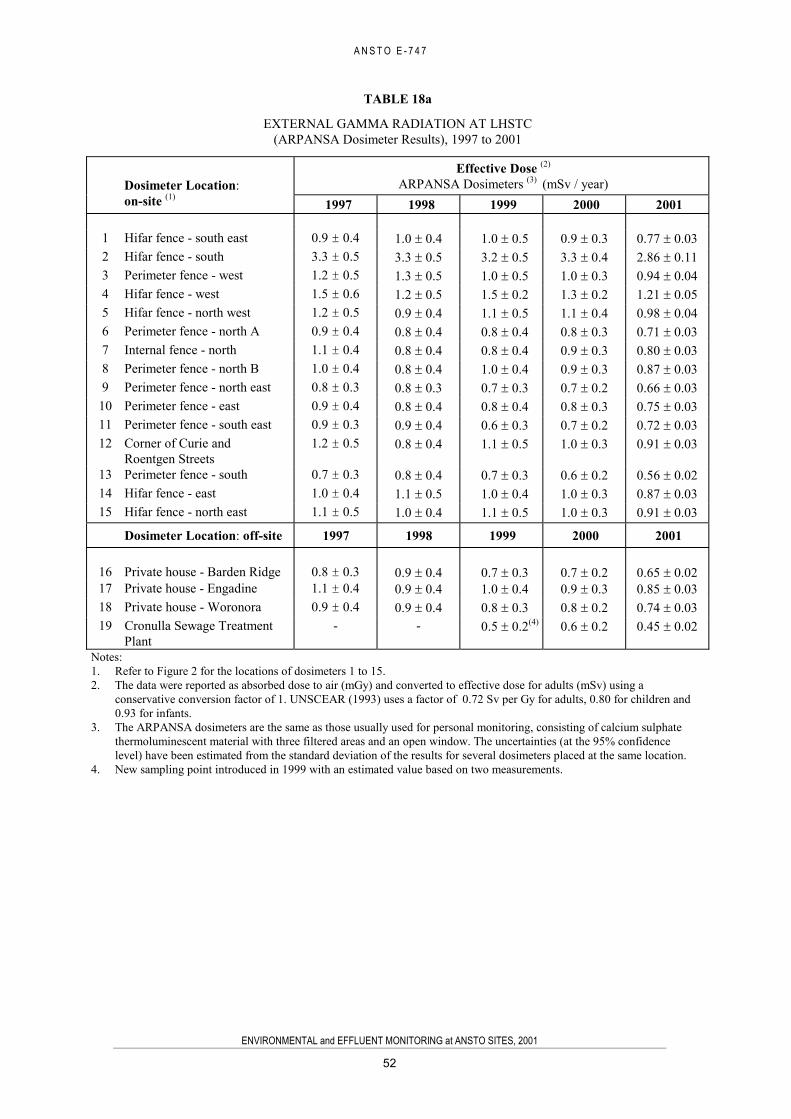
A N S T O E - 7 4 7
ENVIRONMENTAL and EFFLUENT MONITORING at ANSTO SITES, 2001
52
TABLE 18a
EXTERNAL GAMMA RADIATION AT LHSTC(ARPANSA Dosimeter Results), 1997 to 2001
Effective Dose (2)
ARPANSA Dosimeters (3) (mSv / year)Dosimeter Location:on-site (1)
1997 1998 1999 2000 2001
1 Hifar fence - south east 0.9 ± 0.4 1.0 0.4 1.0 0.5 0.9 0.3 0.77 0.032 Hifar fence - south 3.3 ± 0.5 3.3 0.5 3.2 0.5 3.3 0.4 2.86 0.113 Perimeter fence - west 1.2 ± 0.5 1.3 0.5 1.0 0.5 1.0 0.3 0.94 0.044 Hifar fence - west 1.5 ± 0.6 1.2 0.5 1.5 0.2 1.3 0.2 1.21 0.055 Hifar fence - north west 1.2 ± 0.5 0.9 0.4 1.1 0.5 1.1 0.4 0.98 0.046 Perimeter fence - north A 0.9 ± 0.4 0.8 0.4 0.8 0.4 0.8 0.3 0.71 0.037 Internal fence - north 1.1 ± 0.4 0.8 0.4 0.8 0.4 0.9 0.3 0.80 0.038 Perimeter fence - north B 1.0 ± 0.4 0.8 0.4 1.0 0.4 0.9 0.3 0.87 0.039 Perimeter fence - north east 0.8 ± 0.3 0.8 0.3 0.7 0.3 0.7 0.2 0.66 0.03
10 Perimeter fence - east 0.9 ± 0.4 0.8 0.4 0.8 0.4 0.8 0.3 0.75 0.0311 Perimeter fence - south east 0.9 ± 0.3 0.9 0.4 0.6 0.3 0.7 0.2 0.72 0.0312 Corner of Curie and
Roentgen Streets1.2 ± 0.5 0.8 0.4 1.1 0.5 1.0 0.3 0.91 0.03
13 Perimeter fence - south 0.7 ± 0.3 0.8 0.4 0.7 0.3 0.6 0.2 0.56 0.0214 Hifar fence - east 1.0 ± 0.4 1.1 0.5 1.0 0.4 1.0 0.3 0.87 0.0315 Hifar fence - north east 1.1 ± 0.5 1.0 0.4 1.1 0.5 1.0 0.3 0.91 0.03
Dosimeter Location: off-site 1997 1998 1999 2000 2001
16 Private house - Barden Ridge 0.8 ± 0.3 0.9 0.4 0.7 0.3 0.7 0.2 0.65 0.0217 Private house - Engadine 1.1 ± 0.4 0.9 0.4 1.0 0.4 0.9 0.3 0.85 0.0318 Private house - Woronora 0.9 ± 0.4 0.9 0.4 0.8 0.3 0.8 0.2 0.74 0.0319 CCronulla Sewage Treatment
Plant- - 0.5 0.2(4) 0.6 0.2 0.45 0.02
Notes:1. Refer to Figure 2 for the locations of dosimeters 1 to 15.2. The data were reported as absorbed dose to air (mGy) and converted to effective dose for adults (mSv) using a
conservative conversion factor of 1. UNSCEAR (1993) uses a factor of 0.72 Sv per Gy for adults, 0.80 for children and0.93 for infants.
3. The ARPANSA dosimeters are the same as those usually used for personal monitoring, consisting of calcium sulphatethermoluminescent material with three filtered areas and an open window. The uncertainties (at the 95% confidencelevel) have been estimated from the standard deviation of the results for several dosimeters placed at the same location.
4. New sampling point introduced in 1999 with an estimated value based on two measurements.

A N S T O E - 7 4 7
ENVIRONMENTAL and EFFLUENT MONITORING at ANSTO SITES, 2001
53
TABLE 18b
EXTERNAL GAMMA RADIATION AT LHSTCCOMPARISON OF ARPANSA AND ANSTO DOSIMETER RESULTS, 2001
Thermoluminescent DosimeterResults 2001
Effective Dose (2) (mSv / year)Dosimeter Location: on-site (1)
ARPANSA (3) ANSTO (4)
1 Hifar fence - south east 0.77 0.03 0.85 0.032 Hifar fence - south 2.86 0.11 3.16 0.103 Perimeter fence - west 0.94 0.04 1.13 0.044 Hifar fence - west 1.21 0.05 1.39 0.045 Hifar fence - north west 0.98 0.04 1.19 0.046 Perimeter fence - north A 0.71 0.03 0.84 0.037 Internal fence - north 0.80 0.03 0.92 0.038 Perimeter fence - north B 0.87 0.03 0.95 0.039 Perimeter fence - north east 0.66 0.03 0.82 0.03
10 Perimeter fence - east 0.75 0.03 0.91 0.0311 Perimeter fence - south east 0.72 0.03 0.87 0.0312 Corner of Curie and Roentgen St 0.91 0.03 1.06 0.0313 Perimeter fence - south 0.56 0.02 0.77 0.0214 Hifar fence - east 0.87 0.03 1.05 0.0315 Hifar fence - north east 0.91 0.03 1.12 0.04
Dosimeter Location: off-site ARPANSA ANSTO
16 Private house - Barden Ridge 0.65 0.02 0.89 0.0317 Private house - Engadine 0.85 0.03 1.17 0.0418 Private house - Woronora 0.74 0.03 0.90 0.0319 Cronulla Sewage Treatment Plant 0.45 0.02 0.55 0.02
Notes:1. Refer to Figure 2 for the locations of thermoluminsecent dosimeters (TLD’s) 1 to 15.2. The data were reported as absorbed dose to air (mGy) and converted to effective dose for adults (mSv)
using a conservative conversion factor of 1. UNSCEAR (1993) uses a factor of 0.72 Sv per Gy for adults,0.80 for children and 0.93 for infants.
3. The ARPANSA dosimeters are the same as those usually used for personal monitoring, consisting ofcalcium sulphate thermoluminescent material with three filtered areas and an open window.
4. The ANSTO environmental dosimeters contain lithium fluoride and calcium fluoride thermoluminescentmaterials with energy compensation filters. The uncertainties have been estimated (at the 95% confidencelevel) from the standard deviation of the results for several dosimeters placed at the same location.

A N S T O E - 7 4 7
ENVIRONMENTAL and EFFLUENT MONITORING at ANSTO SITES, 2001
54
TABLE 19a
AIRBORNE RADIOACTIVITY DISCHARGES FROM INDIVIDUAL DISCHARGE POINTS AT LHSTCJanuary – March 2001
STACK (1) Alpha(kBq)
Beta (2)
(kBq) Iodine-131
(MBq)Tritium(GBq)
Noble Gases (3)
(TBq)Other Nuclides (MBq)
3 N.D. (4) N.D. 0.59(5)
15A N.D. 270 2.0 540 37 Hg-19712
Hg-2033.1
As-7681
Br-821.8
15M N.D. N.D. 0.59 29 3.5
19S N.D. N.D. 2.4
19D N.D. N.D. 0.12
20 N.D. N.D. 0.42 (5) 2.3
21A N.D. N.D. 0.091(5)
21B N.D. N.D. N.D.(5)
23A N.D. 270 490
23B N.D. N.D. 0.082
41A N.D. N.D. 15(5)
41B N.D. N.D. 0.44(5)
54 N.D. N.D. 5300 40 I-13249000
I-133 1700
56 N.D. N.D. 2.2(5)
57 N.D. N.D. 0.73(5) 140
Notes:1. See Figure 2 for the location of the discharge stacks and Appendix B for explanations of the different types of airborne
discharges.2. Any long-lived beta activity is assumed to be Strontium-90, although this nuclide is not a likely candidate.3. Noble gases emitted from building 54 stack are short-lived radioactive isotopes of Xenon and Krypton from Tc-99
production. HIFAR emits mainly Argon-41 produced by the neutron activation of air inside the reactor irradiationfacilities.
4. “N.D.” indicates that the radioactivity was not detected.5. Indicates emissions where I-131 is included with non-specific emissions for that stack, ie there is no specific
Notification Level for I-131 for that stack.
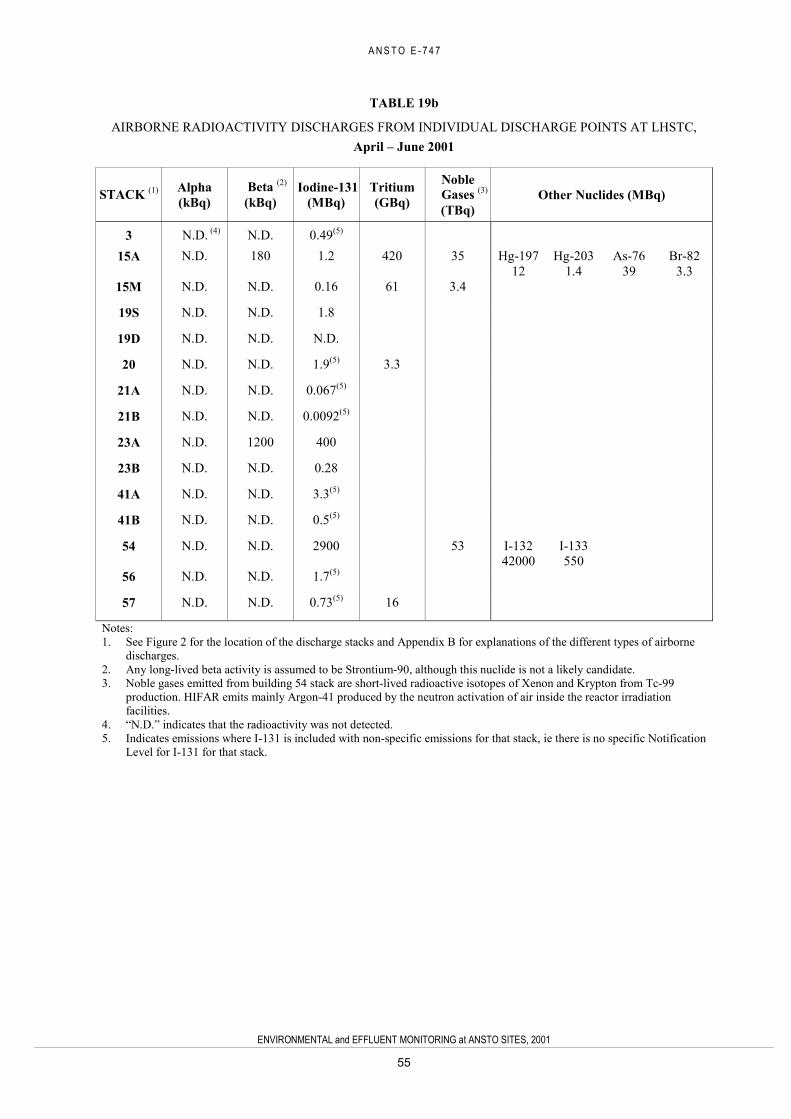
A N S T O E - 7 4 7
ENVIRONMENTAL and EFFLUENT MONITORING at ANSTO SITES, 2001
55
TABLE 19b
AIRBORNE RADIOACTIVITY DISCHARGES FROM INDIVIDUAL DISCHARGE POINTS AT LHSTC,April – June 2001
STACK (1) Alpha(kBq)
Beta (2)
(kBq) Iodine-131
(MBq)Tritium(GBq)
Noble Gases (3)
(TBq)Other Nuclides (MBq)
3 N.D. (4) N.D. 0.49(5)
15A N.D. 180 1.2 420 35 Hg-19712
Hg-2031.4
As-7639
Br-823.3
15M N.D. N.D. 0.16 61 3.4
19S N.D. N.D. 1.8
19D N.D. N.D. N.D.
20 N.D. N.D. 1.9(5) 3.3
21A N.D. N.D. 0.067(5)
21B N.D. N.D. 0.0092(5)
23A N.D. 1200 400
23B N.D. N.D. 0.28
41A N.D. N.D. 3.3(5)
41B N.D. N.D. 0.5(5)
54 N.D. N.D. 2900 53 I-13242000
I-133550
56 N.D. N.D. 1.7(5)
57 N.D. N.D. 0.73(5) 16
Notes:1. See Figure 2 for the location of the discharge stacks and Appendix B for explanations of the different types of airborne
discharges.2. Any long-lived beta activity is assumed to be Strontium-90, although this nuclide is not a likely candidate.3. Noble gases emitted from building 54 stack are short-lived radioactive isotopes of Xenon and Krypton from Tc-99
production. HIFAR emits mainly Argon-41 produced by the neutron activation of air inside the reactor irradiationfacilities.
4. “N.D.” indicates that the radioactivity was not detected.5. Indicates emissions where I-131 is included with non-specific emissions for that stack, ie there is no specific Notification
Level for I-131 for that stack.

A N S T O E - 7 4 7
ENVIRONMENTAL and EFFLUENT MONITORING at ANSTO SITES, 2001
56
TABLE 19c
AIRBORNE RADIOACTIVITY DISCHARGES FROM INDIVIDUAL DISCHARGE POINTS at LHSTC,July – September 2001
STACK (1) Alpha(kBq)
Beta (2)
(kBq) Iodine-131
(MBq)Tritium(GBq)
Noble Gases (3)
(TBq)Other Nuclides (MBq)
3 N.D. (4) N.D. 0.64 (5)
15A N.D. 220 1.0 490 35 Hg-19712
Hg-2030.9
As-7647
Br-822.1
15M N.D. N.D. 0.28 92 4.1
19S N.D. N.D. 0.59
19D N.D. N.D. 0.08
20 N.D. N.D. 0.31 (5) 6.5
21A N.D. N.D. 0.03 (5)
21B N.D. N.D. N.D.(5)
23A N.D. 1200 760
23B N.D. N.D. 0.35
41A N.D. N.D. 12(5)
41B N.D. N.D. 1.90 (5)
54 N.D. N.D. 3000 54 I-13215500
I-133580
56 N.D. N.D. 1.1(5)
57 N.D. N.D. N.D.(5) 34
Notes:1. See Figure 2 for the location of the discharge stacks and Appendix B for explanations of the different types of airborne
discharges.2. Any long-lived beta activity is assumed to be Strontium-90, although this nuclide is not a likely candidate.3. Noble gases emitted from building 54 stack are short-lived radioactive isotopes of Xenon and Krypton from Tc-99
production. HIFAR emits mainly Argon-41 produced by the neutron activation of air inside the reactor irradiationfacilities.
4. “N.D.” indicates that the radioactivity was not detected.5. Indicates emissions where I-131 is included with non-specific emissions for that stack, ie there is no specific Notification
Level for I-131 for that stack.
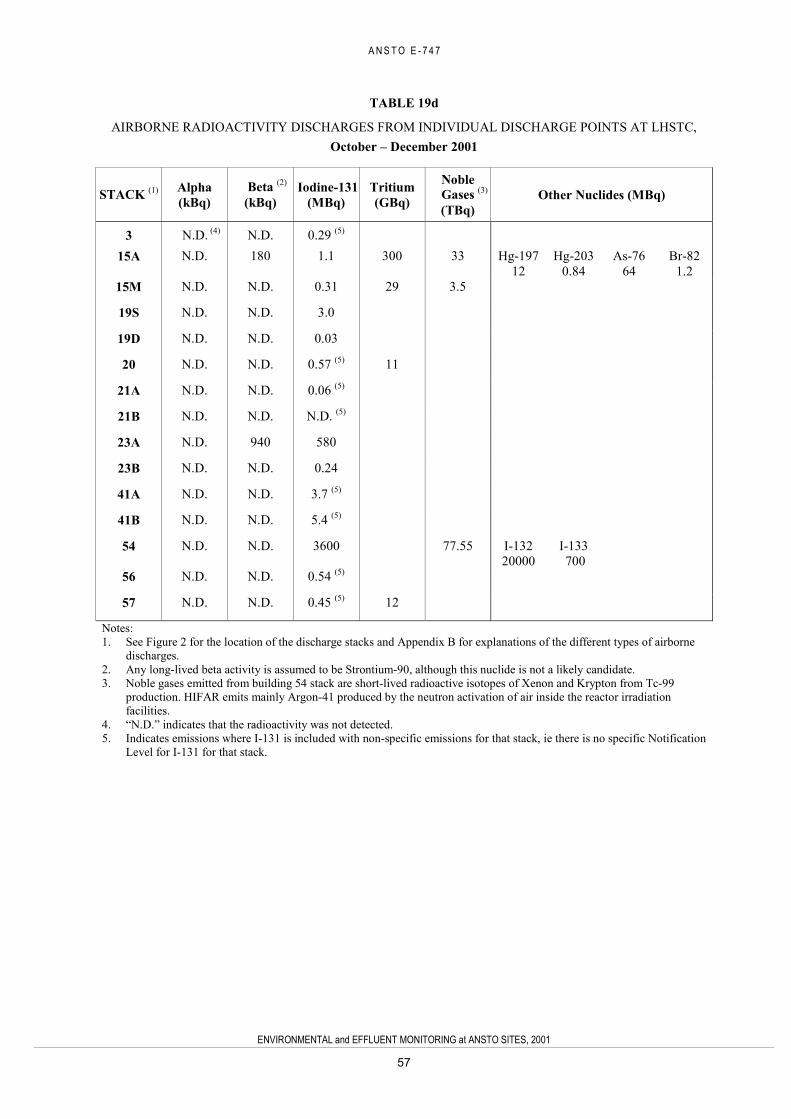
A N S T O E - 7 4 7
ENVIRONMENTAL and EFFLUENT MONITORING at ANSTO SITES, 2001
57
TABLE 19d
AIRBORNE RADIOACTIVITY DISCHARGES FROM INDIVIDUAL DISCHARGE POINTS AT LHSTC,October – December 2001
STACK (1) Alpha(kBq)
Beta (2)
(kBq) Iodine-131
(MBq)Tritium(GBq)
Noble Gases (3)
(TBq)Other Nuclides (MBq)
3 N.D. (4) N.D. 0.29 (5)
15A N.D. 180 1.1 300 33 Hg-19712
Hg-2030.84
As-7664
Br-821.2
15M N.D. N.D. 0.31 29 3.5
19S N.D. N.D. 3.0
19D N.D. N.D. 0.03
20 N.D. N.D. 0.57 (5) 11
21A N.D. N.D. 0.06 (5)
21B N.D. N.D. N.D. (5)
23A N.D. 940 580
23B N.D. N.D. 0.24
41A N.D. N.D. 3.7 (5)
41B N.D. N.D. 5.4 (5)
54 N.D. N.D. 3600 77.55 I-13220000
I-133 700
56 N.D. N.D. 0.54 (5)
57 N.D. N.D. 0.45 (5) 12
Notes:1. See Figure 2 for the location of the discharge stacks and Appendix B for explanations of the different types of airborne
discharges.2. Any long-lived beta activity is assumed to be Strontium-90, although this nuclide is not a likely candidate.3. Noble gases emitted from building 54 stack are short-lived radioactive isotopes of Xenon and Krypton from Tc-99
production. HIFAR emits mainly Argon-41 produced by the neutron activation of air inside the reactor irradiationfacilities.
4. “N.D.” indicates that the radioactivity was not detected.5. Indicates emissions where I-131 is included with non-specific emissions for that stack, ie there is no specific Notification
Level for I-131 for that stack.
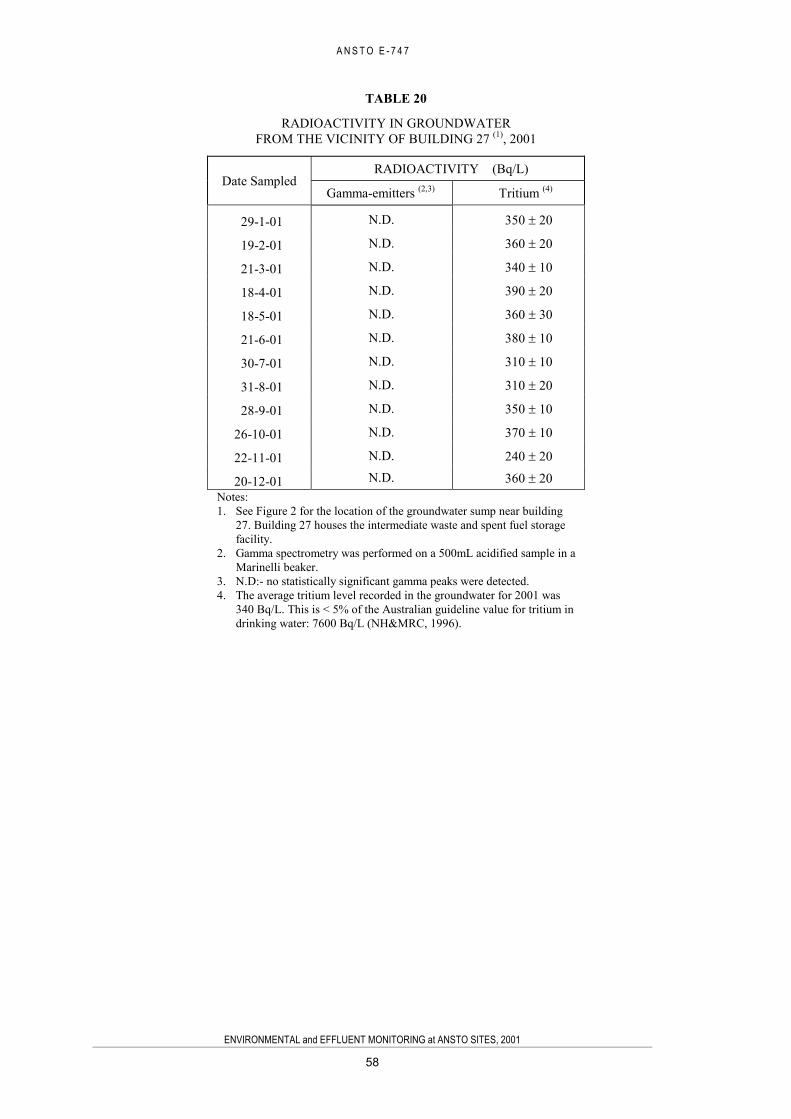
A N S T O E - 7 4 7
ENVIRONMENTAL and EFFLUENT MONITORING at ANSTO SITES, 2001
58
TABLE 20
RADIOACTIVITY IN GROUNDWATERFROM THE VICINITY OF BUILDING 27 (1), 2001
RADIOACTIVITY (Bq/L)Date Sampled
Gamma-emitters (2,3) Tritium (4)
29-1-01 N.D. 350 20
19-2-01 N.D. 360 20
21-3-01 N.D. 340 10
18-4-01 N.D. 390 20
18-5-01 N.D. 360 30
21-6-01 N.D. 380 10
30-7-01 N.D. 310 10
31-8-01 N.D. 310 20
28-9-01 N.D. 350 10
26-10-01 N.D. 370 10
22-11-01 N.D. 240 20
20-12-01 N.D. 360 20Notes:1. See Figure 2 for the location of the groundwater sump near building
27. Building 27 houses the intermediate waste and spent fuel storagefacility.
2. Gamma spectrometry was performed on a 500mL acidified sample in aMarinelli beaker.
3. N.D:- no statistically significant gamma peaks were detected.4. The average tritium level recorded in the groundwater for 2001 was
340 Bq/L. This is < 5% of the Australian guideline value for tritium indrinking water: 7600 Bq/L (NH&MRC, 1996).
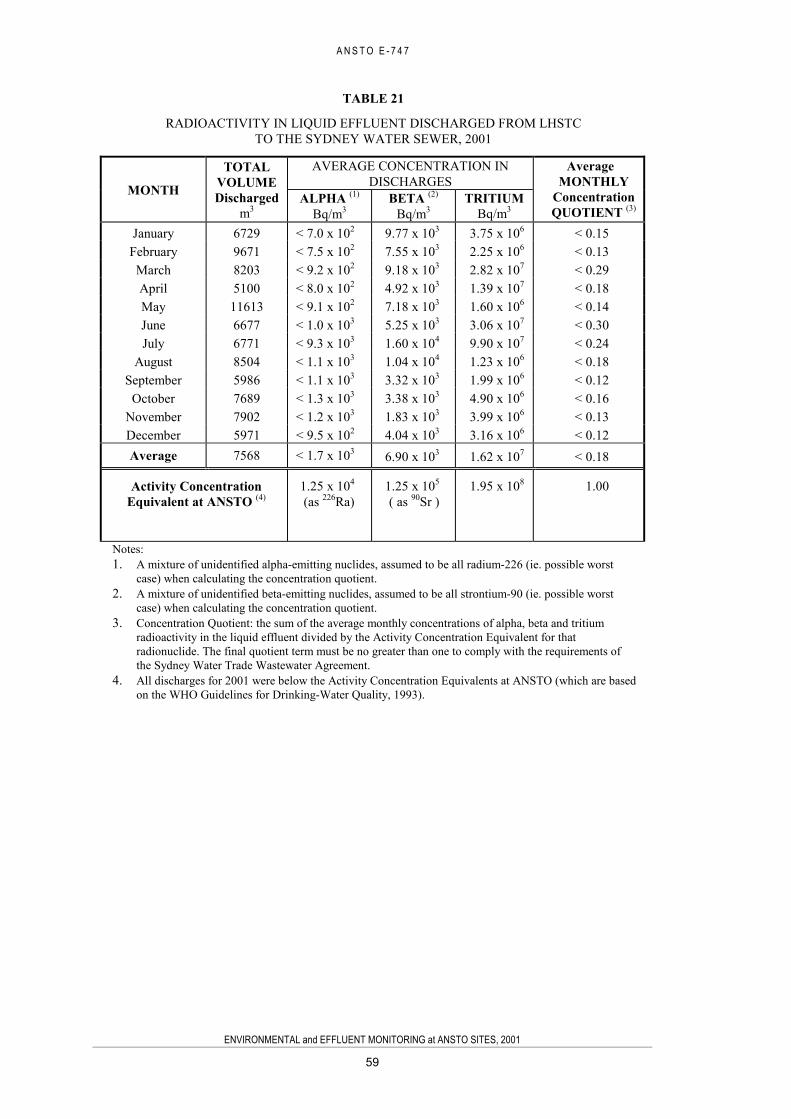
A N S T O E - 7 4 7
ENVIRONMENTAL and EFFLUENT MONITORING at ANSTO SITES, 2001
59
TABLE 21
RADIOACTIVITY IN LIQUID EFFLUENT DISCHARGED FROM LHSTCTO THE SYDNEY WATER SEWER, 2001
AVERAGE CONCENTRATION INDISCHARGESMONTH
TOTALVOLUMEDischarged
m3ALPHA (1)
Bq/m3BETA (2)
Bq/m3TRITIUM
Bq/m3
AverageMONTHLY
ConcentrationQUOTIENT (3)
January 6729 < 7.0 x 10² 9.77 x 10³ 3.75 x 10⁶ < 0.15February 9671 < 7.5 x 10² 7.55 x 10³ 2.25 x 10⁶ < 0.13March 8203 < 9.2 x 10² 9.18 x 10³ 2.82 x 10⁷ < 0.29April 5100 < 8.0 x 10² 4.92 x 10³ 1.39 x 10⁷ < 0.18May 11613 < 9.1 x 10² 7.18 x 10³ 1.60 x 10⁶ < 0.14June 6677 < 1.0 x 10³ 5.25 x 10³ 3.06 x 10⁷ < 0.30July 6771 < 9.3 x 10³ 1.60 x 10⁴ 9.90 x 10⁷ < 0.24
August 8504 < 1.1 x 10³ 1.04 x 10⁴ 1.23 x 10⁶ < 0.18September 5986 < 1.1 x 10³ 3.32 x 10³ 1.99 x 10⁶ < 0.12
October 7689 < 1.3 x 10³ 3.38 x 10³ 4.90 x 10⁶ < 0.16November 7902 < 1.2 x 10³ 1.83 x 10³ 3.99 x 10⁶ < 0.13December 5971 < 9.5 x 10² 4.04 x 10³ 3.16 x 10⁶ < 0.12Average 7568 < 1.7 x 10³ 6.90 x 10³ 1.62 x 10⁷ < 0.18
Activity ConcentrationEquivalent at ANSTO (4)
1.25 x 10⁴
(as 226Ra)1.25 x 10⁵
( as 90Sr )1.95 x 10⁸ 1.00
Notes:1. A mixture of unidentified alpha-emitting nuclides, assumed to be all radium-226 (ie. possible worst
case) when calculating the concentration quotient.2. A mixture of unidentified beta-emitting nuclides, assumed to be all strontium-90 (ie. possible worst
case) when calculating the concentration quotient.3. Concentration Quotient: the sum of the average monthly concentrations of alpha, beta and tritium
radioactivity in the liquid effluent divided by the Activity Concentration Equivalent for thatradionuclide. The final quotient term must be no greater than one to comply with the requirements ofthe Sydney Water Trade Wastewater Agreement.
4. All discharges for 2001 were below the Activity Concentration Equivalents at ANSTO (which are basedon the WHO Guidelines for Drinking-Water Quality, 1993).
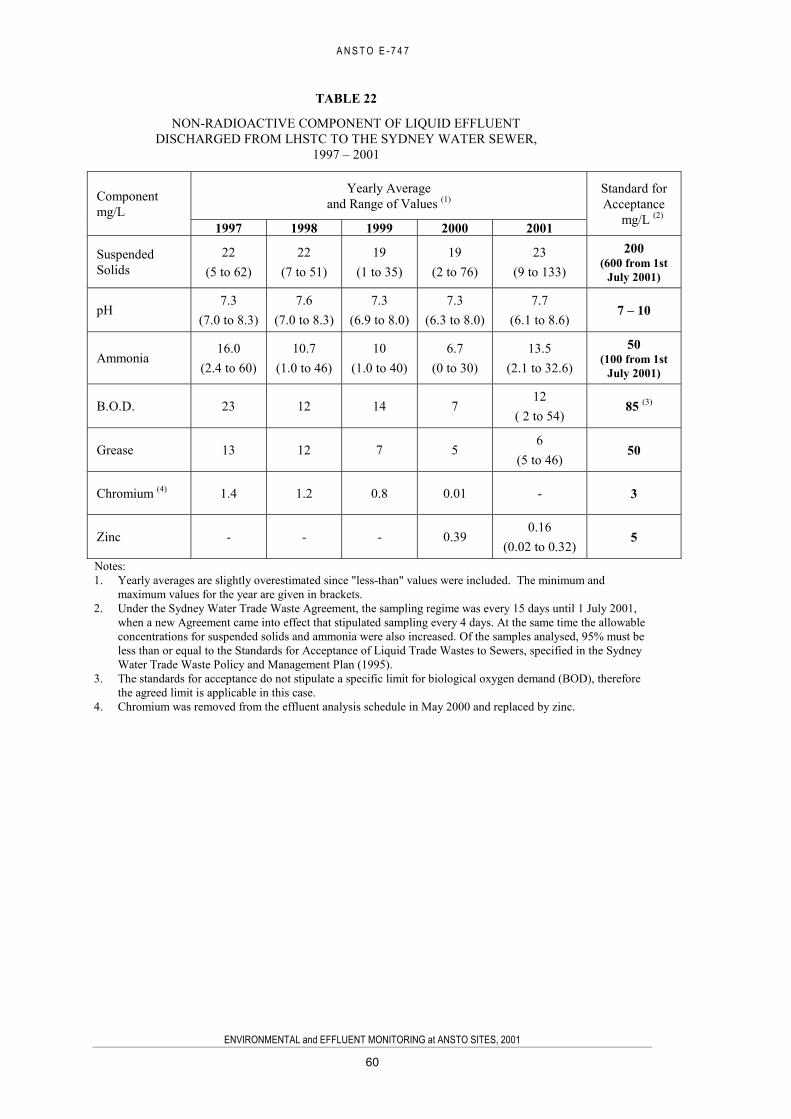
A N S T O E - 7 4 7
ENVIRONMENTAL and EFFLUENT MONITORING at ANSTO SITES, 2001
60
TABLE 22
NON-RADIOACTIVE COMPONENT OF LIQUID EFFLUENTDISCHARGED FROM LHSTC TO THE SYDNEY WATER SEWER,
1997 – 2001
Yearly Averageand Range of Values (1)Component
mg/L1997 1998 1999 2000 2001
Standard forAcceptance mg/L (2)
SuspendedSolids
22(5 to 62)
22(7 to 51)
19(1 to 35)
19(2 to 76)
23(9 to 133)
200(600 from 1st
July 2001)
pH7.3
(7.0 to 8.3)7.6
(7.0 to 8.3)7.3
(6.9 to 8.0)7.3
(6.3 to 8.0)7.7
(6.1 to 8.6)7 – 10
Ammonia16.0
(2.4 to 60)10.7
(1.0 to 46)10
(1.0 to 40)6.7
(0 to 30)13.5
(2.1 to 32.6)
50(100 from 1st
July 2001)
B.O.D. 23 12 14 712
( 2 to 54) 85 (3)
Grease 13 12 7 56
(5 to 46)50
Chromium (4) 1.4 1.2 0.8 0.01 - 3
Zinc - - - 0.390.16
(0.02 to 0.32)5
Notes:1. Yearly averages are slightly overestimated since "less-than" values were included. The minimum and
maximum values for the year are given in brackets.2. Under the Sydney Water Trade Waste Agreement, the sampling regime was every 15 days until 1 July 2001,
when a new Agreement came into effect that stipulated sampling every 4 days. At the same time the allowableconcentrations for suspended solids and ammonia were also increased. Of the samples analysed, 95% must beless than or equal to the Standards for Acceptance of Liquid Trade Wastes to Sewers, specified in the SydneyWater Trade Waste Policy and Management Plan (1995).
3. The standards for acceptance do not stipulate a specific limit for biological oxygen demand (BOD), thereforethe agreed limit is applicable in this case.
4. Chromium was removed from the effluent analysis schedule in May 2000 and replaced by zinc.
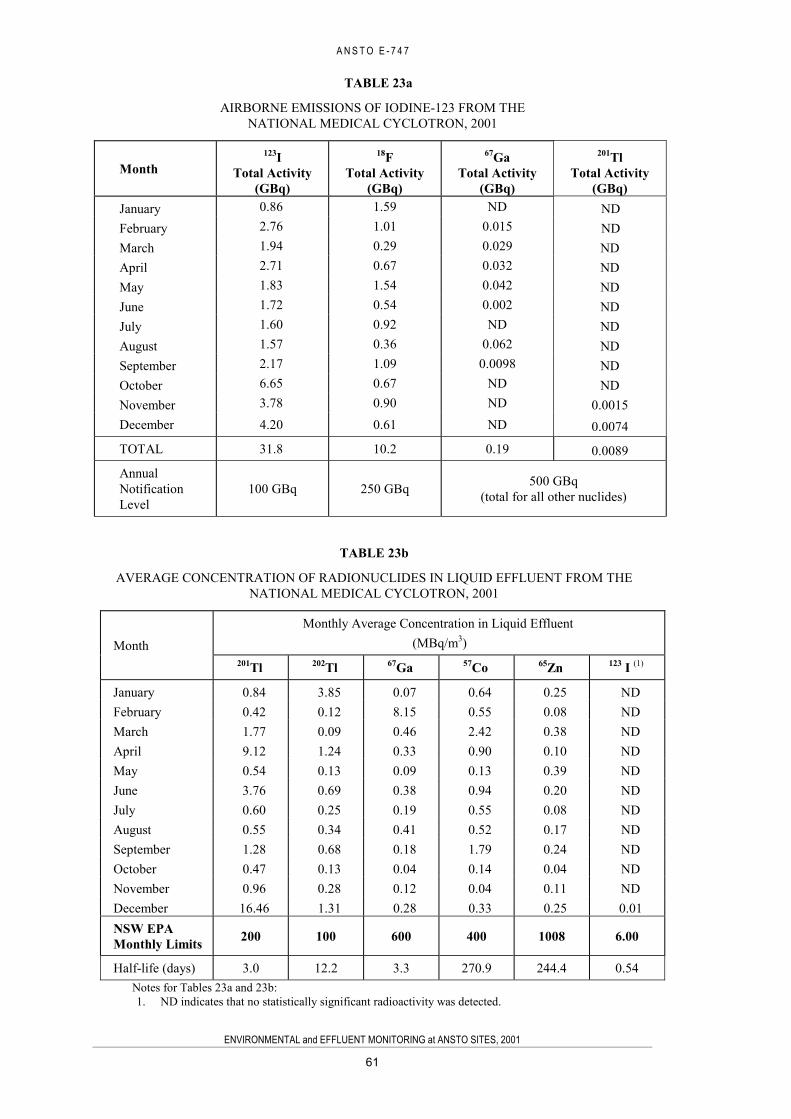
A N S T O E - 7 4 7
ENVIRONMENTAL and EFFLUENT MONITORING at ANSTO SITES, 2001
61
TABLE 23a
AIRBORNE EMISSIONS OF IODINE-123 FROM THENATIONAL MEDICAL CYCLOTRON, 2001
Month123I
Total Activity(GBq)
18FTotal Activity
(GBq)
67GaTotal Activity
(GBq)
201TlTotal Activity
(GBq)January 0.86 1.59 ND NDFebruary 2.76 1.01 0.015 NDMarch 1.94 0.29 0.029 NDApril 2.71 0.67 0.032 NDMay 1.83 1.54 0.042 NDJune 1.72 0.54 0.002 NDJuly 1.60 0.92 ND NDAugust 1.57 0.36 0.062 NDSeptember 2.17 1.09 0.0098 NDOctober 6.65 0.67 ND NDNovember 3.78 0.90 ND 0.0015December 4.20 0.61 ND 0.0074
TOTAL 31.8 10.2 0.19 0.0089
AnnualNotificationLevel
100 GBq 250 GBq 500 GBq(total for all other nuclides)
TABLE 23b
AVERAGE CONCENTRATION OF RADIONUCLIDES IN LIQUID EFFLUENT FROM THENATIONAL MEDICAL CYCLOTRON, 2001
Monthly Average Concentration in Liquid Effluent (MBq/m3)Month
201Tl 202Tl 67Ga 57Co 65Zn 123 I (1)
January 0.84 3.85 0.07 0.64 0.25 NDFebruary 0.42 0.12 8.15 0.55 0.08 NDMarch 1.77 0.09 0.46 2.42 0.38 NDApril 9.12 1.24 0.33 0.90 0.10 NDMay 0.54 0.13 0.09 0.13 0.39 NDJune 3.76 0.69 0.38 0.94 0.20 NDJuly 0.60 0.25 0.19 0.55 0.08 NDAugust 0.55 0.34 0.41 0.52 0.17 NDSeptember 1.28 0.68 0.18 1.79 0.24 NDOctober 0.47 0.13 0.04 0.14 0.04 NDNovember 0.96 0.28 0.12 0.04 0.11 NDDecember 16.46 1.31 0.28 0.33 0.25 0.01NSW EPAMonthly Limits 200 100 600 400 1008 6.00
Half-life (days) 3.0 12.2 3.3 270.9 244.4 0.54Notes for Tables 23a and 23b:1. ND indicates that no statistically significant radioactivity was detected.
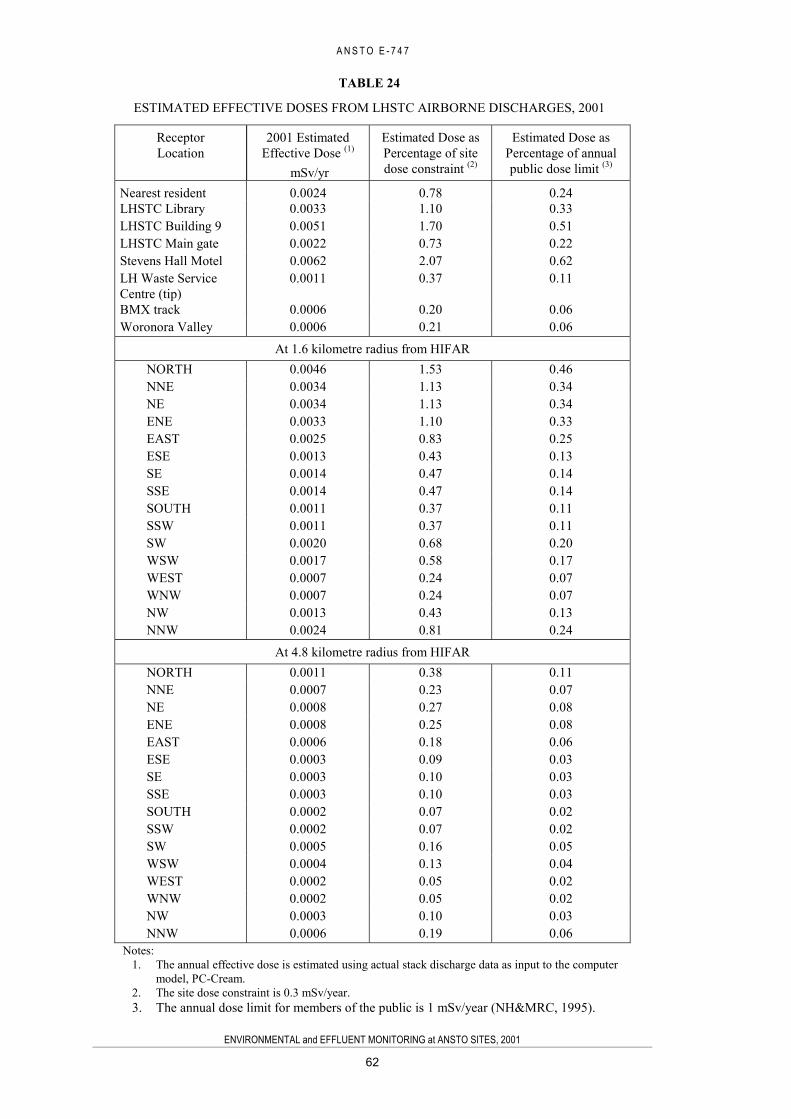
A N S T O E - 7 4 7
ENVIRONMENTAL and EFFLUENT MONITORING at ANSTO SITES, 2001
62
TABLE 24
ESTIMATED EFFECTIVE DOSES FROM LHSTC AIRBORNE DISCHARGES, 2001
ReceptorLocation
2001 EstimatedEffective Dose (1)
mSv/yr
Estimated Dose asPercentage of sitedose constraint (2)
Estimated Dose asPercentage of annualpublic dose limit (3)
Nearest resident 0.0024 0.78 0.24LHSTC Library 0.0033 1.10 0.33LHSTC Building 9 0.0051 1.70 0.51LHSTC Main gate 0.0022 0.73 0.22Stevens Hall Motel 0.0062 2.07 0.62LH Waste ServiceCentre (tip)
0.0011 0.37 0.11
BMX track 0.0006 0.20 0.06Woronora Valley 0.0006 0.21 0.06
At 1.6 kilometre radius from HIFARNORTH 0.0046 1.53 0.46NNE 0.0034 1.13 0.34NE 0.0034 1.13 0.34ENE 0.0033 1.10 0.33EAST 0.0025 0.83 0.25ESE 0.0013 0.43 0.13SE 0.0014 0.47 0.14SSE 0.0014 0.47 0.14SOUTH 0.0011 0.37 0.11SSW 0.0011 0.37 0.11SW 0.0020 0.68 0.20WSW 0.0017 0.58 0.17WEST 0.0007 0.24 0.07WNW 0.0007 0.24 0.07NW 0.0013 0.43 0.13NNW 0.0024 0.81 0.24
At 4.8 kilometre radius from HIFARNORTH 0.0011 0.38 0.11NNE 0.0007 0.23 0.07NE 0.0008 0.27 0.08ENE 0.0008 0.25 0.08EAST 0.0006 0.18 0.06ESE 0.0003 0.09 0.03SE 0.0003 0.10 0.03SSE 0.0003 0.10 0.03SOUTH 0.0002 0.07 0.02SSW 0.0002 0.07 0.02SW 0.0005 0.16 0.05WSW 0.0004 0.13 0.04WEST 0.0002 0.05 0.02WNW 0.0002 0.05 0.02NW 0.0003 0.10 0.03NNW 0.0006 0.19 0.06
Notes:1. The annual effective dose is estimated using actual stack discharge data as input to the computer
model, PC-Cream.2. The site dose constraint is 0.3 mSv/year.3. The annual dose limit for members of the public is 1 mSv/year (NH&MRC, 1995).

A N S T O E - 7 4 7
ENVIRONMENTAL and EFFLUENT MONITORING at ANSTO SITES, 2001
63
APPENDIX 1. MEASUREMENT OF RADIOACTIVITYThis section presents a brief description of the types of radioactivity analyses performed onenvironmental samples and the radionuclides commonly found, together with information onnatural radioactivity. The statistical analysis of data is also discussed. Definitions of termsused throughout this report may be found in the Glossary. The radioisotope symbols used inthis report are listed in Appendix 3.
The unit of radioactivity is the becquerel (Bq), which is equivalent to one nucleardisintegration per second. This unit is usually prefixed by multiples (for discharge data) andsubmultiples (for environmental concentrations) of 1000. These prefixes, which are applicableto the International System of Units (SI), are tabulated inside the back cover of this report.
NATURAL RADIOACTIVITY IN ENVIRONMENTAL SAMPLESThe uranium-238 and thorium-232 series are two of the primordial radioactive decay chainsfound in nature. The extremely long half-lives of the parent nuclides (4500 million and 14000million years respectively) mean that their various decay products are ubiquitous in nature,occurring to varying degrees in soils, biota, water, and air. When present in environmentalsamples, the decay products of the uranium and thorium series can contribute significantly tothe levels of gross alpha, gross beta and gamma radioactivity of such samples. Because oftheir natural origin, levels of the uranium-238 and thorium-232 series in LHSTCenvironmental survey samples have not been quantified. If progeny of the uranium-238 andthorium-232 decay series are detected during gamma spectroscopy of samples, their presenceis reported in the relevant tables simply as "U & Th series". Typical activities of uranium andthorium and each of their 24 radioactive products range from 0.001 to 0.520 Bq/g in differentsoil types (UNSCEAR 1993, Table 5, p 65).
Potassium-40 has a half-life of 1280 million years and is found in rocks, natural waters andall material of plant and animal origin. It decays by beta/gamma emission with a specificactivity of 30.7 Bq per gram of stable potassium (NH&MRC 1996). Potassium-40 is notconsidered to be of significance to health because it is present naturally with the stablepotassium isotope and does not accumulate in the body but is maintained at a constant level.The average concentration of potassium in an adult male is about 2 g per kg of body weight,or about 60 Bq of potassium-40 per kg of body weight. The average contribution of thisnuclide to the annual effective dose from background radiation is estimated to be 0.18 mSv(UNSCEAR 2000).
When evaluating the net gross beta activity of an environmental sample the beta contributionfrom potassium-40 (at 27.6 Bq per gram of stable potassium) may be calculated andsubtracted.
Beryllium-7 is a naturally produced radioisotope that is formed by cosmic ray bombardmentof atmospheric gases, mainly nitrogen and oxygen. For this reason beryllium-7 is considered atracer of air masses coming from the stratosphere or upper troposphere. Beryllium-7 has ahalf-life of 53 days and is a highly reactive element that rapidly becomes associated withaerosol particles. These particles are efficiently removed from the atmosphere to earththrough precipitation. Hence beryllium-7 is often found in stormwater samples collected atthe Lucas Heights site.
RADIOACTIVITY MEASUREMENTSGross alpha and gross beta activity refers to the measurement of the total alpha or betaradioactivity of a sample from unspecified radionuclides. The measurement of grossradioactivity is a semi-quantitative screening technique, which is used to determine whether
A N S T O E - 7 4 7
ENVIRONMENTAL and EFFLUENT MONITORING at ANSTO SITES, 2001
64
more detailed analyses for specific radionuclides are warranted. Tritium (a weak beta emitter)cannot be detected using gross beta counting techniques.
Gamma activity refers to the electromagnetic radiation (gamma rays or photons) emitted fromnuclides undergoing radioactive decay. Gamma photons are counted using a high puritygermanium solid-state detector. A gamma spectrum for each sample is accumulated, with anenergy range of 20 keV to 2000 keV. The peaks in the spectrum are then identified andcompared with background spectra to determine significant nuclides and the specific activitycalculated. Nuclides that may be detected by this method include caesium-137, cobalt-60 andiodine-131.
Caesium-137 is a fission-product that was widely dispersed around the world by fallout fromnuclear tests performed in the atmosphere. It has a half-life of 30.14 years. The isotope isdeposited on land in precipitation or as 'dry' fallout, and adsorbs strongly onto fine sediments(like clays). A typical value for soils in the Sydney region is 1350 Bq/m2 (Cole-Clark, 1993).Caesium-137 is widespread in foods, since its chemical behaviour is similar to that ofpotassium (an element essential to all living things). This isotope is also present in the marineenvironment and hence can be found in marine biota such as fish and shellfish. Caesium-137is also formed as a by-product of the manufacture of technetium-99m generators for medicalpurposes.
Cobalt-60 is an activation product formed in reactors by the neutron activation of stablecobalt-59 (often present in steel components). It has a half-life of 5.26 years and is a beta-gamma emitter. This isotope is readily concentrated by both aquatic and terrestrial organisms.
Iodine-131 is a beta/gamma-emitting radionuclide with a relatively short half-life of 8.02days. Iodine-131 is used in hospitals to diagnose and treat various diseases associated with thethyroid. It is biologically important because atmospheric releases of iodine-131 can depositonto pasture and be incorporated into milk. Human consumption of this milk can then lead toiodine-131 uptake by thyroid tissue. Further, inhalation of gaseous iodine-131 can also resultin doses to the lung and thyroid. If present in water, iodine is more readily concentrated bymarine biota than by freshwater organisms.
Tritium (3H) is a radioisotope of hydrogen and has a half-life of 12.26 years. It decays withthe emission of a weak beta particle, with a maximum energy of 18.6 keV and an averageenergy of 5.69 keV (there is no gamma emission). Tritium activity in water samples ismeasured by distillation and liquid scintillation counting.
Tritium is widespread in the environment. It is a cosmogenic radionuclide and was alsoproduced as a result of atmospheric nuclear weapons testing (by far the largest contribution).It is also produced in nuclear reactors (particularly in reactors such as HIFAR that have heavywater moderators) by neutron activation of deuterium.
The penetration of the tritium beta is low (the stopping distance is about 7 mm in air, 0.01 mmthickness of paper, or the outer dead layer of human skin). Exposure through internal uptakeis therefore the main consideration when assessing radiation dose due to tritium. TheAustralian drinking water guideline value for tritium is 7600 Bq/L (NH&MRC 1996) and thisreflects the fact that tritium is not as biologically hazardous as other radionuclides havingmore energetic radiations.
Tritium (as tritiated water) is chemically indistinguishable from normal water and may betaken up as such by living organisms. The biological half-life of tritium is relatively short,with one half of the absorbed tritium being excreted from the body typically within days.When present, tritium is found more or less uniformly distributed throughout living species,not accumulated in any particular organ. The concentration factor is ordinarily assumed to beequal to one. Tritium is therefore not considered to accumulate in aquatic organisms abovethe concentration found in the surrounding water.
A N S T O E - 7 4 7
ENVIRONMENTAL and EFFLUENT MONITORING at ANSTO SITES, 2001
65
Tritiated water does not undergo geochemical processes such as ion exchange, adsorption orprecipitation and can therefore be used as a tracer for groundwater movement.
QUALITY MANAGEMENTANSTO's Quality Policy requires activities to be undertaken in a manner that promotes aquality culture for planning and undertaking research and development, the provision ofservices and reporting of these activities. Consistent with this policy, a formal commitment toquality systems is fundamental to obligations accepted by ANSTO within the framework ofthe environmental assessment process for the replacement reactor. ANSTO is in the processof introducing an ISO 9001/2000 regime across the site (including the monitoringlaboratories) and has made a commitment to implement the ISO 14001 standard forEnvironmental Management Systems.
The Environment Division achieved accreditation to the ISO 9001:2000 standard for QualityManagement Systems in December 2000 (certificate No. QEC12839). In October 2000 theSafety Division external dosimetry, health physics instrument calibration and stack samplingoperations gained certification to the AS/NZS ISO 9002:1994 standard.
Radiological Analysis MethodsDetailed information on sample collection and analysis methods were published in Hoffmannet al, 2001. International Standard methods for radiological analyses are used for tritiumanalysis via distillation and liquid scintillation counting (ISO 9698:1989), gross alpha activity(ISO 9696:1992) and gross beta activity (ISO 9697:1992). Laboratory instructions forperforming gamma spectrometry, gross alpha, gross beta and tritium analyses of waters aredocumented and incorporate techniques based on those used by the ARPANSAEnvironmental Radioactivity Branch.
Instruments and detectors are regularly maintained and calibrated against certified standardmaterials. Blanks and standards are counted regularly.
Counting StatisticsAfter a sample has been "counted" or measured for radioactivity, it is important to determinewhether or not the level of activity is statistically significant. The results from theenvironmental monitoring program are reported using the principles of counting decisionlevels endorsed by Gilmore & Hemingway in Practical Gamma-ray Spectrometry (1995),Chapter 5, Section 5.6, pages 119-124. These decision levels are used to determine thestatistical significance of a sample count based upon the uncertainty of the background count.
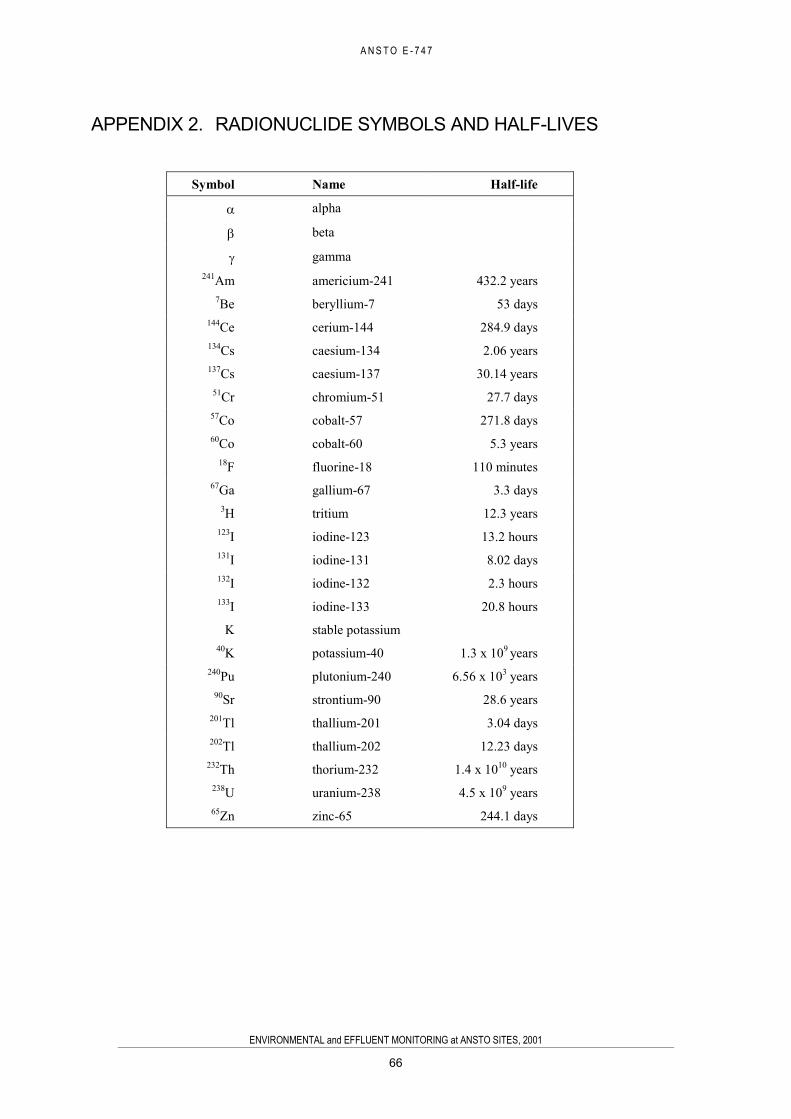
A N S T O E - 7 4 7
ENVIRONMENTAL and EFFLUENT MONITORING at ANSTO SITES, 2001
66
APPENDIX 2. RADIONUCLIDE SYMBOLS AND HALF-LIVES
Symbol Name Half-life
alpha
beta
gamma241Am americium-241 432.2 years
7Be beryllium-7 53 days144Ce cerium-144 284.9 days134Cs caesium-134 2.06 years137Cs caesium-137 30.14 years
51Cr chromium-51 27.7 days57Co cobalt-57 271.8 days60Co cobalt-60 5.3 years
18F fluorine-18 110 minutes67Ga gallium-67 3.3 days
3H tritium 12.3 years123I iodine-123 13.2 hours131I iodine-131 8.02 days132I iodine-132 2.3 hours133I iodine-133 20.8 hours
K stable potassium40K potassium-40 1.3 x 10⁹ years
240Pu plutonium-240 6.56 x 10³ years90Sr strontium-90 28.6 years
201Tl thallium-201 3.04 days202Tl thallium-202 12.23 days
232Th thorium-232 1.4 x 10¹⁰ years238U uranium-238 4.5 x 10⁹ years65Zn zinc-65 244.1 days
A N S T O E - 7 4 7
ENVIRONMENTAL and EFFLUENT MONITORING at ANSTO SITES, 2001
6 7
GLOSSARY OF TERMSAbsorbed dose: The energy imparted to matter by ionising radiation per unit mass ofirradiated material at the place of interest. The unit of absorbed dose is joules per kilogram,called the gray (Gy). See radiation dose.
Activity (of a substance): The number of disintegrations per unit of time taking place in aradioactive material. The unit of activity is the becquerel (Bq), one disintegration per second.
ALARA: As low as reasonably achievable. Used in reference to radiation levels.
Alpha particle: A positively charged particle emitted from the nucleus of an atom duringradioactive decay. Consists of two protons and two neutrons, ie a helium-4 nucleus. Althoughalpha particles are normally highly energetic, they travel only a few centimetres in air and arestopped by a sheet of paper or outer layer of dead skin.
Alpha radiation: The emission of alpha particles when the nucleus of an atom is unstable andradioactive.
A member of the public: A real or hypothetical person outside the effective control ofANSTO who is identified in a critical group pathway analysis.
Ambient: the amount of radioactivity that is considered to fall within measured levels arisingfrom naturally occurring sources.
ARI: Australian Radiopharmaceuticals and Industrials. A commercial unit operated byANSTO to market and distribute radioisotopes produced by ANSTO.
Background radiation: The ionising radiation in the environment to which we are allexposed. It comes from many sources - outer space, the sun, the rocks and soil under our feet,the buildings we live in, the air we breathe, the food we eat, and from our own bodies.
Becquerel (Bq): Unit of radioactivity, equal to one radioactive disintegration per second. ThisSI unit may be used instead of the curie (Ci):
1 curie = 3.7 x 10¹⁰ becquerels.
Beta particle (ray): A particle emitted from an atom during radioactive decay. Beta particlesare either electrons with a negative charge or positrons with a positive electric charge. High-energy beta particles can travel metres in air and several millimetres into the human body. Lowenergy betas are unable to penetrate the skin. Most beta particles can be stopped by a smallthickness of light material, eg aluminium or plastic sheeting.
Beta radioactivity: Radioactive transformation of a nuclide in which high energy electrons areemitted and the mass number remains unchanged, but the atomic number changes by 1 withthe emission of a beta particle.
Biota: Fauna and flora of a given region.
Biological half-life of an isotope: The time required for one-half of an absorbed radioisotopeto be excreted from the body. Also called biological turnover.
Buffer zone: A 1.6 km boundary around ANSTO (measured radially from the HIFAR reactor)within which no residential development is allowed to occur.
Class C water: Water that is controlled with regard to what can be discharged into it. For afull definition, see the NSW Protection of the Environment Operations Act, 1997.
Concentration factor (biological): the ratio of an element in an organism, to that of itsenvironment or what is consumed, i.e.
Concentration in consumer organism Concentration in environment or food.

A N S T O E - 7 4 7
ENVIRONMENTAL and EFFLUENT MONITORING at ANSTO SITES, 2001
6 8
Critical group: A group of members of the public that is reasonably homogeneous withrespect to its exposure to a given radiation source and given exposure pathway and is typical ofindividuals receiving the highest radiation dose by the given exposure pathway from the givensource.
Critical orifice: A device that restricts air-flow through a sampling assembly to a constantrate, provided the required vacuum is applied.
Decay, radioactive: The disintegration of an atomic nucleus resulting in the release of alpha orbeta particles, and/or gamma radiation.
Dilution ratio: The ratio of effluent concentration at release, to the maximum concentration atthe destination.
Dose constraint: For public exposure, the dose constraint is the maximum annual dose thatmembers of the public may be allowed to receive from the planned operation of any specificsource of radioactivity. The exposure to which the dose constraint applies is the annual dose toany critical group summed over all exposure pathways arising from the predicted operation ofthe controlled source. The dose constraint for each source is intended to ensure that the sum ofdoses to the critical group from all controlled sources remains within the public dose limit.
Dose limits: The maximum radiation dose that a person may receive over a stated period oftime. Internationally recommended limits adopted by Australia are that radiation workersshould not accumulate more than 20 mSv per year. Members of the public should not receivemore than 1 mSv per year (NH&MRC 1995).
Effective dose: A physical quantity used in the measurement of ionising radiation dose tohumans, taking into account the harmfulness of different types of radiation and thesusceptibility to harm of different organs of the body. The effective dose is the sum ofweighted equivalent doses to all organs and tissues of the body, where the equivalent dose toeach organ and tissue is multiplied by the weighting factor for that organ or tissue. The unit ofeffective dose is joules per kilogram, termed the sievert (Sv), or more commonly themillisievert (mSv) - one-thousandth of one sievert.
Electromagnetic radiation: Waves of energy that are caused by the acceleration of chargedparticles. Includes radio waves, infra-red, visible light and ultraviolet radiation (all non-ionising radiation), and x-rays and gamma rays (ionising radiation).
Equivalent dose: A weighted radiation dose to an organ or tissue, which is the product ofabsorbed dose in the organ or tissue and the radiation weighting factor (determined by the typeand energy of the radiation to which the organ or tissue is exposed). This measurement allowsthe dose received by exposed persons to be expressed on a scale common to all ionisingradiation. The unit of equivalent dose is joules per kilogram, termed the sievert (Sv). Dose ismost commonly expressed as millisieverts (mSv).
Fission: Usually, the division of a heavy nucleus into two similar but generally unequalmasses, with the emission of neutrons, gamma radiation and a great deal of energy.
Fission product decay: The process by which radioactive atoms from fission become stablethrough the emission of radioactive particles.
Fission products: The atoms formed as a result of fission. Most fission products are veryunstable, have short half-lives and are highly radioactive, emitting copious quantities of betarays and gamma rays over a range of energies. A small number emit delayed neutrons.
Gamma radiation: Gamma radiation is short wavelength electromagnetic radiation of thesame physical nature as light, x-rays, radio waves, etc. However, gamma radiation is highlypenetrating (more so than x-rays) and, depending on its energy, can require a considerablethickness of lead or concrete to absorb it. Because gamma radiation causes ionisation, itconstitutes a biological hazard.
A N S T O E - 7 4 7
ENVIRONMENTAL and EFFLUENT MONITORING at ANSTO SITES, 2001
6 9
Gamma radioactivity: Electromagnetic radiation of high quantum energy emitted afternuclear reactions or by radioactive atoms when the nucleus is left in an excited state afteremission of alpha or beta particles.
Half-life, radioactive: For a single radioactive decay process, the time required for the activityto decrease to half its original value by that process. Half-lives vary, according to theradioisotope, from less than one-millionth of a second to more than one billion years.
Heavy water: Deuterium oxide (D2O) or water containing significantly more than the naturalproportion of heavy hydrogen atoms. Heavy water is used as a moderator in the HIFAR reactorbecause it slows down neutrons effectively.
HIFAR (high flux Australian reactor): Nuclear reactor of the DIDO class operated byANSTO and located at Lucas Heights.
Hot cell: A heavily shielded enclosure for highly radioactive materials. It can be used for theirhandling or processing by remote means, or for their storage.
Ionisation: Any process by which an atom, molecule or ion gains or loses electrons.
Ionising radiation: Radiation capable of causing ionisation of the matter through which itpasses. Ionising radiation may damage living tissue.
Isotope: Atoms of an element having the same number of protons but different numbers ofneutrons in the nuclei. Different isotopes of the same element have the same chemicalproperties, but somewhat different physical properties.
Low level waste: Any waste material that contains measurable quantities of radioactivityrequiring minimum standards of protection for personnel when the waste is handled,transported or stored.
Noble gases: Also known as inert gases, the noble gases (helium, argon, krypton, xenon andradon) have filled electron shells and normally do not react chemically with other elements.There are some radioactive isotopes of noble gases.
Nuclear reactor: A structure in which a fission chain reaction can be maintained andcontrolled. It usually contains fuel, coolant, moderator, control absorbers and safety devicesand is most often surrounded by a concrete biological shield to absorb neutron and gamma rayemissions.
Planchette: A lipped, flat dish, commonly around 50 mm in diameter, used for holdingsamples to be counted under a detector. Water samples may be evaporated directly onto theplanchette. Usually made of stainless steel or aluminium.
Progeny: A nuclide formed from the radioactive decay of another nuclide, called the parent.
Potassium-40: A naturally occurring radioisotope with a 1.30 x 10⁹ year half-life. A majorcontributor to the internal part of radiation dose arising from natural background radiation. It isa beta/gamma emitter.
Radiation dose: A measure of radiation received or “absorbed” by a target. The quantitiestermed absorbed dose, organ dose, equivalent dose, effective dose, committed equivalent doseor committed effective dose are used depending on the context.
Radiation exposure pathways: The routes by which radioactive materials can reach andirradiate people. These include the carrying of radioactive materials by air and water followedby inhalation or ingestion, the carrying of radioactive materials through food or animals thatabsorb the materials, and direct radiation from sources external to the body.
Radioactivity: The property of certain nuclides of spontaneously emitting particles or gammaradiation, or of emitting x-radiation following orbital electron capture, or of undergoingspontaneous fission. The SI (International System) unit of radioactivity is the becquerel (Bq).
A N S T O E - 7 4 7
ENVIRONMENTAL and EFFLUENT MONITORING at ANSTO SITES, 2001
7 0
One becquerel is equal to one nuclear disintegration per second. This is a direct measure of theamount of radioactivity in a sample.
Radionuclide: Any nuclide (isotope of an element) that is unstable and undergoes a naturalradioactive decay.
Sievert: The unit of measurement of dose, effective dose or equivalent dose. It is equal to theabsorbed dose (in grays) multiplied by a factor related to a particular part of the body. It is theunit used to assess the effects of ionising radiation on living cells. Usually measured inmillisieverts, the whole-body dose that every person receives from natural backgroundradiation in one year is about 2.4 millisieverts. Replaces the rem: 1 Sv = 100 rem.
Transit time for the passage of effluent: The time interval from the midpoint of an effluentrelease to the time at which the maximum concentration of the effluent is detected at thedestination.
Tritium: The “heavy” hydrogen isotope of mass 3. It is naturally occurring but can also bemade in a number of ways, including neutron absorption in lithium, deuterium or heavy water.It is radioactive (a very weak beta-emitter) with a half-life of 12.3 years.

A N S T O E - 7 4 7
ENVIRONMENTAL and EFFLUENT MONITORING at ANSTO SITES, 2001
7 1
LIST OF ACRONYMS AND ABBREVIATIONS
AAEC The former Australian Atomic Energy Commission
ARL The former Australian Radiation Laboratories, now ARPANSA
ANSTO Australian Nuclear Science and Technology Centre
ANTARES Australian National Tandem Accelerator for Applied Research
ARI Australian Radioisotopes and Industrials
ARPANSA Australian Radiation Protection and Nuclear Safety Agency
CSTP Cronulla Sewage Treatment Plant
EPA Environment Protection Authority
EMAP Environmental Management Action Plan
HIFAR High Flux Australian Reactor
IAEA International Atomic Energy Agency
ICRP International Commission on Radiological Protection
INIS International Nuclear Information System
ISO International Organisation for Standardisation
LHSTC Lucas Heights Science and Technology Centre
LFBG Little Forest Burial Ground
MDP Main Disposal Pipeline
NH&MRC National Health and Medical Research Council
NMC The National Medical Cyclotron
NSB The former Nuclear Safety Bureau, now ARPANSA
NSW New South Wales
RAC The former Radiological Advisory Council, now ARPANSA
SPCC The former State Pollution Control Commission, now theNSW Environment Protection Agency
STP Sewage Treatment Plant
UNSCEAR United Nations Scientific Committee on theEffects of Atomic Radiation
WHO World Health Organisation
WMAP Waste Management Action Plan