Embed Size (px)
Citation preview

● distribution: the transfer of the drug from the generalcirculation into the different organs of the body
● elimination: the removal of the drug from the body,which may involve either excretion or metabolism.
Each of these can be described in terms of chemical,biochemical and physiological processes and also inmathematical terms. The mathematical description ofpharmacokinetic processes determines many of thequantitative aspects of drug prescribing:
● why oral and intravenous treatments may requiredifferent doses
● the interval between doses during chronic therapy● the dosage adjustment that may be necessary in
hepatic and renal disease● the calculation of dosages for the very young and
the elderly.
The nature of the response of an individual to a par-ticular drug, for example a decrease in blood pressure,depends on the inherent pharmacological properties ofthe drug at its site of action. However, the time delaybetween drug adminstration and response, and the inten-sity and duration of response, usually depend on therate and extent of uptake from the site of administration,the distribution to different tissues, including the site ofaction, and the rate of elimination from the body: insummary, the response of the patient represents a com-bination of the effects of the drug at its site of action inthe body (pharmacodynamics) and the effects of the bodyon drug delivery to its site of action (pharmacokinetics)(Fig. 2.1). Both pharmacodynamic and pharmacokineticaspects are subject to a number of variables (Fig. 2.1),which affect the dose–response relationship. Pharmaco-dynamic aspects are determined by processes such asdrug–receptor interaction and are specific to the class ofthe drug, e.g. β-adrenoceptor antagonists. Pharmaco-kinetic aspects are determined by general processes,such as transfer across membranes, xenobiotic (foreigncompound) metabolism and renal elimination, whichapply irrespective of the pharmacodynamic properties.
Pharmacokinetics may be divided into three basicprocesses:
● absorption: the transfer of the drug from the site ofadministration to the general circulation
Pharmacokinetics2
17
The biological basis of pharmacokinetics 17
General considerations 17
Absorption 20
Distribution 22
Elimination 25
The mathematical basis ofpharmacokinetics 31
General considerations 31
Absorption 33
Distribution 35
Elimination 38
Chronic administration 41
Factors affecting pharmacokinetics 43
Pharmacogenomics, pharmacogenetics and drugresponses 43
Fig. 2.1Factors determining the response of a patient to a drug.
Pharmacology
Pharmacodynamics
Dose–response relationship
Pharmacokinetics
Specific to drug ordrug class
Non-specific, generalprocesses
Interaction with cellularcomponent e.g. receptoror target site
Effects at the site ofaction
Concentration–effectrelationship
Reduction in symptoms
Modification of diseaseprogression
Unwanted effects
Drug interactions
Inter- and intrapatientdifferences
Absorption from site ofadministration
Delivery to the site ofaction
Elimination from body
Time to onset of effect
Duration of effect
Accumulation on repeatdosage
Drug interactions
Inter- and intrapatientdifferences
Ch02.qxd 3/12/05 10:58 AM Page 17

The biological basis ofpharmacokinetics
Drug structures bear little resemblance to normal dietaryconstituents such as carbohydrates, fats and proteins,and they are handled in the body by different processes.Drugs that bind to the receptor for a specific endoge-nous neurotransmitter rarely resemble the natural ligandin chemical structure, and they do not usually share thesame carrier processes or metabolising enzymes with thenatural ligand. Consequently, the movement of drugsaround the body is mostly by simple passive diffusionrather than by specific transporters, while metabolism isusually by ‘drug-metabolising enzymes’, which have alow substrate specificity and can handle a wide varietyof drug substrates.
General considerationsPassage across membranesWith the exception of direct intravenous or intra-arterialinjections, a drug must cross at least one membrane inits movement from the site of administration into thegeneral circulation. Drugs acting at intracellular sitesmust also cross the cell membrane to exert an effect. Themain mechanisms by which drugs can cross membranes(Fig. 2.2) are:
● passive diffusion● carrier-mediated processes: facilitated diffusion and
active transport● through pores or ion channels● by pinocytosis.
Passive diffusion. Passive movement down a con-centration gradient occurs for all drugs. To cross a mem-brane, the drug must pass into the phospholipid bilayer(Fig. 2.2) and therefore has to have a degree of lipidsolubility. Eventually a state of equilibrium will bereached in which equal concentrations of the diffusibleform of the drug are present in solution on each side ofthe membrane.
Carrier-mediated processes. In facilitated diffusion,energy is not consumed and the drug cannot be trans-ported against a concentration gradient; by comparison,active transport is an energy-dependent mechanism result-ing in accumulation of the drug on one side of themembrane. In each case the drug or its metaboliteresembles the natural ligand for the carrier process suffi-ciently to bind to the carrier macromolecule. Examplesof drugs transported into cells via specific carriers thatare used for nutrients include levodopa (Ch. 24), whichcrosses the blood–brain barrier by facilitated diffusion,and base analogues such as 5-fluorouracil (Ch. 52), whichundergoes active uptake. There are a number of rela-tively non-specific carriers which can transport drugsout of cells, such as P-glycoprotein (PGP), organic aniontransporters (OAT1 to OAT4) and organic cation trans-porters (OCT1 and OCT2). PGP is of most importancein the gut, blood–brain barrier and kidneys, and alsoin cells that develop resistance to anticancer drugs(Ch. 52), while the others are most important in thebrain and kidneys (see later). Drugs that bind to carrierproteins but are released only slowly act as inhibitors ofthe carrier; for example, probenecid inhibits the secre-tion of anions, such as penicillins, by the renal tubule(Ch. 51).
Passage through membrane pores or ion channels.Movement occurs down a concentration gradient andcan only occur for extremely small water-solublemolecules (<100 Da). This is applicable to therapeuticions such as lithium and radioactive iodide.
Principles of medical pharmacology and therapeutics
18Fig. 2.2The passage of drugs (D) across membrane bilayers.
Pore or openion-channel
Diffusionthrough
lipid bi-layer
Carrierprotei(carrier-
mediatedprocess)
nClosed
ion-channel
D
D D
D D
D
Ch02.qxd 3/12/05 10:58 AM Page 18

Pinocytosis. This can be regarded as a form of carrier-mediated entry into the cell cytoplasm. Pinocytosis isnormally concerned with the uptake of macromolecules;however, successful attempts have been made to utiliseit for targeted drug uptake by incorporating the druginto a lipid vesicle or liposome (e.g. amphotericin anddoxorubicin – Ch. 51).
A number of reversible and irreversible processescan influence the total concentration of drug present oneach side of the membrane (Fig. 2.3). Ionisation is afundamental property of most drugs and will occurwhenever the drug is in solution. The majority of drugsare either weak acids, such as aspirin, or weak bases,such as propranolol. The presence of an ionisablegroup(s) is essential for the mechanism of action of mostdrugs, because ionic forces represent a key part ofligand–receptor interactions. Drug receptors are formedby the three-dimensional arrangement of a protein(Ch. 1), and drug binding requires both lipid- andwater-soluble sites within the drug molecule; the latterare usually produced by an ionisable functional group.
The overall polarity of the drug and its extent ofionisation determine the extent of distribution (forexample, entry into the brain), accumulation in adiposetissue, and mechanism and route of elimination fromthe body. Ionisation is a fundamental property and occurswhen drugs containing acidic or basic groups dissolvein an aqueous body fluid.
[Acidic drug] [Acidic drug]− + H+
[Basic drug] + H+ [Basic drug – H]+
In general terms, the ionised form of the molecule can beregarded as the water-soluble form and the un-ionisedform as the lipid-soluble form. Drugs with ionisablegroups exist as an equilibrium between charged anduncharged forms. The extent of ionisation can affectboth the pharmacodynamics (for example, the affinityfor the receptor) and the pharmacokinetics (for example,the extent of uptake by adipose tissue and the route of
elimination). The ease with which a drug can enter andcross a lipid bilayer is determined by the lipid solubilityof its un-ionised form. Drugs that are fixed in theirionised form at all pH values, such as the quaternaryamines, cross membranes extremely slowly or not at all;they have limited effects on the brain (because of lack ofentry) and are given by injection (because of lack ofabsorption from the intestine).
The extent of ionisation of a drug depends on thestrength of the ionisable group and the pH of thesolution. The extent of ionisation is given by the aciddissociation constant Ka.
Conjugate acid Conjugate base + H+
Ka = [conjugate base] [H+] (2.1)
[conjugate acid]
The term conjugate acid refers to a form of the drug ableto release a proton, such as an un-ionised acidic drug(Drug–COOH) or an ionised basic drug (Drug–NH3
+).The conjugate base is the corresponding equilibriumform of the drug that has lost the proton, such as anionised acidic drug (Drug–COO−) or an un-ionised basicdrug (Drug–NH2).
For acidic drugs, the value of Ka is normally low (e.g.10−5) and therefore it is easier to compare compoundsusing the negative logarithm of the Ka, which is calledthe pKa (e.g. 5).
For acidic functional groups, a strong acid will havea high tendency to dissociate to give H+; this results in ahigh value for Ka (e.g. 10−1 or 10−2) and numerically a lowpKa (e.g. 1 or 2). Thus, strongly acidic groups (such asDrug–SO3H) have a pKa of 1–2, while weakly acidicgroups (such as a phenolic–OH) have a pKa of 9–10. Incontrast, for basic functional groups, the stronger thebase, the greater will be its ability to retain the H+ as aconjugate acid – resulting in a low Ka and a high pKa.Thus, strongly basic groups (such as R–NH2 where R isan alkyl group) have a pKa of 10–11, while weakly basicgroups (such as R3N) have a pKa of 2–3.
Pharmacokinetics
19
2
Fig. 2.3Passive diffusion and the factors that affect the concentrations of drug freely available in solution (as an equilibrium between un-ionisedand ionised forms).
Extracellular fluid Intracellular fluid
Administration
Ionisation
Redistributionto other tissues
Proteinbinding
Metabolism Excretion
Proteinbinding
Dissolutionin fat
IonisationD DD
Ch02.qxd 3/12/05 10:58 AM Page 19

The pH of body fluids is controlled by the bufferingcapacity of the ionic groups present in endogenousmolecules such as phosphate ions and proteins. Whenthe fluids on each side of a membrane (see Fig. 2.3) havethe same pH values, there will be equal concentrationsof both the diffusible, un-ionised form and the polarionised form of the drug on each side of the membraneat equilibrium. When the fluids on each side of a mem-brane are at different pH values, the concentration ofionised drug in equilibrium with the un-ionised will bedetermined by the pH of the solution and the pKa of thedrug. This results in pH-dependent differences in drugconcentration on each side of a membrane (pH parti-tioning). The pH differences between plasma (pH 7.4)and stomach contents (pH 1–2) and urine (pH 5–7) caninfluence drug absorption and drug elimination.
Drugs are 50% ionised when the pH of the solutionequals the pKa of the drug. Acidic drugs are mostionised when the pH of the solution exceeds the pKa,whereas basic drugs are most ionised when the pH islower than the pKa (Fig. 2.4). The practical importance isthat the total concentration of drug will be higher on theside of the membrane where it is most ionised (Fig. 2.5),which has implications for drug absorption from thestomach and the renal elimination of some drugs. Indrug overdose, increasing the pH of the urine canenhance the renal elimination of acidic drugs, such asaspirin, by retaining the ionised drug in the urine (seebelow), whereas a decrease in urine pH can be useful forbasic drugs, such as dexamfetamine. It is important torealise that changing urine pH in the wrong directionfor the type of drug taken in overdose will make mattersworse and could kill the person!
The low pH of the stomach contents (usually pH 1–2)means that most acidic drugs are present largely in theirun-ionised (proton-associated) form and pH partition-ing allows the drug to pass into plasma (pH 7.4) whereit is more ionised. In contrast, basic drugs are highlyionised in the stomach and absorption is negligible until
the stomach empties and the drug can be absorbed fromthe lumen of the duodenum (pH about 8).
Absorption
Absorption is the process of transfer of the drug fromthe site of administration into the general or systemiccirculation.
Absorption from the gutThe easiest and most convenient route of administrationof medicines is orally by tablets, capsules or syrups;however, this route presents the greatest number ofbarriers for the drug prior to reaching the systemiccirculation. A number of factors can affect the rate andextent to which a drug can pass from the gut lumen intothe general circulation.
Drug structureDrug structure is a major determinant of absorption,distribution and elimination. Drugs need to be lipidsoluble to be absorbed from the gut. Therefore, highlypolar acids and bases tend to be absorbed only slowlyand incompletely, with much of the dose not absorbedbut voided in the faeces. High polarity may be useful fordelivery of the drug to the lower bowel (see Ch. 34). Thestructure of some drugs can make them unstable eitherat the low pH of the stomach, for example penicillin G,or in the presence of digestive enzymes, for exampleinsulin. Such compounds have to be given by injection,but other routes of delivery may be possible (e.g.inhalation for insulin).
Principles of medical pharmacology and therapeutics
20Fig. 2.4The effect of pH on drug ionisation.
Fig. 2.5Partitioning of acidic and basic drugs across a pH gradient.
Acid–
Base-H+ Base
Acid-H
Low pH
High pH(e.g. – COO–) (e.g. – COOH)
(e.g. – NH3+) (e.g. – NH2)
Low pH
High pH
Ionisedwater-soluble form
Un-ionisedlipid-soluble form
For an acidicdrug (DH)
Urine (pH 6) Membrane Plasma (pH 7.4)
D DH H D
Overall
For a basic drug (D)
–
+DH D
Overall
D D+
DH
–DH D
Ch02.qxd 3/12/05 10:58 AM Page 20

Drugs that are weak acids or bases may undergo pHpartitioning between the gut lumen and mucosal cells.Acidic drugs will be least ionised in the stomach lumen,and most absorption would be expected at this site.However, the potential for absorption in the stomach isdecreased by its low surface area and the presence of azone at neutral pH on the immediate surface of thegastric mucosal cells (the mucosal bicarbonate layer). Inconsequence, even weak acids, such as aspirin, tend tobe absorbed mainly from the small intestine. Basic drugsare highly ionised in the stomach; as a result, absorptiondoes not occur until the drug has passed from thestomach to the small intestine.
FormulationDrugs cannot be absorbed until the administered tablet/capsule disintegrates and the drug is dissolved in thegastrointestinal contents to form a molecular solution.Most tablets disintegrate and dissolve rapidly and com-pletely and all of the dose is rapidly available for absorp-tion. However, some formulations are produced thatdisintegrate slowly so that the rate at which the drug isabsorbed is limited by the rate of release and dissolutionof drug from the formulation, rather than by the transferof the dissolved drug across the gut wall. This is thebasis for modified-release formulations (e.g. slow-release)in which the drug either is incorporated into a complexmatrix from which it diffuses, or is administered in acrystallised form that dissolves only slowly. Dissolutionof a tablet in the stomach can be prevented by coating itin an acid-insoluble layer, producing an enteric-coatedformulation, for example omeprazole and aspirin. Thisallows delivery of intact drug to the duodenum.
Gastric emptyingThe rate of gastric emptying determines the rate at whicha drug is delivered to the small intestine, which is themajor site of absorption. A delay between dose admin-istration and the detection of the drug in the circulationis seen frequently after oral dosing, and is usually causedby delayed gastric emptying. The co-administration ofdrugs that slow gastric emptying, for example antimus-carinics, can alter the rate of drug absorption.
Food has a complex effect on drug absorption sinceit reduces the rate of gastric emptying and delaysabsorption, but it can also alter the total amount of drugabsorbed.
First-pass metabolismMetabolism of drugs (see below) can occur prior to and during absorption, and this can limit the amount of parent compound reaching the generalcirculation. Drugs taken orally have to pass four major metabolic barriers before they reach the generalcirculation.
Intestinal lumen. This contains digestive enzymessecreted by the mucosal cells and pancreas that are able
to split amide, ester and glycosidic bonds. Intestinalproteases prevent the oral administration of peptides,which are the usual products derived from molecularbiological approaches to drug development. In addition,the lower bowel contains large numbers of aerobic andanaerobic bacteria, which are capable of performing arange of metabolic reactions, especially hydrolysis andreduction.
Intestinal wall. The cells of the wall are rich inenzymes such as monoamine oxidase (MAO), L-aromaticamino acid decarboxylase, CYP3A4 (see below) and theenzymes responsible for the phase 2 conjugation reac-tions (see below). In addition, the luminal membrane ofthe intestinal cells contains the efflux transporter PGP,which transfers some drugs that have entered the cellback into the intestinal lumen. Drug molecules that enterthe enterocyte may undergo three possible fates – i.e.diffuse into the hepatic portal circulation, undergometabolism within the cell, or be transported back intothe gut lumen by PGP. There are overlapping substratespecificities of CYP3A4 and PGP, and for common sub-strates the combined actions can prevent the majority ofan oral dose reaching the portal circulation.
Liver. Blood from the intestine is delivered directlyto the liver, which is the major site of drug metabolismin the body (see metabolism, below).
Lung. Cells of the lung have high affinity for manybasic drugs and are the main site of metabolism formany local hormones via MAO or peptidase activity.
If there is extensive metabolism at one or more ofthese sites, only a fraction of the administered oral dosemay reach the general circulation. This process is knownas first-pass metabolism because it occurs at the firstpassage through these organs. The liver is generally themost important site of first-pass metabolism. Hepaticmetabolism can be avoided by administration of thedrug to a region of the gut from which the blood doesnot drain into the hepatic portal vein, for example thebuccal cavity and rectum. A good example of avoidinghepatic first-pass metabolism is the buccal administra-tion of glyceryl trinitrate (Ch. 5).
Absorption from other routesPercutaneous (transcutaneous) administrationThe human epidermis (especially the stratum corneum)represents an effective permeability barrier to waterloss and to the transfer of water-soluble compounds.Although lipid-soluble drugs are able to cross thisbarrier, the rate and extent of entry are very limited. Inconsequence, this route is only really effective for usewith potent non-irritant drugs, such as glyceryltrinitrate, or to produce a local effect. The slow andcontinued absorption from dermal administration (e.g.via adhesive patches) can be used to produce low, butrelatively constant, blood concentrations, e.g. the use ofnicotine patches.
Pharmacokinetics
21
2
Ch02.qxd 3/12/05 10:58 AM Page 21

Intradermal and subcutaneous injectionIntradermal or subcutaneous injection avoids the barrierpresented by the stratum corneum, and entry into thegeneral circulation is limited largely by the blood flowto the site of injection. However, these sites only allowthe administration of small volumes of drug and tend tobe used for local effects, such as local anaesthesia, orto limit the rate of drug absorption, for example insulin.Slow uptake from the site of injection, as seen with someinsulin preparations, can result in an increased durationof action.
Intramuscular injectionThe rate of absorption from an intramuscular injectiondepends on two variables: the local blood flow and thewater solubility of the drug, both of which enhance therate of removal from the injection site. Absorption ofdrugs from the injection site can be prolonged inten-tionally either by incorporation of the drug into a lipidvehicle or by formation of a sparingly soluble salt, suchas procaine benzylpenicillin, thereby creating a depotformulation.
Intranasal administration The nasal mucosa provides a good surface area forabsorption, combined with lower levels of proteasesand drug-metabolising enzymes compared with thegastrointestinal tract. In consequence, intranasal adminis-tration is used for the administration of some potentpeptides, such as desmopressin (Ch. 43), as well as fordrugs that are designed to produce local effects, such asnasal decongestants.
InhalationAlthough the lungs possess the characteristics of a goodsite for drug absorption (a large surface area and exten-sive blood flow), inhalation is rarely used to producesystemic effects. The principal reason for this is thedifficulty of delivering non-volatile drugs to the alveoli.Therefore, drug administration by inhalation is largelyrestricted to:
● volatile compounds, such as general anaesthetics● locally acting drugs, such as bronchodilators used in
asthma● potent agents, such as ergotamine for migraine, since
this route avoids the gastric stasis that is a commonfeature of a migraine attack.
The last two groups present technical problems foradministration because the drugs are not volatile andhave to be given either as aerosols containing the drugor as fine particles of the solid drug. Particles greaterthan 10 µm in diameter settle out in the upper airways,which are poor sites for absorption, and the drug thenpasses back up the airways via ciliary motion and iseventually swallowed. The optimum particle size forairways deposition is 2–5 µm. It has been estimated that
only 5–10% of the dose may be absorbed from the air-ways, even when the administration technique generatesmostly small particles (i.e. 5 µm or less). Particles lessthan 1 µm in diameter are not deposited in the airwaysand are exhaled.
Minor routesAlthough drugs may be applied to all body surfaces andorifices, this is usually to produce a local and not asystemic effect. However, absorption from the site ofadministration may be important in limiting theduration of action and in producing unwanted systemicactions.
Distribution
Distribution is the process by which the drug istransferred reversibly from the general circulation intothe tissues as the concentrations in blood increase, andfrom tissues into blood when the blood concentrationsdecrease. For most drugs this occurs by simple diffusionof the un-ionised form across cell membranes untilequilibrium is reached (Fig. 2.3). At equilibrium, anyprocess that removes the drug from one side of themembrane results in movement of drug across themembrane to re-establish the equilibrium (Fig. 2.3).
After an intravenous injection, there is a high initialplasma concentration, and the drug may rapidly enterand equilibrate with well-perfused tissues such as thebrain, liver and lungs (Table 2.1), giving relatively highconcentrations in these tissues. However, the drug willcontinue to enter poorly perfused tissues, and this willlower the plasma concentration. The high concentrationsin the rapidly perfused tissues then decrease in parallelwith the decreasing plasma concentrations, whichresults in a transfer of drug back from those tissues intothe plasma (Fig. 2.6). In most cases, the uptake into well-perfused tissues is so rapid that these tissues may beassumed to equilibrate instantaneously with plasma andrepresent part of the ‘central’ compartment (see below).Redistribution from well-perfused to poorly perfusedtissues is of clinical importance for terminating theaction of some drugs that are given as a rapid intra-venous injection or bolus. For example, thiopentalproduces rapid anaesthesia after intravenous dosage,but this is short lived because continued uptake intomuscle lowers the concentrations in the blood and in thebrain (section A to B in Fig. 2.6; see also Fig.17.2).
The processes of elimination (such as metabolismand excretion) are of major importance and are discussedin detail below. Elimination processes lower theconcentration of the drug within the cells of the organthat eliminates the drug; this results in a transfer fromplasma into the drug-eliminating cells in order to
Principles of medical pharmacology and therapeutics
22
Ch02.qxd 3/12/05 10:58 AM Page 22

Pharmacokinetics
23
2
maintain the equilibrium. The resultant fall in theconcentration of drug in plasma results in drug transferfrom other tissues into plasma in order to maintain theirequilibria. Thus, there is a net transfer from other tissuesto the organ of elimination. Figure 2.6 illustrates howelimination (shown as a dashed line) produces a parallel
decrease in drug concentrations in both plasma andtissues.
Reversible protein bindingMany drugs show an affinity for specific sites onproteins, which results in a reversible association orbinding:
Drug + protein Drug–protein complex
The drug–protein complex is not biologically active.Binding sites occur with circulating proteins such as
albumin and α1-acid glycoprotein (Table 2.2) and withintracellular proteins (Fig. 2.3). The drug–protein bind-ing interaction resembles the drug–receptor interactionsince it is an extremely rapid, reversible and saturableprocess and different ligands can compete for the samesite. However, it differs in two extremely importantrespects:
● drug–protein binding is of low specificity and doesnot result in any pharmacological effect but servessimply to lower the concentration of free drug insolution; such protein binding lowers theconcentration of drug available to act at the receptor
● large amounts of drug may be present in the bodybound to proteins such as albumin; in contrast, theamount of drug actually bound to receptors at thesite of pharmacological activity is only a minutefraction of the total body load (but is in equilibriumwith the total body load – see later).
The rapidly reversible nature of protein binding isimportant because protein-bound drug can act as adepot. If the intracellular concentration of unbounddrug decreases, for example through metabolism, thenthis will affect all the equilibria shown in Figure 2.3.
Fig. 2.6A simplified scheme for the redistribution of drugs betweentissues. The initial decrease in plasma concentrations results fromuptake into well-perfused tissues, which essentially reaches equilibriumat point A. Between points A and B, the drug continues to enter poorlyperfused tissues, which results in a decrease in the concentrations inboth plasma and well-perfused tissues. At point B, all tissues are inequilibrium. N.B. The scheme has been simplified by representing thephases as discrete linear steps and also by the omission of any removalprocess. The presence of a removal process would produce a paralleldecrease in all tissues from point B (shown as ----).
Plasma
Con
cent
ratio
n
Con
cent
ratio
nC
once
ntra
tion
Time
Time
Poorly perfused tissues
Well-perfused tissues
A
B
A
B
AB
Time
Organ Cardiac Blood flowoutput (%) (ml min–1 100 g–1 tissue)
Well-perfused organsLung 100 1000Adrenals 1 550Kidneys 23 450Thyroid 2 400Liver 25 75Heart 5 70Intestines 20 60Brain 15 55Placenta (full term) – 10–15
Poorly perfused organsSkin 9 5Skeletal muscle 16 3Connective tissue – 1Fat 2 1
aExcept for the placenta, the data are for an adult male underresting conditions.
Table 2.1
Relative organ perfusion rates in humansa
Bound to albumin Bound to α1-acidglycoprotein
Clofibrate ChlorpromazineDigitoxin PropranololFurosemide QuinidineIbuprofen Tricyclic antidepressantsIndometacin LidocainePhenytoinSalicylatesSulphonamidesThiazidesTolbutamideWarfarin
Table 2.2
Examples of drugs that undergo extensive plasma proteinbinding and may show therapeutically importantinteractions
Ch02.qxd 3/12/05 10:58 AM Page 23

Drug will dissociate from intracellular protein-bindingsites, and some will transfer across the membrane fromplasma until the intracellular equilibria are re-established.As a result, the extracellular (plasma) concentration ofunbound drug will decrease, and drug will dissociatefrom plasma protein-binding sites. The ratio of the totalamount of drug in the extracellular and intracellularcompartments is determined by the relative affinity ofthe intra- and extracellular binding proteins.
Competition for protein binding can occur betweendifferent drugs (drug interaction; see Ch. 56), and alsobetween drugs and natural, endogenous ligands.Administration of a highly protein-bound drug (such asaspirin) to an individual who is already receiving main-tenance therapy with a drug that binds reversibly toplasma proteins (such as warfarin; see Ch. 11) will resultin displacement of the initial drug from its binding sites;this increases the unbound concentration and thereforethe biological activity. In practice, such protein-bindinginteractions are frequently of limited duration becausethe extra free drug is removed by metabolism or excretion.
An important interaction involving the displacementof an endogenous compound occurs in infants givendrugs such as sulphonamides: drugs that compete forthe same albumin binding sites as endogenous bilirubincan displace the bilirubin and cause a potentially danger-ous increase in its plasma concentration.
Irreversible protein bindingCertain drugs, because of their chemical reactivity,undergo covalent binding to plasma or tissue compo-nents, such as proteins or nucleic acids. When the bind-ing is irreversible, as for example the interaction of somecytotoxic agents with DNA, then this should be consid-ered as an elimination process (because the parent drugcannot re-enter the circulation, as occurs after simpledistribution to tissues). In contrast, the covalent bindingof thiol-containing drugs, such as captopril (Ch. 6), toproteins, via the formation of a disulphide bridge, maybe slowly reversible. In such cases, the covalently bounddrug will not dissociate in response to a rapid decreasein the concentration of unbound drug and such bindingrepresents a slowly equilibrating reservoir of drug.
Distribution to specific organsAlthough the distribution of drugs to all organs iscovered by the general considerations discussed above,two systems require more detailed consideration: thebrain, because of the difficulty of drug entry, and thefetus, because of the potential for toxicity.
BrainLipid-soluble drugs, such as the anaesthetic thiopental,readily pass from the blood into the brain, and for suchdrugs the brain represents a typical well-perfused tissue(see Fig. 2.6, Table 2.1). In contrast, the entry of water-
soluble drugs into the brain is much slower than intoother well-perfused tissues, and this has given rise tothe concept of a blood–brain barrier. The functional basisof the barrier (Fig. 2.7) is reduced capillary permeabilityowing to:
● tight junctions between adjacent endothelial cells(the capillaries are composed of an endothelial celllayer without smooth muscle)
● a decrease in the size and number of pores in theendothelial cell membranes
● the presence of a surrounding layer of astrocytes.
Principles of medical pharmacology and therapeutics
24
Tight junctions between
Endothelial cell
Mitochondrion
Non-tightjunction
Astrocyte
Foot process of astrocyte
endothelial cells
Fig. 2.7The blood–brain barrier.
Astrocyte footprojection
Mitochondrion
Carriersystem
Basallamina
Endothelial cell Nucleus
Tightjunction
Active transport
Ch02.qxd 3/12/05 10:58 AM Page 24

Therefore, only lipid-soluble compounds can readilyenter the brain. Water-soluble endogenous compoundsneeded for normal brain functioning, such as carbohy-drates and amino acids, enter the brain via specifictransport processes. Some drugs, for example levodopa,may enter the brain using these transport processes, andin such cases the rate of transport of the drug will beinfluenced by the concentrations of competitive endoge-nous substrates.
There is limited drug-metabolising ability in thebrain and drugs leave by diffusion back into plasma, byactive transport processes in the choroid plexus, or byelimination in the cerebrospinal fluid. Transporters,such as PGP, in the endothelial cells are an importantpart of the blood–brain barrier, and serve to return drugmolecules that have entered the cell back into the circu-lation, thereby preventing their entry into the brain andreducing any effects in the central nervous system.Organic acid transporters are important in removingpolar neurotransmitter metabolites from the brain.
FetusLipid-soluble drugs can readily cross the placenta andenter the fetus. The placental blood flow is low com-pared with that in the liver, lung and spleen (Table 2.1);consequently, the fetal concentrations equilibrate slowlywith the maternal circulation. Highly polar and largemolecules (such as heparin; see Ch. 11) do not readilycross the placenta. The fetal liver has only low levels ofdrug-metabolising enzymes. It is maternal eliminationprocesses that predominantly control fetal concentra-tions of drug; lowering of maternal concentrations allowsdrug to diffuse back across the placenta from fetal tomaternal circulation.
After delivery, the baby may show effects from drugsgiven to the mother close to delivery (such as pethidinefor pain control; see Ch. 19): such effects may be pro-longed because the infant now has to rely on his or herown immature elimination processes (Ch. 54).
Elimination
Elimination is the removal of drug from the body andmay involve metabolism, in which the drug molecule istransformed into a different molecule, and/or excretion,in which the drug molecule is expelled in the body’sliquid, solid or gaseous ‘waste’.
MetabolismLipid solubility is an essential property of most drugs,since it allows the compound to cross lipid barriers andhence to be given via the oral route. Metabolism isessential for the elimination of lipid-soluble chemicalsfrom the body, because it converts a lipid-soluble
molecule (which would be reabsorbed from urine in thekidney tubule) into a water-soluble species (which iscapable of rapid elimination in the urine). The drugitself is eliminated as soon as metabolism converts itinto a different chemical structure. However, the elimi-nation of the unwanted carbon skeleton of the drug mayinvolve a complex series of biotransformation reactions(see below).
Metabolism of the parent drug produces a newchemical entity, which may show different pharmaco-logical properties:
● complete loss of biological activity, which is theusual result of drug metabolism; this can increasepolarity (especially phase 2 metabolism – see below)and prevent receptor binding
● decrease in activity, when the metabolite retainssome activity
● increase in activity, when the metabolite is morepotent than the parent drug
● change in activity, when the metabolite showsdifferent pharmacological properties which can beless active or more toxic
The various steps of drug metabolism can be dividedinto two phases (Fig. 2.8). Although many compoundsundergo both phases of metabolism, it is possible for achemical to undergo only a phase 1 or a phase 2reaction. Phase 1 metabolism (oxidation, reduction andhydrolysis) is usually described as preconjugation,because it produces a molecule that is a suitable sub-strate for a phase 2 or conjugation reaction. The enzymesinvolved in these reactions have low substrate speci-ficities and can metabolise a vast range of drug sub-strates (as well as most environmental pollutants). Inthis section, drug metabolism is discussed in terms ofthe functional groups that may be found in differentdrugs, rather than individual specific compounds. (Inthe following tables, R refers to an aliphatic or aromaticgroup and Ar refers specifically to an aromatic group.)
Phase 1Oxidation is by far the most important of the phase 1reactions and can occur at carbon, nitrogen or sulphuratoms (Table 2.3). In most cases, an oxygen atom isretained in the metabolite, although some reactions,such as dealkylation, result in loss of the oxygen atom ina small fragment of the original molecule.
Pharmacokinetics
25
2
Phase1
Benzene0%
Phenol0.3%
Phenylsulfate99.9%+
Phase2
Percentageionisedat pH 7.4
OH O – SO3–
Fig. 2.8The two phases of drug metabolism.
Ch02.qxd 3/12/05 10:58 AM Page 25
Oxidation reactions are catalysed by a diverse groupof enzymes, of which the cytochrome P450 system is themost important. Cytochrome P450 is a superfamily ofmembrane-bound enzymes (Table 2.4) which are presentin the smooth endoplasmic reticulum of cells (Fig. 2.9).The liver is the major site of drug oxidation. The amountsof cytochrome P450 in extrahepatic tissues are lowcompared with those in liver.
Cytochrome P450 is a haemoprotein that can bindboth the drug and molecular oxygen (Fig. 2.10). Itcatalyses the transfer of one oxygen atom to the sub-strate while the other oxygen atom is reduced to water:
RH + O2 + NADPH + H+ → ROH + H2O + NADP+
The reaction involves initial binding of the drug sub-strate to the ferric (Fe3+) form of cytochrome P450 (Fig.
2.10), followed by reduction (via a specific cytochromeP450 reductase) and then binding of molecular oxygen.Further reduction is followed by molecular rearrange-ment, with release of the reaction products and regen-eration of ferric cytochrome P450.
Oxidations at nitrogen and sulphur atoms are fre-quently performed by a second enzyme of the endoplas-mic reticulum, the flavin-containing mono-oxygenase,which also requires molecular oxygen and NADPH. Anumber of other enzymes, such as alcohol dehydro-genase, aldehyde oxidase and MAO, may be involved inthe oxidation of specific functional groups.
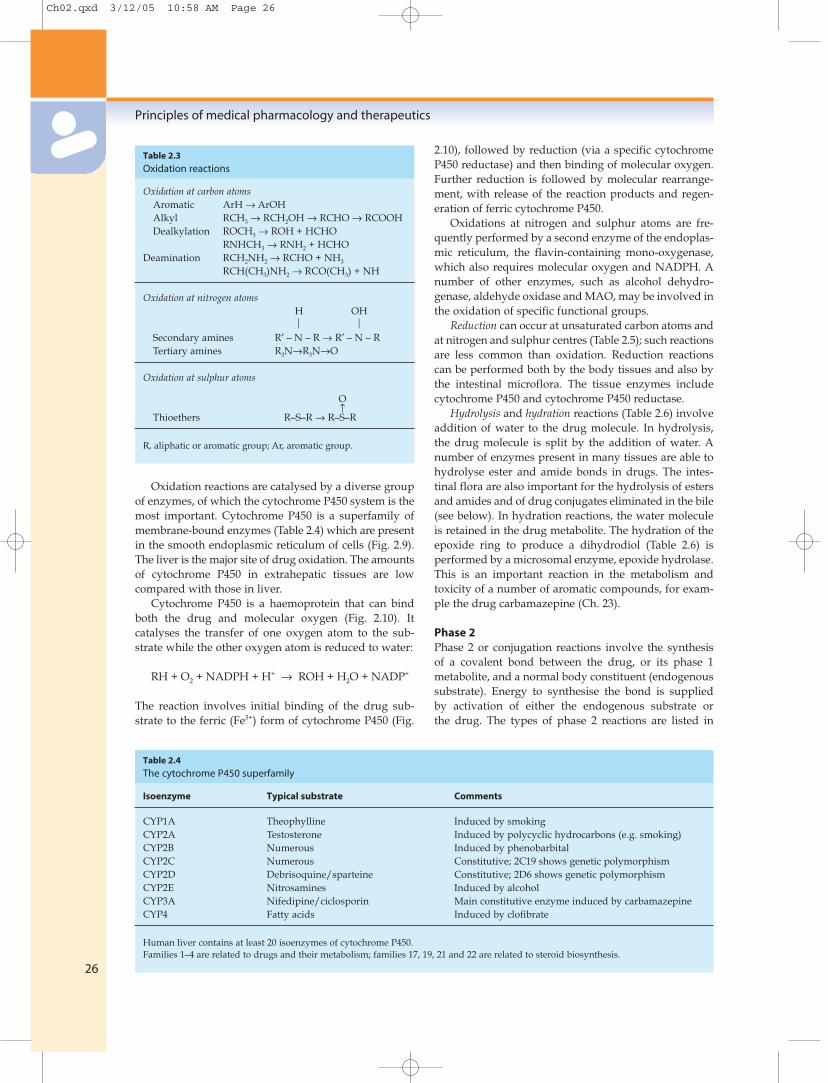
Reduction can occur at unsaturated carbon atoms andat nitrogen and sulphur centres (Table 2.5); such reactionsare less common than oxidation. Reduction reactionscan be performed both by the body tissues and also bythe intestinal microflora. The tissue enzymes includecytochrome P450 and cytochrome P450 reductase.
Hydrolysis and hydration reactions (Table 2.6) involveaddition of water to the drug molecule. In hydrolysis,the drug molecule is split by the addition of water. Anumber of enzymes present in many tissues are able tohydrolyse ester and amide bonds in drugs. The intes-tinal flora are also important for the hydrolysis of estersand amides and of drug conjugates eliminated in the bile(see below). In hydration reactions, the water moleculeis retained in the drug metabolite. The hydration of theepoxide ring to produce a dihydrodiol (Table 2.6) isperformed by a microsomal enzyme, epoxide hydrolase.This is an important reaction in the metabolism andtoxicity of a number of aromatic compounds, for exam-ple the drug carbamazepine (Ch. 23).
Phase 2Phase 2 or conjugation reactions involve the synthesisof a covalent bond between the drug, or its phase 1metabolite, and a normal body constituent (endogenoussubstrate). Energy to synthesise the bond is suppliedby activation of either the endogenous substrate orthe drug. The types of phase 2 reactions are listed in
Principles of medical pharmacology and therapeutics
26
Oxidation at carbon atomsAromatic ArH → ArOHAlkyl RCH3 → RCH2OH → RCHO → RCOOHDealkylation ROCH3 → ROH + HCHO
RNHCH3 → RNH2 + HCHODeamination RCH2NH2 → RCHO + NH3
RCH(CH3)NH2 → RCO(CH3) + NH
Oxidation at nitrogen atomsH OH
Secondary amines R′ – N – R → R′ – N – RTertiary amines R3N→R3N→O
Oxidation at sulphur atoms
O↑
Thioethers R–S–R → R–S–R
R, aliphatic or aromatic group; Ar, aromatic group.
Table 2.3
Oxidation reactions
Isoenzyme Typical substrate Comments
CYP1A Theophylline Induced by smokingCYP2A Testosterone Induced by polycyclic hydrocarbons (e.g. smoking)CYP2B Numerous Induced by phenobarbitalCYP2C Numerous Constitutive; 2C19 shows genetic polymorphismCYP2D Debrisoquine/sparteine Constitutive; 2D6 shows genetic polymorphismCYP2E Nitrosamines Induced by alcoholCYP3A Nifedipine/ciclosporin Main constitutive enzyme induced by carbamazepineCYP4 Fatty acids Induced by clofibrate
Human liver contains at least 20 isoenzymes of cytochrome P450.Families 1–4 are related to drugs and their metabolism; families 17, 19, 21 and 22 are related to steroid biosynthesis.
Table 2.4
The cytochrome P450 superfamily
Ch02.qxd 3/12/05 10:58 AM Page 26

Table 2.7, which shows the functional group necessaryin the drug molecule and the activated species for thereaction. In most cases, the reaction involves an acti-vated endogenous substrate. The products of conjuga-tion reactions are usually highly water soluble and with-out biological activity.
The activated endogenous substrate for glucuronide
synthesis is uridine-diphosphate glucuronic acid(UDPGA), which is synthesised from UDP-glucose. Theenzymes that transfer the glucuronic acid moiety to thedrug (UDP-glucuronyl transferases) occur in the endo-plasmic reticulum close to the cytochrome P450 system,the products of which frequently undergo glucuronida-tion (Fig. 2.9). Glucuronide synthesis occurs in many
Pharmacokinetics
27
2
D
CytochromeP450
Activesite
D
D incytosol
M
M
MS
D incytosol
M
MS
M
MGA
P450
Active
site
UPDGT
Phospholipidbilayer
D = DrugM = MetaboliteMGA = Metabolite–glucuronide conjugateMS = Metabolite–sulphate conjugate
ROH
H2O Fe3+
Fe3+ RH
Fe2+ RH
Fe2+ RHFe3+ RH
Fe3+ RH
O2_
O2
O2
e–
RH
e–
O22–
2H+
From reducedcytochrome b5or cytochromeP450 reductase
From NADPH-cytochrome P450reductase
Fig. 2.9Drug metabolism in the smooth endoplasmic reticulum. The lipid-soluble drug (D) partitions into the lipid bilayer of the endoplasmic reticulum.The cytochrome P450 oxidises the drug to a metabolite (M) that is more water soluble and diffuses out of the lipid layer. The metabolite mayundergo a phase 2 (conjugation) reaction with UDP-glucuronyl transferase (UDPGT) in the endoplasmic reticulum or sulphate in the cytosol, to givea glucuronide conjugate (MGA) or a sulphate conjugate (MS), respectively.
Fig. 2.10The oxidation of substrate (RH) by cytochrome P450. Fe3+, the active site of cytochrome P450 in its ferric state; RH, drug substrate; ROH, oxidisedmetabolite. Cytochrome b5 is present in the endoplasmic reticulum and can transfer an electron to cytochrome P450 as part of its redox reactions.
Ch02.qxd 3/12/05 10:58 AM Page 27
tissues, especially the gut wall and liver, where it maycontribute significantly to the first-pass metabolism ofsubstrates such as simple phenols.
In contrast, sulphate conjugation is performed by acytosolic enzyme, which utilises high-energy sulphate(3′-phosphoadenosine-5′-phosphosulphate or PAPS) asthe endogenous substrate. The capacity for sulphateconjugation is limited by the availability of PAPS, ratherthan the transferase enzyme. Sulphate conjugation ishighly dose-dependent, and saturation of sulphate con-jugation contributes to the metabolic events involved inthe liver toxicity seen in paracetamol (acetaminophen inthe USA) overdose (see Ch. 53).
The reactions of acetylation and methylation fre-quently decrease, rather than increase, polarity, becausethey block an ionisable functional group. These reac-tions mask potentially active functional groups suchas amino and catechol moieties, and the enzymes are
primarily involved in the inactivation of neurotrans-mitters such as noradrenaline or of local hormones suchas histamine.
The conjugation of drug carboxylic acid groups withamino acids is unusual because the drug is convertedto a high-energy form (a CoA derivative) prior to theformation of the conjugate bond. The enzymes involvedin the formation of the drug CoA derivatives areinvolved in the metabolism of intermediate-chain-length fatty acids. Conjugation of the drug CoAderivative with an amino acid is catalysed by trans-ferase enzymes.
Conjugation with the tripeptide glutathione (L-α-glutamyl-L-cysteinylglycine) is important in drugtoxicity. This reaction is catalysed by a family of trans-ferase enzymes and the product has a covalent bondbetween the drug, or its metabolite, and the thiol groupin the cysteine (Fig. 2.11). The substrates are often
Principles of medical pharmacology and therapeutics
28
Reduction at carbon atomsAldehydes RCHO → RCH2OHKetones RCOR → RCHOHR
Reduction at nitrogen atomsNitro groups ArNO2 → ArNO→ ArNHOH → ArNH2
Azo group ArN=NAr′ → ArNH2 + H2NAr′
Reduction at sulphur atoms
O↑
Sulphoxides R–S–R → R–S–RDisulphides R–S–S–R′ → RSH + HSR′
R, aliphatic or aromatic group; Ar, aromatic group.
Table 2.5
Reduction reactions
Reaction Functional Activated species Productgroup
Glucuronidation –OH UDPGA (uridine diphosphate –COOH glucuronic acid)–NH2
Sulphation –OH PAPS (3′-phosphoadenosine –O–SO3H–NH3 5′-phosphosulfate) –NH–SO3H
Acetylation –NH2 Acetyl-CoA –NH–COCH3
–NHNH2 – NHNH–COCH3
Methylation –OH S-Adenosyl methionine –OCH3
–NH2 –NHCH3
–SH –SCH3
Amino acid –COOH Drug-CoA CO-NHCHRCOOH
Glutathione Various – Glutathione conjugate
Table 2.7
Major conjugation reactions
Hydrolysis reactionsEstersRCO.OR′ → RCOOH + HOR′AmidesRCO.NHR′ → RCOH + H2NR′
Hydration reactionsEpoxides
R, R′, different aliphatic/aromatic groups.
Table 2.6
Hydrolysis and hydration reactions
O OH OHH H H H
C C C C
COOH
O O�Drug
Ch02.qxd 3/12/05 10:58 AM Page 28

reactive drugs or activated metabolites, which areinherently unstable (see Ch. 53), and the reaction canalso occur non-enzymatically. Glutathione conjuga-tion is a detoxication reaction in which glutathione acts as a scavenging agent to protect the cellfrom toxic damage. The initial glutathione conjugate under-goes a series of subsequent metabolic reactions, which illustrates the complexity of drug metabolism(Fig. 2.11).
A good example of a drug that undergoes a com-plex array of biotransformation reactions is diazepam(Fig. 2.12). Cytochrome P450-mediated oxidation andremoval of the N-methyl group (see Table 2.3) producesN-desmethyldiazepam, which retains biological activityat GABAA receptors. Both diazepam and N-desmethyl-diazepam undergo ring oxidation, giving temazepamand oxazepam, respectively, which are also used asanxiolytics and sedatives (see Ch. 20). Oxazepamand temazepam contain an aliphatic hydroxyl group,which is conjugated with glucuronic acid, giving aninactive, water-soluble excretory product. In addition,temazepam can undergo N-demethylation to giveoxazepam.
Pharmacokinetics
29
2
RX
R S CYS
GLU
GLY
Hydrolysis
R S Cysteine
Lyase
R SH
Further metabolism
Excretoryproduct
N-acetylation
GLU
CYS
GLY
HS
Glutathione transferaseor spontaneous reaction
GlutathioneUnstable drug orreactive metabolite
Fig. 2.11The formation and further metabolism of glutathione conjugates.
Fig. 2.12The pathways of metabolism of diazepam in humans. This figure illustrates that a single drug may generate a number of metabolites, which maypossess similar pharmacological properties. UDP-glucuronyl transferase (UDPGT) is the enzyme that transfers glucuronic acid from UDPGA to thealicyclic OH group.
Cytochrome P450
Cytochrome P450
Ring oxidation
N-demethylation
N
N
CH3O
Cl
Diazepam
UDPGT
Cytochrome P450
Water-solubleglucuronideconjugate
Water-solubleglucuronideconjugate
N-demethylation
N
N
CH3O
Cl
Temazepam
N
N
HO
Cl
Oxazepam
Cytochrome P450N
N
HO
Cl
Desmethyldiazepam(nordiazepam)
OH
UDPGTOH
Ring oxidation
Ch02.qxd 3/12/05 10:58 AM Page 29
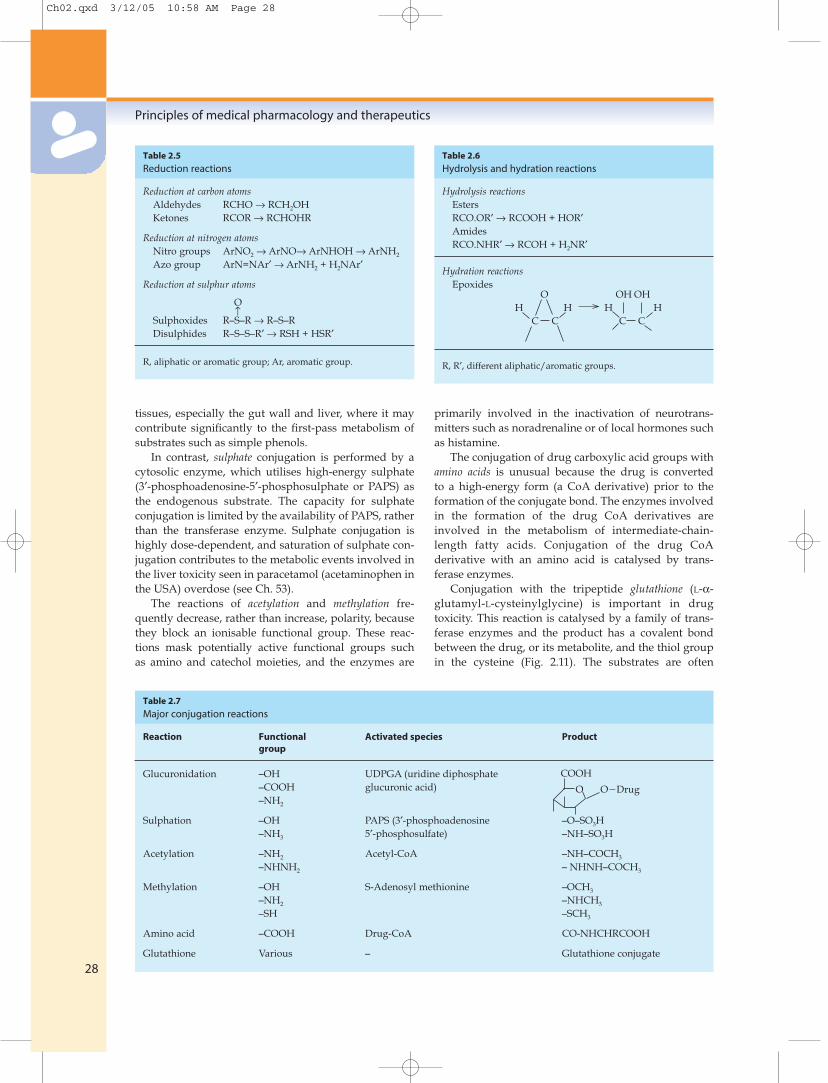
Factors affecting drug metabolismThe ability of individuals to metabolise drugs is deter-mined by their genetic constitution, their environmentand their physiological status.
Genetic constitutionThis is an increasingly important area of pharmacologyand is presented at the end of this chapter under Phar-macogenomics, pharmacogenetics and drug responses.
Environmental influencesThe activity of drug-metabolising enzymes, especiallythe cytochrome P450 system, can be increased or inhibitedby foreign compounds such as environmental contami-nants and therapeutic drugs. Induction of cytochromeP450 results in increased synthesis of the haemoproteinfollowing exposure to the inducing agent. Environ-mental contaminants such as organochlorine pesticides(e.g. DDT) and polycyclic aromatic hydrocarbons (e.g.benzo[a]pyrene in cigarette smoke) induce the CYP1Aand CYP2A isoenzymes (Table 2.4). Therapeutic drugscan induce members of the CYP2, CYP3 and CYP4families (Table 2.8). Chronic consumption of alcoholinduces CYP2E. Induction of cytochrome P450isoenzymes occurs over a period of a few days, duringwhich the inducer interacts with nuclear receptors toincrease the transcription of the mRNA, followingwhich the additional enzyme is synthesised. Theincreased amounts of the enzyme last for a few daysafter the removal of the inducing agent, during whichthe extra enzyme is removed by normal protein turn-over. In contrast, inhibition of drug-metabolisingenzymes is by direct reversible competition for theenzyme site and the time course follows closely theabsorption and elimination of the inhibitor substance. Anumber of drugs (Table 2.8) can produce clinicallysignificant drug interactions because of their inductionor inhibition of cytochrome P450 enzymes. Suchchanges in hepatic metabolism can affect both thebioavailability and clearance of drugs undergoinghepatic elimination (see below).
Physiological statusThe functional capacity of the drug-metabolisingenzymes is dependent on both the intrinsic enzymeactivity and the delivery of drug to the site of metab-olism via the circulation. Drug metabolism, and henceclearance and half-life (see below), for most drugs, isaffected significantly by age (the very young and theelderly) and by liver disease. This is discussed in detailin Chapter 56.
ExcretionDrugs and their metabolites may be eliminated from thecirculation by various routes:
● in fluids (urine, bile, sweat, tears, milk, etc.): theseroutes are most important for low-molecular-weightpolar compounds, and the urine is the major route;milk is important because of the potential forexposure of the breastfed infant
● in solids (faeces, hair, etc.): drugs enter thegastrointestinal tract by various mechanisms (seebelow) and faecal elimination is most important forhigh-molecular-weight compounds; thesequestration of foreign compounds into hair is notof quantitative importance, because of the slowgrowth of hair, but distribution of a drug along thehair can be used to indicate the history of drugintake during the preceding weeks
● in gases (expired air): this route is only ofimportance for volatile compounds.
Excretion via the urineThere are three processes involved in the handling ofdrugs and their metabolites in the kidney: glomerularfiltration, reabsorption and tubular secretion. The totalurinary excretion of a drug depends on the balance ofthese three processes: total excretion equals glomerularfiltration plus tubular secretion minus any reabsorption.
Glomerular filtration. All molecules less than about20 kDa undergo filtration under positive hydrostaticpressure through the pores of 7–8 nm in the glomerularmembrane. The glomerular filtrate contains about 20%of the plasma volume delivered to the glomerulus, andabout 20% of water-soluble, low-molecular-weight com-pounds in plasma, including non-protein-bound drugs,enter the filtrate. Plasma proteins and protein-bounddrug are not filtered; therefore, the efficiency ofglomerular filtration for a drug is influenced by theextent of plasma-protein binding.
Reabsorption. The glomerular filtrate containsnumerous constituents that the body cannot afford tolose. There are specific tubular uptake processes forcarbohydrates, amino acids, vitamins, etc. and most ofthe water is also reabsorbed. Drugs may pass back fromthe tubule into the plasma if they are substrates for thesespecific uptake processes (very rare) or if they are lipid
Principles of medical pharmacology and therapeutics
30
Inducers Inhibitors
Barbiturates (esp. phenobarbital) CimetidinePhenytoin AllopurinolCarbamazepine IsoniazidGrisofulvin ChloramphenicolRifampicin (rifampin) DisulfiramGlutethimide Quinine
Erythromycin
Table 2.8
Common inducers and inhibitors of cytochrome P450
Ch02.qxd 3/12/05 10:58 AM Page 30
soluble. The urine is concentrated on its passage downthe renal tubule and the tubule-to-plasma concentrationgradient increases, so that only the most polar and leastdiffusible molecules will remain in the urine. Because ofextensive reabsorption, lipid-soluble drugs are noteliminated via the urine, and are retained in thecirculation until they are metabolised to water-solubleproducts (see above), which are efficiently removedfrom the body. The pH of urine is usually less than thatof plasma; consequently, pH partitioning, between urine(pH 5–6) and plasma (pH 7.4), may either increase ordecrease the tendency of the compound to bereabsorbed (see above).
Tubular secretion. The renal tubule has secretorytransporters on both the basolateral and apical mem-branes for compounds that are acidic (organic aniontransporters – OATs 1–4) or basic (organic cation trans-porters – OCTs 1–3). In addition, there are multidrugresistance-associated proteins (MRPs), which wereoriginally identified in a cell line resistant to anticancerdrugs but have since been found as important trans-porters in various tissues. Drugs and their metabolites(especially the glucuronic acid and sulphate conjugates)may undergo an active carrier-mediated elimination,primarily by OATs but also by MRPs. Because secretionlowers the plasma concentration of unbound drug by anactive process, there will be a rapid dissociation of anydrug–protein complex; as a result, even highly protein-bound drugs may be cleared almost completely fromthe blood in a single passage through the kidney.
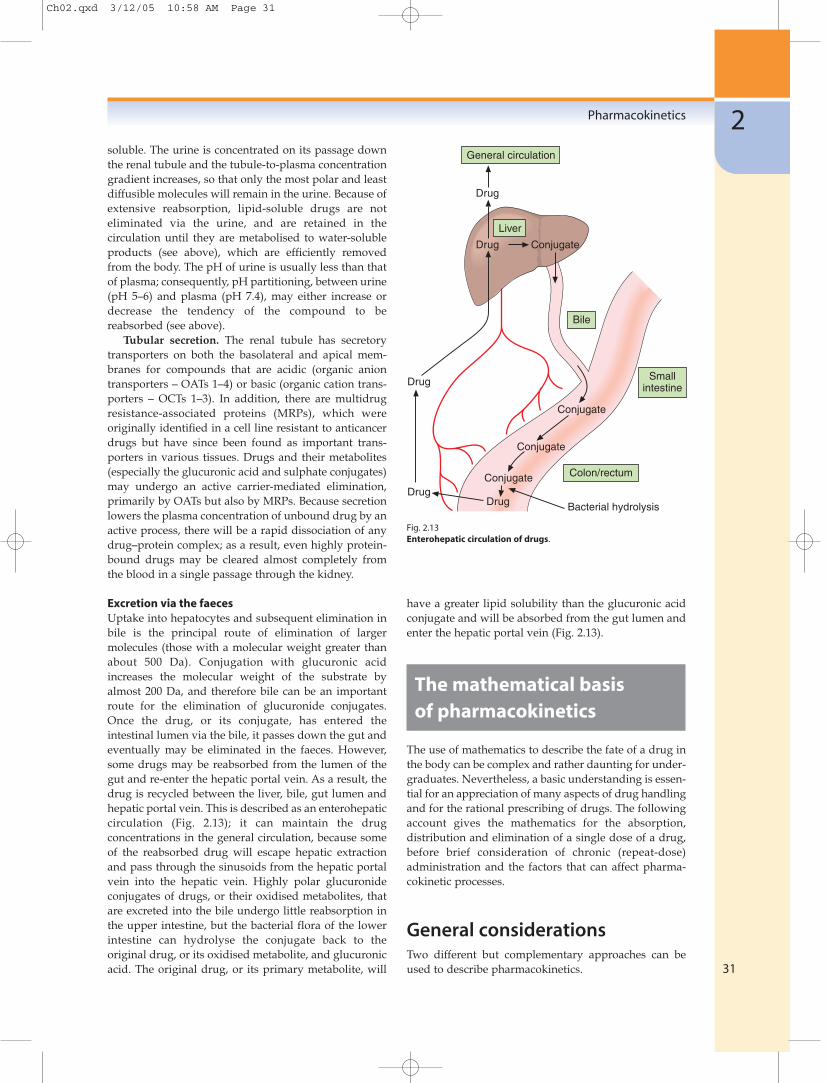
Excretion via the faecesUptake into hepatocytes and subsequent elimination inbile is the principal route of elimination of largermolecules (those with a molecular weight greater thanabout 500 Da). Conjugation with glucuronic acidincreases the molecular weight of the substrate byalmost 200 Da, and therefore bile can be an importantroute for the elimination of glucuronide conjugates.Once the drug, or its conjugate, has entered theintestinal lumen via the bile, it passes down the gut andeventually may be eliminated in the faeces. However,some drugs may be reabsorbed from the lumen of thegut and re-enter the hepatic portal vein. As a result, thedrug is recycled between the liver, bile, gut lumen andhepatic portal vein. This is described as an enterohepaticcirculation (Fig. 2.13); it can maintain the drugconcentrations in the general circulation, because someof the reabsorbed drug will escape hepatic extractionand pass through the sinusoids from the hepatic portalvein into the hepatic vein. Highly polar glucuronideconjugates of drugs, or their oxidised metabolites, thatare excreted into the bile undergo little reabsorption inthe upper intestine, but the bacterial flora of the lowerintestine can hydrolyse the conjugate back to theoriginal drug, or its oxidised metabolite, and glucuronicacid. The original drug, or its primary metabolite, will
have a greater lipid solubility than the glucuronic acidconjugate and will be absorbed from the gut lumen andenter the hepatic portal vein (Fig. 2.13).
The mathematical basisof pharmacokinetics
The use of mathematics to describe the fate of a drug inthe body can be complex and rather daunting for under-graduates. Nevertheless, a basic understanding is essen-tial for an appreciation of many aspects of drug handlingand for the rational prescribing of drugs. The followingaccount gives the mathematics for the absorption,distribution and elimination of a single dose of a drug,before brief consideration of chronic (repeat-dose)administration and the factors that can affect pharma-cokinetic processes.
General considerationsTwo different but complementary approaches can beused to describe pharmacokinetics.
Pharmacokinetics
31
2General circulation
Bile
Drug
Drug Conjugate
Liver
Conjugate
Conjugate
Conjugate
DrugDrug
Drug
Smallintestine
Colon/rectum
Bacterial hydrolysis
Fig. 2.13Enterohepatic circulation of drugs.
Ch02.qxd 3/12/05 10:58 AM Page 31

● Compartmental model analysis. Plasmaconcentration–time curves are described by anequation containing one or more exponentialfunctions. This approach gives a precise mathematicaldescription of the concentration–time curve and canbe used to predict the concentration of drug at anytime after a dose. However, it is difficult to relate themathematical values to the physiological dispositionof the compound.
● Model-independent analysis. This approach may berelated more closely to the physiological processesgoverning the disposition of the chemical. It is moreuseful in predicting the influence of variables suchas disease, age and the administration of othercompounds on the concentrations of the drug.
Some undergraduate texts provide details of compart-mental analysis, but the model-independent methodsare of greater potential value to medical undergraduatesand are the basis of the following account.
The three basic processes that need to be describedmathematically are absorption, distribution and elimi-nation. For each process, it is important to know the rateor speed with which the drug is processed and the extentof the process, i.e. the amount or proportion of drug thatundergoes that process.
For nearly all physiological and metabolic processes,the rate of reaction is proportional to the amount of sub-strate (drug) available: this is described as a first-orderreaction. Diffusion down a concentration gradient andglomerular filtration are examples of first-order reac-tions. Protein-mediated reactions, such as metabolismand active transport, are also first-order at low concen-trations because if the concentration of the substate isdoubled, then the formation of product is doubled.However, as the substrate concentration increases, theenzyme or transporter can become saturated with sub-strate and the rate of reaction cannot increase inresponse to a further increase in concentration. Theprocess then occurs at a fixed maximum rate that isindependent of substrate concentration, and the reac-tion is described as a zero-order reaction; examples are themetabolism of ethanol (Ch. 54) and phenytoin (Ch. 23).When the substrate concentration has decreased suffi-ciently for protein sites to become available again, thenthe change in concentration will proceed at a rateproportional to the concentration available – in otherwords, the reaction will revert to first-order.
Zero-order reactionsIf a drug is being processed (absorbed, distributed oreliminated) according to zero-order kinetics, then thechange in concentration with time (dC/dt) is a fixedamount per time – independent of concentration:
dC
dt= –k (2.2)
The units of k (the reaction rate constant) will be anamount per unit time (e.g. mg min−1). A graph of concen-tration against time will produce a straight line with aslope of −k (Fig. 2.14a).
First-order reactionsIn first-order reactions, the change in concentration atany time (dC/dt) is proportional to the concentrationpresent at that time:
dC
dt= –kC (2.3)
The units of the rate constant, k, are time−1 (e.g. h−1), andk may be regarded as the proportional change per unitof time. The rate of change will be high at high con-centrations but low at low concentrations (Fig. 2.14b),and a graph of concentration against time will producean exponential decrease. Such a curve can be describedby an exponential equation:
C = C0e−kt (2.4)
where C is the concentration at time t and C0 is the initialconcentration (when time = 0). This equation may bewritten more simply by taking natural logarithms:
lnC = lnC0 − kt (2.5)
and a graph of lnC against time will produce a straightline with a slope of −k and an intercept of lnC0
(Fig. 2.14c).The units of k (which are time−1, e.g. h−1) are difficult
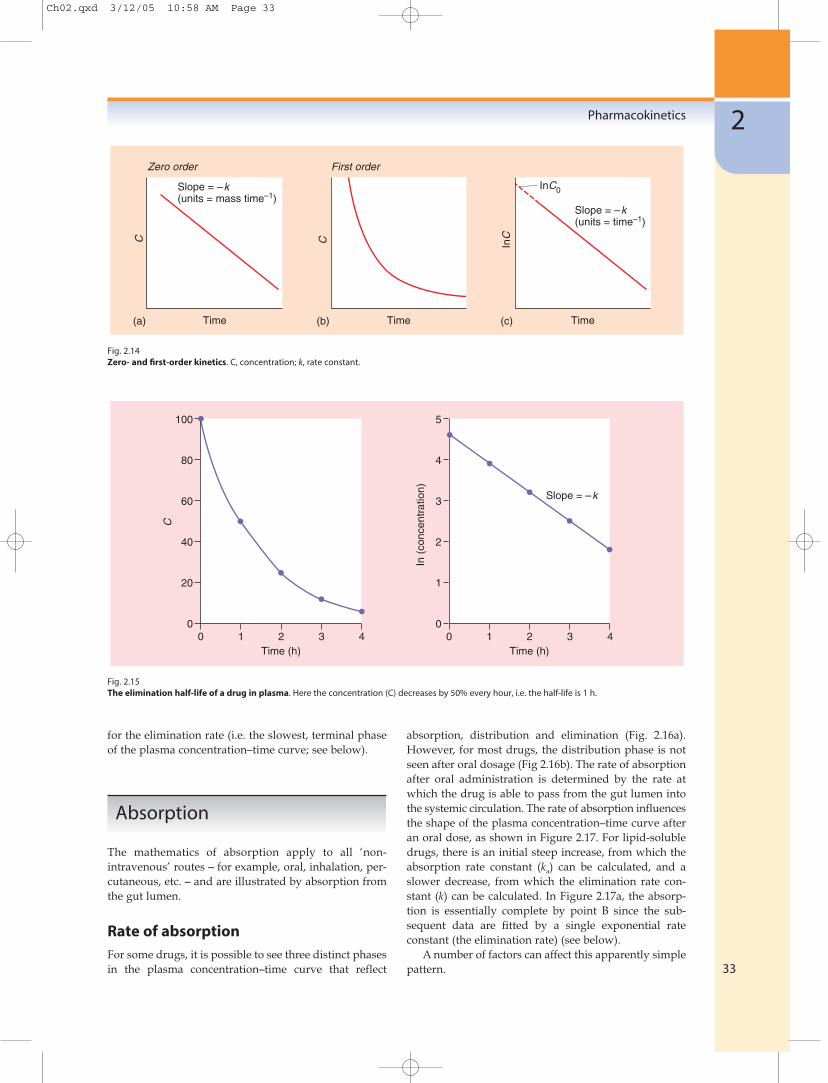
to use practically, and therefore the rate of a first-orderreaction is usually described in terms of its half-life(which has units of time). The half-life is the time takenfor a concentration to decrease to one-half. The half-lifeis independent of concentration (Fig. 2.15) and is acharacteristic for that particular first-order process andthat particular drug. The decrease in plasma concentra-tion after an intravenous bolus dose is shown in Figure2.15, which has been plotted such that the concentrationis halved every hour.
The relationship between the half-life and the rateconstant is derived by substituting C0 = 2 and C = 1 intothe above equation, when the time interval t will be onehalf-life (t1⁄2).
ln1 = ln2 − kt1⁄2 (2.6)
0 = 0.693 − kt1⁄2
0.693t1/2 = k
A half-life can be calculated for any first-order process(e.g. for absorption, distribution or elimination); inpractice, the ‘half-life’ reported for a drug is the half-life
Principles of medical pharmacology and therapeutics
32
Ch02.qxd 3/12/05 10:58 AM Page 32
for the elimination rate (i.e. the slowest, terminal phaseof the plasma concentration–time curve; see below).
Absorption
The mathematics of absorption apply to all ‘non-intravenous’ routes – for example, oral, inhalation, per-cutaneous, etc. – and are illustrated by absorption fromthe gut lumen.
Rate of absorptionFor some drugs, it is possible to see three distinct phasesin the plasma concentration–time curve that reflect
absorption, distribution and elimination (Fig. 2.16a).However, for most drugs, the distribution phase is notseen after oral dosage (Fig 2.16b). The rate of absorptionafter oral administration is determined by the rate atwhich the drug is able to pass from the gut lumen intothe systemic circulation. The rate of absorption influencesthe shape of the plasma concentration–time curve afteran oral dose, as shown in Figure 2.17. For lipid-solubledrugs, there is an initial steep increase, from which theabsorption rate constant (ka) can be calculated, and aslower decrease, from which the elimination rate con-stant (k) can be calculated. In Figure 2.17a, the absorp-tion is essentially complete by point B since the sub-sequent data are fitted by a single exponential rateconstant (the elimination rate) (see below).
A number of factors can affect this apparently simplepattern.
Pharmacokinetics
33
2C
Slope = –k(units = mass time–1)
Time Time Time
Slope = –k(units = time–1)
InC0
(a)
Zero order
(b)
First order
C InC
(c)
100
80
60
40
20
00 1 2 3 4
5
4
3
2
1
00 1 2 3 4
Time (h) Time (h)
C
In (
conc
entr
atio
n)
Slope = –k
Fig. 2.14Zero- and first-order kinetics. C, concentration; k, rate constant.
Fig. 2.15The elimination half-life of a drug in plasma. Here the concentration (C) decreases by 50% every hour, i.e. the half-life is 1 h.
Ch02.qxd 3/12/05 10:58 AM Page 33

● Gastric emptying. Basic drugs undergo negligibleabsorption from the stomach (see above). Inconsequence, there can be a delay of up to an hourbetween drug administration and the detection ofdrug in the general circulation (Fig. 2.17b).
● Food. The pattern of absorption can be affected bychanges in gastric emptying (Fig. 2.17b) and food canalter the absorption rate, i.e. value of ka (Fig. 2.17c).
● Decomposition or first-pass metabolism prior to orduring absorption. This will reduce the amount of
drug that reaches the general circulation but will notaffect the rate of absorption (which is usuallydetermined by lipid solubility). Therefore, the curveis parallel but at lower concentrations (Fig. 2.17d).
● Modified-release formulation. If a drug is eliminatedrapidly, the plasma concentrations will show rapidfluctuations during regular oral dosing, and patientsmay have to take the drug at very frequent intervals.This can be avoided by giving a tablet that releasesdrug at a slow and predictable rate over many
Principles of medical pharmacology and therapeutics
34
(a) Rate of absorption > rate of distribution
Time after dosage
Pla
sma
drug
conc
entr
atio
n
Absorption phaseDistribution phaseElimination phase
(b) Rate of absorption < rate of distribution
Time after dosage
Pla
sma
drug
conc
entr
atio
n
Absorption phaseDistribution phaseElimination phase
(a)
(b)
(d)
(c)
(e)
TimeA
In C
Slope determinedby ka
B
C
Slope = –k
In C
In C
ATime Time
Time Time
In C
In C
–k–k
Slope = –kdiss
–k–k
Fig. 2.16Plasma concentration–time profiles after oral administration. The processes of distribution and elimination start as soon as some of the drug hasentered the general circulation. A clear distribution phase is seen if the rate of absorption is extremely rapid, so that absorption is complete beforedistribution is finished (Fig. 2.16a). For most drugs, the rate of absorption is slow compared with the rate of distribution, and distribution occurs asrapidly as the drug is absorbed; therefore, distribution is complete when absorption is complete, and a clear distribution phase is not seen (Fig 2.16b).
Fig. 2.17Plasma concentration–time curves following oral administration. (a) General profile (A, start of absorption; B, end of absorption; B–C, elimination[rate = k]) (this ‘normal’ profile is repeated as a green line in panels b–e). (b) Influence of gastric emptying: there is a delay between t = 0 and A. (c)Influence of food: slower absorption results in a reduction in the absorption rate constant (ka) derived from A–B. (d) Decrease in bioavailability(owing to incomplete dissolution of formulation, decomposition, increased first-pass metabolism). (e) Slow-release formulation: the rate at which thedrug can be eliminated is limited by the rate at which the formulation disintegrates (kdiss).
Ch02.qxd 3/12/05 10:58 AM Page 34

hours: a modified-release formulation. The profile isaffected by continuing absorption from the intestine,and the terminal slope of the concentration–timecurve is then determined by the dissolution rate ofthe oral formulation, not by the elimination of thedrug from the circulation (Fig. 2.17e).
Extent of absorptionThe parameter that measures the extent of absorption istermed the bioavailability (F). This is defined as the frac-tion of the administered dose that reaches the systemic circu-lation as the parent drug (not as metabolites). For oraladministration, incomplete bioavailability (F<1) mayresult from:
● incomplete absorption and loss in the faeces, eitherbecause the molecule is too polar to be absorbed orbecause the tablet did not release all of its contents
● first-pass metabolism, in the gut lumen, duringpassage across the gut wall or by the liver prior tothe drug reaching the systemic circulation.
The bioavailability of a drug has important therapeuticimplications, because it is the major factor determiningthe dosage requirements for different routes of adminis-tration. For example, if a drug has an oral bioavailabilityof 0.1, the oral dose needed for therapeutic effectivenesswill need to be 10 times higher than the correspondingintravenous dose.
The bioavailability of a drug is normally determinedby comparison of plasma concentration data obtainedafter oral administration (when the fraction F enters thegeneral circulation as the parent drug) with data follow-ing intravenous administration (when, by definition,100% enters the general circulation as the parent drug).The amount in the circulation cannot be compared atonly one time point, because intravenous and oraldosing show different concentration–time profiles. Thisis avoided by using the total area under the plasmaconcentration–time curve (AUC) from t = 0 to t = infinity(which is a reflection of the total amount of drug thathas entered the general circulation):
F =AUCoral (2.7)AUCiv
if the oral and intravenous (iv) doses are equal or
F =AUCoral × Doseiv (2.8)AUCiv × Doseoral
if different doses are used.This calculation assumes that the elimination (clear-
ance – see below) is first-order. The AUC is a reflectionof overall body exposure and is discussed below underclearance.
An alternative method to calculate F is to measurethe total urinary excretion of the parent drug (Aex) fol-lowing oral and intravenous doses (even in situationswhere the urine is a minor route of elimination), and:
F =Aexoral (2.9)Aexiv
for two equal doses.
Distribution
Distribution of a drug is the reversible movement of theparent drug from the blood into the tissues duringadministration and its re-entry from tissue into blood asthe parent drug during elimination.
Rate of distributionBecause distribution is usually more rapid than absorp-tion from the intestine (Fig. 2.16b), the rate of distribu-tion can be measured reliably only following an intra-venous bolus dose. Some drugs reach equilibriumbetween blood/plasma and tissues very rapidly and adistinct distribution phase is not apparent, and only theterminal elimination phase is seen after an intravenousinjection (Fig. 2.18a). Most drugs take a finite time todistribute into, and equilibrate with, the tissues, whichresults in a rapid distribution phase (Slope A–B in Fig.2.18b, which has a high rate constant), prior to the slowerterminal elimination phase (slope B–C in Fig. 2.18b,which has a lower rate constant). In Figure 2.18b, theprocesses of distribution are complete by point B. Theconcentration–time curve in Figure 2.18b cannot bedescribed by a single exponential term, and two first-order rates occur. By convention, the faster (distribution)rate is termed α and the slower (elimination) rate β. Thedistribution rate constant (α) cannot be derived directlyfrom the slope A–B, because both distribution and elimi-nation start as soon as the drug enters the body and A–Brepresents the summation of both processes. Backextrapolation of the terminal (β) phase gives an initialconcentration at point D, which is the value that wouldhave been obtained if distribution had been instanta-neous. In practice, the distribution rate (α) is calculatedfor the difference between the line D–B for each timepoint and the actual concentration measured (given bythe line A–B in Fig. 2.18b). The rate of distribution isonly occasionally of clinical relevance. The time delaybetween an intravenous bolus dose and the responsemay be caused by the time taken for distribution to thesite of action. Redistribution of intravenous drugs, suchas thiopental (Ch. 17), may limit the duration of action(see Fig. 2.6).
Pharmacokinetics
35
2
Ch02.qxd 3/12/05 10:58 AM Page 35

Instantaneous and slow distributions are describedby different mathematical models: the former is des-cribed as a one-compartment model (Fig. 2.18a), in whichall tissues are in equilibrium instantaneously; the latteris described as a two-compartment model (Fig. 2.18b), inwhich the drug initially enters and reaches instanta-neous equilibrium with one compartment (blood andpossibly well-perfused tissues) prior to equilibratingmore slowly with a second compartment (possiblypoorly perfused tissues; refer back to Fig. 2.6). This isshown schematically in Figure 2.19.
The rate of distribution is dependent on two mainvariables:
● for water-soluble drugs, the rate of distributiondepends on the rate of passage across membranes,i.e. the diffusion characteristics of the drug
● for lipid-soluble drugs, the rate of distributiondepends on the rate of delivery (the blood flow) tothose tissues, such as adipose, that accumulate thedrug.
For some drugs, the natural logarithm of the plasmaconcentration–time curve shows three distinct phases;such curves require three exponential rates and repre-sent a three-compartment model. Although two- or three-compartment models may be necessary to give amathematical description of the data, they are of limitedpractical value.
Extent of distributionThe extent of distribution of a drug from plasma intotissues is of clinical importance because it determinesthe relationship between the measurable plasma con-centration and the total amount of drug in the body(body burden). In consequence, the extent of distribu-tion determines the amount of a drug that has to beadministered in order to produce a particular plasmaconcentration (see below).
The extent of distribution of a drug from blood orplasma into tissues can be determined in animals bymeasuring concentrations in both blood and all the
Principles of medical pharmacology and therapeutics
36
β
α β
A
B
InC
Time
Slope = –k
Model
Dose V k
One-compartment
C = C0e–kt
(a) Instantaneous distribution
A
BInC
Time
Slope = –
Model
Dose V1k21
Two-compartment
(b) Slower distribution
C
k12V2
k10
C = Xe– t + Ye– t
D
Fig. 2.18Plasma concentration–time curves for the distribution of drugs into one- and two-compartment models. The terms k, α, β, k10, k12, k21, are rateconstants; α and β are composite rate constants which define the distribution and elimination rates. The terms α and β relate to distribution (k12 ork21) and elimination (k10) processes and are determined by k10, k12, and k21. V are volumes of distribution, and X and Y are constants. (Note: theequation for a two-compartment system is usually written as C = Ae−αt + Be−βt, where A and B are constants equivalent to X and Y; X and Y were usedto avoid confusion with points A and B on the graph.)
Ch02.qxd 3/12/05 10:58 AM Page 36

tissues of the body. However, in humans, only the con-centration in blood or plasma can be measured, andtherefore the extent of distribution has to be estimatedfrom the amount remaining in blood, or more usuallyplasma, after completion of distribution.
The parameter that describes the extent of distribu-tion is the apparent volume of distribution (V), where:
V =Total amount of drug in the body
(2.10)Plasma concentration
The apparent volume of distribution is a characteristicproperty of the drug that, like half-life, bioavailabilityand clearance, is independent of dose. In the simpleexample shown by Figure 2.18a, if a dose of 50 mg of aparticular drug is injected, this will mix instantaneouslyinto the apparent volume of distribution V. If the initialplasma concentration is 1 µg ml−1 (equivalent to point Aon Fig. 2.18a), then the apparent volume of distributionwill be given by:
V =Total amount (dose)
=50 000 µg
= 50 000 ml = 50 lPlasma concentration 1 µg ml–1
In other words, after giving the dose, it appears that thedrug has been dissolved in 50 litres of plasma. However,plasma volume is only 3 litres and, therefore, much of thedrug must have left the plasma and entered tissues, inorder to give the low concentration present (1 µg ml−1).The clinical relevance of V is shown when a physicianneeds to calculate how much drug should be given toa patient in order to produce a specific desired plasmaconcentration. If an initial plasma concentration of2.5 µg ml−1 of the same drug were needed for a clinicaleffect, this would be produced by giving a dose of[plasma concentration × V] or [2.5 µg ml−1 × 50 000 ml] –that is, 125 000 µg or 125 mg.
In the more complex example shown in Figure 2.18b,the dose of 50 mg will distribute instantaneously onlyinto V1, which is usually termed the central compartment,and will usually comprise plasma and well-perfusedtissues. Measurement of the initial concentration (pointA in Fig. 2.18b) will not represent distribution into V2
and the volume calculated using point A will under-represent the true extent of distribution (see Fig. 2.19).Distribution into V2, which is usually termed the periph-eral compartment and will usually comprise poorly per-fused tissues, is not complete until point B in Figure 2.18b.However, by the time point B is reached, there will havebeen considerable elimination, and so the total amountof drug in the body is no longer known. This can beovercome by using the elimination phase (B–C in Fig.2.18b) to back-extrapolate to the intercept (point D),which is the concentration that would have beenobtained if distribution into V2 had been instantaneous(see Equation 2.10):
V =Dose
(2.11)Concentration at point D
Alternative equations for the calculation of V are pre-sented below.
V is not a physiological volume but simply a reflec-tion of the amount of drug remaining in the blood orplasma after distribution and provides no informationon where the drug has been taken up. Thus, a high valuefor V could result from either reversible accumulationin adipose tissue (owing to dissolution in fat) orreversible accumulation in liver and lung (owing to highintracellular protein binding). The actual tissue distri-bution can be determined only by measurement oftissue concentrations.
The value of V is usually calculated using the totalconcentration in plasma – that is, free (unbound) drugplus protein-bound drug. A low value for V can result ifa drug is highly bound to plasma proteins but not totissue proteins; if the drug shows an even higher affinityfor tissue (lipid or protein; see Fig. 2.3), then it will have
Pharmacokinetics
37
2
Dose
Elimination
Elimination
Elimination
Elimination
Doseadministration
Instantaneousequilibrationwith V1
Equilibrationbetween V1and V2
Eliminationfrom V1 lowersconcentrationsin V1 and V2 in
parallel
V1 V2
V2V1
V2V1
V2V1
Fig. 2.19Schematic diagram of drug distribution. (Note, at equilibrium, thetotal concentrations in V1 and V2 may be different, because of proteinbinding, etc.)
Ch02.qxd 3/12/05 10:58 AM Page 37

a high value for V. The term V reflects the relative affinityof plasma and tissues for a drug, and there is no simplerelationship between plasma-protein binding and V(Table 2.9).
If the tissues have a very high affinity for the drug,the value of V will be extremely high and may greatlyexceed the bodyweight. Chloroquine is a good exampleof such a drug (Table 2.9) and the value illustrates clearlythat V should be regarded as a mathematical ratio (notas an indication of physiological distribution to anactual volume of plasma!).
The term V represents the volume of plasma that hasto be cleared of drug by the organs of elimination, suchas the liver and kidneys, which extract the drug from theplasma and remove it from the body by metabolism orexcretion. It is independent of dose or concentration.Because V is constant, a twofold increase in plasma con-centration will be accompanied by a twofold increase inthe total amount of drug in the body (Equation 2.10).Although apparent volume of distribution may seem arather abstract (and possibly even irrelevant) parameter,it is important for two reasons. Firstly, it is the parameterthat relates the total body drug load present at any timeto the plasma concentration. Secondly, together withclearance, it determines the overall elimination rate con-stant (k) and therefore the half-life. The half-life deter-mines the duration of action of a single dose, the timeinterval between doses on repeated dosage and thepotential for accumulation (see below).
Elimination
Elimination can also be described in terms of both rateand extent. The rate at which the drug is eliminated isimportant because it usually determines the duration ofresponse, the time interval between doses, and the timeto reach equilibrium during repeated dosing. The extentof elimination is eventually 100%. The route ofelimination is important because it can determine theeffects of renal/liver disease, age and drug interactions.
Rate of eliminationThe rate of elimination is usually indicated by the ter-minal half-life – that is, the half-life for the final (slowest)rate (k in Fig. 2.18a; β in Fig. 2.18b). The elimination half-lives of drugs range from a few minutes to many days(and, in rare cases, weeks). Precise knowledge about thehalf-life of every drug is not necessary and, therefore, inthis book we have used the descriptive terms given inTable 2.10 to indicate the approximate half-life and theinfluence this would have on clinical use of the drug.
The rate at which a drug can be eliminated from thebody, and therefore the half-life, is determined by twoindependent, biologically-determined variables: theactivity of the mechanisms metabolising/excreting the drug and the extent of movement of drug from theblood into tissues.
The activity of the metabolising enzymes or excre-tory mechanisms. The organs of elimination (usuallyliver and kidneys) remove drug that is brought to themvia the blood. Providing that first-order kinetics apply(in other words, the process is not saturated), a constantproportion of the drug carried in the blood will beremoved on each passage through the organ of elimi-nation, independent of the concentration in the blood. In
Principles of medical pharmacology and therapeutics
38
Description Half-life Doses per day for Comment(h) chronic treatment
Very short <1 – A modified-release formulation may be preferredShort 1–6 3–4 A modified-release formulation may be preferredIntermediate 6–12 1–2Long 12–24 1 Once-daily dosage may be adequateVery long >24 1 Potential for accumulation
Table 2.10
Half-life descriptions used in this book
Drug V Binding (%)(� kg–1)
Warfarin and furosemide 0.1 99Aspirin 0.2 49Gentamicin 0.3 <10Propranolol 3.9 93Nortriptyline 18.5 95Chloroquine 185.7 61
Note: V is given in �/kg body weight; therefore, forchloroquine, the total volume of distribution will be 13 000 �per 70 kg patient.
Table 2.9
The apparent volume of distribution (V) and plasma-proteinbinding of selected drugs
Ch02.qxd 3/12/05 10:58 AM Page 38

effect, this is equivalent to a constant proportion of theblood flow to the organ being cleared of drug. The moreactive the process (e.g. hepatic metabolism), the greaterwill be the proportion of the blood flow cleared of drugon one passage through the organ. For example, if 10%of the drug carried to the liver by the plasma (at a flowrate of 800 ml min–1) is cleared, by uptake and metabo-lism, this is equivalent to a clearance of 10% of theplasma flow (80 ml min–1); if 20% of the drug is cleared,this gives a clearance of 160 ml min–1. The proportion ofthe blood flow cleared of drug will have units of volumeper time (e.g. ml min–1). The plasma clearance (CL) of thedrug is the sum of all clearance processes (metabolism +renal + bile + exhalation + etc.) and is the volume ofplasma cleared of drug per unit time; it is the best indi-cation of the overall activity of the elimination processes.
CL =Rate of elimination from the body
(2.12)Plasma concentration
For exampleµg min–1
= ml min–1
µg ml–1
The plasma clearance is a characteristic value for aparticular drug (see Table 2.11), is a constant for first-order (non-saturated) reactions, and is independent ofdose or concentration. Because clearance is constant(Equation 2.12), a twofold increase in plasma concen-tration will be accompanied by a twofold increase in therate of elimination. The greater the value of plasmaclearance, the greater will be the rate at which the drugwill be removed from the body, i.e. the elimination rateconstant (k) is proportional to plasma clearance.
Reversible passage of drug from the blood intotissues. The organs of elimination can only act on drugthat is delivered to them via the blood supply. If, after
equilibration with tissues, the blood or plasma concen-tration is very low, then V is very high. The low plasmaconcentration will result in a low rate of elimination fromthe body; in other words, the rate at which the drug canbe eliminated will be limited by the extent of tissuedistribution. Therefore, the elimination rate constant (k)is inversely proportional to the apparent volume ofdistribution.
k ∝1 (2.13)
V
Plasma clearanceThe overall rate of elimination is dependent on the twovariables, the volume of plasma cleared per minute (CL)and the total apparent volume of plasma that has to becleared (V):
k =CL
(2.14)V
or
t1⁄2 =0.693V
since t1⁄2 =0.693
CL k
This is illustrated in Figure 2.20 and Table 2.11. Theelimination rate constant (or half-life) is the best indi-cation of changes in drug concentration with time, andfor many drugs this will relate to changes in therapeuticactivity following a single dose. Clearance is the bestmeasurement of the ability of the organs of eliminationto remove the drug and determines the average plasmaconcentrations (and therefore therapeutic activity) atsteady state (see below). Clearance is usually determinedusing the area under the concentration–time curve(AUC).
Pharmacokinetics
39
2
Clearance Apparent volume of Half-life(ml min–1) distribution (� per 70 kg) (h)
Warfarin 3 8 37Digitoxin 4 38 161Diazepam 27 77 43Valproic acid 76 27 5.6Digoxin 130 640 39Ampicillin 270 20 1.3Amlodipine 333 1470 36Nifedipine 500 80 1.8Lidocaine 640 77 1.8Propranolol 840 270 3.9Imipramine 1050 1600 18
Note: The drugs are arranged in order of increasing plasma clearance. A long half-life may result from a low clearance (e.g.digitoxin), a high apparent volume of distribution (e.g. amlodipine) or both.
Table 2.11
Pharmacokinetic parameters of selected drugs
Ch02.qxd 3/12/05 10:58 AM Page 39
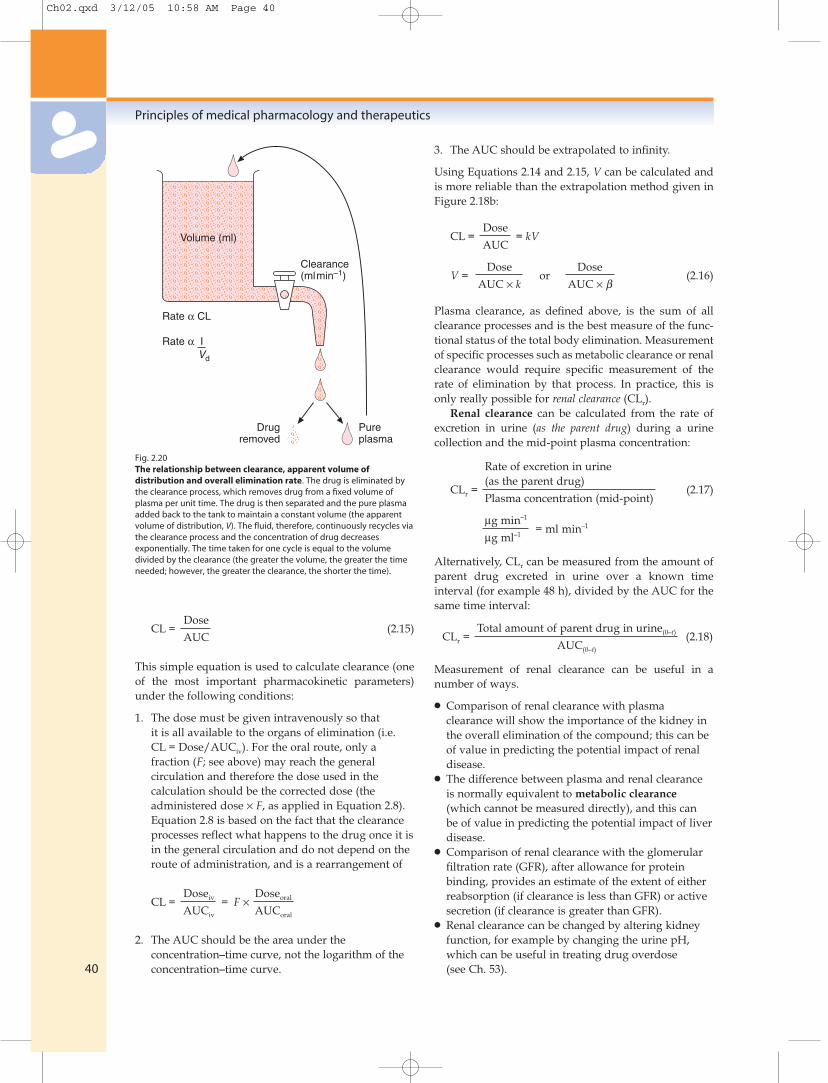
CL =Dose
(2.15)AUC
This simple equation is used to calculate clearance (oneof the most important pharmacokinetic parameters)under the following conditions:
1. The dose must be given intravenously so thatit is all available to the organs of elimination (i.e.CL = Dose/AUCiv). For the oral route, only afraction (F; see above) may reach the generalcirculation and therefore the dose used in thecalculation should be the corrected dose (theadministered dose × F, as applied in Equation 2.8).Equation 2.8 is based on the fact that the clearanceprocesses reflect what happens to the drug once it isin the general circulation and do not depend on theroute of administration, and is a rearrangement of
CL =Doseiv = F ×
Doseoral
AUCiv AUCoral
2. The AUC should be the area under theconcentration–time curve, not the logarithm of theconcentration–time curve.
3. The AUC should be extrapolated to infinity.
Using Equations 2.14 and 2.15, V can be calculated andis more reliable than the extrapolation method given inFigure 2.18b:
CL =Dose
= kVAUC
V =Dose
orDose
(2.16)AUC × k AUC × β
Plasma clearance, as defined above, is the sum of allclearance processes and is the best measure of the func-tional status of the total body elimination. Measurementof specific processes such as metabolic clearance or renalclearance would require specific measurement of therate of elimination by that process. In practice, this isonly really possible for renal clearance (CLr).
Renal clearance can be calculated from the rate ofexcretion in urine (as the parent drug) during a urinecollection and the mid-point plasma concentration:
Rate of excretion in urine
CLr =(as the parent drug)
(2.17)Plasma concentration (mid-point)
µg min–1
= ml min–1
µg ml–1
Alternatively, CLr can be measured from the amount ofparent drug excreted in urine over a known timeinterval (for example 48 h), divided by the AUC for thesame time interval:
CLr =Total amount of parent drug in urine(0–t) (2.18)
AUC(0–t)
Measurement of renal clearance can be useful in anumber of ways.
● Comparison of renal clearance with plasmaclearance will show the importance of the kidney inthe overall elimination of the compound; this can beof value in predicting the potential impact of renaldisease.
● The difference between plasma and renal clearanceis normally equivalent to metabolic clearance(which cannot be measured directly), and this canbe of value in predicting the potential impact of liverdisease.
● Comparison of renal clearance with the glomerularfiltration rate (GFR), after allowance for proteinbinding, provides an estimate of the extent of eitherreabsorption (if clearance is less than GFR) or activesecretion (if clearance is greater than GFR).
● Renal clearance can be changed by altering kidneyfunction, for example by changing the urine pH,which can be useful in treating drug overdose(see Ch. 53).
Principles of medical pharmacology and therapeutics
40
Rate α CL
Rate α IVd
Drugremoved
Pureplasma
Clearance(mlmin–1)
Volume (ml)
Fig. 2.20The relationship between clearance, apparent volume ofdistribution and overall elimination rate. The drug is eliminated bythe clearance process, which removes drug from a fixed volume ofplasma per unit time. The drug is then separated and the pure plasmaadded back to the tank to maintain a constant volume (the apparentvolume of distribution, V). The fluid, therefore, continuously recycles viathe clearance process and the concentration of drug decreasesexponentially. The time taken for one cycle is equal to the volumedivided by the clearance (the greater the volume, the greater the timeneeded; however, the greater the clearance, the shorter the time).
Ch02.qxd 3/12/05 10:58 AM Page 40

Biliary clearance of a drug can be measured using theabove approach, but in practice is seldom done, becauseof the difficulty of collecting bile samples.
Extent of eliminationThe extent of elimination is of limited value becauseeventually all the drug will be removed from the body.Measurement of total elimination in urine, faeces andexpired air as parent drug and metabolites can giveuseful insights into the extent of absorption, metabolism,and renal and biliary elimination.
Chronic administration
Long-term or chronic drug therapy is designed to main-tain a constant concentration of the drug in blood, withan equilibrium (steady state) established between bloodand all tissues of the body, including the site of action.In practice, a constant concentration can only be achievedby an intravenous infusion that has continued longenough to reach steady state (Fig. 2.21).
Time to reach steady stateDuring constant infusion, the time to reach steady stateis dependent on the elimination half-life, and steady stateis approached after four or five half-lives. Intuitively, itmay seem peculiar that the elimination half-life deter-mines the time required to reach equilibrium during
constant input. The relationship is more readily under-stood if plasma concentrations following both increasesand decreases in dose rate are considered (Table 2.12).The plasma concentration at steady state (Css) is directlyproportional to the infusion rate; plasma concentrationsreach 95% of the new steady-state conditions by four orfive half-lives after a change in infusion rate.
Pharmacokinetics
41
2
InC
TimeA
CssD B C
Slope = –k
Fig. 2.21 Constant intravenous infusion (between points A and C).Steady state is reached at point B and the steady-state concentration(Css; given by D) can be used to calculate clearance: CL = rate ofinfusion/Css (see text). Clearance can also be calculated from the areaunder the total curve (AUC) and the total dose infused between A andC. The slope on cessation of infusion is the terminal elimination phase(k or β). The distribution phase is not usually detected becausedistribution is occurring throughout the period A to C. The apparentvolume of distribution can be calculated as: V = Dose/(AUC × k). Theincrease to steady state is determined by the elimination rate constantand it takes approximately four to five half-lives to reach steady state.
Drug concentration in plasma (ng ml–1) after a change in dose rate (mg h–1) Percentagechange A-E
A B C D E
(1 to 0) (1 to 0.5) (1 to 2) (0 to 1) (0 to 2)
Initial concentration 100 100 100 0 0 0After 1 half-life 50 75 150 50 100 50After 2 half-lives 25 62.5 175 75 150 75After 3 half-lives 12.5 56.25 187.5 87.5 175 87.5After 4 half-lives 6.25 53.125 193.75 93.75 187.5 93.75After 5 half-lives 3.125 51.5625 196.875 96.875 193.75 96.875At infinity 0 50 200 100 200 100
aTheoretical changes in plasma concentrations of a drug that has been given by continuous intravenous infusion.Notes:The steady-state concentrations (initial and infinity) are directly proportional to the infusion rate.The percentage changes (from initial conditions to infinity) are identical and independent of the rate of infusion.After four or five half-lives, the change in concentration represents about 95% of the overall change to infinity (the new steady state).Clearance = rate of infusion/Css = 1 000 000 ng h–1/100 ng ml–1 = 167 ml min.–1
Table 2.12
Plasma concentrations following a change in dosagea
Ch02.qxd 3/12/05 10:58 AM Page 41

Since the elimination half-life is dependent on bothCL and V, each of these can contribute to any delay inachieving steady state. A drug with a large V will havea long half-life and, therefore, it will take a longer timeto reach steady state. It is easy to envisage the slowfilling of such a high volume of distribution duringregular administration.
Plasma concentration at steady stateOnce steady state has been reached, the plasma andtissues are in equilibrium, and the distribution rate con-stant and V will not affect the plasma concentration. Thevalue of Css is determined solely by the balance betweenthe rate of infusion and the rate of elimination (orclearance): from Equation 2.12, the rate of eliminationequals CL × Css, so that CL × Css = Rate of infusion or
Css =Rate of infusion
(2.19)CL
This relationship for an intravenous infusion can beused to calculate plasma clearance:
CL =Rate of infusion
(2.20)Cssss
Clearance and volume of distribution can also becalculated using the AUC between zero and infinity andthe terminal slope after cessation of the infusion (seeFig. 2.21).
Oral administrationMost chronic administration is via the oral route, andthe rate and extent of absorption need to be considered.Also, oral therapy is by intermittent doses and thereforethere will be a series of peaks and troughs betweendoses (Fig. 2.22).
The rate of absorption will influence the interdoseprofile, since very rapid absorption will exaggeratefluctuations, while slow absorption will dampen downthe peak.
The extent of absorption, or bioavailability (F), willinfluence the average steady-state concentration, becauseit determines the dose entering the circulation. The rateof input during chronic oral therapy is given by:
D × F
t(2.21)
where D is the administered dose, F is bioavailability,and t is the interval between doses. At steady state, therate of input is balanced by the rate of elimination, that is:
D × F= CL × Css (2.22)
t
Therefore:
Css =D × F
(2.23)t × CL
This is an important equation and reflects the balancebetween input and output, which is, in reality, a balancebetween the prescriber and the person taking the drug:
● The input of drug is determined by the prescriber,who can change Css by altering either the dose or thedose interval (and sometimes the bioavailability ofthe drug formulation).
● The removal of drug is determined by thecharacteristics of the individual taking the drug:metabolism/renal function can change Css byaltering bioavailability and/or clearance.
Loading doseA therapeutic problem may arise when a rapid effect isrequired for a drug that has a long or very long half-life;for example, the steady-state conditions will not bereached until 2–4 days if the half-life is 12–24 h, or over4 or 5 weeks if the half-life is 1 week. Increasing the doserate (for example, column E compared with column D inTable 2.12) does not reduce the time to reach steadystate. A higher dose rate will reduce the time taken toreach any particular concentration, but plasma concen-trations will continue to increase to give a higher steady-state level (after the same time interval of about four orfive half-lives).
Any delay between the initiation of treatment andthe attainment of steady state may be avoided by theadministration of a loading dose. A loading dose is a high
Principles of medical pharmacology and therapeutics
42
InC
Time
Css
Fig. 2.22Chronic oral therapy (——) compared with intravenous (- - - -)infusion at the same dosage rate. The oral dose shows very rapidabsorption and distribution followed by a more slow eliminationphase within each dose interval. Cessation of therapy after any dosewould produce the line shown in blue.
Ch02.qxd 3/12/05 10:58 AM Page 42

initial or first dose that, as the name implies, is designedto ‘load up’ the body. In principle, this is done by givinga first dose that is equivalent to the total steady-statebody load which would be produced by the intendedchronic dosage regimen. This will avoid the slow build-up to steady state, and the steady-state body load canthen be maintained by giving the dosage regimen thatwould eventually have resulted in the same steady-stateconcentration. The amount of drug equivalent to thesteady-state body load is the target Css multiplied by V(see Equation 2.10).
Loading dose = Css × V (2.24)
In cases where Css or V are not known, the loading dosecan be calculated based on the proposed maintenanceregimen by replacing Css with Equation 2.24 and V byCL/k (Equation 2.14):
Loading dose =D × F
×CL
t × CL k
=D × F
t × k
=D × F × 1.44 × t 1⁄2 (2.25)
t
It is clear from this last equation that the magnitude ofany loading dose compared with the maintenance doseis proportional to the half-life.
Good examples of drugs that may require a loadingdose are the cardiac glycosides digoxin and digitoxin,which are compared in Table 2.13. The values given inTable 2.13 are to illustrate the concept of a loading dose:the doses used clinically should take into account body-weight, age, and the presence of severe renal or liverimpairment.
Loading doses may need to be given in two or threefractions over a period of about 24–36 h. The reason isthat during tissue distribution of the loading dose, thereare higher (non-steady-state) concentrations in the bloodand rapidly equilibrating tissues, and lower (non-steady-
state) concentrations in the slowly equilibrating tissues(see Fig. 2.6). The excessive concentrations in rapidlyequilibrating tissues may give rise to toxicity. This canbe minimised by giving the loading dose in fractions,which would allow distribution of one fraction beforethe next was given. The fractional loading doses shouldbe given within the period of the normal dose interval.
Factors affectingpharmacokinetics
A number of factors can affect the physiologicalprocesses of absorption, distribution and elimination.Aspects such as pregnancy, age, and diseases of theorgans of elimination are discussed in Chapter 56.Clinically important variability arises from differencesin bioavailability, V and CL:
● drug interactions: see Chapter 56, and the inductionand inhibition of P450 discussed above
● age: see Chapter 56● diseases, especially of the liver and kidneys: see
Chapter 56● environmental factors, for example alcohol and
smoking● genetics: this is becoming an increasingly important
area and is discussed in detail below in relation topharmacokinetics and in Chapter 4 in relation toreceptors.
Pharmacogenomics,pharmacogenetics and drugresponses
There are person-to-person variations for any biologicalproperty, including the responses to drug administra-
Pharmacokinetics
43
2
Digoxin Digitoxin
Elimination half-life (days) 1.6 7Time to steady state (days; 4 × t1⁄2) 6 28‘Therapeutic’ plasma concentrations (ng ml–1 or µg l–1) 0.5–2.0 10–35Volume of distribution (1/70 kg) 600 40Typical loading dose (Css × V) (mg) up to 1.2 up to 1.4Bioavailability (F) 0.75 >0.9Normal oral maintenance dose (Dose × F/t; mg per day) 0.125–0.5 0.05–0.2Typical loading dose (maintenance dose × 1.44 × t1⁄2) (mg) 0.3–1.2 0.5–2.0
Table 2-13
Pharmacokinetics and dosage for digoxin and digitoxin
Ch02.qxd 3/12/05 10:58 AM Page 43

tion. The nature of the response is usually similar in allindividuals, because they share the same underlyingbiology, but the magnitude of the response to the samedose of a drug can differ markedly within a group ofindividuals. For many responses, this variation isreflected in a single Gaussian distribution (Fig. 2.23a),and such variability is an inherent part of the need toindividualise dosage for the person. The presence of apolymorphism (Fig. 2.23b) can give rise to much widerperson-to-person variation in response, such that someindividuals may show no response, while others showtoxicity at the same dose. The genetic origins of manypolymorphisms is of increasing importance both in rela-tion to drug development (see Ch. 3) and also because itallows the possibility in the future for genetic screeningto be used to individualise drug and dosage selection.
Pharmacogenetics relates to how genetic differencesbetween individuals affect the fate of a drug or theresponse to a drug. Pharmacogenetic research has beenundertaken for more than four decades, largely in rela-tion to in vivo variability, and has often used classicgenetic techniques such as studies in twins and patternsof inheritance.
Pharmacogenomics relates to genome-wide approachesthat define the presence of single-nucleotide polymor-phisms (SNPs) in the genes which affect the activity ofthe gene product. Molecular biological techniques haveallowed recognition of more than 1.4 million SNPs inthe human genome. SNPs can be:
● in the upstream regulatory sequence of a codinggene, which can result in increased or decreased
expression of the gene in response to the regulatorytranscription factors that control that gene product;the gene product will be the same as the normal or‘wild’ type of gene product
● in the coding region of the gene, which will result ina gene product with an altered amino acid sequencethat may have higher activity (although this isunlikely), similar activity, lower activity or noactivity at all.
In addition, there can be other inactive SNPs becausethey are in non-coding or silent regions of the genome,or because the base change does not alter the amino acidencoded (although this can result in altered expresson –see PGP below). In consequence, a major challenge forthe future is not in identifying SNPs and the presence ofgenotypic differences, but rather in defining the func-tional consequences of the genetic difference and themagnitude of phenotypic differences. Future researchwill also focus on the importance of different combina-tions of genetic variants (haplotypes) rather than onsingle gene differences.
The rapid advances in molecular biology haveallowed analysis of person-to-person differences in thesequences of the genes involved in drug metabolismand drug transport (pharmacokinetics) and receptors(pharmacodynamics). The earliest studies on pharma-cogenetics were performed in relation to enzymesinvolved in drug metabolism. N-Acetyltransferase wasone of the first drug metabolism pathways to be shownto have a genetic influence on both plasma concen-trations of a drug (isoniazid) and the therapeutic
Principles of medical pharmacology and therapeutics
44
(a) Gaussian distribution of response (b) Polymorphic distribution of response
ResponseResponse
Num
ber
of s
ubje
cts
Num
ber
of s
ubje
cts
Fig. 2.23Inter-individual variation in response to a single dose. The graphs show the numbers of individuals in a population showing a particular level ofresponse to a single dose of a drug against the magnitude of the response. In Figure 2.23a, most individuals show the average response and theoverall shape is a normal distribution. In a normal monomorphic distribution (Fig. 2.23a), the magnitude of inter-individual variability is indicated bythe coefficient of variation (the dotted line in Figure 2.23a is for a response showing wider inter-individual variation). Both the coefficient of variationand the magnitude of the difference between phenotypes affect the variation in a polymorphic distribution (Fig. 2.23b).
Ch02.qxd 3/12/05 10:58 AM Page 44

response. Individuals with low enzyme activity, so-called ‘slow acetylators’, had higher blood concen-trations of isoniazid and a better response but a greaterrisk of toxicity than did ‘fast acetylators’. BecauseN-acetylation is a minor pathway of drug metabolism,
pharmacogenetics remained of largely academic interestuntil the late 1970s, when it was found that CYP2D6 –one of the isoforms of cytochrome P450, the major drug-metabolising enzyme – showed a functionally impor-tant genetic polymorphism that could affect a wide
Pharmacokinetics
45
2
Enzyme Incidence of Typical substrates Consequences of deficiency ordeficiency or slow- slow-metaboliser statusmetaboliser statusa
Phase I reactionsPlasma 1 in 3000 Suxamethonium Prolonged paralysispseudocholinesterase (succinylcholine)
Alcohol 5–10% (approx. 90% Ethanol Profound vasodilation on ingestion ofdehydrogenase in Asians) alcohol
CYP2A6 ? Nicotine Reduced nicotine metabolism
CYP2B6 ? Anticancer drugs? Reduced metabolism – but functionalimportance is unclear
CYP2C9 About 3% (UK) Tolbutamide, diazepam, Increased response if parent drug warfarin is active
CYP2C19 5% (about 20% S-mephenytoin, omeprazole Increased response if parent drug in Asians) is active
CYP2D6 5–10% Nortriptyline, codeine Increased response if parent drug is active, but reduced response if oxidationproduces the active form, e.g. codeine
Dihydropyrimidine 1% are heterozygous Fluorouracil Enhanced drug responsedehydrogenase
Phase II reactionsN-Acetyltransferase 50% (10–20% Isoniazid, hydralazine, Enhanced drug response in slow
in Asians) procainamide acetylators
Glucuronyl- 10% (1–4% in Asians) Irinotecan (bilirubin) Enhanced effect (Gilbert’s syndrome)transferase 1A1
Thiopurine S-methyl 0.3% Mercaptopurine, azathioprine Increased risk of toxicity (because thetransferase doses normally used are close to toxic)
Catechol 25% Levodopa Slightly enhanced drug effectO-methyltransferase
TransportersPGP A number of SNPs Digoxin, anti-cancer drugs, Possibly higher drug levels with some
have been identified, dihydropyridines SNPs, but lower drug levels due to the incidences of increased activity with other SNPswhich vary withethnic origins
a Incidence for CaucasiansPGP, P-glycoprotein; SNP, single-nucleotide polymorphism
Table 2-14
Pharmacogenetic differences in drug-metabolising enzymes
Ch02.qxd 3/12/05 10:58 AM Page 45
variety of different drugs. It is now known that the basicgenotypic difference relates to the coding of an inactiveenzyme in those without appreciable CYP2D6 activity –‘poor metabolisers’ – but that 75 different alleles havebeen described and also there are variations in thenumber of copies of the coding region, with normal‘extensive metabolisers’ having one copy of the normalgene, although individuals with up to 13 copies havebeen been identified. Cytochrome P450 was one of theearliest enzyme systems to be a focus of research onhuman genomics.
Knowledge of the precise nature of the differences(SNPs) for genetic polymorphisms is beyond the scopeof an undergraduate text, and is not necessary to under-stand or appreciate either the current position or pos-sible future developments in the area of pharmaco-genomics. There is a well-established database ongenetic differences in many of the major pathways offoreign compound metabolism (Table 2.14), and thefunctional consequences are outlined. Ethnic origins canaffect the proportion of the population showing agenetic deficiency or polymorphism (see Table 2.14). Inaddition, the extent of metabolism in the general
population may be different; for example, subjects fromthe Indian subcontinent show a two- to threefold lowersystemic clearance of nifedipine (a CYP3A substrate)compared with Caucasians, and this probably has agenetic basis in the control of enzyme expression.
There is an increasing interest in pharmacogeneticsof transporter proteins. Although in its infancy, com-pared with pharmacogenetics of drug metabolism, theavailable data indicate that there are functionally impor-tant polymorphisms in some adenosine triphosphate(ATP)-binding transporter proteins. A number of SNPshave been identified in the MDR1 gene, which codes forPGP, although the consequences of this for drug trans-port and for the aetiology of diseases are not clear. Thereare splice variants for the OAT transporters in thekidneys, but, again, the incidence and consequences ofthese for humans have not been defined.
Information on genetic polymorphisms and geneticvariants of the enzymes and transporters involved indrug metabolism and biodisposition can be found onthe OMIM (Online Mendelian Inheritance in Man;John Hopkins University) database (http://www.ncbi.nlm.nih.gov/entrez/dispomim.cgi?id=235200).
Principles of medical pharmacology and therapeutics
46
FURTHER READING
Abdel-Rahman SM, Kauffman RE (2004) The integration ofpharmacokinetics and pharmacodynamics: understandingdose–response. Annu Rev Pharmacol Toxicol 44, 111–136
Aweeka F, Greenblatt RM, Blaschke TF (2004) Sex differencesin pharmacokinetics and pharmacodynamics. Annu RevPharmacol Toxicol 44, 499–523
Burckhardt BC, Burckhardt G (2003) Transport of organicanions across the basolateral membrane of proximal tubulecells. Rev Physiol Biochem Pharmacol 146, 95–158
Cholerton S, Daly AK, Idle JR (1992) The role of individualhuman cytochromes P450 in drug metabolism and clinicalresponse. Trends Pharmacol Sci 13, 434–439
Daly AK (2003) Pharmacogenetics of the major polymorphicmetabolizing enzymes. Fundam Clin Pharmacol 17, 27–41
de Boer AG, van der Sandt ICJ, Gaillard PJ (2003) The role ofdrug transporters at the blood–brain barrier. Annu RevPharmacol Toxicol 43, 629–656
Evans WE, McLeod HL (2003) Pharmacogenomics – drugdisposition, drug targets, and side effects. N Engl J Med 348,538–549
Fromm MF (2004) Importance of P-glycoprotein at blood–tissuebarriers. Trends Pharmacol Sci 25, 423–429
Gonzalez TJ (1992) Human cytochromes P450: problems andprospects. Trends Pharmacol Sci 13, 346–352
Gurwitz D, Weizman A, Rehavi M (2003) Education: teachingpharmacogenomics to prepare future physicians andresearchers for personalized medicine. Trends Pharmacol Sci24, 122–125
Handschin C, Meyer UA (2003) Induction of drug metabolism:the role of nuclear receptors. Pharmacol Rev 55, 649–673
Lee G, Dallas S, Hong M, Bendayan R (2001) Drug transportersin the central nervous system: brain barriers and brainparenchyma considerations. Pharmacol Rev 53, 569–596
Lee W, Kim RB (2004) Transporters and renal drug eliminationAnnu Rev Pharmacol Toxicol 44, 137–166
Lin JH, Lu AY (2001) Interindividual variability in inhibitionand induction of cytochrome P450 enzymes. Annu RevPharmacol Toxicol 41, 535–567
Marzolini C, Paus E, Buclin T, Kim RB (2004) Polymorphismsin human MDR1 (P-glycoprotein): recent advances andclinical relevance. Clin Pharmacol Ther 75, 13–33
Pirmohamed M, Park BK (2001) Genetic susceptibility toadverse drug reactions. Trends Pharmacol Sci 22, 298–305
Schwab M, Eichelbaum M, Fromm MF (2003) Geneticpolymorphisms of the human MDR1 drug transporter.Annu Rev Pharmacol Toxicol 43, 285–307
Tukey RH, Strassburg CP (2000) Human UDP-glucuronosyltransferases: metabolism, expression, anddisease. Annu Rev Pharmacol Toxicol 40, 581–616
Weinshilboum R (2003) Inheritance and drug response. N EnglJ Med 348, 529–537
Xie H-G, Kim RB, Wood AJJ, Stein MC (2001) Molecular basisof ethnic differences in drug disposition and response.Annu Rev Pharmacol Toxicol 41, 815–850
Ch02.qxd 3/12/05 10:58 AM Page 46

Self-assessment
1. The following statements describe drugpharmacokinetics. Are they true or false?
a. The plasma clearance of a drug usually decreaseswith increase in the dose prescribed.
b. First-pass metabolism may limit thebioavailability of orally administered drugs.
c. Drugs that show high first-pass metabolism inthe liver also have a high systemic clearance.
d. The half-life of many drugs is longer in infantsthan in children or adults.
e. A decrease in renal function may affect bothsystemic clearance and oral bioavailability.
f. Benzathine benzylpenicillin has a prolongedhalf-life because the renal extraction of penicillinis reduced.
g. Nifedipine is eliminated more rapidly in cigarettesmokers.
h. Chronic treatment with phenobarbital canincrease the systemic clearance and oralbioavailability of co-administered drugs.
i. A loading dose is not necessary for drugs thathave short half-lives.
j. An obese person is likely to show an increasedvolume of distribution and decreased clearanceof prescribed drugs.
k. Drugs are always taken with meals in order toreduce unwanted effects.
2. Figure 2.24 shows the changes in plasma levels oftwo drugs, A and B, given as 10-mg doses by oraland intravenous routes. From the plasmaconcentration–time curves, compare the two drugsfor the following properties (do not performdetailed calculations):
a. Absorption from the gut.b. Oral bioavailability.c. Distribution to tissues.d. Elimination half-life.e. Extent of accumulation during daily
administration of each drug.
3. The pharmacokinetics of three drugs, A, Band C, were studied in the blood and urineof a healthy adult male volunteer (70 kg) followingboth oral and intravenous administration of20-mg doses (Table 2.15). From the data given,compare:
a. The extent of absorption (bioavailability, F) (youcannot calculate the rate of absorption from thesedata).
b. The apparent volume of distribution (V) (youcannot calculate the rate of distribution fromthese data).
Pharmacokinetics
47
2
Self-
asse
ssm
ent
qu
esti
on
s
Intravenous
Oral
Intravenous
Oral
Time (h)
Pla
sma
conc
entr
atio
n (n
gm
l–1)
1000
100
10
110 20 30
A
Time (h)
Pla
sma
conc
entr
atio
n (n
gm
l–1)
1000
100
10
110 20 30
B
Fig. 2.24Plasma concentration–time curves for two drugs.
Ch02.qxd 3/12/05 10:58 AM Page 47

c. The elimination of these drugs (half-life, t1/2) andclearance (CL, and route).
d. Their potential for accumulation during chronicdosage (related to half-life and interval betweendoses).
e. List genetic and environmental factors that mayaffect the disposition of these drugs (A, B, C,) indifferent individuals.
The answers are provided on pages 703–706.
Principles of medical pharmacology and therapeutics
48
Self-
asse
ssm
ent
qu
esti
on
s
Parameter A B C
Intravenous Oral Intravenous Oral Intravenous Oral
AUC (µg ml–l min) 16 2 1000 995 40 26Terminal slope (min–l) 0.0063 0.0063 0.00022 0.00022 0.014 0.003Percentage of dose in urine (unchanged) 0 5 98Percentage of dose in urine as metabolites 100 95 0
AUC, total area under the plasma concentration-time curve.
Table 2.15
Data for question 3
Ch02.qxd 3/12/05 10:58 AM Page 48