Embed Size (px)
Citation preview

1
Fish oil and fenofibrate inhibit pancreatic islet hypertrophy, and improve glucose and 1
lipid metabolic dysfuntions with different ways in diabetic KK mice 2
3
Maki Nakasatomia: [email protected] 4
Hyounju Kima*: [email protected] 5
Takeshi Araia: [email protected] 6
Satoshi Hirakob: [email protected] 7
Seiji Shiodac: [email protected] 8
Yuzuru Iizukaa:[email protected] 9
Koji Sakuraia: [email protected] 10
Akiyo Matsumotoa: [email protected] 11
12
a Department of Clinical Dietetics & Human Nutrition, Faculty of Pharmaceutical Sciences, 13
Josai University, Saitama, Japan 14 b Department of Health and Nutrition, University of Human Arts and Sciences, Saitama, 15
Japan 16
c Global Research Center for Innovative Life Science, School of Pharmacy and 17
Pharmaceutical Sciences, Hoshi University, Tokyo, Japan 18
19
*Corresponding author at: Department of Clinical Dietetics & Human Nutrition, Faculty of 20
Pharmaceutical Sciences, Josai University, 1-1, Keyakidai, Sakado, Saitama 350-0295, Japan. 21
Tel.: +81 49 271 7234; fax: +81 49 271 7247. 22
23
24

2
Fish oil and fenofibrate inhibit pancreatic islet hypertrophy, and improve glucose and 25
lipid metabolic dysfuntions with different ways in diabetic KK mice 26
Maki Nakasatomia, Hyounju Kima*, Takeshi Araia, Satoshi Hirakob, Seiji Shiodac, Yuzuru 27
Iizukaa, Koji Sakuraia, Akiyo Matsumotoa 28
29
30
a Department of Clinical Dietetics & Human Nutrition, Faculty of Pharmaceutical Sciences, 31
Josai University, Saitama, Japan 32 b Department of Health and Nutrition, University of Human Arts and Sciences, Saitama, 33
Japan 34
c Global Research Center for Innovative Life Science, School of Pharmacy and 35
Pharmaceutical Sciences, Hoshi University, Tokyo, Japan 36
37
*Corresponding author at: Department of Clinical Dietetics & Human Nutrition, Faculty of 38
Pharmaceutical Sciences, Josai University, 1-1, Keyakidai, Sakado, Saitama 350-0295, Japan. 39
Tel.: +81 49 271 7234; fax: +81 49 271 7247. 40
41
42
43
44
45
46
47
48

3
Summary 49
We examined the effects of fish oil and fenofibrate (FF) on the pancreatic islet 50
hypertrophy, and on the modification of glucose and lipid metabolic dysfunctions in KK mice 51
with insulin resistance. The mice were fed one of four diets [25 en% lard/safflower oil (LSO), 52
25 en% fish oil (FO), or each of these diets plus 0.1 wt% FF (LSO/FF, FO/FF)] for 9 weeks. 53
FO group and both FF groups had significantly lower final body and adipose tissue weights 54
than LSO group. Pancreatic islet hypertrophy was observed only in LSO group but not in the 55
other groups with fish oil or FF. And, it is likely that fish oil has a stronger therapeutic effect 56
on islet hypertrophy. Plasma adiponectin level was significantly higher in FO group but not 57
in both FF groups. Expression of hepatic lipogenic enzyme genes such as fatty acid synthase 58
(FAS) and stearoyl-CoA desaturase-1 (SCD-1) was lower in FO groups with or without FF, 59
whereas fatty acid oxidation-related mRNAs such as acyl-CoA oxidase (AOX) and 60
uncoupling protein-2 (UCP-2) were more abundant in FF groups with or without fish oil. 61
Our results suggest that both fish oil and FF improve pancreatic islet hypertrophy with the 62
amelioration of insulin resistance. Fish oil enhances insulin sensitivity by increasing plasma 63
adiponectin; however, the beneficial effect of FF on insulin resistance seems to be 64
independent of the plasma adiponectin level. These results mean that improvement of glucose 65
and lipid metabolic dysfuctions in diabetic KK mice are independently approached by fish oil 66
and FF. 67
68
Keywords: Fish oil, Fenofibrate; Islet hypertrophy; Insulin resistance 69
70
71
72
4
Introduction 73
High fat diets bring about lipid accumulation and de novo lipid synthesis, leading to 74
obesity and increasing the risk of diabetes, hypertension, hyperlipidemia, metabolic 75
syndrome, coronary heart disease, and stroke [1-3]. Conversely, diets rich in fish can reduce 76
plasma triglyceride levels in patients with hyperlipidemia and decrease the risk of coronary 77
heart disease [4, 5]. Fish oil contains n-3 polyunsaturated fatty acids such as eicosapentaenoic 78
acid (EPA, 20:5 n-3) and docosahexaenoic acid (DHA, 22:6 n-3), and inhibits lipogenesis and 79
enhances fatty acid oxidation in the liver [6-8]. 80
Fatty acid and cholesterol synthesis in the liver are mainly regulated by sterol regulatory 81
element-binding proteins (SREBPs) [9-11]. Fish oil represses maturation of SREBP-1 and 82
attenuates expression of genes encoding lipogenesis and cholesterol biosynthesis enzymes [8, 83
12]. On the other hand, fatty acid oxidation and triglyceride hydrolysis are modulated by 84
peroxisome proliferator-activated receptor α (PPARα) [13-15]. Fish oil activates PPARα and 85
enhances the expression of genes involved in fatty acid oxidation and triglyceride hydrolysis 86
such as acyl-CoA oxidase (AOX), lipoprotein lipase, medium-chain acyl-CoA 87
dehydrogenase, acyl-CoA synthetase and uncoupling protein-2 (UCP-2) [16, 17]. The clinical 88
anti-hyperlipidemia drug fenofibrate, an agonist of PPARα, decreases triglyceride synthesis 89
and increases hepatic fatty acid oxidation, reducing the amount of fatty acids available for 90
triglyceride synthesis [18, 19]. And, fenofibrate treatment lowers plasma concentration of 91
triglycerides and low density lipoprotein (LDL) cholesterol, and raises the high density 92
lipoprotein (HDL) cholesterol level [20, 21]. 93
Our previous study demonstrated that the combination of fish oil and fenofibrate decreased 94
liver triglycerides and total cholesterol levels, white adipose tissue (WAT) weight, and final 95
body weight of C57BL/6 mice [22]. And, in KK mice, which develop diabetes with moderate 96

5
obesity, fish oil inhibits the body weight gain and increases insulin sensitivity, whereas 97
combination of fish oil and fenofibrate inhibits the body weight gain to a greater extent than 98
does fish oil alone [23]. This study was designed to examine the beneficial effects of fish oil 99
and fenofibrate on the pancreatic islet hypertrophy, and on the modification of glucose and 100
lipid metabolic dysfunctions in KK mice with insulin resistance. 101
102
Materials and methods 103
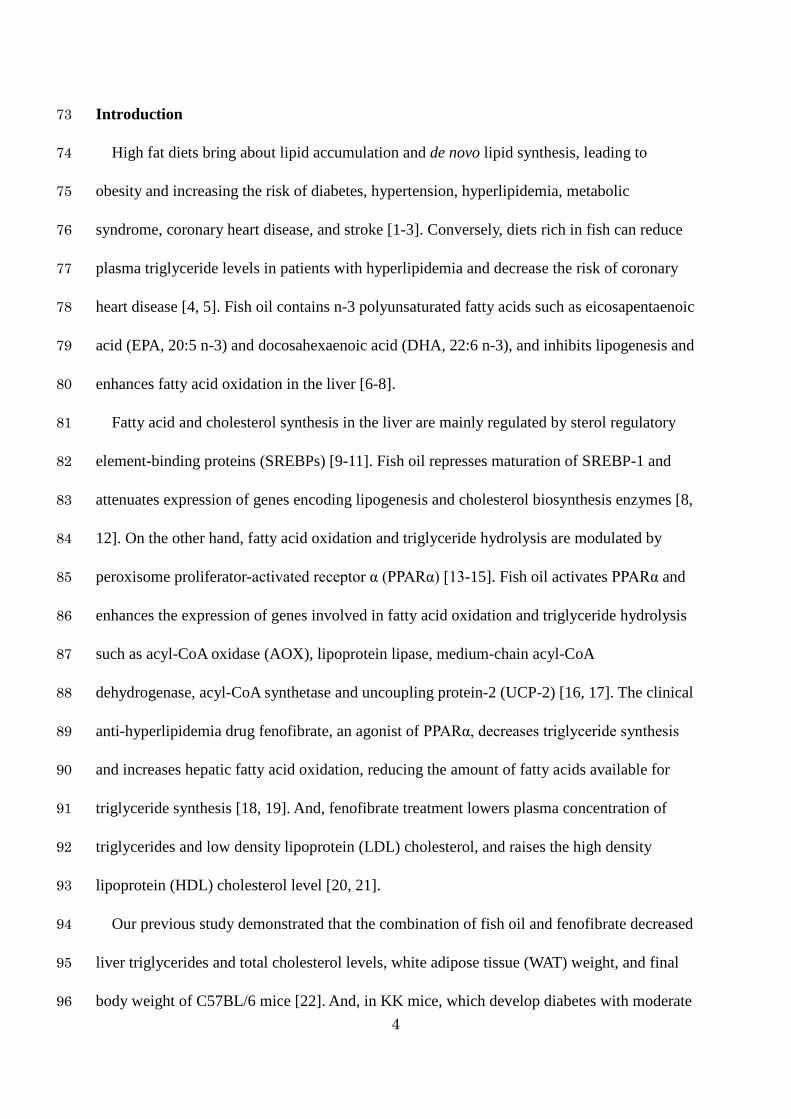
Animals and diets 104
Female KK mice were obtained from Tokyo Laboratory Animals Science Co. (Tokyo, 105
Japan) at 5 weeks of age and were fed a standard rodent diet (CE2; Clea, Tokyo, Japan) for 1 106
week for acclimatisation. The mice were maintained in a room with controlled temperature 107
(23 ± 2°C) and humidity (55 ± 10%) with a 12h light/12h dark cycle at the Josai University 108
Life Science Center. The mice were divided into four dietary groups (n = 5 in each group). 109
All experimental diets contained 54 en% carbohydrate, 25 en% fat, and 21en% protein and 110
some were supplemented with 0.1 wt% FF. The composition of experimental diets was 111
modified on the basis of AIN-93G as described previously [24]. In this study, a 6:4 lard: 112
safflower oil mixture (LSO) was used as the control dietary fat. The lard (Oriental Yeast, 113
Tokyo, Japan) contained 44% of oleic acid (18:1 n-9), 24% of palmitic acid (16:0), and 14% 114
of stearic acid (18:0) as the main fatty acids. Safflower oil (Benibana Foods, Tokyo, Japan) 115
contained 78% of oleic acid. Fish oil (NOF Corporation, Tokyo, Japan) contained 7% of EPA 116
(20:5 n-3), 25% of DHA (22:6 n-3), 20% of oleic acid, 18% of palmitic acid, and 5% of 117
stearic acid. Fenofibate was purchased from Sigma–Aldrich (St. Louis, MO, USA). The mice 118
6
were fed one of four diets [25 en% lard/safflower oil (LSO), 25 en% fish oil (FO), or each of 119
these diets plus 0.1 wt% FF (LSO/FF, FO/FF)] for 9 weeks. The mice were allowed free 120
access to water and feed. The details of all the diets are presented in Table 1. The diet was 121
changed every day, and the residual quantity was recorded. Food intake (g) was represented 122
on per mouse daily basis. Body weight was recorded once every week. All animal 123
experiments were performed in accordance with the “Fundamental Guidelines for Proper 124
Conduct of Animal Experiment and Related Activities in Academic Research Institutions” 125
(Ministry of Education, Culture, Sports, Science and Technology, Japan, Notice No. 71, 126
dated June 1, 2006) and approved by the Institutional Animal Care and Use Committee of the 127
Josai University. 128
129
130
Collection of blood and tissue samples 131

7
At the end of the experiment, mice fasted for 3 h were anesthetised with intraperitoneal 132
injections of pentobarbital sodium (Dainippon Sumitomo Pharma, Osaka, Japan). Blood 133
samples were drawn from the inferior vena cava and treated with EDTA-2Na, and were 134
centrifuged (900 ×g, 4°C, 10 min) to separate plasma, which was then frozen at −80°C until 135
analysis. The liver, white adipose tissue and pancreas were excised. Tissue samples were 136
weighed, frozen in liquid nitrogen, and stored at −80°C until analysis. 137
138
Measurement of liver and plasma parameters 139
Hepatic lipids were extracted from approximately 100 mg of liver tissue per mouse by the 140
method described by Folch et al. [25]. Hepatic triglycerides and total cholesterol, and plasma 141
triglyceride, total cholesterol and nonesterified fatty acid (NEFA) levels were quantified by 142
the enzymatic colorimetric method using commercial kits (Wako E-Test kits; Wako Pure 143
Chemical Industries Ltd., Osaka, Japan). Plasma aspartate transaminase (AST) and alanine 144
transaminase (ALT) levels were quantified using the Transaminase C-ⅡTest kit (Wako Pure 145
Chemical Industries Ltd, Osaka, Japan). Plasma insulin (the mouse Insulin kit) and leptin (the 146
mouse Leptin kit) levels were quantified by the enzyme-linked immunosorbent assay 147
(ELISA) using commercial kits (Morinaga Institute of Biological Science, Tokyo, Japan). The 148
plasma adiponectin level was measured using the mouse/rat Adiponectin ELISA kit (Otsuka 149
Pharmaceutical, Tokyo, Japan). Insulin resistance was assessed using the homeostasis model 150
of assessment-insulin resistance [HOMA-IR, fasting insulin (μU/mL) × fasting glucose 151
(mmol/L) / 22.5]. 152
153
Morphological analysis of the liver and pancreas 154
Liver and pancreatic tissue samples were collected from 4 to 5 mice in each group and 155
fixed in 10% neutral buffered formalin (Wako Pure Chemical Industries Ltd, Osaka, Japan). 156

8
The tissue samples were then embedded in paraffin, cut into sections, and stained with 157
haematoxylin and eosin (H&E) for morphological examination. In addition, the pancreatic 158
sections were stained with insulin and glucagon antibodies (Takara Bio Inc., Shiga, Japan) for 159
immunohistochemical analysis of islet structure by Kotobiken Medical Laboratories, Inc. 160
(Tokyo, Japan). The core of the pancreatic islet consists of insulin-positive beta cells 161
surrounded by glucagon-positive alpha cells (arrow). 162
163
Measurement of mRNA levels by real-time PCR 164
Portion of liver tissue was homogenised using the TRIzol Reagent (Invitrogen, Carlsbad, 165
CA, USA), and total RNA was isolated according to the manufacturer’s protocol. The 166
quantity and purity of total RNA were carefully verified on a spectrophotometer at A260 and 167
A280. mRNA amplification was performed using a QuantiTect SYBR Green Real-time PCR 168
kit (Qiagen, Hilden, Germany), and relative mRNA expression levels were quantified by RT-169
PCR from the cycle number (Ct) for threshold signal detection on an ABI Prism 7500 170
Sequence Detection System (Applied Biosystems, Foster City, CA, USA). The thermal 171
cycling conditions were as follows: reverse transcription at 50°C for 30 min, PCR initial 172
activation at 95°C for 15 min, 40 cycles of denaturation at 94°C for 15 s, annealing at the 173
optimum temperature of each primer for 30 s, and extension at 72°C for 1 min. A 174
housekeeping transcript, glyceraldehyde-3-phosphate dehydrogenase (GAPDH), was used as 175
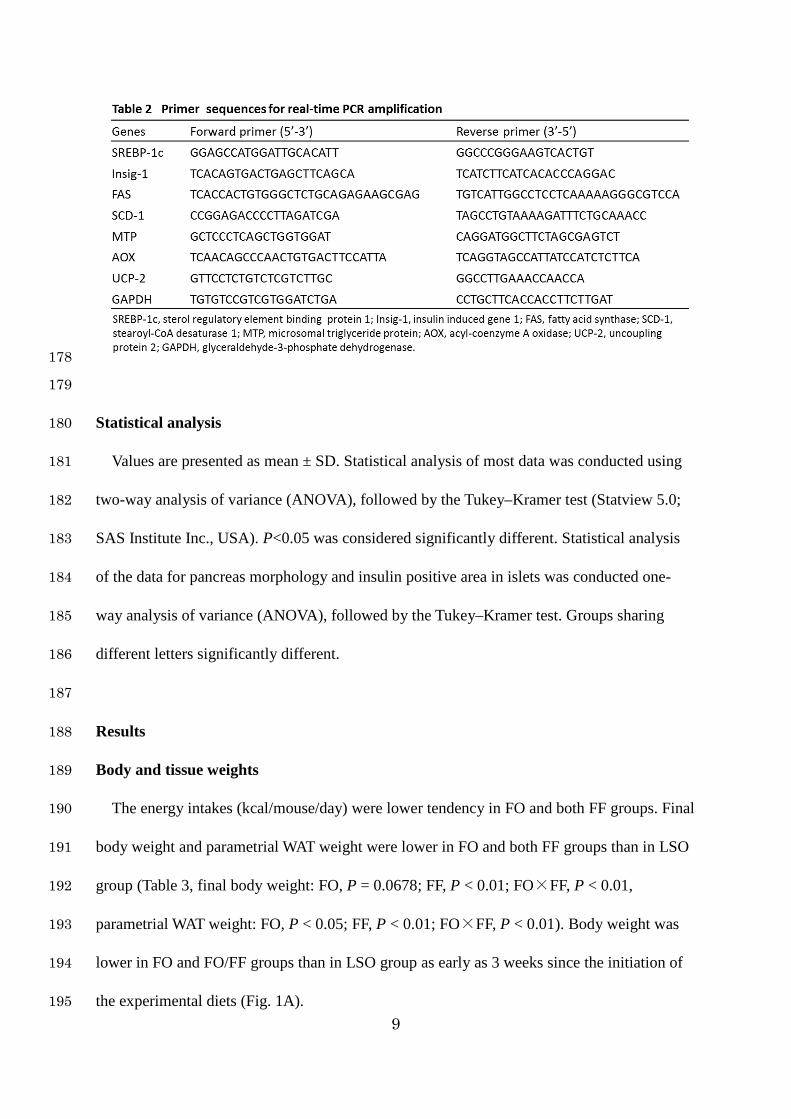
an endogenous control gene. The details of all PCR primers used are shown in Table 2. 176
Results were expressed as the ratio of the obtained value to that of LSO group. 177
9
178
179
Statistical analysis 180
Values are presented as mean ± SD. Statistical analysis of most data was conducted using 181
two-way analysis of variance (ANOVA), followed by the Tukey–Kramer test (Statview 5.0; 182
SAS Institute Inc., USA). P<0.05 was considered significantly different. Statistical analysis 183
of the data for pancreas morphology and insulin positive area in islets was conducted one-184
way analysis of variance (ANOVA), followed by the Tukey–Kramer test. Groups sharing 185
different letters significantly different. 186
187
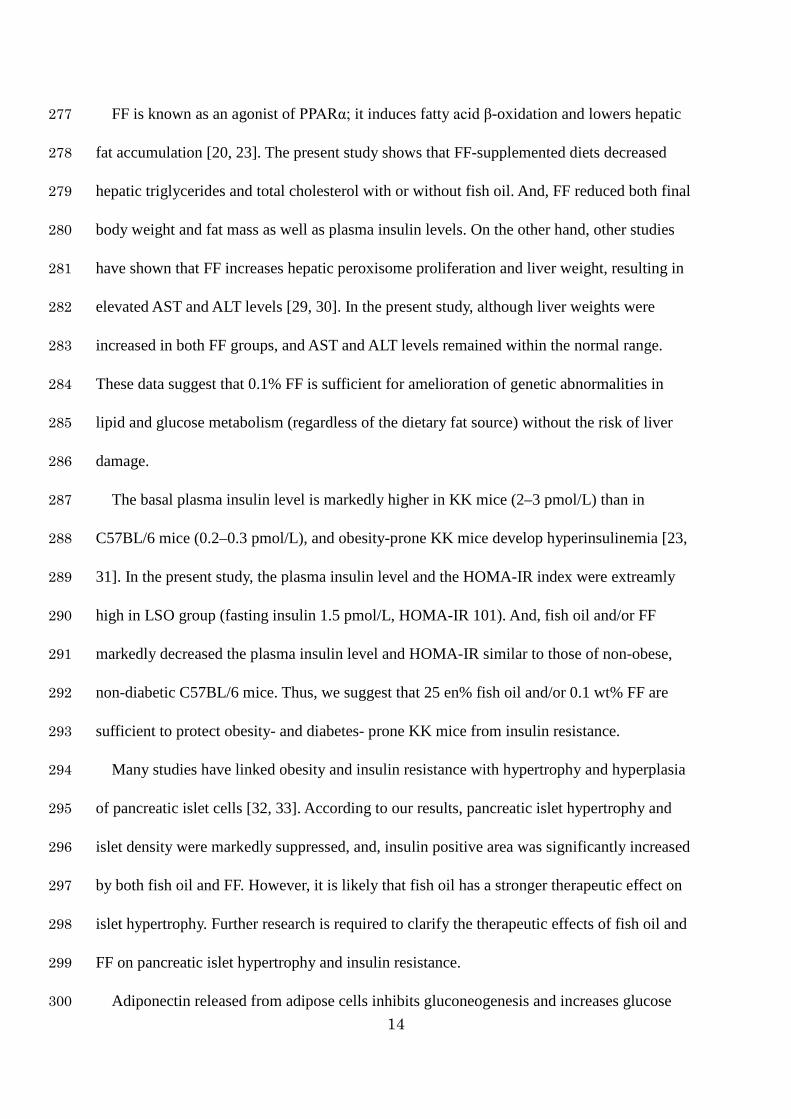
Results 188
Body and tissue weights 189
The energy intakes (kcal/mouse/day) were lower tendency in FO and both FF groups. Final 190
body weight and parametrial WAT weight were lower in FO and both FF groups than in LSO 191
group (Table 3, final body weight: FO, P = 0.0678; FF, P < 0.01; FO×FF, P < 0.01, 192
parametrial WAT weight: FO, P < 0.05; FF, P < 0.01; FO×FF, P < 0.01). Body weight was 193
lower in FO and FO/FF groups than in LSO group as early as 3 weeks since the initiation of 194
the experimental diets (Fig. 1A). 195

10
Liver weight was decreased in FO group and increased in both FF groups compared to the 196
other groups (Table 3: FO, P < 0.05; FF, P < 0.01; FO×FF, P < 0.01). There was no main 197
effect of FF or FO×FF interaction, but there was a main effect of FO in the plasma aspartate 198
transaminase (AST) levels. And, there was no main effect of FO or FO×FF interaction, but 199
there was a main effect of FF in the alanine transaminase (ALT) levels (Table 3). 200
201
202
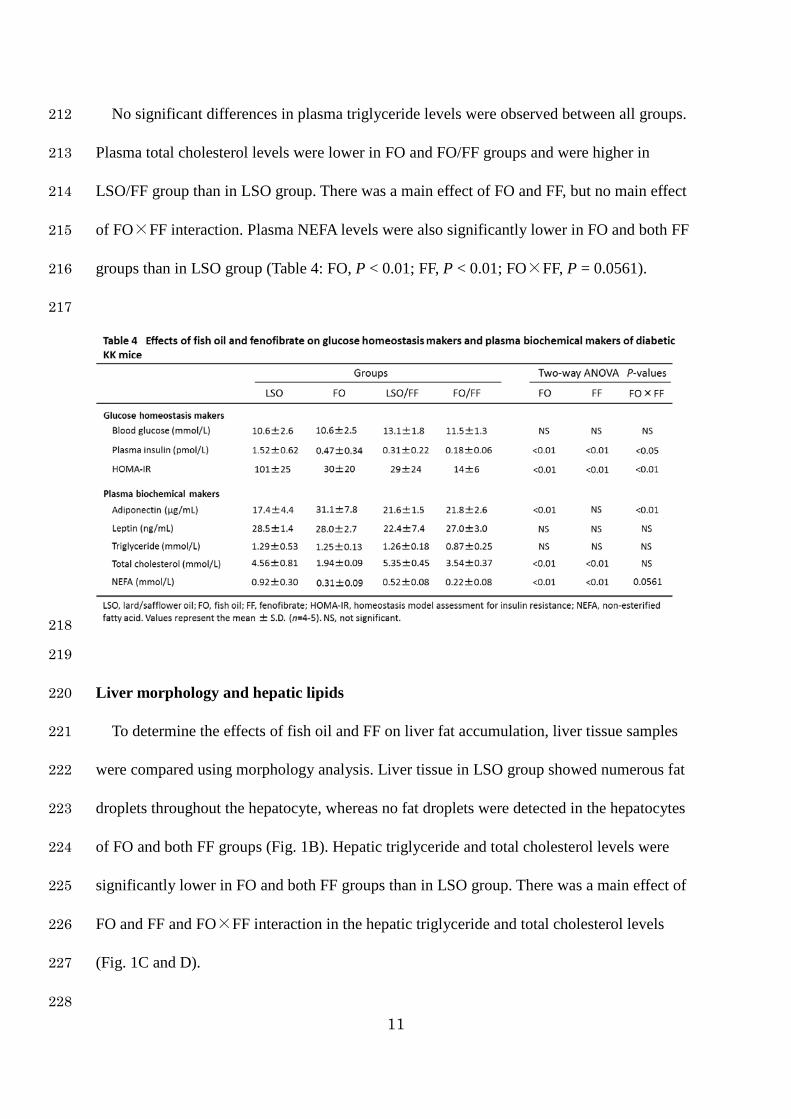
203
Plasma biochemical markers 204
As shown in Table 4, although no differences were observed in blood glucose levels by fish 205
oil or fenofibrate (FF), plasma insulin and HOMA-IR levels were significantly lower in FO 206
and both FF groups than in LSO group. There was a main effect of FO and FF and FO×FF 207
interaction in the plasma insulin and HOMA-IR levels. Plasma adiponectin level was 208
significantly higher in FO group compare with the other groups, showing a main effect of FO 209
and FO×FF interaction, but no main effect of FF. However, plasma leptin levels did not 210
change among the groups. 211
11
No significant differences in plasma triglyceride levels were observed between all groups. 212
Plasma total cholesterol levels were lower in FO and FO/FF groups and were higher in 213
LSO/FF group than in LSO group. There was a main effect of FO and FF, but no main effect 214
of FO×FF interaction. Plasma NEFA levels were also significantly lower in FO and both FF 215
groups than in LSO group (Table 4: FO, P < 0.01; FF, P < 0.01; FO×FF, P = 0.0561). 216
217
218
219
Liver morphology and hepatic lipids 220
To determine the effects of fish oil and FF on liver fat accumulation, liver tissue samples 221
were compared using morphology analysis. Liver tissue in LSO group showed numerous fat 222
droplets throughout the hepatocyte, whereas no fat droplets were detected in the hepatocytes 223
of FO and both FF groups (Fig. 1B). Hepatic triglyceride and total cholesterol levels were 224
significantly lower in FO and both FF groups than in LSO group. There was a main effect of 225
FO and FF and FO×FF interaction in the hepatic triglyceride and total cholesterol levels 226
(Fig. 1C and D). 227
228

12
Pancreas morphology and insulin positive area in islets 229
We examined whether fish oil and FF inhibit pancreatic islet hypertrophy. Haematoxylin 230
and eosin (H&E) staining revealed a markedly greater islet size in LSO group than in FO and 231
both FF groups (Fig. 2A). Statistical analysis of the data for pancreas morphology and insulin 232
positive area in islets was conducted one-way ANOVA, because the number of islets among 233
groups is too different to compare by two-way ANOVA. Pancreatic islets area was 234
significantly lower in FO and FO/FF groups than in LSO group (Fig. 2A and D). Also, islet 235
density (islet number /section) results were similar trends (15.3 ± 3.8, 7.3 ± 3.2, 4.8 ± 2.2 and 236
4.8 ± 1.3 in LSO, FO, LSO/FF and FO/FF, respectively). Insulin positive area in islets was 237
significantly higher in FO and both FF groups than in LSO group (Fig. 2B and E). However, 238
glucagon positive area did not differ significantly among the groups (Fig. 2C and F). 239
240
Hepatic expression of genes involved in lipid metabolism 241
To examine the effects of fish oil and FF on lipid metabolism in the liver, hepatic 242
expression of mRNA encoding enzymes involved in lipid metabolism was measured. Only 243
minor differences were observed in SREBP-1c mRNA levels among the groups. However, 244
the mRNA levels of insulin induced gene 1 (Insig-1), stearoyl-CoA desaturase 1 (SCD-1) and 245
fatty acid synthase (FAS) tended to be greatly lower in both FO groups, with or without FF. 246
There was a main effect of FO, but no main effect of FF and FO×FF interaction in the 247
mRNA levels of Insig-1, SCD-1 and FAS. The mRNA levels of microsomal triglyceride 248
transfer protein were significantly higher in both FF groups than in FF-free groups, showing a 249
main effect of FO and FF, but no main effect of FO×FF interaction (Fig. 3). 250
The mRNA levels of AOX and UCP-2, which are related to fatty acid oxidation and heat 251
production, respectively, were significantly higher in both FF groups. There was a main effect 252

13
of FF, but no main effect of FO and FO×FF interaction in the mRNA levels of AOX and 253
UCP-2 (Fig. 4). 254
255
Discussion 256
In this study, we evaluated the effects of fish oil and FF on the pancreatic islet hypertrophy 257
and observed the modification of glucose and lipid dysfunction in KK mice with insulin 258
resistance. 259
The diet containing fish oil significantly decreased final body weight and parametrial WAT 260
weight in KK mice, which correlates with our previous results [23, 26]. 261
FF treatment in the C57BL/6 mice has been resulted in liver weight increase that is caused 262
by a peroxisome proliferation [27, 28]. In the present study also, the 0.1% FF treatment in the 263
female KK mice increased the liver weights. 264
Fish oil consumption reduces the risk of developing a cardiovascular disease by decreasing 265
the plasma triglyceride concentration [4, 5]. However, in the present study, the fish oil dose 266
used in this study did not decrease the plasma triglyceride level. These results are consistent 267
with our previous studies [23, 26]. We have been also observed that plasma triglyceride levels 268
were markedly decreased in female KK mice fed 50 en% fish oil diet (data not shown). It 269
appears that 25 en% fish oil is not sufficient to decrease plasma triglyceride level caused by 270
the obese state of female KK mice. 271
Fish oil can induce AOX and UCP-2 mRNA expression through PPARα activation [16, 272
17]. In the present study, fish oil cannot induce AOX and UCP-2 mRNA expression in the 273
liver, perhaps because 25 en% fish oil are insufficient for the induction of fatty acid β-274
oxidation. In contrast, 0.1% FF supplementation induced fatty acid oxidation through an 275
increase in AOX and UCP-2 mRNA expression. 276
14
FF is known as an agonist of PPARα; it induces fatty acid β-oxidation and lowers hepatic 277
fat accumulation [20, 23]. The present study shows that FF-supplemented diets decreased 278
hepatic triglycerides and total cholesterol with or without fish oil. And, FF reduced both final 279
body weight and fat mass as well as plasma insulin levels. On the other hand, other studies 280
have shown that FF increases hepatic peroxisome proliferation and liver weight, resulting in 281
elevated AST and ALT levels [29, 30]. In the present study, although liver weights were 282
increased in both FF groups, and AST and ALT levels remained within the normal range. 283
These data suggest that 0.1% FF is sufficient for amelioration of genetic abnormalities in 284
lipid and glucose metabolism (regardless of the dietary fat source) without the risk of liver 285
damage. 286
The basal plasma insulin level is markedly higher in KK mice (2–3 pmol/L) than in 287
C57BL/6 mice (0.2–0.3 pmol/L), and obesity-prone KK mice develop hyperinsulinemia [23, 288
31]. In the present study, the plasma insulin level and the HOMA-IR index were extreamly 289
high in LSO group (fasting insulin 1.5 pmol/L, HOMA-IR 101). And, fish oil and/or FF 290
markedly decreased the plasma insulin level and HOMA-IR similar to those of non-obese, 291
non-diabetic C57BL/6 mice. Thus, we suggest that 25 en% fish oil and/or 0.1 wt% FF are 292
sufficient to protect obesity- and diabetes- prone KK mice from insulin resistance. 293
Many studies have linked obesity and insulin resistance with hypertrophy and hyperplasia 294
of pancreatic islet cells [32, 33]. According to our results, pancreatic islet hypertrophy and 295
islet density were markedly suppressed, and, insulin positive area was significantly increased 296
by both fish oil and FF. However, it is likely that fish oil has a stronger therapeutic effect on 297
islet hypertrophy. Further research is required to clarify the therapeutic effects of fish oil and 298
FF on pancreatic islet hypertrophy and insulin resistance. 299
Adiponectin released from adipose cells inhibits gluconeogenesis and increases glucose 300

15
uptake and fatty acid oxidation, resulting in enhanced insulin sensitivity [34, 35]. In the 301
present study, plasma adiponectin levels were significantly higher in FO group but not in any 302
FF-treated group. This result indicates that fish oil enhance insulin sensitivity by increasing 303
plasma adiponectin; however, the beneficial effects of FF on body weight and insulin 304
resistance are independent of the plasma adiponectin level. These results suggest that there is 305
a diversity of relationships between the plasma adiponectin levels and insulin resistance. 306
307
Conclusions 308
Our results suggest that fish oil and FF improve pancreatic islet hypertrophy with the 309
amelioration of insulin resistance, and positively modulate glucose and lipid metabolism in 310
obesity and diabetes female KK mice. And, these good effects of fish oil and FF may be via a 311
different way. 312
313
Abbreviations 314
ACC, acetyl-CoA carboxylase; ALT, alanine aminotransferase; AST, aspartate 315
aminotransferase; AOX, acyl-CoA oxidase; DHA, docosahexaenoic acid; EPA, 316
eicosapentaenoic acid; FAS, fatty acid synthase; FF, fenofibrate; FO, fish oil; H&E, 317
haematoxylin eosin; HOMA-IR, homeostasis model assessment for insulin resistance; PPAR, 318
peroxisome proliferator-activated receptor; SCD, stearoyl-CoA desaturase; SREBPs, sterol 319
regulatory element-binding proteins; UCP, uncoupling protein; WAT, white adipose tissue. 320
321
Acknowledgements 322
We would like to thank Itaru Kondo and Misato Honda for their assistance and NOF 323
Corporation (Tokyo, Japan) for providing fish oil. 324

16
325
Conflict of interest 326
The authors have nothing to declare. 327
References 328
[1] Lawrence GD. Dietary fats and health: dietary recommendations in the context of scientific 329
evidence. Adv Nutr 2013; 4: 294-302. 330
[2] Meshkani R, Adeli K. Hepatic insulin resistance, metabolic syndrome and cardiovascular 331
disease. Clin Biochem 2009; 42: 1331-46. 332
[3] Wang CY, Liao JK. A mouse model of diet-induced obesity and insulin resistance. Methods 333
Mol Biol 2012; 821: 421-33. 334
[4] Iso H, Kobayashi M, Ishihara J, Sasaki S, Okada K, Kita Y, et al. Intake of fish and n3 335
fatty acids and risk of coronary heart disease among Japanese: the Japan Public Health 336
Center-Based (JPHC) Study Cohort I. Circulation 2006; 113: 195-202. 337
[5] Flachs P, Rossmeisl M, Bryhn M, Kopecky J. Cellular and molecular effects of n-3 338
polyunsaturated fatty acids on adipose tissue biology and metabolism. Clin Sci 2009; 116: 1-339
16. 340
[6] Jump DB. N-3 polyunsaturated fatty acid regulation of hepatic gene transcription. Curr 341
Opin Lipidol 2008; 19: 242-7. 342
[7] Davidson MH. Mechanisms for the hypotriglyceridemic effect of marine omega-3 fatty 343
acids. Am J Cardiol 2006; 98: 27i-33i. 344
[8] Nakatani T, Kim H, Kaburagi Y, Yasuda K, Ezaki O. A low fish oil inhibits SREBP-1 345
proteolytic cascade, while a high-fish-oil feeding decreases SREBP-1 mRNA in mice liver: 346
relationship to anti-obesity. J Lipid Res 2003; 44: 369-79. 347
[9] Amemiya-Kudo M, Shimano H, Hasty AH, Yahagi N, Yoshikawa T, Matsuzaka T, et al. 348

17
Transcriptional activities of nuclear SREBP-1a, -1c, and -2 to different target promoters of 349
lipogenic and cholesterogenic genes. J Lipid Res 2002; 43: 1220-35. 350
[10] Brown MS, Goldstein JL. The SREBP pathway regulation of cholesterol metabolism by 351
proteolysis of a membrane-bound transcription factor. Cell 1997; 89: 331-40. 352
[11] Horton JD, Goldstein JL, Brown MS. SREBPs activators of the complete program of 353
cholesterol and fatty acid synthesis in the liver. J Clin Invest 2002; 109: 1125-31. 354
[12] Zhu H, Fan C, Xu F, Tian C, Zhang F, Qi K. Dietary fish oil n-3 polyunsaturated fatty 355
acids and alpha-linolenic acid differently affect brain accretion of docosahexaenoic acid and 356
expression of desaturases and sterol regulatory element-binding protein 1 in mice. J Nutr 357
Biochem 2010; 21: 954-60. 358
[13] Morise A, Thomas C, Landrier JF, Besnard P, Hermier D. Hepatic lipid metabolism 359
response to dietary fatty acids is differently modulated by PPARalpha in male and female 360
mice. Eur J Nutr 2009; 48: 465-73. 361
[14] Issemann I, Green S. Activation of a member of the steroid hormone receptor 362
superfamily by peroxisome proliferators. Nature 1990; 347: 645-50. 363
[15] Schoonjans K, Staels B, Auwerx, J. The peroxisome proliferator activated receptors 364
(PPARS) and their effects on lipid metabolism and adipocyte differentiation. Biochim 365
Biophys Acta 1996; 1302: 93-109. 366
[16] Krey G, Braissant O, L'Horset F, Kalkhoven E, Perroud M, Parker MG, et al. Fatty acids, 367
eicosanoids, and hypolipidemic agents identified as ligands of peroxisome proliferator-368
activated receptors by coactivator-dependent receptor ligand assay. Mol Endocrinol 1997; 11: 369
779-91. 370
[17] Kim H, Takahashi M, Ezaki O. Fish oil feeding decreases mature sterol regulatory 371
element-binding protein 1 (SREBP-1) by down-regulation of SREBP-1c mRNA in mouse 372
liver. A possible mechanism for down-regulation of lipogenic enzyme mRNAs. J Biol Chem 373

18
1999; 274: 25892-8. 374
[18] Seo YS, Kim JH, Jo NY, Choi KM, Baik SH, Park JJ, et al. PPAR agonists treatment is 375
effective in a nonalcoholic fatty liver disease animal model by modulating fatty-acid 376
metabolic enzymes. J Gastroenterol Hepatol 2008; 23: 102-9. 377
[19] Jeong S, Han M, Lee H, Kim M, Kim J, Nicol CJ, et al. Effects of fenofibrate on high-fat 378
diet-induced body weight gain and adiposity in female C57BL/6J mice. Metabolism 2004; 379
53: 1284-9. 380
[20] Ikewaki K, Tohyama J, Nakata Y, Wakikawa T, Kido T, Mochizuki S. Fenofibrate 381
effectively reduces remnants, and small dense LDL, and increases HDL particle number in 382
hypertriglyceridemic men - a nuclear magnetic resonance study. J Atheroscler Thromb 2004; 383
11: 278-85. 384
[21] Tokuno A, Hirano T, Hayashi T, Mori Y, Yamamoto T, Nagashima M, et al. The effects 385
of statin and fibrate on lowering small dense LDL- cholesterol in hyperlipidemic patients 386
with type 2 diabetes. J Atheroscler Thromb 2007; 14: 128-32. 387
[22] Arai T, Kim H, Chiba H, Matsumoto A. Interaction of fenofibrate and fish oil in relation 388
to lipid metabolism in mice. J Atheroscler Thromb 2009; 16: 283–91. 389
[23] Arai T, Kim H, Chiba H, Matsumoto A. Anti-obesity effect of fish oil and fish oil-390
fenofibrate combination in female KK mice. J Atheroscler Thromb 2009; 16: 674-83. 391
[24] Ikemoto S, Takahashi M, Tsunoda N, Maruyama K, Itakura H, Ezaki O. High fat diet-392
induced hyperglycemia and obesity in mice: differential effects of dietary oils. Metabolism 393
1996; 45: 1539-46. 394
[25] Folch J, Lees M, Sloane Stanley GH. A simple method for the isolation and purification 395
of total lipids from animal tissues. J Biol Chem 1957; 226: 497-509. 396
[26] Arai T, Kim H, Hirako S, Nakasatomi M, Chiba H, Matsumoto A. Effects of dietary fat 397
energy restriction and fish oil feeding on hepatic metabolic abnormalities and insulin 398

19
resistance in KK mice with high-fat diet-induced obesity. J Nutr Biochem 2013; 24: 267-73. 399
[27] Lu Y, Boekschoten MV, Wopereis S, Müller M, Kersten S. Comparative transcriptomic 400
and metabolomic analysis of fenofibrate and fish oil treatments in mice. Physiol Genomics 401
2011; 43: 1307-18. 402
[28] Gao M, Bu L, Ma Y, Liu D. Concurrent activation of liver X receptor and peroxisome 403
proliferator-activated receptor alpha exacerbates hepatic steatosis in high fat diet-induced 404
obese mice. PLOS ONE 2013; 8: 1-11. 405
[29] Oosterveer MH, Grefhorst A, van Dijk TH, Havinga R, Staels B, Kuipers F, et al. 406
Fenofibrate simultaneously induces hepatic fatty acid oxidation, synthesis, and elongation in 407
mice. J Biol Chem 2009; 284: 34036-44. 408
[30] Kobayashi A, Suzuki Y, Kuno H, Sugai S, Sakakibara H, Shimoi K. Effects of 409
fenofibrate on plasma and hepatic transaminase activities and hepatic transaminase gene 410
expression in rats. J Toxicol Sci 2009; 34: 377-87. 411
[31] Thakker GD, Frangogiannis NG, Bujak M, Zymek P, Gaubatz JW, Reddy AK, et al. 412
Effects of diet-induced obesity on inflammation and remodeling after myocardial infarction. 413
Am J Physiol Heart Circ Physiol 2006; 291: H2504- 14. 414
[32] Kawashima S, Matsuoka T, Kaneto H, Tochino Y, Kato K, Yamamoto K, et al.: Effect of 415
alogliptin, pioglitazone, increased islet volume but unchanged islet number in ob/ob mice. 416
Biochem Biophys Res Commun 2011; 404: 534-40. 417
[33] Kargar C, Ktorza A: Anatomical versus functional β-cell mass in experimental diabetes. 418
Diabetes Obes Metab 2008; 10: 43-53. 419
[34] Trujillo ME, Scherer PE. Adiponectin-journey from an adipocyte secretory protein to 420
biomarker of the metabolic syndrome. J Intern Med 2005; 257: 167-75. 421
[35] Yamauchi T, Kamon J, Minokoshi Y, Ito Y, Waki H, Uchida S, , et al. Adiponectin 422
stimulates glucose utilization and fatty-acid oxidation by activating AMP-activated protein 423

20
kinase. Nat Med 2002; 8: 1288-95. 424

21
Figure legends 425
426
Figure 1 427
Effects of fish oil and fenofibrate on body weight, hepatic fat accumulation, hepatic 428
triglyceride and total cholesterol levels of diabetic KK mice. LSO, lard/safflower oil; FO, fish 429
oil; FF, fenofibrate. Mice were fed the indicated experimental diets for 9 weeks. (A) Body 430
weights, (B) liver morphology, (C) hepatic triglyceride and (D) hepatic total cholesterol. 431
Body weights were plotted until 9 weeks. Liver tissues from 4 to 5 mice in each group were 432
embedded in paraffin, stained with H&E, and examined under a microscope (400×). Values 433
represent mean ± S.D. (n = 4-5).Two-way ANOVA results are shown at the bottom of the 434
each figure. NS, not significant. 435
436
Figure 2 437
Effects of fish oil and fenofibrate on morphology of pancreatic islet in diabetic KK mice. 438
LSO, lard/safflower oil; FO, fish oil; FF, fenofibrate. Mice were fed the indicated 439
experimental diets for 9 weeks. (A) Islet stained with H&E, (B) islet marked with insulin 440
antibodies, (C) islet marked with glucagon antibodies, (D) islets area, (E) insulin positive area 441
and (F) glucagon positive area. Pancreatic tissues from 4 to 5 mice in each group were 442
embedded in paraffin, and stained with H&E, insulin and glucagon antibodies. Then, the 443
tissue section examined under a microscope (400×). The core of the pancreatic islet consists 444
of insulin-positive beta cells surrounded by glucagon-positive alpha cells (arrow). Insulin and 445
glucagon positive areas were represented as a percentage of the islets areas. (D, E) The data 446
were compared by one-way ANOVA, followed by the Tukey-Kramer test. Groups sharing 447
different letters significantly different (P < 0.05). 448

22
449
Figure 3 450
Effects of fish oil and fenofibrate on hepatic mRNA expression of genes involved in fatty 451
acid synthesis in diabetic KK mice. LSO, lard/safflower oil; FO, fish oil; FF, fenofibrate. Mice 452
were fed the indicated experimental diets for 9 weeks. Panels show mRNA expression levels 453
of (A) SREBP-1c, (B) Insig-1, (C) FAS, (D) SCD-1 and (E) MTP. mRNA levels were 454
determined by real-time quantitative PCR. Results are expressed as the ratio of the obtained 455
value to that of LSO group. Values represent mean ± S.D. (n = 4-5). Two-way ANOVA results 456
are shown at the bottom of the each figure. NS, not significant. 457
458
Figure 4 459
Effects of fish oil and fenofibrate on hepatic mRNA expression of genes involved in fatty 460
acid oxidation and cholesterol metabolism in diabetic KK mice. LSO, lard/safflower oil; FO, 461
fish oil; FF, fenofibrate. Mice were fed the indicated experimental diets for 9 weeks. Panels 462
show mRNA expression levels of (A) AOX and (B) UCP-2. mRNA levels were determined by 463
real-time quantitative PCR. Results are expressed as the ratio of the obtained value to that of 464
LSO group. Values represent mean ± S.D. (n = 4-5). Two-way ANOVA results are shown at 465
the bottom of the each figure. NS, not significant. 466
467
468
469
470
471
472

23
473

Table 1 Composition of the experimental diets
Ingredient (g) LSO FO LSO/FF FO /FFLard 4.20 4.20 Safflower oil 6.30 6.30 Fish oil 10.50 10.50 Casein 21.00 21.00 21.00 21.00 Sucrose 10.50 10.50 10.50 10.50 β-Starch 47.45 47.45 47.45 47.45 Vitamin mixa 1.31 1.31 1.31 1.31 Mineral mixa 3.68 3.68 3.68 3.68 Cellulose powder 5.25 5.25 5.25 5.25 L-Cystine 0.32 0.32 0.32 0.32 t-Butylhydroquinone 0.0021 0.0021 0.0021 0.0021
Fenofibrate 0.1 0.1
Total (g) 100.0 100.0 100.1 100.1Total energy (kcal/100g) 386.6 385.8 386.4 385.6 Fat energy (kcal/100g) 97.4 96.6 97.4 96.5Fat energy( % ) 25.2 25.0 25 .2 25 .0LSO, lard/safflower oil; FO, fish oil; FF, fenofibrate. a Vitamin mix and mineral mix were prepared according to the American Institute of Nutrition (AIN)-93G formulation. Vitamin mix included 0.25% sucrose for chorine bitartrate supplementation.

Table 2 Primer sequences for real-time PCR amplification
Genes Forward primer (5’-3’) Reverse primer (3’-5’)SREBP-1c GGAGCCATGGATTGCACATT GGCCCGGGAAGTCACTGTInsig-1 TCACAGTGACTGAGCTTCAGCA TCATCTTCATCACACCCAGGACFAS TCACCACTGTGGGCTCTGCAGAGAAGCGAG TGTCATTGGCCTCCTCAAAAAGGGCGTCCASCD-1 CCGGAGACCCCTTAGATCGA TAGCCTGTAAAAGATTTCTGCAAACCMTP GCTCCCTCAGCTGGTGGAT CAGGATGGCTTCTAGCGAGTCTAOX TCAACAGCCCAACTGTGACTTCCATTA TCAGGTAGCCATTATCCATCTCTTCAUCP-2 GTTCCTCTGTCTCGTCTTGC GGCCTTGAAACCAACCAGAPDH TGTGTCCGTCGTGGATCTGA CCTGCTTCACCACCTTCTTGATSREBP-1c, sterol regulatory element binding protein 1; Insig-1, insulin induced gene 1; FAS, fatty acid synthase; SCD-1, stearoyl-CoA desaturase 1; MTP, microsomal triglyceride protein; AOX, acyl-coenzyme A oxidase; UCP-2, uncoupling protein 2; GAPDH, glyceraldehyde-3-phosphate dehydrogenase.
Groups
Final body weight (g)
Initial body weight (g) 24.7±1.4 24.6±0.9 24.7±1.3 24.6±0.7
46.0±4.7 39.2±2.7 37.7±1.8 39.3±1.6
Liver weight (g) 2.88±0.93 1.50±0.24 3.30±0.16 3.53±0.12
4.62±0.67 3.34±0.43 2.78±0.49 2.88±0.31
0.50±0.07 0.53±0.22 0.33±0.03 0.41±0.10
Table 3 Effects of fish oil and fenofibrate on body weights, tissue weights, and liver function makers of diabetic KKmice
FO/FFLSO/FFLSO FO
LSO, lard/safflower oil; FO, fish oil; FF, fenofibrate; WAT, white adipose tissue; AST, aspartate aminotransferase; ALT, alanine aminotransferase. aDaily food energy intake calculated on the basis of total energy for each experimental diet. Values represent the mean ± S.D. (n=4-5). NS, not significant.
Parametrial WAT weight (g)
Perirenal WAT weight (g)
AST activity (IU/L) 20.9±5.8 35.6±13.5 19.6±7.4 35.1±7.9
ALT activity (IU/L) 6.7±2.1 6.2±3.9 10.9±5.7 11.3±2.2
Body and tissue weights
Liver function makers
Food intake (kcal/mouse/day) a 17.0 15.3 16.4 15.4
Two-way ANOVA P-values
FO FF FO×FF
NSNS NS
<0.010.0678 <0.01
NS<0.01 NS
<0.05NS NS
<0.01<0.05 <0.01
<0.05NS NS
<0.01<0.05 <0.01
-- -

Table 4 Effects of fish oil and fenofibrate on glucose homeostasis makers and plasma biochemical makers of diabetic KK mice
LSO, lard/safflower oil; FO, fish oil; FF, fenofibrate; HOMA-IR, homeostasis model assessment for insulin resistance; NEFA, non-esterified fatty acid. Values represent the mean ± S.D. (n=4-5). NS, not significant.
Blood glucose (mmol/L)
Plasma insulin (pmol/L)
Adiponectin (μg/mL)
1.52±0.62 0.47±0.34 0.31±0.22 0.18±0.06
17.4±4.4 31.1±7.8 21.6±1.5 21.8±2.6
Leptin (ng/mL) 28.5±1.4 28.0±2.7 22.4±7.4 27.0±3.0
HOMA-IR
10.6±2.6 10.6±2.5 13.1±1.8 11.5±1.3
101±25 30±20 29±24 14±6
Total cholesterol (mmol/L)
NEFA (mmol/L)
Triglyceride (mmol/L) 1.29±0.53 1.25±0.13 1.26±0.18 0.87±0.25
4.56±0.81 1.94±0.09 5.35±0.45 3.54±0.37
0.92±0.30 0.31±0.09 0.52±0.08 0.22±0.08
Glucose homeostasis makers
Plasma biochemical makers
Groups
FO/FFLSO/FFLSO FO
Two-way ANOVA P-values
FO FF FO×FF
NSNS NS
NS<0.01 <0.01
NSNS NS
<0.01<0.01 NS
NSNS NS
<0.01<0.01 <0.05
<0.01<0.01 <0.01
<0.01<0.01 0.0561

(A)
LSO FO
LSO/FF FO/FF
100μm
(B)
(D)(C)
Bo
dy
wei
ght
,g
Weeks
10
20
30
40
50
60
0 1 2 3 4 5 6 7 8 9
* **
**
**
§ § †§†§ †§ †§
†§
LSO
LSO/FF
FO
FO/FF
0
50
100
150
200
Hep
atic
tri
glyc
erid
e, m
g/g
FO FO/FFLSO LSO/FF Hep
atic
to
tal c
ho
lest
ero
l,m
g/g
0
10
20
30
40
50
FO FO/FFLSO LSO/FF
Figure 1
FO; P<0.01 FF; P<0.01
FO×FF; P<0.01
FO; P=0.0678 FF; P<0.01
FO×FF; P<0.01
Body weight (9 weeks old)
FO; P<0.01 FF; P<0.01
FO×FF; P<0.01

(A)
LSO FO/FF
(B)
(C)
Figure 2
50μm
50μm
FO LSO/FF
50μm
(D)
0
50
100
150
200
250
300
Isle
tsar
ea, µ
m2/1
03µ
m2
b
a
b
ab
FO FO/FFLSO LSO/FF FO FO/FFLSO LSO/FFG
luca
gon
po
siti
ve a
rea,
%0
0.1
0.2
0.3
0.4
0.5
0.6
0FO FO/FFLSO LSO/FF
Insu
lin p
osi
tive
are
a, %
10
20
30
40
50
60
70
80
90aab
b
c

(A) (B)
(E)
Figure 3
(C) (D)
0
1
2
3
SREB
P-1
c
FO FO/FFLSO LSO/FF0
1
2
3
Insi
g-1
FO FO/FFLSO LSO/FF
0
1
2
3
MTP
FO FO/FFLSO LSO/FF
SCD
-1
0
1
2
3
FO FO/FFLSO LSO/FF
FAS
0
1
2
3
FO FO/FFLSO LSO/FF
FO; NS FF; NS
FO×FF; NS
FO; P<0.05 FF; NS
FO×FF; NS
FO; P<0.05 FF; NS
FO×FF; NS
FO; P<0.01 FF; NS
FO×FF; NS
FO; P<0.01 FF; P<0.01
FO×FF; NS

Figure 4
0
2
4
6 (B)
UC
P-2
0
2
4
6
8
AO
X
(A)
FO FO/FFLSO LSO/FF FO FO/FFLSO LSO/FF
FO; NS FF; P<0.01
FO×FF; NS
FO; NS FF; P<0.01
FO×FF; NS
![Reorganization of Acyl Flux through the Lipid Metabolic ... · Reorganization of Acyl Flux through the Lipid Metabolic Network in Oil-Accumulating Tobacco Leaves1[OPEN] Xue-Rong Zhou,a](https://img.pdfslide.us/doc/110x75/600d53e6e9c612776c5ae95a/reorganization-of-acyl-flux-through-the-lipid-metabolic-reorganization-of-acyl.jpg)