Embed Size (px)
Citation preview
Tree-Soil-Crop Interactions
Meine van Noordwijk and Kurniatun Hairiah
I N T E R N A T I O N A L C E N T R E F O R R E S E A R C H I N A G R O F O R E S T R Y

ICRAF's "Lecture notes" have been developed by its scientific staff in support of variousgroup training activities organised by the Centre. Views expressed are those of the author(s)and should not be taken to represent the views of ICRAF or any other organisation.Comments and suggestions are invited and can be addressed to the editors, KurniatunHairiah and Bruno Verbist or to the author(s) themselves. These notes are periodicallyreviewed and updated to reflect advances in agroforestry research and development. Theyare made available to ICRAF trainees, collaborators, lecturers, ….
These lecture notes are mainly developed in support of the training-of-trainers course on‘Agroforestry for improved land use and livelihood systems in Southeast Asia’, which tookplace in Chiang Mai from 8-20 March 1999, and its follow-up activities, both sponsored bythe Netherlands’ Government through DSO. However the materials are also meant torespond to the need for teaching materials formulated by universities and technical collegesin the region.
The development of these lecture notes was mainly supported by the Ministry of ForeignAffairs, the Netherlands Directorate General International Cooperation (DGIS) CulturalCooperation, Education and Research Department Education and Developing CountriesDivision (DCO/OO). Other collaborators and donors were the University of Brawijaya(UNIBRAW) and the Flemish Office for Development Cooperation and TechnicalAssistance (VVOB). Their generous support is hereby acknowledged.
Bogor, Indonesia
April 2000
Tree-Soil-Crop Interactions
Meine van Noordwijk and Kurniatun Hairiah

Published in April 2000
Published by:International Centre for Research in AgroforestrySoutheast Asian Regional Research ProgrammePO Box 161, Bogor, IndonesiaTel: +62 251 625415; fax: +62 251 625416; email: [email protected] site: http://www.icraf.cgiar.org/sea
© copyright ICRAF Southeast Asia
Cover illustration: Wiyono
Layout: T Atikah
1
Lecture note 2
TREE- SOIL- CROP INTERACTIONSBy Meine van Noordwijk and Kurniatun Hairiah
I. Objectives• Discuss the various positive and negative tree-crop interactions illustrated
with the example of a simultaneous agroforestry system• Illustrate how these interactions can be quantified from a bio-physical point
of view• Demonstrate how these common principles can be applied in a wide array
of situation-dependent agroforestry systems, rather than using blueprintmodels.
II. Lecture
5. 1. Background/General scheme
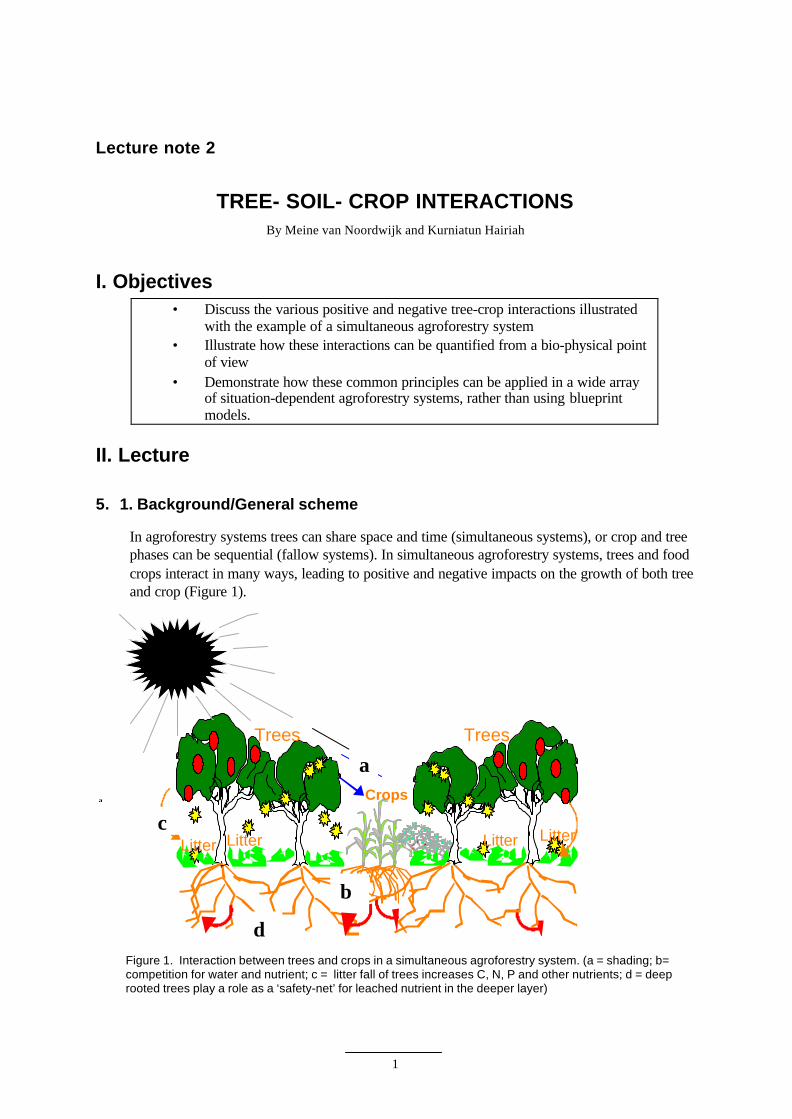
In agroforestry systems trees can share space and time (simultaneous systems), or crop and treephases can be sequential (fallow systems). In simultaneous agroforestry systems, trees and foodcrops interact in many ways, leading to positive and negative impacts on the growth of both treeand crop (Figure 1).
a
Figure 1. Interaction between trees and crops in a simultaneous agroforestry system. (a = shading; b=competition for water and nutrient; c = litter fall of trees increases C, N, P and other nutrients; d = deeprooted trees play a role as a ‘safety-net’ for leached nutrient in the deeper layer)
b
d
TreesTrees
Crops
LitterLitterLitterLitter
Sun light
a
b
c
d
2
Discussion Question 1:
Consider three forms of simultaneous agroforestry systems relevant in your area:• Can you recognise all interaction processes for all systems?• Which interactions depend on climate, which on soil type and which on crop and tree
type? What interactions can be influenced by management?• What is the overall balance of positive and negative effects?
2. Tree-crop interactions
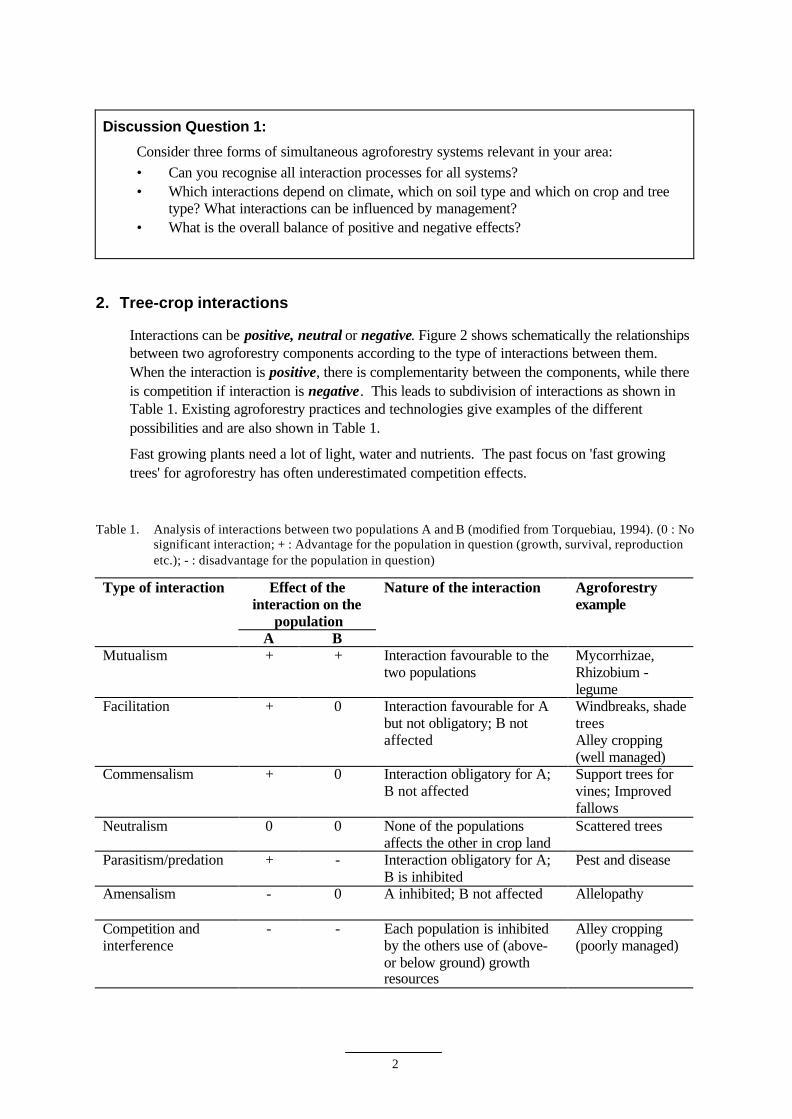
Interactions can be positive, neutral or negative. Figure 2 shows schematically the relationshipsbetween two agroforestry components according to the type of interactions between them.When the interaction is positive, there is complementarity between the components, while thereis competition if interaction is negative. This leads to subdivision of interactions as shown inTable 1. Existing agroforestry practices and technologies give examples of the differentpossibilities and are also shown in Table 1.
Fast growing plants need a lot of light, water and nutrients. The past focus on 'fast growingtrees' for agroforestry has often underestimated competition effects.
Table 1. Analysis of interactions between two populations A and B (modified from Torquebiau, 1994). (0 : Nosignificant interaction; + : Advantage for the population in question (growth, survival, reproductionetc.); - : disadvantage for the population in question)
Effect of theinteraction on the
population
Type of interaction
A B
Nature of the interaction Agroforestryexample
Mutualism + + Interaction favourable to thetwo populations
Mycorrhizae,Rhizobium -legume
Facilitation + 0 Interaction favourable for Abut not obligatory; B notaffected
Windbreaks, shadetreesAlley cropping(well managed)
Commensalism + 0 Interaction obligatory for A;B not affected
Support trees forvines; Improvedfallows
Neutralism 0 0 None of the populationsaffects the other in crop land
Scattered trees
Parasitism/predation + - Interaction obligatory for A;B is inhibited
Pest and disease
Amensalism - 0 A inhibited; B not affected Allelopathy
Competition andinterference
- - Each population is inhibitedby the others use of (above-or below ground) growthresources
Alley cropping(poorly managed)

3
Crop output Crop output Crop output
Figure 2. Complementary (a), supplementary (b), or competitive (c) interactions between agroforestrycomponents (Torquebiau, 1994).
3. Tree-soil -crop interactions
A more elaborate list of positive and negative interactions:
Negative interaction (Interference)
a. Shading by the trees, reducing light intensity at the crop levelb. Root competition between tree and crop for water and/or nutrients in the topsoil. Hereby the
tree root architecture is important. Shallow tree root systems are likely to compete morewith the crop for scarce nutrients, while deep tree roots can act as a 'nutrient pump' or'safety net' , where nutrients are so deep that they are out of reach for the crop roots
c. Trees and crops can be a host of each other’s pests and diseases.
Positive interaction (Facilitation)
a. Nutrient recycling can be based on:• Nutrients taken up in the topsoil by tree roots in competition with crops,• Nutrients taken up while leaching down to a deeper layer with tree roots acting as a
'safety net'.• Nutrients taken up from weathered minerals in deeper layer, with deep tree roots acting
as ‘nutrient pump'.b. Litter production. If litter is high quality (low C/N ratio, low lignin and polyphenolic
content), it will decompose rapidly and make nutrients available to the crop and the trees.c. Mulch: Litter of low quality (high C/N ratio, high lignin and polyphenolic content)
decomposes slowly and is suitable as mulch. Mulch maintains soil moisture during the dryseason. Especially on sandy soils, where water supply for the crops could be a problem,mulch is important.
d. Nitrogen supply by tree roots to crop roots, either due to root decay or root death followingtree pruning or by direct transfer if nodulated roots are in close contact with crop roots,
e. Tree and crop effects reducing weeds (by shading in relevant parts of the year) andreducing dry-season fire risks.
f. Tree and crop effects reducing pest and disease pressure by facilitating biological controlagents.
Tree
out
put
ab C

4
g. Tree effects on microclimate (reducing wind speed, increasing air humidity, providingpartial shade)
h. Long term effects on reducing erosion, maintaining soil organic matter content and soilstructure.
4. How to quantify tree-crop interactions?
The success of any intercropping depends on the balance of positive and negative interactionsbetween the components.
A simple equation is:
Equation 1:
With Ysystem = yield of tree + crop systemYtree = yield of tree productsYcrop = yield of crop productsYcrop,0 = crop yield in a monoculture on the same soilF = Positive effects of trees on crop growth via soil fertility improvementC = Negative effects via competition for light, water and nutrients.
The question whether or not agroforestry has any advantage over separate crop fields andwoodlots, can now be rephrased as:
Positive interaction, if F > C
Negative interaction, if F < C
Question is now: How can we identify, analyse and synthesise those various tree-soil-crop interactions?
Research offers a way out. A three-step approach is presented in Table 2 (Van Noordwijk et al.,1998). It links those overall terms to experimental treatments, process research and WaNuLCASas a synthesis model.
Ysystem = Ytree + Ycrop = Ytree + Ycrop,0 + F - C

5
Table 2. A direct experimental separation of the terms in the equation is combined with quantificationof key processes and followed by model synthesis to explore management options and system-sitematching.
Yc = Y0 + F1 + Fω + Cl + Cw+n + M
Crop yieldininteraction
Crop yield inmonoculture
Directfertilityeffect
Long termfertilityeffect
Competitionfor light
Competitionfor waterandnutrients
Micro-climateeffects
1. Experimental method Mulchtransfer
Residualeffect (treeremoval vs.control)
Treeremovalvs. control
Rootbarriers
2. Process-levelunderstanding
Litter quality,mineralisationrates
Functionalsoil organicmatterfractions
Canopyshape, lightprofiles
Rootarchitecture
3. Synthesis model W A N U L C A S
It must be recognised that the relative importance of different terms of the equation depends onthe agroforestry system, the environment and the management of the system. Simulation modelsare an important tool for predicting how these interactions depend on soil, climate, crop and treearchitecture and physiology. These three steps are further explained in the next paragraphs on'Process level understanding using experimental methods' and 'Synthesis model'.
5. Process level understanding using experimental methods
On-station field experiments are a way to test which processes are important under whatconditions.
Discussion Question 2:
Looking at equation 1, how can the positive and negative interactions (processes) in the threeagroforestry systems you discussed before be separated? Can you outline an experimentaltreatment, which allows you to measure F and or C separately?
How a scientist went about it, is explained in following case study.
Tree-crop interaction of a hedgerow intercropping system
An example of the approach in Table 1, tree-crop interactions was tested in a simpleagroforestry system. It was a long-term (8 years) hedgerow intercropping experiment on an acidsoil in North-Lampung, Sumatra, Indonesia with maize planted as a test crop.
Purpose of the experiment• To quantify the effect of hedgerow trees on light interception• To quantify root competition on water and nutrient uptake

6
• To quantify residual effects of hedgerow intercropping (after removing the hedgerowtrees)
• To quantify the differences in interactions of six different common hedgerow tree species
Treatments:
Six tree species were planted as hedgerows in 1986: (a) Peltophorum dasyrrachys, (b) Gliricidiasepium, (c) alternating rows of Peltophorum and Gliricidia , (d) Calliandra calothyrsus, (e)Leucaena leucocephala , and (f) Flemingia congesta . The control treatment was ‘planting nohedgerow trees’. Each plot in the control treatment was split into four subplots to test N-response:
• No fertiliser• 45 kg ha-1
• 90 kg ha-1
• 135 kg ha-1
How to set up experimental treatment to test tree-crop interactions?
From the above main treatment, following sub-treatments were set up to separate the positiveand negative interactions between tree and crop.
Parameter Experimental treatment
Shading • Without canopy pruning
• With canopy pruning
Competition of water andnutrient
• Without root barrier
• With root barrier
Mulching • Without mulch transfer
• With mulch transfer
Long term residual effect • Without tree removal
• With removal of complete hedgerowsTotal plot 8 sub plot per tree species
Results
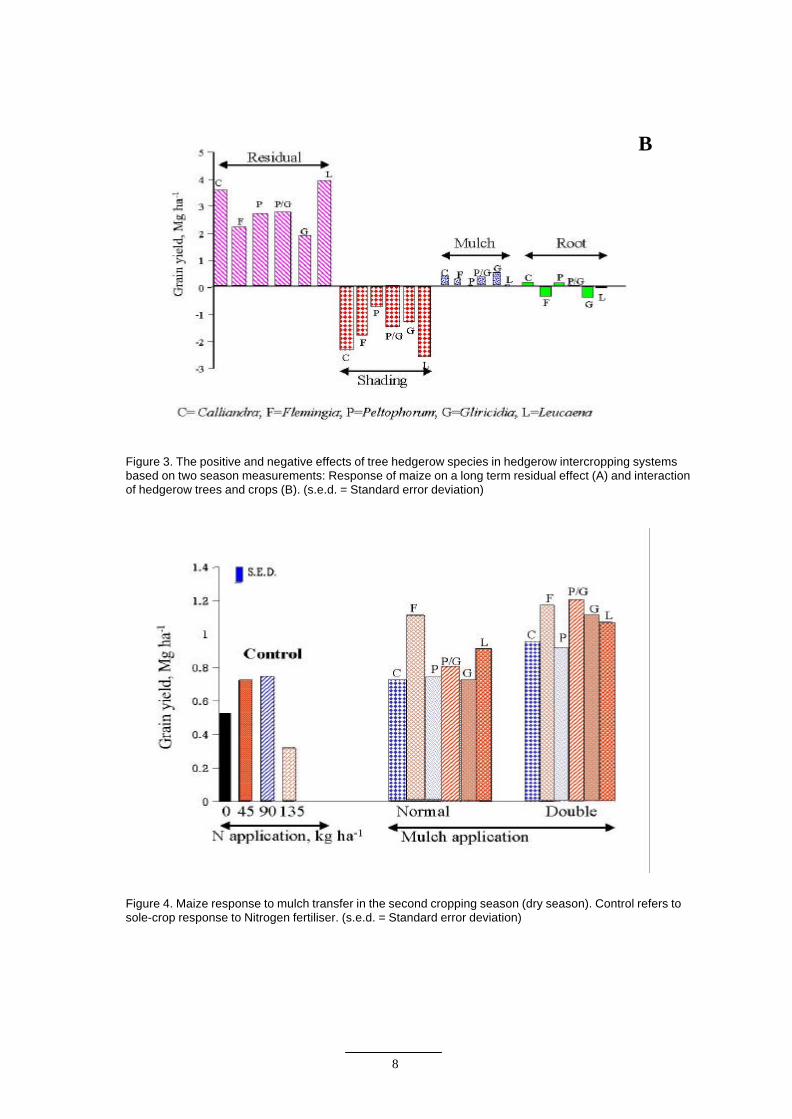
This on-station trial showed that only the local tree Peltophorum gave a consistent beneficialeffect on crop yields.
After 8 years the hedgerow trees were removed in part of the plots, and maize yields showed astrong positive response ('residual effect') based on soil fertility maintenance, relative to thecontinuously cropped control (Figure 3A). Maize yields (average of two seasons) in the plotsthat had grown Calliandra and Leucaena were significantly higher than those obtained with thehighest N-fertiliser rate tested (135 kg ha-1), showing a major below-ground residual effect ofthe N-fixing trees, which were just removed.
Under the normal hedgerow intercropping system, however, only Peltophorum gave maizeyields higher than those obtained in the control plot with N-application of 90 kg ha-1. Thedifference was largely due to aboveground interactions (shade), as the effects of fresh mulch
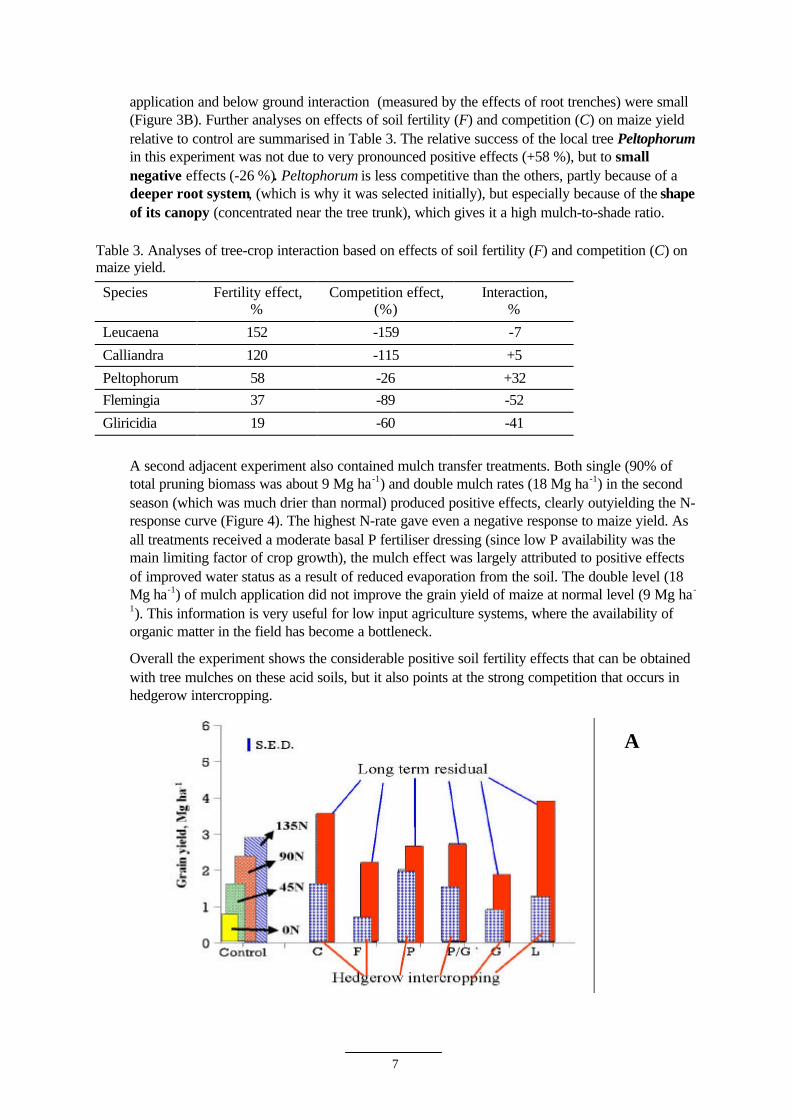
7
application and below ground interaction (measured by the effects of root trenches) were small(Figure 3B). Further analyses on effects of soil fertility (F) and competition (C) on maize yieldrelative to control are summarised in Table 3. The relative success of the local tree Peltophorumin this experiment was not due to very pronounced positive effects (+58 %), but to smallnegative effects (-26 %). Peltophorum is less competitive than the others, partly because of adeeper root system, (which is why it was selected initially), but especially because of the shapeof its canopy (concentrated near the tree trunk), which gives it a high mulch-to-shade ratio.
Table 3. Analyses of tree-crop interaction based on effects of soil fertility (F) and competition (C) onmaize yield.
Species Fertility effect,%
Competition effect,(%)
Interaction,%
Leucaena 152 -159 -7
Calliandra 120 -115 +5
Peltophorum 58 -26 +32Flemingia 37 -89 -52
Gliricidia 19 -60 -41
A second adjacent experiment also contained mulch transfer treatments. Both single (90% oftotal pruning biomass was about 9 Mg ha-1) and double mulch rates (18 Mg ha-1) in the secondseason (which was much drier than normal) produced positive effects, clearly outyielding the N-response curve (Figure 4). The highest N-rate gave even a negative response to maize yield. Asall treatments received a moderate basal P fertiliser dressing (since low P availability was themain limiting factor of crop growth), the mulch effect was largely attributed to positive effectsof improved water status as a result of reduced evaporation from the soil. The double level (18Mg ha-1) of mulch application did not improve the grain yield of maize at normal level (9 Mg ha-
1). This information is very useful for low input agriculture systems, where the availability oforganic matter in the field has become a bottleneck.
Overall the experiment shows the considerable positive soil fertility effects that can be obtainedwith tree mulches on these acid soils, but it also points at the strong competition that occurs inhedgerow intercropping.
A
8
Figure 3. The positive and negative effects of tree hedgerow species in hedgerow intercropping systemsbased on two season measurements: Response of maize on a long term residual effect (A) and interactionof hedgerow trees and crops (B). (s.e.d. = Standard error deviation)
Figure 4. Maize response to mulch transfer in the second cropping season (dry season). Control refers tosole-crop response to Nitrogen fertiliser. (s.e.d. = Standard error deviation)
B
9
6. Synthesis model
Mulch + shade model
Fast growing trees produce a lot of mulch material, but also cast a lot of shade. Van Noordwijk(1996a) presented explicit algebraic solutions for an agroforestry model, which links both themulch production and its ensuing soil fertility effect and the shading which is assumed to have anegative effect on crop yields to the biomass production of the tree. The model leads to a simplemulch/shade ratio as a basis for comparing tree species. The model also predicts that at low soilfertility, where the soil fertility improvement due to mulch can be pronounced, there is morechance that an agroforestry system improves crop yields than at higher fertility where thenegative effects of shading will dominate.
The mulch/shade model, however, does not incorporate the dynamic interactions between wateravailability, N dynamics, and crop and tree growth . Incorporating these elements on the basis ofa daily time step extends the model beyond what can be solved explicitly. It leads into the realmof dynamic simulation models, which keep track of resource stocks outside and inside the plantsand use these to calculate daily resource flows and daily resource capture.
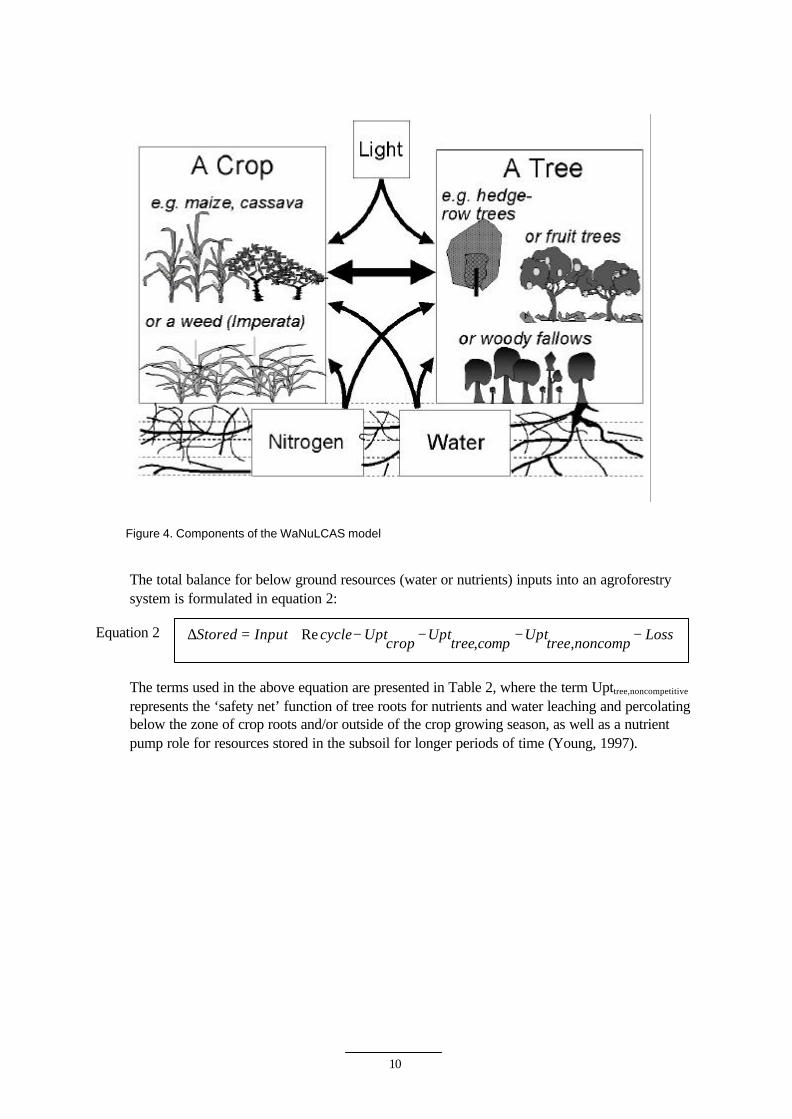
WaNulCas (Water Nutrient Light Capture) model.
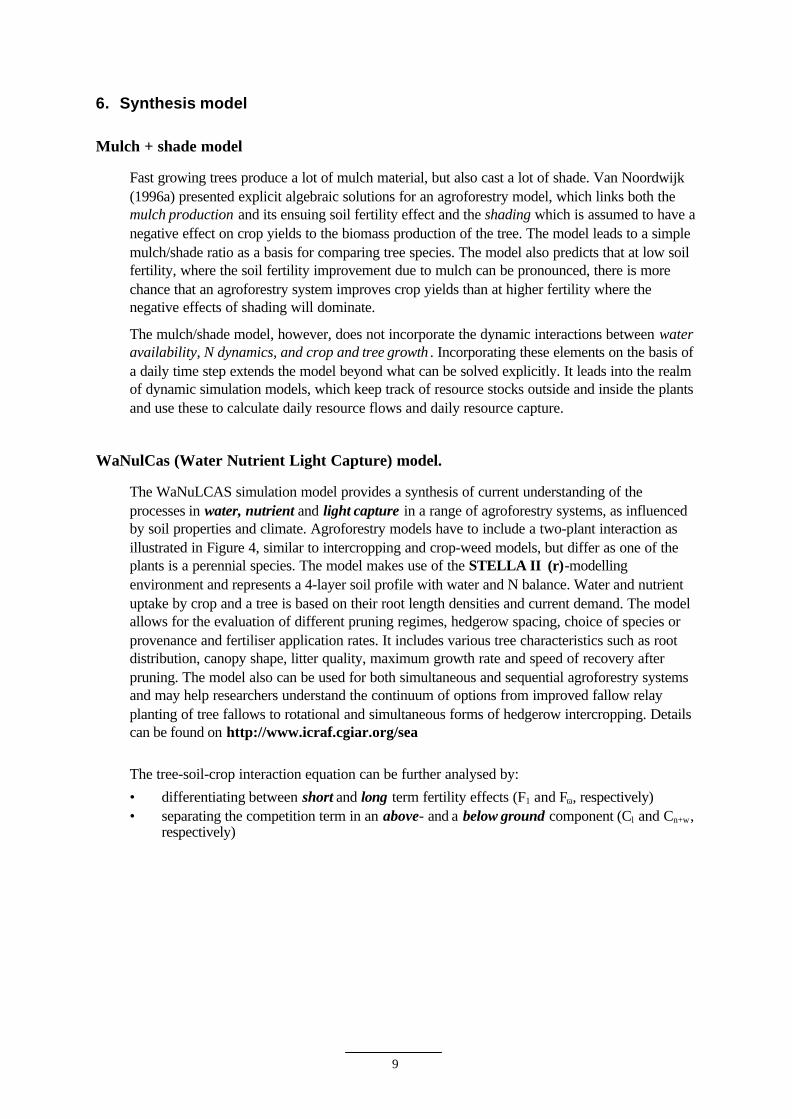
The WaNuLCAS simulation model provides a synthesis of current understanding of theprocesses in water, nutrient and light capture in a range of agroforestry systems, as influencedby soil properties and climate. Agroforestry models have to include a two-plant interaction asillustrated in Figure 4, similar to intercropping and crop-weed models, but differ as one of theplants is a perennial species. The model makes use of the STELLA II (r)-modellingenvironment and represents a 4-layer soil profile with water and N balance. Water and nutrientuptake by crop and a tree is based on their root length densities and current demand. The modelallows for the evaluation of different pruning regimes, hedgerow spacing, choice of species orprovenance and fertiliser application rates. It includes various tree characteristics such as rootdistribution, canopy shape, litter quality, maximum growth rate and speed of recovery afterpruning. The model also can be used for both simultaneous and sequential agroforestry systemsand may help researchers understand the continuum of options from improved fallow relayplanting of tree fallows to rotational and simultaneous forms of hedgerow intercropping. Detailscan be found on http://www.icraf.cgiar.org/sea
The tree-soil-crop interaction equation can be further analysed by:
• differentiating between short and long term fertility effects (F1 and Fω, respectively)• separating the competition term in an above- and a below ground component (Cl and Cn+w,
respectively)
10
Figure 4. Components of the WaNuLCAS model
The total balance for below ground resources (water or nutrients) inputs into an agroforestrysystem is formulated in equation 2:
Equation 2
The terms used in the above equation are presented in Table 2, where the term Upttree,noncompetitive
represents the ‘safety net’ function of tree roots for nutrients and water leaching and percolatingbelow the zone of crop roots and/or outside of the crop growing season, as well as a nutrientpump role for resources stored in the subsoil for longer periods of time (Young, 1997).
,,Re LossnoncomptreeUptcomptreeUptcropUptcycleInputStored −−−−+=∆

11
Table 4. Representation of resource capture (equation 1) in a simple tree-crop agroforestry system.The crop roots are confined to the 'topsoil' and the tree roots explore the 'subsoil' as well; thesubscripts 1, 2 and 3 refer to crop zones with increasing distance to the tree
Term in eq. 2 Water Nitrogen LightInput Rainfall, irrigation
run-on-runoffFertiliser & organicimport
Sum of dailyradiation
Recycle Hydraulic lift into croproot zone
Litterfall, tree pruning,crop residues
-
UptakeCrop ΣW_Uptakecrop N_fix(Crop) +ΣN_Uptakecrop
ΣLightcap_crop
UptakeTree,Competitive ΣtopW_Uptaketree ΣtopN_Uptaketree ΣLightcap_tree1,2
UptakeTree,Noncomp ΣsubW_Uptaketree N_fix(Tree) +ΣsubN_Uptaketree
Lightcap_tree3
Losses ΣPercolation fromlowest zone
ΣLeaching from lowestzone
1 - ΣLightcap
∆storage ∆Water content ∆(Nmin & SOM) -
7. Management options
To what extent can these research results now be translated into management recommendations?That is what ultimately matters for the farmer!a. Fast growing trees usually have a broad distributed canopy; pruning can reduce the
aboveground competition (shading!), but this is labour-intensiveb. Frequency and height of aboveground pruning affect depth distribution of tree root
systems. More frequent and low level tree pruning stimulate superficial tree roots,increasing competition for water and nutrients.
c. Fallowing the land can be beneficial where residual effects of the trees benefit the crops insubsequent years.
d. Choice of tree species is crucial with regard to shading effects, root competition orproduction of useful products for the farmer. As trees generally have a long lifetime, a goodchoice is a far-reaching decision, which has effects on the longer term.
e. Mulching crops with prunings from the trees are a possible way to improve soil fertility.Decomposition of organic residues have a direct effect on crop growth, by mineralisation ofN and other nutrients, and an indirect one, by build-up soil organic residues which mayincrease future efficiency of nutrient use. Rapidly decomposing organic residues of lowC/N ratio contributes mainly by N-mineralisation and slowly decomposing organic residuescontribute especially to build up of the soil organic matter pool. Slowly decomposedorganic residues are also suitable for mulching. What quality criteria of organic residueswere used? Organic residues have a low quality if they have a C/N ratio >25, a lignincontent >20 % and a polyphenolic content >2%, usually found in thick and shiny leafs andwoody biomass.
SummaryAgroforestry systems are only beneficiary - from a biophysical point of view -, if there is at leastsome complementarity in resource capture. Direct empirical approaches to quantifycomplementarity are possible for aboveground processes, but are more complex below ground.

12
Resources that are stored over a longer period of time make it more difficult to judge whether ornot resources could have been used outside an agroforestry context. Models of tree-soil-cropinteractions have to pay specific attention to the depth from which each component is capturingwater and nutrients on a daily basis, in order to derive overall complementarity on a seasonalbasis.
III. Reading Materials
Book chapters
Akyeampong E, Duguma B, Heineman AM, Kamara CS, Kiepe P, Kwesiga F, Ong CK, Otieno HJ, RaoMR, 1995. A synthesis of ICRAF’s research on alley cropping. In: Alley farming research anddevelopment. AFNETA, Ibadan, Nigeria. p 40-51.
van Noordwijk M, Hairiah K, Lusiana B, Cadisch G. 1998. Tree-soil-crop interactions in sequential andsimultaneous agroforestry systems. In: Bergstrom L, Kirchmann H, eds. Carbon and nutrientdynamics in natural and agricultural tropical ecosystems. CAB International, Wallingford, UK. p173-191.
TextbookHuxley P, 1999. Tropical Agroforestry. Blackwell Science, UK. p 370
Ong CK, Huxley P, 1996. Tree-crop interactions – A physiological approach. CAB International,Wallingford, UK. p 386
Vandermeer JH. 1989. The ecology of intercropping. Cambridge Univ. Press. Cambridge, UK.
Training materialsTorquebiau E. 1994. Ecological interactions in agroforestry. Personal communication.
van Noordwijk M, Lusiana B. 2000. WANULCAS 2.0. Background on a model of water, nutrient andlight capture in agroforestry systems. ICRAF SE. Asia, Bogor.
Web sitehttp://www.icraf.cgiar.org/sea
INTERNATIONAL CENTRE FOR RESEARCH IN AGROFORESTRYSoutheast Asian Regional Research Programme
Jl. CIFOR, Situ Gede, Sindang BarangPO Box 161, Bogor 16001, Indonesia
Tel: +62 251 625415, fax: +62 251 625416, email: [email protected] site: http://www.icraf.cgiar.org/sea
DSO


![Ppt CCTV FinalDec 13 [Compatibility Mode]](https://img.pdfslide.us/doc/110x75/589efb681a28ab734d8b9aa7/ppt-cctv-finaldec-13-compatibility-mode.jpg)