Embed Size (px)
Citation preview
Lascar Data Logger EL-WiFi-TP+ (DTP+)
User Guide
Table of Contents Page #
Data Logger Features 2
Logging In 3
Devices Screen 4
Archive / Delete Logger 6
Change Device Setting 7
Alarm Settings & Audit Check 9
Email Alerts 10
View Data 11
Other Sessions 12
Summary 12
Event Logs 13
Reset Alarm 13
Revised 6/12/20171
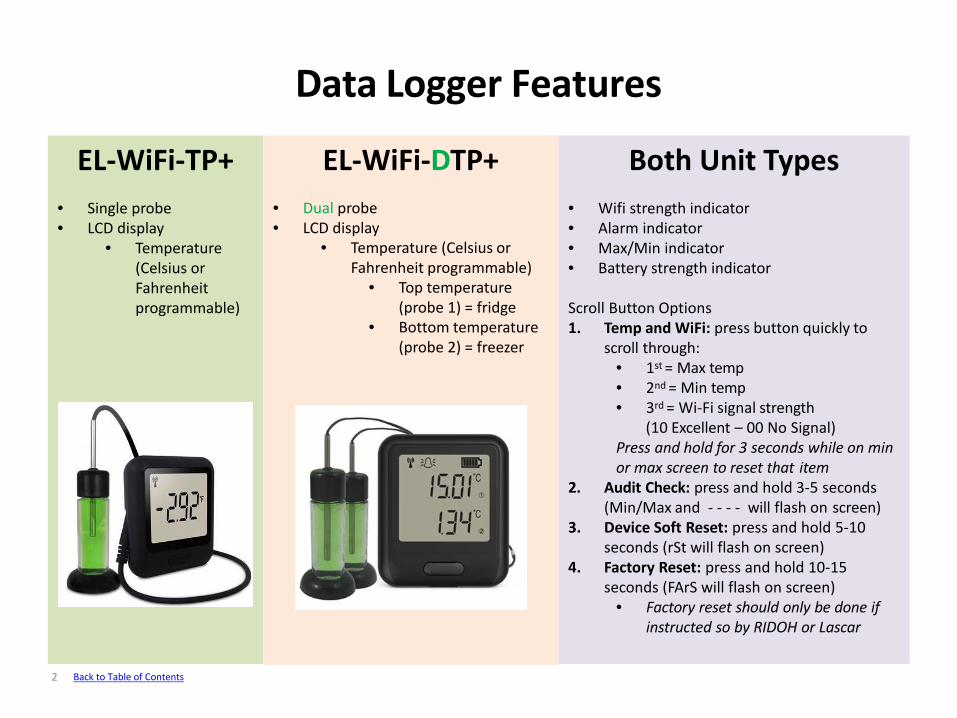
Data Logger Features
EL-WiFi-TP+• Single probe• LCD display
• Temperature (Celsius or Fahrenheit programmable)
EL-WiFi-DTP+• Dual probe• LCD display
• Temperature (Celsius or Fahrenheit programmable)
• Top temperature (probe 1) = fridge
• Bottom temperature (probe 2) = freezer
Both Unit Types• Wifi strength indicator• Alarm indicator• Max/Min indicator• Battery strength indicator
Scroll Button Options1. Temp and WiFi: press button quickly to
scroll through:• 1st = Max temp• 2nd = Min temp• 3rd = Wi-Fi signal strength
(10 Excellent – 00 No Signal)Press and hold for 3 seconds while on min or max screen to reset that item
2. Audit Check: press and hold 3-5 seconds (Min/Max and - - - - will flash on screen)
3. Device Soft Reset: press and hold 5-10 seconds (rSt will flash on screen)
4. Factory Reset: press and hold 10-15 seconds (FArS will flash on screen)
• Factory reset should only be done if instructed so by RIDOH or Lascar
2 Back to Table of Contents
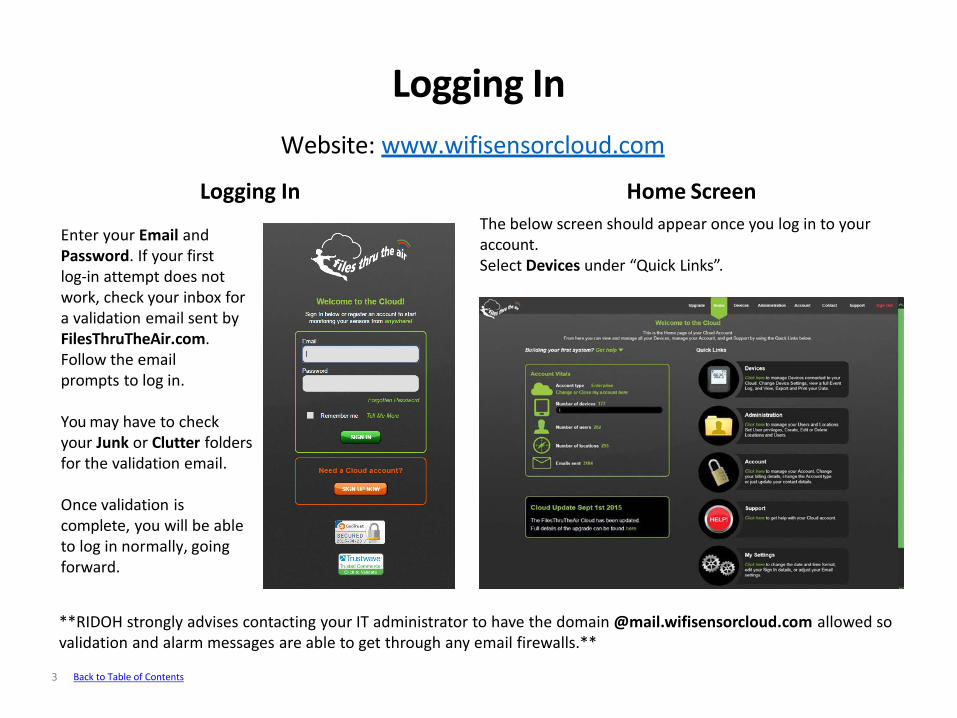
Home ScreenThe below screen should appear once you log in to your account.Select Devices under “Quick Links”.
Website: www.wifisensorcloud.com
Enter your Email and Password. If your firstlog-in attempt does not work, check your inbox fora validation email sent byFilesThruTheAir.com.Follow the email prompts to log in.
You may have to check your Junk or Clutter folders for the validation email.
Once validation is complete, you will be able to log in normally, goingforward.
Logging In
3
Logging In
Back to Table of Contents
**RIDOH strongly advises contacting your IT administrator to have the domain @mail.wifisensorcloud.com allowed so validation and alarm messages are able to get through any email firewalls.**
••••••
Devices Screen
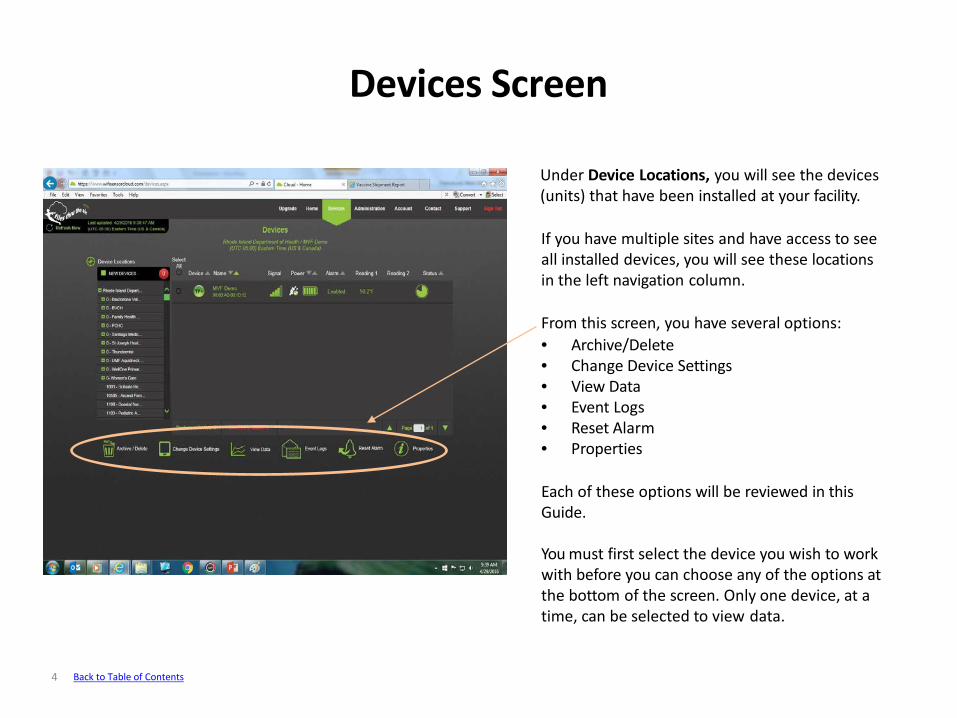
Under Device Locations, you will see the devices (units) that have been installed at your facility.
If you have multiple sites and have access to see all installed devices, you will see these locations in the left navigation column.
From this screen, you have several options:• Archive/Delete• Change Device Settings• View Data• Event Logs• Reset Alarm• Properties
Each of these options will be reviewed in this Guide.
You must first select the device you wish to work with before you can choose any of the options at the bottom of the screen. Only one device, at a time, can be selected to view data.
4 Back to Table of Contents
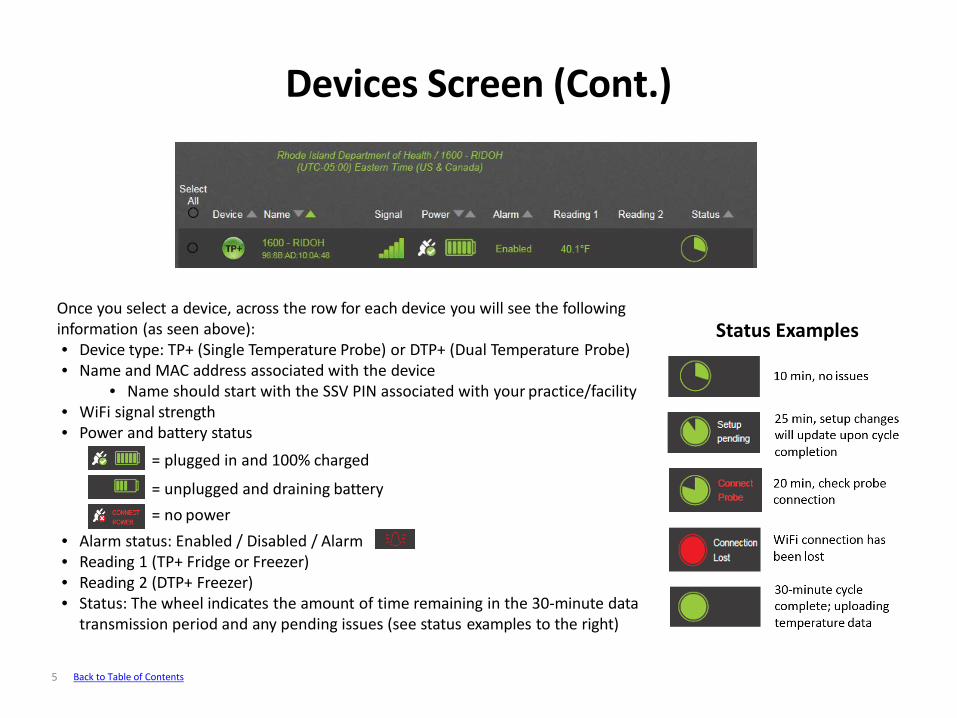
Once you select a device, across the row for each device you will see the followinginformation (as seen above):• Device type: TP+ (Single Temperature Probe) or DTP+ (Dual Temperature Probe)• Name and MAC address associated with the device
• Name should start with the SSV PIN associated with your practice/facility• WiFi signal strength• Power and battery status
= plugged in and 100% charged
= unplugged and draining battery= no power
• Alarm status: Enabled / Disabled / Alarm• Reading 1 (TP+ Fridge or Freezer)• Reading 2 (DTP+ Freezer)• Status: The wheel indicates the amount of time remaining in the 30-minute data
transmission period and any pending issues (see status examples to the right)
Devices Screen (Cont.)
5
Status Examples
Back to Table of Contents
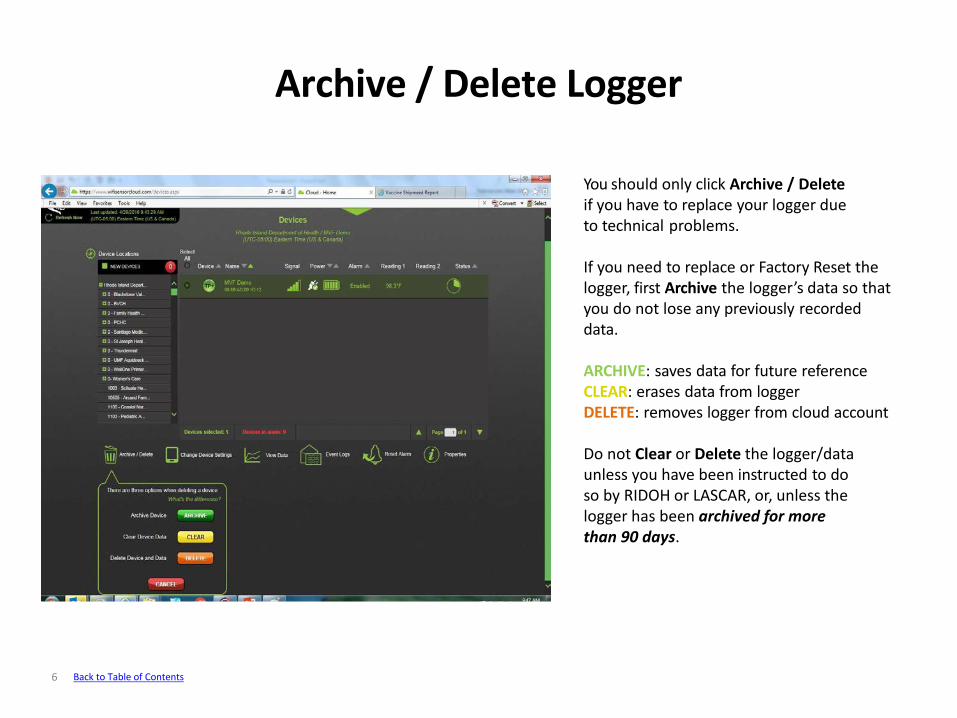
You should only click Archive / Deleteif you have to replace your logger due to technical problems.
If you need to replace or Factory Reset the logger, first Archive the logger’s data so that you do not lose any previously recordeddata.
ARCHIVE: saves data for future referenceCLEAR: erases data from loggerDELETE: removes logger from cloud account
Do not Clear or Delete the logger/dataunless you have been instructed to do so by RIDOH or LASCAR, or, unless the logger has been archived for more than 90 days.
Archive / Delete Logger
6 Back to Table of Contents
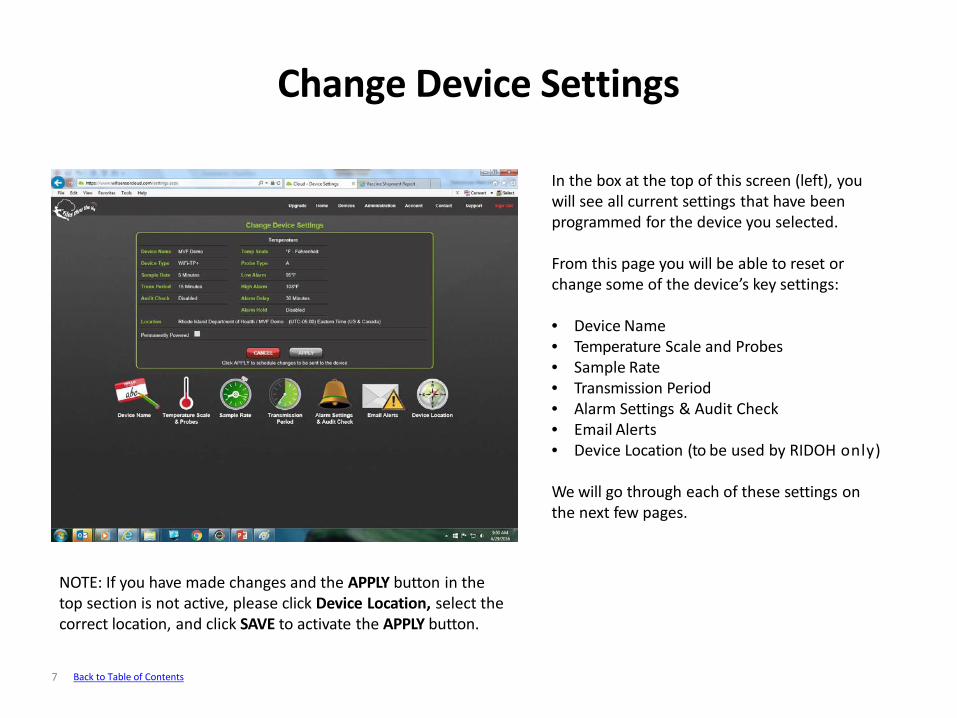
In the box at the top of this screen (left), you will see all current settings that have been programmed for the device you selected.
From this page you will be able to reset or change some of the device’s key settings:
• Device Name• Temperature Scale and Probes• Sample Rate• Transmission Period• Alarm Settings & Audit Check• Email Alerts• Device Location (to be used by RIDOH only)
We will go through each of these settings on the next few pages.
NOTE: If you have made changes and the APPLY button in the top section is not active, please click Device Location, select the correct location, and click SAVE to activate the APPLY button.
Change Device Settings
7 Back to Table of Contents
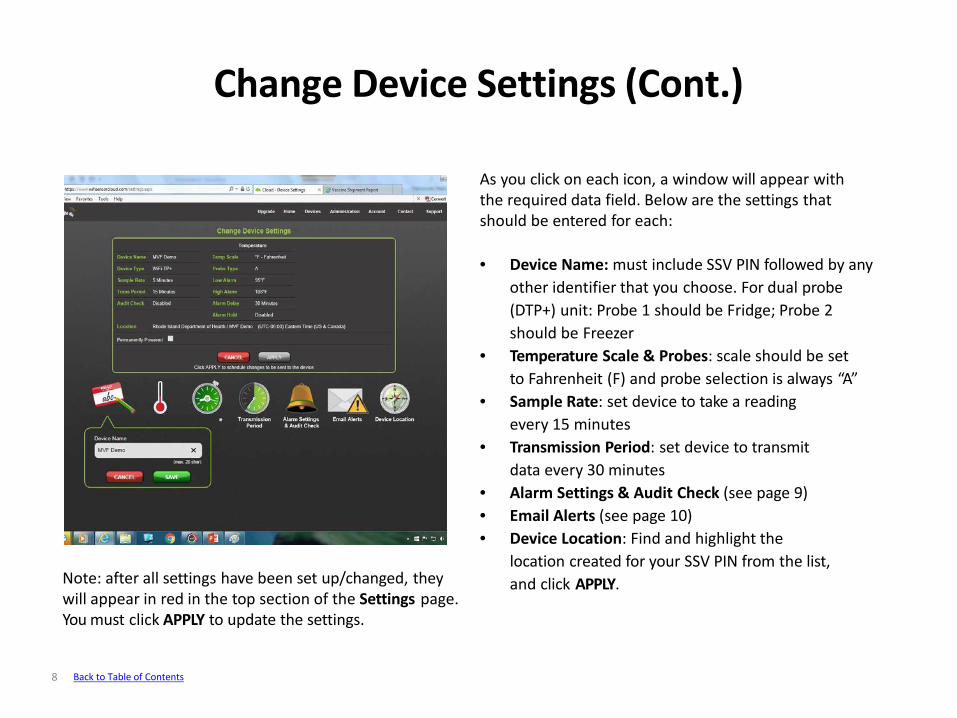
As you click on each icon, a window will appear with the required data field. Below are the settings that should be entered for each:
• Device Name: must include SSV PIN followed by any other identifier that you choose. For dual probe(DTP+) unit: Probe 1 should be Fridge; Probe 2 should be Freezer
• Temperature Scale & Probes: scale should be set to Fahrenheit (F) and probe selection is always “A”
• Sample Rate: set device to take a reading every 15 minutes
• Transmission Period: set device to transmitdata every 30 minutes
• Alarm Settings & Audit Check (see page 9)• Email Alerts (see page 10)• Device Location: Find and highlight the
location created for your SSV PIN from the list,and click APPLY.Note: after all settings have been set up/changed, they
will appear in red in the top section of the Settings page.You must click APPLY to update the settings.
Change Device Settings (Cont.)
8 Back to Table of Contents
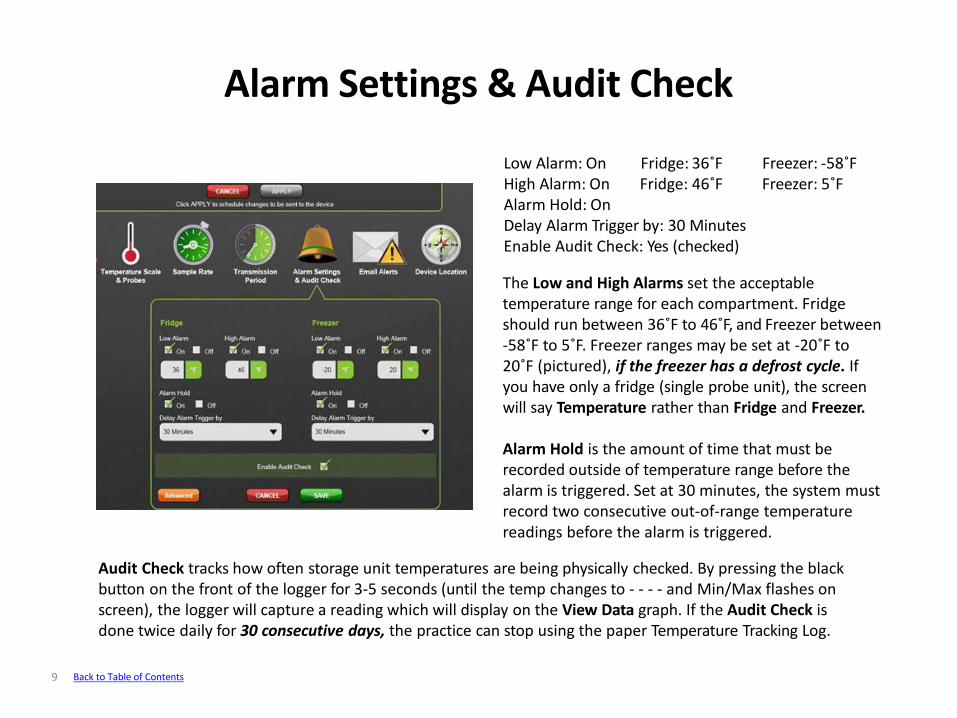
Fridge: 36˚F Freezer: -58˚FFridge: 46˚F Freezer: 5˚F
Low Alarm: OnHigh Alarm: OnAlarm Hold: OnDelay Alarm Trigger by: 30 MinutesEnable Audit Check: Yes (checked)
The Low and High Alarms set the acceptable temperature range for each compartment. Fridge should run between 36˚F to 46˚F, and Freezer between -58˚F to 5˚F. Freezer ranges may be set at -20˚F to 20˚F (pictured), if the freezer has a defrost cycle. If you have only a fridge (single probe unit), the screen will say Temperature rather than Fridge and Freezer.
Alarm Hold is the amount of time that must be recorded outside of temperature range before the alarm is triggered. Set at 30 minutes, the system must record two consecutive out-of-range temperature readings before the alarm is triggered.
Alarm Settings & Audit Check
9 Back to Table of Contents
Audit Check tracks how often storage unit temperatures are being physically checked. By pressing the black button on the front of the logger for 3-5 seconds (until the temp changes to - - - - and Min/Max flashes on screen), the logger will capture a reading which will display on the View Data graph. If the Audit Check is done twice daily for 30 consecutive days, the practice can stop using the paper Temperature Tracking Log.
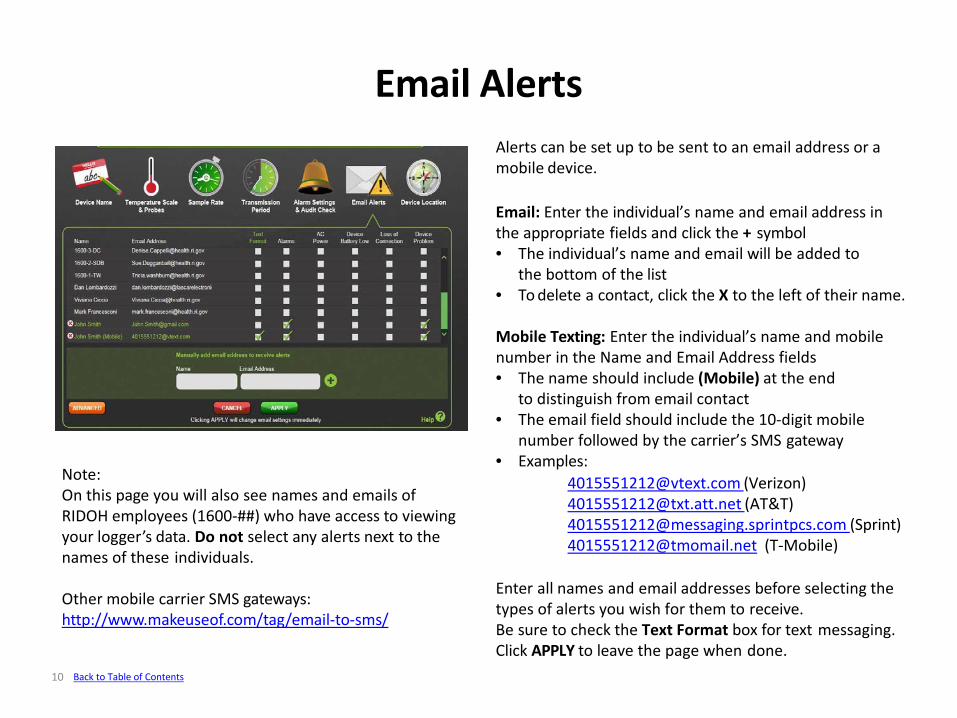
Alerts can be set up to be sent to an email address or a mobile device.
Email: Enter the individual’s name and email address in the appropriate fields and click the + symbol• The individual’s name and email will be added to
the bottom of the list• To delete a contact, click the X to the left of their name.
Mobile Texting: Enter the individual’s name and mobile number in the Name and Email Address fields• The name should include (Mobile) at the end
to distinguish from email contact• The email field should include the 10-digit mobile
number followed by the carrier’s SMS gateway• Examples:
[email protected] (Verizon)[email protected] (AT&T)[email protected] (Sprint)[email protected] (T-Mobile)
Enter all names and email addresses before selecting the types of alerts you wish for them to receive.Be sure to check the Text Format box for text messaging.Click APPLY to leave the page when done.
Note:On this page you will also see names and emails of RIDOH employees (1600-##) who have access to viewing your logger’s data. Do not select any alerts next to the names of these individuals.
Other mobile carrier SMS gateways:http://www.makeuseof.com/tag/email-to-sms/
Email Alerts
10 Back to Table of Contents
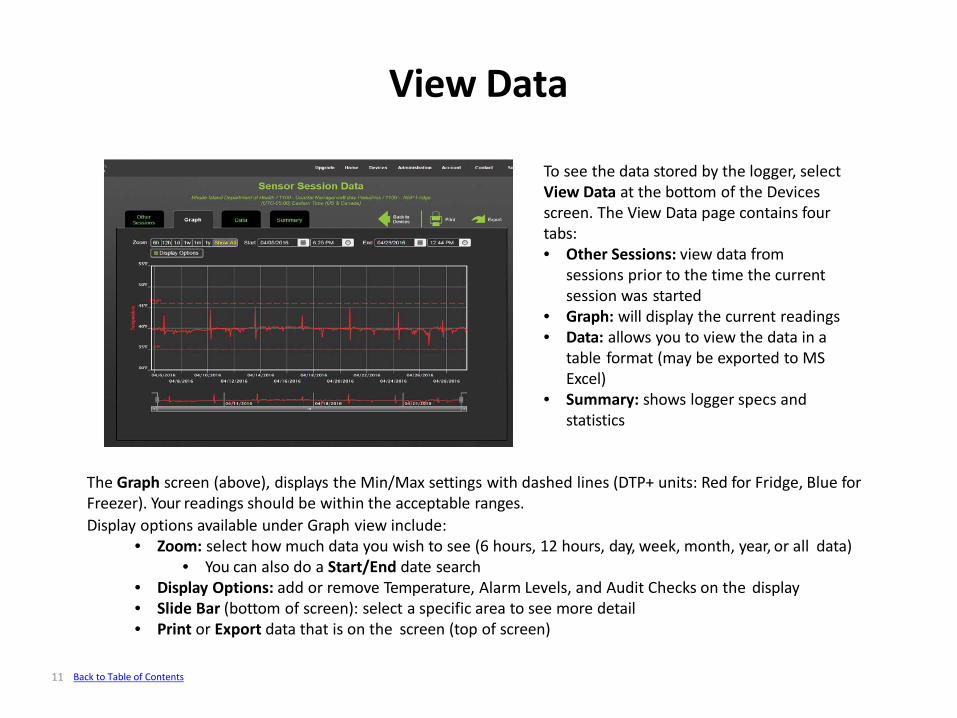
To see the data stored by the logger, select View Data at the bottom of the Devices screen. The View Data page contains fourtabs:• Other Sessions: view data from
sessions prior to the time the current session was started
• Graph: will display the current readings• Data: allows you to view the data in a
table format (may be exported to MSExcel)
• Summary: shows logger specs andstatistics
The Graph screen (above), displays the Min/Max settings with dashed lines (DTP+ units: Red for Fridge, Blue for Freezer). Your readings should be within the acceptable ranges.Display options available under Graph view include:
• Zoom: select how much data you wish to see (6 hours, 12 hours, day, week, month, year, or all data)• You can also do a Start/End date search
• Display Options: add or remove Temperature, Alarm Levels, and Audit Checks on the display• Slide Bar (bottom of screen): select a specific area to see more detail• Print or Export data that is on the screen (top of screen)
View Data
11 Back to Table of Contents
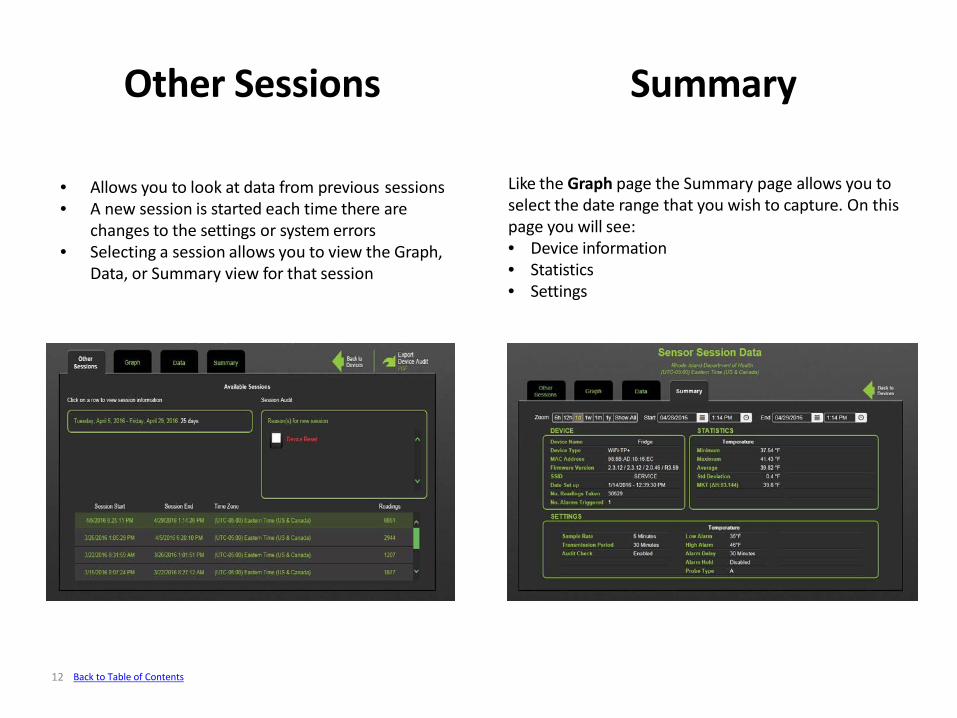
Like the Graph page the Summary page allows you to select the date range that you wish to capture. On this page you will see:• Device information• Statistics• Settings
• Allows you to look at data from previous sessions• A new session is started each time there are
changes to the settings or system errors• Selecting a session allows you to view the Graph,
Data, or Summary view for that session
Other Sessions Summary
12 Back to Table of Contents
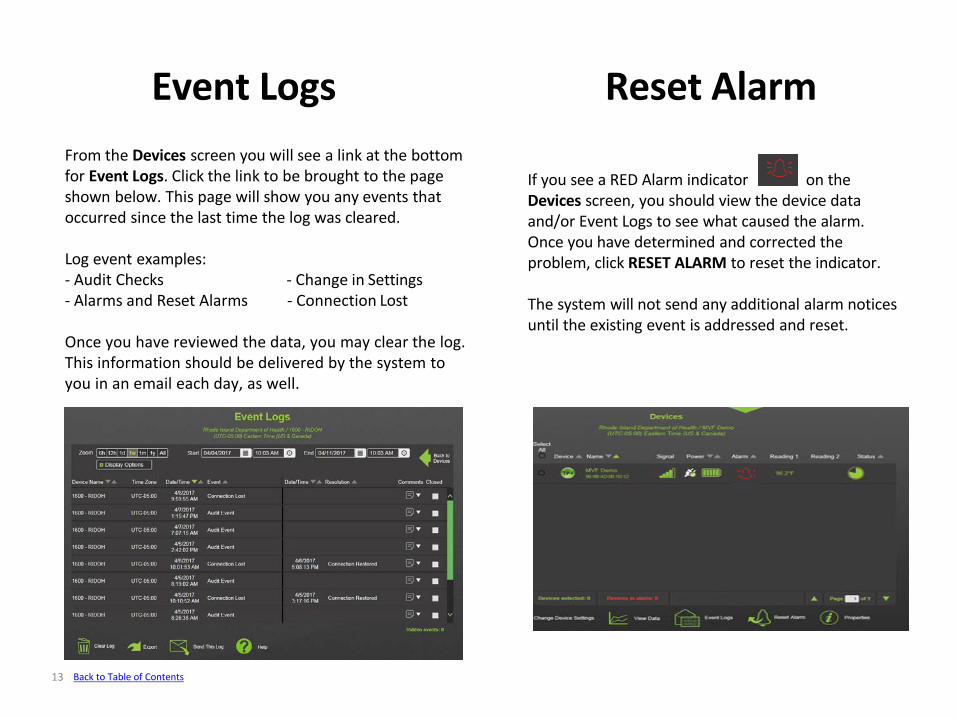
From the Devices screen you will see a link at the bottom for Event Logs. Click the link to be brought to the page shown below. This page will show you any events that occurred since the last time the log was cleared.
Log event examples:- Audit Checks - Change in Settings- Alarms and Reset Alarms - Connection Lost
Once you have reviewed the data, you may clear the log. This information should be delivered by the system to you in an email each day, as well.
If you see a RED Alarm indicator on the Devices screen, you should view the device data and/or Event Logs to see what caused the alarm. Once you have determined and corrected the problem, click RESET ALARM to reset the indicator.
The system will not send any additional alarm notices until the existing event is addressed and reset.
13
Event Logs Reset Alarm
Back to Table of Contents
![Help File Contentsapvco.vn/uploads/files/Lascar/EL-USB-2-LCD[1].pdf · Help File Contents . USB Data Logger Name, Temperature Scale and Sample Rate . In order to distinguish between](https://img.pdfslide.us/doc/110x75/5f5d48e04899be03737c99d2/help-file-1pdf-help-file-contents-usb-data-logger-name-temperature-scale.jpg)


![Characterization and evolution of tropospheric plumes from ... · 1.1. Lascar Volcano [4] Lascar (5592 m; 23.37 S, 67.732 W) is a calc-alkaline stratovolcano located in the Central](https://img.pdfslide.us/doc/110x75/5f1fe06829776b1863562df5/characterization-and-evolution-of-tropospheric-plumes-from-11-lascar-volcano.jpg)