Embed Size (px)
Citation preview
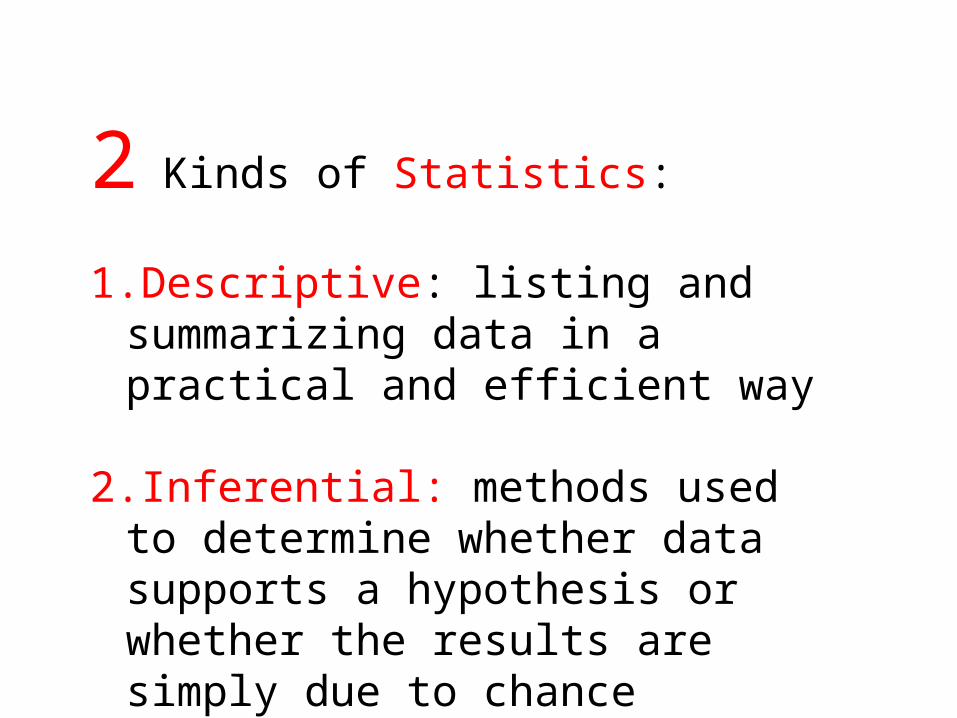
2 Kinds of Statistics:
1.Descriptive: listing and summarizing data in a practical and efficient way
2.Inferential: methods used to determine whether data supports a hypothesis or whether the results are simply due to chance
Question: Does television viewing before a test impact test results?
Hypothesis: The more television a student watches the night before a test, the lower the test score.
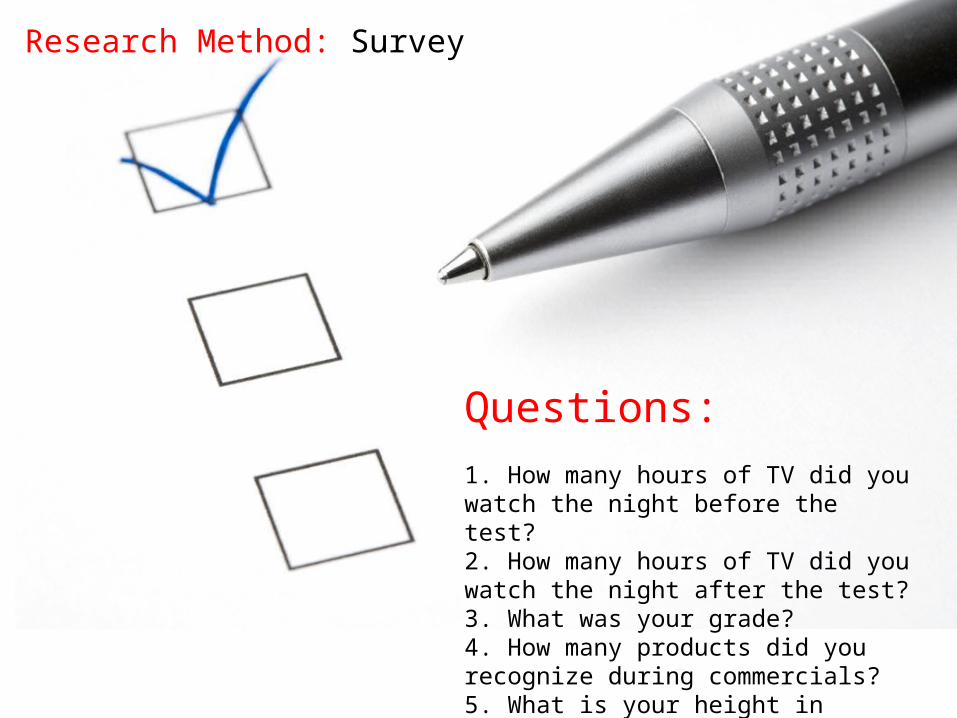
Questions: 1. How many hours of TV did you watch the night before the test?2. How many hours of TV did you watch the night after the test?3. What was your grade?4. How many products did you recognize during commercials?5. What is your height in inches?
Research Method: Survey
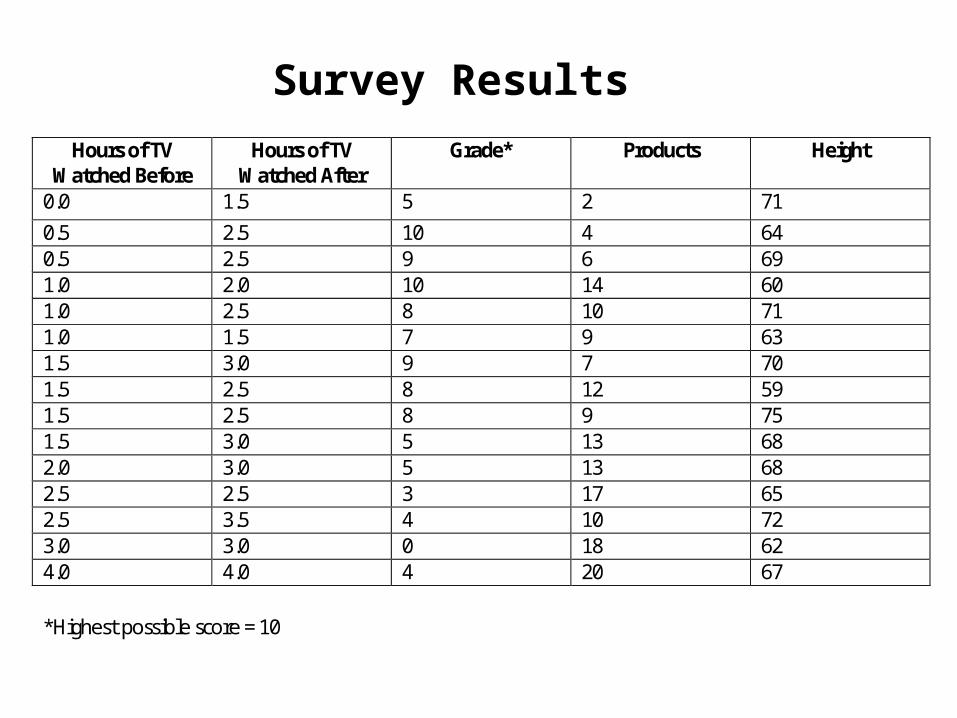
Hours of TV
Watched Before Hours of TV
Watched After Grade* Products Height
0.0 1.5 5 2 71 0.5 2.5 10 4 64 0.5 2.5 9 6 69 1.0 2.0 10 14 60 1.0 2.5 8 10 71 1.0 1.5 7 9 63 1.5 3.0 9 7 70 1.5 2.5 8 12 59 1.5 2.5 8 9 75 1.5 3.0 5 13 68 2.0 3.0 5 13 68 2.5 2.5 3 17 65 2.5 3.5 4 10 72 3.0 3.0 0 18 62 4.0 4.0 4 20 67 *Highest possible score = 10
Survey Results

So what???? What are we supposed to do with this stuff?
Descriptive Statistics:listing and summarizing data in a practical and
efficient way
1. Data Distribution (Frequency)
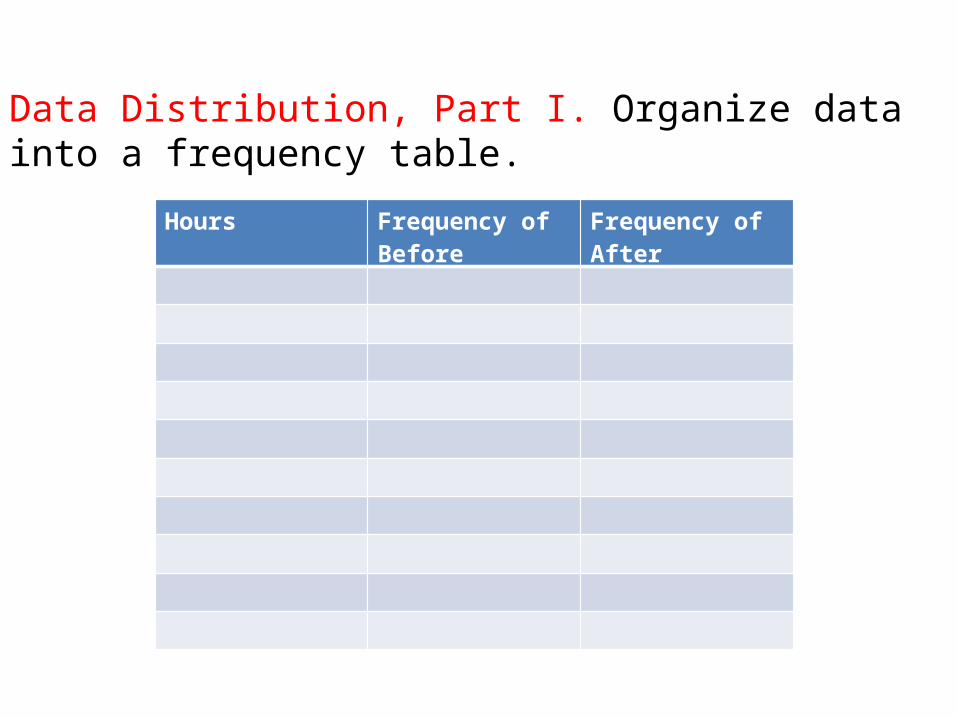
Data Distribution, Part I. Organize data into a frequency table.
Hours Frequency of Before
Frequency of After
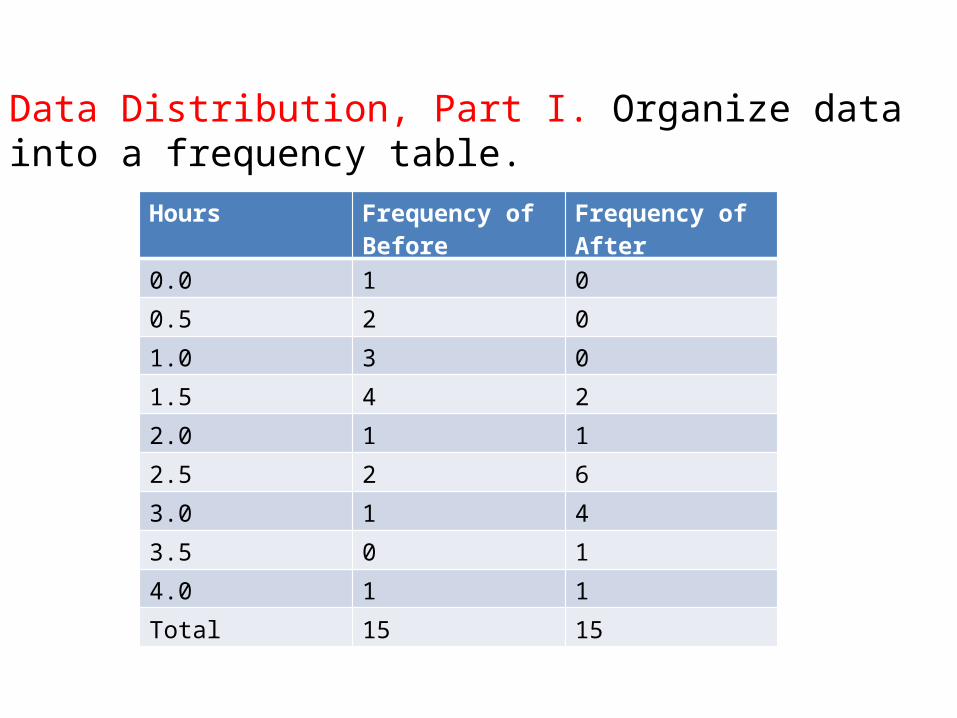
Data Distribution, Part I. Organize data into a frequency table.
Hours Frequency of Before
Frequency of After
0.0 1 0
0.5 2 0
1.0 3 0
1.5 4 2
2.0 1 1
2.5 2 6
3.0 1 4
3.5 0 1
4.0 1 1
Total 15 15
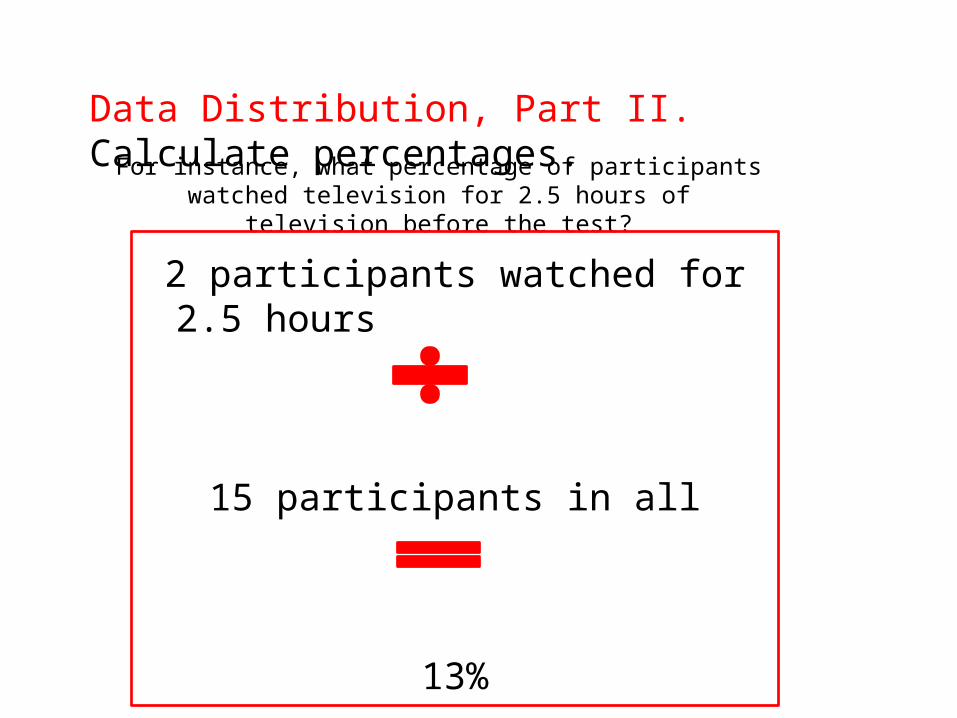
Data Distribution, Part II. Calculate percentages.For instance, what percentage of participants watched television
for 2.5 hours of television before the test?
2 participants watched for 2.5 hours
15 participants in all
13%
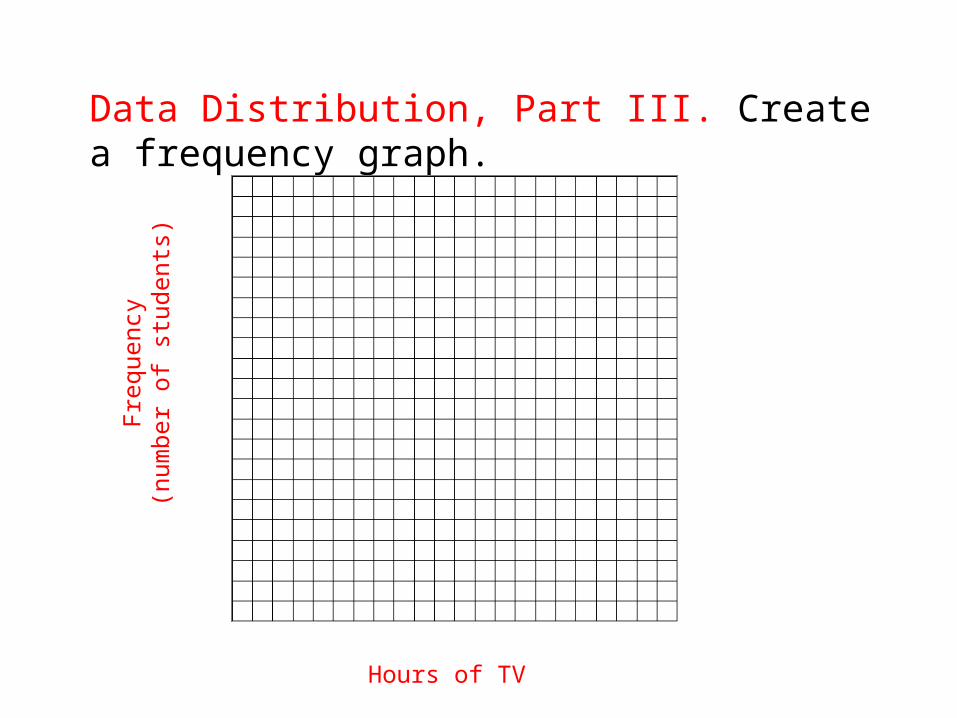
Data Distribution, Part III. Create a frequency graph.
Hours of TV
Freq
uenc
y(n
umbe
r of s
tude
nts)
Descriptive Statistics:listing and summarizing data in a practical and
efficient way
1. Data Distribution (Frequency)2. Central Tendency (Middles & Averages)
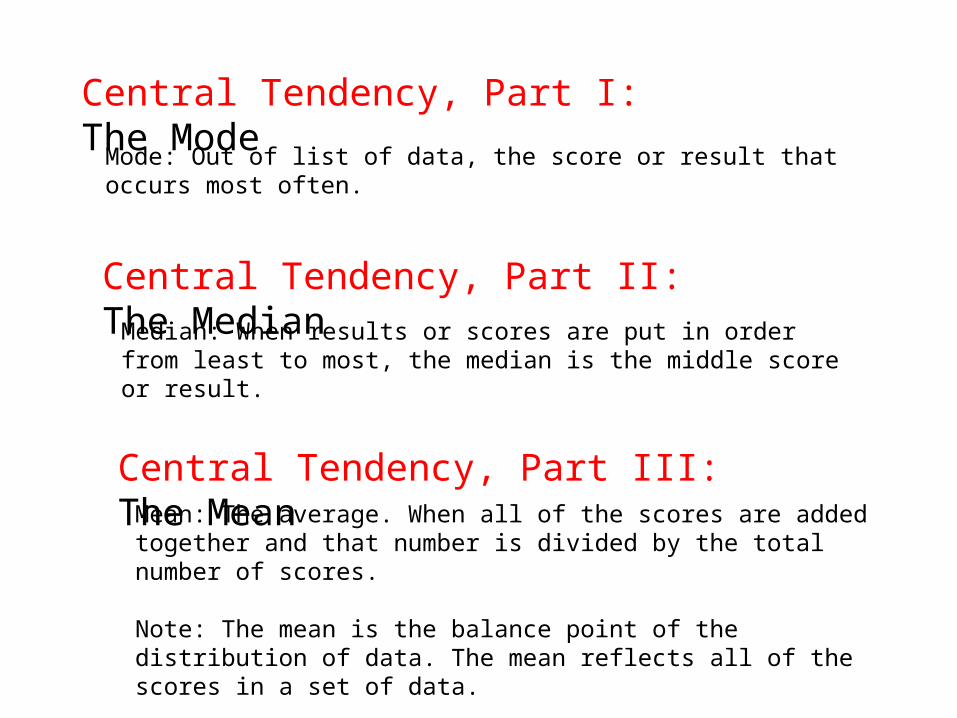
Central Tendency, Part I: The Mode
Mode: Out of list of data, the score or result that occurs most often.
Central Tendency, Part II: The MedianMedian: When results or scores are put in order from least to most, the median is the middle score or result.
Central Tendency, Part III: The MeanMean: The average. When all of the scores are added together and that number is divided by the total number of scores.
Note: The mean is the balance point of the distribution of data. The mean reflects all of the scores in a set of data.
Descriptive Statistics:listing and summarizing data in a practical and
efficient way
1. Data Distribution (Frequency)2. Central Tendency (Middles & Averages)
3. Measures of Variability (Spread)
Measures of Variability, Part I: The RangeRange is the total number of possible scores or results.
“Home, home on the range,
where the deer and the
antelope play…”
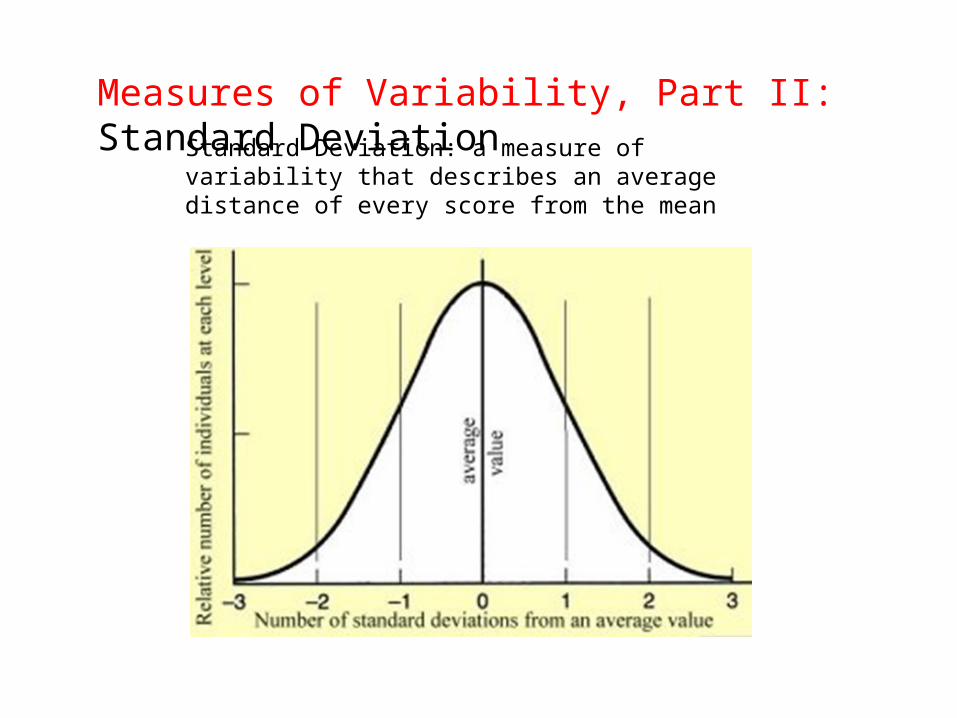
Measures of Variability, Part II: Standard DeviationStandard Deviation: a measure of variability that describes an average distance of every score from the mean
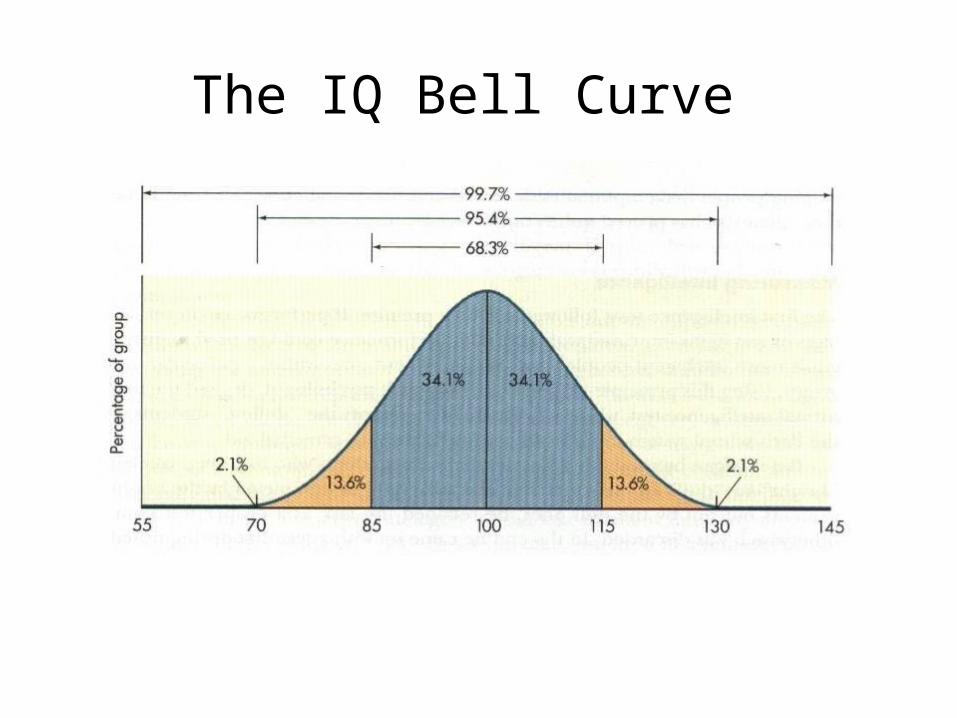
The IQ Bell Curve
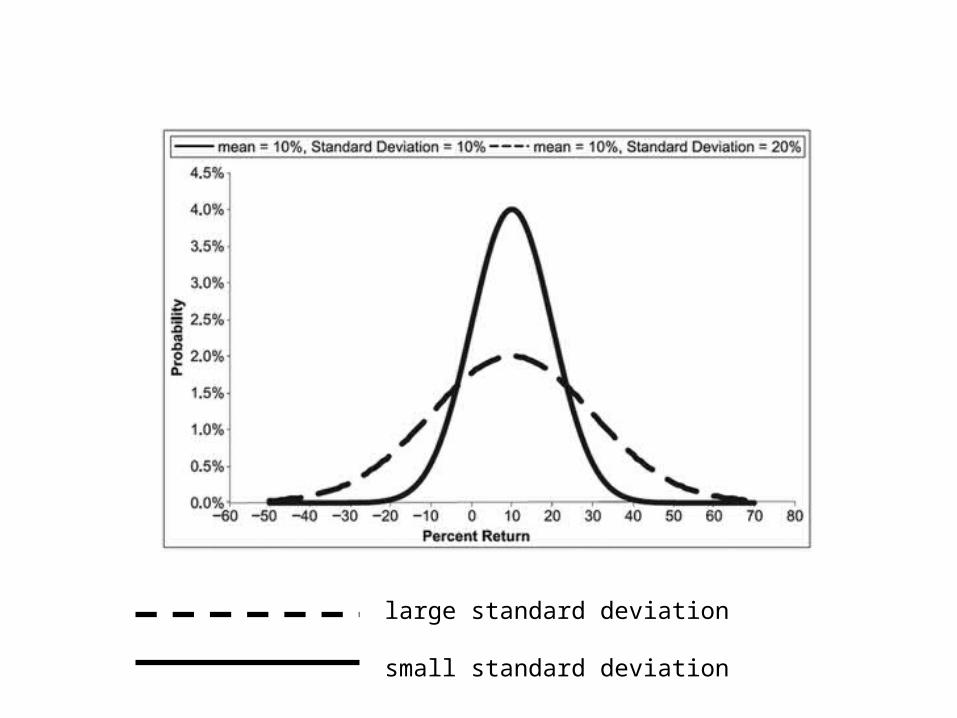
large standard deviation
small standard deviation

Descriptive Statistics:listing and summarizing data in a practical and
efficient way
1. Data Distribution (Frequency)2. Central Tendency (Middles & Averages)
3. Measures of Variability (Spread)4. Correlation Coefficients (Direction & Strength)
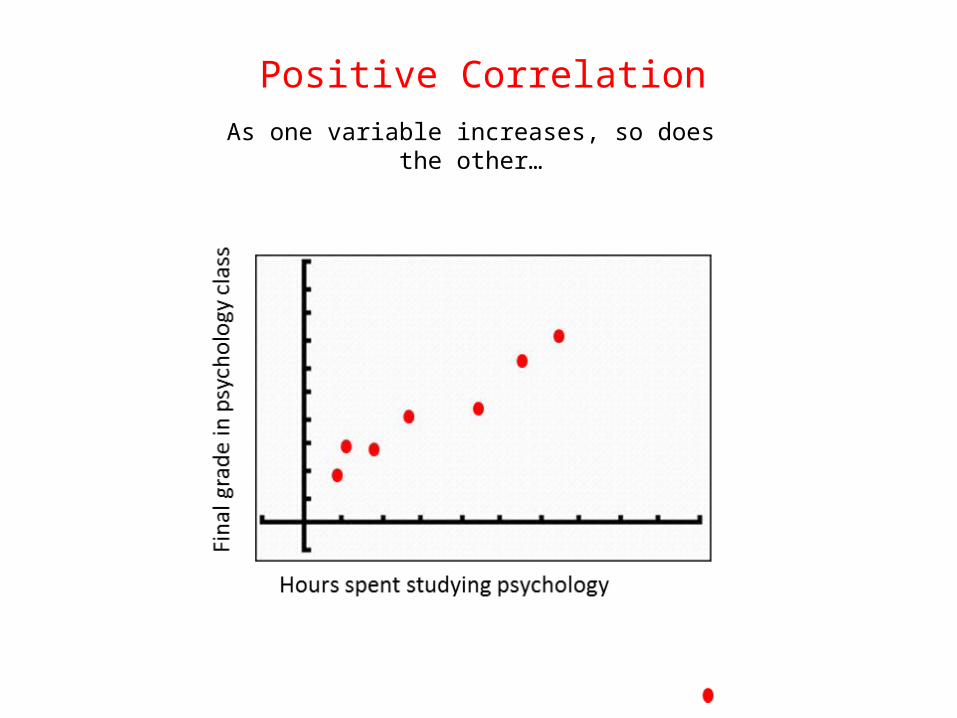
Positive CorrelationAs one variable increases, so does the other…
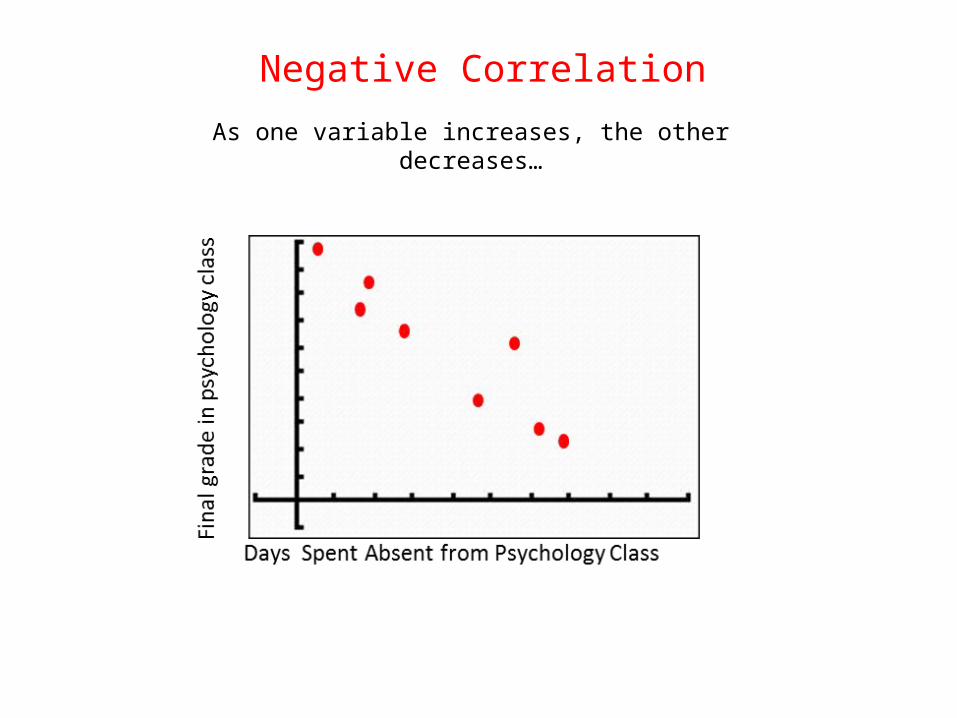
Negative Correlation
As one variable increases, the other decreases…
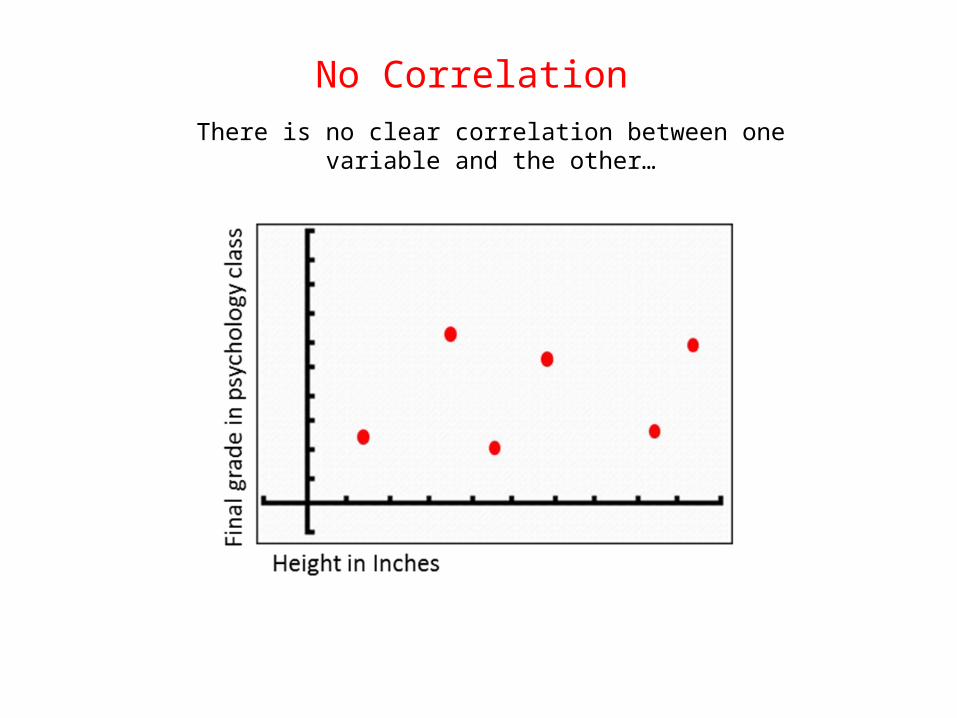
No Correlation There is no clear correlation between one variable and the other…
Important: A correlation only shows that there
is a relationship.
It does not indicate cause and effect.
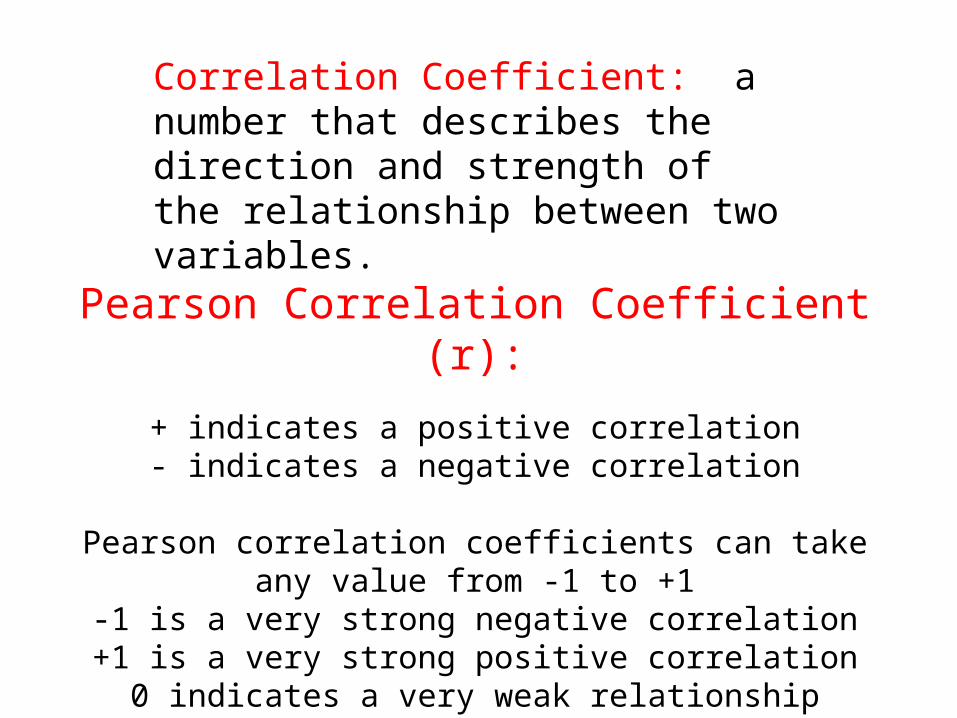
Correlation Coefficient: a number that describes the direction and strength of the relationship between two variables.
Pearson Correlation Coefficient (r):
+ indicates a positive correlation- indicates a negative correlation
Pearson correlation coefficients can take any value from -1 to +1-1 is a very strong negative correlation+1 is a very strong positive correlation
0 indicates a very weak relationship
Inferential Statistics:
mathematical methods used to help make generalizations about data and to determine whether results are due to chance or whether results support the hypothesis
Are the results due to chance?
OR
Is there a real and significant relationship between the two
variables?
Only Inferential Statistics can answer these questions. Researchers calculate measures of statistical significance.
The 5% Rule:
When the probability of the result is less than 5% (or 1% or whatever the researcher decides), then
the result is statistically significant.This means that the odds are good that the result is
not due to chance.