Embed Size (px)
Citation preview
ABSTRACTPassengers are exposed to roadway pollutants due toentrainment of outside air into the vehicle cabin. Previousworks found cabin air-recirculation can reduce pollutantparticle concentrations significantly. However simultaneousincrease of CO2 concentrations in the cabin prevented wideuse of recirculation mode for such purpose. A mathematicalmodel was developed to predict CO2 concentrations invehicle cabin air during air-recirculation mode. The modelpredicts temporal CO2 concentration changes as a function ofcabin volume, vehicle body leakage, and number ofpassengers. This model can be used to design and control air-recirculation mode for a variety of vehicle conditions.
INTRODUCTIONA vehicle cabin provides a unique environment in whichpassengers are confined during their ride. Current vehicleHVAC (Heating, Ventilation, and Air Conditioning) systemsare optimized to reduce the dust concentration and noisecoming from roadway while maintaining comfortabletemperature and humidity for passengers.
In 2010 CARB (California Air Resources Board) reported9,000 people in California die prematurely each year as aresult of exposure to fine particle pollution (PM2.5) [1]. Onroadways, in-cabin exposures to ultrafine particles have beenshown to be 10 times higher than ambient levels andcontribute to approximately 50% of total daily ultrafineparticle exposure among Los Angeles commuters [2, 3].These results can apply to most of urban areas where hightraffic volume exists. The high exposure at the above studiesis because air on the roadway is entrained into the vehiclecabin. On roadway vehicles with internal combustion enginesemit particulate emissions. CARB [4] and WHO [5] declareddiesel exhaust (including particulate) as a carcinogen based
on numerous health effect studies. The vehicle emissionsincluding PM (particulate matter) emissions are strictlyregulated to protect public health. However, roadways poseserious threat to the health of passengers due to a highconcentration of pollutants including particle emissions.
Scientists found cabin air-recirculation can reduce particleconcentrations in the vehicle cabin significantly andeffectively. Zhu et al. [2] found up to 85% reduction inparticle concentrations with cabin air-recirculation. Qi et al.[6] reported similar improvement in cabin air quality underfreeway driving conditions with air-recirculation. However,their findings could not be applied to the cars in the market.One important problem should be resolved to implement air-recirculation algorithm into the vehicle HVAC system forreduction of particle concentrations. Zhu et al. [2] showedthat CO2 concentrations rise to 4500ppm in 10 min for apassenger car with 3 passengers during air-recirculationmode. Occupational Safety and Health Administration(OSHA) has established 5000 ppm as the PermissibleExposure Limit (PEL) of CO2 for 8 hour [7]. As theoccupancy of a home or office space is very different fromthat of a vehicle, researchers have also referenced otherstandard. Mathur [8] cited ASHRAE standard 62 whichspecifies the safety level of CO2 in conditioned space. TheASHRAE standard is 700 ppm over ambient conditions on acontinuous basis. Therefore development of an air-recirculation system to reduce PM level is not possiblewithout controlling or suppressing increase of CO2concentrations in the cabin. Grady et al. [9] suggested such asystem which recirculates a fraction of cabin air (as opposedto 100% recirculation) to reduce PM concentrations whilesuppressing CO2 increase is possible.
This paper will provide mathematical model with whichtemporal change of CO2 concentrations can be predicted
Modeling CO2 Concentrations in Vehicle Cabin 2013-01-1497Published
04/08/2013
Heejung JungUniv. of California-Riverside
Copyright © 2013 SAE International
doi:10.4271/2013-01-1497
THIS DOCUMENT IS PROTECTED BY U.S. AND INTERNATIONAL COPYRIGHT.It may not be reproduced, stored in a retrieval system, distributed or transmitted, in whole or in part, in any form or by any means.
Downloaded from SAE International by Heejung Jung, Friday, March 01, 2013 12:29:08 AM
under various cabin air-recirculation conditions. This modelcan be used to design and control air-recirculation mode forproduction cars.
MODELING CO2 CONCENTRATIONThe cabin of a modern vehicle is a relatively well sealedspace except a distinctive inlet and outlet. Most of passengercars draw air from outside through a duct system which hasan inlet placed near the bottom of the windshield and theengine hood. This duct system is connected to the vehicleHVAC system. The outlet is called body vent which isusually hidden at rear bottom space of the cabin. The size andposition of the body vent is critical to maintain pressurebalance of the cabin and to reduce noise from outside.Although vehicle body leakage (i.e. flow in and flow outthrough gaps and crevice) can take place in any location otherthan the distinctive inlet and outlet, it is assumed that most ofthe leakage flow will be through the distinctive inlet andoutlet for properly maintained modern vehicles.
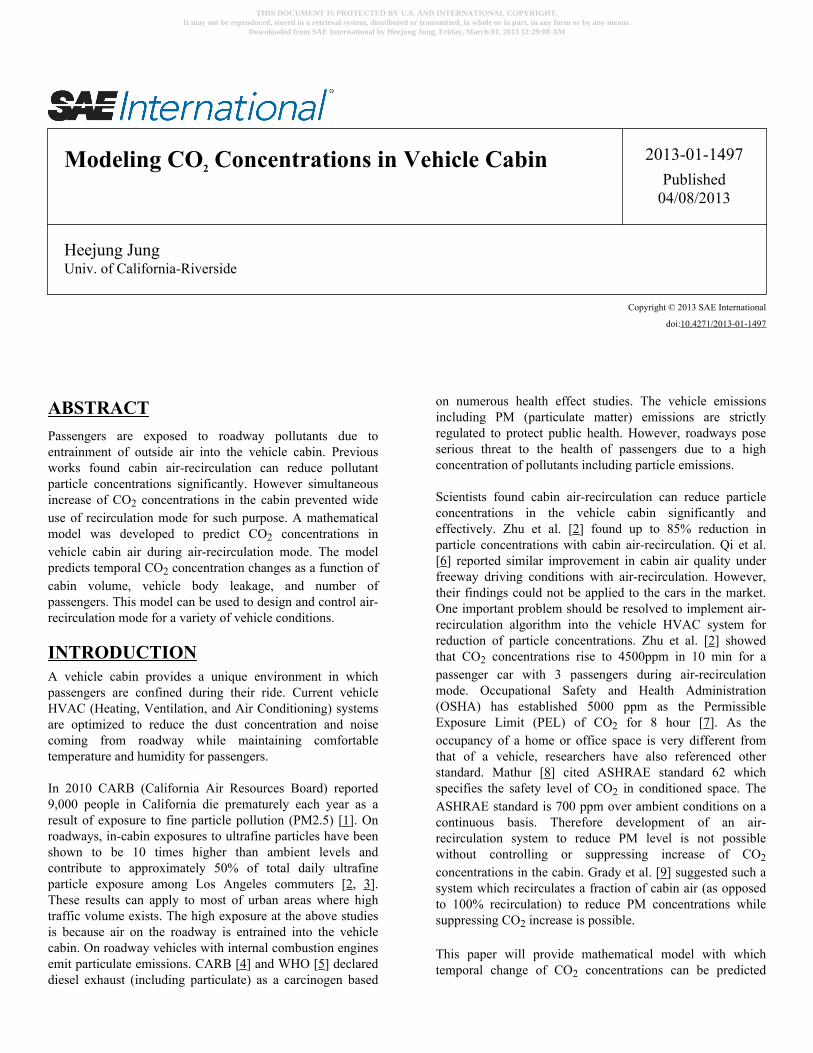
Figure 1 shows a schematic diagram of the vehicle cabinsystem. Qi is a flow through the inlet duct system and thisshould balance with Qo which is a flow through the bodyvent. Passengers are the source of CO2 within the cabin. Thenormal human breath exhales CO2 at levels ranging from38,000 ppm to 56,000 ppm with rates ranging from 220ml/min at rest to 1650 ml/min during moderate exercise [10].This high concentration exhale can lead to high levels of theCO2 concentration in enclosed spaces like the vehicle cabinunless it is well ventilated. The outside CO2 concentration isfixed at the ambient CO2 level which is around 385 to 395ppm [11]− 390 ppm was used for all fits- while the in-cabinCO2 concentration can vary as a function of the strength ofthe source term (i.e. number of passengers), cabin volume(Vc) and body leakage flow (Ql=Qi=Qo). Ql can vary as afunction of other parameters such as ventilation fan speed,vehicle speed, geometry of the HVAC duct system etc.
Figure 1. Schematic diagram of vehicle cabin air system
The CO2 mass balance equation for the vehicle cabin can beexpressed as equation 1 using schematics in Figure 1.
(1)
Where mc is the mass of CO2 in cabin, t is the time, n is thenumber of passengers, Cex is the concentration of CO2 inexhale and Qex is the flow rate of exhale, Co is the CO2concentration outside, Ql is the body leakage flow, and Cc isthe CO2 concentration in cabin. Left side of the equation 1shows the time derivative of CO2 mass in the control volume(i.e. vehicle cabin). The first, second and third term on theright side show CO2 mass change due to exhale, inflow ofoutside air and outflow of the cabin air. Equation 2 showsrelationship between the cabin volume, CO2 mass and CO2concentration.
(2)
, where Vc is the cabin volume. After substituting equation 2into equation 1, the governing equation which determinesCO2 concentrations in the vehicle cabin can be expressed by:
(3)
, which is the first order ordinary differential equation. Thesolution of the equation 3 should predict CO2 concentrationsof the cabin air under various conditions. It is worth to notethat the body leakage (Ql) should be determined to solve theequation 3. When the vehicle is motionless and ventilationfan is off, the body leakage (Ql) becomes nearly zero. Underthis condition there is a special solution:
(4)
, where Cc0 is the in-cabin CO2 concentration at t=0.Equation 4 shows a linear increase of the CO2 concentrationas a function of time. The body leakage (Ql) will have non-zero value under all other conditions such as when vehicle isin motion and/or the ventilation fan is on. Under theseconditions the equation 3 has a general solution as shownbelow:
(5)
The coefficient of the exponential function can becomepositive or negative depending on whether the initial in-cabinCO2 concentration is greater than the equilibrium CO2
THIS DOCUMENT IS PROTECTED BY U.S. AND INTERNATIONAL COPYRIGHT.It may not be reproduced, stored in a retrieval system, distributed or transmitted, in whole or in part, in any form or by any means.
Downloaded from SAE International by Heejung Jung, Friday, March 01, 2013 12:29:08 AM
concentration or not. This will result in exponential decreaseor increase of the cabin CO2 concentration.
The inverse of the coefficient in the exponential functiondefines the time constant of the system as:
(6), where τ is the time constant. Time response of the CO2concentration becomes slow as the cabin volume increasesand body leakage decreases.
An equilibrium CO2 concentration can also be obtained fromthe equation 3 by assuming zero value for the time derivativeterm.
(7)This expression was already included in equation 5 todetermine the coefficient of the exponential term.
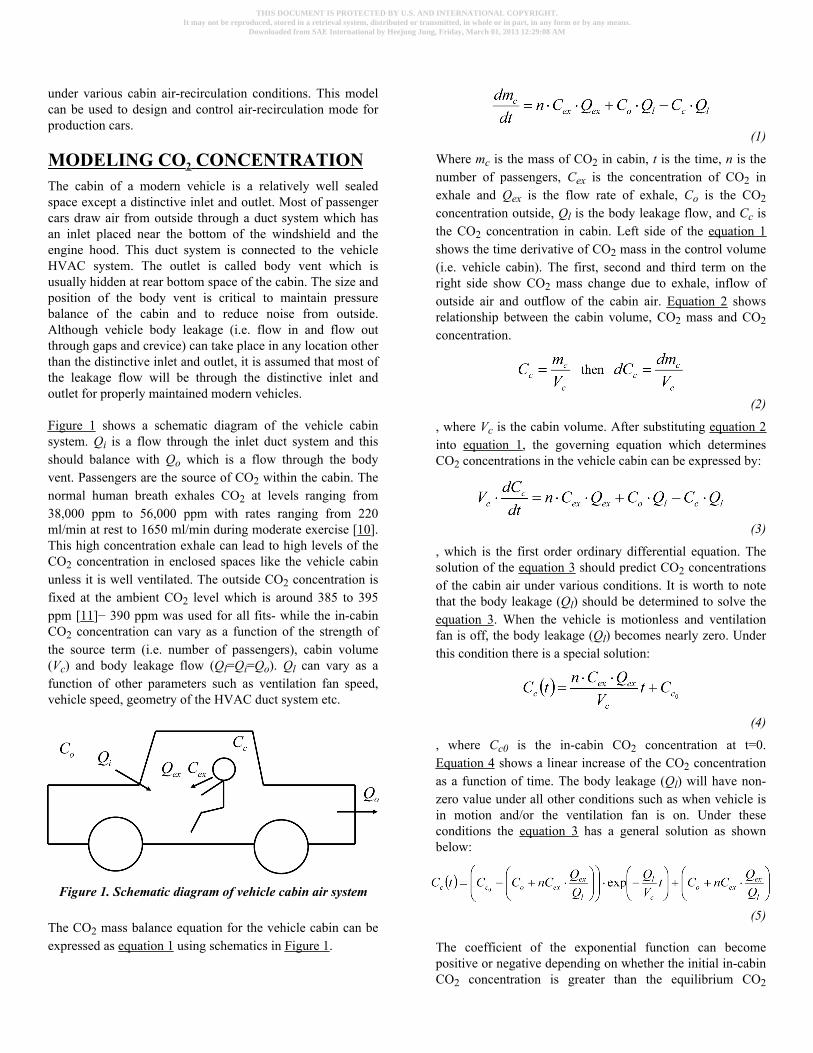
DETERMINATION OF UNKNOWNSThis section explains how to determine unknowns in theanalytic solutions by comparing with experimental data. First,a test was conducted using a light duty passenger vehicle.Specifications of the vehicle are not important forunderstanding therefore not provided. The cabin air wassampled at the shoulder level of a driver above the centerconsole, facing away from the front vehicle HVAC system.The CO2 concentration was quantified using CIRAS-2 SC(PP-Systems) using NDIR method. The vehicle was at restand the ventilation fan was off. Two passengers were in thevehicle and the CO2 concentration was measured as afunction of time. This experimental condition is for thespecial solution (equation 4). The data was fitted to a linearline and coefficients of the fitted lines are shown in Figure 2.By comparing coefficients of the fitted line and equation 4,the unknown, n · Cex · Qex could be determined. Forexample, Cex · Qex = 2.69 · Vc. Then Cex · Qex = 2.69·Vc =9,713 Vc assuming is 3600 liter. It should be noted that wasforced to be 390 ppm for all data fittings. Predicted trendlines were also drawn using equation 4 for 3 and 4 passengersin Figure 2.
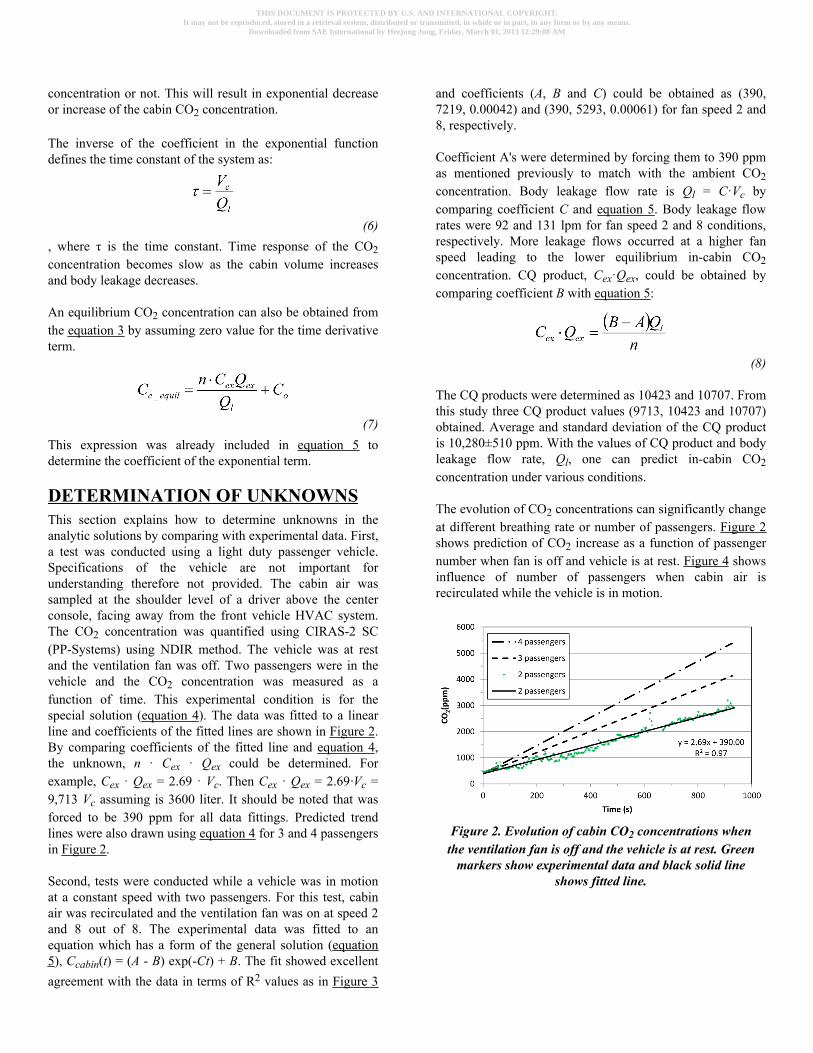
Second, tests were conducted while a vehicle was in motionat a constant speed with two passengers. For this test, cabinair was recirculated and the ventilation fan was on at speed 2and 8 out of 8. The experimental data was fitted to anequation which has a form of the general solution (equation5), Ccabin(t) = (A - B) exp(-Ct) + B. The fit showed excellentagreement with the data in terms of R2 values as in Figure 3
and coefficients (A, B and C) could be obtained as (390,7219, 0.00042) and (390, 5293, 0.00061) for fan speed 2 and8, respectively.
Coefficient A's were determined by forcing them to 390 ppmas mentioned previously to match with the ambient CO2concentration. Body leakage flow rate is Ql = C·Vc bycomparing coefficient C and equation 5. Body leakage flowrates were 92 and 131 lpm for fan speed 2 and 8 conditions,respectively. More leakage flows occurred at a higher fanspeed leading to the lower equilibrium in-cabin CO2concentration. CQ product, Cex·Qex, could be obtained bycomparing coefficient B with equation 5:
(8)
The CQ products were determined as 10423 and 10707. Fromthis study three CQ product values (9713, 10423 and 10707)obtained. Average and standard deviation of the CQ productis 10,280±510 ppm. With the values of CQ product and bodyleakage flow rate, Ql, one can predict in-cabin CO2concentration under various conditions.
The evolution of CO2 concentrations can significantly changeat different breathing rate or number of passengers. Figure 2shows prediction of CO2 increase as a function of passengernumber when fan is off and vehicle is at rest. Figure 4 showsinfluence of number of passengers when cabin air isrecirculated while the vehicle is in motion.
Figure 2. Evolution of cabin CO2 concentrations whenthe ventilation fan is off and the vehicle is at rest. Green
markers show experimental data and black solid lineshows fitted line.
THIS DOCUMENT IS PROTECTED BY U.S. AND INTERNATIONAL COPYRIGHT.It may not be reproduced, stored in a retrieval system, distributed or transmitted, in whole or in part, in any form or by any means.
Downloaded from SAE International by Heejung Jung, Friday, March 01, 2013 12:29:08 AM
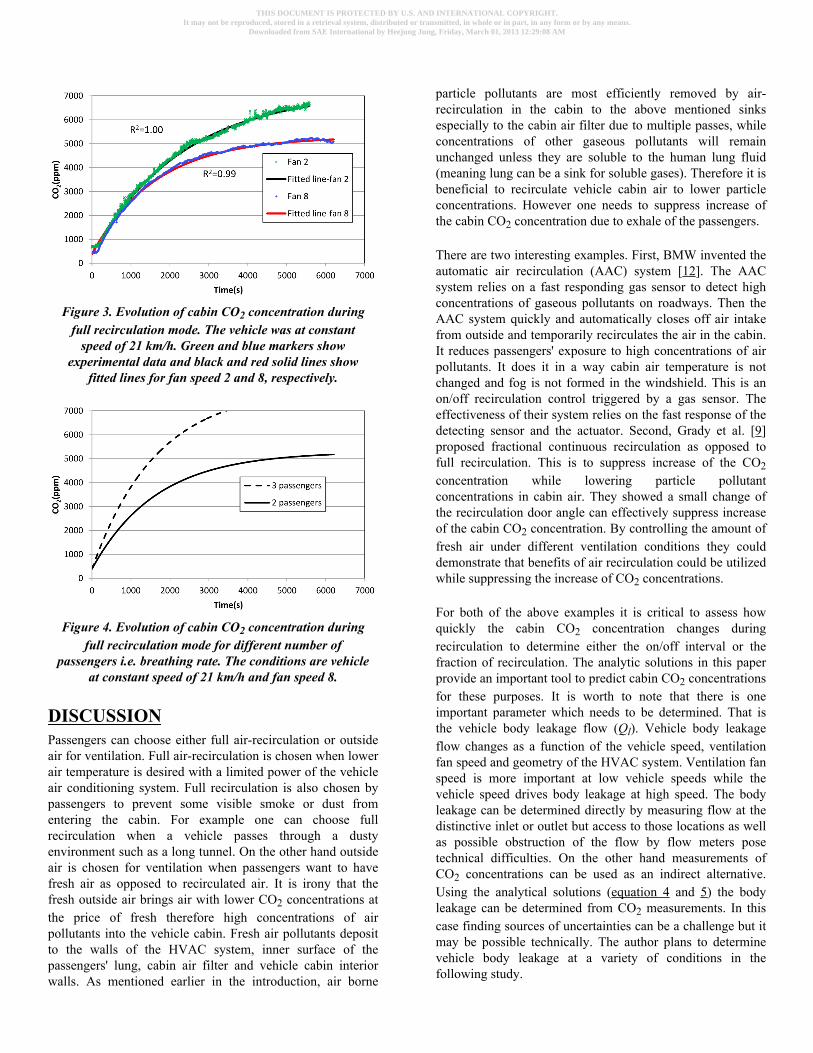
Figure 3. Evolution of cabin CO2 concentration duringfull recirculation mode. The vehicle was at constant
speed of 21 km/h. Green and blue markers showexperimental data and black and red solid lines show
fitted lines for fan speed 2 and 8, respectively.
Figure 4. Evolution of cabin CO2 concentration duringfull recirculation mode for different number of
passengers i.e. breathing rate. The conditions are vehicleat constant speed of 21 km/h and fan speed 8.
DISCUSSIONPassengers can choose either full air-recirculation or outsideair for ventilation. Full air-recirculation is chosen when lowerair temperature is desired with a limited power of the vehicleair conditioning system. Full recirculation is also chosen bypassengers to prevent some visible smoke or dust fromentering the cabin. For example one can choose fullrecirculation when a vehicle passes through a dustyenvironment such as a long tunnel. On the other hand outsideair is chosen for ventilation when passengers want to havefresh air as opposed to recirculated air. It is irony that thefresh outside air brings air with lower CO2 concentrations atthe price of fresh therefore high concentrations of airpollutants into the vehicle cabin. Fresh air pollutants depositto the walls of the HVAC system, inner surface of thepassengers' lung, cabin air filter and vehicle cabin interiorwalls. As mentioned earlier in the introduction, air borne
particle pollutants are most efficiently removed by air-recirculation in the cabin to the above mentioned sinksespecially to the cabin air filter due to multiple passes, whileconcentrations of other gaseous pollutants will remainunchanged unless they are soluble to the human lung fluid(meaning lung can be a sink for soluble gases). Therefore it isbeneficial to recirculate vehicle cabin air to lower particleconcentrations. However one needs to suppress increase ofthe cabin CO2 concentration due to exhale of the passengers.
There are two interesting examples. First, BMW invented theautomatic air recirculation (AAC) system [12]. The AACsystem relies on a fast responding gas sensor to detect highconcentrations of gaseous pollutants on roadways. Then theAAC system quickly and automatically closes off air intakefrom outside and temporarily recirculates the air in the cabin.It reduces passengers' exposure to high concentrations of airpollutants. It does it in a way cabin air temperature is notchanged and fog is not formed in the windshield. This is anon/off recirculation control triggered by a gas sensor. Theeffectiveness of their system relies on the fast response of thedetecting sensor and the actuator. Second, Grady et al. [9]proposed fractional continuous recirculation as opposed tofull recirculation. This is to suppress increase of the CO2concentration while lowering particle pollutantconcentrations in cabin air. They showed a small change ofthe recirculation door angle can effectively suppress increaseof the cabin CO2 concentration. By controlling the amount offresh air under different ventilation conditions they coulddemonstrate that benefits of air recirculation could be utilizedwhile suppressing the increase of CO2 concentrations.
For both of the above examples it is critical to assess howquickly the cabin CO2 concentration changes duringrecirculation to determine either the on/off interval or thefraction of recirculation. The analytic solutions in this paperprovide an important tool to predict cabin CO2 concentrationsfor these purposes. It is worth to note that there is oneimportant parameter which needs to be determined. That isthe vehicle body leakage flow (Ql). Vehicle body leakageflow changes as a function of the vehicle speed, ventilationfan speed and geometry of the HVAC system. Ventilation fanspeed is more important at low vehicle speeds while thevehicle speed drives body leakage at high speed. The bodyleakage can be determined directly by measuring flow at thedistinctive inlet or outlet but access to those locations as wellas possible obstruction of the flow by flow meters posetechnical difficulties. On the other hand measurements ofCO2 concentrations can be used as an indirect alternative.Using the analytical solutions (equation 4 and 5) the bodyleakage can be determined from CO2 measurements. In thiscase finding sources of uncertainties can be a challenge but itmay be possible technically. The author plans to determinevehicle body leakage at a variety of conditions in thefollowing study.
THIS DOCUMENT IS PROTECTED BY U.S. AND INTERNATIONAL COPYRIGHT.It may not be reproduced, stored in a retrieval system, distributed or transmitted, in whole or in part, in any form or by any means.
Downloaded from SAE International by Heejung Jung, Friday, March 01, 2013 12:29:08 AM
CONCLUSIONSThe main objective of this study was to derive theoreticalequations which can predict cabin CO2 concentrations undervarious conditions. This was done by applying CO2 massbalance on the vehicle cabin system. A secondary objectivewas to validate the theoretical equations by comparing withexperimental data. This was done by fitting experimental datausing the theoretical equations.
The model equations were validated against experimentaldata. The coefficients of the special solution (equation 4)were determined by comparing with experimental dataobtained while the fan was off and the vehicle was at rest.The coefficients of the general solution (equation 5) weredetermined by comparing with experimental data obtainedwhile the fan is at 2 and 8 out of 8 and the vehicle was at 21km/h constant speed. The R squared values of the two fitswere 1.00 and 0.99 respectively. This reflects the theoreticalsolution predicts the change of CO2 concentrations extremelywell.
To take full advantage of the theoretical equations derived inthis paper, vehicle body leakage needs to be determinedexperimentally at all conditions of interest. Then, cabin CO2concentrations can be predicted with no further experiment.The uncertainty in measuring body leakage will propagate topredicted CO2 concentrations. Comprehensivecharacterization of vehicle body leakage and uncertaintiesdetermining CO2 concentrations are subjects which requirefurther study.
In conclusion, analytic solutions were derived to model timeevolution of cabin air during recirculation. This mathematicalmodel can be used to design on/off or a fractionalrecirculation system which can reduce passengers' exposureto airborne pollutants, especially particle pollutants, entrainedfrom outside.
REFERENCES1. California Air Resources Board, 2010, Estimate ofPremature Deaths Associated with Fine Particle Pollution(PM2.5) in California Using a U.S. Environmental ProtectionAgency Methodology, CARB report, http://www.arb.ca.gov/research/health/pm-mort/pm-report_2010.pdf
2. Zhu, Y. F., Eiguren-Fernandez A., et al., 2007, In-cabincommuter exposure to ultrafine particles on Los Angelesfreeways. Environmental Science & Technology 41(7):2138-2145.
3. Fruin, S., Westerdahl D., et al., 2008, Measurements andpredictors of on-road ultrafine particle concentrations andassociated pollutants in Los Angeles. AtmosphericEnvironment 42(2): 207-219.
4. California Air Resource Board, 1998, The Report onDiesel Exhaust, CARB report, http://www.arb.ca.gov/toxics/dieseltac/de-fnds.htm
5. World Health Organization, 2012, IARC: Diesel EngineExhaust Carcinogenic, Press Release, http://press.iarc.fr/pr213_E.pdf
6. Qi C., Stanley N., Pui D. Y. H. and Kuehn T. H., 2008,Laboratory and On-Road Evaluations of Cabin Air FiltersUsing Number and Surface Area Concentration Monitors,Environ. Sci. Technol., 42 (11), 4128-4132
7. Occupational Safety and Health Standards, Standardnumber 1910.1000 Table Z-1
8. Mathur, G., “Field Monitoring of Carbon Dioxide inVehicle Cabin to Monitor Indoor Air Quality and Safety inFoot and Defrost Modes,” SAE Technical Paper2009-01-3080, 2009, doi:10.4271/2009-01-3080.
9. Grady, M., Kim, Y., Park, J., Lee, B. et al., “AirConditioning Efficiency with Varied Recirculation Ratios,”SAE Technical Paper 2013-01-1494, 2013, doi:10.4271/2013-01-1494.
10. Scott J. L., Kraemer D. G., Keller R. J., 2009,Occupational Hazards of Carbon Dioxide Exposure, Journalof Chemical Health and Safety, 16, 2, 18-22
11. NOAA, 2012, Trends in Carbon Dioxide, http://www.esrl.noaa.gov/gmd/ccgg/trends/
12. BMW AAC, http://www.bmw.com/com/en/insights/technology/technol ogy_guide/articles/automatic_air_recirculation.html
CONTACT INFORMATIONHeejung S. [email protected]
ACKNOWLEDGMENTSThe author gratefully acknowledges Hyundai-Kia motors toprovide the test vehicle and funding for this study. The authorwould like to thank Mike Grady for the experimental data.
DEFINITIONS/ABBREVIATIONSCARB - California Air Resource BoardPM2.5 - particles below 2.5 μmWHO - World Health Organization
THIS DOCUMENT IS PROTECTED BY U.S. AND INTERNATIONAL COPYRIGHT.It may not be reproduced, stored in a retrieval system, distributed or transmitted, in whole or in part, in any form or by any means.
Downloaded from SAE International by Heejung Jung, Friday, March 01, 2013 12:29:08 AM

The Engineering Meetings Board has approved this paper for publication. It hassuccessfully completed SAE's peer review process under the supervision of the sessionorganizer. This process requires a minimum of three (3) reviews by industry experts.
All rights reserved. No part of this publication may be reproduced, stored in aretrieval system, or transmitted, in any form or by any means, electronic, mechanical,photocopying, recording, or otherwise, without the prior written permission of SAE.
ISSN 0148-7191
Positions and opinions advanced in this paper are those of the author(s) and notnecessarily those of SAE. The author is solely responsible for the content of the paper.
SAE Customer Service:Tel: 877-606-7323 (inside USA and Canada)Tel: 724-776-4970 (outside USA)Fax: 724-776-0790Email: [email protected] Web Address: http://www.sae.orgPrinted in USA
THIS DOCUMENT IS PROTECTED BY U.S. AND INTERNATIONAL COPYRIGHT.It may not be reproduced, stored in a retrieval system, distributed or transmitted, in whole or in part, in any form or by any means.
Downloaded from SAE International by Heejung Jung, Friday, March 01, 2013 12:29:08 AM