Embed Size (px)
Citation preview
fast forward spokaneChapter
BACKGROUND AND CONTEXT
2

f A s T f O R w A R D s p O K A N E D O w N T O w N p l A N U p D A T E
19
Background and ContextC H A P T E R T W O
I N T H I S C H A P T E R
R E g I o N A l C o N T E x T
H I S T o R y o f d E v E l o P m E N T
P A S T A N d C u R R E N T P l A N N I N g E f f o R T S
S o C I o - E C o N o m I C o v E R v I E W
l A N d u S E
T R A N S P o R T A T I o N A N d C I R C u l A T I o N
B u I l T f o R m
T R E N d S A f f E C T I N g d o W N T o W N
S u m m A R y o f T R E N d S , I S S u E S
A N d o P P o R T u N I T I E S
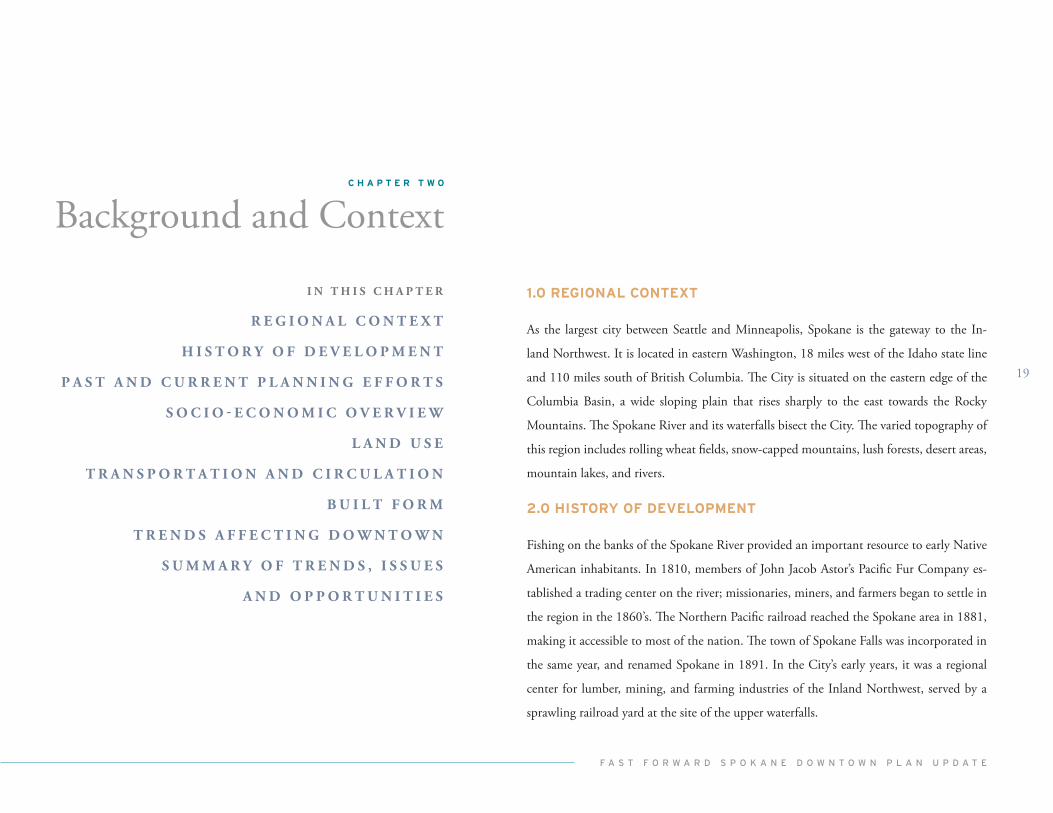
1.0 REGIONAL CONTEXT
As the largest city between Seattle and Minneapolis, Spokane is the gateway to the In-
land Northwest. It is located in eastern Washington, 18 miles west of the Idaho state line
and 110 miles south of British Columbia. The City is situated on the eastern edge of the
Columbia Basin, a wide sloping plain that rises sharply to the east towards the Rocky
Mountains. The Spokane River and its waterfalls bisect the City. The varied topography of
this region includes rolling wheat fields, snow-capped mountains, lush forests, desert areas,
mountain lakes, and rivers.
2.0 HISTORY OF DEVELOPMENT
Fishing on the banks of the Spokane River provided an important resource to early Native
American inhabitants. In 1810, members of John Jacob Astor’s Pacific Fur Company es-
tablished a trading center on the river; missionaries, miners, and farmers began to settle in
the region in the 1860’s. The Northern Pacific railroad reached the Spokane area in 1881,
making it accessible to most of the nation. The town of Spokane Falls was incorporated in
the same year, and renamed Spokane in 1891. In the City’s early years, it was a regional
center for lumber, mining, and farming industries of the Inland Northwest, served by a
sprawling railroad yard at the site of the upper waterfalls.
C h A p T E R T w O B A C K G R O U N D A N D C O N T E X T
f A s T f O R w A R D s p O K A N E D O w N T O w N p l A N U p D A T E
20
Like many other American cities, Spokane experienced
increasing decentralization over time. In the latter half of
the 20th century, the growth of suburban single family
housing and outlying commercial centers eroded Down-
town’s dominance as the region’s retail and residential cen-
ter. Despite this, it continues to be a vital commercial and
cultural center, attracting many visitors with its Conven-
tion Center, cultural activities, sports events, Riverfront
Park attractions, commerce, shopping, and dining. As the
host of the 1974 World’s Fair Environmental Exposition,
the City converted a rusting rail yard into the 100-acre
Riverfront Park, centered on the Spokane River. This park
remains the physical and symbolic focal point of the com-
munity. It is a living example of Spokane’s commitment
to Downtown and its ability to change with the times.
The park continues to evolve thanks to the development
of the Great Gorge Park, which links Downtown to High
Bridge Park and the Centennial Trail.
Since 1999, Downtown Spokane has increasingly rees-
tablished itself as the nightlife and entertainment hub
of Eastern Washington and the larger region, with the
opening of various restaurants and bars, and new and re-
furbished cultural facilities, such as the INB Performing
Arts Center, Bing Crosby Theater, and the Fox Theater.
The opening of River Park Square in 1999 strengthened
Downtown’s position as the retail center of the Inland
Northwest.
Spokane also has seen significant growth in its conven-
tion and hospitality industry as a result of major hotel
development and the expansion of the Spokane Conven-
tion Center. Additionally, the University District is home
to three universities and serves approximately 10,000
students, growing in enrollment and programmatic di-
versity every year. The Community Colleges of Spokane
also have a presence and plan to bring more students
to the area as well. Together, these projects have helped
to create an increasingly vibrant urban environment in
Downtown.
Spokane’s enviable high quality of life has earned the City
numerous accolades. In 2005, Spokane was rated as one
of the most walkable cities in the U.S. by Prevention Mag-
azine. The City’s burgeoning high-tech industry has also
established Spokane as one of the country’s best places
for entrepreneurial businesses. In 2007, Spokane ranked
number 22 on Inc. Magazine’s list of the “Best Midsize
Cities for Doing Business” and number 20 on Forbes’ list
of overall “Best Places.” In 2008, Spokane ranked num-
ber nine on Forbes’ list of “Best Places for Business and
Careers”.
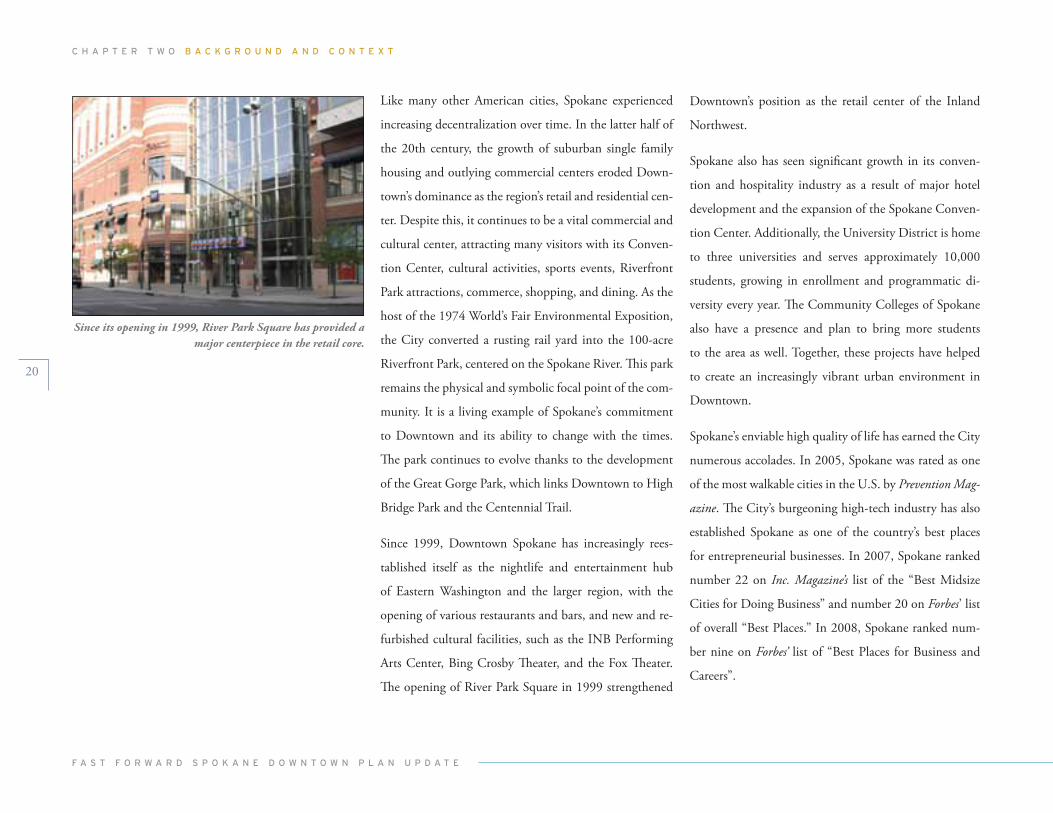
Since its opening in 1999, River Park Square has provided a major centerpiece in the retail core.
C h A p T E R T w O B A C K G R O U N D A N D C O N T E X T
f A s T f O R w A R D s p O K A N E D O w N T O w N p l A N U p D A T E
21
June 2008Downtown Plan Update
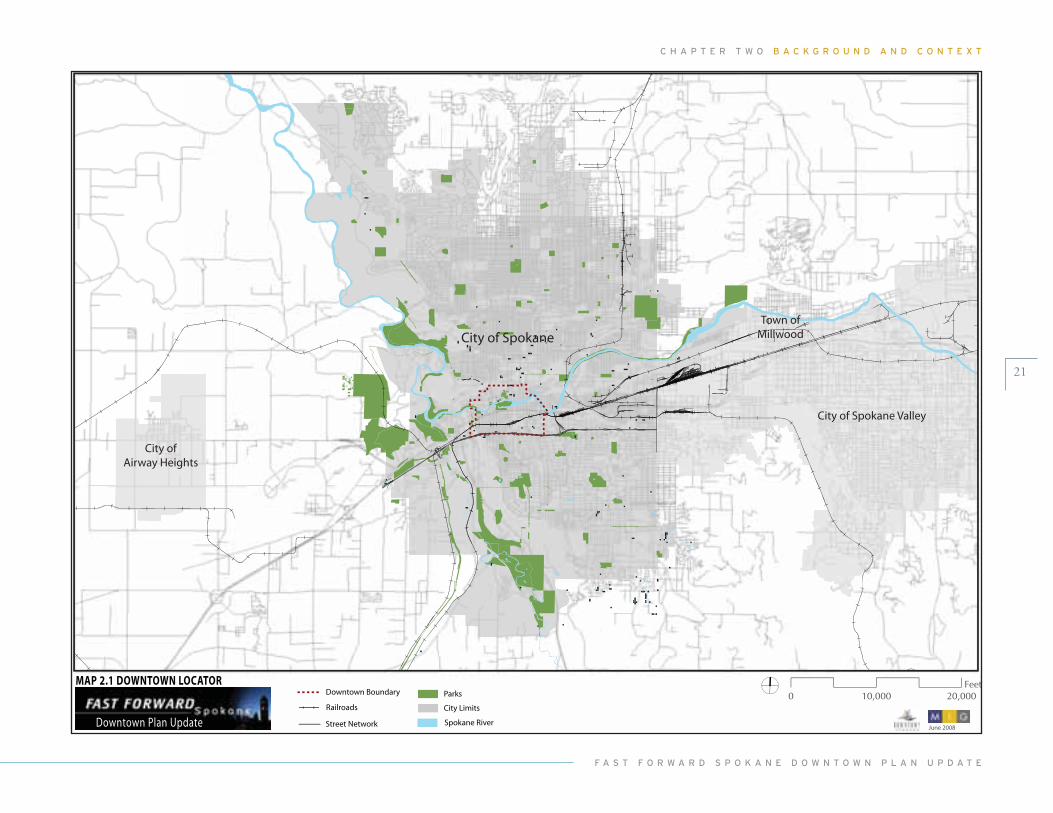
MAP 2.1 DOWNTOWN LOCATOR
Railroads
ParksDowntown Boundary
Street Network
City Limits
Spokane River
0 20,00010,000Feet
City of Airway Heights
City of Spokane
City of Spokane Valley
Town of Millwood
C h A p T E R T w O B A C K G R O U N D A N D C O N T E X T
f A s T f O R w A R D s p O K A N E D O w N T O w N p l A N U p D A T E
22
The 1999 Plan set the following strategic objectives for
Downtown Spokane:
development opportunity Sites: Target Convention Center and underutilized properties on Stevens Street between Spokane Falls Boulevard and Main Avenue as key opportunity sites for new development.
green Streets: Create a network of three types of green streets centered on Howard Street and Spokane Falls Boulevard.
Howard Street “String of Pearls”: Develop Howard Street as the central pedestrian element in Downtown Spokane. Make this street the “string” that links the “pearls,” or activity centers, of Downtown.
Spokane falls Boulevard link: Enhance Spokane Falls Boulevard as the primary connection between the Convention Center/INB Performing Arts Center and the Downtown retail core.
urban Refuge: Enhance Riverfront Park as a peaceful urban refuge in the center of Downtown.
downtown Public Square: Develop a new public square on Riverside Avenue between Howard Street and Post Street as a “ceremonial” place for the City, designed for public events and informal gatherings.
Increased Public Transportation: Build a new light rail line to help ensure smooth traffic flow through Down-town from the east side of the City.
Skywalk Improvements: Improve connections from the skywalks to the street level and parking ramps.
Fourteen priority projects were identified in the 1999 Plan to catalyze revitalization of the Downtown. These projects, and their status in 2008, are listed in Table 2.1.
•
•
•
•
•
•
•
•
•
3.0 PAST AND CONCURRENT PLANNING EFFORTS
Prepared for:
THE CITY OF SPOKANE
DOWNTOWN SPOKANE PARTNERSHIP
The Plan for a New Downtown
J U L Y 1 9 9 9
CHARTING THE FUTURECHARTING THE FUTURE
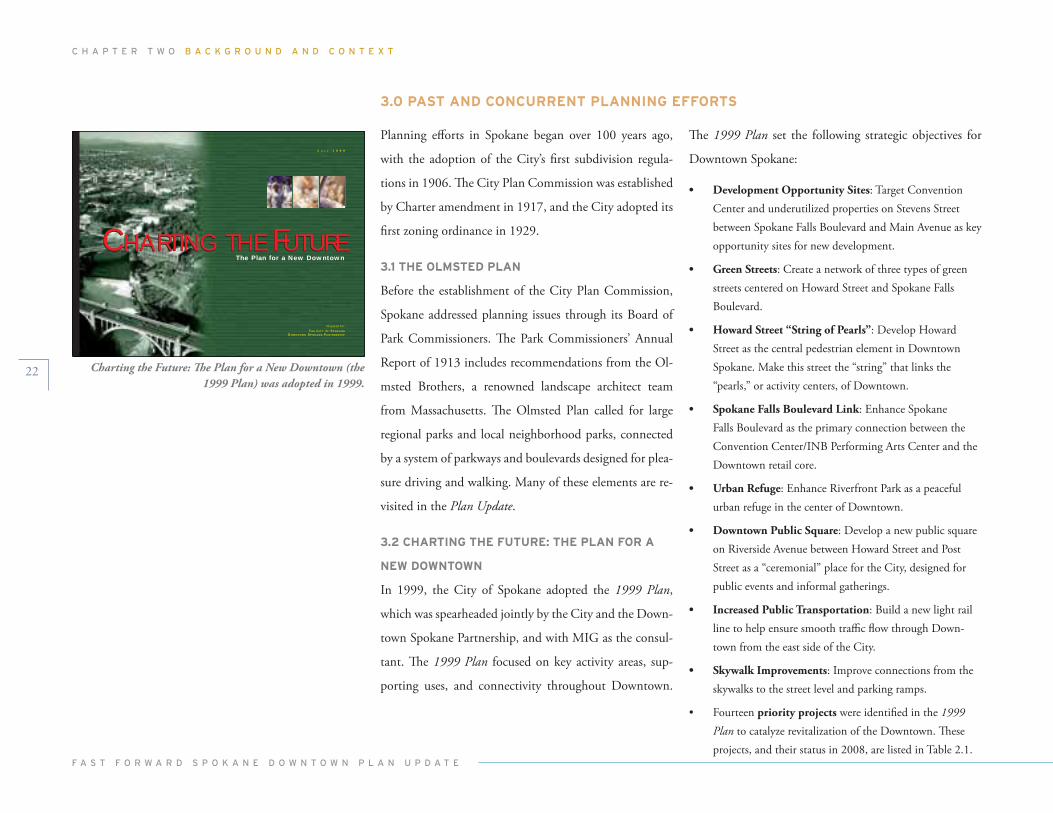
Charting the Future: The Plan for a New Downtown (the 1999 Plan) was adopted in 1999.
Planning efforts in Spokane began over 100 years ago,
with the adoption of the City’s first subdivision regula-
tions in 1906. The City Plan Commission was established
by Charter amendment in 1917, and the City adopted its
first zoning ordinance in 1929.
3.1 THE OLMSTED PLAN
Before the establishment of the City Plan Commission,
Spokane addressed planning issues through its Board of
Park Commissioners. The Park Commissioners’ Annual
Report of 1913 includes recommendations from the Ol-
msted Brothers, a renowned landscape architect team
from Massachusetts. The Olmsted Plan called for large
regional parks and local neighborhood parks, connected
by a system of parkways and boulevards designed for plea-
sure driving and walking. Many of these elements are re-
visited in the Plan Update.
3.2 CHARTING THE FUTURE: THE PLAN FOR A
NEW DOWNTOWN
In 1999, the City of Spokane adopted the 1999 Plan,
which was spearheaded jointly by the City and the Down-
town Spokane Partnership, and with MIG as the consul-
tant. The 1999 Plan focused on key activity areas, sup-
porting uses, and connectivity throughout Downtown.
C h A p T E R T w O B A C K G R O U N D A N D C O N T E X T
f A s T f O R w A R D s p O K A N E D O w N T O w N p l A N U p D A T E
23
3.3 RECENT DOWNTOWN AREA PLANS
Since 1999, the City and its partners have undertaken nu-
merous planning efforts that will influence the direction
of the Plan Update. These studies help provide a context
for understanding the continued evolution of Downtown.
The most significant of these plans are summarized on the
following pages.
3.3.1 Residential Market Potential Study, Feb. 2003
The City and the Downtown Spokane Partnership, with
partial financial backing by the Federal National Mort-
gage Association (Fannie Mae), oversaw the development
of the Residential Market Potential Study, conducted by
Zimmerman/Volk Associates, Inc. in 2003. The purpose
of the study was to identify the market potential for new
market-rate housing units in Downtown.
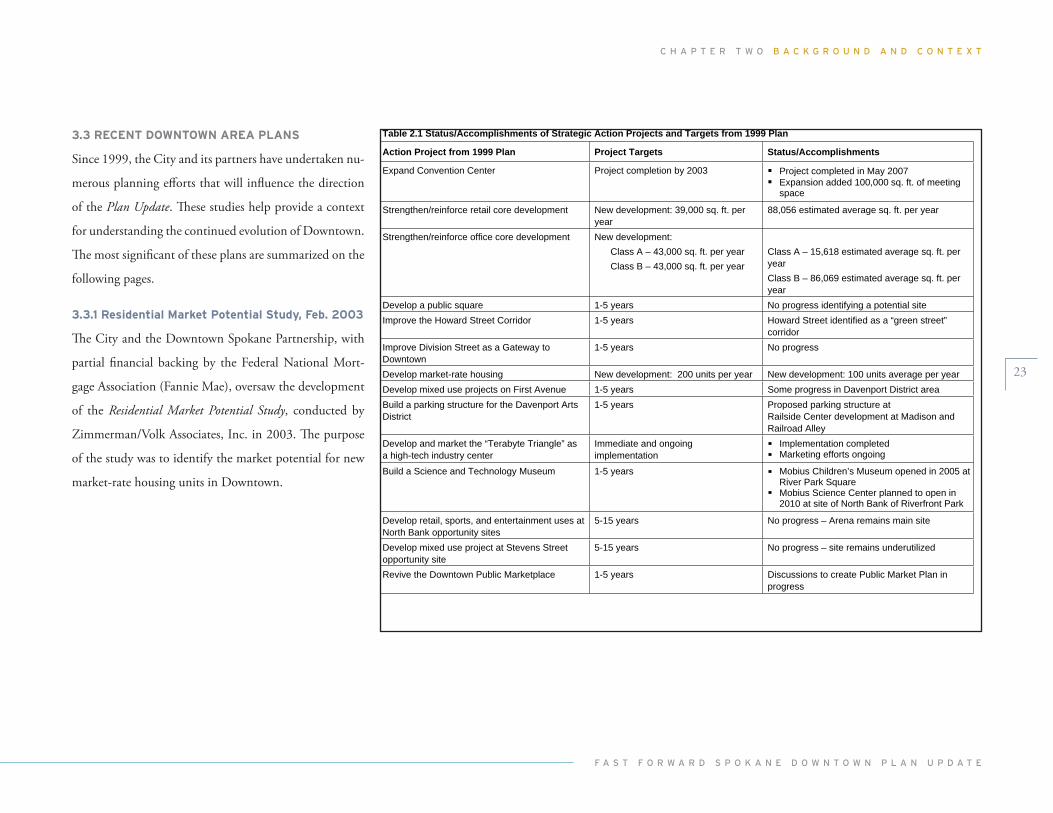
Table 2.1 Status/Accomplishments of Strategic Action Projects and Targets from 1999 Plan
Action Project from 1999 Plan Project Targets Status/Accomplishments
Expand Convention Center Project completion by 2003 Project completed in May 2007Expansion added 100,000 sq. ft. of meetingspace
Strengthen/reinforce retail core development New development: 39,000 sq. ft. peryear
88,056 estimated average sq. ft. per year
Strengthen/reinforce office core development New development:Class A – 43,000 sq. ft. per yearClass B – 43,000 sq. ft. per year
Class A – 15,618 estimated average sq. ft. peryearClass B – 86,069 estimated average sq. ft. peryear
Develop a public square 1-5 years No progress identifying a potential siteImprove the Howard Street Corridor 1-5 years Howard Street identified as a “green street”
corridorImprove Division Street as a Gateway toDowntown
1-5 years No progress
Develop market-rate housing New development: 200 units per year New development: 100 units average per yearDevelop mixed use projects on First Avenue 1-5 years Some progress in Davenport District areaBuild a parking structure for the Davenport ArtsDistrict
1-5 years Proposed parking structure atRailside Center development at Madison andRailroad Alley
Develop and market the “Terabyte Triangle” asa high-tech industry center
Immediate and ongoingimplementation
Implementation completedMarketing efforts ongoing
Build a Science and Technology Museum 1-5 years Mobius Children’s Museum opened in 2005 atRiver Park SquareMobius Science Center planned to open in2010 at site of North Bank of Riverfront Park
Develop retail, sports, and entertainment uses atNorth Bank opportunity sites
5-15 years No progress – Arena remains main site
Develop mixed use project at Stevens Streetopportunity site
5-15 years No progress – site remains underutilized
Revive the Downtown Public Marketplace 1-5 years Discussions to create Public Market Plan inprogress
C h A p T E R T w O B A C K G R O U N D A N D C O N T E X T
f A s T f O R w A R D s p O K A N E D O w N T O w N p l A N U p D A T E
24
The study yielded the following key findings:
Considerable latent demand existed for Downtown hous-ing, both new construction and adaptive re-use of existing buildings.
The market potential for new market-rate housing units to be leased or sold within Downtown Spokane was 4,100 households.
Just under half of these 4,100 households were currently living in the City of Spokane or Spokane County at the time of the study. A significant portion of the potential market was expected to move from the Seattle/Tacoma area (11 percent), from Southern California (four per-cent) or from elsewhere in the nation (35 percent).
The household groups that comprised the potential market were:
Younger singles and couples without children (53 percent);
Well-to-do empty nesters and retirees (41 percent); and
A range of urban families (six percent).
Downtown Spokane should be able to support nearly 300
new units per year over the five-year period ending 2008.
•
•
•
•
1.
2.
3.
•
3.3.2 The University District Strategic Master
Plan, Nov. 2004
A University District Strategic Master Plan was prepared by
the City of Spokane’s Economic Development Depart-
ment in 2004, with MIG as the consultant. This plan
established the community’s vision for the University
District and addressed the District’s economic develop-
ment issues, urban growth, environmental restoration,
transportation, and affordable housing needs. The Master
Plan laid out the following goals for the District:
Construct a pedestrian/bicycle bridge that will cross the existing Burlington Northern/Santa Fe railroad tracks at Grant Street. This bridge is expected to facilitate pedestrian and bicycle traffic directly to the south of the Riverpoint Campus and provide a link to the underdevel-oped commercial district around Sprague Avenue.
Create a vibrant mixed-use environment with housing, campus facilities, pedestrian amenities, shopping, dining, and gathering places. Permanent employment oppor-tunities are expected to be created to support a growing student population.
Incorporate sustainable design as a core principle, includ-ing pedestrian and bicycle improvements, the restoration of the Spokane River, utilizing “green designs” for new infrastructure and the expectation that new buildings will strive for LEED® certification
Create public meeting and gathering places that promote festivals, community gatherings, ceremonies, and public performances.
•
•
•
•
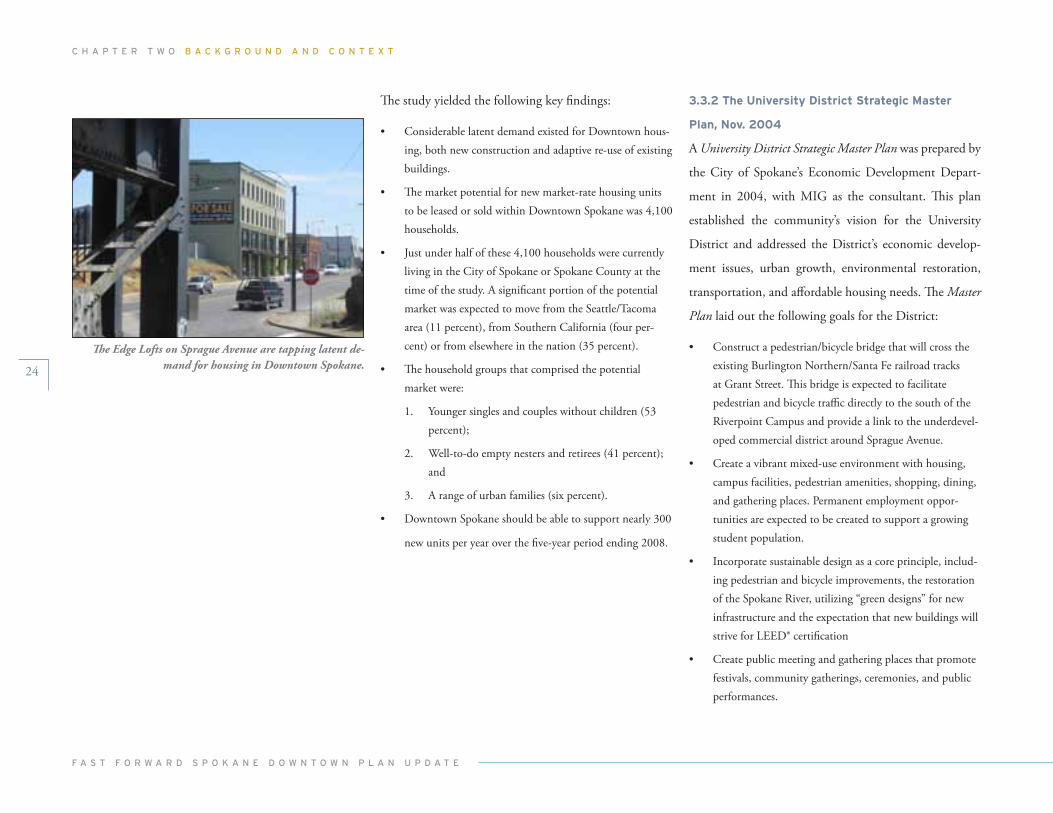
The Edge Lofts on Sprague Avenue are tapping latent de-mand for housing in Downtown Spokane.
C h A p T E R T w O B A C K G R O U N D A N D C O N T E X T
f A s T f O R w A R D s p O K A N E D O w N T O w N p l A N U p D A T E
25
3.3.3 Great Spokane River Gorge Strategic Master
Plan, March, 2005
This Master Plan, which was developed by MIG for
Friends of the Falls, identifies guidelines, projects, and
strategies to activate the Spokane River Gorge by provid-
ing enhanced educational, recreational, cultural, and aes-
thetic opportunities, increased environmental awareness,
and by serving as a driver for regional economic develop-
ment.
The Master Plan does the following:
Describes the market support that affects the Gorge area and Spokane as a whole.
Builds on the Olmstead Brothers’ (1913) vision for the Gorge area by identifying goals, principles, and key projects that will enable the Gorge area’s restoration and enhancement.
Provides the guidelines by which Spokane can make the most of the opportunities identified.
Establishes a clear strategy to implement the Master Plan, including project timeframes, lead agencies, and budget estimates.
•
•
•
•
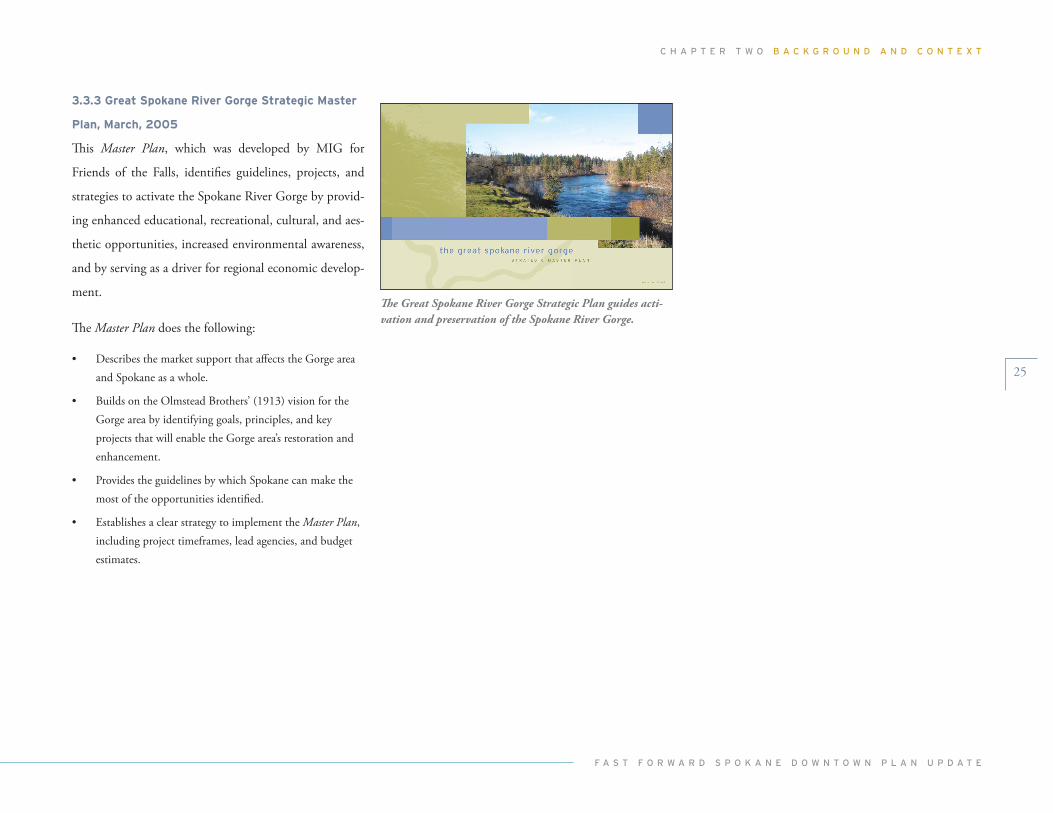
The Great Spokane River Gorge Strategic Plan guides acti-vation and preservation of the Spokane River Gorge.
C h A p T E R T w O B A C K G R O U N D A N D C O N T E X T
f A s T f O R w A R D s p O K A N E D O w N T O w N p l A N U p D A T E
26
3.3.4 Spokane Downtown Parking Demand Study,
April, 2005
The City and the Downtown Spokane Partnership com-
missioned a Parking Demand Study, which was conducted
by Melvin Mark Development Company and Nelson/
Nygaard Consulting and was completed in 2005. The
study identified key issues regarding parking, transporta-
tion, and access in Downtown and their impact on con-
tinued economic vitality. The following were the key find-
ings from the study:
Overall parking occupancy of Downtown reaches a peak of 63.8% of total capacity in the peak hour (i.e., 12:30 p.m. – 1:30 p.m.) on business days.
While on-street occupancies are high in the Core and West End Zones, both zones have low utilization of off-street facilities. This relationship underscores the need for a better system of wayfinding/signage, communication, lighting/landscaping, and pricing to draw patrons into off-street facilities.
Time-stay violations are high in the Downtown study area, particularly in the Core Zone. The situation in the Core Zone is likely the result of the high number of 1-hour meters (and 30-minute meters) in the zone, which is out of sync with a patron’s average time stay of approximately 1.5 hours. A review and reconsideration of the mix of time stay allowances in the Core Zone is recommended.
It appears that the available supply of parking in the peak hours is adequate to accommodate current and future levels of demand.
•
•
•
•
The study made the following recommendations:
Develop programs to improve signage and communica-tion.
Evaluate parking time stay allowances.
Capture additional on-street parking supply.
Undertake specific policy level actions to reduce levels of parking abuse.
Create a permanent Parking Steering Committee.
Designate a Parking Manager charged with facilitating the Parking Steering Committee process and acting as a liaison/partner with the City in managing parking in Downtown.
•
•
•
•
•
•
DDoowwnnttoowwnn SSppookkaanneePPaarrkkiinngg DDeemmaanndd
SSttuuddyyA report of:
CCiittyy ooff SSppookkaanneeDDoowwnnttoowwnn SSppookkaannee PPaarrttnneerrsshhiipp
DDoowwnnttoowwnn BBuussiinneessss IImmpprroovveemmeenntt DDiissttrriicctt
Prepared by:
MMeellvviinn MMaarrkk DDeevveellooppmmeenntt CCoommppaannyyNNeellssoonn//NNyyggaaaarrdd CCoonnssuullttiinngg
RRoobbiinnssoonn RReesseeaarrcchh
FinalApril 2005
Available at: www.downtown.spokane.net
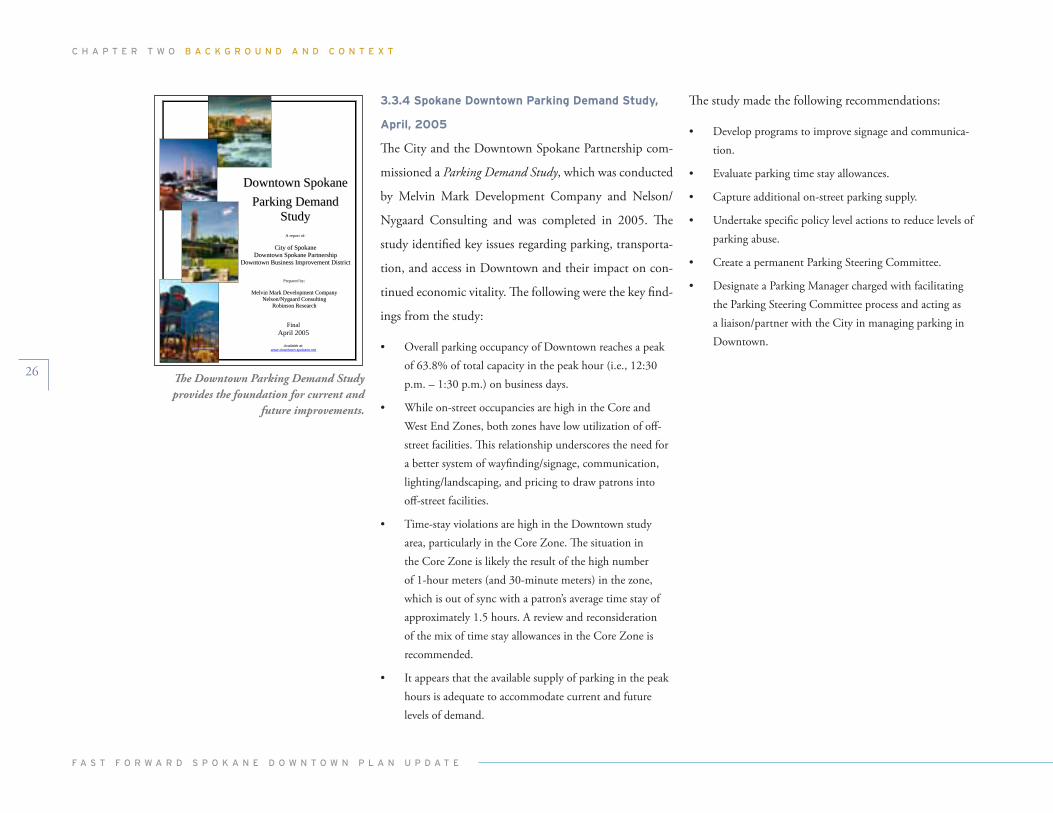
The Downtown Parking Demand Study provides the foundation for current and
future improvements.
C h A p T E R T w O B A C K G R O U N D A N D C O N T E X T
f A s T f O R w A R D s p O K A N E D O w N T O w N p l A N U p D A T E
27
3.3.5 Spokane Streetcar Feasibility Study, March
2006
In the summer of 2004, the Spokane Regional Transporta-
tion Council (SRTC) in conjunction with Spokane Tran-
sit Authority (STA) and the Downtown Spokane Partner-
ship initiated the Spokane Streetcar Feasibility Study. The
study analyzed the effectiveness of a streetcar system as
a transportation and development tool that could help
realize the vision for Downtown Spokane, and provided
the basis for a decision on whether or not a streetcar sys-
tem should be pursued as a component of the Downtown
development strategy. The study was prepared by URS
Corporation and contained the following key findings:
A Downtown streetcar system is feasible. The study recommended a system with two lines that intersect in Downtown.
The initial segment would extend from the vicinity of the County Government Center north of the Spokane River, past the Spokane Arena, through Riverfront Park to the Downtown Core, then east to the University District.
Cost estimates for the initial segment:
Construction: $52-56 million
Operation: Approximately $1.7 million/year
Streetcar system would generate an estimated $350 mil-lion worth of development and redevelopment on and adjacent to the streetcar line.
•
•
•
1.
2.
•
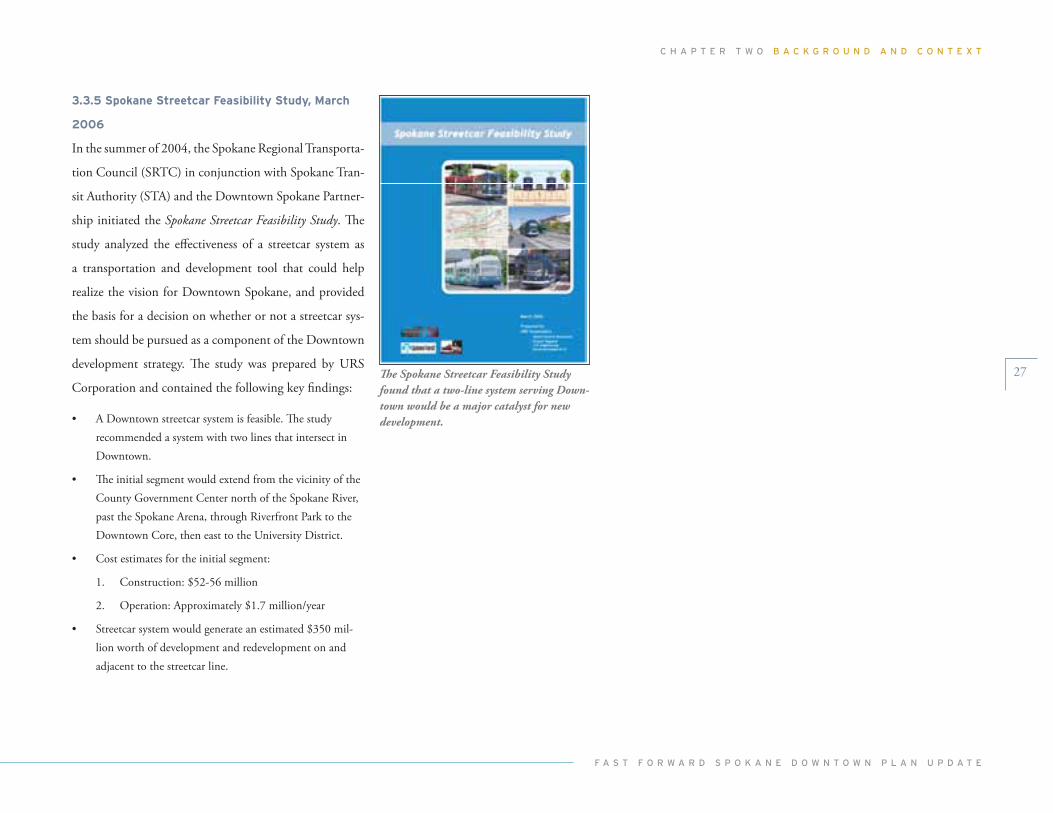
The Spokane Streetcar Feasibility Study found that a two-line system serving Down-town would be a major catalyst for new development.
C h A p T E R T w O B A C K G R O U N D A N D C O N T E X T
f A s T f O R w A R D s p O K A N E D O w N T O w N p l A N U p D A T E
28
3.3.7 Downtown Spokane Streetscape Treatment
and Element Design Standards, November 2007
In November 2007, David Evans and Associates, Inc.
completed the Downtown Spokane Streetscape Treatment
& Element Design Standards for the Downtown Spokane
Partnership (DSP) and Business Improvement District
(BID). The purpose of these guidelines is to provide a set
of design standards for a hierarchy of streetscape treat-
ments for the BID, generally bounded by Maple Street to
Browne Street and the Railroad Viaduct to North River
Drive. The result will be a cohesive collection of elements
that tie Downtown together, while providing distinctions
between sub-districts. Some elements have been imple-
mented in 2008 with the addition of 18 new planters
within the Downtown Core, funded by the BID, to be
expanded in future years with new street banners to fol-
low.
3.3.6 Spokane’s University District: Policy Options
for a New Urban Center, June 2007
Following the completion of the University District Master
Plan in 2004, the City asked the U.S. Environmental Pro-
tection Agency (EPA) to determine the market potential
for urban redevelopment in the University District and to
identify policy options that could increase development
opportunities in the district.
The EPA’s report was released in 2007 and made five rec-
ommendations to help achieve the objectives of the Uni-
versity District Strategic Master Plan:
Use investment in Riverside Avenue to support an urban Riverpoint Campus.
Develop a specific area plan for the University District.
Support private sector development on the Riverpoint Campus.
Strengthen partnerships between universities, the City and the private sector.
Act on catalytic development opportunities, such as the Jensen-Byrd Building.
•
•
•
•
•
The DSP and BID are currently install-ing street furnishings recommended in the
streetscape report.
C h A p T E R T w O B A C K G R O U N D A N D C O N T E X T
f A s T f O R w A R D s p O K A N E D O w N T O w N p l A N U p D A T E
29
The City’s SMP was originally adopted in 1976 and was
last revised in 1982. The SMP update is anticipated to be
completed in late 2008.
3.4.4 Growth and Transportation Efficiency Center
(GTEC)
Washington State’s 2006 Commute Trip Reduction Ef-
ficiency Act (ESSB 6566) resulted in the creation of the
Growth and Transportation Efficiency Center (GTEC)
program. The purpose of this program is to increase the
efficiency of the State’s transportation system in areas
with a concentration of jobs and housing. The City of
Spokane received State funding to develop a program to
improve Downtown transportation system performance.
The GTEC plan will be based on many of the strategies
identified in the 1999 Plan and University District Master
Plan. The plan will collect City-adopted goals, policies, fa-
cility and service improvements, and marketing strategies,
outlining how drive-alone trip and vehicle miles traveled
in the Downtown area will be reduced over the next six
years. The GTEC plan was approved in February 2008
and implementation occurred in late summer 2008.
3.4 CURRENT PLANNING EFFORTS
3.4.1 University District/Downtown Spokane Trans-
portation Improvement Study
DKS Associates is conducting a comprehensive trans-
portation improvement study for the City of Spokane to
evaluate existing transportation deficiencies, traffic flow,
and congestion within the Downtown Core and the Uni-
versity District, and to identify safe travel routes for bicy-
clists and pedestrians. A draft of this study was released in
May 2008 and is being undertaken in partnership with
the City and various businesses and universities.
3.4.2 Transit 2020
Transit 2020 is a plan being developed by Nelson-Nygaard
Consulting on behalf of the Spokane Transit Authority
(STA). The plan is expected to take a comprehensive look
at STA’s facilities and operations, and will recommend
physical and service improvements for the next 10 to 15
years. The transit plan is expected to be released in early
2009.
3.4.3 Shoreline Master Program Update
The City’s Shoreline Master Program (SMP) is a policy and
regulatory document governing development within 200
feet of the high water mark of the Spokane River and La-
tah Creek within the City limits. The SMP provides poli-
cy guidance and development standards such as setbacks,
height, and design requirements, among other elements.
C h A p T E R T w O B A C K G R O U N D A N D C O N T E X T
f A s T f O R w A R D s p O K A N E D O w N T O w N p l A N U p D A T E
30
3.4.5 Riverpark Square Ten Years Later Economic
Impact Study
A recent study conducted by Real Estate Economics com-
pares several key economic indicators measured in 1995
when a decision was being made on whether to move for-
ward with River Park Square.
Key findings from the study indicate significant increases
since construction began on River Park Square in Down-
town: retail jobs (72%), retail wages (73%), and retail
sales (38%). During the same time period, retail vacancy
rates decreased from 25 to 12 percent. These results ex-
ceeded forecasts made in 1995.
3.4.6 Riverpoint Campus Master Plan Update
Washington State University will be updating its Mas-
ter Plan for the Riverpoint Campus, at the heart of the
University District, beginning in autumn of 2008. The
update will include revisiting circulation and parking,
development patterns, and the mix of land uses on and
near campus, based on a long-term, strategic vision and
academic plan for growth and development as a center for
biomedical and health sciences innovation. The update
will strive to integrate campus plans with this Downtown
Plan Update. The future vision is for integration and ex-
tension of the Central Business District with the campus,
for intensive, vertical, mixed-use urban development and
large-scale research and clinical facilities. Public-private
partnerships will accelerate development opportunities
on university-owned land on the south side of Spokane
Falls Boulevard. Academic facility construction will focus
on the north side of Spokane Falls Boulevard in the near
term, with the proposed addition of another major bio-
medical/health sciences building as the next short-term
capital priority.
C h A p T E R T w O B A C K G R O U N D A N D C O N T E X T
f A s T f O R w A R D s p O K A N E D O w N T O w N p l A N U p D A T E
31
4.2 KEY ECONOMIC SECTORS
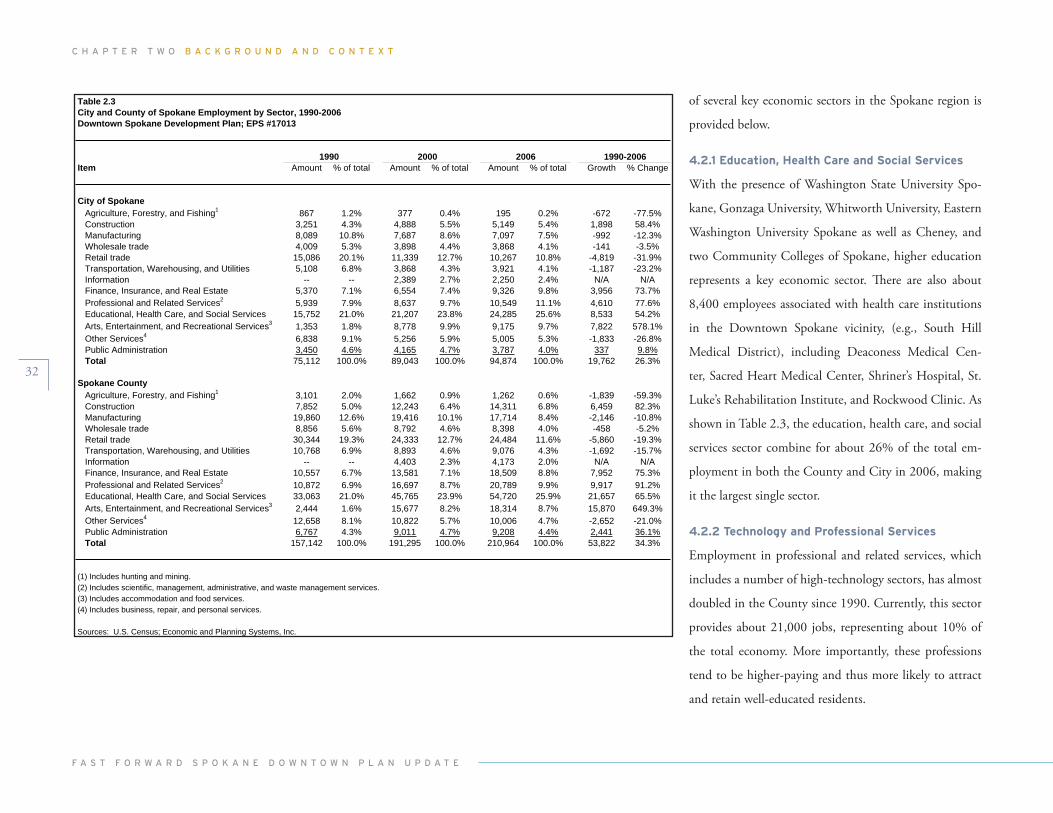
The Spokane region has experienced a gradual change in
the composition of its economy over the last 15 years.
As shown in Table 2.3, blue collar sectors such as manu-
facturing and retail trade are gradually being replaced by
white collar professions such as professional services, fi-
nance, insurance, real estate, health care, and education.
The sectors experiencing the most significant increases
between 2000 and 2006 were finance, insurance, and
real estate, which grew by about 42%, and professional
services, which grew by about 22%. A brief description
4.0 SOCIO-ECONOMIC OVERVIEW
As the second largest city in the State, Spokane is the eco-
nomic driver of Eastern Washington’s nine-county region.
Despite several cyclical downturns, the region has experi-
enced relatively healthy growth in the last 15 years driven
by the higher education, recreation and tourism, and
technology sectors, as well as a combination of a desirable
urban culture and abundant outdoor amenities. From
1999 to 2007, overall investment in Downtown Spokane
totaled approximately $3.4 billion.
4.1 POPULATION AND EMPLOYMENT GROWTH
Employment growth in the Spokane region has been par-
ticularly strong, exceeding national rates and at least keep-
ing pace with the State. As shown in Table 2.2, Spokane
County gained about 55,400 jobs since 1990, an increase
of about 36%, which is equal to the State and more than
double the national rate. Over the last six years, the rate of
County employment growth actually exceeded the State
as a whole, and this trend is projected to continue. The
County is projected to gain about 30,000 new jobs by
2015, an increase of 14% (twice the State average and
greatly exceeding the national rate).
Although population growth has not kept pace with the
State over the last two decades (while still exceeding the
nation), recent data suggest this trend is reversing, espe-
cially in the urban core. The County gained about 85,300
new residents since 1990, an increase of about 24%, com-
pared to 31% growth in the State and 20% for the nation.
Also, Spokane’s population growth has lagged behind em-
ployment growth in the State as a whole, and continues
to do so. Increasing employment relative to population
tends to indicate a positive and sustainable long-term
economic outlook. The City’s population growth rate is
expected to catch up with the State and the County (10%
from 2006 to 2015 compared to 11% at the State and
County level).
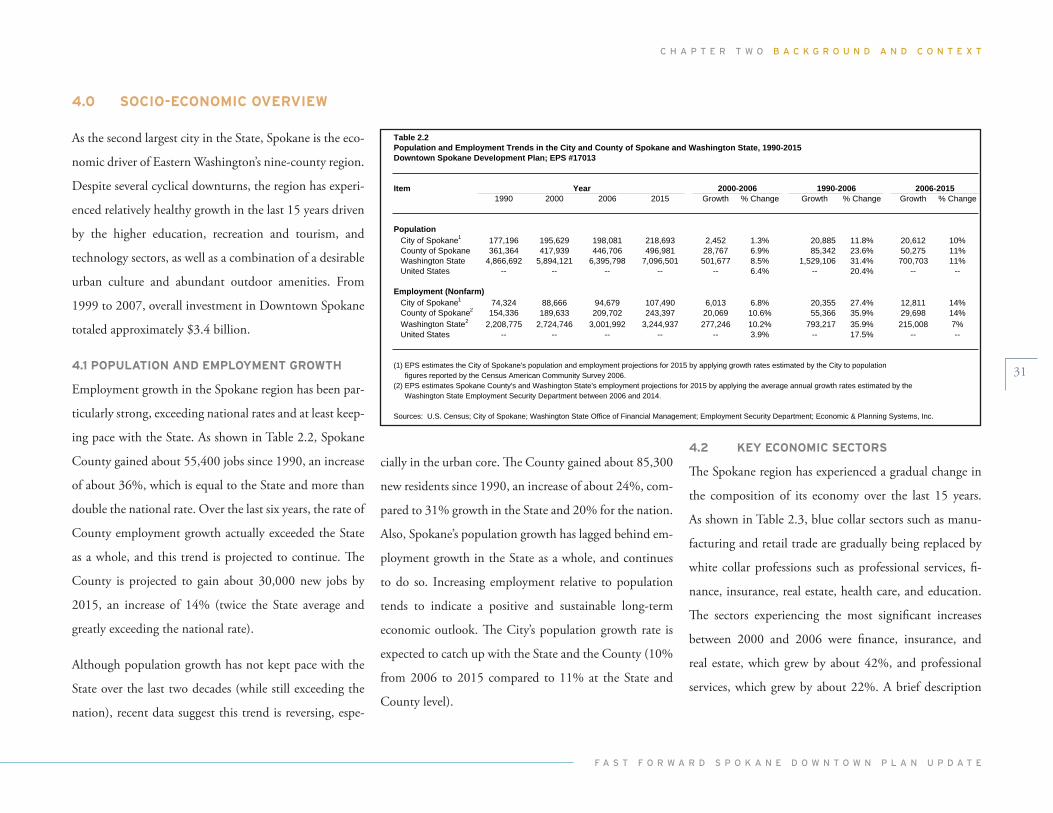
Table 2.2Population and Employment Trends in the City and County of Spokane and Washington State, 1990-2015Downtown Spokane Development Plan; EPS #17013
Item1990 2000 2006 2015 Growth % Change Growth % Change Growth % Change
PopulationCity of Spokane1 177,196 195,629 198,081 218,693 2,452 1.3% 20,885 11.8% 20,612 10%County of Spokane 361,364 417,939 446,706 496,981 28,767 6.9% 85,342 23.6% 50,275 11%Washington State 4,866,692 5,894,121 6,395,798 7,096,501 501,677 8.5% 1,529,106 31.4% 700,703 11%United States -- -- -- -- -- 6.4% -- 20.4% -- --
Employment (Nonfarm)City of Spokane1 74,324 88,666 94,679 107,490 6,013 6.8% 20,355 27.4% 12,811 14%County of Spokane2 154,336 189,633 209,702 243,397 20,069 10.6% 55,366 35.9% 29,698 14%Washington State2 2,208,775 2,724,746 3,001,992 3,244,937 277,246 10.2% 793,217 35.9% 215,008 7%United States -- -- -- -- -- 3.9% -- 17.5% -- --
(1) EPS estimates the City of Spokane's population and employment projections for 2015 by applying growth rates estimated by the City to population figures reported by the Census American Community Survey 2006.
(2) EPS estimates Spokane County's and Washington State's employment projections for 2015 by applying the average annual growth rates estimated by the Washington State Employment Security Department between 2006 and 2014.
Sources: U.S. Census; City of Spokane; Washington State Office of Financial Management; Employment Security Department; Economic & Planning Systems, Inc.
2006-2015Year 2000-2006 1990-2006
Economic & Planning Systems, Inc. 6/18/2008 \\PORTLAND-SVR\Projects\4-Urban Planning and Design\01768_Spokane_Downtown_Plan\07_Memos_Task_Reports\Planning Conditions\EPS\Tables(T1-5)UPDATES
C h A p T E R T w O B A C K G R O U N D A N D C O N T E X T
f A s T f O R w A R D s p O K A N E D O w N T O w N p l A N U p D A T E
32
of several key economic sectors in the Spokane region is
provided below.
4.2.1 Education, Health Care and Social Services
With the presence of Washington State University Spo-
kane, Gonzaga University, Whitworth University, Eastern
Washington University Spokane as well as Cheney, and
two Community Colleges of Spokane, higher education
represents a key economic sector. There are also about
8,400 employees associated with health care institutions
in the Downtown Spokane vicinity, (e.g., South Hill
Medical District), including Deaconess Medical Cen-
ter, Sacred Heart Medical Center, Shriner’s Hospital, St.
Luke’s Rehabilitation Institute, and Rockwood Clinic. As
shown in Table 2.3, the education, health care, and social
services sector combine for about 26% of the total em-
ployment in both the County and City in 2006, making
it the largest single sector.
4.2.2 Technology and Professional Services
Employment in professional and related services, which
includes a number of high-technology sectors, has almost
doubled in the County since 1990. Currently, this sector
provides about 21,000 jobs, representing about 10% of
the total economy. More importantly, these professions
tend to be higher-paying and thus more likely to attract
and retain well-educated residents.
Table 2.3City and County of Spokane Employment by Sector, 1990-2006Downtown Spokane Development Plan; EPS #17013
Item Amount % of total Amount % of total Amount % of total Growth % Change
City of SpokaneAgriculture, Forestry, and Fishing1 867 1.2% 377 0.4% 195 0.2% -672 -77.5%Construction 3,251 4.3% 4,888 5.5% 5,149 5.4% 1,898 58.4%Manufacturing 8,089 10.8% 7,687 8.6% 7,097 7.5% -992 -12.3%Wholesale trade 4,009 5.3% 3,898 4.4% 3,868 4.1% -141 -3.5%Retail trade 15,086 20.1% 11,339 12.7% 10,267 10.8% -4,819 -31.9%Transportation, Warehousing, and Utilities 5,108 6.8% 3,868 4.3% 3,921 4.1% -1,187 -23.2%Information -- -- 2,389 2.7% 2,250 2.4% N/A N/AFinance, Insurance, and Real Estate 5,370 7.1% 6,554 7.4% 9,326 9.8% 3,956 73.7%Professional and Related Services2 5,939 7.9% 8,637 9.7% 10,549 11.1% 4,610 77.6%Educational, Health Care, and Social Services 15,752 21.0% 21,207 23.8% 24,285 25.6% 8,533 54.2%Arts, Entertainment, and Recreational Services3 1,353 1.8% 8,778 9.9% 9,175 9.7% 7,822 578.1%Other Services4 6,838 9.1% 5,256 5.9% 5,005 5.3% -1,833 -26.8%Public Administration 3,450 4.6% 4,165 4.7% 3,787 4.0% 337 9.8%Total 75,112 100.0% 89,043 100.0% 94,874 100.0% 19,762 26.3%
Spokane CountyAgriculture, Forestry, and Fishing1 3,101 2.0% 1,662 0.9% 1,262 0.6% -1,839 -59.3%Construction 7,852 5.0% 12,243 6.4% 14,311 6.8% 6,459 82.3%Manufacturing 19,860 12.6% 19,416 10.1% 17,714 8.4% -2,146 -10.8%Wholesale trade 8,856 5.6% 8,792 4.6% 8,398 4.0% -458 -5.2%Retail trade 30,344 19.3% 24,333 12.7% 24,484 11.6% -5,860 -19.3%Transportation, Warehousing, and Utilities 10,768 6.9% 8,893 4.6% 9,076 4.3% -1,692 -15.7%Information -- -- 4,403 2.3% 4,173 2.0% N/A N/AFinance, Insurance, and Real Estate 10,557 6.7% 13,581 7.1% 18,509 8.8% 7,952 75.3%Professional and Related Services2 10,872 6.9% 16,697 8.7% 20,789 9.9% 9,917 91.2%Educational, Health Care, and Social Services 33,063 21.0% 45,765 23.9% 54,720 25.9% 21,657 65.5%Arts, Entertainment, and Recreational Services3 2,444 1.6% 15,677 8.2% 18,314 8.7% 15,870 649.3%Other Services4 12,658 8.1% 10,822 5.7% 10,006 4.7% -2,652 -21.0%Public Administration 6,767 4.3% 9,011 4.7% 9,208 4.4% 2,441 36.1%Total 157,142 100.0% 191,295 100.0% 210,964 100.0% 53,822 34.3%
(1) Includes hunting and mining.(2) Includes scientific, management, administrative, and waste management services.(3) Includes accommodation and food services.(4) Includes business, repair, and personal services.
Sources: U.S. Census; Economic and Planning Systems, Inc.
1990 2000 2006 1990-2006
Economic & Planning Systems, Inc. 6/18/2008 \\PORTLAND-SVR\Projects\4-Urban Planning and Design\01768_Spokane_Downtown_Plan\07_Memos_Task_Reports\Planning Conditions\EPS\Tables(T1-5)UPDATES
C h A p T E R T w O B A C K G R O U N D A N D C O N T E X T
f A s T f O R w A R D s p O K A N E D O w N T O w N p l A N U p D A T E
33
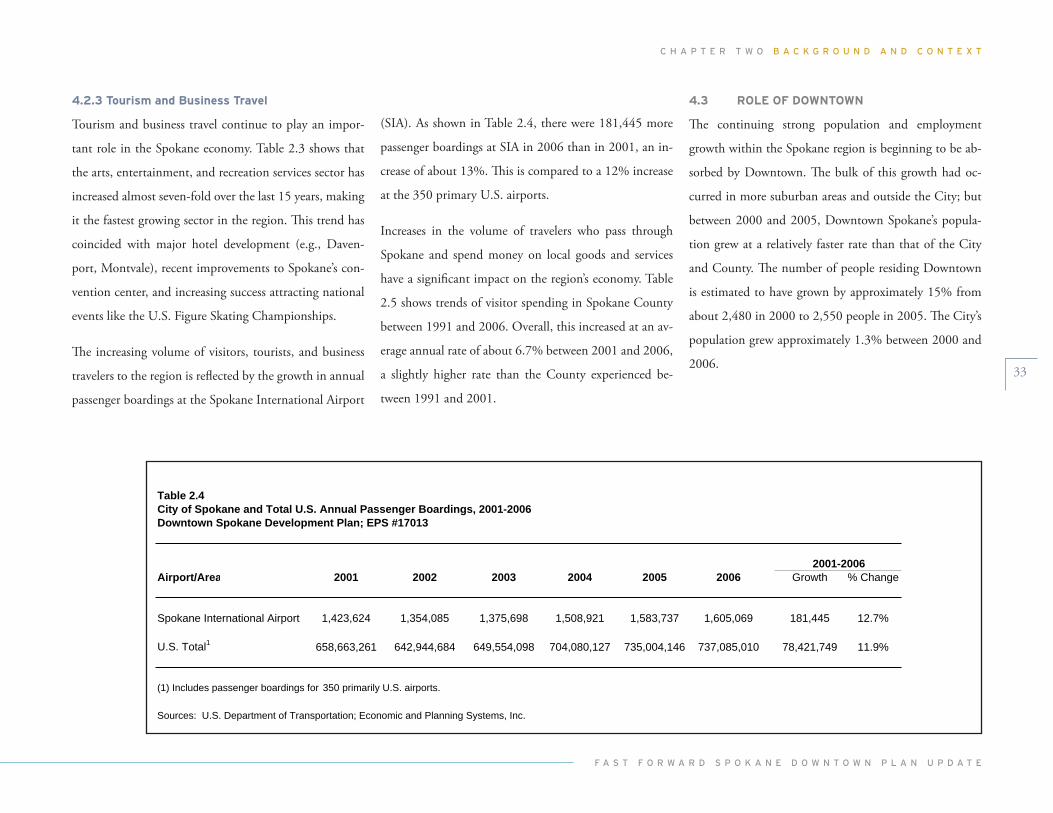
(SIA). As shown in Table 2.4, there were 181,445 more
passenger boardings at SIA in 2006 than in 2001, an in-
crease of about 13%. This is compared to a 12% increase
at the 350 primary U.S. airports.
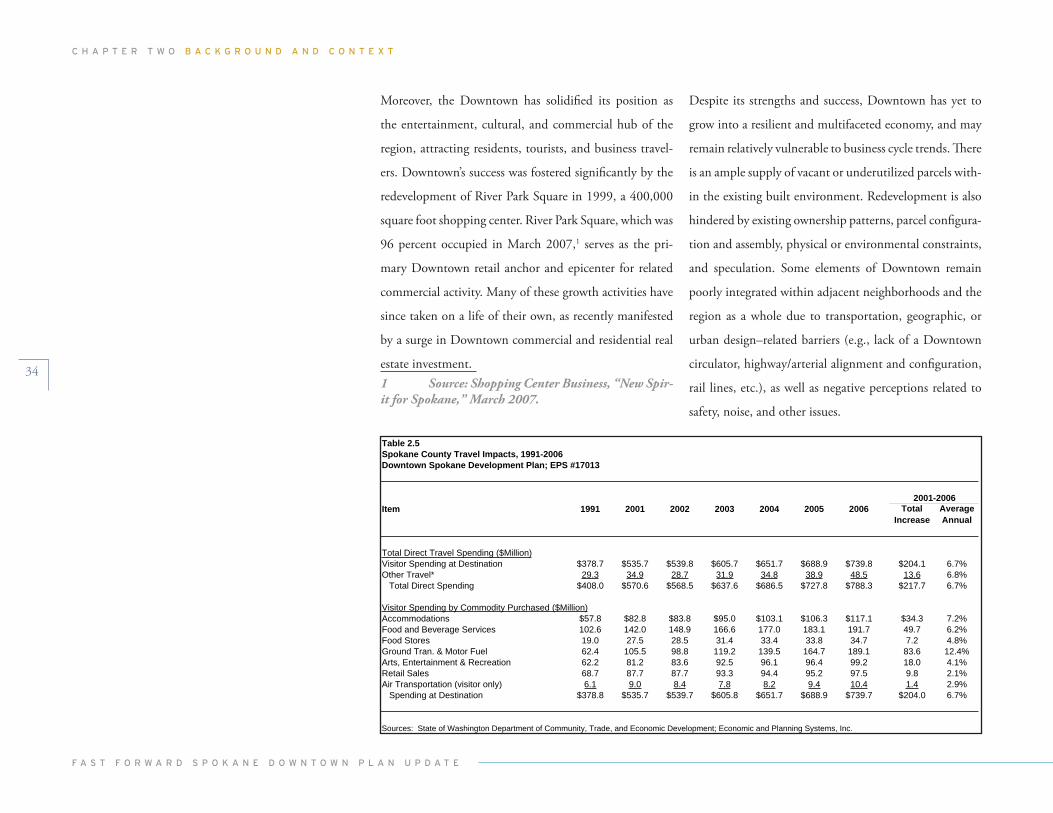
Increases in the volume of travelers who pass through
Spokane and spend money on local goods and services
have a significant impact on the region’s economy. Table
2.5 shows trends of visitor spending in Spokane County
between 1991 and 2006. Overall, this increased at an av-
erage annual rate of about 6.7% between 2001 and 2006,
a slightly higher rate than the County experienced be-
tween 1991 and 2001.
4.2.3 Tourism and Business Travel
Tourism and business travel continue to play an impor-
tant role in the Spokane economy. Table 2.3 shows that
the arts, entertainment, and recreation services sector has
increased almost seven-fold over the last 15 years, making
it the fastest growing sector in the region. This trend has
coincided with major hotel development (e.g., Daven-
port, Montvale), recent improvements to Spokane’s con-
vention center, and increasing success attracting national
events like the U.S. Figure Skating Championships.
The increasing volume of visitors, tourists, and business
travelers to the region is reflected by the growth in annual
passenger boardings at the Spokane International Airport
Table 2.4City of Spokane and Total U.S. Annual Passenger Boardings, 2001-2006Downtown Spokane Development Plan; EPS #17013
Airport/Area 2001 2002 2003 2004 2005 2006 Growth % Change
Spokane International Airport 1,423,624 1,354,085 1,375,698 1,508,921 1,583,737 1,605,069 181,445 12.7%
U.S. Total1 658,663,261 642,944,684 649,554,098 704,080,127 735,004,146 737,085,010 78,421,749 11.9%
(1) Includes passenger boardings for 350 primarily U.S. airports.
Sources: U.S. Department of Transportation; Economic and Planning Systems, Inc.
2001-2006
Economic & Planning Systems, Inc. 6/18/2008 \\PORTLAND-SVR\Projects\4-Urban Planning and Design\01768_Spokane_Downtown_Plan\07_Memos_Task_Reports\Planning Conditions\EPS\Tables(T1-5)UPDATES
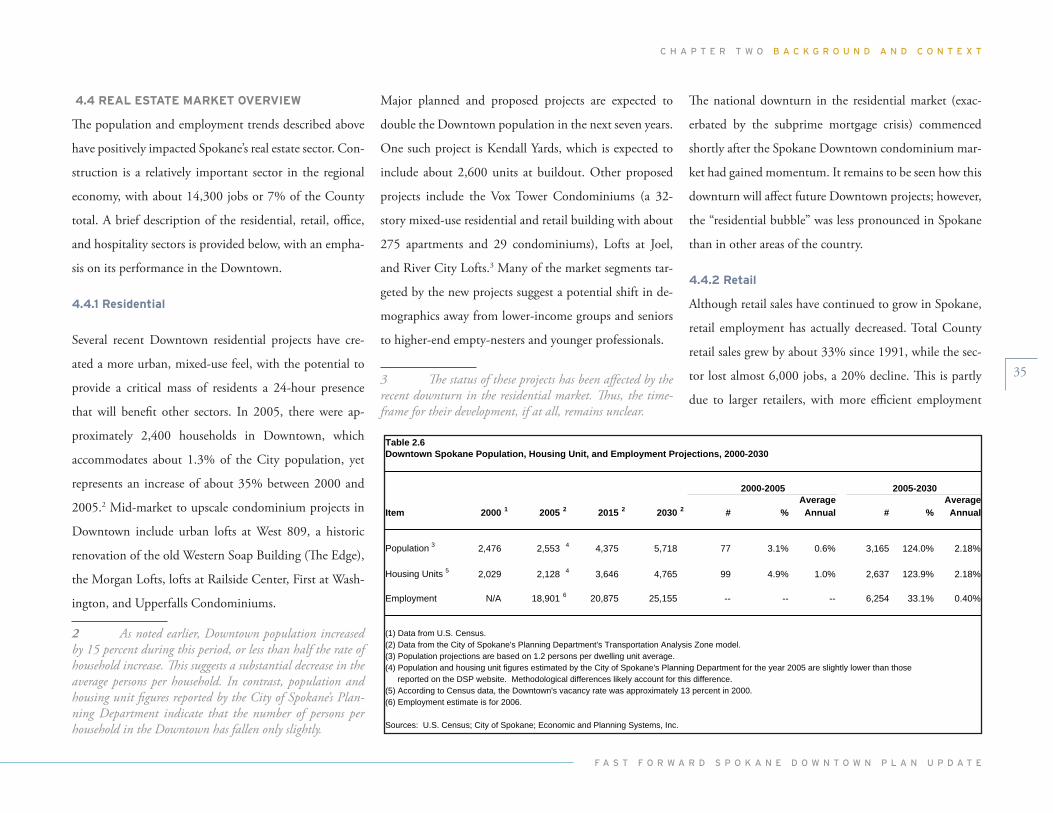
4.3 ROLE OF DOWNTOWN
The continuing strong population and employment
growth within the Spokane region is beginning to be ab-
sorbed by Downtown. The bulk of this growth had oc-
curred in more suburban areas and outside the City; but
between 2000 and 2005, Downtown Spokane’s popula-
tion grew at a relatively faster rate than that of the City
and County. The number of people residing Downtown
is estimated to have grown by approximately 15% from
about 2,480 in 2000 to 2,550 people in 2005. The City’s
population grew approximately 1.3% between 2000 and
2006.
C h A p T E R T w O B A C K G R O U N D A N D C O N T E X T
f A s T f O R w A R D s p O K A N E D O w N T O w N p l A N U p D A T E
34
Moreover, the Downtown has solidified its position as
the entertainment, cultural, and commercial hub of the
region, attracting residents, tourists, and business travel-
ers. Downtown’s success was fostered significantly by the
redevelopment of River Park Square in 1999, a 400,000
square foot shopping center. River Park Square, which was
96 percent occupied in March 2007,1 serves as the pri-
mary Downtown retail anchor and epicenter for related
commercial activity. Many of these growth activities have
since taken on a life of their own, as recently manifested
by a surge in Downtown commercial and residential real
estate investment. 1 Source: Shopping Center Business, “New Spir-it for Spokane,” March 2007.
Despite its strengths and success, Downtown has yet to
grow into a resilient and multifaceted economy, and may
remain relatively vulnerable to business cycle trends. There
is an ample supply of vacant or underutilized parcels with-
in the existing built environment. Redevelopment is also
hindered by existing ownership patterns, parcel configura-
tion and assembly, physical or environmental constraints,
and speculation. Some elements of Downtown remain
poorly integrated within adjacent neighborhoods and the
region as a whole due to transportation, geographic, or
urban design–related barriers (e.g., lack of a Downtown
circulator, highway/arterial alignment and configuration,
rail lines, etc.), as well as negative perceptions related to
safety, noise, and other issues.
Table 2.5Spokane County Travel Impacts, 1991-2006Downtown Spokane Development Plan; EPS #17013
Item 1991 2001 2002 2003 2004 2005 2006
Total Direct Travel Spending ($Million)Visitor Spending at Destination $378.7 $535.7 $539.8 $605.7 $651.7 $688.9 $739.8 $204.1 6.7%Other Travel* 29.3 34.9 28.7 31.9 34.8 38.9 48.5 13.6 6.8%
Total Direct Spending $408.0 $570.6 $568.5 $637.6 $686.5 $727.8 $788.3 $217.7 6.7%
Visitor Spending by Commodity Purchased ($Million)Accommodations $57.8 $82.8 $83.8 $95.0 $103.1 $106.3 $117.1 $34.3 7.2%Food and Beverage Services 102.6 142.0 148.9 166.6 177.0 183.1 191.7 49.7 6.2%Food Stores 19.0 27.5 28.5 31.4 33.4 33.8 34.7 7.2 4.8%Ground Tran. & Motor Fuel 62.4 105.5 98.8 119.2 139.5 164.7 189.1 83.6 12.4%Arts, Entertainment & Recreation 62.2 81.2 83.6 92.5 96.1 96.4 99.2 18.0 4.1%Retail Sales 68.7 87.7 87.7 93.3 94.4 95.2 97.5 9.8 2.1%Air Transportation (visitor only) 6.1 9.0 8.4 7.8 8.2 9.4 10.4 1.4 2.9%
Spending at Destination $378.8 $535.7 $539.7 $605.8 $651.7 $688.9 $739.7 $204.0 6.7%
Sources: State of Washington Department of Community, Trade, and Economic Development; Economic and Planning Systems, Inc.
2001-2006Total
IncreaseAverageAnnual
Economic & Planning Systems, Inc. 6/18/2008 \\PORTLAND-SVR\Projects\4-Urban Planning and Design\01768_Spokane_Downtown_Plan\07_Memos_Task_Reports\Planning Conditions\EPS\Tables(T1-5)UPDATES
C h A p T E R T w O B A C K G R O U N D A N D C O N T E X T
f A s T f O R w A R D s p O K A N E D O w N T O w N p l A N U p D A T E
35
Table 2.6Downtown Spokane Population, Housing Unit, and Employment Projections, 2000-2030
Average AverageItem 2000 1 2005 2 2015 2 2030 2 # % Annual # % Annual
Population 3 2,476 2,553 4 4,375 5,718 77 3.1% 0.6% 3,165 124.0% 2.18%
Housing Units 5 2,029 2,128 4 3,646 4,765 99 4.9% 1.0% 2,637 123.9% 2.18%
Employment N/A 18,901 6 20,875 25,155 -- -- -- 6,254 33.1% 0.40%
(1) Data from U.S. Census.(2) Data from the City of Spokane's Planning Department's Transportation Analysis Zone model.(3) Population projections are based on 1.2 persons per dwelling unit average.(4) Population and housing unit figures estimated by the City of Spokane's Planning Department for the year 2005 are slightly lower than those
reported on the DSP website. Methodological differences likely account for this difference.(5) According to Census data, the Downtown's vacancy rate was approximately 13 percent in 2000.(6) Employment estimate is for 2006.
Sources: U.S. Census; City of Spokane; Economic and Planning Systems, Inc.
2000-2005 2005-2030
Economic & Planning Systems, Inc. 6/18/2008 \\PORTLAND-SVR\Projects\4-Urban Planning and Design\01768_Spokane_Downtown_Plan\07_Memos_Task_Reports\Planning Conditions\EPS\Tables5and6UPDATE
4.4 REAL ESTATE MARKET OVERVIEW
The population and employment trends described above
have positively impacted Spokane’s real estate sector. Con-
struction is a relatively important sector in the regional
economy, with about 14,300 jobs or 7% of the County
total. A brief description of the residential, retail, office,
and hospitality sectors is provided below, with an empha-
sis on its performance in the Downtown.
4.4.1 Residential
Several recent Downtown residential projects have cre-
ated a more urban, mixed-use feel, with the potential to
provide a critical mass of residents a 24-hour presence
that will benefit other sectors. In 2005, there were ap-
proximately 2,400 households in Downtown, which
accommodates about 1.3% of the City population, yet
represents an increase of about 35% between 2000 and
2005.2 Mid-market to upscale condominium projects in
Downtown include urban lofts at West 809, a historic
renovation of the old Western Soap Building (The Edge),
the Morgan Lofts, lofts at Railside Center, First at Wash-
ington, and Upperfalls Condominiums.
2 As noted earlier, Downtown population increased by 15 percent during this period, or less than half the rate of household increase. This suggests a substantial decrease in the average persons per household. In contrast, population and housing unit figures reported by the City of Spokane’s Plan-ning Department indicate that the number of persons per household in the Downtown has fallen only slightly.
The national downturn in the residential market (exac-
erbated by the subprime mortgage crisis) commenced
shortly after the Spokane Downtown condominium mar-
ket had gained momentum. It remains to be seen how this
downturn will affect future Downtown projects; however,
the “residential bubble” was less pronounced in Spokane
than in other areas of the country.
4.4.2 Retail
Although retail sales have continued to grow in Spokane,
retail employment has actually decreased. Total County
retail sales grew by about 33% since 1991, while the sec-
tor lost almost 6,000 jobs, a 20% decline. This is partly
due to larger retailers, with more efficient employment
Major planned and proposed projects are expected to
double the Downtown population in the next seven years.
One such project is Kendall Yards, which is expected to
include about 2,600 units at buildout. Other proposed
projects include the Vox Tower Condominiums (a 32-
story mixed-use residential and retail building with about
275 apartments and 29 condominiums), Lofts at Joel,
and River City Lofts.3 Many of the market segments tar-
geted by the new projects suggest a potential shift in de-
mographics away from lower-income groups and seniors
to higher-end empty-nesters and younger professionals.
� The status of these projects has been affected by the recent downturn in the residential market. Thus, the time-frame for their development, if at all, remains unclear.
C h A p T E R T w O B A C K G R O U N D A N D C O N T E X T
f A s T f O R w A R D s p O K A N E D O w N T O w N p l A N U p D A T E
36
ratios, replacing smaller establishments and family-owned
businesses. These businesses play an important role in
maintaining a unique urban environment in Downtown,
and this industry re-structuring has leveled off since peak-
ing in the 1990’s.
The most significant planned Downtown project with a
retail component is Kendall Yards, which is an 80-acre
mixed-use project that is expected to include approxi-
mately one million square feet of commercial, retail, and
office space. The University District also has potential to
add significant retail space. 4
� According to a recent EPA market study, the Uni-versity District can accommodate about 150,000 square feet of new retail space (see, ICF International, Spokane’s Uni-versity District: Policy Options for a New Urban Center, June 25, 2007).
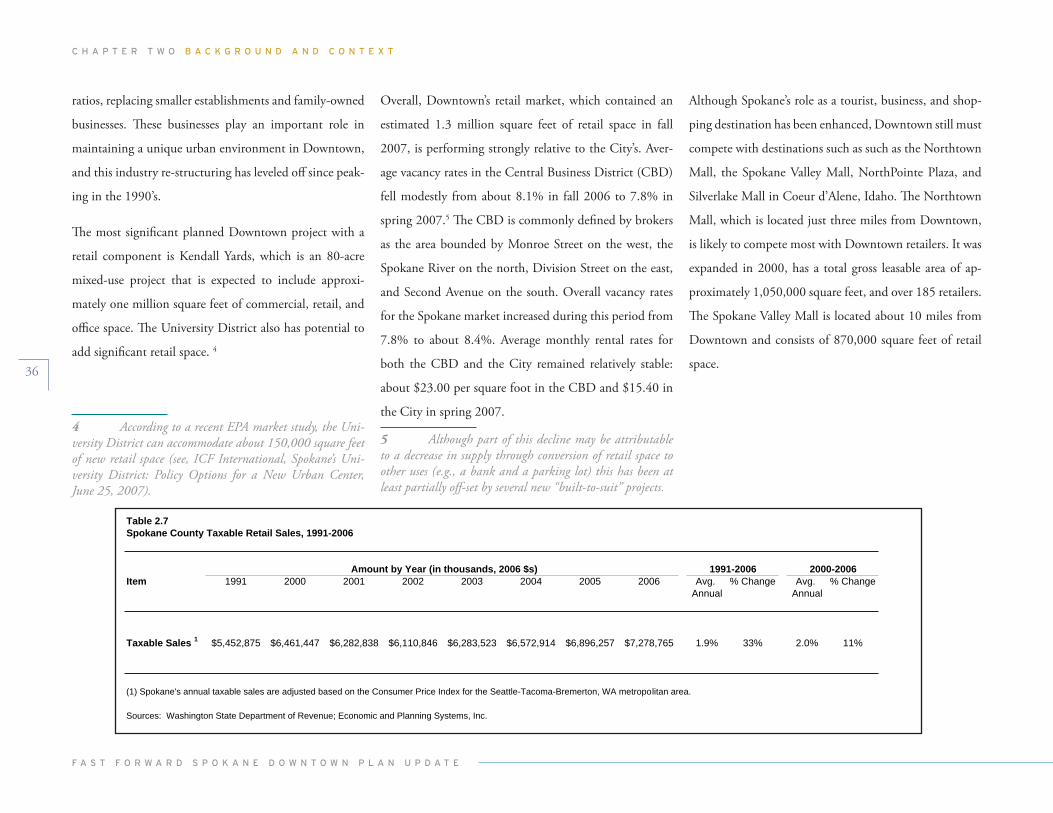
Table 2.7Spokane County Taxable Retail Sales, 1991-2006
Item 1991 2000 2001 2002 2003 2004 2005 2006 Avg. % Change Avg. % ChangeAnnual Annual
Taxable Sales 1 $5,452,875 $6,461,447 $6,282,838 $6,110,846 $6,283,523 $6,572,914 $6,896,257 $7,278,765 1.9% 33% 2.0% 11%
(1) Spokane's annual taxable sales are adjusted based on the Consumer Price Index for the Seattle-Tacoma-Bremerton, WA metropolitan area.
Sources: Washington State Department of Revenue; Economic and Planning Systems, Inc.
2000-20061991-2006Amount by Year (in thousands, 2006 $s)
M_70\nalP_nwotnwoD_enakopS_86710\ngiseDdnagninnalPnabrU-4\stcejorP\RVS-DNALTROP\\8002/81/6.cnI,smetsySgninnalP&cimonocE emos_Task_Reports\Planning Conditions\EPS\Tables(T1-5)UPDATES
Overall, Downtown’s retail market, which contained an
estimated 1.3 million square feet of retail space in fall
2007, is performing strongly relative to the City’s. Aver-
age vacancy rates in the Central Business District (CBD)
fell modestly from about 8.1% in fall 2006 to 7.8% in
spring 2007.5 The CBD is commonly defined by brokers
as the area bounded by Monroe Street on the west, the
Spokane River on the north, Division Street on the east,
and Second Avenue on the south. Overall vacancy rates
for the Spokane market increased during this period from
7.8% to about 8.4%. Average monthly rental rates for
both the CBD and the City remained relatively stable:
about $23.00 per square foot in the CBD and $15.40 in
the City in spring 2007.
� Although part of this decline may be attributable to a decrease in supply through conversion of retail space to other uses (e.g., a bank and a parking lot) this has been at least partially off-set by several new “built-to-suit” projects.
Although Spokane’s role as a tourist, business, and shop-
ping destination has been enhanced, Downtown still must
compete with destinations such as such as the Northtown
Mall, the Spokane Valley Mall, NorthPointe Plaza, and
Silverlake Mall in Coeur d’Alene, Idaho. The Northtown
Mall, which is located just three miles from Downtown,
is likely to compete most with Downtown retailers. It was
expanded in 2000, has a total gross leasable area of ap-
proximately 1,050,000 square feet, and over 185 retailers.
The Spokane Valley Mall is located about 10 miles from
Downtown and consists of 870,000 square feet of retail
space.
C h A p T E R T w O B A C K G R O U N D A N D C O N T E X T
f A s T f O R w A R D s p O K A N E D O w N T O w N p l A N U p D A T E
37
4.4.4 Hospitality
The increasing number of visitors to Spokane has consid-
erably impacted the City’s hospitality sector (as reflected
in increasing hotel occupancy rates). According to Smith
Travel Research, 2007 average occupancy rates for Spo-
kane County were approximately 62%, up from about
59% in 2005 and 61% in 2006. Even with moderate in-
creases in the net number of rooms in the County, Spo-
kane has maintained occupancy levels around 60%. In-
creased demand has allowed hotels to increase room rates
by approximately 9.3% and annual revenues by 17.8%
from 2006.
Several hotel developments in the Downtown have
helped to accommodate this increased demand. The most
notable of these include the Davenport Hotel and Tower,
a 611-room luxury hotel, which includes a historic, fully-
restored 1914 hotel and a new tower (opened in 2007),
and the Montvale Hotel, a 36-room historic boutique ho-
tel that was reopened in January 2005.
The higher education and health care sectors are two ex-
amples of synergistic economic drivers for Downtown
and surrounding areas. Both sectors have the potential
to create higher-paying jobs and offset declines in other
sectors. Relationships between these sectors are helping
to foster an emerging bio-medical cluster supported by
incubators such as Sirti. A facet of the Riverpoint Campus
strategic vision for development as a center for biomedi-
cal and health sciences innovation is to accommodate this
demand. An estimated 800,000 square feet of medical of-
fice space have been added to the market in last 10 years.
Recently, the areas surrounding Spokane’s major medical
centers have experienced a slight reversal of the increas-
ing vacancy rates experienced since 2003, when rates were
at a low of 3.4%. In spring 2007, vacancy rates for the
medical office market in the greater Spokane area were
about 6.6%, down from 8.5% in fall 2006. Medical office
market lease rates increased by 10.9% between 2002 and
2006 and grew faster than the rate of inflation.
4.4.3 Office
As the composition of Spokane’s economy shifts and em-
ployment in knowledge-based sectors grows, the City is
experiencing an increase in demand for office space. In
2007, the Spokane County office market consisted of
approximately 8.2 million square feet of leasable space,
an increase of about 2.8 million since 1998. Spokane’s
CBD contains 2.7 million square feet (about 34%) of the
region’s office space, an increase of about 500,000 square
feet, or 18%, since 1998.
This substantial increase in office supply does not appear
to have negatively affected occupancy rates, as vacancy
rates in Spokane have remained between 12% and 15%
since 2002. Although Downtown experienced more vola-
tile vacancy rates during this time, this can be attributed
to a relatively larger influx of supply in response to tight
market conditions as well as the unexpected vacancy of
a large tenant.6 Lease rates for Class A and Class B office
space in the Downtown have remained relatively stable
since 2002; average monthly rental rates for Class A have
remained between $19.00 and $20.00 per square foot,
and Class B have hovered between $14.50 and $15.50.
� There was a temporary spike in 2004 due to the relinquishment of 120,000 square feet of office space in the CBD following the bankruptcy of Metropolitan Mortgage.
C h A p T E R T w O B A C K G R O U N D A N D C O N T E X T
f A s T f O R w A R D s p O K A N E D O w N T O w N p l A N U p D A T E
38
5.0 LAND USE
5.1 EXISTING ZONING
The Downtown Planning Area comprises a mixture of six
Central Business District (CBD) zones. The CBD zones
were designed to implement the 1999 Plan, with a land-
use pattern of medium- and high-intensity structures
with a mix of residential, commercial, office, light indus-
trial, and recreational uses. This mix of uses is intended to
foster a lively, pedestrian-friendly, and safe urban environ-
ment unique to Downtown.
CBd-1 Category: CBD-1 is applied to the Downtown
Core, the mixed-use, high-intensity, pedestrian-oriented
center of the City. Generally, all uses are allowed, except
auto-oriented and industrial.
CBd-2 Category: CBD-2 is applied to the West End,
the area immediately west of the Downtown Core. This is
a medium-to-high-density mixed-use area in which resi-
dential, community-serving retail, and office uses are en-
couraged, especially as part of a mixed-use development.
Generally, all uses are allowed, except auto-oriented and
industrial.
CBd-3 Category: CBD-3 is applied to the East End
– the area immediately east of the Downtown Core – and
the Riverpoint Campus. This is a high-density, mixed-use
area in which community-serving retail uses, residential,
and office uses are encouraged, especially as part of a
mixed-use development. Generally, all uses are allowed,
except auto-oriented and industrial.
CBd-4 Category: CBD-4 is applied to the South End,
the area immediately south of the Downtown Core, West
End, and East End. This is a mixed-use area in which
multi-family and live-work studios are encouraged; ware-
housing and light industrial uses are allowed; and artist-
related uses are encouraged. Generally, all uses are allowed,
except auto-oriented and heavy industrial.
CBd-5 Category: CBD-5 is applied to the Freeway Area,
the area immediately south of the South End. This is an
auto-oriented commercial area. Residential uses are not
allowed; commercial uses are generally allowed; heavy
industrial uses are not allowed and auto body repair is
prohibited except as accessory to new car sales.
CBd-6 Category: CBD-6 is applied to the North Bank,
the area immediately north of the Spokane River. This is a
mixed-use residential, commercial, hotel, recreation, and
entertainment area. Generally, all uses are allowed, except
auto-oriented and industrial.
North River overlay Zone: This overlay addresses the
public’s value of the views and access to the Spokane River
Gorge, Riverfront Park, and Downtown from the north
side of the Spokane River. It includes visual and pedes-
trian access standards and guidelines to ensure that build-
ings and other constructed objects do not obstruct views
of or access to these destinations.
general Commercial: General Commercial is applied
to the greater area of the South University District. The
boundaries are defined by Interstate 90 to the south, Di-
vision Street to the West, Scott Street to the East, and the
railroad to the north. A full range of retail and service
businesses with a local or regional market as well as in-
dustrial uses are allowed. Industrial uses are limited in size
to avoid adverse effects different in kind or amount than
commercial uses and to ensure that they do not dominate
the character of the commercial area.
C h A p T E R T w O B A C K G R O U N D A N D C O N T E X T
f A s T f O R w A R D s p O K A N E D O w N T O w N p l A N U p D A T E
39
The area south of the railroad tracks is characterized by
lower-density, auto-serving commercial uses, such as auto
dealerships and gas stations. Small professional offices and
service providers, along with independent retailers, have
begun a transition in this area. This part of the Planning
Area includes several underutilized and vacant parcels.
The northern and southern parts of the Planning Area are
joined by the Spokane River and the 100-acre Riverfront
Park. Riverfront Park features recreational and entertain-
ment uses, including open spaces, an IMAX theater, and
a historic 1909 Looff Carrousel.
The north side of the Planning Area consists of scattered
light industrial uses, the Spokane Arena, and numerous
surface parking lots. There is also a cluster of commercial
uses along Monroe Street.
5.2 CURRENT LAND USES
The land use pattern in the Planning Area is a mix of
commercial, office, residential, industrial, and recreation-
al uses. The Downtown Core contains the Planning Area’s
highest intensity of uses, with office and retail uses, in-
cluding River Park Square and Macy’s. Downtown also
has some residential uses in the form of high-rise condo-
miniums and apartment buildings, and has recently seen
the conversion of some retail uses to upscale residential
units. Art and entertainment venues and historic industri-
al buildings are located throughout Downtown as well.
The Downtown Core is flanked by historic mixed-use of-
fice and residential neighborhoods to the west, and sur-
face parking lots, and less intense office and commercial
uses to the east. The Convention Center is located directly
northeast of the Downtown Core.
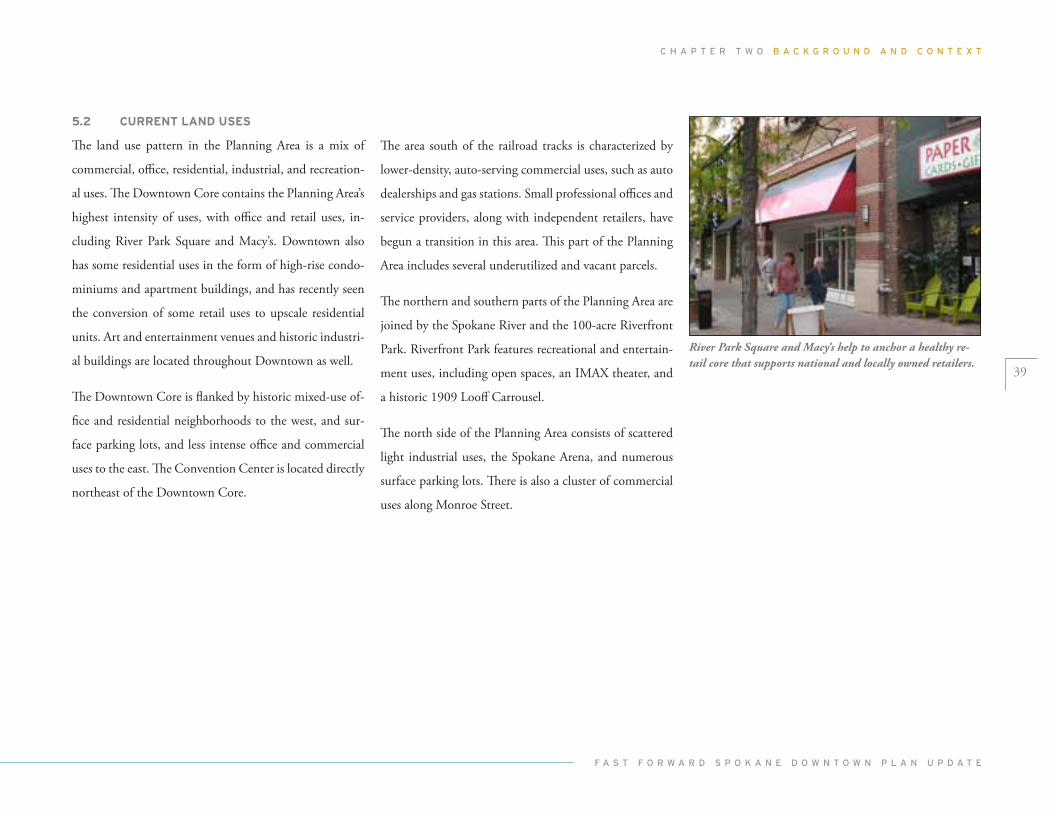
River Park Square and Macy’s help to anchor a healthy re-tail core that supports national and locally owned retailers.
C h A p T E R T w O B A C K G R O U N D A N D C O N T E X T
f A s T f O R w A R D s p O K A N E D O w N T O w N p l A N U p D A T E
40
6.0 TRANSPORTATION & CIRCULATION
6.1 WALKABILITY
Downtown Spokane lacks a cohesive pedestrian environ-
ment and strong connections between Downtown dis-
tricts and adjacent neighborhoods. Although Downtown
benefits from pedestrian-friendly areas of activity, connec-
tivity to the vibrant neighborhoods and strong districts
surrounding the Downtown Core remains challenging.
Roadway and railroad barriers contribute to this situa-
tion; inconsistent quality in the pedestrian environment
along key streets makes the trip seem longer and more
difficult than it actually is.
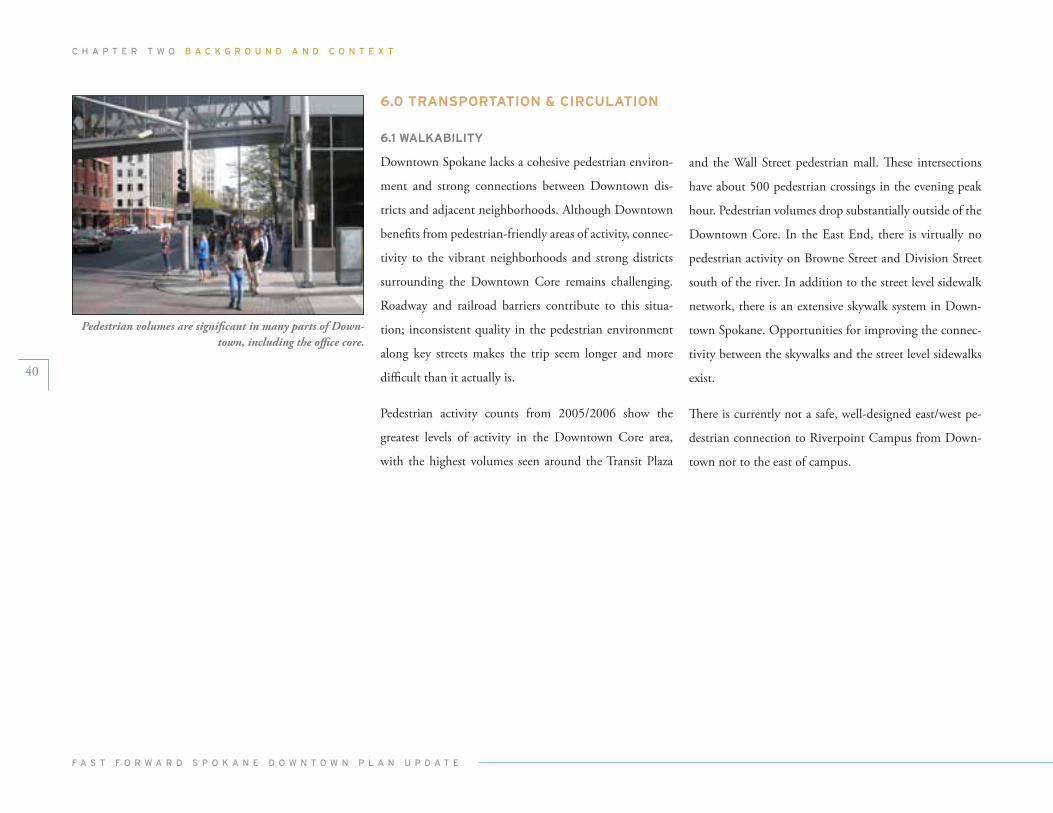
Pedestrian activity counts from 2005/2006 show the
greatest levels of activity in the Downtown Core area,
with the highest volumes seen around the Transit Plaza
and the Wall Street pedestrian mall. These intersections
have about 500 pedestrian crossings in the evening peak
hour. Pedestrian volumes drop substantially outside of the
Downtown Core. In the East End, there is virtually no
pedestrian activity on Browne Street and Division Street
south of the river. In addition to the street level sidewalk
network, there is an extensive skywalk system in Down-
town Spokane. Opportunities for improving the connec-
tivity between the skywalks and the street level sidewalks
exist.
There is currently not a safe, well-designed east/west pe-
destrian connection to Riverpoint Campus from Down-
town nor to the east of campus.
Pedestrian volumes are significant in many parts of Down-town, including the office core.
C h A p T E R T w O B A C K G R O U N D A N D C O N T E X T
f A s T f O R w A R D s p O K A N E D O w N T O w N p l A N U p D A T E
41
6.2 CYCLING ENVIRONMENT
Gaps between the existing bicycle facilities in Down-
town and the routes that cyclists are using suggest that
cycling connections could be improved. The Downtown
area contains designated bicycle lanes, bicycle routes, and
off-street bicycle trails, which have the potential to serve
trips just beyond walking distance and better connect
the University District and surrounding neighborhoods.
However, the existing facilities do not make up a con-
nected network nor directly serve a number of key cycling
corridors.
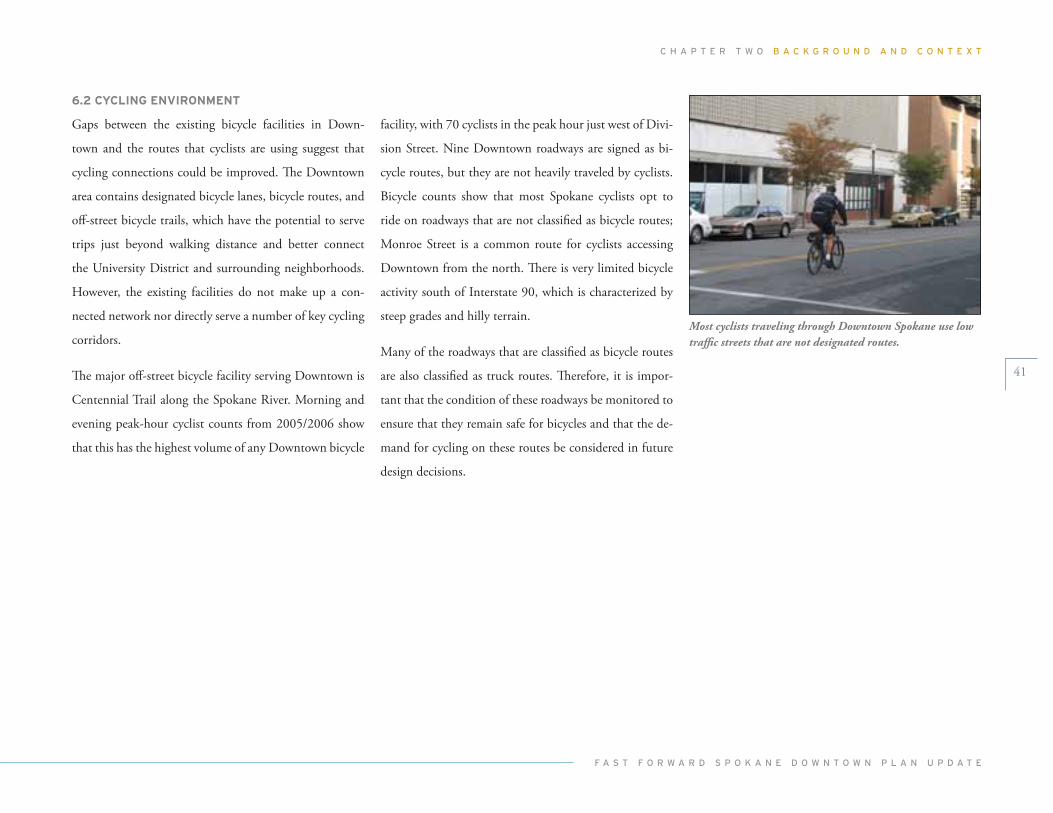
The major off-street bicycle facility serving Downtown is
Centennial Trail along the Spokane River. Morning and
evening peak-hour cyclist counts from 2005/2006 show
that this has the highest volume of any Downtown bicycle
facility, with 70 cyclists in the peak hour just west of Divi-
sion Street. Nine Downtown roadways are signed as bi-
cycle routes, but they are not heavily traveled by cyclists.
Bicycle counts show that most Spokane cyclists opt to
ride on roadways that are not classified as bicycle routes;
Monroe Street is a common route for cyclists accessing
Downtown from the north. There is very limited bicycle
activity south of Interstate 90, which is characterized by
steep grades and hilly terrain.
Many of the roadways that are classified as bicycle routes
are also classified as truck routes. Therefore, it is impor-
tant that the condition of these roadways be monitored to
ensure that they remain safe for bicycles and that the de-
mand for cycling on these routes be considered in future
design decisions.
Most cyclists traveling through Downtown Spokane use low traffic streets that are not designated routes.
C h A p T E R T w O B A C K G R O U N D A N D C O N T E X T
f A s T f O R w A R D s p O K A N E D O w N T O w N p l A N U p D A T E
42
6.3 TRANSIT SERVICE
Transit connections to Downtown destinations are be-
coming increasingly important to Downtown’s future
growth, since many of these destinations are just beyond
comfortable walking distance from the Downtown Core.
While a number of recent plans and studies have called
for a dedicated transit option to serve these destinations,
Downtown still relies on the existing Spokane Transit Au-
thority (STA) bus and shuttle coverage. The recent Spo-
kane Streetcar Feasibility Study builds on previous findings
that a dedicated Downtown transit system would be both
feasible and beneficial to mobility. Preliminary transpor-
tation studies have also examined extending Riverside Av-
enue east along the railroad tracks, which would be used
as an alignment for a potential bus rapid transit or light
rail system.
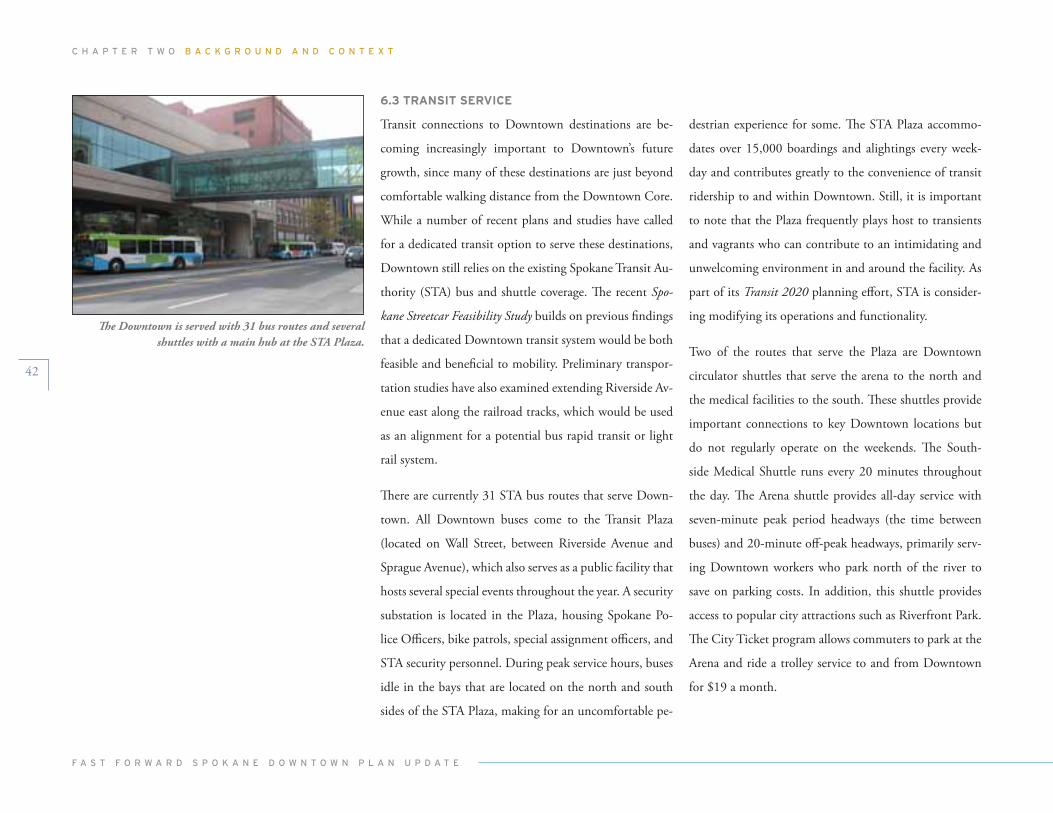
There are currently 31 STA bus routes that serve Down-
town. All Downtown buses come to the Transit Plaza
(located on Wall Street, between Riverside Avenue and
Sprague Avenue), which also serves as a public facility that
hosts several special events throughout the year. A security
substation is located in the Plaza, housing Spokane Po-
lice Officers, bike patrols, special assignment officers, and
STA security personnel. During peak service hours, buses
idle in the bays that are located on the north and south
sides of the STA Plaza, making for an uncomfortable pe-
destrian experience for some. The STA Plaza accommo-
dates over 15,000 boardings and alightings every week-
day and contributes greatly to the convenience of transit
ridership to and within Downtown. Still, it is important
to note that the Plaza frequently plays host to transients
and vagrants who can contribute to an intimidating and
unwelcoming environment in and around the facility. As
part of its Transit 2020 planning effort, STA is consider-
ing modifying its operations and functionality.
Two of the routes that serve the Plaza are Downtown
circulator shuttles that serve the arena to the north and
the medical facilities to the south. These shuttles provide
important connections to key Downtown locations but
do not regularly operate on the weekends. The South-
side Medical Shuttle runs every 20 minutes throughout
the day. The Arena shuttle provides all-day service with
seven-minute peak period headways (the time between
buses) and 20-minute off-peak headways, primarily serv-
ing Downtown workers who park north of the river to
save on parking costs. In addition, this shuttle provides
access to popular city attractions such as Riverfront Park.
The City Ticket program allows commuters to park at the
Arena and ride a trolley service to and from Downtown
for $19 a month.
The Downtown is served with 31 bus routes and several shuttles with a main hub at the STA Plaza.
C h A p T E R T w O B A C K G R O U N D A N D C O N T E X T
f A s T f O R w A R D s p O K A N E D O w N T O w N p l A N U p D A T E
43
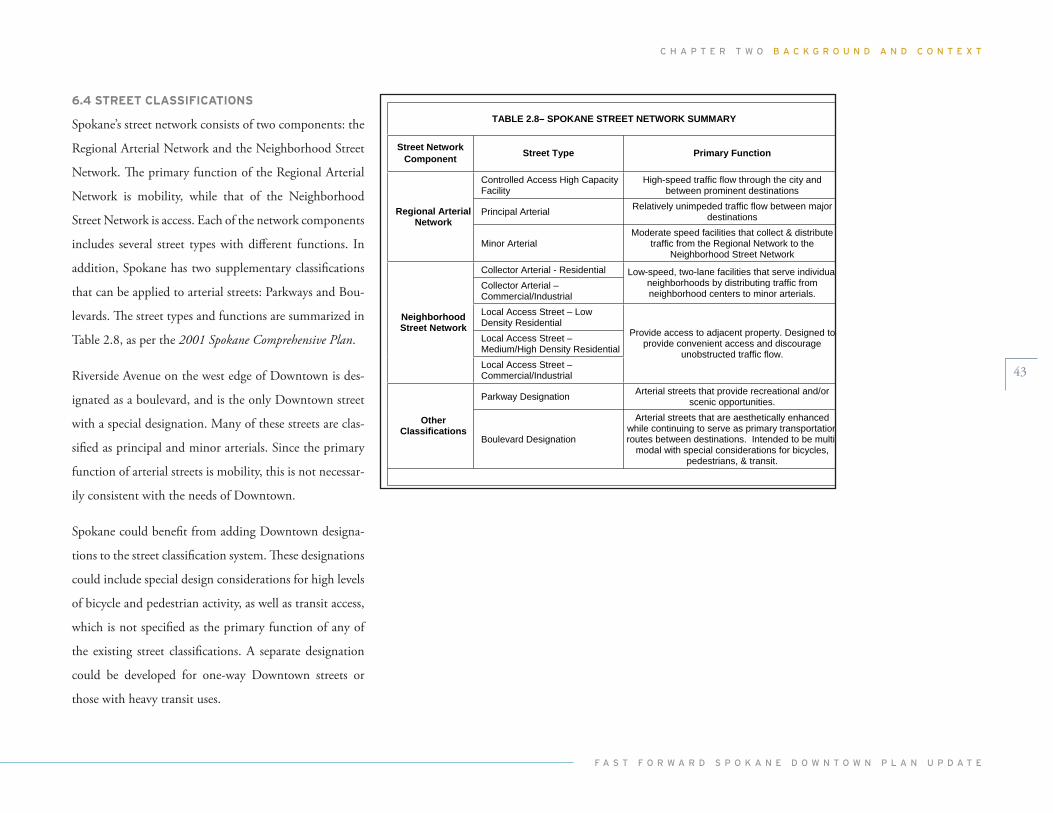
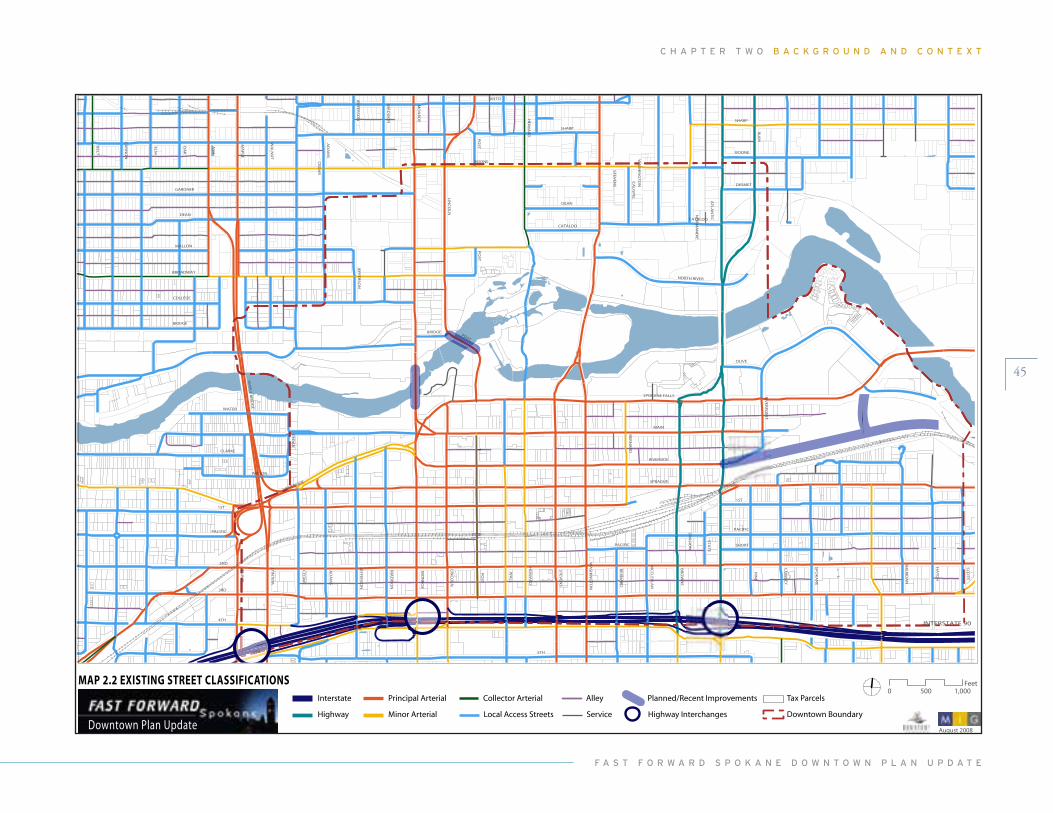
6.4 STREET CLASSIFICATIONS
Spokane’s street network consists of two components: the
Regional Arterial Network and the Neighborhood Street
Network. The primary function of the Regional Arterial
Network is mobility, while that of the Neighborhood
Street Network is access. Each of the network components
includes several street types with different functions. In
addition, Spokane has two supplementary classifications
that can be applied to arterial streets: Parkways and Bou-
levards. The street types and functions are summarized in
Table 2.8, as per the 2001 Spokane Comprehensive Plan.
Riverside Avenue on the west edge of Downtown is des-
ignated as a boulevard, and is the only Downtown street
with a special designation. Many of these streets are clas-
sified as principal and minor arterials. Since the primary
function of arterial streets is mobility, this is not necessar-
ily consistent with the needs of Downtown.
Spokane could benefit from adding Downtown designa-
tions to the street classification system. These designations
could include special design considerations for high levels
of bicycle and pedestrian activity, as well as transit access,
which is not specified as the primary function of any of
the existing street classifications. A separate designation
could be developed for one-way Downtown streets or
those with heavy transit uses.
TABLE 2.8– SPOKANE STREET NETWORK SUMMARY
Street Network Component Street Type Primary Function
Controlled Access High Capacity Facility
High-speed traffic flow through the city and between prominent destinations
Principal Arterial Relatively unimpeded traffic flow between major destinationsRegional Arterial
Network
Minor Arterial Moderate speed facilities that collect & distribute
traffic from the Regional Network to the Neighborhood Street Network
Collector Arterial - Residential Collector Arterial – Commercial/Industrial
Low-speed, two-lane facilities that serve individual neighborhoods by distributing traffic from neighborhood centers to minor arterials.
Local Access Street – Low Density Residential Local Access Street – Medium/High Density Residential
Neighborhood Street Network
Local Access Street – Commercial/Industrial
Provide access to adjacent property. Designed to provide convenient access and discourage
unobstructed traffic flow.
Parkway Designation Arterial streets that provide recreational and/or scenic opportunities.
OtherClassifications
Boulevard Designation
Arterial streets that are aesthetically enhanced while continuing to serve as primary transportation routes between destinations. Intended to be multi-
modal with special considerations for bicycles, pedestrians, & transit.
C h A p T E R T w O B A C K G R O U N D A N D C O N T E X T
f A s T f O R w A R D s p O K A N E D O w N T O w N p l A N U p D A T E
44
6.6 CIRCULATION
Downtown’s street network generally has available ca-
pacity, but the Downtown Core is bounded by certain
barriers. Interstate 90 is the primary route for accessing
Spokane, and serves as an essential component of the
Downtown transportation network, but its on- and off-
ramps affect roadway performance. The majority of the
intersections in Downtown Spokane operate above the
Level of Service (LOS) standards set forth by the City, at
LOS “C” or better, and have available capacity. Two key
intersections operate below the LOS standards: Browne
Street/3rd Avenue and Division Street/3rd Avenue, both
directly adjacent to the Interstate 90 ramps.
One-way street circulation within Downtown facilitates
through traffic movement; causes fewer delays for mo-
torists; simplifies traffic movements and signal timing at
intersections; and provides fewer potential conflicts for
pedestrians at intersections. It also allows for higher travel
speeds on three and four lane streets that may conflict
with other goals related to the walking and cycling envi-
ronment.
There are approximately 15 north/south streets that run
through Downtown between Walnut Street and Division
Street, only six of which have river crossings. Two of the
crossings are local streets through Riverfront Park, one of
which is closed to traffic. Monroe Street, with its historic
bridge across the Spokane River, is a major north/south
route that traverses Downtown. The City is establishing
a study to review potential congestion and air quality is-
sues at the north end of the Monroe Street Bridge. The
proposed Kendall Yards development on the west side of
Monroe at Bridge Street is expected to significantly in-
crease land use density and trip generation. City engineers
are determining what is needed to fulfill the conditions of
the Kendall Yards approval. Wall Street is another north/
south corridor that despite some traffic flow and air qual-
ity challenges, has the opportunity to become an impor-
tant pedestrian linkage to Downtown.
Traffic accident rates in the Downtown network are high-
est on principal arterials. The intersection of Division
Street and Sprague Avenue has the highest crash rate of
any intersection in the area, and three other intersections
along Division Street make the list of the 15 intersections
with the highest crash rates in Downtown.
6.5 SPOKANE TRAFFIC VOLUMES
Average Daily Traffic (ADT) counts were taken in 2005
as part of the University District/Downtown Spokane
Transportation Improvement Study. These counts, which
include screenline counts around the City, show that ap-
proximately 273,000 vehicles each day use surface streets
to enter or exit Spokane. About half of these vehicles come
from north of the river; 10% of the vehicles are from the
west; and the remaining 40% are split between the east
and south, with slightly more vehicles coming from the
east. Interstate 90 carries approximately 50,000 vehicles
per day in each direction through the City. As expected,
the river crossing locations have the highest daily aver-
age surface street volumes. In general, the north/south
streets carry more vehicles than the east/west streets—not
surprising since Interstate 90 carries the majority of the
east/west “through” traffic. Third Avenue carries the most
east/west traffic, with approximately 15,000 vehicles per
day.
C h A p T E R T w O B A C K G R O U N D A N D C O N T E X T
f A s T f O R w A R D s p O K A N E D O w N T O w N p l A N U p D A T E
45
2ND
DR3
5TH
1ST
NIAM
HT4
DIV
ISIO
N
ENOOB
OTNIS
WA
LL
WA
SH
ING
TO
N
SPRAGUE
MO
NR
OE
RU
BY
BR
OW
NEM
AP
LE
RIVERSIDE
LIN
CO
LN
WA
LN
UT
PIN
E
YAWDAORB
CE
DA
R
BE
RN
AR
D
AD
AM
S
GELLOC E
MC
CL
EL
LA
N
JEF
FE
RS
ON
RENDRAG
AT
LA
NT
IC
POST
NAED
NO
RM
AN
DIE
NORTH RIVER
MA
PL
E B
RID
GE
ST
AT
E
ODLATAC
PACIFIC
RETAW
EVILO
SLLAFENAKOPS
WILSON
TEMSED
CA
LIS
PE
L
SHORT
HO
WA
RD
BRIDGE
ST
EV
EN
S
CLARKE
PO
ST
BE
RN
AR
D
RIVERSIDE
NAED
SHARP
NOLLAM
CE
DA
R
AD
AM
S ENOOB
TS1
CE
DA
R
JEF
FE
RS
ON
4TH09ETATSRETNI
IFICAP C
MA
DIS
ON
EGDIRB
5TH
LIN
CO
LN
SHARP
ST
EV
EN
S
MA
DIS
ON
PO
ST
JEF
FE
RS
ON
PO
ST
CATALDO
WA
LL
MA
PL
E
OA
K
WA
LN
UT
CA
NN
ON
EL
M
AS
H
BE
LT
PACIFIC
MO
NR
OE
HO
WA
RD
WA
SH
ING
TO
N
CO
WL
EY
SP
OK
AN
E
SH
ER
IDA
N
HA
TC
H
SC
OT
T
0 1,000500Feet
August 2008Downtown Plan Update
MAP 2.2 EXISTING STREET CLASSIFICATIONSAlleyCollector Arterial
Highway
Interstate
Minor Arterial
Principal Arterial
Local Access Streets Service
Planned/Recent Improvements
Highway Interchanges
Tax Parcels
Downtown Boundary
RIV
ER
PO
INT
C h A p T E R T w O B A C K G R O U N D A N D C O N T E X T
f A s T f O R w A R D s p O K A N E D O w N T O w N p l A N U p D A T E
46
6.7 DOWNTOWN PARKING
Parking demands and perceptions still present challenges
for Downtown Spokane, despite the implementation of
a number of the Spokane Downtown Parking Demand
Study recommendations. Program improvements bring-
ing a customer-friendly approach to parking have been
relatively well received by the business community, visi-
tors, and employees. However, parking cost, availability,
access, and concerns over the impacts of surface parking
lots remain challenges. Parking rates have increased over
50% between 2006 and 2007, and consolidated owner-
ship and/or management of parking resources complicates
their public management. Off-street parking ranges from
about $5-$10 per day and $80-$205 per month. Metered
spaces are generally priced at a little more than $1 per
hour. The monthly parking figure range does not include
the price of off-street surface parking lots. The monthly
fee for these lots is $40-$45.
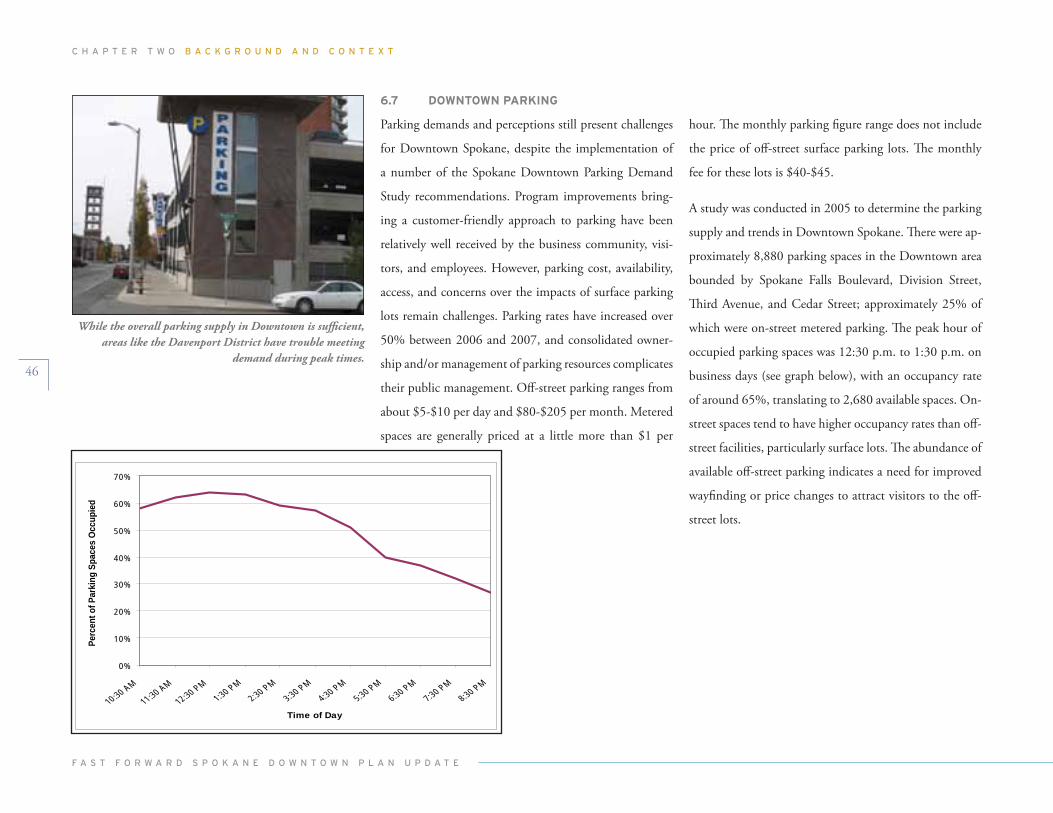
A study was conducted in 2005 to determine the parking
supply and trends in Downtown Spokane. There were ap-
proximately 8,880 parking spaces in the Downtown area
bounded by Spokane Falls Boulevard, Division Street,
Third Avenue, and Cedar Street; approximately 25% of
which were on-street metered parking. The peak hour of
occupied parking spaces was 12:30 p.m. to 1:30 p.m. on
business days (see graph below), with an occupancy rate
of around 65%, translating to 2,680 available spaces. On-
street spaces tend to have higher occupancy rates than off-
street facilities, particularly surface lots. The abundance of
available off-street parking indicates a need for improved
wayfinding or price changes to attract visitors to the off-
street lots.
0%
10%
20%
30%
40%
50%
60%
70%
10 :30 AM
11 :30 AM
12 :30 PM1:30 PM
2:30 PM3:30 PM
4:30 PM5:30 PM
6:30 PM7:30 PM
8:30 PM
Time of Day
Perc
ent o
f Par
king
Spa
ces
Occ
upie
d
While the overall parking supply in Downtown is sufficient, areas like the Davenport District have trouble meeting
demand during peak times.
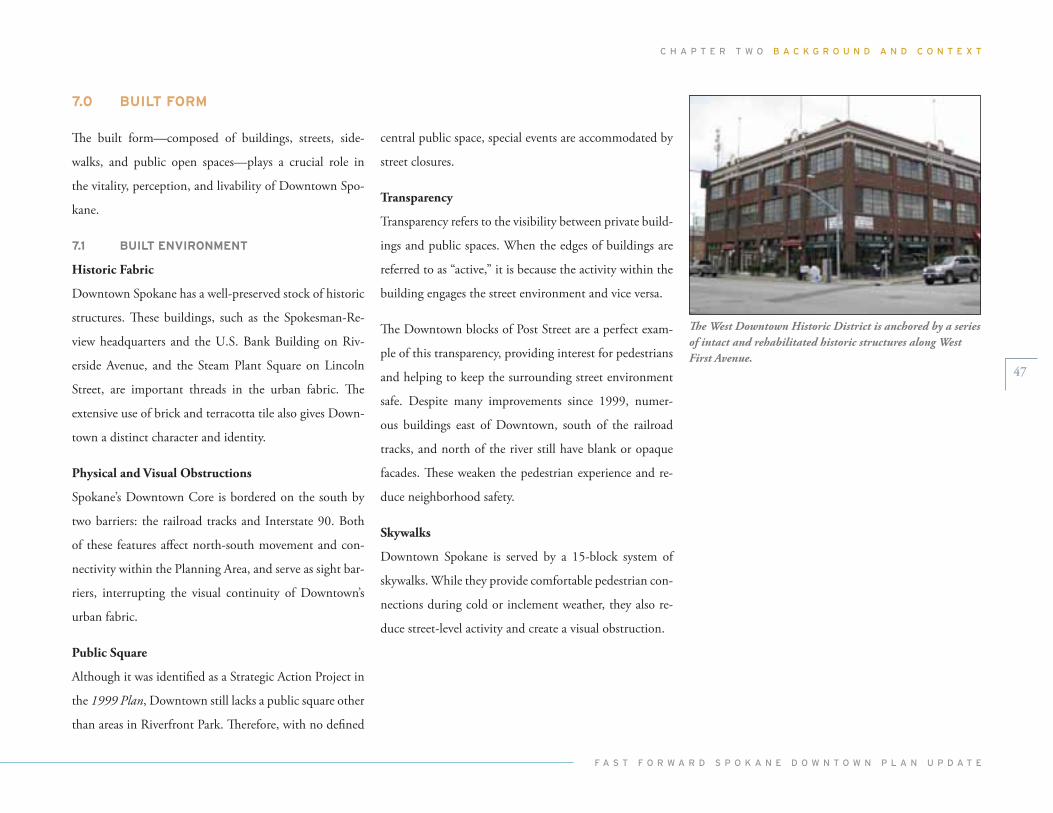
C h A p T E R T w O B A C K G R O U N D A N D C O N T E X T
f A s T f O R w A R D s p O K A N E D O w N T O w N p l A N U p D A T E
47
7.0 BUILT FORM
The built form—composed of buildings, streets, side-
walks, and public open spaces—plays a crucial role in
the vitality, perception, and livability of Downtown Spo-
kane.
7.1 BUILT ENVIRONMENT
Historic fabric
Downtown Spokane has a well-preserved stock of historic
structures. These buildings, such as the Spokesman-Re-
view headquarters and the U.S. Bank Building on Riv-
erside Avenue, and the Steam Plant Square on Lincoln
Street, are important threads in the urban fabric. The
extensive use of brick and terracotta tile also gives Down-
town a distinct character and identity.
Physical and visual obstructions
Spokane’s Downtown Core is bordered on the south by
two barriers: the railroad tracks and Interstate 90. Both
of these features affect north-south movement and con-
nectivity within the Planning Area, and serve as sight bar-
riers, interrupting the visual continuity of Downtown’s
urban fabric.
Public Square
Although it was identified as a Strategic Action Project in
the 1999 Plan, Downtown still lacks a public square other
than areas in Riverfront Park. Therefore, with no defined
central public space, special events are accommodated by
street closures.
Transparency
Transparency refers to the visibility between private build-
ings and public spaces. When the edges of buildings are
referred to as “active,” it is because the activity within the
building engages the street environment and vice versa.
The Downtown blocks of Post Street are a perfect exam-
ple of this transparency, providing interest for pedestrians
and helping to keep the surrounding street environment
safe. Despite many improvements since 1999, numer-
ous buildings east of Downtown, south of the railroad
tracks, and north of the river still have blank or opaque
facades. These weaken the pedestrian experience and re-
duce neighborhood safety.
Skywalks
Downtown Spokane is served by a 15-block system of
skywalks. While they provide comfortable pedestrian con-
nections during cold or inclement weather, they also re-
duce street-level activity and create a visual obstruction.
The West Downtown Historic District is anchored by a series of intact and rehabilitated historic structures along West First Avenue.
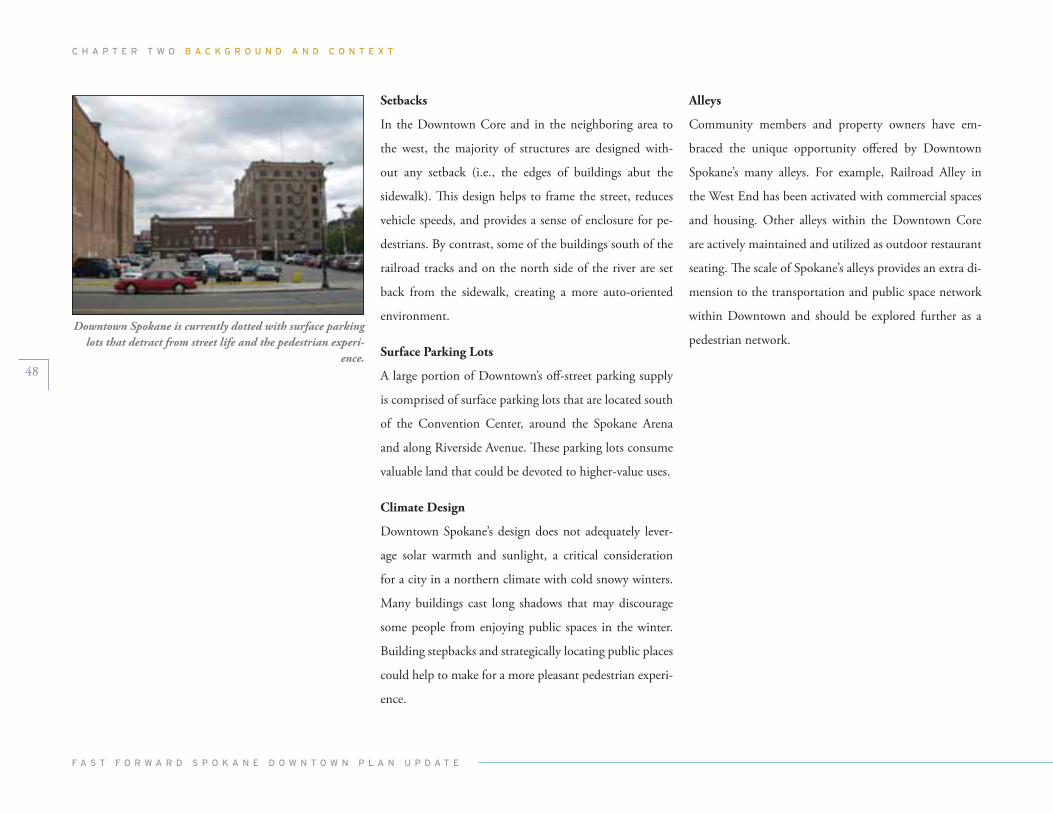
C h A p T E R T w O B A C K G R O U N D A N D C O N T E X T
f A s T f O R w A R D s p O K A N E D O w N T O w N p l A N U p D A T E
48
Setbacks
In the Downtown Core and in the neighboring area to
the west, the majority of structures are designed with-
out any setback (i.e., the edges of buildings abut the
sidewalk). This design helps to frame the street, reduces
vehicle speeds, and provides a sense of enclosure for pe-
destrians. By contrast, some of the buildings south of the
railroad tracks and on the north side of the river are set
back from the sidewalk, creating a more auto-oriented
environment.
Surface Parking lots
A large portion of Downtown’s off-street parking supply
is comprised of surface parking lots that are located south
of the Convention Center, around the Spokane Arena
and along Riverside Avenue. These parking lots consume
valuable land that could be devoted to higher-value uses.
Climate design
Downtown Spokane’s design does not adequately lever-
age solar warmth and sunlight, a critical consideration
for a city in a northern climate with cold snowy winters.
Many buildings cast long shadows that may discourage
some people from enjoying public spaces in the winter.
Building stepbacks and strategically locating public places
could help to make for a more pleasant pedestrian experi-
ence.
Alleys
Community members and property owners have em-
braced the unique opportunity offered by Downtown
Spokane’s many alleys. For example, Railroad Alley in
the West End has been activated with commercial spaces
and housing. Other alleys within the Downtown Core
are actively maintained and utilized as outdoor restaurant
seating. The scale of Spokane’s alleys provides an extra di-
mension to the transportation and public space network
within Downtown and should be explored further as a
pedestrian network.Downtown Spokane is currently dotted with surface parking
lots that detract from street life and the pedestrian experi-ence.
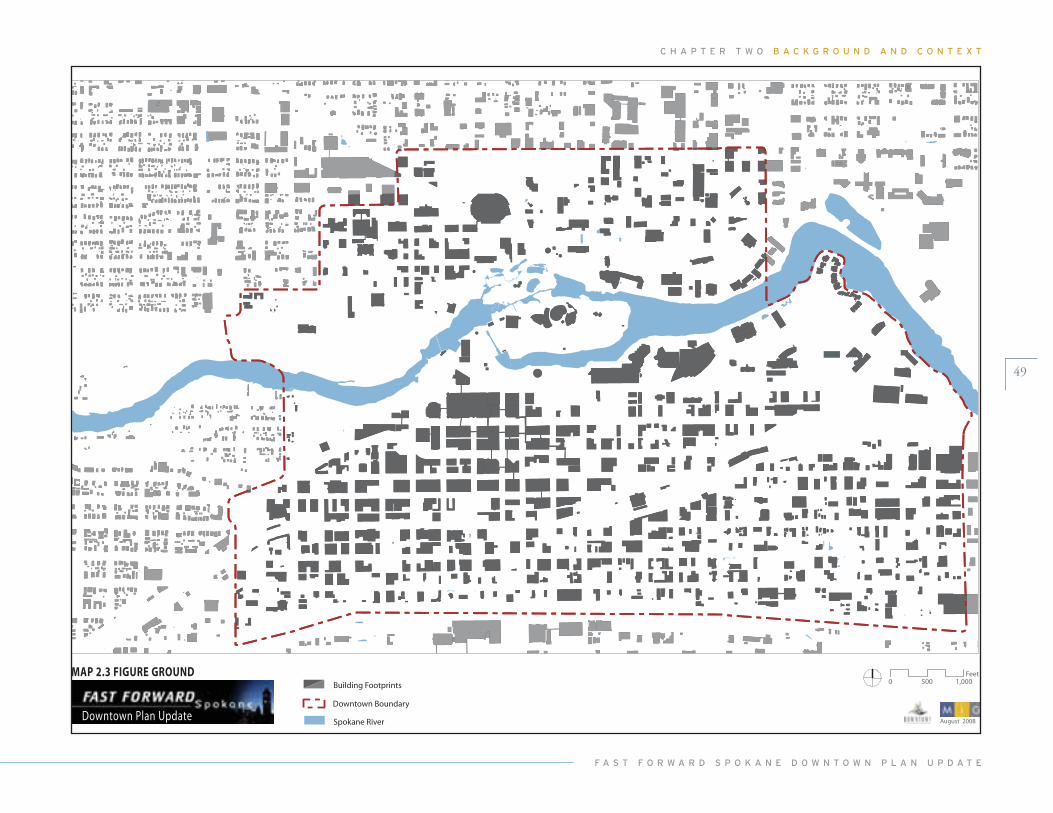
C h A p T E R T w O B A C K G R O U N D A N D C O N T E X T
f A s T f O R w A R D s p O K A N E D O w N T O w N p l A N U p D A T E
49
0 1,000500Feet
August 2008Downtown Plan Update
Building Footprints
Spokane River
Downtown Boundary
MAP 2.3 FIGURE GROUND
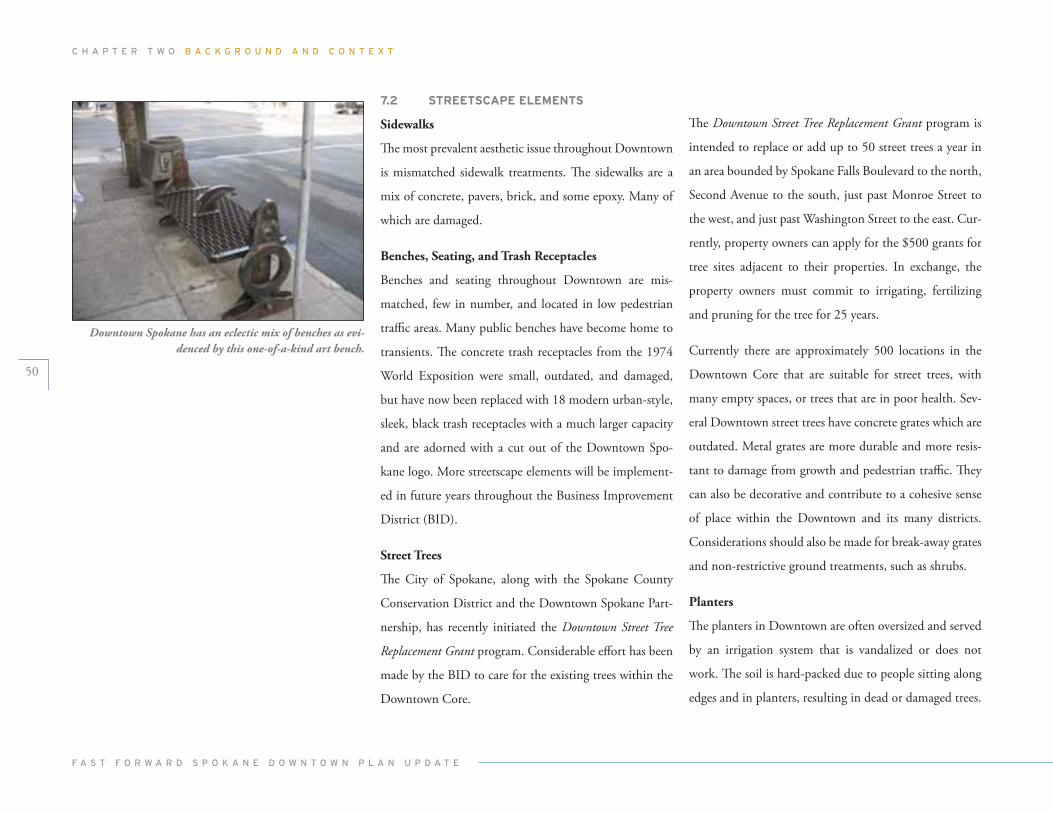
C h A p T E R T w O B A C K G R O U N D A N D C O N T E X T
f A s T f O R w A R D s p O K A N E D O w N T O w N p l A N U p D A T E
50
7.2 STREETSCAPE ELEMENTS
Sidewalks
The most prevalent aesthetic issue throughout Downtown
is mismatched sidewalk treatments. The sidewalks are a
mix of concrete, pavers, brick, and some epoxy. Many of
which are damaged.
Benches, Seating, and Trash Receptacles
Benches and seating throughout Downtown are mis-
matched, few in number, and located in low pedestrian
traffic areas. Many public benches have become home to
transients. The concrete trash receptacles from the 1974
World Exposition were small, outdated, and damaged,
but have now been replaced with 18 modern urban-style,
sleek, black trash receptacles with a much larger capacity
and are adorned with a cut out of the Downtown Spo-
kane logo. More streetscape elements will be implement-
ed in future years throughout the Business Improvement
District (BID).
Street Trees
The City of Spokane, along with the Spokane County
Conservation District and the Downtown Spokane Part-
nership, has recently initiated the Downtown Street Tree
Replacement Grant program. Considerable effort has been
made by the BID to care for the existing trees within the
Downtown Core.
The Downtown Street Tree Replacement Grant program is
intended to replace or add up to 50 street trees a year in
an area bounded by Spokane Falls Boulevard to the north,
Second Avenue to the south, just past Monroe Street to
the west, and just past Washington Street to the east. Cur-
rently, property owners can apply for the $500 grants for
tree sites adjacent to their properties. In exchange, the
property owners must commit to irrigating, fertilizing
and pruning for the tree for 25 years.
Currently there are approximately 500 locations in the
Downtown Core that are suitable for street trees, with
many empty spaces, or trees that are in poor health. Sev-
eral Downtown street trees have concrete grates which are
outdated. Metal grates are more durable and more resis-
tant to damage from growth and pedestrian traffic. They
can also be decorative and contribute to a cohesive sense
of place within the Downtown and its many districts.
Considerations should also be made for break-away grates
and non-restrictive ground treatments, such as shrubs.
Planters
The planters in Downtown are often oversized and served
by an irrigation system that is vandalized or does not
work. The soil is hard-packed due to people sitting along
edges and in planters, resulting in dead or damaged trees.
Downtown Spokane has an eclectic mix of benches as evi-denced by this one-of-a-kind art bench.
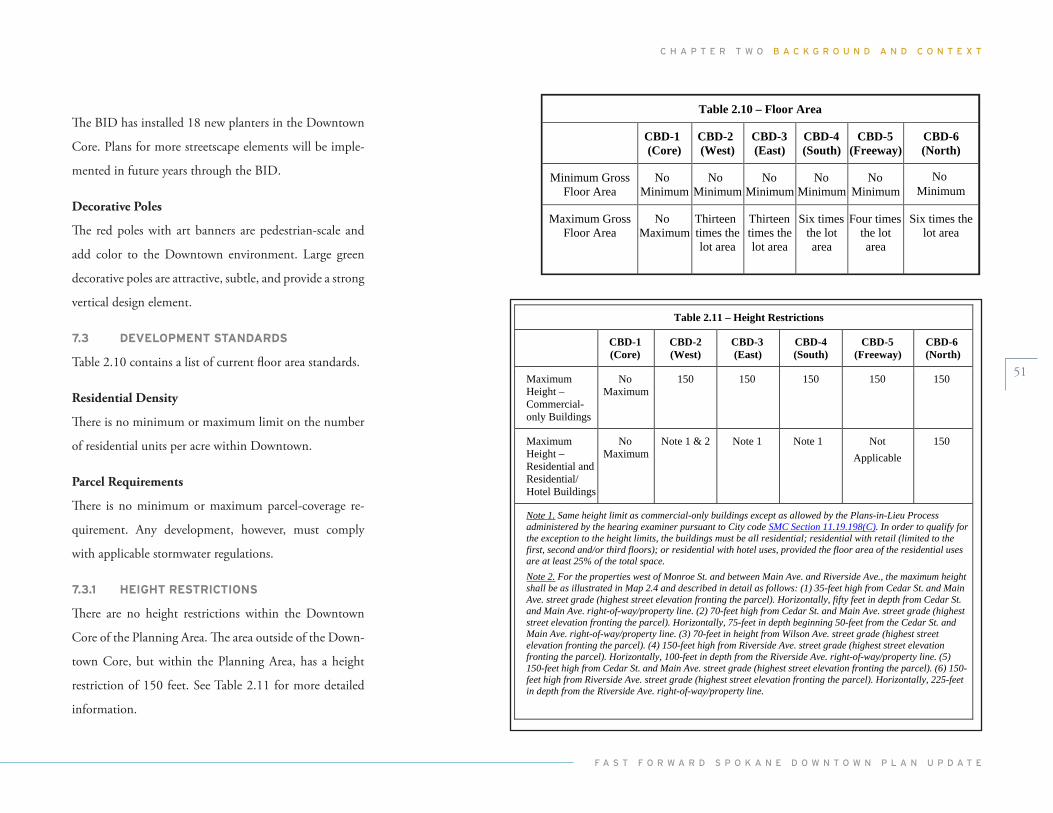
C h A p T E R T w O B A C K G R O U N D A N D C O N T E X T
f A s T f O R w A R D s p O K A N E D O w N T O w N p l A N U p D A T E
51
The BID has installed 18 new planters in the Downtown
Core. Plans for more streetscape elements will be imple-
mented in future years through the BID.
decorative Poles
The red poles with art banners are pedestrian-scale and
add color to the Downtown environment. Large green
decorative poles are attractive, subtle, and provide a strong
vertical design element.
7.3 DEVELOPMENT STANDARDS
Table 2.10 contains a list of current floor area standards.
Residential density
There is no minimum or maximum limit on the number
of residential units per acre within Downtown.
Parcel Requirements
There is no minimum or maximum parcel-coverage re-
quirement. Any development, however, must comply
with applicable stormwater regulations.
7.3.1 HEIGHT RESTRICTIONS
There are no height restrictions within the Downtown
Core of the Planning Area. The area outside of the Down-
town Core, but within the Planning Area, has a height
restriction of 150 feet. See Table 2.11 for more detailed
information.
Table 2.10 – Floor Area
CBD-1(Core)
CBD-2(West)
CBD-3(East)
CBD-4(South)
CBD-5(Freeway)
CBD-6(North)
Minimum GrossFloor Area
NoMinimum
NoMinimum
NoMinimum
NoMinimum
NoMinimum
No Minimum
Maximum GrossFloor Area
NoMaximum
Thirteentimes thelot area
Thirteentimes thelot area
Six timesthe lotarea
Four timesthe lotarea
Six times thelot area
Table 2.11 – Height Restrictions
CBD-1(Core)
CBD-2(West)
CBD-3(East)
CBD-4(South)
CBD-5(Freeway)
CBD-6(North)
Maximum Height – Commercial-only Buildings
NoMaximum
150 150 150 150 150
Maximum Height – Residential and Residential/Hotel Buildings
NoMaximum
Note 1 & 2 Note 1 Note 1 NotApplicable
150
Note 1. Same height limit as commercial-only buildings except as allowed by the Plans-in-Lieu Process administered by the hearing examiner pursuant to City code SMC Section 11.19.198(C). In order to qualify for the exception to the height limits, the buildings must be all residential; residential with retail (limited to the first, second and/or third floors); or residential with hotel uses, provided the floor area of the residential uses are at least 25% of the total space. Note 2. For the properties west of Monroe St. and between Main Ave. and Riverside Ave., the maximum height shall be as illustrated in Map 2.4 and described in detail as follows: (1) 35-feet high from Cedar St. and Main Ave. street grade (highest street elevation fronting the parcel). Horizontally, fifty feet in depth from Cedar St. and Main Ave. right-of-way/property line. (2) 70-feet high from Cedar St. and Main Ave. street grade (highest street elevation fronting the parcel). Horizontally, 75-feet in depth beginning 50-feet from the Cedar St. and Main Ave. right-of-way/property line. (3) 70-feet in height from Wilson Ave. street grade (highest street elevation fronting the parcel). (4) 150-feet high from Riverside Ave. street grade (highest street elevation fronting the parcel). Horizontally, 100-feet in depth from the Riverside Ave. right-of-way/property line. (5) 150-feet high from Cedar St. and Main Ave. street grade (highest street elevation fronting the parcel). (6) 150-feet high from Riverside Ave. street grade (highest street elevation fronting the parcel). Horizontally, 225-feet in depth from the Riverside Ave. right-of-way/property line.
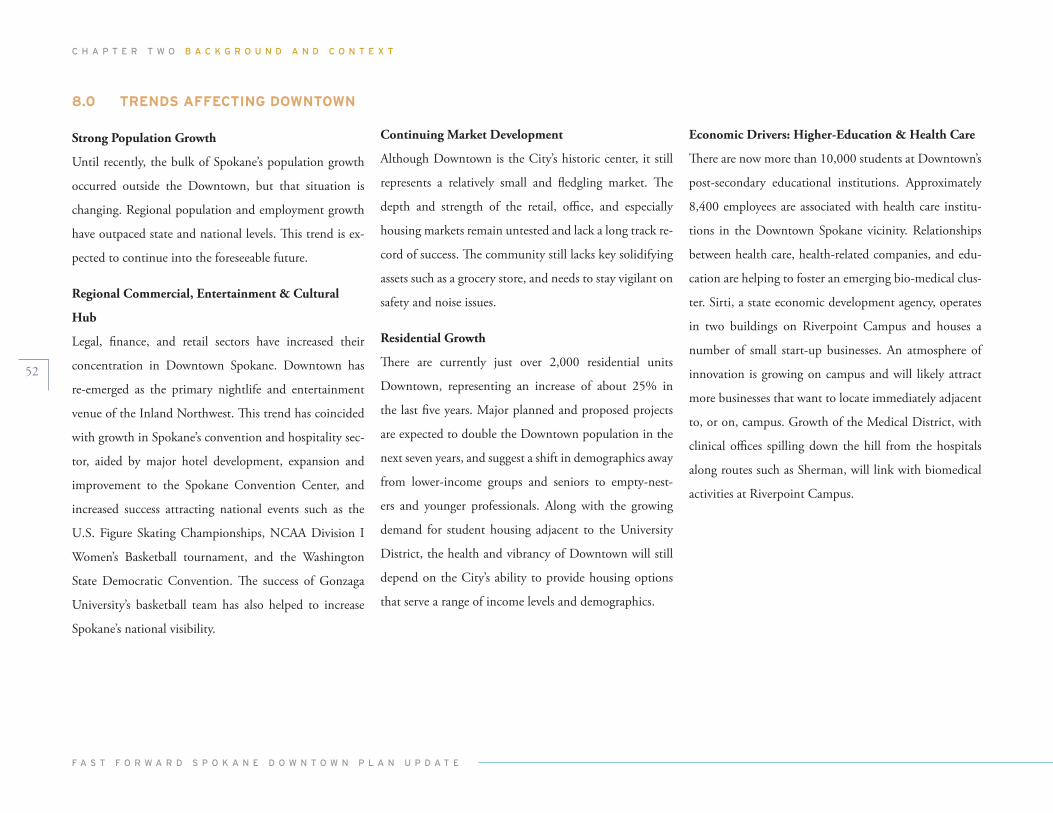
C h A p T E R T w O B A C K G R O U N D A N D C O N T E X T
f A s T f O R w A R D s p O K A N E D O w N T O w N p l A N U p D A T E
52
8.0 TRENDS AFFECTING DOWNTOWN
Strong Population growth
Until recently, the bulk of Spokane’s population growth
occurred outside the Downtown, but that situation is
changing. Regional population and employment growth
have outpaced state and national levels. This trend is ex-
pected to continue into the foreseeable future.
Regional Commercial, Entertainment & Cultural
Hub
Legal, finance, and retail sectors have increased their
concentration in Downtown Spokane. Downtown has
re-emerged as the primary nightlife and entertainment
venue of the Inland Northwest. This trend has coincided
with growth in Spokane’s convention and hospitality sec-
tor, aided by major hotel development, expansion and
improvement to the Spokane Convention Center, and
increased success attracting national events such as the
U.S. Figure Skating Championships, NCAA Division I
Women’s Basketball tournament, and the Washington
State Democratic Convention. The success of Gonzaga
University’s basketball team has also helped to increase
Spokane’s national visibility.
Continuing market development
Although Downtown is the City’s historic center, it still
represents a relatively small and fledgling market. The
depth and strength of the retail, office, and especially
housing markets remain untested and lack a long track re-
cord of success. The community still lacks key solidifying
assets such as a grocery store, and needs to stay vigilant on
safety and noise issues.
Residential growth
There are currently just over 2,000 residential units
Downtown, representing an increase of about 25% in
the last five years. Major planned and proposed projects
are expected to double the Downtown population in the
next seven years, and suggest a shift in demographics away
from lower-income groups and seniors to empty-nest-
ers and younger professionals. Along with the growing
demand for student housing adjacent to the University
District, the health and vibrancy of Downtown will still
depend on the City’s ability to provide housing options
that serve a range of income levels and demographics.
Economic drivers: Higher-Education & Health Care
There are now more than 10,000 students at Downtown’s
post-secondary educational institutions. Approximately
8,400 employees are associated with health care institu-
tions in the Downtown Spokane vicinity. Relationships
between health care, health-related companies, and edu-
cation are helping to foster an emerging bio-medical clus-
ter. Sirti, a state economic development agency, operates
in two buildings on Riverpoint Campus and houses a
number of small start-up businesses. An atmosphere of
innovation is growing on campus and will likely attract
more businesses that want to locate immediately adjacent
to, or on, campus. Growth of the Medical District, with
clinical offices spilling down the hill from the hospitals
along routes such as Sherman, will link with biomedical
activities at Riverpoint Campus.
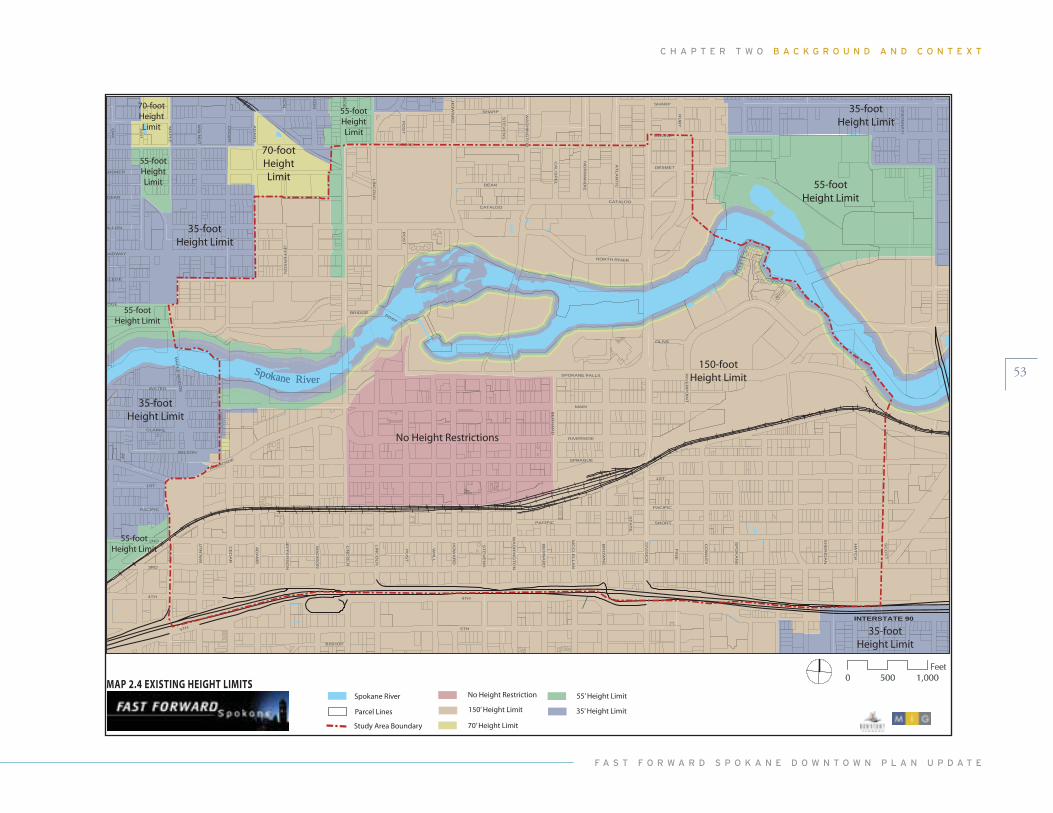
C h A p T E R T w O B A C K G R O U N D A N D C O N T E X T
f A s T f O R w A R D s p O K A N E D O w N T O w N p l A N U p D A T E
53Spokane River
2ND
3RD
5TH
1ST
MAIN
4TH
DIV
ISIO
N
BOONE
WA
LL
WA
SH
ING
TO
N
SPRAGUE
NR
OE
RU
BY
BR
OW
NEM
AP
LE
RIVERSIDE
LIN
CO
LN
WA
LN
UT P
INE
OADWAY
CE
DA
R
BE
RN
AR
D
AD
AM
S
LLEGE
MC
CLE
LLA
N
JEF
FE
RS
ON
ARDNER
AT
LA
NT
IC
POST
DEAN
NO
RM
AN
DIE
NORTH RIVER
BISHOP
MA
PLE
BR
IDG
E
ST
AT
E
CATALDO
PACIFIC
WATER
OLIVE
SPOKANE FALLS
WILSON
DESMET
CA
LIS
PE
L
SHORT
HO
WA
RD
BRIDGE
ST
EV
EN
S
CLARKE
RIV
ER
PO
INT
PO
ST
BE
RN
AR
D
RIVERSIDE
DEAN
SHARP
ALLON
CE
DA
R
AD
AM
S BOONE
1ST
CE
DA
R
RS
ON
4TH
INTERSTATE 90
PACIFIC
ISO
N
IDGE
5TH
LIN
CO
LN
SHARP
ST
EV
EN
S
MA
DIS
ON
PO
ST
JEF
FE
RS
ON
PO
ST
CATALDO
AL
L
MA
PLE
OA
K
WA
LN
UT
AS
H
PACIFIC
LIN
CO
LN
HO
WA
RD
WA
SH
ING
TO
N
CO
WLE
Y
SP
OK
AN
E
SH
ER
IDA
N
HA
TC
H
SC
OT
T
CIN
CIN
NA
TI
0 1,000500Feet
MAP 2.4 EXISTING HEIGHT LIMITS Spokane River
Parcel Lines
Study Area Boundary
No Height Restriction
150’ Height Limit
70’ Height Limit
55’ Height Limit
35’ Height Limit
0 1,000500Feet
No Height Restrictions
150-foot Height Limit
35-foot Height Limit
55-foot Height Limit
55-foot HeightLimit
55-foot HeightLimit
70-foot HeightLimit
70-foot HeightLimit
55-foot Height Limit
35-foot Height Limit
35-foot Height Limit
55-foot Height Limit
35-foot Height Limit
Spokane River
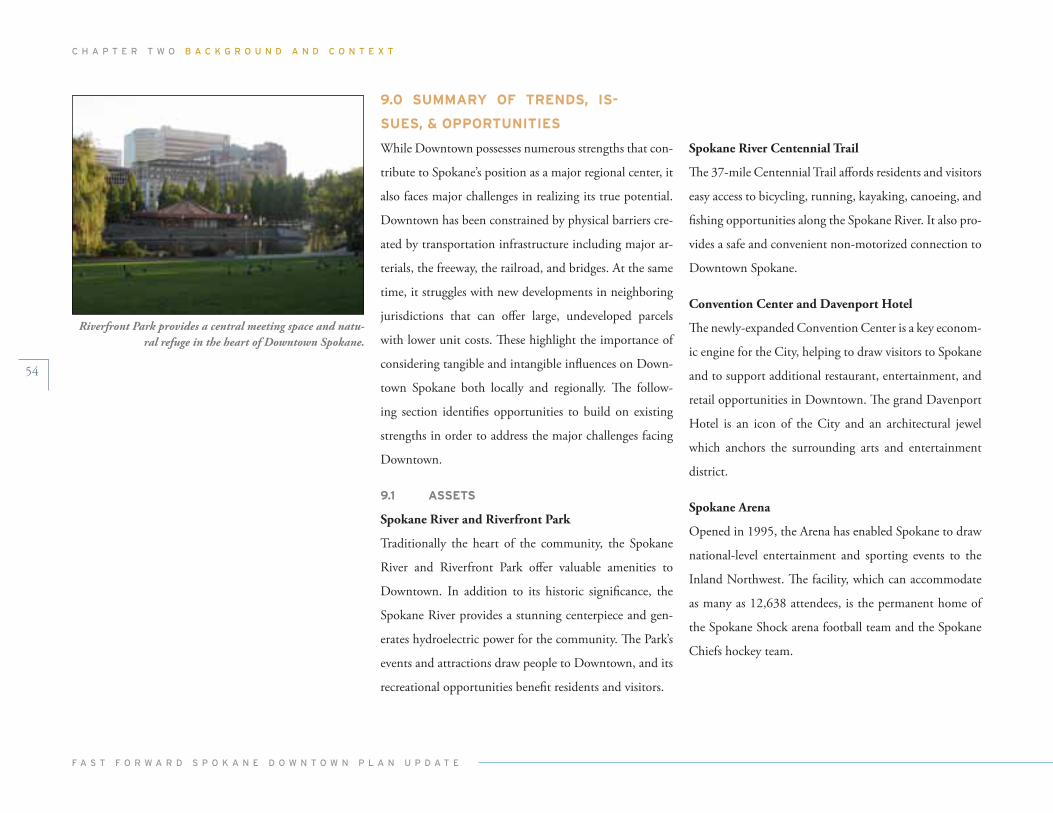
C h A p T E R T w O B A C K G R O U N D A N D C O N T E X T
f A s T f O R w A R D s p O K A N E D O w N T O w N p l A N U p D A T E
54
Spokane River Centennial Trail
The 37-mile Centennial Trail affords residents and visitors
easy access to bicycling, running, kayaking, canoeing, and
fishing opportunities along the Spokane River. It also pro-
vides a safe and convenient non-motorized connection to
Downtown Spokane.
Convention Center and davenport Hotel
The newly-expanded Convention Center is a key econom-
ic engine for the City, helping to draw visitors to Spokane
and to support additional restaurant, entertainment, and
retail opportunities in Downtown. The grand Davenport
Hotel is an icon of the City and an architectural jewel
which anchors the surrounding arts and entertainment
district.
Spokane Arena
Opened in 1995, the Arena has enabled Spokane to draw
national-level entertainment and sporting events to the
Inland Northwest. The facility, which can accommodate
as many as 12,638 attendees, is the permanent home of
the Spokane Shock arena football team and the Spokane
Chiefs hockey team.
While Downtown possesses numerous strengths that con-
tribute to Spokane’s position as a major regional center, it
also faces major challenges in realizing its true potential.
Downtown has been constrained by physical barriers cre-
ated by transportation infrastructure including major ar-
terials, the freeway, the railroad, and bridges. At the same
time, it struggles with new developments in neighboring
jurisdictions that can offer large, undeveloped parcels
with lower unit costs. These highlight the importance of
considering tangible and intangible influences on Down-
town Spokane both locally and regionally. The follow-
ing section identifies opportunities to build on existing
strengths in order to address the major challenges facing
Downtown.
9.1 ASSETS
Spokane River and Riverfront Park
Traditionally the heart of the community, the Spokane
River and Riverfront Park offer valuable amenities to
Downtown. In addition to its historic significance, the
Spokane River provides a stunning centerpiece and gen-
erates hydroelectric power for the community. The Park’s
events and attractions draw people to Downtown, and its
recreational opportunities benefit residents and visitors.
9.0 SUMMARY OF TRENDS, IS-
SUES, & OPPORTUNITIES
Riverfront Park provides a central meeting space and natu-ral refuge in the heart of Downtown Spokane.
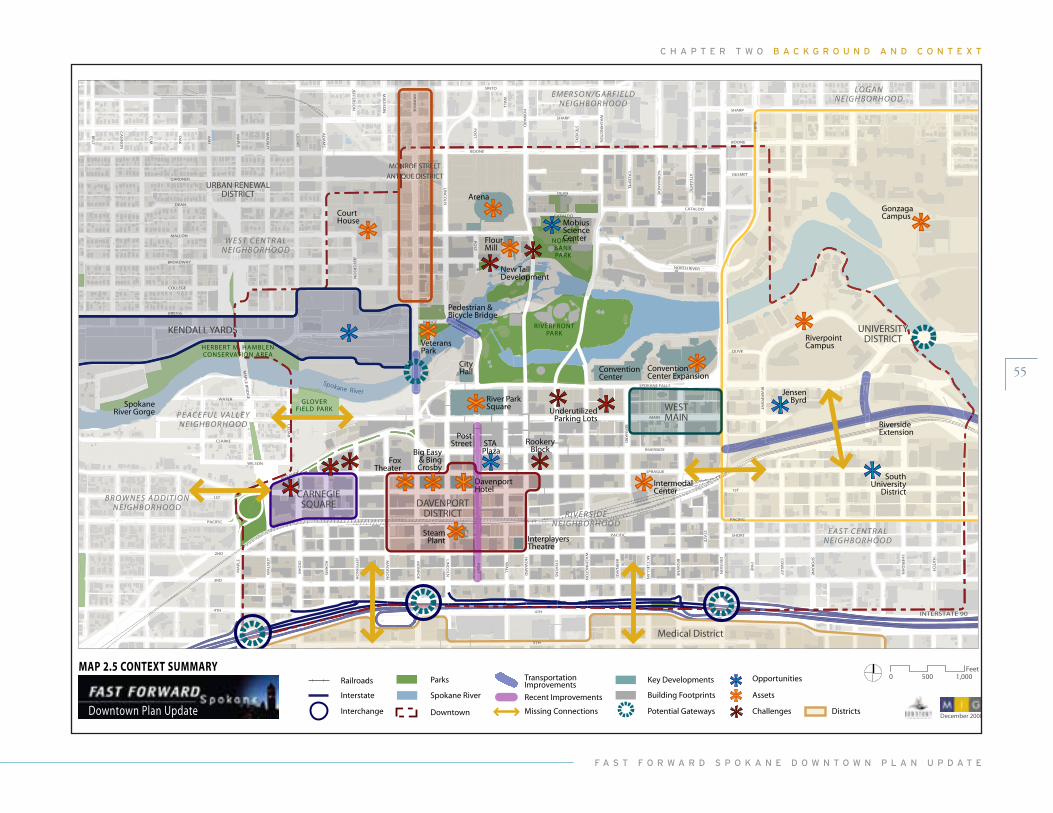
C h A p T E R T w O B A C K G R O U N D A N D C O N T E X T
f A s T f O R w A R D s p O K A N E D O w N T O w N p l A N U p D A T E
55
KENDALL YARDS UNIVERSITYDISTRICT
DAVENPORTDISTRICT
CARNEGIESQUARE
MONROE STREET
ANTIQUE DISTRICT
KENDALL YARDSSSRDALL YAALL YARDSKENDA SKENDA S
EEEEEEEEMOMOOMOMO RRSTRSTRRSTRRROENRON SONN ONROOO SNRONONROE STRE
RIRIANTANTANTANT TTTTRDISTDISTTRQUE DUEQU DDDDUUUQQ DDEEEE DQIQTIQUE DISTR
WESTMAIN
URBAN RENEWALDISTRICT
Medical District
E A S T C E N T R A LN E I G H B O R H O O D
R I V E R S I D EN E I G H B O R H O O D
LO G A NN E I G H B O R H O O D
E M E R S O N / G A R F I E L DN E I G H B O R H O O D
W E S T C E N T R A LN E I G H B O R H O O D
P E AC E F U L VA L L E YN E I G H B O R H O O D
B R O W N E S A D D I T I O NN E I G H B O R H O O D
Districts
2ND
3RD
5TH
1ST
MAIN
4TH
DIV
ISIO
N
BOONE
SINTO
WA
LL
WA
SH
ING
TO
N
SPRAGUE
MO
NR
OE
RU
BY
BR
OW
NEM
AP
LE
RIVERSIDE
LIN
CO
LN
WA
LN
UT
PIN
E
BROADWAY
CE
DA
R
BE
RN
AR
D
AD
AM
S
COLLEGE
MC
CL
EL
LA
N
JEF
FE
RS
ON
GARDNER
AT
LA
NT
IC
POST
DEAN
NO
RM
AN
DIE
NORTH RIVER
MA
PL
E B
RID
GE
ST
AT
E
CATALDO
PACIFIC
WATER
OLIVE
SPOKANE FALLS
WILSON
DESMET
CA
LIS
PE
L
SHORT
HO
WA
RD
BRIDGE
ST
EV
EN
S
CLARKE
RIV
ER
PO
INT
PO
ST
BE
RN
AR
D
RIVERSIDE
DEAN
SHARP
MALLON
CE
DA
R
AD
AM
S BOONE
1ST
CE
DA
R
JEF
FE
RS
ON
4THINTERSTATE 90
PACIFIC
MA
DIS
ON
BRIDGE
5TH
LIN
CO
LN
SHARP
ST
EV
EN
S
MA
DIS
ON
PO
ST
JEF
FE
RS
ON
PO
ST
CATALDO
WA
LL
MA
PL
E
OA
K
WA
LN
UT
CA
NN
ON
EL
M
AS
H
BE
LT
PACIFIC
MO
NR
OE
HO
WA
RD
WA
SH
ING
TO
N
CO
WL
EY
SP
OK
AN
E
SH
ER
IDA
N
HA
TC
H
SC
OT
T
0 1,000500Feet
December 2008Downtown Plan Update
MAP 2.5 CONTEXT SUMMARY
RIVERFRONTPARK
HERBERT M. HAMBLENCONSERVATION AREA
NORTHBANKPARK
GLOVERFIELD PARK
Spokane River
Railroads
Interstate
Parks
Spokane River
TransportationImprovements
Interchange
Recent Improvements
Missing ConnectionsDowntown
Key Developments
Building Footprints
Potential Gateways
Opportunities
Assets
Challenges
ConventionCenter
RookeryBlock
ConventionCenter Expansion
FlourMill
Arena
MobiusScienceCenter
CourtHouse
CityHall
River ParkSquare
VeteransPark
Pedestrian &Bicycle Bridge
FoxTheater
Big Easy& BingCrosby
SteamPlant
DavenportHotel
PostStreet
RiversideExtension
RiverpointCampus
GonzagaCampus
JensenByrd
STA Plaza
InterplayersTheatre
IntermodalCenter
SpokaneRiver Gorge Underutilized
Parking Lots
New TallDevelopment
SouthUniversity
District
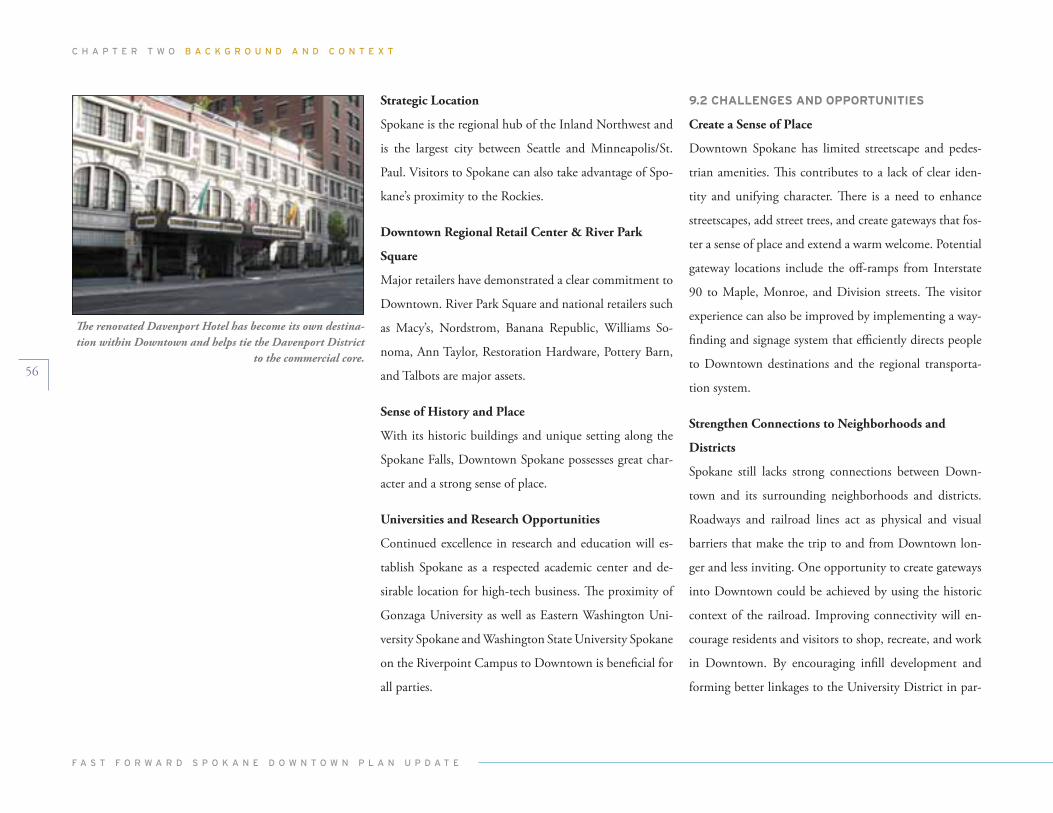
C h A p T E R T w O B A C K G R O U N D A N D C O N T E X T
f A s T f O R w A R D s p O K A N E D O w N T O w N p l A N U p D A T E
56
9.2 CHALLENGES AND OPPORTUNITIES
Create a Sense of Place
Downtown Spokane has limited streetscape and pedes-
trian amenities. This contributes to a lack of clear iden-
tity and unifying character. There is a need to enhance
streetscapes, add street trees, and create gateways that fos-
ter a sense of place and extend a warm welcome. Potential
gateway locations include the off-ramps from Interstate
90 to Maple, Monroe, and Division streets. The visitor
experience can also be improved by implementing a way-
finding and signage system that efficiently directs people
to Downtown destinations and the regional transporta-
tion system.
Strengthen Connections to Neighborhoods and
districts
Spokane still lacks strong connections between Down-
town and its surrounding neighborhoods and districts.
Roadways and railroad lines act as physical and visual
barriers that make the trip to and from Downtown lon-
ger and less inviting. One opportunity to create gateways
into Downtown could be achieved by using the historic
context of the railroad. Improving connectivity will en-
courage residents and visitors to shop, recreate, and work
in Downtown. By encouraging infill development and
forming better linkages to the University District in par-
Strategic location
Spokane is the regional hub of the Inland Northwest and
is the largest city between Seattle and Minneapolis/St.
Paul. Visitors to Spokane can also take advantage of Spo-
kane’s proximity to the Rockies.
downtown Regional Retail Center & River Park
Square
Major retailers have demonstrated a clear commitment to
Downtown. River Park Square and national retailers such
as Macy’s, Nordstrom, Banana Republic, Williams So-
noma, Ann Taylor, Restoration Hardware, Pottery Barn,
and Talbots are major assets.
Sense of History and Place
With its historic buildings and unique setting along the
Spokane Falls, Downtown Spokane possesses great char-
acter and a strong sense of place.
universities and Research opportunities
Continued excellence in research and education will es-
tablish Spokane as a respected academic center and de-
sirable location for high-tech business. The proximity of
Gonzaga University as well as Eastern Washington Uni-
versity Spokane and Washington State University Spokane
on the Riverpoint Campus to Downtown is beneficial for
all parties.
The renovated Davenport Hotel has become its own destina-tion within Downtown and helps tie the Davenport District
to the commercial core.
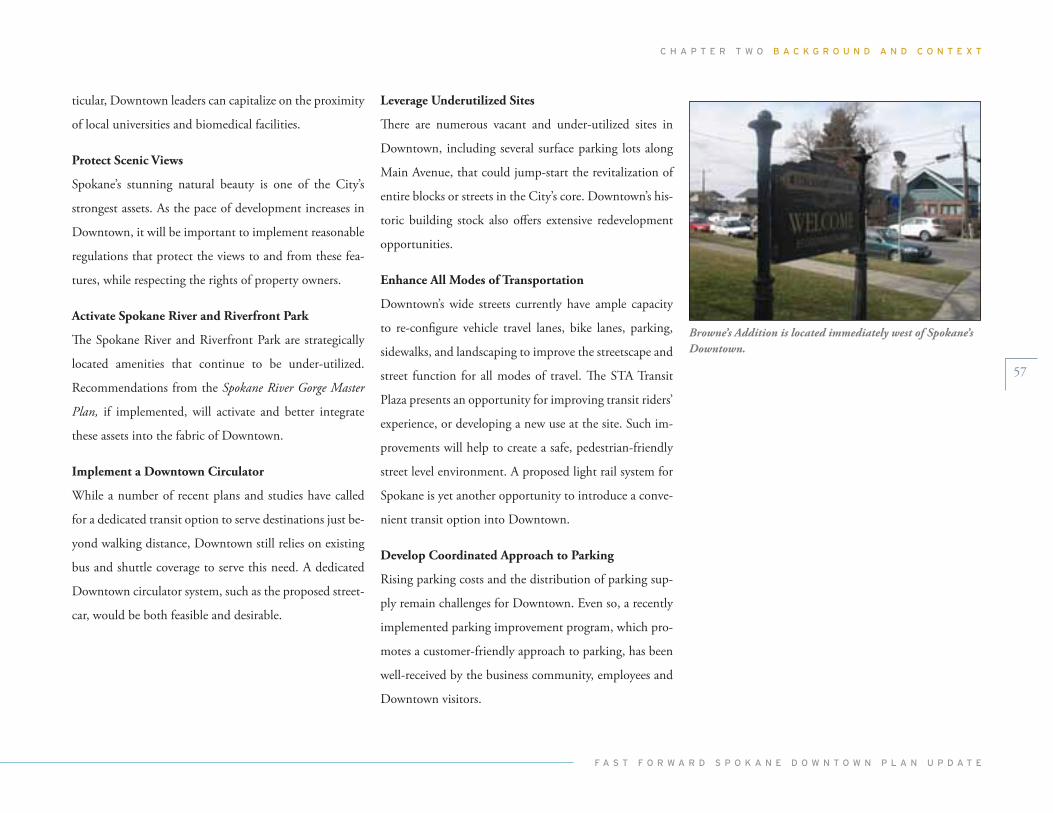
C h A p T E R T w O B A C K G R O U N D A N D C O N T E X T
f A s T f O R w A R D s p O K A N E D O w N T O w N p l A N U p D A T E
57
ticular, Downtown leaders can capitalize on the proximity
of local universities and biomedical facilities.
Protect Scenic views
Spokane’s stunning natural beauty is one of the City’s
strongest assets. As the pace of development increases in
Downtown, it will be important to implement reasonable
regulations that protect the views to and from these fea-
tures, while respecting the rights of property owners.
Activate Spokane River and Riverfront Park
The Spokane River and Riverfront Park are strategically
located amenities that continue to be under-utilized.
Recommendations from the Spokane River Gorge Master
Plan, if implemented, will activate and better integrate
these assets into the fabric of Downtown.
Implement a downtown Circulator
While a number of recent plans and studies have called
for a dedicated transit option to serve destinations just be-
yond walking distance, Downtown still relies on existing
bus and shuttle coverage to serve this need. A dedicated
Downtown circulator system, such as the proposed street-
car, would be both feasible and desirable.
leverage underutilized Sites
There are numerous vacant and under-utilized sites in
Downtown, including several surface parking lots along
Main Avenue, that could jump-start the revitalization of
entire blocks or streets in the City’s core. Downtown’s his-
toric building stock also offers extensive redevelopment
opportunities.
Enhance All modes of Transportation
Downtown’s wide streets currently have ample capacity
to re-configure vehicle travel lanes, bike lanes, parking,
sidewalks, and landscaping to improve the streetscape and
street function for all modes of travel. The STA Transit
Plaza presents an opportunity for improving transit riders’
experience, or developing a new use at the site. Such im-
provements will help to create a safe, pedestrian-friendly
street level environment. A proposed light rail system for
Spokane is yet another opportunity to introduce a conve-
nient transit option into Downtown.
develop Coordinated Approach to Parking
Rising parking costs and the distribution of parking sup-
ply remain challenges for Downtown. Even so, a recently
implemented parking improvement program, which pro-
motes a customer-friendly approach to parking, has been
well-received by the business community, employees and
Downtown visitors.
Browne’s Addition is located immediately west of Spokane’s Downtown.