Embed Size (px)
Citation preview
2
69
Equations and Inequalities in One Variable
Chapter Outline2.1 Linear Equations in
One Variable
2.2 Formulas
2.3 Applications
2.4 Linear Inequalities in One Variable
2.5 Equations with Absolute Value
2.6 Inequalities Involving Absolute Value
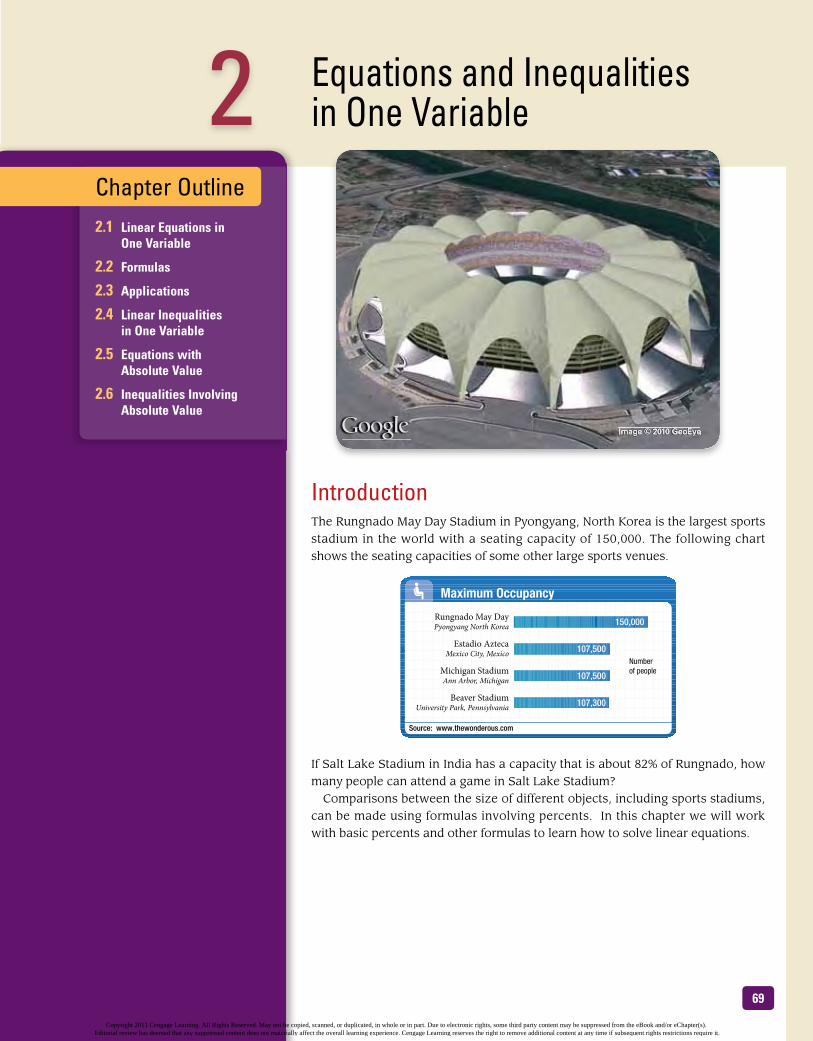
IntroductionThe Rungnado May Day Stadium in Pyongyang, North Korea is the largest sports stadium in the world with a seating capacity of 150,000. The following chart shows the seating capacities of some other large sports venues.
If Salt Lake Stadium in India has a capacity that is about 82% of Rungnado, how many people can attend a game in Salt Lake Stadium?
Comparisons between the size of different objects, including sports stadiums, can be made using formulas involving percents. In this chapter we will work with basic percents and other formulas to learn how to solve linear equations.
Source: www.thewonderous.com
Maximum Occupancy
Rungnado May DayPyongyang North Korea 150,000
Estadio AztecaMexico City, Mexico 107,500
Michigan StadiumAnn Arbor, Michigan 107,500
Beaver StadiumUniversity Park, Pennsylvania 107,300
Numberof people
Image © 2010 GeoEyeImage © 2010 GeoEye
Copyright 2011 Cengage Learning. All Rights Reserved. May not be copied, scanned, or duplicated, in whole or in part. Due to electronic rights, some third party content may be suppressed from the eBook and/or eChapter(s). Editorial review has deemed that any suppressed content does not materially affect the overall learning experience. Cengage Learning reserves the right to remove additional content at any time if subsequent rights restrictions require it.
Chapter 2 Equations and Inequalities in One Variable70
Getting Ready for Chapter 2
Simplify each expression.
1. −6 2 _ 3 2. −24 3 _
8 3. 4 _
3 (−9) 4. 2 _
3 −
21 _
16
5. − 3 _
8 + −
1 _
2 6. −
7 _
8 + 1 _
2 7. 1 _
2 (2x) 8. 4 _
3 3 _
4 x
9. 24 2 _ 3 x 10. 24 2 _
3 x + 1 _
2 11. 100(0.05x) 12. 0.06x + 0.05(10,000 − x)
13. 3(2y − 1) + y 14. 8 − 3(4x − 2) + 5x
15. Find the value of 2x − 1 when x is:
a. 2 b. 3 c. 5
16. Find the value of 1 _
x + 1 when x is:
a. 1 b. 2 c. 3
Translate into symbols.
17. Three less than twice a number 18. Ten less than four times a number
19. The sum of x and y is 180. 20. The sum of a and b is 90.
2.1 Linear Equations in One Variable Solve a linear equation in one variable. A
2.2 Formulas Solve a formula with numerical replacements for all but
one of its variables. Solve formulas for the indicated variable. Solve basic percent problems by translating them into
equations.
A
B C
2.3 Applications Apply the Blueprint for Problem Solving to a variety of
application problems. Use a formula to construct a table of paired data.
A
B
2.4 Linear Inequalities in One Variable Solve a linear inequality in one variable and graph the
solution set. Write solutions to inequalities using interval notation. Solve a compound inequality and graph the solution set.
Solve application problems using inequalities.
A
B C D
2.5 Equations with Absolute Value Solve equations with absolute value symbols. A
2.6 Inequalities Involving Absolute Value Solve inequalities with absolute value and graph the
solution set. A
Chapter Outline
Copyright 2011 Cengage Learning. All Rights Reserved. May not be copied, scanned, or duplicated, in whole or in part. Due to electronic rights, some third party content may be suppressed from the eBook and/or eChapter(s). Editorial review has deemed that any suppressed content does not materially affect the overall learning experience. Cengage Learning reserves the right to remove additional content at any time if subsequent rights restrictions require it.

71
OBjECtIVEs
Solve a linear equation in one variable. A
2.1 Linear Equations in One Variable
2.1 Linear Equations in One Variable
tICkEt tO suCCEssKeep these questions in mind as you read through the section. Then respond in your own words and in complete sentences.
1. What are equivalent equations?
2. What is the addition property of equality?
3. What is the multiplication property of equality?
4. Briefly explain the strategy for solving linear equations in one variable.
The population density of a state is calculated by using the number of people in the state compared to the area of the state. If the population of Massachusetts is 6,497,967 and the population density is 828.82 people per square mile, how many square miles does Massachusetts cover? In this section, we will begin our work with linear equations to solve problems like this one.
A Solving Linear EquationsA linear equation in one variable is any equation that can be put in the form
ax + b = c
where a, b, and c are constants and a ≠ 0. For example, each of the equations
5x + 3 = 2 2x = 7 2x + 5 = 0
is linear because they can be put in the form ax + b = c. In the first equation, 5x, 3, and 2 are called terms of the equation: 5x is a variable term; 3 and 2 are constant terms.
Furthermore, we can find a solution for the equation by substituting a number for the variable.
Imag
e cop
yrigh
t ©Ad
isa, 2
009.
Used
unde
r lice
nse f
rom
Shut
terst
ock.c
om
DefinitionThe solution set for an equation is the set of all numbers that when used in place of the variable make the equation a true statement.
Copyright 2011 Cengage Learning. All Rights Reserved. May not be copied, scanned, or duplicated, in whole or in part. Due to electronic rights, some third party content may be suppressed from the eBook and/or eChapter(s). Editorial review has deemed that any suppressed content does not materially affect the overall learning experience. Cengage Learning reserves the right to remove additional content at any time if subsequent rights restrictions require it.
Chapter 2 Equations and Inequalities in One Variable72
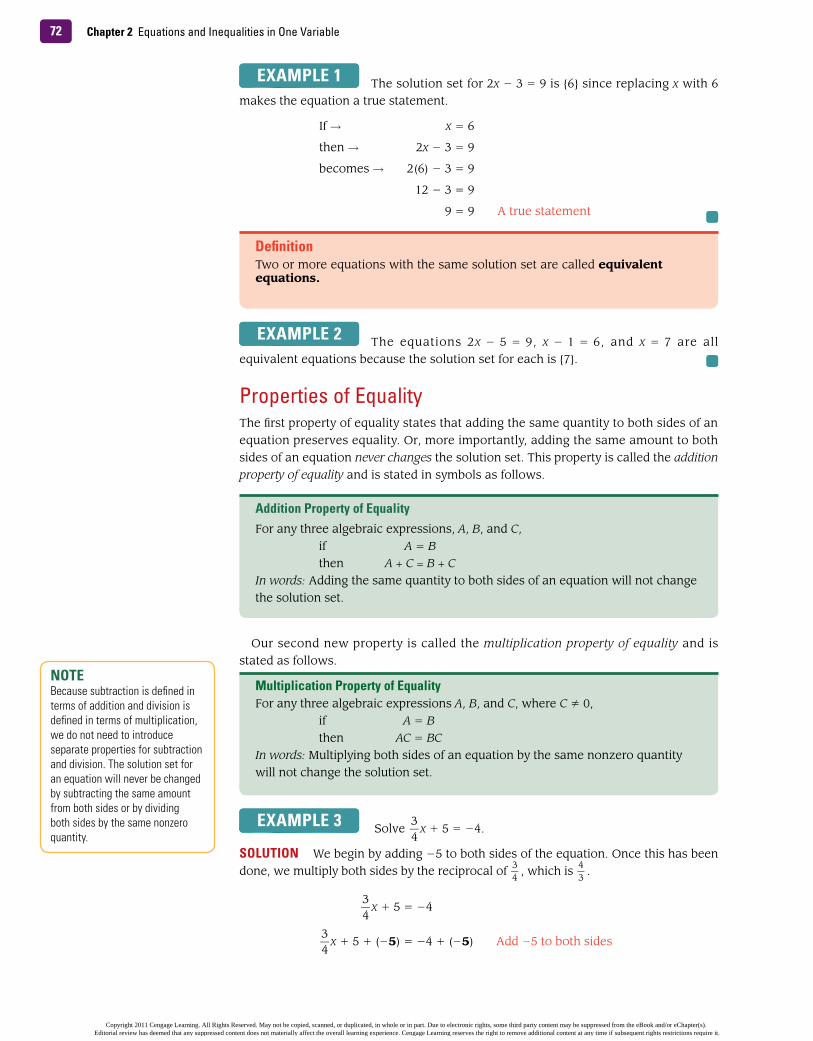
ExAmpLE 1 The solution set for 2x − 3 = 9 is {6} since replacing x with 6 makes the equation a true statement.
If → x = 6
then → 2x − 3 = 9
becomes → 2(6) − 3 = 9
12 − 3 = 9
9 = 9 A true statement
ExAmpLE 2 The equations 2x − 5 = 9, x − 1 = 6, and x = 7 are all equivalent equations because the solution set for each is {7}.
Properties of EqualityThe first property of equality states that adding the same quantity to both sides of an equation preserves equality. Or, more importantly, adding the same amount to both sides of an equation never changes the solution set. This property is called the addition property of equality and is stated in symbols as follows.
Our second new property is called the multiplication property of equality and is stated as follows.
ExAmpLE 3 Solve 3 _ 4
x + 5 = −4.
sOLutIOn We begin by adding −5 to both sides of the equation. Once this has been done, we multiply both sides by the reciprocal of 3 _
4 , which is 4 _
3 .
3 _ 4
x + 5 = −4
3 _ 4
x + 5 + (−5) = −4 + (−5) Add −5 to both sides
DefinitionTwo or more equations with the same solution set are called equivalent equations.
Addition property of EqualityFor any three algebraic expressions, A, B, and C,
if A = Bthen A + C = B + C
In words: Adding the same quantity to both sides of an equation will not change the solution set.
multiplication property of Equality For any three algebraic expressions A, B, and C, where C ≠ 0,
if A = Bthen AC = BC
In words: Multiplying both sides of an equation by the same nonzero quantity will not change the solution set.
nOtEBecause subtraction is defined in terms of addition and division is defined in terms of multiplication, we do not need to introduce separate properties for subtraction and division. The solution set for an equation will never be changed by subtracting the same amount from both sides or by dividing both sides by the same nonzero quantity.
Copyright 2011 Cengage Learning. All Rights Reserved. May not be copied, scanned, or duplicated, in whole or in part. Due to electronic rights, some third party content may be suppressed from the eBook and/or eChapter(s). Editorial review has deemed that any suppressed content does not materially affect the overall learning experience. Cengage Learning reserves the right to remove additional content at any time if subsequent rights restrictions require it.

732.1 Linear Equations in One Variable
3 _ 4
x = −9
4
_ 3
3 _ 4
x = 4 _ 3
(−9) Multiply both sides by 4 _ 3
x = −12 4 _ 3 (−9) = 4 _
3 − 9 _
1 = − 36
_ 3 = −12
ExAmpLE 4 Find the solution set for 3a − 5 = −6a + 1.
sOLutIOn To solve for a we must isolate it on one side of the equation. Let’s decide to isolate a on the left side by adding 6a to both sides of the equation.
3a − 5 = −6a + 1
3a + 6a − 5 = −6a + 6a + 1 Add 6a to both sides
9a − 5 = 1
9a − 5 + 5 = 1 + 5 Add 5 to both sides
9a = 6
1 _ 9
(9a) = 1 _ 9
(6) Multiply both sides by 1 _ 9
a = 2 _ 3
1 _ 9 (6) = 6 _
9 = 2 _
3
The solution set is 2 _ 3
.We can check our solution in Example 4 by replacing a in the original equation
with 2 _ 3 .
When → a = 2 _ 3
the equation → 3a − 5 = −6a + 1
becomes → 3 2 _ 3
− 5 = −6 2 _ 3
+ 1
2 − 5 = −4 + 1
−3 = −3 A true statement
There will be times when we solve equations and end up with a negative sign in front of the variable. The next example shows how to handle this situation.
ExAmpLE 5 Solve each equation.a. −x = 4 b. −y = −8
sOLutIOn Neither equation can be considered solved because of the negative sign in front of the variable. To eliminate the negative signs, we simply multiply both sides of each equation by −1.
a. −x = 4 b. −y = −8
−1(−x) = −1(4) −1(−y) = −1(−8) Multiply each side by −1
x = −4 y = 8
ExAmpLE 6 Solve 2 _ 3
x + 1 _ 2
= − 3
_ 8
.
sOLutIOn We can solve this equation by applying our properties and working with fractions, or we can begin by eliminating the fractions. Let’s use both methods.
nOtEFrom the previous chapter, we know that multiplication by a number and division by its reciprocal always produce the same result. Because of this fact, instead of multiplying each side of our equation by 1 _ 9 , we could just as easily divide each side by 9. If we did so, the last two lines in our solution would look like this:
9a _
9 = 6 _
9
a = 2 _ 3
Copyright 2011 Cengage Learning. All Rights Reserved. May not be copied, scanned, or duplicated, in whole or in part. Due to electronic rights, some third party content may be suppressed from the eBook and/or eChapter(s). Editorial review has deemed that any suppressed content does not materially affect the overall learning experience. Cengage Learning reserves the right to remove additional content at any time if subsequent rights restrictions require it.
Chapter 2 Equations and Inequalities in One Variable74
mEthOD 1 Working with the fractions.
2 _ 3
x + 1 _ 2
+ − 1 _
2 = −
3 _
8 + −
1 _
2 Add − 1 _
2 to each side
2 _ 3
x = − 7
_ 8
− 3 _ 8 + − 1 _
2 = − 3 _
8 + − 4 _
8
3 _ 2
2 _ 3
x = 3 _ 2
− 7
_ 8
Multiply each side by 3 _ 2
x = − 21
_ 16
mEthOD 2 Eliminating the fractions in the beginning.Our original equation has denominators of 3, 2, and 8. The least common denominator, abbreviated LCD, for these three denominators is 24, and it has the property that all three denominators will divide it evenly. If we multiply both sides of our equation by 24, each denominator will divide into 24, and we will be left with an equation that does not contain any denominators other than 1.
24 2 _ 3
x + 1 _ 2
= 24 − 3
_ 8
Multiply each side by the LCD 24
24 2 _ 3
x + 24 1 _ 2
= 24 − 3
_ 8
Distributive property on the left side
16x + 12 = −9 Multiply
16x = −21 Add −12 to each side
x = − 21
_ 16
Multiply each side by 1 _ 16
ChECk To check our solution, we substitute x = − 21 _
16 back into our original equation
to obtain
2 _ 3
− 21
_ 16
+ 1 _ 2
≟ − 3
_ 8
− 7
_ 8
+ 1 _ 2
≟ − 3
_ 8
− 7
_ 8
+ 4 _ 8
≟ − 3
_ 8
− 3
_ 8
= − 3
_ 8
A true statement
ExAmpLE 7 Solve the equation 0.06x + 0.05(10,000 − x) = 560.
sOLutIOn We can solve the equation in its original form by working with the decimals, or we can eliminate the decimals first by using the multiplication property of equality and solve the resulting equation. Here are both methods.
mEthOD 1 Working with the decimals.
0.06x + 0.05(10,000 − x) = 560 Original equation
0.06x + 0.05(10,000) − 0.05x = 560 Distributive property
0.01x + 500 = 560 Simplify the left side
0.01x + 500 + (−500) = 560 + (−500) Add −500 to each side
0.01x = 60
nOtEWe are placing a question mark over the equal sign because we don’t know yet if the expression on the left will be equal to the expression on the right.
Copyright 2011 Cengage Learning. All Rights Reserved. May not be copied, scanned, or duplicated, in whole or in part. Due to electronic rights, some third party content may be suppressed from the eBook and/or eChapter(s). Editorial review has deemed that any suppressed content does not materially affect the overall learning experience. Cengage Learning reserves the right to remove additional content at any time if subsequent rights restrictions require it.

752.1 Linear Equations in One Variable
0.01x _
0.01 = 60
_ 0.01
Divide each side by 0.01
x = 6,000
mEthOD 2 Eliminating the decimals in the beginning: To move the decimal point two places to the right in 0.06x and 0.05, we multiply each side of the equation by 100.
0.06x + 0.05(10,000 − x) = 560 Original equation
0.06x + 500 − 0.05x = 560 Distributive property
100(0.06x) + 100(500) − 100(0.05x) = 100(560) Multiply each side by 100 6x + 50,000 − 5x = 56,000
x + 50,000 = 56,000 Simplify the left side
x = 6,000 Add −50,000 to each side
Using either method, the solution to our equation is 6,000.
ChECk We check our work (to be sure we have not made a mistake in applying the properties or in arithmetic) by substituting 6,000 into our original equation and simplifying each side of the result separately, as the following shows.
0.06(6,000) + 0.05(10,000 − 6,000) ≟ 560
0.06(6,000) + 0.05(4,000) ≟ 560
360 + 200 ≟ 560
560 = 560 A true statement
Here is a list of steps to use as a guideline for solving linear equations in one variable.
As you will see as you work through the problems in the problem set, it is not always necessary to use all four steps when solving equations. The number of steps used depends on the equation. In Example 8, there are no fractions or decimals in the original equation, so Step 1b will not be used.
strategy Solving Linear Equations in One Variable
step 1: a. Use the distributive property to separate terms, if necessary.
b. If fractions are present, consider multiplying both sides by the LCD to eliminate the fractions. If decimals are present, consider multiplying both sides by a power of 10 to clear the equation of decimals.
c. Combine similar terms on each side of the equation.
step 2: Use the addition property of equality to get all variable terms on one side of the equation and all constant terms on the other side. A variable term is a term that contains the variable. A constant term is a term that does not contain the variable (the number 3, for example).
step 3: Use the multiplication property of equality to get the variable by itself on one side of the equation.
step 4: Check your solution in the original equation to be sure that you have not made a mistake in the solution process.
Copyright 2011 Cengage Learning. All Rights Reserved. May not be copied, scanned, or duplicated, in whole or in part. Due to electronic rights, some third party content may be suppressed from the eBook and/or eChapter(s). Editorial review has deemed that any suppressed content does not materially affect the overall learning experience. Cengage Learning reserves the right to remove additional content at any time if subsequent rights restrictions require it.
Chapter 2 Equations and Inequalities in One Variable76
ExAmpLE 8 Solve 3(2y − 1) + y = 5y + 3.
sOLutIOn Applying the steps outlined in the preceding strategy, we haveStep 1: a. 3(2y − 1) + y = 5y + 3 Original equation
6y − 3 + y = 5y + 3 Distributive property
c. 7y − 3 = 5y + 3 Simplify
Step 2: 7y + (−5y) − 3 = 5y + (−5y) + 3 Add −5y to both sides
2y − 3 = 3
2y − 3 + 3 = 3 + 3 Add 3 to both sides
2y = 6
Step 3: 1 _ 2
(2y) = 1 _ 2
(6) Multiply by 1 _ 2
y = 3
Step 4: When → y = 3
the equation → 3(2y − 1) + y = 5y + 3
becomes → 3(2 ⋅ 3 − 1) + 3 ≟ 5 ⋅ 3 + 3
3(5) + 3 ≟ 15 + 3
18 = 18 A true statement
ExAmpLE 9 Solve the equation 8 − 3(4x − 2) + 5x = 35.
sOLutIOn We must begin by distributing the −3 across the quantity 4x − 2.Step 1: a. 8 − 3(4x − 2) + 5x = 35 Original equation
8 − 12x + 6 + 5x = 35 Distributive property
c. −7x + 14 = 35 Simplify
Step 2: −7x = 21 Add −14 to each side
Step 3: x = −3 Multiply by − 1 _ 7
Step 4: When x is replaced by −3 in the original equation, a true statement results. Therefore, −3 is the solution to our equation.
Identities and Equations with No SolutionTwo special cases are associated with solving linear equations in one variable, each of which is illustrated in the following examples.
ExAmpLE 10 Solve 2(3x − 4) = 3 + 6x for x.
sOLutIOn Applying the distributive property to the left side gives us
6x − 8 = 3 + 6x Distributive property
Now, if we add −6x to each side, we are left with the following
−8 = 3
which is a false statement. This means that there is no solution to our equation. Any number we substitute for x in the original equation will lead to a similar false statement.
88n
88n
nOtEIt would be a mistake to subtract 3 from 8 first because the rule for order of operations indicates we are to do multiplication before subtraction.
88n
88n
Copyright 2011 Cengage Learning. All Rights Reserved. May not be copied, scanned, or duplicated, in whole or in part. Due to electronic rights, some third party content may be suppressed from the eBook and/or eChapter(s). Editorial review has deemed that any suppressed content does not materially affect the overall learning experience. Cengage Learning reserves the right to remove additional content at any time if subsequent rights restrictions require it.

2.1 Problem Set 77
A Solve each of the following equations. [Examples 1–11]
1. x − 5 = 3 2. x + 2 = 7
3. 2x − 4 = 6 4. 3x − 5 = 4
5. 7 = 4a − 1 6. 10 = 3a − 5
7. 3 − y = 10 8. 5 − 2y = 11
9. −3 − 4x = 15 10. −8 − 5x = −6
11. −3 = 5 + 2x 12. −12 = 6 + 9x
13. −300y + 100 = 500
14. −20y + 80 = 30
15. 160 = −50x − 40 16. 110 = −60x − 50
17. −x = 2 18. −x = 1 _ 2
19. −a = − 3 _
4 20. −a = −5
21. 2 _
3 x = 8 22.
3 _
2 x = 9
23. − 3 _
5 a + 2 = 8 24. −
5 _
3 a + 3 = 23
25. 8 = 6 + 2 _ 7 y 26. 1 = 4 + 3 _
7 y
27. 2x − 5 = 3x + 2 28. 5x − 1 = 4x + 3
29. −3a + 2 = −2a − 1 30. −4a − 8 = −3a + 7
31. 5 − 2x = 3x + 1
32. 7 − 3x = 8x − 4
33. 11x − 5 + 4x − 2 = 8x
34. 2x + 7 − 3x + 4 = −2x
35. 6 − 7(m − 3) = −1
36. 3 − 5(2m − 5) = −2
37. 7 + 3(x + 2) = 4(x − 1)
38. 5 + 2(4x − 4) = 3(2x − 1)
39. 5 = 7 − 2(3x − 1) + 4x
40. 20 = 8 − 5(2x − 3) + 4x
41. 1
_ 2
x + 1 _ 4
= 1 _ 3
x + 5 _ 4
42. 2
_ 3
x − 3 _ 4
= 1 _ 6
x + 21 _
4
43. − 2
_ 5
x + 2 _ 15
= 2 _ 3
44. − 1 _
6 x + 2 _
3 = 1 _
4
45. 3
_ 4
(8x − 4) = 2 _ 3
(6x − 9)
46. 3
_ 5
(5x + 10) = 5 _ 6
(12x − 18)
ExAmpLE 11 Solve −15 + 3x = 3(x − 5) for x.
sOLutIOn We start by applying the distributive property to the right side.
−15 + 3x = 3x − 15 Distributive property
If we add −3x to each side, we are left with the true statement
−15 = −15
In this case, our result tells us that any number we use in place of x in the original equation will lead to a true statement. Therefore, all real numbers are solutions to our equation. We say the original equation is an identity because the left side is always identically equal to the right side.
problem set 2.1
“One of the greatest discoveries a man makes, one of his great surprises, is to find he can do what he was afraid he couldn't do.”
—Henry Ford, 1863–1947, American industrialist and founder of Ford Motor Company
1. What was the most important study skill you used while working through Chapter 1?
2. Why should you continue to place an importance on study skills as you work through Chapter 2?
moving toward success
Copyright 2011 Cengage Learning. All Rights Reserved. May not be copied, scanned, or duplicated, in whole or in part. Due to electronic rights, some third party content may be suppressed from the eBook and/or eChapter(s). Editorial review has deemed that any suppressed content does not materially affect the overall learning experience. Cengage Learning reserves the right to remove additional content at any time if subsequent rights restrictions require it.
Chapter 2 Equations and Inequalities in One Variable78
47. 1 _ 4
(12a + 1) − 1 _ 4 = 5
48. 2
_ 3
(6x − 1) + 2 _ 3 = 4
49. 0.35x − 0.2 = 0.15x + 0.1
50. 0.25x − 0.05 = 0.2x + 0.15
51. 0.42 − 0.18x = 0.48x − 0.24
52. 0.3 − 0.12x = 0.18x + 0.06
A Solve each equation, if possible. [Examples 10–11]
53. 3x − 6 = 3(x + 4)
54. 7x − 14 = 7(x − 2)
55. 4y + 2 − 3y + 5 = 3 + y + 4
56. 7y + 5 − 2y − 3 = 6 + 5y − 4
57. 2(4t − 1) + 3 = 5t + 4 + 3t
58. 5(2t − 1) + 1 = 2t − 4 + 8t
Now that you have practiced solving a variety of equations, we can turn our attention to the types of equations you will see as you progress through the book. Each equation appears later in the book exactly as you see it below.
Solve each equation.
59. 3x + 2 = 0 60. 5x − 4 = 0
61. 0 = 6,400a + 70 62. 0 = 6,400a + 60
63. x + 2 = 2x 64. x + 2 = 7x
65. 0.07x = 1.4 66. 0.02x = 0.3
67. 5(2x + 1) = 12 68. 4(3x − 2) = 21
69. 50 = K _ 48
70. 50 = K _ 24
71. 100P = 2,400 72. 3.5d = 16(3.5)2
73. x + (3x + 2) = 26 74. 2(1) + y = 4
75. 2x − 3(3x − 5) = −6
76. 2(2y + 6) + 3y = 5
77. 2(2x − 3) + 2x = 45
78. 2(4x − 10) + 2x = 12.5
79. 3x + (x − 2) ∙ 2 = 6
80. 2x − (x + 1) = −1
81. 15 − 3(x − 1) = x − 2
82. 4x − 4(x − 3) = x + 3
83. 2(x + 3) + x = 4(x − 3)
84. 5(y + 2) − 4(y + 1) = 3
85. 6(y − 3) − 5(y + 2) = 8
86. 2(x + 3) + 3(x + 5) = 2x
87. 2(20 + x) = 3(20 − x)
88. 6(7 + x) = 5(9 + x)
89. 2x + 1.5(75 − x) =127.5
90. x + 0.06x = 954
91. 0.08x + 0.09(9,000 − x) = 750
92. 0.08x + 0.09(9,000 − x) = 500
93. 0.12x + 0.10(15,000 − x) = 1,600
94. 0.09x + 0.11(11,000 − x) = 1,150
95. 5 19 _
15 + 5y = 9
96. 4 19 _
15 − 2y = 4
97. 2 29 _
22 − 3y = 4
98. 2x − 3 − 5 _
11 = 4
99. Work each problem according to the instructions given:
a. Solve: 8x − 5 = 0
b. Solve: 8x − 5 = −5
c. Add: (8x − 5) + (2x − 5) d. Solve: 8x − 5 = 2x − 5
e. Multiply: 8(x − 5)
f. Solve: 8(x − 5) = 2(x − 5)
100. Work each problem according to the instructions given:
a. Solve: 3x + 6 = 0
b. Solve: 3x + 6 = 4
c. Add: (3x + 6) + (7x + 4)
d. Solve: 3x + 6 = 7x + 4
e. Multiply: 3(x + 5)
f. Solve: 3(x + 6) = 7(x + 2)
Copyright 2011 Cengage Learning. All Rights Reserved. May not be copied, scanned, or duplicated, in whole or in part. Due to electronic rights, some third party content may be suppressed from the eBook and/or eChapter(s). Editorial review has deemed that any suppressed content does not materially affect the overall learning experience. Cengage Learning reserves the right to remove additional content at any time if subsequent rights restrictions require it.
2.1 Problem Set 79
Applying the Concepts
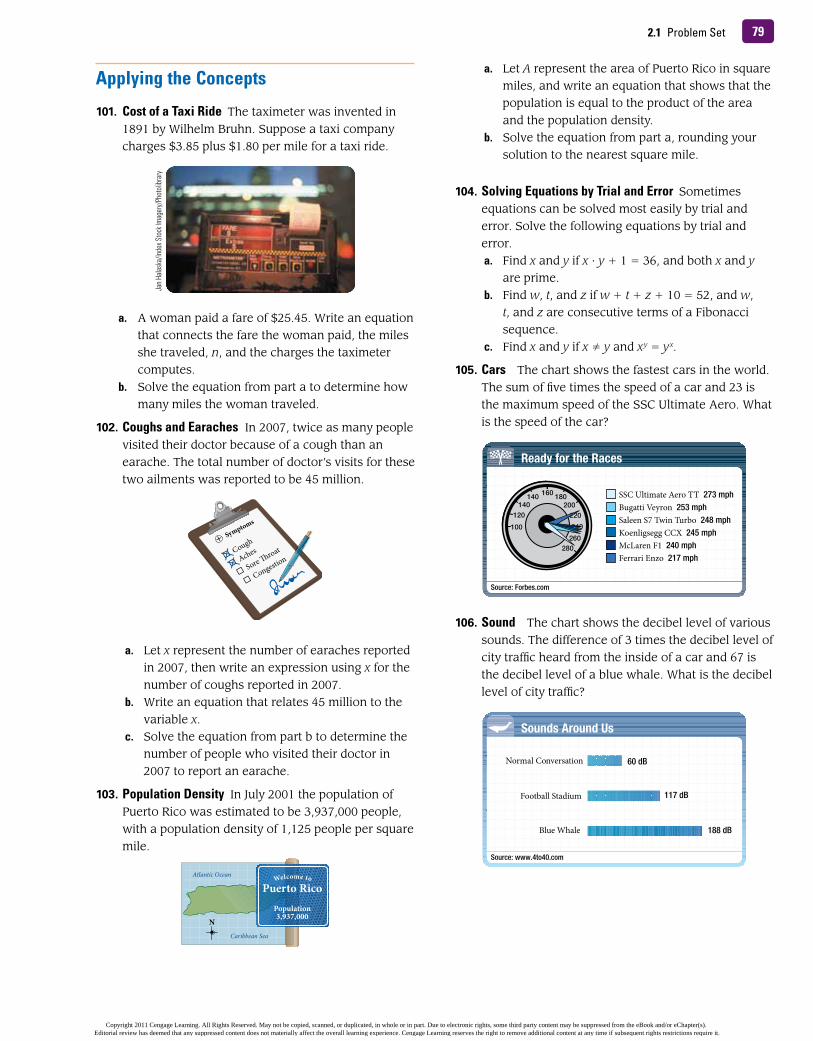
101. Cost of a taxi Ride The taximeter was invented in 1891 by Wilhelm Bruhn. Suppose a taxi company charges $3.85 plus $1.80 per mile for a taxi ride.
a. A woman paid a fare of $25.45. Write an equation that connects the fare the woman paid, the miles she traveled, n, and the charges the taximeter computes.
b. Solve the equation from part a to determine how many miles the woman traveled.
102. Coughs and Earaches In 2007, twice as many people visited their doctor because of a cough than an earache. The total number of doctor’s visits for these two ailments was reported to be 45 million.
a. Let x represent the number of earaches reported in 2007, then write an expression using x for the number of coughs reported in 2007.
b. Write an equation that relates 45 million to the variable x.
c. Solve the equation from part b to determine the number of people who visited their doctor in 2007 to report an earache.
103. population Density In July 2001 the population of Puerto Rico was estimated to be 3,937,000 people, with a population density of 1,125 people per square mile.
Jan H
alask
a/Ind
ex S
tock
Imag
ery/
Phot
olibr
ary
N
Puerto RicoPopulation3,937,000
Welcome toAtlantic Ocean
Caribbean Sea
a. Let A represent the area of Puerto Rico in square miles, and write an equation that shows that the population is equal to the product of the area and the population density.
b. Solve the equation from part a, rounding your solution to the nearest square mile.
104. solving Equations by trial and Error Sometimes equations can be solved most easily by trial and error. Solve the following equations by trial and error.
a. Find x and y if x ⋅ y + 1 = 36, and both x and y are prime.
b. Find w, t, and z if w + t + z + 10 = 52, and w, t, and z are consecutive terms of a Fibonacci sequence.
c. Find x and y if x ≠ y and x y = y x.
105. Cars The chart shows the fastest cars in the world. The sum of five times the speed of a car and 23 is the maximum speed of the SSC Ultimate Aero. What is the speed of the car?
106. sound The chart shows the decibel level of various sounds. The difference of 3 times the decibel level of city traffic heard from the inside of a car and 67 is the decibel level of a blue whale. What is the decibel level of city traffic?
Source: Forbes.com
Ready for the Races
SSC Ultimate Aero TT 273 mphBugatti Veyron 253 mphSaleen S7 Twin Turbo 248 mphKoenligsegg CCX 245 mphMcLaren F1 240 mphFerrari Enzo 217 mph
Source: www.4to40.com
Sounds Around Us
Normal Conversation 60 dB
Football Stadium 117 dB
Blue Whale 188 dB
Copyright 2011 Cengage Learning. All Rights Reserved. May not be copied, scanned, or duplicated, in whole or in part. Due to electronic rights, some third party content may be suppressed from the eBook and/or eChapter(s). Editorial review has deemed that any suppressed content does not materially affect the overall learning experience. Cengage Learning reserves the right to remove additional content at any time if subsequent rights restrictions require it.
Chapter 2 Equations and Inequalities in One Variable80
maintaining Your skills
From this point on, each problem set will contain a number of problems under the heading Maintaining Your Skills. These problems cover the most important skills you have learned in previous sections and chapters. By working these problems regularly, you will keep yourself current on all the topics we have covered and, possibly, need less time to study for tests and quizzes.
Identify the property (or properties) that justifies each of the following statements.
107. ax = xa
108. 5 1 _ 5 = 1
109. 3 + (x + y) = (3 + x) + y
110. 3 + (x + y) = (x + y) + 3
111. 3 + (x + y) = (3 + y) + x
112. 7(3x − 5) = 21x − 35
113. 5(1) = 5
114. 5 + 0 = 5
115. 4(xy) = 4(yx)
116. 4(xy) = (4y)x
117. 2 + 0 = 2
118. 2 + (−2) = 0
Simplify the following expressions.
119. 2x −3y + 5 + 5x − 7
120. 5x − 7 + 5y + 3 − 9y
121. 3(2y − 4) + 7 − 5y
122. 2(6x − 3) − 4x + 4
123. 7 − 4(x − 2) + 9
124. 3x − 5(x + 3) + 11
Getting Ready for the next section
Problems under the heading, Getting Ready for the Next Section, are problems that you must be able to work in order to understand the material in the next section. In this case, the problems below are variations on the types of problems you have already worked in this problem set. They are exactly the types of problems you will see in explanations and examples in the next section.
Solve each equation.
125. x ⋅ 42 = 21 126. x ⋅ 84 = 21
127. 25 = 0.4x 128. 35 = 0.4x
129. 12 − 4y = 12 130. −6 − 3y = 6
131. 525 = 900 − 300p
132. 375 = 900 − 300p
133. 486.7 = 78.5 + 31.4h
134. 486.7 = 113.0 + 37.7h
135. Find the value of 2x − 1 when x is: a. 2 b. 3 c. 5
136. Find the value of 1 _
x + 1 when x is:
a. 1 b. 2 c. 3
Extending the Concepts
137. x + 4 _
5 − x + 3
_ 3
= − 7 _
15
138. x + 1
_ 7
− x − 2 _
2 = 1 _
14
139. 1 _
x − 2 _
3 = 2 _
x
140. 1 _
x − 3 _
5 = 2 _
x
141. x + 3
_ 2 − x − 4
_ 4 = −
1 _
8
142. x − 3
_ 5
− x + 1 _
10 = − 1 _
10
143. x − 1
_ 2
− x + 2 _
3 = x + 3
_ 6
144. x + 2
_ 4
− x − 1 _
3 = x + 2
_ 6
Copyright 2011 Cengage Learning. All Rights Reserved. May not be copied, scanned, or duplicated, in whole or in part. Due to electronic rights, some third party content may be suppressed from the eBook and/or eChapter(s). Editorial review has deemed that any suppressed content does not materially affect the overall learning experience. Cengage Learning reserves the right to remove additional content at any time if subsequent rights restrictions require it.
812.2 Formulas
OBjECtIVEs
Solve a formula with numerical replacements for all but one of its variables.
B Solve formulas for the indicated variable.
Solve basic percent problems by translating them into equations.
A
C
2.2 Formulas
tICkEt tO suCCEssKeep these questions in mind as you read through the section. Then respond in your own words and in complete sentences.
1. What is a formula in mathematics?
2. How would you solve the formula 2x + 4y = 10 if x = 3?
3. Give two equivalent forms of the rate equation d = rt.
4. How would you find what percent of 36 is 27?
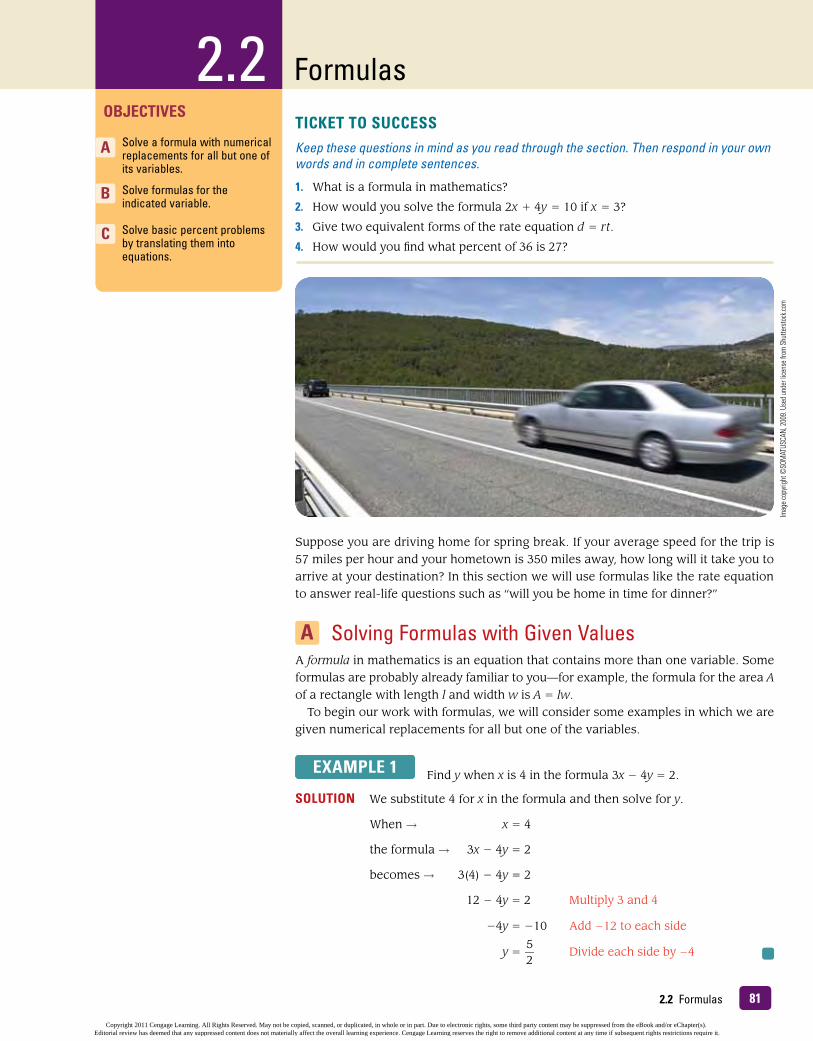
Suppose you are driving home for spring break. If your average speed for the trip is 57 miles per hour and your hometown is 350 miles away, how long will it take you to arrive at your destination? In this section we will use formulas like the rate equation to answer real-life questions such as “will you be home in time for dinner?”
A Solving Formulas with Given ValuesA formula in mathematics is an equation that contains more than one variable. Some formulas are probably already familiar to you—for example, the formula for the area Aof a rectangle with length l and width w is A = lw.
To begin our work with formulas, we will consider some examples in which we are given numerical replacements for all but one of the variables.
ExAmpLE 1 Find y when x is 4 in the formula 3x − 4y = 2.
sOLutIOn We substitute 4 for x in the formula and then solve for y.
When → x = 4
the formula → 3x − 4y = 2
becomes → 3(4) − 4y = 2
12 − 4y = 2 Multiply 3 and 4
−4y = −10 Add −12 to each side
y = 5 _
2 Divide each side by −4
Imag
e cop
yrigh
t ©SO
MAT
USCA
N, 20
09. U
sed u
nder
licen
se fr
om S
hutte
rstoc
k.com
Copyright 2011 Cengage Learning. All Rights Reserved. May not be copied, scanned, or duplicated, in whole or in part. Due to electronic rights, some third party content may be suppressed from the eBook and/or eChapter(s). Editorial review has deemed that any suppressed content does not materially affect the overall learning experience. Cengage Learning reserves the right to remove additional content at any time if subsequent rights restrictions require it.

Chapter 2 Equations and Inequalities in One Variable82
Note that in the last line of Example 1 we divided each side of the equation by −4. Remember that this is equivalent to multiplying each side of the equation by − 1 _
4 .
ExAmpLE 2 A store selling art supplies finds that they can sell x sketch pads each week at a price of p dollars each, according to the formula x = 900 − 300p. What price should they charge for each sketch pad if they want to sell 525 pads each week?
sOLutIOn Here we are given a formula, x = 900 − 300p, and asked to find the value of p if x is 525. To do so, we simply substitute 525 for x and solve for p.
When → x = 525
the formula → x = 900 − 300p
becomes → 525 = 900 − 300p
−375 = −300p Add −900 to each side
1.25 = p Divide each side by −300
To sell 525 sketch pads, the store should charge $1.25 for each pad.
ExAmpLE 3 A boat is traveling upstream against a current. If the speed of the boat in still water is r and the speed of the current is c, then the formula for the distance traveled by the boat is d = (r − c) ⋅ t, where t is the length of time. Find c if d = 52 miles, r = 16 miles per hour, and t = 4 hours.
sOLutIOn Substituting 52 for d, 16 for r, and 4 for t into the formula, we have
52 = (16 − c) ∙ 4
13 = 16 − c Divide each side by 4
−3 = −c Add −16 to each side
3 = c Divide each side by −1
The speed of the current is 3 miles per hour.
FACts FROm GEOmEtRY: Formulas for Area and perimeterTo review, here are the formulas for the area and perimeter of some common geometric objects.
The formula for perimeter gives us the distance around the outside of the object along its sides, whereas the formula for area gives us a measure of the amount of surface the object covers.
nOtEThe red line labeled h in the triangle is its height, or altitude. It extends from the top of the triangle down to the base, meeting the base at an angle of 90°. The altitude of a triangle is always perpendicular to the base. The small square shown where the altitude meets the base is used to indicate that the angle formed is 90°.
s
s
s
s
PerimeterArea
= 4s= s2
Square
w
l
l
w
PerimeterArea
= 2l + 2w= lw
Rectangle
h ca
b
PerimeterArea
= a + b + c= bh1
2
Triangle
Copyright 2011 Cengage Learning. All Rights Reserved. May not be copied, scanned, or duplicated, in whole or in part. Due to electronic rights, some third party content may be suppressed from the eBook and/or eChapter(s). Editorial review has deemed that any suppressed content does not materially affect the overall learning experience. Cengage Learning reserves the right to remove additional content at any time if subsequent rights restrictions require it.

832.2 Formulas
B Solving Formulas for an Indicated Variable
ExAmpLE 4 Given the formula P = 2w + 2l, solve for w.
sOLutIOn To solve for w, we must isolate it on one side of the equation. We can accomplish this if we delete the 2l term and the coefficient 2 from the right side of the equation.
To begin, we add −2l to both sides.
P + (−2l ) = 2w + 2l + (−2l )
P − 2l = 2w
To delete the 2 from the right side, we can multiply both sides by 1 _ 2 .
1 _ 2
(P − 2l ) = 1 _ 2
(2w)
P − 2l _
2 = w
The two formulas
P = 2w + 2l and w = P − 2l _
2
give the relationship between P, l, and w. They look different, but they both say the same thing about P, l, and w. The first formula gives P in terms of l and w, and the second formula gives w in terms of P and l.
Rate Equation and Average SpeedNow we will look at a problem that uses what is called the rate equation. You use this equation on an intuitive level when you are estimating how long it will take you to drive long distances. For example, if you drive at 50 miles per hour for 2 hours, you will travel 100 miles. Here is the rate equation:
Distance = rate ∙ time, or d = r ∙ t
The rate equation has two equivalent forms, one of which is obtained by solving for r, while the other is obtained by solving for t. Here they are:
r = d _ t and t = d _
r
The rate in this equation is also referred to as average speed.The average speed of a moving object is defined to be the ratio of distance to time.
If you drive your car for 5 hours and travel a distance of 200 miles, then your average rate of speed is
Average speed = 200 miles _
5 hours = 40 miles per hour
Our next example involves both the formula for the circumference of a circle and the rate equation.
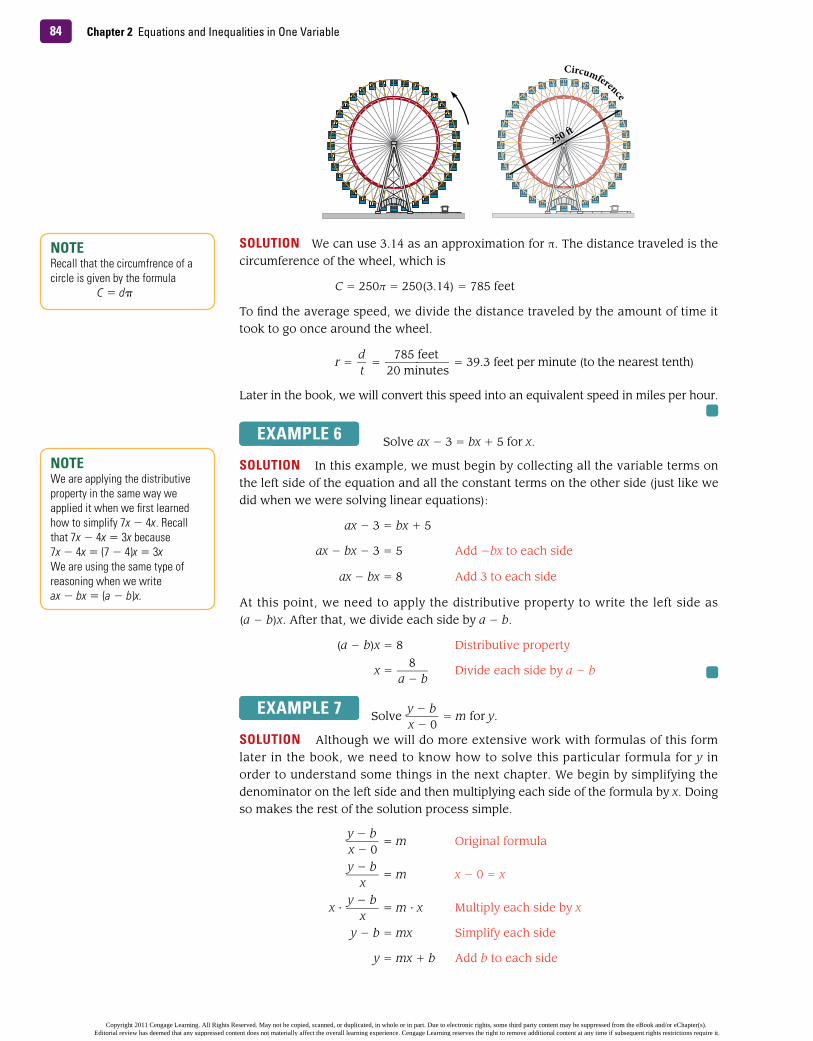
ExAmpLE 5 The first Ferris wheel was designed and built by George Ferris in 1893. The diameter of the wheel was 250 feet. It had 36 carriages, equally spaced around the wheel, each of which held a maximum of 40 people. One trip around the wheel took 20 minutes. Find the average speed of a rider on the first Ferris wheel.
Copyright 2011 Cengage Learning. All Rights Reserved. May not be copied, scanned, or duplicated, in whole or in part. Due to electronic rights, some third party content may be suppressed from the eBook and/or eChapter(s). Editorial review has deemed that any suppressed content does not materially affect the overall learning experience. Cengage Learning reserves the right to remove additional content at any time if subsequent rights restrictions require it.
Chapter 2 Equations and Inequalities in One Variable84
sOLutIOn We can use 3.14 as an approximation for π. The distance traveled is the circumference of the wheel, which is
C = 250π = 250(3.14) = 785 feet
To find the average speed, we divide the distance traveled by the amount of time it took to go once around the wheel.
r = d _ t = 785 feet
__ 20 minutes
= 39.3 feet per minute (to the nearest tenth)
Later in the book, we will convert this speed into an equivalent speed in miles per hour.
ExAmpLE 6 Solve ax − 3 = bx + 5 for x.
sOLutIOn In this example, we must begin by collecting all the variable terms on the left side of the equation and all the constant terms on the other side (just like we did when we were solving linear equations):
ax − 3 = bx + 5
ax − bx − 3 = 5 Add −bx to each side
ax − bx = 8 Add 3 to each side
At this point, we need to apply the distributive property to write the left side as (a − b)x. After that, we divide each side by a − b.
(a − b)x = 8 Distributive property
x = 8 _
a − b Divide each side by a − b
ExAmpLE 7 Solve y − b _
x − 0 = m for y.
sOLutIOn Although we will do more extensive work with formulas of this form later in the book, we need to know how to solve this particular formula for y in order to understand some things in the next chapter. We begin by simplifying the denominator on the left side and then multiplying each side of the formula by x. Doing so makes the rest of the solution process simple.
y − b _
x − 0 = m Original formula
y − b _
x = m x − 0 = x
x ⋅ y − b
_ x = m ⋅ x Multiply each side by x
y − b = mx Simplify each side
y = mx + b Add b to each side
250 �
Circumference
nOtERecall that the circumfrence of a circle is given by the formula C = dπ
nOtEWe are applying the distributive property in the same way we applied it when we first learned how to simplify 7x − 4x. Recall that 7x − 4x = 3x because7x − 4x = (7 − 4)x = 3xWe are using the same type of reasoning when we writeax − bx = (a − b)x.
Copyright 2011 Cengage Learning. All Rights Reserved. May not be copied, scanned, or duplicated, in whole or in part. Due to electronic rights, some third party content may be suppressed from the eBook and/or eChapter(s). Editorial review has deemed that any suppressed content does not materially affect the overall learning experience. Cengage Learning reserves the right to remove additional content at any time if subsequent rights restrictions require it.

852.2 Formulas
This is our solution. If we look back to the first step, we can justify our result on the left side of the equation this way: Dividing by x is equivalent to multiplying by its reciprocal 1 _
x . Here is what it looks like when written out completely:
x ⋅ y − b
_ x = x ⋅
1 _
x ⋅ ( y − b) = 1( y − b) = y − b
ExAmpLE 8 Solve y − 4
_ x − 5
= 3 for y.
sOLutIOn We proceed as we did in the previous example, but this time we clear the formula of fractions by multiplying each side of the formula by x − 5.
y − 4 _
x − 5 = 3 Original formula
(x − 5) ⋅ y − 4
_ x − 5
= 3 ⋅ (x − 5) Multiply each side by (x − 5)
y − 4 = 3x − 15 Simplify each side
y = 3x − 11 Add 4 to each side
We have solved for y. We can justify our result on the left side of the equation this way: Dividing by x − 5 is equivalent to multiplying by its reciprocal 1 _ x − 5 . Here are the details:
(x − 5) ⋅ y − 4
_ x − 5
= (x − 5) ⋅ 1 _
x − 5 ⋅ (y − 4) = 1( y − 4) = y − 4
C Basic Percent ProblemsThe next examples in this section review how basic percent problems can be translated directly into equations. To understand these examples, we must recall that percent means “per hundred.” That is, 75% is the same as 75
_ 100
, 0.75, and, 3 _ 4 in reduced fraction
form. Likewise, the decimal 0.25 is equivalent to 25%. To change a decimal to a percent, we move the decimal point two places to the right and write the % symbol. To change from a percent to a decimal, we drop the % symbol and move the decimal point two places to the left. The table that follows gives some of the most commonly used frac-tions and decimals and their equivalent percents.
ExAmpLE 9 What number is 15% of 63?
sOLutIOn To solve a problem like this, we let x = the number in question and then translate the sentence directly into an equation. Here is how it is done:
Fraction Decimal percent
1 _ 2 0.5 50%
1 _ 4 0.25 25%
3 _ 4 0.75 75%
1 _ 3 0.
_ 3 33 1 _
3 %
2 _ 3 0.
_ 6 66 2 _
3 %
1 _ 5 0.2 20%
2 _ 5 0.4 40%
3 _ 5 0.6 60%
4 _ 5 0.8 80%
Copyright 2011 Cengage Learning. All Rights Reserved. May not be copied, scanned, or duplicated, in whole or in part. Due to electronic rights, some third party content may be suppressed from the eBook and/or eChapter(s). Editorial review has deemed that any suppressed content does not materially affect the overall learning experience. Cengage Learning reserves the right to remove additional content at any time if subsequent rights restrictions require it.

Chapter 2 Equations and Inequalities in One Variable86
The number 9.45 is 15% of 63.
ExAmpLE 10 What percent of 42 is 21?
sOLutIOn We translate the sentence as follows:
Next, we divide each side by 42.
x = 21 _
42
= 0.50 or 50%
ExAmpLE 11 25 is 40% of what number?
sOLutIOn Again, we translate the sentence directly.
We solve the equation by dividing both sides by 0.40.
25 _
0.40 = 0.40 ⋅ x
_ 0.40
62.5 = x
25 is 40% of 62.5.
What number is 15% of 63?
� 0.15 � 63x� 9.45
nOtEWe write 0.15 instead of 15% when we translate the sentence into an equation because we cannot do calculations with the % symbol. Because percent (%) means per hundred, we think of 15% as 15 hundredths, or 0.15.
What percent of 42 is 21?
� 42 � 21x
25 is 40% of what number?
25 � 0.40 � x
problem set 2.2
“Nothing is a waste of time if you use the experience wisely.”
—Auguste Rodin, 1840–1917, French sculptor
1. Why should you maintain good study habits throughout the entire class?
2. Why should you utilize your instructor’s office hours?
moving toward success
A Use the formula 3x − 4y = 12 to find y if [Example 1]
1. x is 0 2. x is −2
3. x is 4 4. x is −4
Use the formula y = 2x − 3 to find x when
5. y is 0 6. y is −3
7. y is 5 8. y is −5
A Problems 9 through 26 are all problems that you will see later in the text. [Example 1]
9. If x − 2y = 4 and y = − 6
_ 5
, find x.
10. If x − 2y = 4 and x = 8 _ 5 , find y.
Copyright 2011 Cengage Learning. All Rights Reserved. May not be copied, scanned, or duplicated, in whole or in part. Due to electronic rights, some third party content may be suppressed from the eBook and/or eChapter(s). Editorial review has deemed that any suppressed content does not materially affect the overall learning experience. Cengage Learning reserves the right to remove additional content at any time if subsequent rights restrictions require it.
2.2 Problem Set 87
11. If 2x + 3y = 6, find y when x is 0.
12. If 2x + 3y = 6, find x when y is 0.
13. Let x = 160 and y = 0 in y = a(x − 80)2 + 70and solve for a.
14. Let x = 0 and y = 0 in y = a(x − 80)2 + 70 and solve for a.
15. Find R if p = 1.5 and R = (900 − 300p)p.
16. Find R if p = 2.5 and R = (900 − 300p)p.
17. Find P if P = −0.1x 2 + 27x − 1,700 anda. x = 100 b. x = 170
18. Find P if P = −0.1x 2 + 27x − 1,820 anda. x = 130 b. x = 140
19. Find h if h = 16 + 32t − 16t 2 and
a. t = 1 _ 4 b. t = 7 _
4
20. Find h if h = 64t − 16t 2 anda. t = 1 b. t = 3
21. Find y if x = 3 _ 2 and y = −2x 2 + 6x − 5.
22. Find y if x = 1 _ 2 and y = −2x 2 + 6x − 5.
23. If y = Kx, find K if x = 5 and y = 15.
24. If d = Kt 2, find K if t = 2 and d = 64.
25. If V = K _ P
, find K if P = 48 and V = 50.
26. If y = Kxz 2, find K if x = 5, z = 3, and y = 180.
B Solve each of the following formulas for the indicated variable. [Examples 6–8]
27. A = lw for l 28. A = 1 _ 2 bh for b
29. I = prt for t 30. I = prt for r
31. PV = nRT for T
32. PV = nRT for R
33. y = mx + b for x
34. A = P + Prt for t
35. C = 5 _ 9 (F − 32) for F
36. F = 9 _ 5 C + 32 for C
37. h = vt + 16t 2 for v
38. h = vt − 16t 2 for v
39. A = a + (n − 1)d for d
40. A = a + (n − 1)d for n
41. 2x + 3y = 6 for y
42. 2x − 3y = 6 for y
43. −3x + 5y = 15 for y
44. −2x − 7y = 14 for y
45. 2x − 6y + 12 = 0 for y
46. 7x − 2y − 6 = 0 for y
47. ax + 4 = bx + 9 for x
48. ax − 5 = cx − 2 for x
49. A = P + Prt for P
50. ax + b = cx + d for x
Solve for y.
51. x _
8 + y _
2 = 1
52. x _
7 + y _
9 = 1
53. x _
5 + y
_ −3
= 1
54. x _
16 + y
_ −2
= 1
Problems 55 through 62 are all problems that you will see later in the text. Solve each formula for y.
55. x = 2y − 3
56. x = 4y + 1
57. y − 3 = −2(x + 4)
58. y − 2 = −3(x + 1)
59. y − 3 = − 2
_ 3
(x + 3)
60. y + 1 = − 2
_ 3
(x − 3)
61. y − 4 = − 1
_ 2
(x + 1)
62. y − 2 = − 1
_ 3
(x + 1)
63. Solve for y.
a. y + 1
_ x − 0
= 4
b. y + 2
_ x − 4
= − 1 _
2
c. y + 3
_ x − 7
= 0
Copyright 2011 Cengage Learning. All Rights Reserved. May not be copied, scanned, or duplicated, in whole or in part. Due to electronic rights, some third party content may be suppressed from the eBook and/or eChapter(s). Editorial review has deemed that any suppressed content does not materially affect the overall learning experience. Cengage Learning reserves the right to remove additional content at any time if subsequent rights restrictions require it.
Chapter 2 Equations and Inequalities in One Variable88
64. Solve for y.
a. y − 1
_ x − 0
= −3
b. y − 2
_ x − 6
= 2 _ 3
c. y − 3
_ x − 1
= 0
C Translate each of the following into a linear equation and then solve the equation. [Examples 9–11]
65. What number is 54% of 38?
66. What number is 11% of 67?
67. What percent of 36 is 9?
68. What percent of 50 is 5?
69. 37 is 4% of what number?
70. 8 is 2% of what number?
The next two problems are intended to give you practice reading, and paying attention to, the instructions that accompany the problems you are working. As we have mentioned previously, working these problems is an excellent way to get ready for a test or a quiz.
71. Work each problem according to the instructions given.
a. Solve: −4x + 5 = 20
b. Find the value of −4x + 5 when x is 3.
c. Solve for y: −4x + 5y = 20
d. Solve for x: −4x + 5y = 20
72. Work each problem according to the instructions given.
a. Solve: 2x + 1 = −4
b. Find the value of 2x + 1 when x is 8.
c. Solve for y: 2x + y = 20
d. Solve for x: 2x + y = 20
Applying the Concepts [Examples 2–3]
73. Devin left a $4 tip for a $25 lunch with his girlfriend. What percent of the cost of lunch was the tip?
74. Janai left a $3 tip for a $15 breakfast with her boyfriend. What percent of the cost of breakfast was the tip?
75. If the sales tax is 6.5% of the purchase price, what is the sales tax on a $50 purchase?
76. If the sales tax is 7.25% of the purchase price, what is the sales tax on a $120 purchase?
77. During the annual sale at the Boot Factory, Fred purchases a pair of $94 boots for only $56.40. What is the discount rate during the sale?
78. Whole tri-tip is priced at $5.65 per pound at the local supermarket, but costs only $4.52 per pound for members of their frequent shoppers club. What is the discount rate for club members?
79. Google Earth The Google Earth map shows Crater Lake National Park in Oregon. The park covers 286.3 square miles. If the lake covers 7.2% of the park, what is the area of the lake? Round to the nearest tenth.
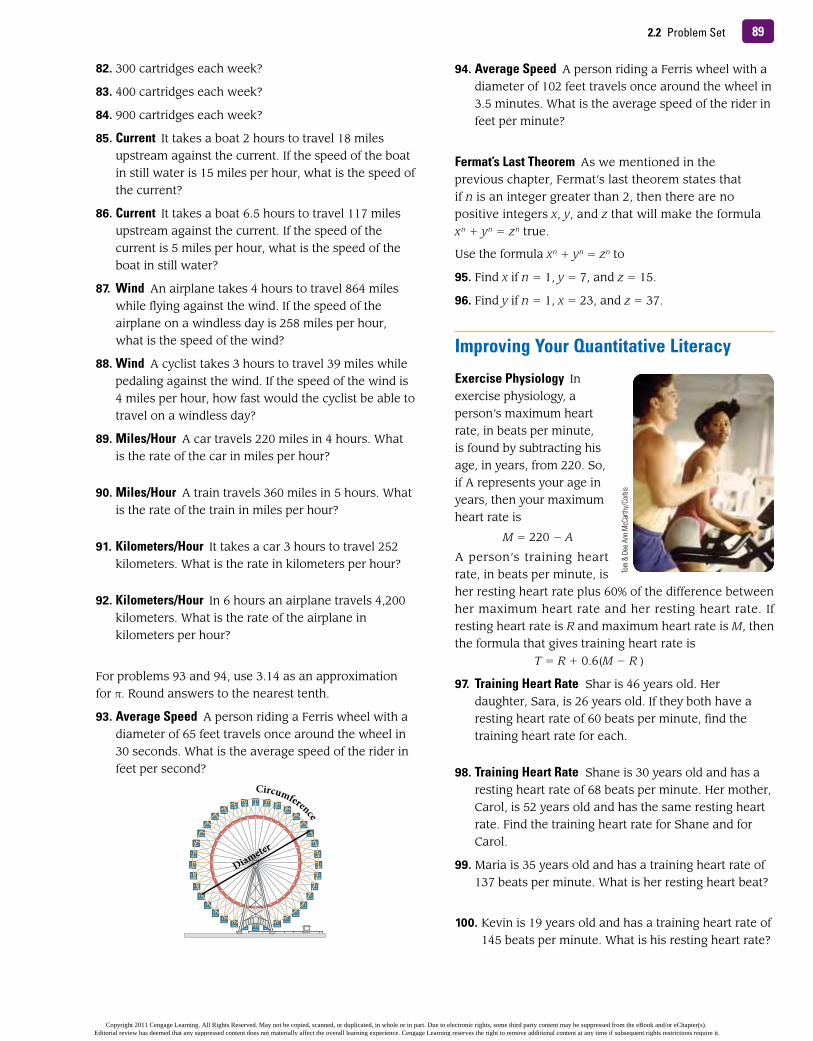
80. u.s. Energy The bar chart shows where Americans get their energy. In 2008, Americans used 99.2 quadrillion Btu of energy. How many Btu’s did Americans use from natural gas? Round to the nearest tenth.
pricing A company that manufactures ink cartridges finds that they can sell x cartridges each week at a price of p dollars each, according to the formula x = 3,800 − 100p. What price should they charge for each cartridge if they want to sell
81. 800 cartridges each week?
Source: Department of Energy, 2008
Role of Renewable Energy in the U.S.
Natural Gas 24%
Coal 23%
Renewable Energy 7%
Nuclear Energy 9%
Petroleum 37%
Copyright 2011 Cengage Learning. All Rights Reserved. May not be copied, scanned, or duplicated, in whole or in part. Due to electronic rights, some third party content may be suppressed from the eBook and/or eChapter(s). Editorial review has deemed that any suppressed content does not materially affect the overall learning experience. Cengage Learning reserves the right to remove additional content at any time if subsequent rights restrictions require it.
2.2 Problem Set 89
82. 300 cartridges each week?
83. 400 cartridges each week?
84. 900 cartridges each week?
85. Current It takes a boat 2 hours to travel 18 miles upstream against the current. If the speed of the boat in still water is 15 miles per hour, what is the speed of the current?
86. Current It takes a boat 6.5 hours to travel 117 miles upstream against the current. If the speed of the current is 5 miles per hour, what is the speed of the boat in still water?
87. Wind An airplane takes 4 hours to travel 864 miles while flying against the wind. If the speed of the airplane on a windless day is 258 miles per hour, what is the speed of the wind?
88. Wind A cyclist takes 3 hours to travel 39 miles while pedaling against the wind. If the speed of the wind is 4 miles per hour, how fast would the cyclist be able to travel on a windless day?
89. miles/hour A car travels 220 miles in 4 hours. What is the rate of the car in miles per hour?
90. miles/hour A train travels 360 miles in 5 hours. What is the rate of the train in miles per hour?
91. kilometers/hour It takes a car 3 hours to travel 252 kilometers. What is the rate in kilometers per hour?
92. kilometers/hour In 6 hours an airplane travels 4,200 kilometers. What is the rate of the airplane in kilometers per hour?
For problems 93 and 94, use 3.14 as an approximation for π. Round answers to the nearest tenth.
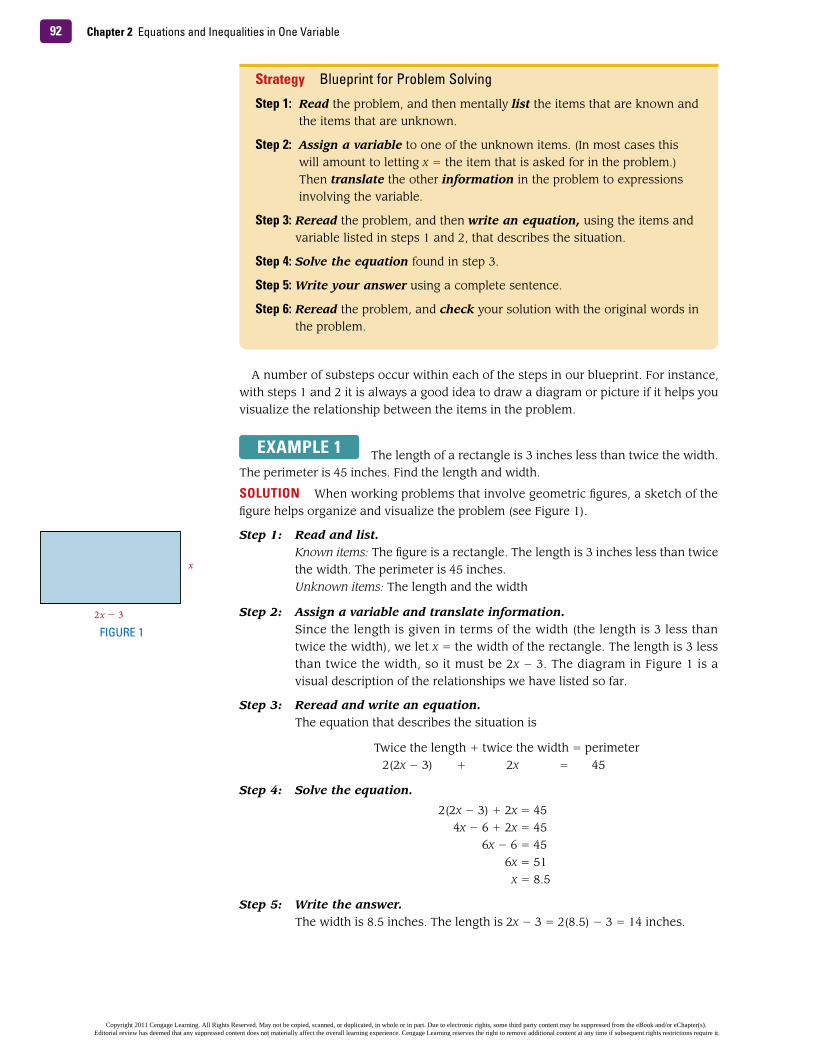
93. Average speed A person riding a Ferris wheel with a diameter of 65 feet travels once around the wheel in 30 seconds. What is the average speed of the rider in feet per second?
Diameter
Circumference
94. Average speed A person riding a Ferris wheel with a diameter of 102 feet travels once around the wheel in 3.5 minutes. What is the average speed of the rider in feet per minute?
Fermat’s Last theorem As we mentioned in the previous chapter, Fermat’s last theorem states that if n is an integer greater than 2, then there are no positive integers x, y, and z that will make the formula x n + y n = z n true.
Use the formula x n + y n = z n to
95. Find x if n = 1, y = 7, and z = 15.
96. Find y if n = 1, x = 23, and z = 37.
Improving Your Quantitative Literacy
Exercise physiology In exercise physiology, a person’s maximum heart rate, in beats per minute, is found by subtracting his age, in years, from 220. So, if A represents your age in years, then your maximum heart rate is
M = 220 − A
A person’s training heart rate, in beats per minute, is her resting heart rate plus 60% of the difference between her maximum heart rate and her resting heart rate. If resting heart rate is R and maximum heart rate is M, then the formula that gives training heart rate is
T = R + 0.6(M − R )
97. training heart Rate Shar is 46 years old. Her daughter, Sara, is 26 years old. If they both have a resting heart rate of 60 beats per minute, find the training heart rate for each.
98. training heart Rate Shane is 30 years old and has a resting heart rate of 68 beats per minute. Her mother, Carol, is 52 years old and has the same resting heart rate. Find the training heart rate for Shane and for Carol.
99. Maria is 35 years old and has a training heart rate of 137 beats per minute. What is her resting heart beat?
100. Kevin is 19 years old and has a training heart rate of 145 beats per minute. What is his resting heart rate?
Tom
& De
e Ann
McC
arth
y/Co
rbis
Copyright 2011 Cengage Learning. All Rights Reserved. May not be copied, scanned, or duplicated, in whole or in part. Due to electronic rights, some third party content may be suppressed from the eBook and/or eChapter(s). Editorial review has deemed that any suppressed content does not materially affect the overall learning experience. Cengage Learning reserves the right to remove additional content at any time if subsequent rights restrictions require it.

Chapter 2 Equations and Inequalities in One Variable90
maintaining Your skills
Simplify using the rule for order of operations.
101. 38 − 19 + 1 102. 200 − 150 + 20
103. 57 − 18 − 8 104. 71 − 11 − 1
105. 28 ÷ 7 ⋅ 2 106. 48 ÷ 3 ⋅ 2
107. 125 ÷ 25 ÷ 5 108. 36 ÷ 12 ÷ 4
Solve each equation.
109. 3(2x −9) + 15 − x = −27
110. 17 − 2(4x + 8) + 4x = −11
111. 8x − 7 + 5x − 12 = 7
112. 12 − 5x + 13 + 7x = 15
113. x − 4 ______ 3 − 5 + 2x = 24
114. 7 − x + 7 ______ 2 − 11 = −6
Getting Ready for the next section
To understand all of the explanations and examples in the next section, you must be able to work the problems below.
Translate into symbols.
115. Three less than twice a number
116. Ten less than four times a number
117. The sum of x and y is 180.
118. The sum of a and b is 90.
Solve each equation.
119. x + 2x = 90 120. x + 5x = 180
121. 2(2x − 3) + 2x = 45
122. 2(4x − 10) + 2x = 12.5
123. 6x + 5(10,000 − x) = 56,000
124. x + 0.0725x = 17,481.75
Extending the Concepts
125. Solve x _ a + y _
b = 1 for x.
126. Solve x _ a + y _
b = 1 for y.
127. Solve 1 _ a + 1 _
b = 1 _
c for a.
128. Solve 1
_ a + 1 _
b = 1 _
c for b.
129. Solve 2
_ a + 2 _
b = 2 _
c for a.
130. Solve 5
_ a + 5 _
b = 5 _
c for b.
131. Solve 2
_ a + 4 _
b = 2 _
c for a.
132. Solve 6
_ a − 3 _
b = 3 _
c for a.
Copyright 2011 Cengage Learning. All Rights Reserved. May not be copied, scanned, or duplicated, in whole or in part. Due to electronic rights, some third party content may be suppressed from the eBook and/or eChapter(s). Editorial review has deemed that any suppressed content does not materially affect the overall learning experience. Cengage Learning reserves the right to remove additional content at any time if subsequent rights restrictions require it.

912.3 Applications
OBjECtIVEs
Apply the Blueprint for Problem Solving to a variety of application problems.
B Use a formula to construct a table of paired data.
A
2.3 Applications
tICkEt tO suCCEssKeep these questions in mind as you read through the section. Then respond in your own words and in complete sentences.
1. What is the first step in the Blueprint for Problem Solving?
2. Why is step 6 in the Blueprint for Problem Solving important?
3. What are complementary angles?
4. How would you use your knowledge of formulas to build a table of paired data?
Imagine you have been working at a local pizza restaurant. Your starting wage was $8.00 per hour. After working there for 1 year, you get a 5.5% raise. What is your new hourly wage? We frequently see applications like this in our everyday lives. In this section, we will expand our work with linear equations to look at several different kinds of applications.
A Blueprint for Problem SolvingIn this section, we use the skills we have developed for solving equations to solve problems written in words. You may find that some of the examples and problems are more realistic than others. Since we are just beginning our work with application problems, even the ones that seem unrealistic are good practice. What is important in this section is the method we use to solve application problems, not the applications themselves. The method, or strategy, that we use to solve application problems is called the Blueprint for Problem Solving. It is an outline that will overlay the solution process we use on all application problems.
Imag
e cop
yrigh
t ©ke
ntoh
, 200
9. Us
ed un
der l
icens
e fro
m Sh
utte
rstoc
k.com
Copyright 2011 Cengage Learning. All Rights Reserved. May not be copied, scanned, or duplicated, in whole or in part. Due to electronic rights, some third party content may be suppressed from the eBook and/or eChapter(s). Editorial review has deemed that any suppressed content does not materially affect the overall learning experience. Cengage Learning reserves the right to remove additional content at any time if subsequent rights restrictions require it.
Chapter 2 Equations and Inequalities in One Variable92
A number of substeps occur within each of the steps in our blueprint. For instance, with steps 1 and 2 it is always a good idea to draw a diagram or picture if it helps you visualize the relationship between the items in the problem.
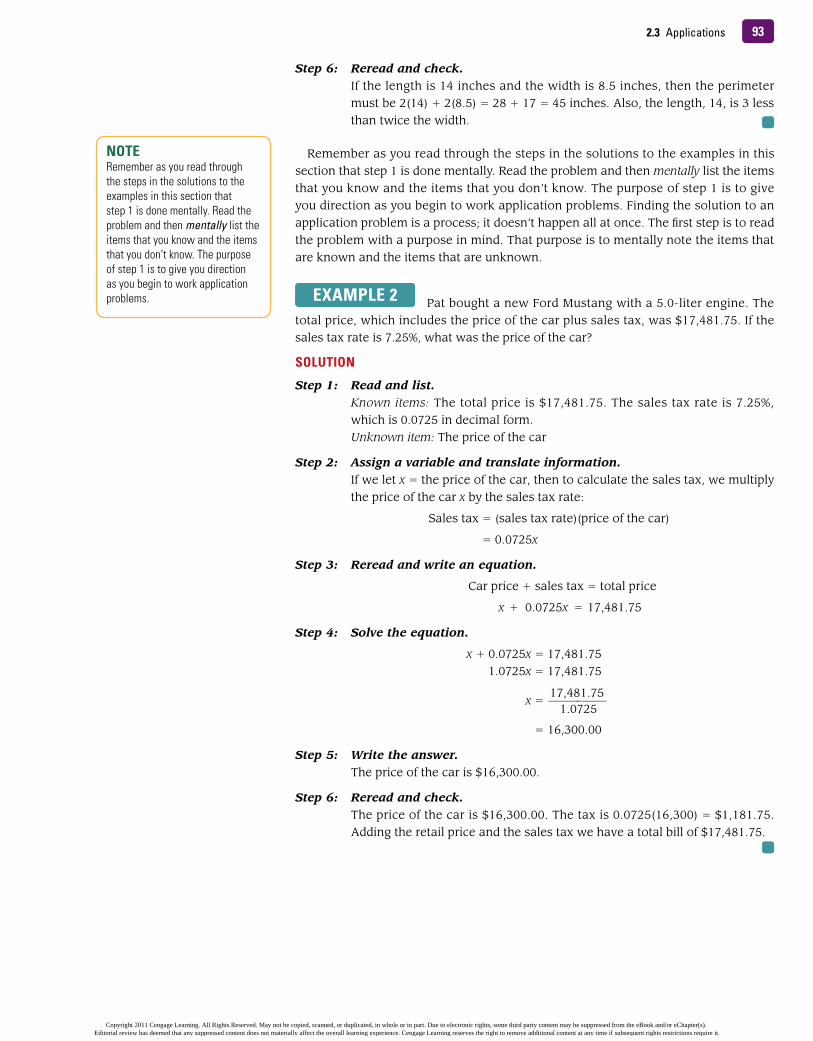
ExAmpLE 1 The length of a rectangle is 3 inches less than twice the width. The perimeter is 45 inches. Find the length and width.
sOLutIOn When working problems that involve geometric figures, a sketch of the figure helps organize and visualize the problem (see Figure 1).
Step 1: Read and list. Known items: The figure is a rectangle. The length is 3 inches less than twice
the width. The perimeter is 45 inches. Unknown items: The length and the width
Step 2: Assign a variable and translate information. Since the length is given in terms of the width (the length is 3 less than
twice the width), we let x = the width of the rectangle. The length is 3 less than twice the width, so it must be 2x − 3. The diagram in Figure 1 is a visual description of the relationships we have listed so far.
Step 3: Reread and write an equation. The equation that describes the situation is
Twice the length + twice the width = perimeter 2(2x − 3) + 2x = 45
Step 4: Solve the equation.
2(2x − 3) + 2x = 45 4x − 6 + 2x = 45 6x − 6 = 45 6x = 51 x = 8.5
Step 5: Write the answer. The width is 8.5 inches. The length is 2x − 3 = 2(8.5) − 3 = 14 inches.
strategy Blueprint for Problem Solving
step 1: Read the problem, and then mentally list the items that are known and the items that are unknown.
step 2: Assign a variable to one of the unknown items. (In most cases this will amount to letting x = the item that is asked for in the problem.) Then translate the other information in the problem to expressions involving the variable.
step 3: Reread the problem, and then write an equation, using the items and variable listed in steps 1 and 2, that describes the situation.
step 4: Solve the equation found in step 3.
step 5: Write your answer using a complete sentence.
step 6: Reread the problem, and check your solution with the original words in the problem.
FIGURE 1
x
2x − 3
Copyright 2011 Cengage Learning. All Rights Reserved. May not be copied, scanned, or duplicated, in whole or in part. Due to electronic rights, some third party content may be suppressed from the eBook and/or eChapter(s). Editorial review has deemed that any suppressed content does not materially affect the overall learning experience. Cengage Learning reserves the right to remove additional content at any time if subsequent rights restrictions require it.
932.3 Applications
Step 6: Reread and check. If the length is 14 inches and the width is 8.5 inches, then the perimeter
must be 2(14) + 2(8.5) = 28 + 17 = 45 inches. Also, the length, 14, is 3 less than twice the width.
Remember as you read through the steps in the solutions to the examples in this section that step 1 is done mentally. Read the problem and then mentally list the items that you know and the items that you don’t know. The purpose of step 1 is to give you direction as you begin to work application problems. Finding the solution to an application problem is a process; it doesn’t happen all at once. The first step is to read the problem with a purpose in mind. That purpose is to mentally note the items that are known and the items that are unknown.
ExAmpLE 2 Pat bought a new Ford Mustang with a 5.0-liter engine. The total price, which includes the price of the car plus sales tax, was $17,481.75. If the sales tax rate is 7.25%, what was the price of the car?
sOLutIOn
Step 1: Read and list. Known items: The total price is $17,481.75. The sales tax rate is 7.25%,
which is 0.0725 in decimal form.Unknown item: The price of the car
Step 2: Assign a variable and translate information. If we let x = the price of the car, then to calculate the sales tax, we multiply
the price of the car x by the sales tax rate:
Sales tax = (sales tax rate)(price of the car)
= 0.0725x
Step 3: Reread and write an equation.
Car price + sales tax = total price
x + 0.0725x = 17,481.75
Step 4: Solve the equation.
x + 0.0725x = 17,481.75 1.0725x = 17,481.75
x = 17,481.75 __
1.0725
= 16,300.00
Step 5: Write the answer. The price of the car is $16,300.00.
Step 6: Reread and check. The price of the car is $16,300.00. The tax is 0.0725(16,300) = $1,181.75.
Adding the retail price and the sales tax we have a total bill of $17,481.75.
nOtERemember as you read through the steps in the solutions to the examples in this section that step 1 is done mentally. Read the problem and then mentally list the items that you know and the items that you don’t know. The purpose of step 1 is to give you direction as you begin to work application problems.
Copyright 2011 Cengage Learning. All Rights Reserved. May not be copied, scanned, or duplicated, in whole or in part. Due to electronic rights, some third party content may be suppressed from the eBook and/or eChapter(s). Editorial review has deemed that any suppressed content does not materially affect the overall learning experience. Cengage Learning reserves the right to remove additional content at any time if subsequent rights restrictions require it.
Chapter 2 Equations and Inequalities in One Variable94
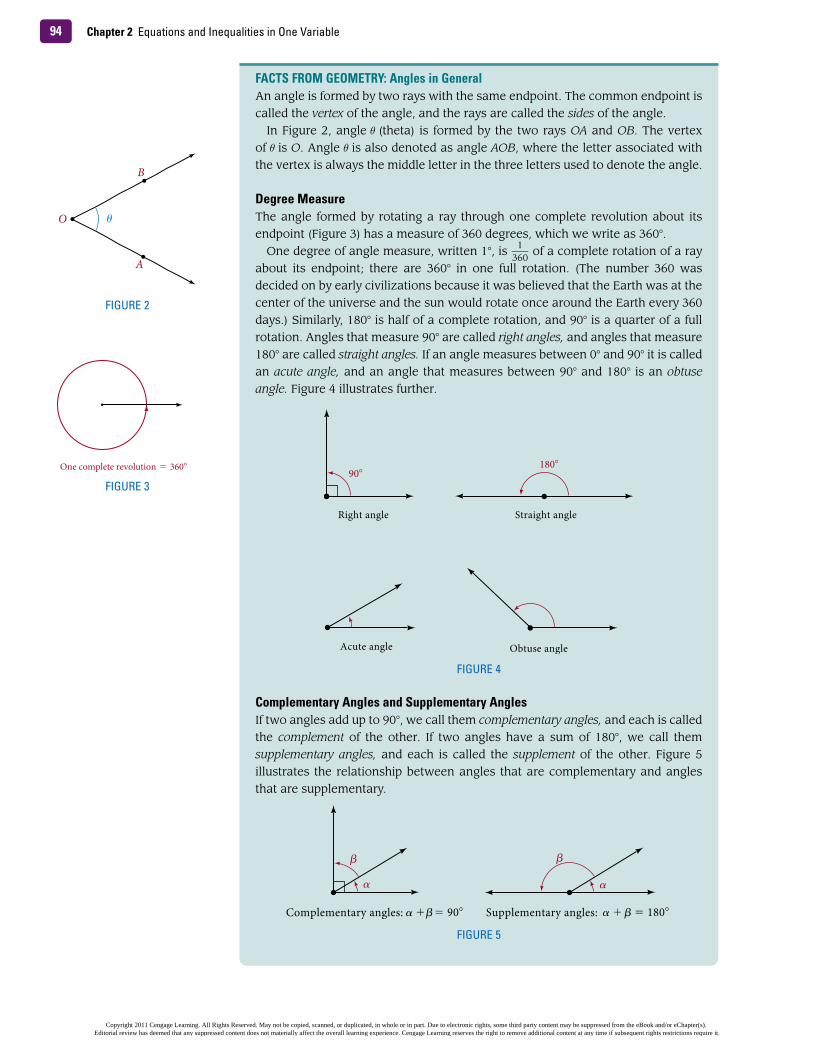
FACts FROm GEOmEtRY: Angles in GeneralAn angle is formed by two rays with the same endpoint. The common endpoint is called the vertex of the angle, and the rays are called the sides of the angle. In Figure 2, angle θ (theta) is formed by the two rays OA and OB. The vertex of θ is O. Angle θ is also denoted as angle AOB, where the letter associated with the vertex is always the middle letter in the three letters used to denote the angle.
Degree measureThe angle formed by rotating a ray through one complete revolution about its endpoint (Figure 3) has a measure of 360 degrees, which we write as 360°. One degree of angle measure, written 1°, is 1
_ 360
of a complete rotation of a ray about its endpoint; there are 360° in one full rotation. (The number 360 was decided on by early civilizations because it was believed that the Earth was at the center of the universe and the sun would rotate once around the Earth every 360 days.) Similarly, 180° is half of a complete rotation, and 90° is a quarter of a full rotation. Angles that measure 90° are called right angles, and angles that measure 180° are called straight angles. If an angle measures between 0° and 90° it is called an acute angle, and an angle that measures between 90° and 180° is an obtuse angle. Figure 4 illustrates further.
Complementary Angles and supplementary AnglesIf two angles add up to 90°, we call them complementary angles, and each is called the complement of the other. If two angles have a sum of 180°, we call them supplementary angles, and each is called the supplement of the other. Figure 5 illustrates the relationship between angles that are complementary and angles that are supplementary.
O θ
A
B
FIGURE 2
One complete revolution = 360°
FIGURE 390°
180°
Right angle Straight angle
Acute angle Obtuse angle
FIGURE 4
+ = 180°+ = 90° Supplementary angles:Complementary angles:
α
β
α
β
α β α β
FIGURE 5
Copyright 2011 Cengage Learning. All Rights Reserved. May not be copied, scanned, or duplicated, in whole or in part. Due to electronic rights, some third party content may be suppressed from the eBook and/or eChapter(s). Editorial review has deemed that any suppressed content does not materially affect the overall learning experience. Cengage Learning reserves the right to remove additional content at any time if subsequent rights restrictions require it.

952.3 Applications
FACts FROm GEOmEtRY: special trianglesIt is not unusual to have the terms we use in mathematics show up in the descriptions of things we find in the world around us. The flag of Puerto Rico shown here is described on the government website as “Five equal horizontal bands of red (top and bottom) alternating with white; a blue isosceles triangle based on the hoist side bears a large white five-pointed star in the center.” An isosceles triangle as shown here and in Figure 6, is a triangle with two sides of equal length.
Angles A and B in the isosceles triangle in Figure 6 are called the base angles: they are the angles opposite the two equal sides. In every isosceles triangle, the base angles are equal.
An equilateral triangle (Figure 7) is a triangle with three sides of equal length. If all three sides in a triangle have the same length, then the three interior angles in the triangle also must be equal. Because the sum of the interior angles in a triangle is always 180°, the three interior angles in any equilateral triangle must be 60°.
a
c
b
B
C
A
a = b
Isosceles Triangle
FIGURE 6
a
c
b
B
C
A
a = b = c
Equilateral Triangle
FIGURE 7
ExAmpLE 3 Two complementary angles are such that one is twice as large as the other. Find the two angles.
sOLutIOn Applying the Blueprint for Problem Solving, we have
Step 1: Read and list. Known items: Two complementary angles. One is twice as large as the
other. Unknown items: The size of the angles
Step 2: Assign a variable and translate information. Let x = the smaller angle. The larger angle is twice the smaller, so we
represent the larger angle with 2x.
nOtEAs you can see from Figures 6 and 7, one way to label the important parts of a triangle is to label the vertices with capital letters and the sides with small letters: side a is opposite vertex A, side b is opposite vertex B, and side c is opposite vertex C. Also, because each vertex is the vertex of one of the angles of the triangle, we refer to the three interior angles as A, B, and C. Finally, in any triangle, the sum of the interior angles is 180°. For the triangles shown in Figures 6 and 7, the relationship is written A + B + C = 180°
Copyright 2011 Cengage Learning. All Rights Reserved. May not be copied, scanned, or duplicated, in whole or in part. Due to electronic rights, some third party content may be suppressed from the eBook and/or eChapter(s). Editorial review has deemed that any suppressed content does not materially affect the overall learning experience. Cengage Learning reserves the right to remove additional content at any time if subsequent rights restrictions require it.

Chapter 2 Equations and Inequalities in One Variable96
Step 3: Reread and write an equation. Because the two angles are complementary, their sum is 90. Therefore,
x + 2x = 90Step 4: Solve the equation.
x + 2x = 90
3x = 90
x = 30
Step 5: Write the answer. The smaller angle is 30°, and the larger angle is 2 ⋅ 30 = 60°.
Step 6: Reread and check. The larger angle is twice the smaller angle, and their sum is 90°.
Suppose we know that the sum of two numbers is 50. If we let x represent one of the two numbers, how can we represent the other? Let’s suppose for a moment that x turns out to be 30. Then the other number will be 20 because their sum is 50; that is, if two numbers add up to 50, and one of them is 30, then the other must be 50 − 30 = 20. Generalizing this to any number x, we see that if two numbers have a sum of 50 and one of the numbers is x, then the other must be 50 − x. The following table shows some additional examples:
Interest Problem
ExAmpLE 4 Suppose a person invests a total of $10,000 in two accounts. One account earns 5% annually, and the other earns 6% annually. If the total interest earned from both accounts in a year is $560, how much is invested in each account?
sOLutIOn
Step 1: Read and list. Known items: Two accounts. One pays interest of 5%, and the other pays 6%.
The total invested is $10,000. Unknown items: The number of dollars invested in each individual account
Step 2: Assign a variable and translate information. If we let x equal the amount invested at 6%, then 10,000 − x is the
amount invested at 5%. The total interest earned from both accounts is $560. The amount of interest earned on x dollars at 6% is 0.06x, whereas the amount of interest earned on 10,000 − x dollars at 5% is 0.05(10,000 − x).
Step 3: Reread and write an equation. The last line gives us the equation we are after.
0.06x + 0.05(10,000 − x) = 560
If two numbers and one of then the other have a sum of them is must be
50 x 50 − x
10 y 10 − y
12 n 12 − n
Dollars Dollars at 6% at 5% total
Dollars x 10,000 − x 10,000
Interest 0.06x 0.05(10,000 − x) 560
Copyright 2011 Cengage Learning. All Rights Reserved. May not be copied, scanned, or duplicated, in whole or in part. Due to electronic rights, some third party content may be suppressed from the eBook and/or eChapter(s). Editorial review has deemed that any suppressed content does not materially affect the overall learning experience. Cengage Learning reserves the right to remove additional content at any time if subsequent rights restrictions require it.

972.3 Applications
Step 4: Solve the equation. To make this equation a little easier to solve, we begin by multiplying both
sides by 100 to move the decimal point two places to the right
6x + 5(10,000 − x) = 56,000
6x + 50,000 − 5x = 56,000
x + 50,000 = 56,000
x = 6,000
Step 5: Write the answer. The amount of money invested at 6% is $6,000. The amount of money
invested at 5% is $10,000 − $6,000 = $4,000.
Step 6: Reread and check. To check our results, we find the total interest from the two accounts:
The interest on $6,000 at 6% is 0.06(6,000) = 360
The interest on $4,000 at 5% is 0.05(4,000) = 200
The total interest = $560
B Table BuildingWe can use our knowledge of formulas to build tables of paired data. As you will see, equations or formulas that contain exactly two variables produce pairs of numbers that can be used to construct tables.
ExAmpLE 5 A piece of string 12 inches long is to be formed into a rectangle. Build a table that gives the length of the rectangle if the width is 1, 2, 3, 4, or 5 inches. Then find the area of each of the rectangles formed.
sOLutIOn Because the formula for the perimeter of a rectangle is P = 2l + 2w and our piece of string is 12 inches long, the formula we will use to find the lengths for the given widths is 12 = 2l + 2w. To solve this formula for l, we divide each side by 2 and then subtract w. The result is l = 6 − w. Table 1 organizes our work so that the formula we use to find l for a given value of w is shown, and we have added a last column to give us the areas of the rectangles formed. The units for the first three columns are inches, and the units for the numbers in the last column are square inches.
TABLE 1
LEnGth, WIDth, AnD AREA
Width (in.) Length (in.) Area (in.2)
w l = 6 − w l A = lw
1 l = 6 − 1 5 5
2 l = 6 − 2 4 8
3 l = 6 − 3 3 9
4 l = 6 − 4 2 8
5 l = 6 − 5 1 5
Copyright 2011 Cengage Learning. All Rights Reserved. May not be copied, scanned, or duplicated, in whole or in part. Due to electronic rights, some third party content may be suppressed from the eBook and/or eChapter(s). Editorial review has deemed that any suppressed content does not materially affect the overall learning experience. Cengage Learning reserves the right to remove additional content at any time if subsequent rights restrictions require it.

Chapter 2 Equations and Inequalities in One Variable98
Figures 8 and 9 show two bar charts constructed from the information in Table 1.
1
5
4
3
2
Leng
th
5
4
3
2
1
Width1 2 3 4 5
FIGURE 8 Length and width of rectangles with perimeters fixed at 12 inches
2
98
6
4
Are
a
1
7
5
3
5
89
8
5
Width1 2 3 4 5
FIGURE 9 Area and width of rectangles with perimeters fixed at 12 inches
u s I n G t E C h n O L O G Ymore About Example 5
A number of graphing calculators have table-building capabilities. We can let the calculator variable X represent the widths of the rectangles in Example 5. To find the lengths, we set variable Y 1 equal to 6 − X. The area of each rectangle can be found by setting variable Y 2 equal to X * Y 1. To have the calculator produce the table automatically, we use a table minimum of 0 and a table increment of 1. Here is a summary of how the graphing calculator is set up:
Table Setup Y Variables SetupTable minimum = 0 Y 1 = 6 − XTable increment = 1 Y 2 = X * Y 1
Independent variable: Auto Dependent variable: Auto
The table will look like this:
x Y1 Y2
0 6 0
1 5 5
2 4 8
3 3 9
4 2 8
5 1 5
6 0 0
Copyright 2011 Cengage Learning. All Rights Reserved. May not be copied, scanned, or duplicated, in whole or in part. Due to electronic rights, some third party content may be suppressed from the eBook and/or eChapter(s). Editorial review has deemed that any suppressed content does not materially affect the overall learning experience. Cengage Learning reserves the right to remove additional content at any time if subsequent rights restrictions require it.
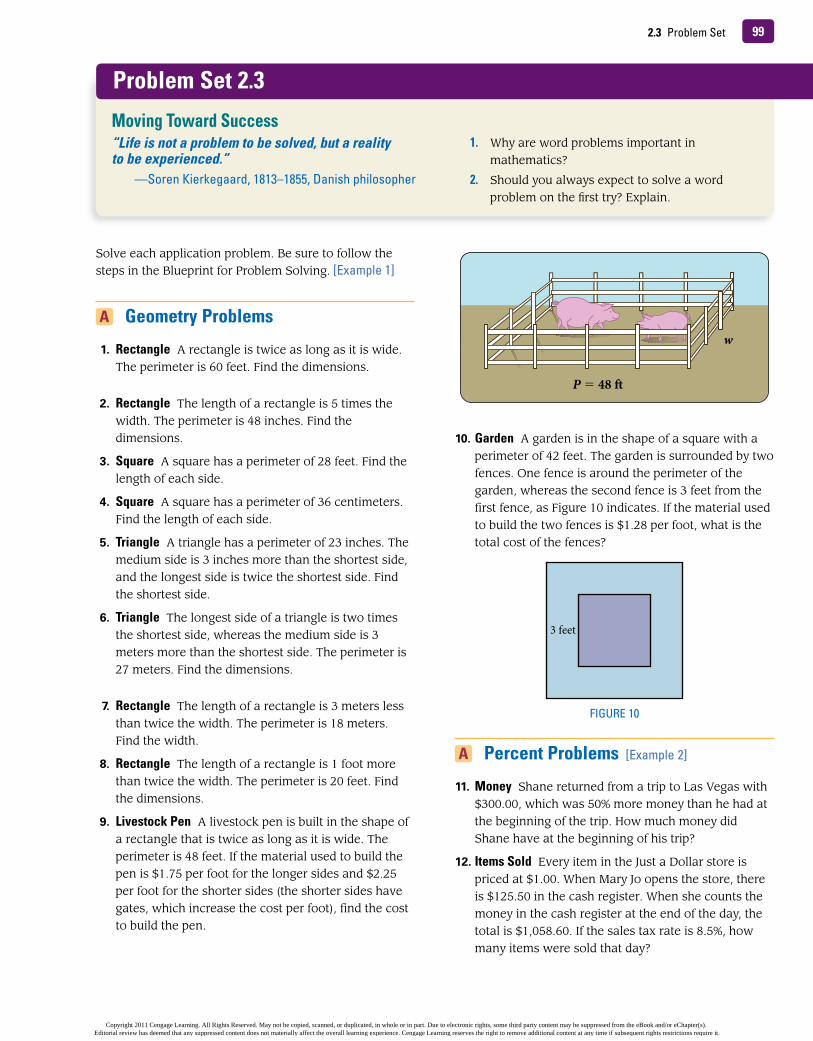
2.3 Problem Set 99
Solve each application problem. Be sure to follow the steps in the Blueprint for Problem Solving. [Example 1]
A Geometry problems
1. Rectangle A rectangle is twice as long as it is wide. The perimeter is 60 feet. Find the dimensions.
2. Rectangle The length of a rectangle is 5 times the width. The perimeter is 48 inches. Find the dimensions.
3. square A square has a perimeter of 28 feet. Find the length of each side.
4. square A square has a perimeter of 36 centimeters. Find the length of each side.
5. triangle A triangle has a perimeter of 23 inches. The medium side is 3 inches more than the shortest side, and the longest side is twice the shortest side. Find the shortest side.
6. triangle The longest side of a triangle is two times the shortest side, whereas the medium side is 3 meters more than the shortest side. The perimeter is 27 meters. Find the dimensions.
7. Rectangle The length of a rectangle is 3 meters less than twice the width. The perimeter is 18 meters. Find the width.
8. Rectangle The length of a rectangle is 1 foot more than twice the width. The perimeter is 20 feet. Find the dimensions.
9. Livestock pen A livestock pen is built in the shape of a rectangle that is twice as long as it is wide. The perimeter is 48 feet. If the material used to build the pen is $1.75 per foot for the longer sides and $2.25 per foot for the shorter sides (the shorter sides have gates, which increase the cost per foot), find the cost to build the pen.
10. Garden A garden is in the shape of a square with a perimeter of 42 feet. The garden is surrounded by two fences. One fence is around the perimeter of the garden, whereas the second fence is 3 feet from the first fence, as Figure 10 indicates. If the material used to build the two fences is $1.28 per foot, what is the total cost of the fences?
A percent problems [Example 2]
11. money Shane returned from a trip to Las Vegas with $300.00, which was 50% more money than he had at the beginning of the trip. How much money did Shane have at the beginning of his trip?
12. Items sold Every item in the Just a Dollar store is priced at $1.00. When Mary Jo opens the store, there is $125.50 in the cash register. When she counts the money in the cash register at the end of the day, the total is $1,058.60. If the sales tax rate is 8.5%, how many items were sold that day?
w
P = 48 �
3 feet
FIGURE 10
problem set 2.3
“Life is not a problem to be solved, but a reality to be experienced.”
—Soren Kierkegaard, 1813–1855, Danish philosopher
1. Why are word problems important in mathematics?
2. Should you always expect to solve a word problem on the first try? Explain.
moving toward success
Copyright 2011 Cengage Learning. All Rights Reserved. May not be copied, scanned, or duplicated, in whole or in part. Due to electronic rights, some third party content may be suppressed from the eBook and/or eChapter(s). Editorial review has deemed that any suppressed content does not materially affect the overall learning experience. Cengage Learning reserves the right to remove additional content at any time if subsequent rights restrictions require it.

Chapter 2 Equations and Inequalities in One Variable100
13. monthly salary An accountant earns $3,440 per month after receiving a 5.5% raise. What was the accountant’s monthly income before the raise? Round your answer to the nearest cent.
14. textbook price Suppose a college bookstore buys a textbook from a publishing company and then marks up the price they paid for the book 33% and sells it to a student at the marked-up price. If the student pays $75.00 for the textbook, what did the bookstore pay for it? Round your answer to the nearest cent.
15. movies Batman Forever grossed $52.8 million on its opening weekend and had one of the most successful movie launches in history. If Batman Forever accounted for approximately 53% of all box office receipts that weekend, what were the total box office receipts? Round your answer to the nearest tenth of a million dollars.
16. hourly Wage A sheet metal worker earns $26.80 per hour after receiving a 4.5% raise. What was the sheet metal worker’s hourly pay before the raise? Round your answer to the nearest cent.
A more Geometry problems [Example 3]
17. Angles Two supplementary angles are such that one is eight times larger than the other. Find the two angles.
18. Angles Two complementary angles are such that one is five times larger than the other. Find the two angles.
19. Angles One angle is 12° less than four times another. Find the measure of each angle if a. they are complements of each other. b. they are supplements of each other.
20. Angles One angle is 4° more than three times another. Find the measure of each angle ifa. they are complements of each other. b. they are supplements of each other.
21. triangle A triangle is such that the largest angle isthree times the smallest angle. The third angle is 9°less than the largest angle. Find the measure of each angle.
22. triangle The smallest angle in a triangle is half of the largest angle. The third angle is 15° less than the largest angle. Find the measure of all three angles.
23. triangle The smallest angle in a triangle is one-third of the largest angle. The third angle is 10° more than the smallest angle. Find the measure of all three angles.
24. triangle The third angle in an isosceles triangle is half as large as each of the two base angles. Find the measure of each angle.
25. Isosceles triangle The third angle in an isosceles triangle is 8° more than twice as large as each of the two base angles. Find the measure of each angle.
26. Isosceles triangle The third angle in an isosceles triangle is 4° more than one fifth of each of the two base angles. Find the measure of each angle.
A Interest problems [Example 4]
27. Investing A woman has a total of $9,000 to invest. She invests part of the money in an account that pays 8% per year and the rest in an account that pays 9% per year. If the interest earned in the first year is $750, how much did she invest in each account?
28. Investing A man invests $12,000 in two accounts. If one account pays 10% per year and the other pays 7% per year, how much was invested in each account if the total interest earned in the first year was $960?
29. Investing A total of $15,000 is invested in two accounts. One of the accounts earns 12% per year, and the other earns 10% per year. If the total interest earned in the first year is $1,600, how much was invested in each account?
30. Investing A total of $11,000 is invested in two accounts. One of the two accounts pays 9% per year, and the other account pays 11% per year. If the total interest paid in the first year is $1,150, how much was invested in each account?
Dollars at 8% Dollars at 9% total
Dollars
Interest
Dollars at 10% Dollars at 7% total
Dollars
Interest
Copyright 2011 Cengage Learning. All Rights Reserved. May not be copied, scanned, or duplicated, in whole or in part. Due to electronic rights, some third party content may be suppressed from the eBook and/or eChapter(s). Editorial review has deemed that any suppressed content does not materially affect the overall learning experience. Cengage Learning reserves the right to remove additional content at any time if subsequent rights restrictions require it.

2.3 Problem Set 101
31. Investing Stacy has a total of $6,000 in two accounts. The total amount of interest she earns from both accounts in the first year is $500. If one of the accounts earns 8% interest per year and the other earns 9% interest per year, how much did she invest in each account?
32. Investing Travis has a total of $6,000 invested in two accounts. The total amount of interest he earns from the accounts in the first year is $410. If one account pays 6% per year and the other pays 8% per year, how much did he invest in each account?
A miscellaneous problems
33. ticket prices Miguel is selling tickets to a barbecue.Adult tickets cost $6.00 and children’s tickets cost $4.00. He sells six more children’s tickets than adult tickets. The total amount of money he collects is $184. How many adult tickets and how many children’s tickets did he sell?
34. Working two jobs Maggie has a job working in an office for $10 an hour and another job driving a tractor for $12 an hour. One week she works in the office twice as long as she drives the tractor. Her total income for that week is $416. How many hours did she spend at each job?
35. sales tax A woman owns a small, cash-only business in a state that requires her to charge 6% sales tax on each item she sells. At the beginning of the day, she has $250 in the cash register. At the end of the day, she has $1,204 in the register. How much money should she send to the state government for the sales tax she collected?
36. sales tax A store is located in a state that requires 6% tax on all items sold. If the store brings in a total of $3,392 in one day, how much of that total was sales tax?
Adult Child
Number
Income
job Office tractor
Hours Worked
Wages Earned
B table Building [Example 5]
37. Use h = 32t − 16t 2 to complete the table.
38. Use s = 60 _
t to complete the table.
39. horse Racing The graph shows the total amount of money wagered on the Kentucky Derby. Use the information to fill in the table
40. BmI Sometimes body mass index is used to determine if a person is underweight, overweight, or normal. The equation used to find BMI is found by dividing a persons weight in kilograms by their height squared in meters. So if w is weight and h is height then your BMI is BMI = w _
h 2 . Use the formula to fill in
the table. Round to the nearest tenth.
t 0 1 _ 4 1 7 _
4 2
h
t 4 6 8 10
s
Source: http://www.kentuckyderby.com, Thoroughbred Times
Betting the Ponies
44.834.465.4
104
163
20.2
0
50
100
150
200
2005 20102000199519901985
Mill
ions
of d
olla
rs Bets
(millions Year of dollars)
1985
1990
1995
2000
2005
2010
Weight height BmI (kg) (m) (kg/m2)
38 1.25
49 1.5
53 1.75
75 2
Copyright 2011 Cengage Learning. All Rights Reserved. May not be copied, scanned, or duplicated, in whole or in part. Due to electronic rights, some third party content may be suppressed from the eBook and/or eChapter(s). Editorial review has deemed that any suppressed content does not materially affect the overall learning experience. Cengage Learning reserves the right to remove additional content at any time if subsequent rights restrictions require it.
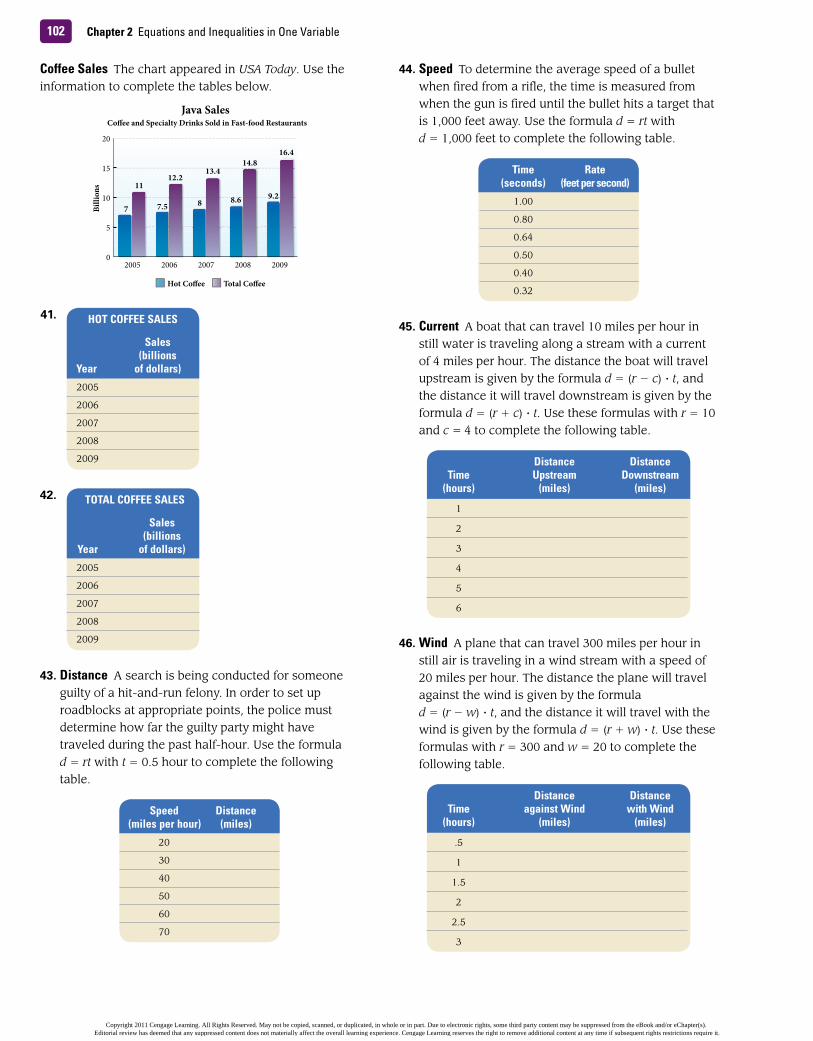
Chapter 2 Equations and Inequalities in One Variable102
Coffee sales The chart appeared in USA Today. Use the information to complete the tables below.
41.
42.
43. Distance A search is being conducted for someone guilty of a hit-and-run felony. In order to set up roadblocks at appropriate points, the police must determine how far the guilty party might have traveled during the past half-hour. Use the formula d = rt with t = 0.5 hour to complete the following table.
7
12.2
8
13.4
8.6
14.8
9.2
16.4
11
7.5
Co�ee and Specialty Drinks Sold in Fast-food Restaurants
2005 2006 2007 2008 20090
5
10
Billi
ons
15
20
Hot Co�ee Total Co�ee
Java Sales
hOt COFFEE sALEs
sales (billions Year of dollars)
2005
2006
2007
2008
2009
tOtAL COFFEE sALEs
sales (billions
Year of dollars)
2005
2006
2007
2008
2009
speed Distance (miles per hour) (miles)
20
30
40
50
60
70
44. speed To determine the average speed of a bullet when fired from a rifle, the time is measured from when the gun is fired until the bullet hits a target that is 1,000 feet away. Use the formula d = rt with d = 1,000 feet to complete the following table.
45. Current A boat that can travel 10 miles per hour in still water is traveling along a stream with a current of 4 miles per hour. The distance the boat will travel upstream is given by the formula d = (r − c) ∙ t, and the distance it will travel downstream is given by the formula d = (r + c) ∙ t. Use these formulas with r = 10 and c = 4 to complete the following table.
46. Wind A plane that can travel 300 miles per hour in still air is traveling in a wind stream with a speed of 20 miles per hour. The distance the plane will travel against the wind is given by the formula d = (r − w) ∙ t, and the distance it will travel with the wind is given by the formula d = (r + w) ∙ t. Use these formulas with r = 300 and w = 20 to complete the following table.
time Rate (seconds) (feet per second)
1.00
0.80
0.64
0.50
0.40
0.32
Distance Distance time upstream Downstream (hours) (miles) (miles)
1
2
3
4
5
6
Distance Distance time against Wind with Wind (hours) (miles) (miles)
.5
1
1.5
2
2.5
3
Copyright 2011 Cengage Learning. All Rights Reserved. May not be copied, scanned, or duplicated, in whole or in part. Due to electronic rights, some third party content may be suppressed from the eBook and/or eChapter(s). Editorial review has deemed that any suppressed content does not materially affect the overall learning experience. Cengage Learning reserves the right to remove additional content at any time if subsequent rights restrictions require it.
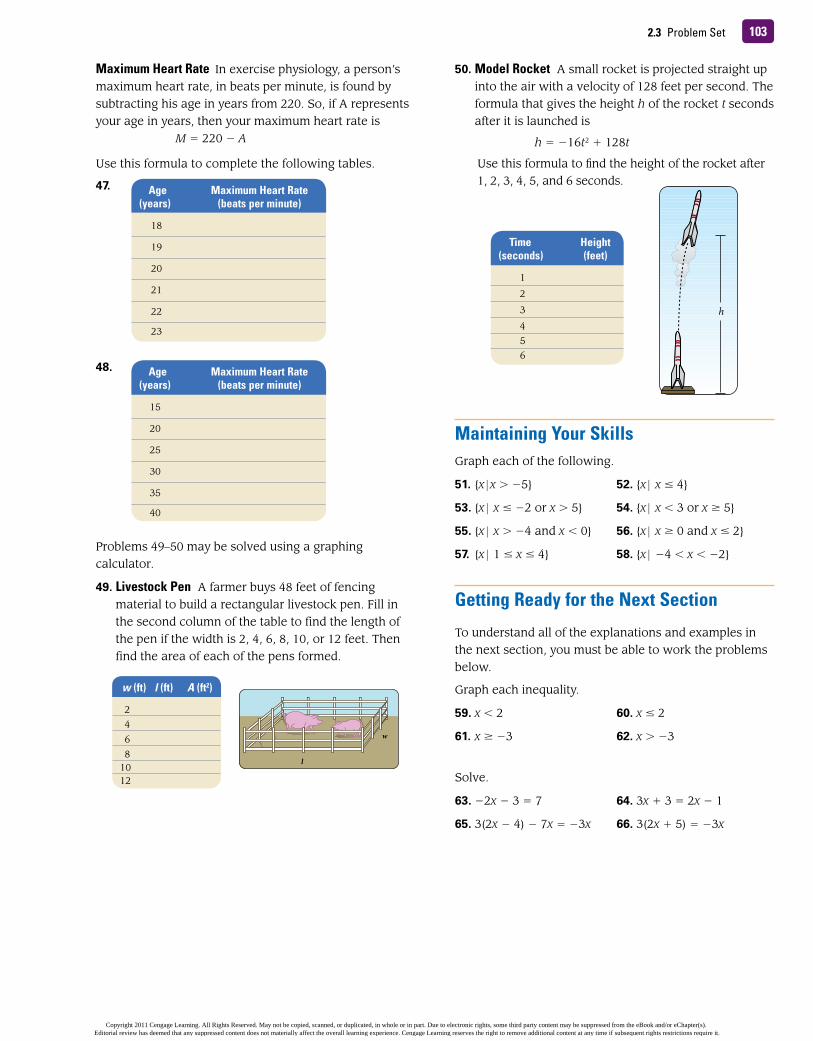
2.3 Problem Set 103
maximum heart Rate In exercise physiology, a person’s maximum heart rate, in beats per minute, is found by subtracting his age in years from 220. So, if A represents your age in years, then your maximum heart rate is
M = 220 − A
Use this formula to complete the following tables.
47.
48.
Problems 49–50 may be solved using a graphing calculator.
49. Livestock pen A farmer buys 48 feet of fencing material to build a rectangular livestock pen. Fill in the second column of the table to find the length of the pen if the width is 2, 4, 6, 8, 10, or 12 feet. Then find the area of each of the pens formed.
Age maximum heart Rate(years) (beats per minute)
18
19
20
21
22
23
Age maximum heart Rate(years) (beats per minute)
15
20
25
30
35
40
w
l
w (ft) l (ft) A (ft2)
2
4
6
8 10 12
50. model Rocket A small rocket is projected straight up into the air with a velocity of 128 feet per second. The formula that gives the height h of the rocket t seconds after it is launched is
h = −16t 2 + 128t
Use this formula to find the height of the rocket after 1, 2, 3, 4, 5, and 6 seconds.
h
time height(seconds) (feet)
1
2
3
4
5 6
maintaining Your skillsGraph each of the following.
51. {x | x > −5} 52. {x | x ≤ 4}
53. {x | x ≤ −2 or x > 5} 54. {x | x < 3 or x ≥ 5}
55. {x | x > −4 and x < 0} 56. {x | x ≥ 0 and x ≤ 2}
57. {x | 1 ≤ x ≤ 4} 58. {x | −4 < x < −2}
Getting Ready for the next section
To understand all of the explanations and examples in the next section, you must be able to work the problems below.
Graph each inequality.
59. x < 2 60. x ≤ 2
61. x ≥ −3 62. x > −3
Solve.
63. −2x − 3 = 7 64. 3x + 3 = 2x − 1
65. 3(2x − 4) − 7x = −3x 66. 3(2x + 5) = −3x
Copyright 2011 Cengage Learning. All Rights Reserved. May not be copied, scanned, or duplicated, in whole or in part. Due to electronic rights, some third party content may be suppressed from the eBook and/or eChapter(s). Editorial review has deemed that any suppressed content does not materially affect the overall learning experience. Cengage Learning reserves the right to remove additional content at any time if subsequent rights restrictions require it.

2.4
Chapter 2 Equations and Inequalities in One Variable104
OBjECtIVEs
Solve a linear inequality in one variable and graph the solution set.
B Write solutions to inequalities using interval notation.
C Solve a compound inequality and graph the solution set.
D Solve application problems using inequalities.
A
2.4 Linear Inequalities in One Variable
tICkEt tO suCCEssKeep these questions in mind as you read through the section. Then respond in your own words and in complete sentences.
1. What is a linear inequality in one variable?
2. What is the addition property for inequalities?
3. What is the multiplication property for inequalities?
4. What is interval notation?
For Florida, the National Weather Service predicted 3 or more hours of temperature readings between 27 and 32 degrees Fahrenheit during January. Temperatures in this range would cause significant damage to Florida’s $9 billion citrus industry. A citrus expert from Spain was consulted about how to manage the damage, but she needed the predictions converted to Celsius in order to render her opinion. In this section, we will begin our work with linear inequalities and their applications like this one.
A linear inequality in one variable is any inequality that can be put in the form
ax + b < c (a, b, and c are constants, a ≠ 0)
where the inequality symbol < can be replaced with any of the other three inequality symbols (≤, >, or ≥).
Some examples of linear inequalities are
3x − 2 ≥ 7 −5y < 25 3(x − 4) > 2x
A Solving Linear InequalitiesOur first property for inequalities is similar to the addition property we used when solv-ing equations.
Imag
e cop
yrigh
t ©Ev
yata
r Day
an, 2
009.
Used
unde
r lice
nse f
rom
Shut
terst
ock.c
om
Copyright 2011 Cengage Learning. All Rights Reserved. May not be copied, scanned, or duplicated, in whole or in part. Due to electronic rights, some third party content may be suppressed from the eBook and/or eChapter(s). Editorial review has deemed that any suppressed content does not materially affect the overall learning experience. Cengage Learning reserves the right to remove additional content at any time if subsequent rights restrictions require it.
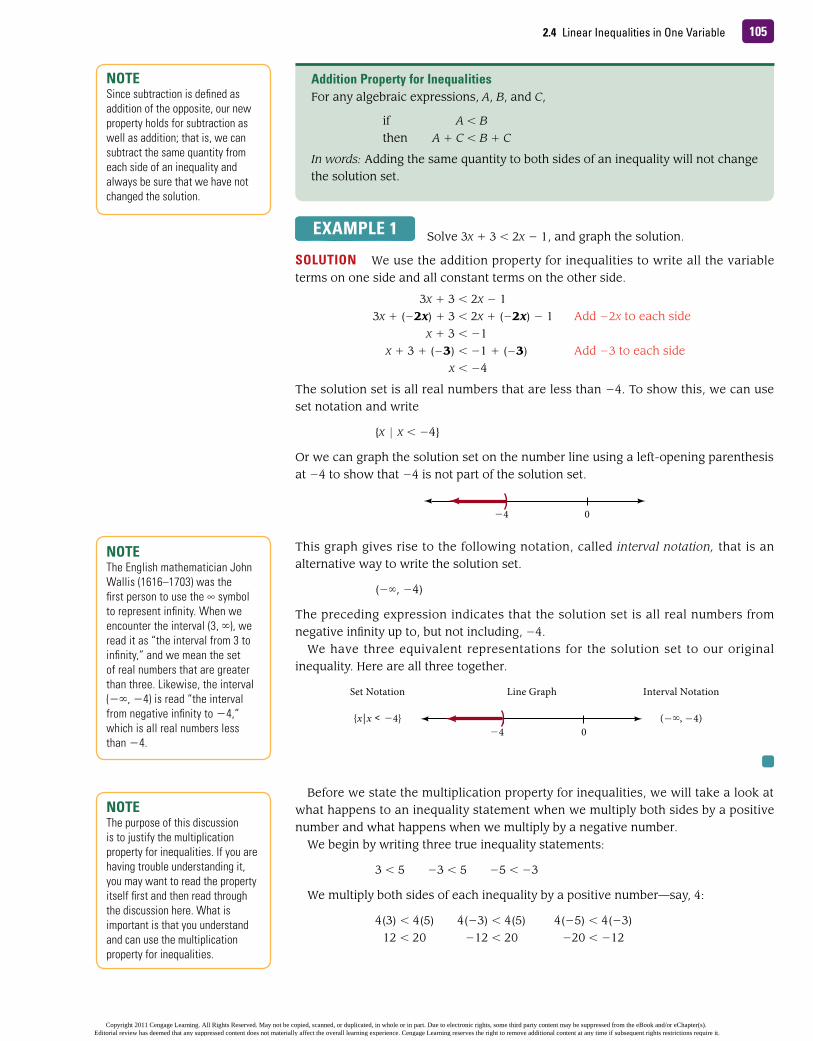
1052.4 Linear Inequalities in One Variable
ExAmpLE 1 Solve 3x + 3 < 2x − 1, and graph the solution.
sOLutIOn We use the addition property for inequalities to write all the variable terms on one side and all constant terms on the other side.
3x + 3 < 2x − 13x + (−2x) + 3 < 2x + (−2x) − 1 Add −2x to each side
x + 3 < −1x + 3 + (−3) < −1 + (−3) Add −3 to each side
x < −4
The solution set is all real numbers that are less than −4. To show this, we can use set notation and write
{x | x < −4}
Or we can graph the solution set on the number line using a left-opening parenthesis at −4 to show that −4 is not part of the solution set.
This graph gives rise to the following notation, called interval notation, that is an alternative way to write the solution set.
(−∞, −4)
The preceding expression indicates that the solution set is all real numbers from negative infinity up to, but not including, −4.
We have three equivalent representations for the solution set to our original inequality. Here are all three together.
Before we state the multiplication property for inequalities, we will take a look at what happens to an inequality statement when we multiply both sides by a positive number and what happens when we multiply by a negative number.
We begin by writing three true inequality statements:
3 < 5 −3 < 5 −5 < −3
We multiply both sides of each inequality by a positive number—say, 4:
4(3) < 4(5) 4(−3) < 4(5) 4(−5) < 4(−3)12 < 20 −12 < 20 −20 < −12
Addition property for InequalitiesFor any algebraic expressions, A, B, and C,
if A < Bthen A + C < B + C
In words: Adding the same quantity to both sides of an inequality will not change the solution set.
nOtESince subtraction is defined as addition of the opposite, our new property holds for subtraction as well as addition; that is, we can subtract the same quantity from each side of an inequality and always be sure that we have not changed the solution.
nOtEThe English mathematician John Wallis (1616–1703) was the first person to use the ∞ symbol to represent infinity. When we encounter the interval (3, ∞), we read it as “the interval from 3 to infinity,” and we mean the set of real numbers that are greater than three. Likewise, the interval (−∞, −4) is read “the interval from negative infinity to −4,” which is all real numbers less than −4.
0�4
Line Graph
{x|x < �4} (�∞, �4)
Set Notation Interval Notation
0�4
nOtEThe purpose of this discussion is to justify the multiplication property for inequalities. If you are having trouble understanding it, you may want to read the property itself first and then read through the discussion here. What is important is that you understand and can use the multiplication property for inequalities.
Copyright 2011 Cengage Learning. All Rights Reserved. May not be copied, scanned, or duplicated, in whole or in part. Due to electronic rights, some third party content may be suppressed from the eBook and/or eChapter(s). Editorial review has deemed that any suppressed content does not materially affect the overall learning experience. Cengage Learning reserves the right to remove additional content at any time if subsequent rights restrictions require it.

Chapter 2 Equations and Inequalities in One Variable106
Notice in each case that the resulting inequality symbol points in the same direction as the original inequality symbol. Multiplying both sides of an inequality by a positive number preserves the sense of the inequality.
Let’s take the same three original inequalities and multiply both sides by −4.
3 < 5 −3 < 5 −5 < −3
−4(3) > −4(5) −4(−3) > −4(5) −4(−5) > −4(−3) −12 > −20 12 > −20 20 > 12
Notice in this case that the resulting inequality symbol always points in the opposite direction from the original one. Multiplying both sides of an inequality by a negative number reverses the sense of the inequality. Keeping this in mind, we will now state the multiplication property for inequalities.
The multiplication property for inequalities does not limit what we can do with inequalities. We are still free to multiply both sides of an inequality by any nonzero number we choose. If the number we multiply by happens to be negative, then we must also reverse the direction of the inequality.
ExAmpLE 2 Find the solution set for −2y − 3 ≤ 7.
sOLutIOn We begin by adding 3 to each side of the inequality.
−2y − 3 ≤ 7
−2y ≤ 10 Add 3 to both sides
− 1 _
2 (−2y) ≥ −
1 _
2 (10) Multiply by − 1 _ 2 and reverse the
direction of the inequality symbol y ≥ −5
The solution set is all real numbers that are greater than or equal to −5. Below are three equivalent ways to represent this solution set.
Notice how a bracket is used with interval notation to show that −5 is part of the solution set.
nOtEBecause division is defined as multiplication by the reciprocal, we can apply our new property to division as well as to multiplication. We can divide both sides of an inequality by any nonzero number as long as we reverse the direction of the inequality when the number we are dividing by is negative.
multiplication property for InequalitiesLet A, B, and C represent algebraic expressions.
If A < Bthen AC < BC if C is positive (C > 0)or AC > BC if C is negative (C < 0)
In words: Multiplying both sides of an inequality by a positive number always produces an equivalent inequality. Multiplying both sides of an inequality by a negative number reverses the sense of the inequality.
−5 0
Line Graph
{y|y ≥ −5} [−5, ∞)
Set Notation Interval Notation
Copyright 2011 Cengage Learning. All Rights Reserved. May not be copied, scanned, or duplicated, in whole or in part. Due to electronic rights, some third party content may be suppressed from the eBook and/or eChapter(s). Editorial review has deemed that any suppressed content does not materially affect the overall learning experience. Cengage Learning reserves the right to remove additional content at any time if subsequent rights restrictions require it.

1072.4 Linear Inequalities in One Variable
When our inequalities become more complicated, we use the same basic steps we used in Section 2.1 to solve equations; that is, we simplify each side of the inequality before we apply the addition property or multiplication property. When we have solved the inequality, we graph the solution on a number line.
ExAmpLE 3 Solve 3(2x − 4) − 7x ≤ −3x.
sOLutIOn We begin by using the distributive property to separate terms. Next, simplify both sides.
3(2x − 4) − 7x ≤ −3x Original inequality
6x − 12 − 7x ≤ −3x Distributive property
−x − 12 ≤ −3x 6x − 7x = (6 − 7)x = −x
−12 ≤ −2x Add x to both sides
− 1 _
2 (−12) ≥ −
1 _
2 (−2x) Multiply both sides by − 1 _ 2 and reverse
the direction of the inequality symbol 6 ≥ x
This last line is equivalent to x ≤ 6. The solution set can be represented in any of the three following ways.
ExAmpLE 4 Solve and graph −3 ≤ 2x − 5 ≤ 3.
sOLutIOn We can extend our properties for addition and multiplication to cover this situation. If we add a number to the middle expression, we must add the same number to the outside expressions. If we multiply the center expression by a number, we must do the same to the outside expressions, remembering to reverse the direction of the inequality symbols if we multiply by a negative number. We begin by adding 5 to all three parts of the inequality.
−3 ≤ 2x − 5 ≤ 3 2 ≤ 2x ≤ 8 Add 5 to all three members 1 ≤ x ≤ 4 Multiply through by 1 _
2
Here are three ways to write this solution set:
B Interval Notation and GraphingThe following figure shows the connection between inequalities, interval notation, and number line graphs. We have included the graphs with open and closed circles for those of you who have used this type of graph previously. In this book, we will continue to show our graphs using the parentheses/brackets method.
nOtEIn Examples 2 and 3, notice that each time we multiplied both sides of the inequality by a negative number we also reversed the direction of the inequality symbol. Failure to do so would cause our graph to lie on the wrong side of the endpoint.
0 6
Line Graph
{x|x ≤ 6} (−∞, 6]
Set Notation Interval Notation
Line Graph
{x|1 ≤ x ≤ 4} [1, 4]
Set Notation Interval Notation
1 4
Copyright 2011 Cengage Learning. All Rights Reserved. May not be copied, scanned, or duplicated, in whole or in part. Due to electronic rights, some third party content may be suppressed from the eBook and/or eChapter(s). Editorial review has deemed that any suppressed content does not materially affect the overall learning experience. Cengage Learning reserves the right to remove additional content at any time if subsequent rights restrictions require it.

Chapter 2 Equations and Inequalities in One Variable108
This next figure shows the connection between interval notation and number line graphs for a variety of continued inequalities. Again, we have included the graphs with open and closed circles for those of you who have used this type of graph previously.
C Compound Inequalities
ExAmpLE 5 Solve the compound inequality.
3t + 7 ≤ −4 or 3t + 7 ≥ 4
sOLutIOn We solve each half of the compound inequality separately, and then we graph the solution set.
3t + 7 ≤ −4 or 3t + 7 ≥ 4
3t ≤ −11 or 3t ≥ −3 Add −7
t ≤ − 11
_
3 or t ≥ −1 Multiply by 1 _
3
The solution set can be written in any of the following ways:
x < 2
x ≤ 2
x ≥ −3
x > −3
Intervalnotation
Inequalitynotation
Graph usingparentheses/brackets
Graph usingopen and closed circles
(−3, ∞)
[−3, ∞)
(−∞, 2)
(−∞, 2]
0 2
0 2
0−3
0−3
0 2
0 2
0−3
0−3
−3 < x < 2
−3 ≤ x ≤ 2
−3 ≤ x < 2
−3 < x ≤ 2
Intervalnotation
Inequalitynotation
Graph usingparentheses/brackets
Graph usingopen and closed circles
(−3, 2]
[−3, 2)
(−3, 2)
[−3, 2]
−3 2
−3 2
2−3
2−3
−3 2
−3 2
2−3
2−3
Line Graph
t ≥ −1}{t | t ≤ (−∞, − ] ∪ [−1, ∞)
Set Notation Interval Notation
−1−
113−
113
113 or
Copyright 2011 Cengage Learning. All Rights Reserved. May not be copied, scanned, or duplicated, in whole or in part. Due to electronic rights, some third party content may be suppressed from the eBook and/or eChapter(s). Editorial review has deemed that any suppressed content does not materially affect the overall learning experience. Cengage Learning reserves the right to remove additional content at any time if subsequent rights restrictions require it.
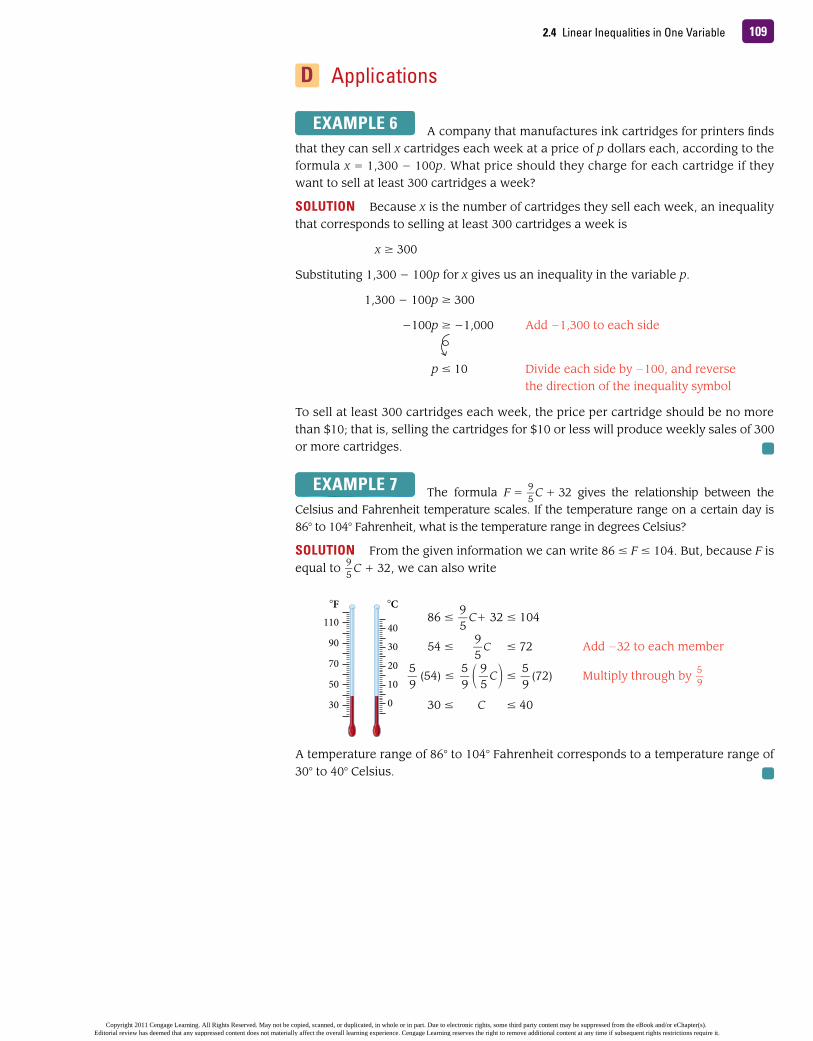
1092.4 Linear Inequalities in One Variable
D Applications
ExAmpLE 6 A company that manufactures ink cartridges for printers finds that they can sell x cartridges each week at a price of p dollars each, according to the formula x = 1,300 − 100p. What price should they charge for each cartridge if they want to sell at least 300 cartridges a week?
sOLutIOn Because x is the number of cartridges they sell each week, an inequality that corresponds to selling at least 300 cartridges a week is
x ≥ 300
Substituting 1,300 − 100p for x gives us an inequality in the variable p.
1,300 − 100p ≥ 300
−100p ≥ −1,000 Add −1,300 to each side
p ≤ 10 Divide each side by −100, and reverse the direction of the inequality symbol
To sell at least 300 cartridges each week, the price per cartridge should be no more than $10; that is, selling the cartridges for $10 or less will produce weekly sales of 300 or more cartridges.
ExAmpLE 7 The formula F = 9 _ 5 C + 32 gives the relationship between the
Celsius and Fahrenheit temperature scales. If the temperature range on a certain day is 86° to 104° Fahrenheit, what is the temperature range in degrees Celsius?
sOLutIOn From the given information we can write 86 ≤ F ≤ 104. But, because F is equal to 9 _
5 C + 32, we can also write
86 ≤ 9 _ 5
C + 32 ≤ 104
54 ≤ 9 _
5 C ≤ 72 Add −32 to each member
5 _ 9
(54) ≤ 5
_ 9
9 _ 5
C ≤ 5 _ 9
(72) Multiply through by 5 _ 9
30 ≤ C ≤ 40
A temperature range of 86° to 104° Fahrenheit corresponds to a temperature range of 30° to 40° Celsius.
110
90
70
50
30
°F
40
30
20
10
0
°C
Copyright 2011 Cengage Learning. All Rights Reserved. May not be copied, scanned, or duplicated, in whole or in part. Due to electronic rights, some third party content may be suppressed from the eBook and/or eChapter(s). Editorial review has deemed that any suppressed content does not materially affect the overall learning experience. Cengage Learning reserves the right to remove additional content at any time if subsequent rights restrictions require it.

Chapter 2 Equations and Inequalities in One Variable110
A Solve each of the following inequalities and graph each solution. [Examples 1–2]
1. 2x ≤ 3 2. 5x ≥ −115
3. 1
_ 2
x > 2 4. 1 _
3 x > 4
5. −5x ≤ 25 6. −7x ≥ 35
7. − 3
_ 2
x > −6 8. − 2 _
3 x < −8
9. −12 ≤ 2x 10. −20 ≥ 4x
11. −1 ≥ − 1 _
4 x 12. −1 ≤ −
1 _
5 x
13. −3x + 1 > 10 14. −2x − 5 ≤ 15
15. 1
_ 2
− m _ 12
≤ 7 _ 12
16. 1 _
2 − m _
10 > −
1 _
5
17. 1
_ 2
≥ − 1 _
6 − 2 _
9 x 18.
9 _
5 > −
1 _
5 − 1 _
2 x
19. −40 ≤ 30 − 20y 20. −20 > 50 − 30y
21. 2
_ 3
x − 3 < 1 22. 3 _
4 x − 2 > 7
23. 10 − 1 _ 2 y ≤ 36 24. 8 − 1 _
3 y ≥ 20
A B Simplify each side first, then solve the following inequalities. Write your answers with interval notation.[Examples 3–5]
25. 2(3y + 1) ≤ −10
26. 3(2y − 4) > 0
27. −(a + 1) − 4a ≤ 2a − 8
28. −(a − 2) − 5a ≤ 3a + 7
29. 1
_ 3
t − 1 _ 2 (5 − t ) < 0
30. 1
_ 4
t − 1 _ 3 (2t − 5) < 0
31. −2 ≤ 5 − 7(2a + 3)
32. 1 < 3 − 4(3a − 1)
33. − 1 _
3 (x + 5) ≤ −
2 _
9 (x − 1)
34. − 1
_ 2
(2x + 1) ≤ − 3
_ 8
(x + 2)
Solve each inequality. Write your answer using inequality notation.
35. 20x + 9,300 > 18,000
36. 20x + 4,800 > 18,000
B Solve the following continued inequalities. Use both a line graph and interval notation to write each solution set. [Example 4]
37. −2 ≤ m − 5 ≤ 2 38. −3 ≤ m + 1 ≤ 3
39. −60 < 20a + 20 < 60
40. −60 < 50a − 40 < 60 41. 0.5 ≤ 0.3a − 0.7 ≤ 1.1
42. 0.1 ≤ 0.4a + 0.1 ≤ 0.3
43. 3 < 1 _ 2 x + 5 < 6 44. 5 < 1 _
4 x + 1 < 9
45. 4 < 6 + 2 _ 3
x < 8
46. 3 < 7 + 4 _ 5
x < 15
C Graph the solution sets for the following compound inequalities. Then write each solution set using interval notation. [Example 5]
47. x + 5 ≤ −2 or x + 5 ≥ 2
48. 3x + 2 < −3 or 3x + 2 > 3 49. 5y + 1 ≤ −4 or 5y + 1 ≥ 4
50. 7y − 5 ≤ −2 or 7y − 5 ≥ 2 51. 2x + 5 < 3x − 1 or x − 4 > 2x + 6
52. 3x − 1 > 2x + 4 or 5x − 2 < 3x + 4
problem set 2.4
“Don't find fault, find a remedy.”—Henry Ford, 1863–1947, American industrialist
and founder of Ford Motor Company
1. How do you plan to use your resources list if you have difficulty with a word problem?
2. Should you do all of the assigned homework problems or just a few? Explain.
moving toward success
Copyright 2011 Cengage Learning. All Rights Reserved. May not be copied, scanned, or duplicated, in whole or in part. Due to electronic rights, some third party content may be suppressed from the eBook and/or eChapter(s). Editorial review has deemed that any suppressed content does not materially affect the overall learning experience. Cengage Learning reserves the right to remove additional content at any time if subsequent rights restrictions require it.
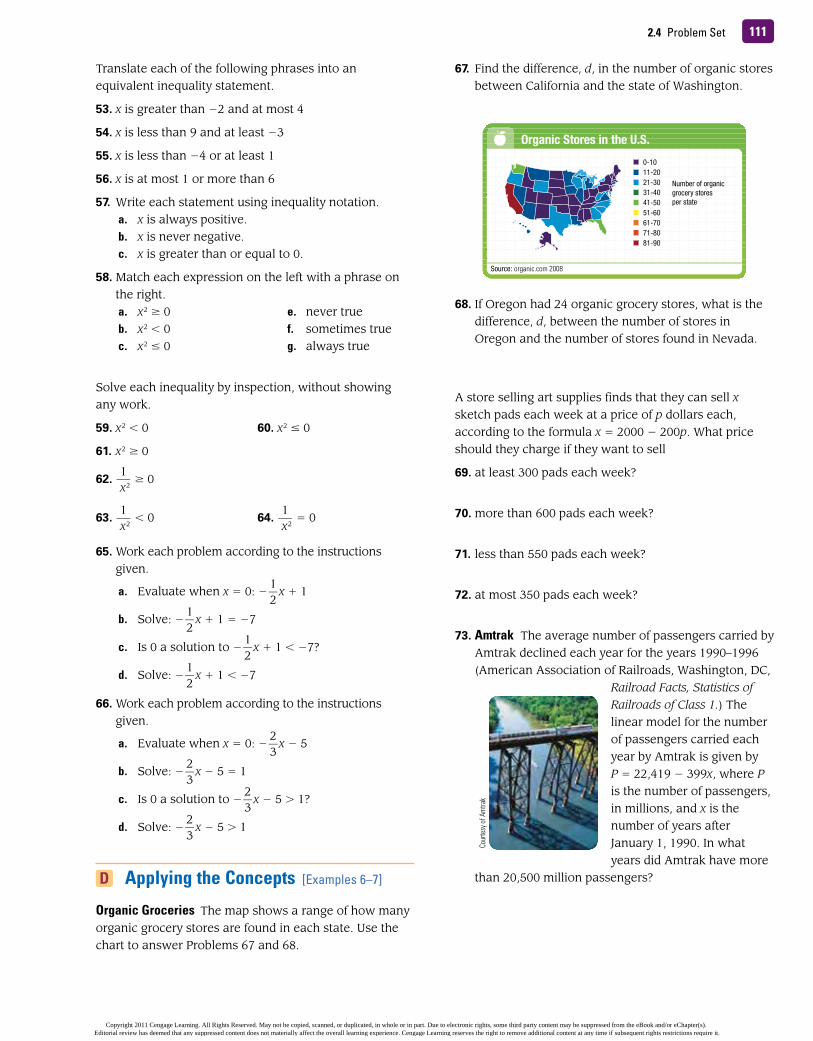
2.4 Problem Set 111
Translate each of the following phrases into an equivalent inequality statement.
53. x is greater than −2 and at most 4
54. x is less than 9 and at least −3
55. x is less than −4 or at least 1
56. x is at most 1 or more than 6
57. Write each statement using inequality notation.a. x is always positive. b. x is never negative. c. x is greater than or equal to 0.
58. Match each expression on the left with a phrase onthe right.a. x 2 ≥ 0 e. never trueb. x 2 < 0 f. sometimes truec. x 2 ≤ 0 g. always true
Solve each inequality by inspection, without showing any work.
59. x 2 < 0 60. x 2 ≤ 0
61. x 2 ≥ 0
62. 1 _
x 2 ≥ 0
63. 1 _
x 2 < 0 64.
1 _
x 2 = 0
65. Work each problem according to the instructions given.
a. Evaluate when x = 0: − 1 _
2 x + 1
b. Solve: − 1 _
2 x + 1 = −7
c. Is 0 a solution to − 1 _
2 x + 1 < −7?
d. Solve: − 1 _
2 x + 1 < −7
66. Work each problem according to the instructions given.
a. Evaluate when x = 0: − 2 _
3 x − 5
b. Solve: − 2 _
3 x − 5 = 1
c. Is 0 a solution to − 2 _
3 x − 5 > 1?
d. Solve: − 2 _
3 x − 5 > 1
D Applying the Concepts [Examples 6–7]
Organic Groceries The map shows a range of how many organic grocery stores are found in each state. Use the chart to answer Problems 67 and 68.
67. Find the difference, d, in the number of organic stores between California and the state of Washington.
68. If Oregon had 24 organic grocery stores, what is the difference, d, between the number of stores in Oregon and the number of stores found in Nevada.
A store selling art supplies finds that they can sell x sketch pads each week at a price of p dollars each, according to the formula x = 2000 − 200p. What price should they charge if they want to sell
69. at least 300 pads each week?
70. more than 600 pads each week?
71. less than 550 pads each week?
72. at most 350 pads each week?
73. Amtrak The average number of passengers carried by Amtrak declined each year for the years 1990–1996 (American Association of Railroads, Washington, DC,
Railroad Facts, Statistics of Railroads of Class 1.) The linear model for the number of passengers carried each year by Amtrak is given by P = 22,419 − 399x, where P is the number of passengers, in millions, and x is the number of years after January 1, 1990. In what years did Amtrak have more
than 20,500 million passengers?
Source: organic.com 2008
Organic Stores in the U.S.
0-1011-2021-3031-4041-5051-6061-7071-8081-90
Number of organicgrocery storesper state
Cour
tesy
of A
mtra
k
Copyright 2011 Cengage Learning. All Rights Reserved. May not be copied, scanned, or duplicated, in whole or in part. Due to electronic rights, some third party content may be suppressed from the eBook and/or eChapter(s). Editorial review has deemed that any suppressed content does not materially affect the overall learning experience. Cengage Learning reserves the right to remove additional content at any time if subsequent rights restrictions require it.

Chapter 2 Equations and Inequalities in One Variable112
74. student Loan When considering how much debt to incur in student loans, you learn that it is wise to keep your student loan payment to 8% or less of your starting monthly income. Suppose you anticipate a starting annual salary of $48,000. Set up and solve an inequality that represents the amount of monthly debt for student loans that would be considered manageable.
75. Here is what the United States Geological Survey has to say about the survival rates of the Apapane, one of the endemic birds of Hawaii.
Annual survival rates based on 1,584 recaptures of 429 banded individuals 0.72 ± 0.11 for adults and 0.13 ± 0.07 for juveniles.
Write the survival rates using inequalities. Then give the survival rates in terms of percent.
76. Here is part of a report concerning the survival rates of Western Gulls that appeared on the website of Cornell University.
Survival of eggs to hatching is 70% – 80%; of hatched chicks to fledgling 50% – 70%; of fledglings to age of first breeding < 50%.
Write the survival rates using inequalities without percent.
77. temperature Each of the following temperature ranges are in degrees Fahrenheit. Use the formula F = 9 _
5 C + 32 to find the corre sponding temperature
range in degrees Celsius.a. 95° to 113° b. 68° to 86° c. −13° to 14° d. −4° to 23°
78. temperature Each of the following temperature ranges are in degrees Celsius. Use the formula C = 5 _
9 (F − 32) to find the corre sponding temperature
range in degrees Fahrenheit.a. 5° to 15° b. −40° to −25° c. 100° to 115° d. −10° to 10°
maintaining Your skills
The problems that follow review some of the more important skills you have learned in previous sections and chapters. You can consider the time you spend working these problems as time spent studying for exams.
Simplify.
79. | −3 | 80. | 3 |
81. − | −3 | 82. −(−3)
83. Give a definition for the absolute value of x that involves the number line. (This is the geometric definition.)
84. Give a definition of the absolute value of x that does not involve the number line. (This is the algebraic definition.)
Getting Ready for the next section
To understand all of the explanations and examples in the next section, you must be able to work the problems below.
Solve each equation.
85. 2a − 1 = −7 86. 3x − 6 = 9
87. 2 _ 3
x − 3 = 7 88. 2 _
3 x − 3 = −7
89. x − 5 = x − 7
90. x + 3 = x + 8
91. x − 5 = −x − 7 92. x + 3 = −x + 8
Extending the Concepts
Assume a, b, and c are positive, and solve each formula for x.
93. ax + b < c
94. x _
a + y _
b < 1
95. −c < ax + b < c
96. −1 < ax + b _
c < 1
Copyright 2011 Cengage Learning. All Rights Reserved. May not be copied, scanned, or duplicated, in whole or in part. Due to electronic rights, some third party content may be suppressed from the eBook and/or eChapter(s). Editorial review has deemed that any suppressed content does not materially affect the overall learning experience. Cengage Learning reserves the right to remove additional content at any time if subsequent rights restrictions require it.

113
OBjECtIVEs
Solve equations with absolute value symbols. A
2.5
2.5 Equations with Absolute Value
Equations with Absolute Value
tICkEt tO suCCEssKeep these questions in mind as you read through the section. Then respond in your own words and in complete sentences.
1. Why would some equations that involve absolute value have two solutions instead of one?
2. Translate | x | = 6 into words using the definition of absolute value.
3. Explain in words what the equation | x − 3 | = 4 means with respect to distance on the number line.
4. When is the statement | x | = x true?
Suppose you are going to a new friend’s house for a barbecue. You begin by driving 4 blocks north and 10 blocks east, when you realize you are lost. You backtrack 5 blocks south and 8 blocks west before you stop for directions. How far are you away from your starting point? Since you are traveling in both positive and negative directions (backtracking) your answer may end up negative. Intuitively we know that distance cannot be negative, so what do you do with this information? After working through this section you will be able to use absolute value to determine the absolute value of a number and how it relates to the distance you have traveled.
A Solve Equations with Absolute ValuesPreviously, we defined the absolute value of x, | x | , to be the distance between x and 0 on the number line. The absolute value of a number measures its distance from 0.
ExAmpLE 1 Solve | x | = 5 for x.
sOLutIOn Using the definition of absolute value, we can read the equation as, “The distance between x and 0 on the number line is 5.” If x is 5 units from 0, then x can be 5 or −5.
If | x | = 5 then x = 5 or x = −5
In general, then, we can see that any equation of the form | a | = b is equivalent to the equations a = b or a = −b, as long as b > 0.
Imag
e cop
yrigh
t ©Ga
ry Bl
akele
y, 20
09. U
sed u
nder
licen
se fr
om S
hutte
rstoc
k.com
Copyright 2011 Cengage Learning. All Rights Reserved. May not be copied, scanned, or duplicated, in whole or in part. Due to electronic rights, some third party content may be suppressed from the eBook and/or eChapter(s). Editorial review has deemed that any suppressed content does not materially affect the overall learning experience. Cengage Learning reserves the right to remove additional content at any time if subsequent rights restrictions require it.

Chapter 2 Equations and Inequalities in One Variable114
ExAmpLE 2 Solve | 2a − 1 | = 7.
sOLutIOn We can read this question as “2a − 1 is 7 units from 0 on the number line.” The quantity 2a − 1 must be equal to 7 or −7:
| 2a − 1 | = 72a − 1 = 7 or 2a − 1 = −7
We have transformed our absolute value equation into two equations that do not involve absolute value. We can solve each equation separately.
2a − 1 = 7 or 2a − 1 = −7 2a = 8 or 2a = −6 Add 1 to both sides a = 4 or a = −3 Multiply by 1 _
2
Our solution set is {4, −3}.
To check our solutions, we put them into the original absolute value equation:
When → a = 4 When → a = −3
the equation → | 2a − 1 | = 7 the equation → | 2a − 1 | = 7
becomes → | 2(4) − 1 | = 7 becomes → | 2(−3) − 1 | = 7
| 7 | = 7 | −7 | = 7
7 = 7 7 = 7
ExAmpLE 3 Solve | 2 _ 3 x − 3 | + 5 = 12.
sOLutIOn To use the definition of absolute value to solve this equation, we must isolate the absolute value on the left side of the equal sign. To do so, we add −5 to both sides of the equation to obtain
| 2 _ 3
x − 3 | = 7
Now that the equation is in the correct form, we can write
2 _ 3
x − 3 = 7 or 2 _ 3
x − 3 = −7
2 _ 3
x = 10 or 2 _ 3
x = −4 Add 3 to both sides
x = 15 or x = −6 Multiply by 3 _ 2
The solution set is {15, −6}.
ExAmpLE 4 Solve | 3a − 6 | = −4.
sOLutIOn The solution set is ∅ because the left side cannot be negative and the right side is negative. No matter what we try to substitute for the variable a, the quantity | 3a − 6 | will always be positive or zero. It can never be −4.
Consider the statement | a | = | b | . What can we say about a and b? We know they are equal in absolute value. By the definition of absolute value, they are the same distance from 0 on the number line. They must be equal to each other or opposites of each other. In symbols, we write
| a | = | b | a a = b or a = −b h h h
Equal in Equals or Opposites absolute value
nOtERecall that ∅ is the symbol we use to denote the empty set. When we use it to indicate the solutions to an equation, then we are saying the equation has no solution.
Copyright 2011 Cengage Learning. All Rights Reserved. May not be copied, scanned, or duplicated, in whole or in part. Due to electronic rights, some third party content may be suppressed from the eBook and/or eChapter(s). Editorial review has deemed that any suppressed content does not materially affect the overall learning experience. Cengage Learning reserves the right to remove additional content at any time if subsequent rights restrictions require it.

2.5 Problem Set 115
A Use the definition of absolute value to solve each of the following equations. [Examples 1–2]
1. | x | = 4 2. | x | = 7
3. 2 = | a | 4. 5 = | a |
5. | x | = −3 6. | x | = −4
7. | a | + 2 = 3 8. | a | − 5 = 2
9. | y | + 4 = 3 10. | y | + 3 = 1
11. 4 = | x | − 2 12. 3 = | x | − 5
13. | x − 2 | = 5 14. | x + 1 | = 2
15. | a − 4 | = 5 _ 3 16. | a + 2 | = 7 _
5
17. 1 = | 3 − x | 18. 2 = | 4 − x |
19. | 3 _ 5 a + 1 _
2 | = 1 20. | 2 _
7 a + 3 _
4 | = 1
21. 60 = | 20x − 40 |
22. 800 = | 400x − 200 |
23. | 2x + 1 | = −3 24. | 2x − 5 | = −7
25. | 3 _ 4 x − 6 | = 9 26. | 4 _
5 x − 5 | = 15
27. | 1 − 1 _ 2 a | = 3 28. | 2 − 1 _
3 a | = 10
Solve each equation. [Examples 3–5]
29. | 3x + 4 | + 1 = 7 30. | 5x − 3 | − 4 = 3
31. | 3 − 2y | + 4 = 3 32. | 8 − 7y | + 9 = 1
33. 3 + | 4t − 1 | = 8 34. 2 + | 2t − 6 | = 10
35. | 9 − 3 _ 5
x | + 6 = 12
36. | 4 − 2 _ 7 x | + 2 = 14
37. 5 = | 2x _ 7
+ 4 _ 7
| − 3
38. 7 = | 3x _ 5
+ 1 _ 5
| + 2
39. 2 = −8 + | 4 − 1 _ 2
y |
40. 1 = −3 + | 2 − 1 _ 4
y |
41. | 3a + 1 | = | 2a − 4 |
42. | 5a + 2 | = | 4a + 7 |
43. | x − 1 _ 3
| = | 1 _ 2
x + 1 _ 6
|
44. | 1 _ 10
x − 1 _ 2
| = | 1 _ 5
x + 1 _ 10
|
ExAmpLE 5 Solve | x − 5 | = | x − 7 |.
sOLutIOn The quantities x − 5 and x − 7 must be equal or they must be opposites, because their absolute values are equal:
Equals Opposites x − 5 = x − 7 or x − 5 = −(x − 7) −5 = −7 x − 5 = −x + 7No solution here 2x − 5 = 7 2x = 12 x = 6
Because the first equation leads to a false statement, it will not give us a solution. (If either of the two equations were to reduce to a true statement, it would mean all real numbers would satisfy the original equation.) In this case, our only solution is x = 6.
problem set 2.5
“Forget the times of your distress, but never forget what they taught you.”
—Herbert Gasser, 1888–1963, American physiologist
1. Do you think you will make mistakes on tests and quizzes, even when you understand the material?
2. If you make a mistake on a test or a quiz, how do you plan on learning from it?
moving toward success
Copyright 2011 Cengage Learning. All Rights Reserved. May not be copied, scanned, or duplicated, in whole or in part. Due to electronic rights, some third party content may be suppressed from the eBook and/or eChapter(s). Editorial review has deemed that any suppressed content does not materially affect the overall learning experience. Cengage Learning reserves the right to remove additional content at any time if subsequent rights restrictions require it.

Chapter 2 Equations and Inequalities in One Variable116
45. | y − 2 | = | y + 3 | 46. | y − 5 | = | y − 4 |
47. | 3x − 1 | = | 3x + 1 | 48. | 5x − 8 | = | 5x + 8 |
49. | 3 − m | = | m + 4 | 50. | 5 − m | = | m + 8 |
51. | 0.03 − 0.01x | = | 0.04 + 0.05x |
52. | 0.07 − 0.01x | = | 0.08 − 0.02x |
53. | x − 2 | = | 2 − x |
54. | x − 4 | = | 4 − x |
55. | x _ 5
− 1 | = | 1 − x _ 5 |
56. | x _ 3
− 1 | = | 1 − x _ 3 |
57. Work each problem according to the instructions given.
a. Solve: 4x − 5 = 0
b. Solve: | 4x − 5 | = 0
c. Solve: 4x − 5 = 3
d. Solve: | 4x − 5 | = 3
e. Solve: | 4x − 5 | = | 2x + 3 |
58. Work each problem according to the instructions given.
a. Solve: 3x + 6 = 0
b. Solve: | 3x + 6 | = 0
c. Solve: 3x + 6 = 4
d. Solve: | 3x + 6 | = 4
e. Solve: | 3x + 6 | = | 7x + 4 |
Applying the Concepts
59. skyscrapers The chart shows the heights of the three tallest buildings in the world. Write an expression that finds the difference in height between the Taipei 101 and the Shanghai World Financial Center using absolute values.
Source: www.emporis.com
Such Great Heights
1,671 ft
Taipei 101Taipei, Taiwan
2,716 ft
Burj KhalifaDubai, United Arab Emerites
1,614 ft
Shanghai World Financial CenterShanghai, China
60. Amtrak Amtrak’s annual passenger revenue for the years 1985–1995 is modeled approximately by the formula
R = −60 | x − 11 | + 962
where R is the annual revenue in millions of dollars and x is the number of years since January 1, 1980 (Association of American Railroads, Washington, DC, Railroad Facts, Statistics of Railroads of Class 1, annual). In what years was the passenger revenue $722 mil-lion?
maintaining Your skills
Graph the following inequalities.
61. x < −2 or x > 8 62. 1 < x < 4
63. −2 ≤ x ≤ 1 64. x ≤ − 3
_ 2
or x ≥ 3
Simplify each expression.
65. 38
_ 30
66. 10
_ 25
67. 240 _
6 68.
39 _
13
69. 0 + 6
_ 0 − 3
70. 6 + 6
_ 6 − 3
71. 4 − 4
_ 4 − 2
72. 3 + 6
_ 3 − 3
Getting Ready for the next section
To understand all of the explanations and examples in the next section, you must be able to work the problems below.
Solve each inequality. Do not graph the solution set.
73. 2x − 5 < 3 74. −3 < 2x − 5
75. −4 ≤ 3a + 7 76. 3a + 7 ≤ 4
77. 4t − 3 ≤ −9 78. 4t − 3 ≥ 9
Solve each inequality for x.
79. | x − a | = b
80. | x + a | − b = 0
81. | ax + b | = c
82. | ax − b | − c = 0
83. | x _ a + y _
b | = 1
84. | x _ a + y _
b | = c
Copyright 2011 Cengage Learning. All Rights Reserved. May not be copied, scanned, or duplicated, in whole or in part. Due to electronic rights, some third party content may be suppressed from the eBook and/or eChapter(s). Editorial review has deemed that any suppressed content does not materially affect the overall learning experience. Cengage Learning reserves the right to remove additional content at any time if subsequent rights restrictions require it.

117
OBjECtIVEs
Solve inequalities with absolute value and graph the solution set.
A
2.6
2.6 Inequalities Involving Absolute Value
Inequalities Involving Absolute Value
tICkEt tO suCCEssKeep these questions in mind as you read through the section. Then respond in your own words and in complete sentences.
1. Write an inequality containing absolute value, the solution to which is all the numbers between −5 and 5 on the number line. Why is it important to translate expressions written in symbols into the English language?
2. Translate | x | < 3 into words using the definition of absolute value.
3. Explain in words what the inequality | x − 5 | < 2 means with respect to distance on the number line.
4. Why is there no solution to the inequality | 2x − 3 | < 0?
The chart below shows the heights of the three highest buildings in the world.
The relative size of objects can be compared by extending the use of absolute value to include linear inequalities. In this section, we will again apply the definition of absolute value to solve inequalities involving absolute value. You will see how to compare the heights of these three buildings.
A Solving Inequalities with Absolute ValuesThe absolute value of x, which is | x | , represents the distance that x is from 0 on the number line. We will begin by considering three absolute value equations/inequalities and their English translations.
Imag
e cop
yrigh
t ©ha
inault
phot
o, 20
09. U
sed u
nder
licen
se fr
om S
hutte
rstoc
k.com
Source: www.emporis.com
Such Great Heights
1,671 ft
Taipei 101Taipei, Taiwan
2,716 ft
Burj KhalifaDubai, United Arab Emerites
1,614 ft
Shanghai World Financial CenterShanghai, China
Copyright 2011 Cengage Learning. All Rights Reserved. May not be copied, scanned, or duplicated, in whole or in part. Due to electronic rights, some third party content may be suppressed from the eBook and/or eChapter(s). Editorial review has deemed that any suppressed content does not materially affect the overall learning experience. Cengage Learning reserves the right to remove additional content at any time if subsequent rights restrictions require it.
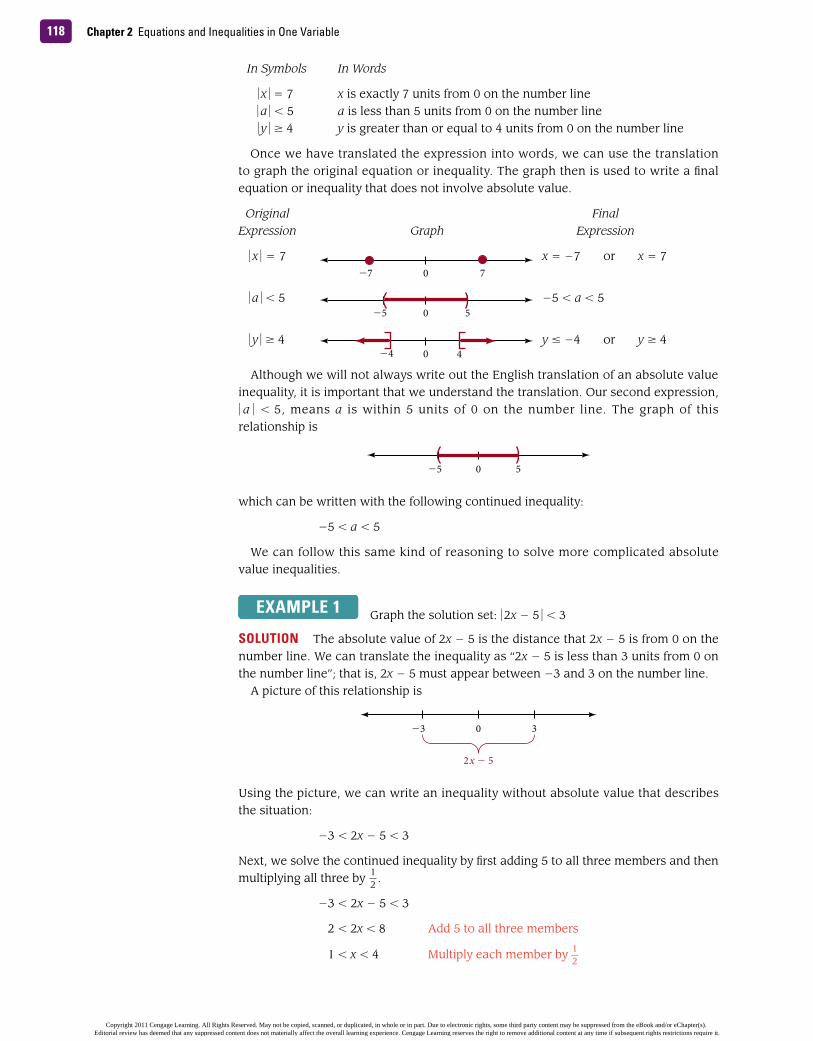
Chapter 2 Equations and Inequalities in One Variable118
In Symbols In Words
| x | = 7 x is exactly 7 units from 0 on the number line | a | < 5 a is less than 5 units from 0 on the number line | y | ≥ 4 y is greater than or equal to 4 units from 0 on the number line
Once we have translated the expression into words, we can use the translation to graph the original equation or inequality. The graph then is used to write a final equation or inequality that does not involve absolute value.
Original FinalExpression Graph Expression
| x | = 7 x = −7 or x = 7
| a | < 5 −5 < a < 5
| y | ≥ 4 y ≤ −4 or y ≥ 4
Although we will not always write out the English translation of an absolute value inequality, it is important that we understand the translation. Our second expression,
| a | < 5, means a is within 5 units of 0 on the number line. The graph of this relationship is
which can be written with the following continued inequality:
−5 < a < 5
We can follow this same kind of reasoning to solve more complicated absolute value inequalities.
ExAmpLE 1 Graph the solution set: | 2x − 5 | < 3
sOLutIOn The absolute value of 2x − 5 is the distance that 2x − 5 is from 0 on the number line. We can translate the inequality as “2x − 5 is less than 3 units from 0 on the number line”; that is, 2x − 5 must appear between −3 and 3 on the number line.
A picture of this relationship is
Using the picture, we can write an inequality without absolute value that describes the situation:
−3 < 2x − 5 < 3
Next, we solve the continued inequality by first adding 5 to all three members and then multiplying all three by 1 _
2 .
−3 < 2x − 5 < 3
2 < 2x < 8 Add 5 to all three members
1 < x < 4 Multiply each member by 1 _ 2
4
5
�7 70
�4
�5 0
0
�5 0 5
�3 0 3
2x � 5
Copyright 2011 Cengage Learning. All Rights Reserved. May not be copied, scanned, or duplicated, in whole or in part. Due to electronic rights, some third party content may be suppressed from the eBook and/or eChapter(s). Editorial review has deemed that any suppressed content does not materially affect the overall learning experience. Cengage Learning reserves the right to remove additional content at any time if subsequent rights restrictions require it.

1192.6 Inequalities Involving Absolute Value
The graph of the solution set is
We can see from the solution that for the absolute value of 2x − 5 to be within 3 units of 0 on the number line, x must be between 1 and 4.
ExAmpLE 2 Solve and graph | 3a + 7 | ≤ 4.
sOLutIOn We can read the inequality as, “The distance between 3a + 7 and 0 is less than or equal to 4.” Or, “3a + 7 is within 4 units of 0 on the number line.” This relationship can be written without absolute value as
−4 ≤ 3a + 7 ≤ 4
Solving as usual, we have
−4 ≤ 3a + 7 ≤ 4
−11 ≤ 3a ≤ −3 Add −7 to all three members
− 11
_ 3 ≤ a ≤ −1 Multiply each member by 1 _
3
We can see from Examples 1 and 2 that to solve an inequality involving absolute value, we must be able to write an equivalent expression that does not involve absolute value.
ExAmpLE 3 Solve | x − 3 | > 5 and graph the solution.
sOLutIOn We interpret the absolute value inequality to mean that x − 3 is more than 5 units from 0 on the number line. The quantity x − 3 must be either above 5 or below −5. Here is a picture of the relationship:
An inequality without absolute value that also describes this situation is
x − 3 < −5 or x − 3 > 5
Adding 3 to both sides of each inequality we have
x < −2 or x > 8
The graph of which is
ExAmpLE 4 Graph the solution set: | 4t − 3 | ≥ 9
sOLutIOn The quantity 4t − 3 is greater than or equal to 9 units from 0. It must be either above 9 or below −9.
4t − 3 ≤ −9 or 4t − 3 ≥ 9
4t ≤ −6 or 4t ≥ 12 Add 3
1 4
�1113�
�5 0 5
orx � 3 x � 3
�2 8
Copyright 2011 Cengage Learning. All Rights Reserved. May not be copied, scanned, or duplicated, in whole or in part. Due to electronic rights, some third party content may be suppressed from the eBook and/or eChapter(s). Editorial review has deemed that any suppressed content does not materially affect the overall learning experience. Cengage Learning reserves the right to remove additional content at any time if subsequent rights restrictions require it.

Chapter 2 Equations and Inequalities in One Variable120
t ≤ − 6 _
4 or t ≥ 12
_
4 Multiply by 1 _
4
t ≤ − 3
_ 2
or t ≥ 3
We can use the results of our first few examples and the material in the previous section to summarize the information we have related to absolute value equations and inequalities.
ExAmpLE 5 Solve and graph | 2x + 3 | + 4 < 9.
sOLutIOn Before we can apply the method of solution we used in the previous examples, we must isolate the absolute value on one side of the inequality. To do so, we add −4 to each side.
| 2x + 3 | + 4 < 9
| 2x + 3 | + 4 + (−4) < 9 + (−4)
| 2x + 3 | < 5
From this last line we know that 2x + 3 must be between −5 and 5.
−5 < 2x + 3 < 5
−8 < 2x < 2 Add −3 to each member
−4 < x < 1 Multiply each member by 1 _ 2
The graph is
ExAmpLE 6 Solve and graph | 4 − 2t | > 2.
sOLutIOn The inequality indicates that 4 − 2t is less than −2 or greater than 2. Writing this without absolute value symbols, we have
4 − 2t < −2 or 4 − 2t > 2
To solve these inequalities, we begin by adding −4 to each side.
4 + (−4) − 2t < −2 + (−4) or 4 + (−4) − 2t > 2 + (−4)
−2t < −6 or −2t > −2
332�
Rewriting Absolute Value Equations and InequalitiesIf c is a positive real number, then each of the following statements on the left is equivalent to the corresponding statement on the right.
With Absolute Value Without Absolute Value | x | = c x = −c or x = c | x | < c −c < x < c | x | > c x < −c or x > c | ax + b | = c ax + b = −c or ax + b = c | ax + b | < c −c < ax + b < c | ax + b | > c ax + b < −c or ax + b > c
�4 1
Copyright 2011 Cengage Learning. All Rights Reserved. May not be copied, scanned, or duplicated, in whole or in part. Due to electronic rights, some third party content may be suppressed from the eBook and/or eChapter(s). Editorial review has deemed that any suppressed content does not materially affect the overall learning experience. Cengage Learning reserves the right to remove additional content at any time if subsequent rights restrictions require it.

2.6 Problem Set 121
Next we must multiply both sides of each inequality by − 1 _ 2 . When we do so, we must
also reverse the direction of each inequality symbol.
−2t < −6 or −2t > −2
− 1 _
2 (−2t) > −
1 _
2 (−6) or −
1 _
2 (−2t) < −
1 _
2 (−2)
t > 3 or t < 1
Although, in situations like this, we are used to seeing the “less than” symbol written first, the meaning of the solution is clear. We want to graph all real numbers that are either greater than 3 or less than 1. Here is the graph.
Because absolute value always results in a nonnegative quantity, we sometimes come across special solution sets when a negative number appears on the right side of an absolute value inequality.
ExAmpLE 7 Solve | 7y − 1 | < −2.
sOLutIOn The left side is never negative because it is an absolute value. The right side is negative. We have a positive quantity (or zero) less than a negative quantity, which is impossible. The solution set is the empty set, ∅. There is no real number to substitute for y to make this inequality a true statement.
ExAmpLE 8 Solve | 6x + 2 | > −5.
sOLutIOn This is the opposite case from that in Example 7. No matter what real number we use for x on the left side, the result will always be positive, or zero. The right side is negative. We have a positive quantity (or zero) greater than a negative quantity. Every real number we choose for x gives us a true statement. The solution set is the set of all real numbers.
nOtERemember, the multiplication property for inequalities requires that we reverse the direction of the inequality symbol every time we multiply both sides of an inequality by a negative number.
1 3
problem set 2.6
“If you have made mistakes, even serious ones, there is always another chance for you. What we call failure is not the falling down but the staying down.”
—Mary Pickford, 1892–1979, Canadian-born movie actress
1. Does a poor score on a test or difficulties with problems typically derail your focus in this class? Why or why not?
2. How do you intend to prevent setbacks from keeping you from your goals?
moving toward success
A Solve each of the following inequalities using the definition of absolute value. Graph the solution set in each case. [Examples 1–4, 7–8]
1. | x | < 3 2. | x | ≤ 7
3. | x | ≥ 2 4. | x | > 4
5. | x | + 2 < 5 6. | x | − 3 < −1
7. | t | − 3 > 4
8. | t | + 5 > 8
9. | y | < −5 10. | y | > −3
Copyright 2011 Cengage Learning. All Rights Reserved. May not be copied, scanned, or duplicated, in whole or in part. Due to electronic rights, some third party content may be suppressed from the eBook and/or eChapter(s). Editorial review has deemed that any suppressed content does not materially affect the overall learning experience. Cengage Learning reserves the right to remove additional content at any time if subsequent rights restrictions require it.

Chapter 2 Equations and Inequalities in One Variable122
11. | x | ≥ −2 12. | x | ≤ −4
13. | x − 3 | < 7
14. | x + 4 | < 2
15. | a + 5 | ≥ 4
16. | a − 6 | ≥ 3
Solve each inequality and graph the solution set. [Examples 1–5, 7–8]
17. | a − 1 | < −3
18. | a + 2 | ≥ −5
19. | 2x − 4 | < 6
20. | 2x + 6 | < 2
21. | 3y + 9 | ≥ 6
22. | 5y − 1 | ≥ 4
23. | 2k + 3 | ≥ 7
24. | 2k − 5 | ≥ 3
25. | x − 3 | + 2 < 6
26. | x + 4 | − 3 < −1
27. | 2a + 1 | + 4 ≥ 7
28. | 2a − 6 | − 1 ≥ 2
29. | 3x + 5 | − 8 < 5
30. | 6x − 1 | − 4 ≤ 2
Solve each inequality, and graph the solution set. Keep in mind that if you multiply or divide both sides of an inequality by a negative number, you must reverse the inequality sign. [Example 6]
31. | 5 − x | > 3
32. | 7 − x | > 2
33. | 3 − 2 _ 3 x | ≥ 5
34. | 3 − 3 _ 4 x | ≥ 9
35. | 2 − 1 _ 2 x | > 1
36. | 3 − 1 _ 3 x | > 1
Solve each inequality.
37. | x − 1 | < 0.01
38. | x + 1 | < 0.01
39. | 2x + 1 | ≥ 1 _ 5
40. | 2x − 1 | ≥ 1 _ 8
41. | 3x − 2 _ 5 | ≤ 1 _
2 42. | 4x − 3 _
2 | ≤ 1 _
3
43. | 2x − 1 _ 5
| < 0.3
44. | 3x − 3 _ 5
| < 0.2
45. Write −1 ≤ x − 5 ≤ 1 as a single inequality involving absolute value.
46. Write −3 ≤ x + 2 ≤ 3 as a single inequality involvingabsolute value.
47. Is 0 a solution to | 5x + 3 | > 7?
48. Is 0 a solution to | −2x − 5 | > 1?
49. Solve: | 5x + 3 | > 7
50. Solve: | −2x − 5 | > 1
maintaining Your skills
Simplify each expression as much as possible.
51. −9 ÷ 3 _ 2
52. − 4 _
5 ÷ (−4)
53. 3 − 7(−6 − 3) 54. (3 − 7)(−6 − 3)
55. −4(−2)3 − 5(−3)2
56. 4(2 − 5)3 − 3(4 − 5)5
57. 2(−3) − 5(−6) __
−1 − 2 − 3 58.
4 − 8(3 − 5) __
2 − 4(3 − 5)
59. 6(1) − 1(−5) + 1(2)
60. −2(−14) + 3(−4) − 1(−10)
61. 1(0)(1) + 3(1)(4) + (−2)(2)(−1)
62. −3(−1 − 1) + 4(−2 + 2) − 5[2 − (−2)]
63. 4(−1)2 + 3(−1) − 2
64. 5 ⋅ 23 − 3 ⋅ 22 + 4 ⋅ 2 − 5
Extending the Concepts
Solve each inequality for x. (Assume a, b, and c are all positive.)
65. | x − a | < b
66. | x − a | > b
67. | ax − b | > c
68. | ax − b | < c
69. | ax + b | ≤ c
70. | ax + b | ≥ c
Copyright 2011 Cengage Learning. All Rights Reserved. May not be copied, scanned, or duplicated, in whole or in part. Due to electronic rights, some third party content may be suppressed from the eBook and/or eChapter(s). Editorial review has deemed that any suppressed content does not materially affect the overall learning experience. Cengage Learning reserves the right to remove additional content at any time if subsequent rights restrictions require it.

123
Chapter 2 Summary
Chapter 2 Summary
Addition property of Equality [2.1]
For algebraic expressions A, B, and C,if A = B
then A + C = B + C
This property states that we can add the same quantity to both sides of an equation without changing the solution set.
multiplication property of Equality [2.1]
For algebraic expressions A, B, and C,if A = B
then AC = BC (C ≠ 0)
Multiplying both sides of an equation by the same nonzero quantity never changes the solution set.
strategy for solving Linear Equations in One Variable [2.1]
Step 1: a. Use the distributive property to separate terms, if necessary.
b. If fractions are present, consider multiplying both sides by the LCD to eliminate the fractions. If decimals are present, consider multiplying both sides by a power of 10 to clear the equation of decimals.
c. Combine similar terms on each side of the equation.
Step 2: Use the addition property of equality to get all variable terms on one side of the equation and all constant terms on the other side. A variable term is a term that contains the variable (for example, 5x). A constant term is a term that does not contain the variable (the number 3, for example).
Step 3: Use the multiplication property of equality to get the variable by itself on one side of the equation.
Step 4: Check your solution in the original equation to be sure that you have not made a mistake in the solution process.
Formulas [2.2]
A formula in algebra is an equation involving more than one variable. To solve a formula for one of its variables, simply isolate that variable on one side of the equation.
ExAmpLEs1. We can solve
x + 3 = 5
by adding −3 to both sides:
x + 3 + (−3) = 5 + (−3) x = 2
2. We can solve 3x = 12 by multiplying both sides by 1 _
3 .
3x = 12
1 _ 3 (3x) = 1 _
3 (12)
x = 4
3. Solve: 3(2x − 1) = 9.
3(2x − 1) = 9 6x − 3 = 9 6x − 3 + 3 = 9 + 3 6x = 12
1 _ 6 (6x) = 1 _
6 (12)
x = 2
4. Solve for w:
P = 2l + 2w P − 21 = 2w
P − 2l _
2 = w
Copyright 2011 Cengage Learning. All Rights Reserved. May not be copied, scanned, or duplicated, in whole or in part. Due to electronic rights, some third party content may be suppressed from the eBook and/or eChapter(s). Editorial review has deemed that any suppressed content does not materially affect the overall learning experience. Cengage Learning reserves the right to remove additional content at any time if subsequent rights restrictions require it.

Chapter 2 Equations and Inequalities in One Variable124
Blueprint for problem solving [2.3]
Step 1: Read the problem, and then mentally list the items that are known and the items that are unknown.
Step 2: Assign a variable to one of the unknown items. (In most cases this will amount to letting x = the item that is asked for in the problem.) Then translate the other information in the problem to expressions involving the variable.
Step 3: Reread the problem, and then write an equation, using the items and variables listed in steps 1 and 2, that describes the situation.
Step 4: Solve the equation found in step 3.
Step 5: Write your answer using a complete sentence.
Step 6: Reread the problem, and check your solution with the original words in the problem.
Addition property for Inequalities [2.4]
For expressions A, B, and C,if A < B
then A + C < B + C
Adding the same quantity to both sides of an inequality never changes the solution set.
multiplication property for Inequalities [2.4]
For expressions A, B, and C,if A < B
then AC < BC if C > 0 (C is positive)
or AC > BC if C < 0 (C is negative)
We can multiply both sides of an inequality by the same nonzero number without changing the solution set as long as each time we multiply by a negative number we also reverse the direction of the inequality symbol.
5. The perimeter of a rectangle is 32 inches. If the length is 3 times the width, find the dimensions.
Step 1: This step is done mentally.
Step 2: Let x = the width. Then the length is 3x.
Step 3: The perimeter is 32; therefore
2x + 2(3x) = 32
Step 4: 8x = 32 x = 4
Step 5: The width is 4 inches. The length is 3(4) = 12 inches.
Step 6: The perimeter is 2(4) + 2(12), which is 32. The length is 3 times the width.
6. Adding 5 to both sides of the inequality x − 5 < −2 gives
x − 5 + 5 < −2 + 5 x < 3
0 3
7. Multiplying both sides of −2x ≥ 6 by − 1 _
2 gives
−2x ≥ 6
− 1 _ 2 (−2x) ≤ − 1 _
2 (6)
x ≤ −3
0�3
Copyright 2011 Cengage Learning. All Rights Reserved. May not be copied, scanned, or duplicated, in whole or in part. Due to electronic rights, some third party content may be suppressed from the eBook and/or eChapter(s). Editorial review has deemed that any suppressed content does not materially affect the overall learning experience. Cengage Learning reserves the right to remove additional content at any time if subsequent rights restrictions require it.

Chapter 2 Review 125
Absolute Value Equations [2.5]
To solve an equation that involves absolute value, we isolate the absolute value on one side of the equation and then rewrite the absolute value equation as two separate equations that do not involve absolute value. In general, if b is a positive real number, then
| a | = b is equivalent to a = b or a = −b
Absolute Value Inequalities [2.6]
To solve an inequality that involves absolute value, we first isolate the absolute value on the left side of the inequality symbol. Then we rewrite the absolute value inequality as an equivalent continued or compound inequality that does not contain absolute value symbols. In general, if b is a positive real number, then
| a | < b is equivalent to −b < a < band
| a | > b is equivalent to a < −b or a > b
8. To solve
| 2x − 1 | + 2 = 7
we first isolate the absolute value on the left side by adding −2 to each side to obtain
| 2x − 1 | = 5 2x − 1 = 5 or 2x − 1 = −5 2x = 6 or 2x = −4 x = 3 or x = −2
9. To solve
| x − 3 | + 2 < 6
we first add −2 to both sides to obtain
| x − 3 | < 4
which is equivalent to
−4 < x − 3 < 4 −1 < x < 7
A very common mistake in solving inequalities is to forget to reverse the direction of the inequality symbol when multiplying both sides by a negative number. When this mistake occurs, the graph of the solution set is always drawn on the wrong side of the endpoint.
COmmOn mIstAkEs
Chapter 2 Review
Solve each equation. [2.1]
1. x − 3 = 7 2. 5x − 2 = 8
3. 400 − 100a = 200 4. 5 − 2 _ 3 a = 7
5. 4x − 2 = 7x + 7 6. 3 _
2 x − 1 _
6 = −
7 _
6 x − 1 _
6
7. 7y − 5 − 2y = 2y − 3
8. 3y _
4 − 1 _
2 + 3y
_ 2 = 2 − y
9. 3(2x + 1) = 18 10. − 1 _
2 (4x − 2) = −x
11. 8 − 3(2t + 1) = 5(t + 2)
12. 8 + 4(1 − 3t ) = −3(t − 4) + 2
Substitute the given values in each formula and then solve for the variable that does not have a numerical replacement. [2.2]
13. P = 2b + 2h: P = 40, b = 3
14. A = P + Prt: A = 2,000, P = 1,000, r = 0.05
Solve each formula for the indicated variable. [2.2]
15. I = prt for p 16. y = mx + b for x
Copyright 2011 Cengage Learning. All Rights Reserved. May not be copied, scanned, or duplicated, in whole or in part. Due to electronic rights, some third party content may be suppressed from the eBook and/or eChapter(s). Editorial review has deemed that any suppressed content does not materially affect the overall learning experience. Cengage Learning reserves the right to remove additional content at any time if subsequent rights restrictions require it.

Chapter 2 Equations and Inequalities in One Variable126
17. 4x − 3y = 12 for y
18. d = vt + 16t 2 for v
Solve each formula for y. [2.2]
19. 5x + 3y − 6 = 0
20. x _
3 + y _
2 = 1
21. y + 3 = −2(x − 1)
22. y + 2
_ x − 1
= −3
Solve each application. In each case, be sure to show the equation that describes the situation. [2.3]
23. Geometry The length of a rectangle is 3 times the width. The perimeter is 32 feet. Find the length and width.
24. Geometry The three sides of a triangle are given by three consecutive integers. If the perimeter is 12 meters, find the length of each side.
25. Brick Laying The formula N = 7 ⋅ L ⋅ H gives the number of standard bricks needed in a wall of L feet long and H feet high and is called the brick-layer’s formula.a. How many bricks would be required in a wall 45
feet long by 12 feet high? b. An 8-foot-high wall is to be built from a load of
35,000 bricks. What length wall can be built?
26. salary A teacher has a salary of $25,920 for her second year on the job. If this is 4.2% more than her first year salary, how much did she earn her first year?
Solve each inequality. Write your answer using interval notation. [2.4]
27. −8a > −4 28. 6 − a ≥ −2
29. 3
__ 4
x + 1 ≤ 10
30. 800 − 200x < 1,000
31. 1
__ 3
≤ 1 __ 6
x ≤ 1
32. −0.01 ≤ 0.02x − 0.01 ≤ 0.01
33. 5t + 1 ≤ 3t − 2 or −7t ≤ −21
34. 3(x + 1) < 2(x + 2) or 2(x − 1) ≥ x + 2
Solve each equation. [2.5]
35. | x | = 2 36. | a | − 3 = 1
37. | x − 3 | = 1 38. | 2y − 3 | = 5
39. | 4x − 3 | + 2 = 11 40. | 7 _ 3 − x _
3 | + 4 _
3 = 2
41. | 5t − 3 | = | 3t − 5 | 42. | 1 _ 2
− x | = | x + 1 _ 2
|
Solve each inequality and graph the solution set. [2.6]
43. | x | < 5
44. | 0.01a | ≥ 5
45. | x | < 0
46. | 2t + 1 | − 3 < 2
Solve each equation or inequality, if possible. [2.1, 2.4, 2.5, 2.6]
47. 2x − 3 = 2(x − 3) 48. 3 5x − 1 _ 2 = 15x + 2
49. | 4y + 8 | = −1
50. | x | > 0
51. | 5 − 8t | + 4 ≤ 1
52. | 2x + 1 | ≥ −4
Copyright 2011 Cengage Learning. All Rights Reserved. May not be copied, scanned, or duplicated, in whole or in part. Due to electronic rights, some third party content may be suppressed from the eBook and/or eChapter(s). Editorial review has deemed that any suppressed content does not materially affect the overall learning experience. Cengage Learning reserves the right to remove additional content at any time if subsequent rights restrictions require it.

127
Chapter 2 Cumulative Review
Chapter 2 Cumulative Review
Simplify each of the following.
1. 72 2. | −3 |
3. −2 ⋅ 5 + 4 4. −2(5 + 4)
5. 6 + 2 ⋅ 5 − 3 6. (6 + 2)(5 − 3)
7. 3 + 2(7 + 4) 8. 35 − 15 ÷ 3 + 6
9. −(6 − 4) − (3 − 8) 10. 3(−5)2 − 6(−2)3
11. −7 − 7
_ −3 − 4
12. 5(−3) + 6
__ 8(−3) + 7(3)
Reduce the following fractions to lowest terms.
13. 630
_ 735
14. 294
_ 392
Add the following fractions.
15. 11
_ 30
+ 13
_
42 16.
7 _
24 +
5 _
42
17. Find the difference of −3 and 6.
18. Add −4 to the product of 5 and −6.
Let A = {3, 6, 9}; B = {4, 5, 6, 7}; C = {2, 4, 6, 8}. Find thefollowing.
19. A ∪ C 20. A ∩ B
21. { x∣ x ∈ B and x ≤ 5} 22. { x∣ x ∈ C and x > 6}
For the set {−13, −6.7, − √—
5 , 0, 1 _
2 , 2, 5 _
2 , π, √—
13 }, list all the numbers that are in each of the following sets.
23. Rational numbers
24. Integers
25. Irrational numbers
26. Whole numbers
Find the next number in the following sequences.
27. 2, −6, 18, . . . 28. − 1 _
2 ,
1 _
4 , −
1 _
8 , . . .
Simplify each of the following expressions.
29. 6 x _ 3 − 2 30. 5(2x + 4) + 6
31. x 1 − 4 _
x
32. 100(0.07x + 0.06y)
Solve each of the following equations.
33. 7 − 3y = 14 34. 5(4 + x) = 3(5 + 2x)
35. 3 − 4 _
5 a = −5 36. 100x 3 = 500x 2
37. | y | − 2 = 3 38. | 3y − 2 | = 7
Substitute the given values in each formula, and then solve for the variable that does not have a numerical replacement.
39. A = P + Prt: A = 1,000, P = 500, r = 0.1
40. A = a + (n − 1)d: A = 40, a = 4, d = 9
Solve each formula for the indicated variable.
41. 4x − 3y = 12 for x
42. F = 9
_
5 C + 32 for C
43. A = 1
_
2 bh for h
44. ax + 6 = bx + 4 for x
Solve each application. In each case, be sure to show the equation that describes the situation.
45. Angles Two angles are complementary. If the larger angle is 15° more than twice the smaller angle, find the measure of each angle.
46. Rectangle A rectangle is twice as long as it is wide. The perimeter is 78 feet. Find the dimentions.
Solve each inequality. Write your answer using interval notation.
47. 600 − 300x < 900 48. − 1 _
2 ≤
1 _
6 x ≤
1 _
3
Solve each inequality and graph the solution set.
49. | 5x − 1 | > 3
50. | 2t + 1 | − 1 < 5
The illustration shows the average price for a gallon of gas in July of 2010. Use this information to answer Problems 51 and 52.
51. What is the difference in the price of gas on the West Coast and the price of gas on the East Coast?
52. What is the difference in the price of gas in Texas and the price of gas in New York?
Average Price per Gallon of Gasoline
Source: http://www.fueleconomy.gov, 2010
West Coast
East Coast
Rocky Mountains
Midwest
Gulf Coast
$3.03
$2.77$2.71
$2.60
$2.69
Copyright 2011 Cengage Learning. All Rights Reserved. May not be copied, scanned, or duplicated, in whole or in part. Due to electronic rights, some third party content may be suppressed from the eBook and/or eChapter(s). Editorial review has deemed that any suppressed content does not materially affect the overall learning experience. Cengage Learning reserves the right to remove additional content at any time if subsequent rights restrictions require it.
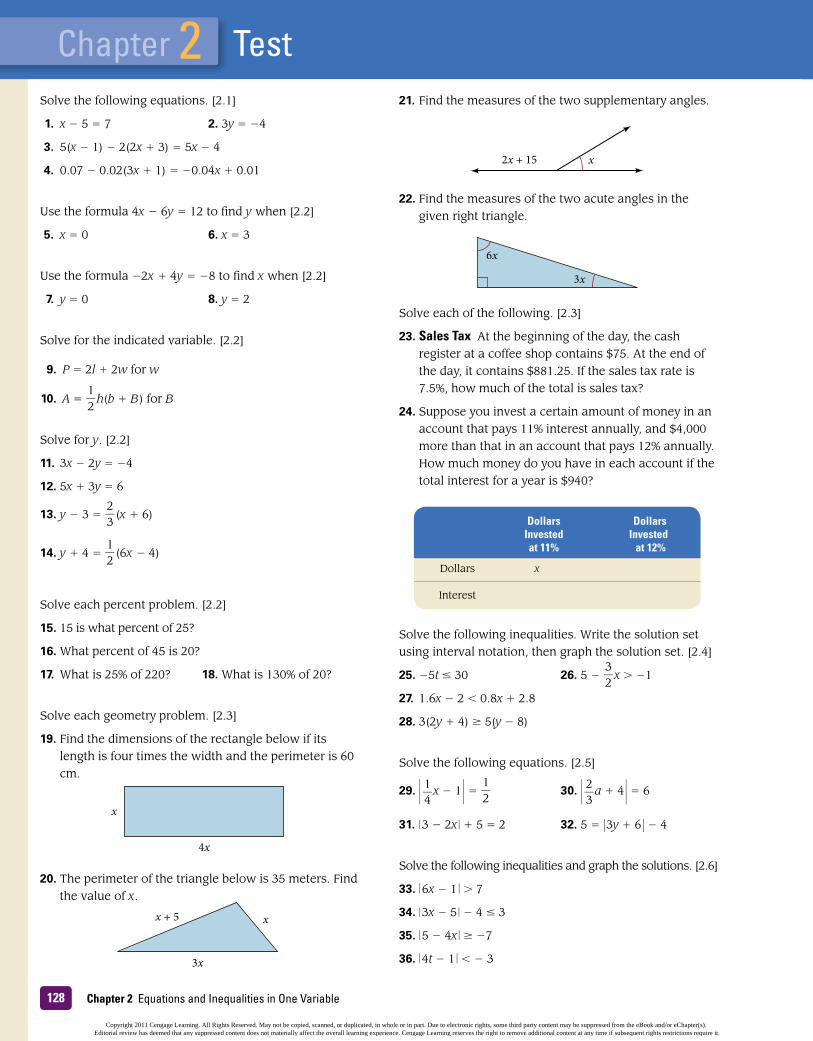
Chapter 2 Equations and Inequalities in One Variable128
Chapter 2 TestSolve the following equations. [2.1]
1. x − 5 = 7 2. 3y = −4
3. 5(x − 1) − 2(2x + 3) = 5x − 4
4. 0.07 − 0.02(3x + 1) = −0.04x + 0.01
Use the formula 4x − 6y = 12 to find y when [2.2]
5. x = 0 6. x = 3
Use the formula −2x + 4y = −8 to find x when [2.2]
7. y = 0 8. y = 2
Solve for the indicated variable. [2.2]
9. P = 2l + 2w for w
10. A = 1 _
2 h(b + B ) for B
Solve for y. [2.2]
11. 3x − 2y = −4
12. 5x + 3y = 6
13. y − 3 = 2 _
3 (x + 6)
14. y + 4 = 1 _
2 (6x − 4)
Solve each percent problem. [2.2]
15. 15 is what percent of 25?
16. What percent of 45 is 20?
17. What is 25% of 220? 18. What is 130% of 20?
Solve each geometry problem. [2.3]
19. Find the dimensions of the rectangle below if its length is four times the width and the perimeter is 60 cm.
20. The perimeter of the triangle below is 35 meters. Find the value of x.
x
4x
x + 5 x
3x
21. Find the measures of the two supplementary angles.
22. Find the measures of the two acute angles in the given right triangle.
Solve each of the following. [2.3]
23. sales tax At the beginning of the day, the cash register at a coffee shop contains $75. At the end of the day, it contains $881.25. If the sales tax rate is 7.5%, how much of the total is sales tax?
24. Suppose you invest a certain amount of money in an account that pays 11% interest annually, and $4,000 more than that in an account that pays 12% annually. How much money do you have in each account if the total interest for a year is $940?
Solve the following inequalities. Write the solution set using interval notation, then graph the solution set. [2.4]
25. −5t ≤ 30 26. 5 − 3
_
2 x > −1
27. 1.6x − 2 < 0.8x + 2.8
28. 3(2y + 4) ≥ 5(y − 8)
Solve the following equations. [2.5]
29. | 1 _ 4
x − 1 | = 1
_
2 30. | 2 _
3 a + 4 | = 6
31. | 3 − 2x | + 5 = 2 32. 5 = | 3y + 6 | − 4
Solve the following inequalities and graph the solutions. [2.6]
33. | 6x − 1 | > 7
34. | 3x − 5 | − 4 ≤ 3
35. | 5 − 4x | ≥ −7
36. | 4t − 1 | < − 3
2x + 15 x
6x
3x
Dollars Dollars Invested Invested at 11% at 12%
Dollars x
Interest
Copyright 2011 Cengage Learning. All Rights Reserved. May not be copied, scanned, or duplicated, in whole or in part. Due to electronic rights, some third party content may be suppressed from the eBook and/or eChapter(s). Editorial review has deemed that any suppressed content does not materially affect the overall learning experience. Cengage Learning reserves the right to remove additional content at any time if subsequent rights restrictions require it.
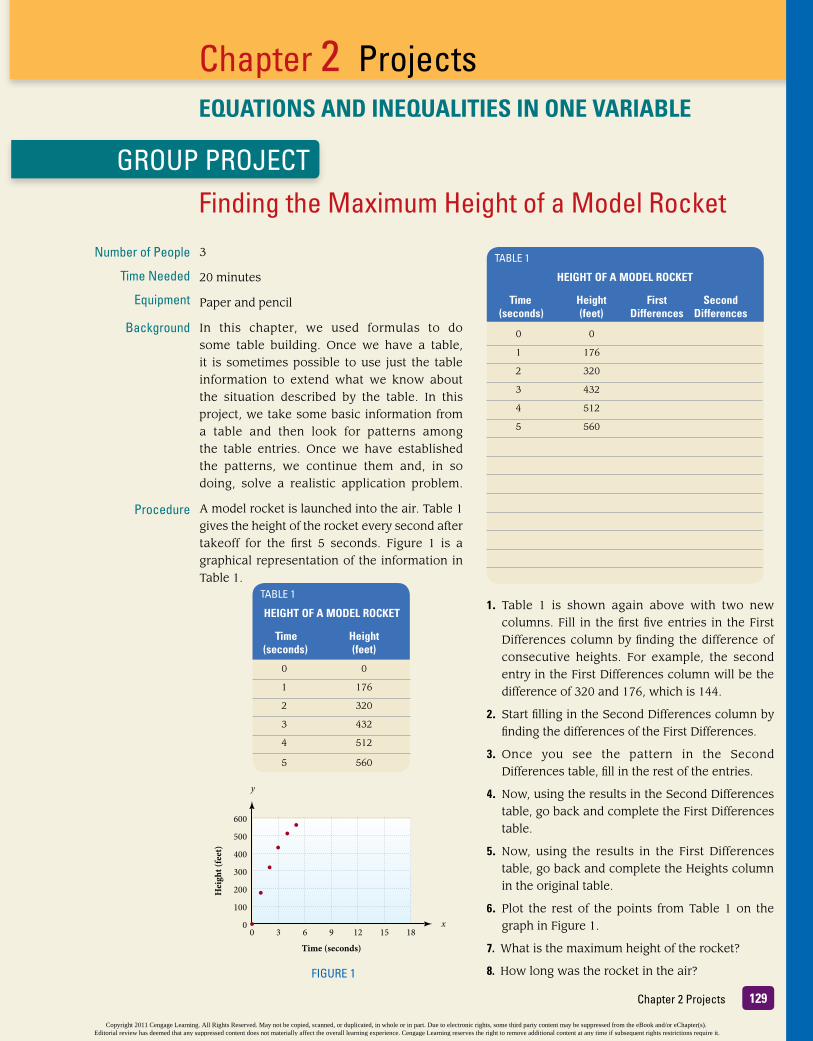
Chapter 2 ProjectsEQuAtIOns AnD InEQuALItIEs In OnE VARIABLE
GROUP PROJECT
Chapter 2 Projects 129
Finding the Maximum Height of a Model Rocket
Number of People
Time Needed
Equipment
Background
Procedure
3
20 minutes
Paper and pencil
In this chapter, we used formulas to do some table building. Once we have a table, it is sometimes possible to use just the table information to extend what we know about the situation described by the table. In this project, we take some basic information from a table and then look for patterns among the table entries. Once we have established the patterns, we continue them and, in so doing, solve a realistic application problem.
A model rocket is launched into the air. Table 1 gives the height of the rocket every second after takeoff for the first 5 seconds. Figure 1 is a graphical representation of the information in Table 1.
TABLE 1
hEIGht OF A mODEL ROCkEt
time height (seconds) (feet)
0 0
1 176
2 320
3 432
4 512
5 560
0 3 6 9
Time (seconds)
Hei
ght (
feet
)
12 15 180
100
200
300
400
500
600
x
y
FIGURE 1
TABLE 1
hEIGht OF A mODEL ROCkEt
time height First second (seconds) (feet) Differences Differences
0 0
1 176
2 320
3 432
4 512
5 560
1. Table 1 is shown again above with two new columns. Fill in the first five entries in the First Differences column by finding the difference of consecutive heights. For example, the second entry in the First Differences column will be the difference of 320 and 176, which is 144.
2. Start filling in the Second Differences column by finding the differences of the First Differences.
3. Once you see the pattern in the Second Differences table, fill in the rest of the entries.
4. Now, using the results in the Second Differences table, go back and complete the First Differences table.
5. Now, using the results in the First Differences table, go back and complete the Heights column in the original table.
6. Plot the rest of the points from Table 1 on the graph in Figure 1.
7. What is the maximum height of the rocket?
8. How long was the rocket in the air?
Copyright 2011 Cengage Learning. All Rights Reserved. May not be copied, scanned, or duplicated, in whole or in part. Due to electronic rights, some third party content may be suppressed from the eBook and/or eChapter(s). Editorial review has deemed that any suppressed content does not materially affect the overall learning experience. Cengage Learning reserves the right to remove additional content at any time if subsequent rights restrictions require it.

RESEARCH PROJECT
Chapter 2 Equations and Inequalities in One Variable130
The Equal Sign
We have been using the equal sign, =, for some time now. The first published use of the symbol was in 1557, with the publication of The Whetstone of Witte by the English mathematician and physician Robert Recorde. Research the first use of the symbols we use for addition, subtraction, multiplication, and division and then write an essay on the subject from your results.
Smith
sonia
n Ins
titut
ion Li
brar
ies
Copyright 2011 Cengage Learning. All Rights Reserved. May not be copied, scanned, or duplicated, in whole or in part. Due to electronic rights, some third party content may be suppressed from the eBook and/or eChapter(s). Editorial review has deemed that any suppressed content does not materially affect the overall learning experience. Cengage Learning reserves the right to remove additional content at any time if subsequent rights restrictions require it.

3
131
Chapter Outline3.1 Paired Data and
the Rectangular Coordinate System
3.2 The Slope of a Line
3.3 The Equation of a Line
3.4 Linear Inequalities in Two Variables
3.5 Introduction to Functions
3.6 Function Notation
3.7 Algebra and Composition with Functions
3.8 Variation
Equations and Inequalities in Two Variables
IntroductionMaria Gaetana Agnesi is recognized as the first woman to publish a book of mathematics. Maria also went on to become the first female professor of mathematics, at the University of Bologna shown in the above Google Earth photo. She was born in Milan to a wealthy and literate family. The Agnesi home was a gathering place of the most recognized intellectual minds of the day. Maria participated in these gatherings until the death of her mother, when she took over management of the household and the education of her siblings. The texts she wrote for this task were the beginnings of the first published mathematical work written by a woman, Analytical Institutions. An illustration of a curve discussed in this book is shown here.
The diagram is drawn on a rectangular coordinate system. The rectangular coordinate system is the foundation upon which we build our study of graphing in this chapter.
x
y
A
B
C
Image © 2009 DigitalGlobeImage © 2009 DigitalGlobe
Copyright 2011 Cengage Learning. All Rights Reserved. May not be copied, scanned, or duplicated, in whole or in part. Due to electronic rights, some third party content may be suppressed from the eBook and/or eChapter(s). Editorial review has deemed that any suppressed content does not materially affect the overall learning experience. Cengage Learning reserves the right to remove additional content at any time if subsequent rights restrictions require it.

Chapter 3 Equations and Inequalities in Two Variables132
Getting Ready for Chapter 3
1. 16(4.5)2 2. 0.2(0.5)2
_ 100
3. −1 _
3 (−3) + 2 4. 4(−2) − 1 5. 4 − (−2)
_ 3 − 1
6. −3 − (−3) __
2 − (−1)
7. 4 _ 3 (3.14) ⋅ 33 (round to the nearest whole number) 8. 3(−2)2 + 2(−2) − 1
9. If 2x + 3y = 6, find x when y = 0. 10. If s = 60 _
t , find s when t = 15.
11. Write −0.06 as a fraction in lowest terms. 12. Write −0.6 as a fraction in lowest terms.
13. Solve 2x − 3y = 5 for y. 14. Solve y − 4 = −1 _
2 (x + 1) for y.
15. Which of the following are solutions to x + y ≥ 5?
(0, 0) (5, 0) (4, 3)
16. Which of the following are solutions to y < 1 _ 2 x + 3?
(0, 0) (2, 0) (−2, 4)
17. Use h = 64t − 16t 2 to complete the table. 18. Use s = 60 _
t to complete the table.
19. If y = K _ x , find K when x = 3 and y = 45. 20. If y = Kxz 2, find K when x = 2, y = 81, and z = 9.
t 0 1 2 3 4
h
t 4 6 8 10
s
3.1
Chapter Outline
3.1 Paired Data and the RectangularCoordinate System
Graph ordered pairs on a rectangular coordinate system. Graph linear equations by finding intercepts or by making
a table. Graph horizontal and vertical lines.
A B
C
3.2 The Slope of a Line Find the slope of a line from its graph. Find the slope of a line given two points on the line.
A B
3.3 The Equation of a Line Find the equation of a line given its slope and y -intercept. Find the slope and y -intercept from the equation of a line. Find the equation of a line given the slope and a point on
the line.Find the equation of a line given two points on the line.
A B C
D
3.5 Introduction to Functions Construct a table or a graph from a function rule. Identify the domain and range of a function or a relation. Determine whether a relation is also a function.
Use the vertical line test to determine whether a graph is a function.
A B C D
3.6 Function Notation Use function notation to find the value of a function for a
given value of the variable. Use graphs to visualize the relationship between a function
and a variable. Use function notation in formulas.
A
B
C
3.8 Variation Set up and solve problems with direct variation. Set up and solve problems with inverse variation. Set up and solve problems with joint variation.
A B C
3.7 Algebra with Composition and Functions Find the sum, difference, product, and quotient of two
functions. For two functions f and g, find f (g (x )) and g (f (x )).
A
B
3.4 Linear Inequalities in Two Variables Graph linear inequalities in two variables. A
Copyright 2011 Cengage Learning. All Rights Reserved. May not be copied, scanned, or duplicated, in whole or in part. Due to electronic rights, some third party content may be suppressed from the eBook and/or eChapter(s). Editorial review has deemed that any suppressed content does not materially affect the overall learning experience. Cengage Learning reserves the right to remove additional content at any time if subsequent rights restrictions require it.

1333.1 Paired Data and the Rectangular Coordinate System
OBjECTIVES
Graph ordered pairs on a rectangular coordinate system.
Graph linear equations by finding intercepts or by making a table.
C Graph horizontal and vertical lines.
A
B
3.1 Paired Data and the Rectangular Coordinate System
TICkET TO SuCCESSKeep these questions in mind as you read through the section. Then respond in your own words and in complete sentences.
1. Explain how you would construct a rectangular coordinate system from two real number lines.
2. What is the definition of a linear equation in two variables?3. How can you tell if an ordered pair is a solution to the equation y = 1 __ 3 x + 5?4. What are the x- and y-intercepts of the graph of an equation?
In the 17th century, mathematicians and scientists treated algebra and geometry as separate subjects. In 1637, the French philosopher and mathematician Rene Descartes discovered a distinct link between algebra and geometry by associating geometric shapes with algebraic equations. He plotted this connection on a graph using an x- and a y-axis drawn perpendicular to each other, later named the Cartesian coordinate system after him. Our ability to graph equations is due to Descartes’ invention of the Cartesian coordinate system. In this section we will begin our work with graphing equations by examining how data can be paired together.
We will start with the visual component of algebra. We are setting the stage for two important topics: functions and graphs. Both topics have a wide variety of applications and are found in all the math classes that follow this one.
Table 1 gives the net price of a popular intermediate algebra text at the beginning of each year in which a new edition was published. (The net price is the price the bookstore pays for the book, not the price you pay for it.)
The information in Table 1 is shown visually in Figures 1 and 2. The diagram in Figure 1 is called a bar chart. The diagram in Figure 2 is called a line graph. In both figures, the horizontal line that shows years is called the horizontal axis, and the vertical line that shows prices is called the vertical axis.
Getty
Imag
es
Copyright 2011 Cengage Learning. All Rights Reserved. May not be copied, scanned, or duplicated, in whole or in part. Due to electronic rights, some third party content may be suppressed from the eBook and/or eChapter(s). Editorial review has deemed that any suppressed content does not materially affect the overall learning experience. Cengage Learning reserves the right to remove additional content at any time if subsequent rights restrictions require it.

Chapter 3 Equations and Inequalities in Two Variables134
Recall from Chapter 1 that the data in Table 1 are called paired data because each number in the year column is paired with a specific number in the price column. Each of these pairs of numbers from Table 1 is associated with one of the solid bars in the bar chart (Figure 1) and one of the dots in the line graph (Figure 2).
A Ordered PairsPaired data plays an important role in equations that contain two variables. Working with these equations is easier if we standardize the terminology and notation associated with paired data. So here is a definition that will do just that.
TAbLE 1
PRICE OF A TExTBOOk
Net PriceEdition Year Published ($)
First 1982 16.95
Second 1985 23.50
Third 1989 30.50
Fourth 1993 39.25
Fifth 1997 47.50
Sixth 2001 55.00
$60
$50
$40
$30
$20
$10
$0
Net
pri
ce ($
)
16.9523.50
30.50
39.25
47.5055.00
1982 1985 1989Year
1993 1997 2001
FIGURE 160
50
40
30
20
10
0
Net
pri
ce ($
)
1982
1983
1984
1985
1986
1987
1988
1989
1990
1991
1992
1993
1994
1995
1996
1997
1998
1999
2000
2001
Year
FIGURE 2
DefinitionA pair of numbers enclosed in parentheses and separated by a comma, such as (−2, 1), is called an ordered pair of numbers. The first number in the pair is called the x-coordinate of the ordered pair; the second number is called the y-coordinate. For the ordered pair (−2, 1), the x-coordinate is −2 and the y-coordinate is 1.
Copyright 2011 Cengage Learning. All Rights Reserved. May not be copied, scanned, or duplicated, in whole or in part. Due to electronic rights, some third party content may be suppressed from the eBook and/or eChapter(s). Editorial review has deemed that any suppressed content does not materially affect the overall learning experience. Cengage Learning reserves the right to remove additional content at any time if subsequent rights restrictions require it.

1353.1 Paired Data and the Rectangular Coordinate System
To standardize the way in which we display paired data visually, we use a rectangular coordinate system. A rectangular coordinate system is made by drawing two real number lines at right angles to each other. The two number lines, called axes, cross each other at 0. This point is called the origin. Positive directions are to the right and up. Negative directions are down and to the left. The rectangular coordinate system is shown in Figure 3.
The horizontal number line is called the x-axis and the vertical number line is called the y-axis. The two number lines divide the coordinate system into four quadrants, which we number I through IV in a counterclockwise direction. Points on the axes are not considered as being in any quadrant.
To graph the ordered pair (a, b) on a rectangular system, we start at the origin and move a units right or left (right if a is positive, left if a is negative). Then we move b units up or down (up if b is positive and down if b is negative). The point where we end up is the graph of the ordered pair (a, b).
ExAmPLE 1 Plot (graph) the ordered pairs (2, 5), (−2, 5), (−2, −5), and (2, −5).
SOLuTION To graph the ordered pair (2, 5), we start at the origin and move 2 units to the right, then 5 units up. We are now at the point with coordinates (2, 5). We graph the other three ordered pairs in a similar manner (see Figure 4).
−5 −4 −3 −2 −1 1 2 3 4 5
−5
−4
−3
−2
−1
1
2
3
4
5
x
y
Positivedirection
y-axis
x-axisOriginNegative
direction
III
III IV
FIGURE 3
NOTEFrom Example 1, we see that any point in quadrant I has both its x- and y-coordinates positive (+, +). Points in quadrant II have negative x-coordinates and positive y-coordinates (−, +). In quadrant III, both coordinates are negative (−, −). In quadrant IV, the form is (+, −).
−5 −4 −3 −2 −1 1 2 3 4 5
−5
−4
−3
−2
−1
1
2
3
4
5
x
y
(−2, 5) (2, 5)
(2, −5)(−2, −5)
FIGURE 4
Copyright 2011 Cengage Learning. All Rights Reserved. May not be copied, scanned, or duplicated, in whole or in part. Due to electronic rights, some third party content may be suppressed from the eBook and/or eChapter(s). Editorial review has deemed that any suppressed content does not materially affect the overall learning experience. Cengage Learning reserves the right to remove additional content at any time if subsequent rights restrictions require it.

Chapter 3 Equations and Inequalities in Two Variables136
ExAmPLE 2 Graph the ordered pairs (1, −3), (0, 5), (3, 0), (0, −2), (−1, 0), and1 _
2 , 2 .
SOLuTION
From Figure 5, we see that any point on the x-axis has a y-coordinate of 0 (with no vertical displacement), and any point on the y-axis has an x-coordinate of 0 (with no horizontal displacement).
B Linear EquationsWe can plot a single point from an ordered pair, but to draw a line, we need two points or an equation in two variables.
To graph a linear equation in two variables, we simply graph its solution set; that is, we draw a line through all the points with coordinates that satisfy the equation.
ExAmPLE 3 Graph the equation y = −1
_ 3
x + 2.
SOLuTION We need to find three ordered pairs that satisfy the equation. To do so, we can let x equal any numbers we choose and find corresponding values of y. But since every value of x we substitute into the equation is going to be multiplied by −1 _
3 , let’s
use numbers for x that are divisible by 3, like −3, 0, and 3. That way, when we multiply them by −1 _
3 , the result will be an integer.
−5 −4 −3 −2 −1 1 2 3 4 5
−5
−4
−3
−2
−1
1
2
3
4
5
x
y
(0, 5)
( , 2)12
(3, 0)(−1, 0)
(0, −2)(1, −3)
FIGURE 5
DefinitionAny equation that can be put in the form ax + by = c, where a, b, and c are real numbers and a and b are not both 0, is called a linear equation in two variables. The graph of any equation of this form is a straight line (that is why these equations are called “linear”). The form ax + by = c is called standardform.
Copyright 2011 Cengage Learning. All Rights Reserved. May not be copied, scanned, or duplicated, in whole or in part. Due to electronic rights, some third party content may be suppressed from the eBook and/or eChapter(s). Editorial review has deemed that any suppressed content does not materially affect the overall learning experience. Cengage Learning reserves the right to remove additional content at any time if subsequent rights restrictions require it.

1373.1 Paired Data and the Rectangular Coordinate System
Let x = −3; y = −1
_ 3
(−3) + 2
y = 1 + 2
y = 3
The ordered pair (−3, 3) is one solution.
Let x = 0; y = −1
_ 3
(0) + 2
y = 0 + 2
y = 2
The ordered pair (0, 2) is a second solution.
Let x = 3; y = −1 _ 3 (3) + 2
y = −1 + 2
y = 1
The ordered pair (3, 1) is a third solution.
Plotting the ordered pairs (−3, 3), (0, 2), and (3, 1) and drawing a straight line through their graphs, we have the graph of the equation y = −1 _
3 x + 2, as shown in Figure 6.
Example 3 illustrates again the connection between algebra and geometry that we mentioned earlier in this section. Descartes’ rectangular coordinate system allows us to associate the equation y = −1 _
3 x + 2 (an algebraic concept) with a specific straight
line (a geometric concept). The study of the relationship between equations in algebra and their associated geometric figures is called analytic geometry.
InterceptsTwo important points on the graph of a straight line, if they exist, are the points where the graph crosses the axes.
Because any point on the x-axis has a y-coordinate of 0, we can find the x-intercept by letting y = 0 and solving the equation for x. We find the y-intercept by letting x = 0 and solving for y.
In table form
x y
−3 3 0 2 3 1
−5 −4 −3 −2 −1 1 2 3 4 5
−5
−4
−3
−2
−1
1
2
3
4
5
x
y
(−3, 3)(0, 2)
(3, 1)
FIGURE 6
NOTEIt takes only two points to determine a straight line. We have included a third point for “insurance.” If all three points do not line up in a straight line, we have made a mistake.
DefinitionThe x-intercept of the graph of an equation is the x-coordinate of the point where the graph crosses the x-axis. The y-intercept is defined similarly.
Copyright 2011 Cengage Learning. All Rights Reserved. May not be copied, scanned, or duplicated, in whole or in part. Due to electronic rights, some third party content may be suppressed from the eBook and/or eChapter(s). Editorial review has deemed that any suppressed content does not materially affect the overall learning experience. Cengage Learning reserves the right to remove additional content at any time if subsequent rights restrictions require it.

Chapter 3 Equations and Inequalities in Two Variables138
ExAmPLE 4 Find the x- and y-intercepts for 2x + 3y = 6; then graph the solution set.
SOLuTION To find the y-intercept we let x = 0.
When x = 0
we have 2(0) + 3y = 6
3y = 6
y = 2
The y-intercept is 2, and the graph crosses the y-axis at the point (0, 2).
When y = 0
we have 2x + 3(0) = 6
2x = 6
x = 3
The x-intercept is 3, so the graph crosses the x-axis at the point (3, 0). We use these results to graph the solution set for 2x + 3y = 6. The graph is shown in Figure 7.
C Horizontal and Vertical Lines
ExAmPLE 5 Graph each of the following lines.
a. y = 1 _ 2
x b. x = 3 c. y = −2
SOLuTIONa. The line y = 1 _
2 x passes through the origin because (0, 0) satisfies the
equation. To sketch the graph we need at least one more point on the line. When x is 2, we obtain the point (2, 1), and when x is −4, we obtain the point (−4, −2). The graph of y = 1 _
2 x is shown in Figure 8A.
b. The line x = 3 is the set of all points whose x-coordinate is 3. The variable y does not appear in the equation, so the y-coordinate can be any number. Note that we can write our equation as a linear equation in two variables by writing it as x + 0y = 3. Because the product of 0 and y will always be 0, y can be any number. The graph of x = 3 is the vertical line shown in Figure 8B.
NOTEGraphing straight lines by finding the intercepts works best when the coefficients of x and y are factors of the constant term.
−5 −4 −3 −2 −1 1 2 3 4 5
−5
−4
−3
−2
−1
1
2
3
4
5
x
y
2x + 3y = 6
(0, 2)
(3, 0)
y-intercept = 2
x-intercept = 3
FIGURE 7
Copyright 2011 Cengage Learning. All Rights Reserved. May not be copied, scanned, or duplicated, in whole or in part. Due to electronic rights, some third party content may be suppressed from the eBook and/or eChapter(s). Editorial review has deemed that any suppressed content does not materially affect the overall learning experience. Cengage Learning reserves the right to remove additional content at any time if subsequent rights restrictions require it.

1393.1 Paired Data and the Rectangular Coordinate System
c. The line y = −2 is the set of all points whose y-coordinate is −2. The variable x does not appear in the equation, so the x-coordinate can be any number. Again, we can write our equation as a linear equation in two variables by writing it as 0x + y = −2. Because the product of 0 and x will always be 0, x can be any number. The graph of y = −2 is the horizontal line shown in Figure 8C.
−5 −4 −3 −2 −1 1 2 3 4 5
−5−4−3−2−1
12345
x
y
y = xy = x12
FIGURE 8A
−5 −4 −3 −2 −1 1 2 3 4 5
−5−4−3−2−1
12345
x
y
x = 3
FIGURE 8b
−5 −4 −3 −2 −1 1 2 3 4 5
−5−4−3−2−1
12345
x
y
y = −2
FIGURE 8C
FACTS FROm GEOmETRY: Special Equations and Their GraphsFor the equations below, m, a, and b are real numbers.
Through the Origin Vertical Line Horizontal Line
x
y
y = mx
FIGURE 9A Any equation of the form y = mx has a graph that passes through the origin.
x
y
x = a
a
FIGURE 9b Any equation of the form x = a has a vertical line for its graph.
x
y
y = bb
FIGURE 9C Any equation of the form y = b has a horizontal line for its graph.
Copyright 2011 Cengage Learning. All Rights Reserved. May not be copied, scanned, or duplicated, in whole or in part. Due to electronic rights, some third party content may be suppressed from the eBook and/or eChapter(s). Editorial review has deemed that any suppressed content does not materially affect the overall learning experience. Cengage Learning reserves the right to remove additional content at any time if subsequent rights restrictions require it.

Chapter 3 Equations and Inequalities in Two Variables140
Graphing Calculators and Computer Graphing Programs
A variety of computer programs and graphing calculators are currently available to help us graph equations and then obtain information from those graphs much faster than we could with paper and pencil. We will not give instructions for all the available calculators. Most of the instructions we give are generic in form. You will have to use the manual that came with your calculator to find the specific instructions for your calculator.
Graphing with Trace and Zoom
All graphing calculators have the ability to graph a function and then trace over the points on the graph, giving their coordinates. Furthermore, all graphing calculators can zoom in and out on a graph that has been drawn. To graph a linear equation on a graphing calculator, we first set the graph window. Most calculators call the smallest value of x Xmin and the largest value of x Xmax. The counterpart values of y are Ymin and Ymax. We will use the notation
Window: X from −5 to 4, Y from −3 to 2
to stand for a window in which
Xmin = −5 Ymin = −3 Xmax = 4 Ymax = 2
Set your calculator with the following window:
Window: X from −10 to 10, Y from −10 to 10
Graph the equation Y = −X + 8. On the TI-83/84, you use the Y= key to enter the equation; you enter a negative sign with the (–) key, and a subtraction sign with the – key. The graph will be similar to the one shown in Figure 10.
Use the Trace feature of your calculator to name three points on the graph. Next, use the Zoom feature of your calculator to zoom out so your window is twice as large.
Solving for y First
To graph the equation from Example 4, 2x + 3y = 6, on a graphing calculator, you must first solve it for y. When you do so, you will get y = − 2 _
3 x + 2, which
you enter into your calculator as Y = −(2/3)X + 2. Graph this equation in the window described here, and compare your results with the graph in Figure 7. Window: X from −6 to 6, Y from −6 to 6
−10 −8 −6 −4 −2 2 4 6 8 10
−10
−8
−6
−4
−2
2
4
6
8
10
FIGURE 10
u S I N G T E C H N O L O G Y
Copyright 2011 Cengage Learning. All Rights Reserved. May not be copied, scanned, or duplicated, in whole or in part. Due to electronic rights, some third party content may be suppressed from the eBook and/or eChapter(s). Editorial review has deemed that any suppressed content does not materially affect the overall learning experience. Cengage Learning reserves the right to remove additional content at any time if subsequent rights restrictions require it.

3.1 Problem Set 141
4.
B Graph each of the following linear equations by first finding the intercepts. [Examples 3–4]
5. 2x − 3y = 6 6. y − 2x = 4
7. 4x − 5y = 20 8. 5x − 3y − 15 = 0
9. y = 2x + 3 10. y = 3x − 2
11. −3x + 2y = 12 12. 5x − 7y = −35
13. 6x − 5y −20 = 0 14. −4x − 6y + 15= 0
15. y = 3x − 5 16. y = −4x +1
17. x _ 2
+ y _ 3
= 1 18. x _ 4
− y _ 7
= 1
19. Which of the following tables could be produced from the equation y = 2x − 6?
−5 −4 −3 −2 −1 1 2 3 4 5
−5−4−3−2−1
12345
x
y
B
A
CD
EF
G
A Graph each of the following ordered pairs on a rectangular coordinate system. [Examples 1–2]
1. a. (1, 2)
b. (−1, −2)
c. (5, 0)
d. (0, 2)
e. (−5, −5)
f. 1 _ 2 , 2
A Give the coordinates of each point.
3.
2. a. (−1, 2)
b. (1, −2)
c. (0, −3)
d. (4, 0)
e. (−4, −1)
f. 3, 1 _
4
−5 −4 −3 −2 −1 1 2 3 4 5
−5−4−3−2−1
12345
x
y
B
A
C
D
E
F G
Hint on Tracing
If you are going to use the Trace feature and you want the x-coordinates to be exact numbers, set your window so that the range of X inputs is a multiple of the number of horizontal pixels on your calculator screen. On the TI-83/84, the screen has 94 pixels across. Here are a few convenient trace windows:
X from −4.7 to 4.7 To trace to the nearest tenth X from −47 to 47 To trace to the nearest integer X from 0 to 9.4 To trace to the nearest tenth X from 0 to 94 To trace to the nearest integer X from −94 to 94 To trace to the nearest even integer
Problem Set 3.1
“One secret of success in life is for a man to be ready for his opportunity when it comes.”
—benjamin Disraeli, 1804–1881, british statesman and literary figure
1. Are you using the study time set aside for this class effectively? If not, how can you improve?
2. What are things you can do to make sure you study with intention?
moving Toward Success
Copyright 2011 Cengage Learning. All Rights Reserved. May not be copied, scanned, or duplicated, in whole or in part. Due to electronic rights, some third party content may be suppressed from the eBook and/or eChapter(s). Editorial review has deemed that any suppressed content does not materially affect the overall learning experience. Cengage Learning reserves the right to remove additional content at any time if subsequent rights restrictions require it.
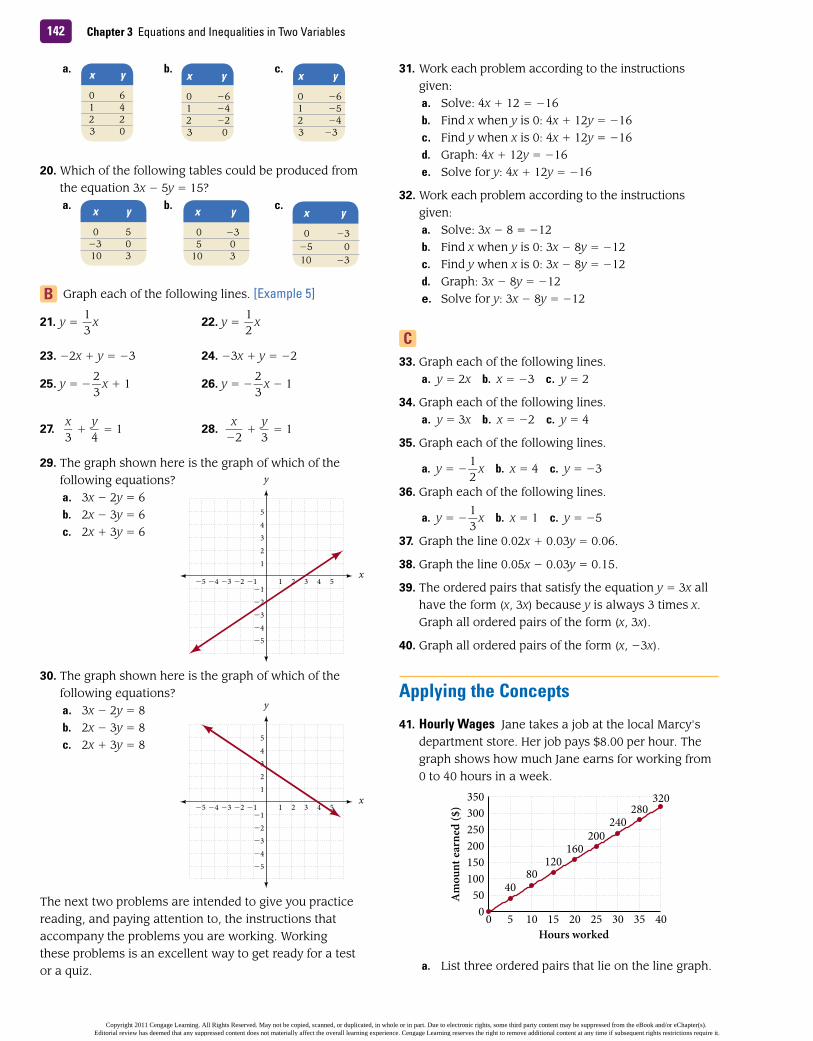
Chapter 3 Equations and Inequalities in Two Variables142
a. b. c.
20. Which of the following tables could be produced from the equation 3x − 5y = 15? a. b. c.
B Graph each of the following lines. [Example 5]
21. y = 1 _ 3
x 22. y = 1 _ 2 x
23. −2x + y = −3 24. −3x + y = −2
25. y = −2 _
3 x + 1 26. y = −
2 _
3 x − 1
27. x _
3 + y _
4 = 1 28.
x _
−2 + y _
3 = 1
29. The graph shown here is the graph of which of the following equations?a. 3x − 2y = 6b. 2x − 3y = 6c. 2x + 3y = 6
30. The graph shown here is the graph of which of the following equations?a. 3x − 2y = 8b. 2x − 3y = 8c. 2x + 3y = 8
The next two problems are intended to give you practice reading, and paying attention to, the instructions that accompany the problems you are working. Working these problems is an excellent way to get ready for a test or a quiz.
x y
0 61 42 23 0
x y
0 −61 −42 −23 0
x y
0 −61 −52 −43 −3
x y
0 5−3 010 3
x y
0 −3 5 010 3
x y
0 −3−5 010 −3
−5 −4 −3 −2 −1 1 2 3 4 5
−5−4−3−2−1
12345
x
y
−5 −4 −3 −2 −1 1 2 3 4 5
−5−4−3−2−1
12345
x
y
31. Work each problem according to the instructions given:a. Solve: 4x + 12 = −16 b. Find x when y is 0: 4x + 12y = −16 c. Find y when x is 0: 4x + 12y = −16 d. Graph: 4x + 12y = −16e. Solve for y: 4x + 12y = −16
32. Work each problem according to the instructions given:a. Solve: 3x − 8 = −12 b. Find x when y is 0: 3x − 8y = −12 c. Find y when x is 0: 3x − 8y = −12
d. Graph: 3x − 8y = −12e. Solve for y: 3x − 8y = −12
C33. Graph each of the following lines.
a. y = 2x b. x = −3 c. y = 2
34. Graph each of the following lines.a. y = 3x b. x = −2 c. y = 4
35. Graph each of the following lines.
a. y = −1 _
2 x b. x = 4 c. y = −3
36. Graph each of the following lines.
a. y = −1 _
3 x b. x = 1 c. y = −5
37. Graph the line 0.02x + 0.03y = 0.06.
38. Graph the line 0.05x − 0.03y = 0.15.
39. The ordered pairs that satisfy the equation y = 3x all have the form (x, 3x) because y is always 3 times x. Graph all ordered pairs of the form (x, 3x).
40. Graph all ordered pairs of the form (x, −3x).
Applying the Concepts
41. Hourly Wages Jane takes a job at the local Marcy's department store. Her job pays $8.00 per hour. The graph shows how much Jane earns for working from 0 to 40 hours in a week.
a. List three ordered pairs that lie on the line graph.
0 5 10 15 20 25 30 35 40050
100150200250300350
4080
120160
200240
280320
4080
120160
200240
280320
Am
ount
earn
ed ($
)A
mou
nt e
arne
d ($
)
Hours worked
Copyright 2011 Cengage Learning. All Rights Reserved. May not be copied, scanned, or duplicated, in whole or in part. Due to electronic rights, some third party content may be suppressed from the eBook and/or eChapter(s). Editorial review has deemed that any suppressed content does not materially affect the overall learning experience. Cengage Learning reserves the right to remove additional content at any time if subsequent rights restrictions require it.

3.1 Problem Set 143
44. Camera Phone Sales The table and bar chart shown here show the projected sales of camera phones from 2006 to 2010. Use the information from the table and chart to construct a line graph.
45. kentucky Derby The graph gives the monetary bets placed at the Kentucky Derby for specific years. If x represents the year in question and y represents the total wagering for that year, write six ordered pairs that describe the information in the graph.
46. Age of New mothers The graph here shows the increase in average age of first-time mothers in the U.S. since 1970. Estimate from the graph the average age of first-time mothers for the years 1970, 1980, 1990, and 2000 as a list of ordered pairs. (Round ages to the nearest whole number).
200
0
400
600
800
1000
500
650750
875 900Projected Camera Phone Sales
Year
Cam
era P
hone
s (m
illio
ns)
Cam
era P
hone
s (m
illio
ns)
2006 2007 2008 2009 2010
Year 2006 2007 2008 2009 2010
Sales (in millions)
Source: http://www.kentuckyderby.com, Thoroughbred Times
Betting the Ponies
44.834.465.4
104
163
20.2
0
50
100
150
200
2005 20102000199519901985
Mill
ions
of d
olla
rs
Source: http://www.childstats.gov
Waiting for the First Child
202122232425
‘05 ‘06‘00‘95‘90‘85‘80‘75‘70
26
b. How much will she earn for working 40 hours?
c. If her check for one week is $240, how many hours did she work?
d. She works 35 hours one week, but her paycheck before deductions are subtracted out is for $260. Is this correct? Explain.
42. Hourly Wages Judy takes a job at Gigi's boutique. Her job pays $6.00 per hour plus $50 per week in commission. The graph shows how much Judy earns for working from 0 to 40 hours in a week.
a. List three ordered pairs that lie on the line graph.
b. How much will she earn for working 40 hours?
c. If her check for one week is $230, how many hours did she work?
d. She works 35 hours one week, but her paycheck before deductions are subtracted out is for $260. Is this correct? Explain.
43. Non-Camera Phone Sales The table and bar chart shown here show the projected sales of non-camera phones. Use the information from the table and chart to construct a line graph.
0 5 10 15 20 25 30 35 400
100
200
300
400
80
50
110140
170200
230260
290
80
50
110140
170200
230260
290
Hours workedHours worked
Am
ount
earn
ed ($
)
300250
175 150 125100
0
200
300
400
500Projected Non–Camera Phone Sales
2006 2007 2008 2009 2010Non
-Cam
era P
hone
s (m
illio
ns)
YearYear
Year 2006 2007 2008 2009 2010
Sales (in millions)
Copyright 2011 Cengage Learning. All Rights Reserved. May not be copied, scanned, or duplicated, in whole or in part. Due to electronic rights, some third party content may be suppressed from the eBook and/or eChapter(s). Editorial review has deemed that any suppressed content does not materially affect the overall learning experience. Cengage Learning reserves the right to remove additional content at any time if subsequent rights restrictions require it.

Chapter 3 Equations and Inequalities in Two Variables144
47. mothers The graph used in the previous problem shows the average age of first-time mothers from 1970 to 2006. Use the chart to make a table of x and y values, where x is the year and y is the average age.Round to the nearest hundreth.
48. Camera Phones The chart shows the estimated number of camera phones and non-camera phones sold from 2004 to 2010. Use the chart to make a line graph of the total number of phones sold, and then list the ordered pairs.
49. In the figure below, right triangle ABC has legs of length 5. Find the coordinates of points A and B.
50. In the figure below, right triangle ABC has legs of length 5. Find the coordinates of points A and B.
x (year) 1970 1975 1980 1985 1990 1995 2000 2005 2006
y (age)
2004 2005 2006 2007 2008 2009 2010
Mill
ions
of P
hone
s 1000800600400200
0
CameraPhones
Non-CameraPhones
Source: http://www.InfoTrends.com
Number of Camera Phones in the World
x
y
A C (6, 2)
B
x
y
AC(−6, −2)
B
51. In the figure below, rectangle ABCD has a length of 5 and a width of 3. Find points A, B, and C.
52. In the figure below, rectangle ABCD has a length of 5 and a width of 3. Find points A, B, and C.
53. Solar Energy The graph shows the rise in solar thermal collectors from 1997 to 2008. Use the chart to answer the following questions.
a. Does the graph contain the point (2000, 7,500)? b. Does the graph contain the point (2004, 15,000)?
c. Does the graph contain the point (2007, 15,000)?
54. Health Care Costs The graph shows the projected rise in the cost of health care from 2002 to 2014. Using
x
y
A
B C
D (8, 3)
x
y
A
B C
D (−2, 2)
Source: Energy Information Association 2008
Solar Thermal Collectors
25000
200001500010000
5000
0‘97 ‘98 ‘99 ‘00 ‘01 ‘02 ‘03 ‘04 ‘05 ‘06 ‘07 ‘08
Copyright 2011 Cengage Learning. All Rights Reserved. May not be copied, scanned, or duplicated, in whole or in part. Due to electronic rights, some third party content may be suppressed from the eBook and/or eChapter(s). Editorial review has deemed that any suppressed content does not materially affect the overall learning experience. Cengage Learning reserves the right to remove additional content at any time if subsequent rights restrictions require it.
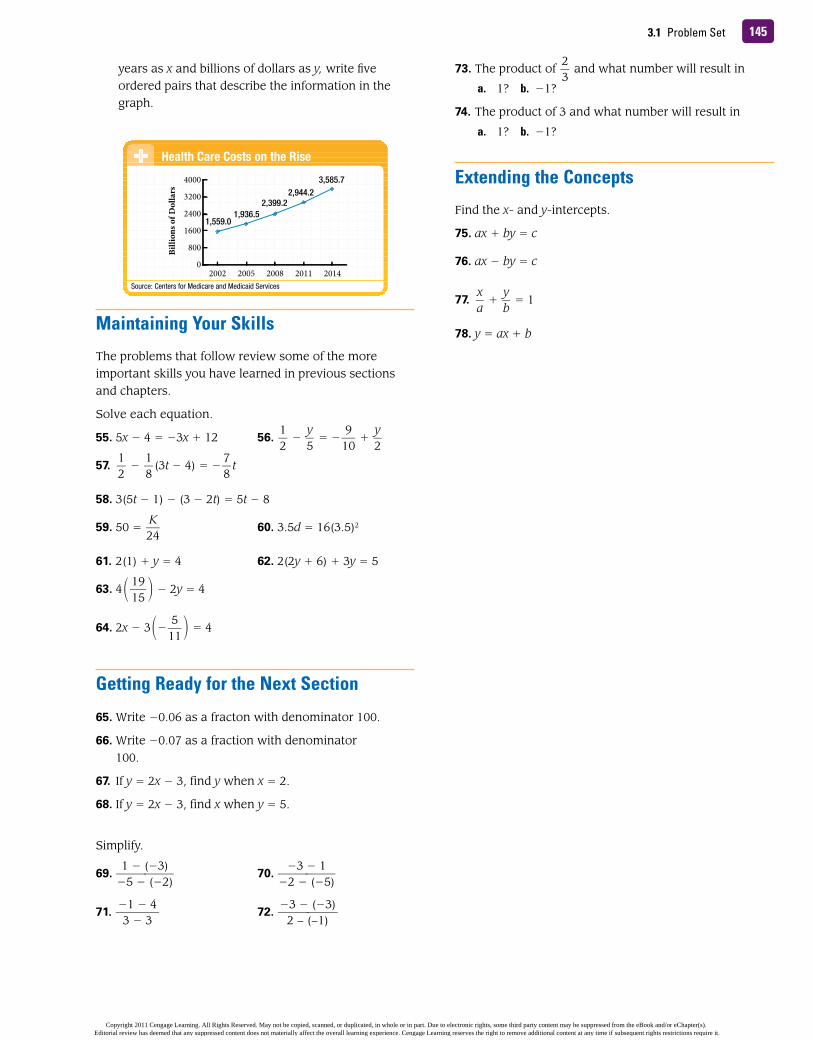
3.1 Problem Set 145
years as x and billions of dollars as y, write five ordered pairs that describe the information in the graph.
maintaining Your Skills
The problems that follow review some of the more important skills you have learned in previous sections and chapters.
Solve each equation.
55. 5x − 4 = −3x + 12 56. 1 _
2 − y _
5 = −
9 _
10 + y _
2
57. 1 _ 2 − 1 _
8 (3t − 4) = −
7 _
8 t
58. 3(5t − 1) − (3 − 2t) = 5t − 8
59. 50 = K _ 24
60. 3.5d = 16(3.5)2
61. 2(1) + y = 4 62. 2(2y + 6) + 3y = 5
63. 419 _
15 − 2y = 4
64. 2x − 3 −5 _
11 = 4
Getting Ready for the Next Section
65. Write −0.06 as a fracton with denominator 100.
66. Write −0.07 as a fraction with denominator 100.
67. If y = 2x − 3, find y when x = 2.
68. If y = 2x − 3, find x when y = 5.
Simplify.
69. 1 − (−3)
__ −5 − (−2)
70. −3 − 1 __
−2 − (−5)
71. −1 − 4
_ 3 − 3
72. −3 − (−3) __
2 − (−1)
Source: Centers for Medicare and Medicaid Services
Health Care Costs on the Rise
0
800
1600
2400
3200
4000
20142011200820052002
2,399.22,944.2
3,585.7
1,936.51,559.0
Billi
ons o
f Dol
lars
73. The product of 2
_ 3
and what number will result in
a. 1? b. −1?
74. The product of 3 and what number will result in
a. 1? b. −1?
Extending the Concepts
Find the x- and y-intercepts.
75. ax + by = c
76. ax − by = c
77. x _ a + y _
b = 1
78. y = ax + b
Copyright 2011 Cengage Learning. All Rights Reserved. May not be copied, scanned, or duplicated, in whole or in part. Due to electronic rights, some third party content may be suppressed from the eBook and/or eChapter(s). Editorial review has deemed that any suppressed content does not materially affect the overall learning experience. Cengage Learning reserves the right to remove additional content at any time if subsequent rights restrictions require it.
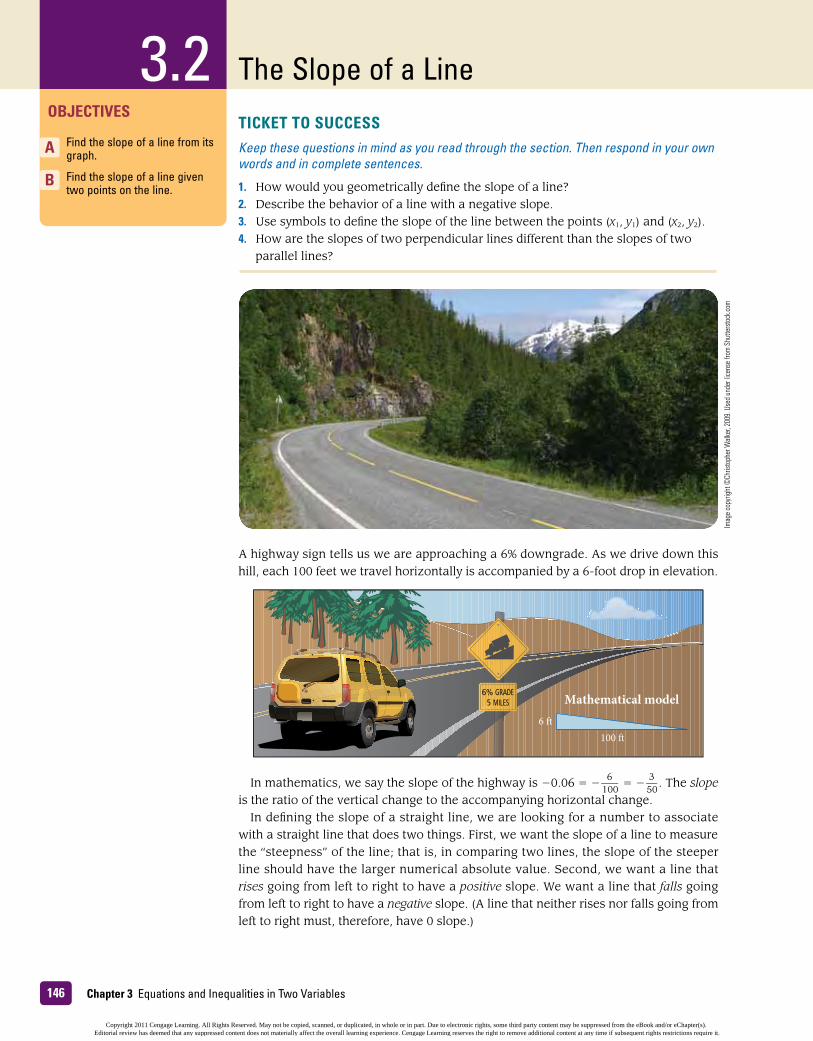
3.2
Chapter 3 Equations and Inequalities in Two Variables146
The Slope of a LineOBjECTIVES
Find the slope of a line from its graph.
B Find the slope of a line given two points on the line.
A
3.2TICkET TO SuCCESSKeep these questions in mind as you read through the section. Then respond in your own words and in complete sentences.
1. How would you geometrically define the slope of a line?2. Describe the behavior of a line with a negative slope.3. Use symbols to define the slope of the line between the points (x1, y1) and (x2, y2).4. How are the slopes of two perpendicular lines different than the slopes of two
parallel lines?
A highway sign tells us we are approaching a 6% downgrade. As we drive down this hill, each 100 feet we travel horizontally is accompanied by a 6-foot drop in elevation.
In mathematics, we say the slope of the highway is −0.06 = − 6 _
100 = −3 _
50 . The slope
is the ratio of the vertical change to the accompanying horizontal change.In defining the slope of a straight line, we are looking for a number to associate
with a straight line that does two things. First, we want the slope of a line to measure the “steepness” of the line; that is, in comparing two lines, the slope of the steeper line should have the larger numerical absolute value. Second, we want a line that rises going from left to right to have a positive slope. We want a line that falls going from left to right to have a negative slope. (A line that neither rises nor falls going from left to right must, therefore, have 0 slope.)
Imag
e cop
yrigh
t ©Ch
risto
pher
Walk
er, 20
09. U
sed u
nder
licen
se fr
om S
hutte
rstoc
k.com
6% GRADE5 MILES Mathematical model
100 �6 �
Copyright 2011 Cengage Learning. All Rights Reserved. May not be copied, scanned, or duplicated, in whole or in part. Due to electronic rights, some third party content may be suppressed from the eBook and/or eChapter(s). Editorial review has deemed that any suppressed content does not materially affect the overall learning experience. Cengage Learning reserves the right to remove additional content at any time if subsequent rights restrictions require it.

3.21473.2 The Slope of a Line
Geometrically, we can define the slope of a line as the ratio of the vertical change to the horizontal change encountered when moving from one point to another on the line. The vertical change is sometimes called the rise. The horizontal change is called the run.
A Finding the Slope From Graphs
ExAmPLE 1 Find the slope of the line y = 2x − 3.
SOLuTION To use our geometric definition, we first graph y = 2x − 3 (Figure 1). We then pick any two convenient points and find the ratio of rise to run. By convenient points we mean points with integer coordinates. If we let x = 2 in the equation, then y = 1. Likewise if we let x = 4, then y is 5.
Our line has a slope of 2.
Notice that we can measure the vertical change (rise) by subtracting the y- coordinates of the two points shown in Figure 1: 5 − 1 = 4. The horizontal change (run) is the difference of the x-coordinates: 4 − 2 = 2. This gives us a second way of defining the slope of a line.
x
y
Negative slope
x
y
Zero slope
x
y
Positive slope
Slope = 42 = 2Vertical change =Rise = 4
Horizontalchange =Run = 2
(4, 5)
(2, 1)
−5 −4 −3 −2 −1 1 2 3 4 5
−5−4−3−2−1
12345
x
y
FIGURE 1
Copyright 2011 Cengage Learning. All Rights Reserved. May not be copied, scanned, or duplicated, in whole or in part. Due to electronic rights, some third party content may be suppressed from the eBook and/or eChapter(s). Editorial review has deemed that any suppressed content does not materially affect the overall learning experience. Cengage Learning reserves the right to remove additional content at any time if subsequent rights restrictions require it.
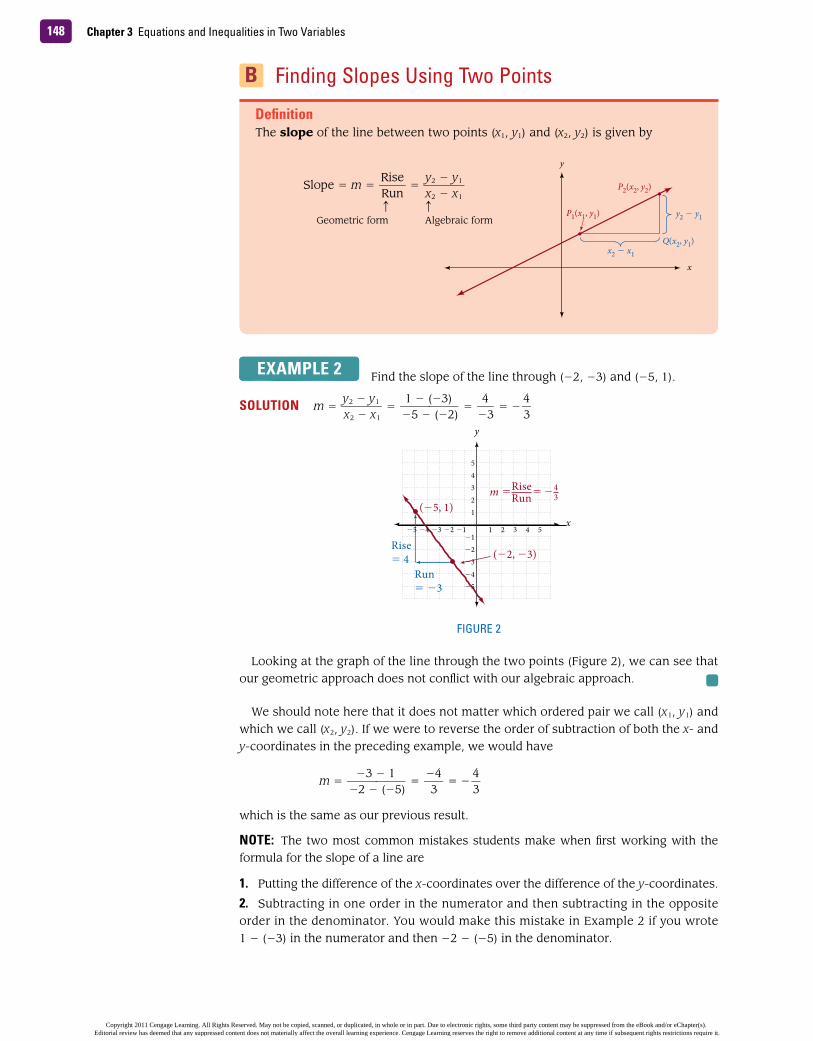
Chapter 3 Equations and Inequalities in Two Variables148
B Finding Slopes Using Two Points
ExAmPLE 2 Find the slope of the line through (−2, −3) and (−5, 1).
SOLuTION m = y 2 − y 1 _ x 2 − x 1
= 1 − (−3) __
−5 − (−2) = 4
_ −3
= −4
_ 3
Looking at the graph of the line through the two points (Figure 2), we can see that our geometric approach does not conflict with our algebraic approach.
We should note here that it does not matter which ordered pair we call (x 1, y 1) and which we call (x 2, y 2). If we were to reverse the order of subtraction of both the x- and y-coordinates in the preceding example, we would have
m = −3 − 1 __
−2 − (−5) = −4
_ 3
= −4
_ 3
which is the same as our previous result.
NOTE: The two most common mistakes students make when first working with the formula for the slope of a line are
1. Putting the difference of the x-coordinates over the difference of the y-coordinates.
2. Subtracting in one order in the numerator and then subtracting in the opposite order in the denominator. You would make this mistake in Example 2 if you wrote 1 − (−3) in the numerator and then −2 − (−5) in the denominator.
DefinitionThe slope of the line between two points (x 1, y 1) and (x 2, y 2) is given by
Slope = m = Rise _
Run = y 2 − y 1 _
x 2 − x 1
h h
Geometric form Algebraic form
x
y
Q(x2, y1)
P1(x1, y1)
P2(x2, y2)
x2 − x1
y2 − y1
m = RiseRun= −4
3
Rise= 4
Run = −3
(−2, −3)
(−5, 1)
−5 −4 −3 −2 −1 1 2 3 4 5
−5−4−3−2−1
12345
x
y
FIGURE 2
Copyright 2011 Cengage Learning. All Rights Reserved. May not be copied, scanned, or duplicated, in whole or in part. Due to electronic rights, some third party content may be suppressed from the eBook and/or eChapter(s). Editorial review has deemed that any suppressed content does not materially affect the overall learning experience. Cengage Learning reserves the right to remove additional content at any time if subsequent rights restrictions require it.
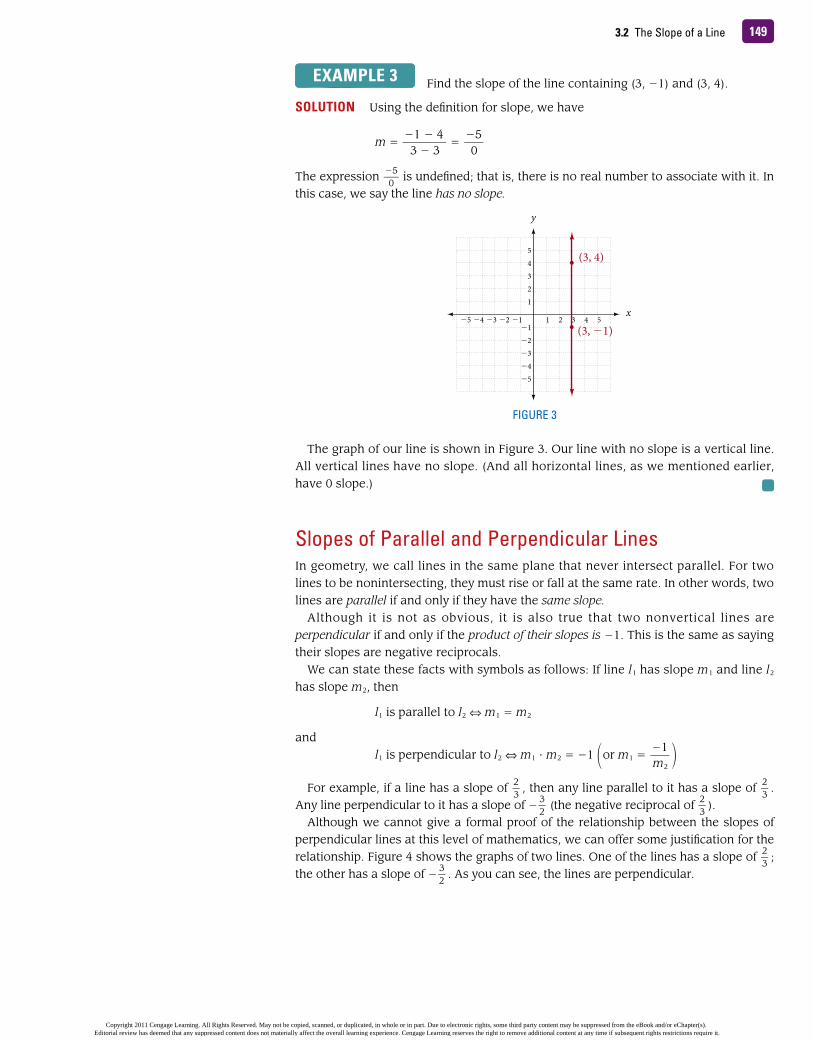
1493.2 The Slope of a Line
ExAmPLE 3 Find the slope of the line containing (3, −1) and (3, 4).
SOLuTION Using the definition for slope, we have
m = −1 − 4 _
3 − 3 = −5
_ 0
The expression −5 _
0 is undefined; that is, there is no real number to associate with it. In
this case, we say the line has no slope.
The graph of our line is shown in Figure 3. Our line with no slope is a vertical line. All vertical lines have no slope. (And all horizontal lines, as we mentioned earlier, have 0 slope.)
Slopes of Parallel and Perpendicular LinesIn geometry, we call lines in the same plane that never intersect parallel. For two lines to be nonintersecting, they must rise or fall at the same rate. In other words, two lines are parallel if and only if they have the same slope.
Although it is not as obvious, it is also true that two nonvertical lines are perpendicular if and only if the product of their slopes is −1. This is the same as saying their slopes are negative reciprocals.
We can state these facts with symbols as follows: If line l 1 has slope m 1 and line l 2has slope m 2, then
l 1 is parallel to l 2 a m 1 = m 2
andl 1 is perpendicular to l 2 a m 1 ⋅ m 2 = −1 or m 1 = −1
_ m 2
For example, if a line has a slope of 2 _
3 , then any line parallel to it has a slope of 2 _
3 .
Any line perpendicular to it has a slope of −3 _ 2 (the negative reciprocal of 2 _
3 ).
Although we cannot give a formal proof of the relationship between the slopes of perpendicular lines at this level of mathematics, we can offer some justification for the relationship. Figure 4 shows the graphs of two lines. One of the lines has a slope of 2 _
3 ;
the other has a slope of −3 _ 2 . As you can see, the lines are perpendicular.
−5 −4 −3 −2 −1 1 2 3 4 5
−5−4−3−2−1
12345
x
y
(3, 4)
(3, −1)
FIGURE 3
Copyright 2011 Cengage Learning. All Rights Reserved. May not be copied, scanned, or duplicated, in whole or in part. Due to electronic rights, some third party content may be suppressed from the eBook and/or eChapter(s). Editorial review has deemed that any suppressed content does not materially affect the overall learning experience. Cengage Learning reserves the right to remove additional content at any time if subsequent rights restrictions require it.

Chapter 3 Equations and Inequalities in Two Variables150
Slope and Rate of ChangeSo far, the slopes we have worked with represent the ratio of the change in y to a corresponding change in x; or, on the graph of the line, the ratio of vertical change to horizontal change in moving from one point on the line to another. However, when our variables represent quantities from the world around us, slope can have additional interpretations.
ExAmPLE 4 On the chart below, find the slope of the line connecting the first point (1955, 0.29) with the highest point (2005, 2.93). Explain the significance of the result.
SOLuTION The slope of the line connecting the first point (1955, 0.29) with the highest point (2005, 2.93), is
m = 2.93 − 0.29 __
2005 − 1955 = 2.64
_ 50
= 0.0528
The units are dollars/year. If we write this in terms of cents we have
m = 5.28 cents/year
which is the average change in the price of a gallon of gasoline over a 50-year period of time.
Likewise, if we connect the points (1995, 1.10) and (2005, 2.93), the line that results has a slope of
m = 2.93 − 1.10 __
2005 − 1995 = 1.83
_ 10
= 0.183 dollars/year = 18.3 cents/year
m = 23
m = −32
−3
3
2
2
−5 −4 −3 −2 −1 1 2 3 4 5
−5−4−3−2−1
12345
x
y
FIGURE 4
Source: Forrester Research, 2010
Fuel Economy
$0.00$0.50$1.00$1.50$2.00$2.50$3.00
’55 ’60 ’65 ’70 ’75 ’80 ’85 ’90 ’95 ’00 ’05 ’10
$0.29
$2.74
Average Price per Gallon of Gasolinein the U.S. since 1955
$2.93
Copyright 2011 Cengage Learning. All Rights Reserved. May not be copied, scanned, or duplicated, in whole or in part. Due to electronic rights, some third party content may be suppressed from the eBook and/or eChapter(s). Editorial review has deemed that any suppressed content does not materially affect the overall learning experience. Cengage Learning reserves the right to remove additional content at any time if subsequent rights restrictions require it.

1513.2 The Slope of a Line
which is the average change in the price of a gallon of gasoline over a 10-year period. As you can imagine by looking at the chart, the line connecting the first and last point is not as steep as the line connecting the points from 1995 and 2005, and this is what we are seeing numerically with our slope calculations. If we were summarizing this information for an article in the newspaper, we could say, although the price of a gallon of gasoline has increased only 5.28 cents per year over the last 50 years, in the last 10 years the average annual rate of increase was more than triple that, at 18.3 cents per year.
Slope and Average SpeedPreviously we introduced the rate equation d = rt. Suppose that a boat is traveling at a constant speed of 15 miles per hour in still water. The following table shows the distance the boat will have traveled in the specified number of hours. The graph of this data is shown in Figure 5. Notice that the points all lie along a line.
We can calculate the slope of this line using any two points from the table. Notice we have graphed the data with t on the horizontal axis and d on the vertical axis. Using the points (2, 30) and (3, 45), the slope will be
m = rise _
run = 45 − 30
_ 3 − 2
= 15 _
1 = 15
The units of the rise are miles and the units of the run are hours, so the slope will be in units of miles per hour. We see that the slope is simply the change in distance divided by the change in time, which is how we compute the average speed. Since the speed is constant, the slope of the line represents the speed of 15 miles per hour.
ExAmPLE 5 A car is traveling at a constant speed. A graph (Figure 6) of the distance the car has traveled over time is shown below. Use the graph to find the speed of the car.
t d (hours) (miles)
0 0 1 15 2 30 3 45 4 60 5 75
10 2 3 4 5
15
0
30
45
60
75
Hours
Mile
sFIGURE 5
0 2 4 6
120
0
240
360
Hours
Mile
s
FIGURE 6
Copyright 2011 Cengage Learning. All Rights Reserved. May not be copied, scanned, or duplicated, in whole or in part. Due to electronic rights, some third party content may be suppressed from the eBook and/or eChapter(s). Editorial review has deemed that any suppressed content does not materially affect the overall learning experience. Cengage Learning reserves the right to remove additional content at any time if subsequent rights restrictions require it.
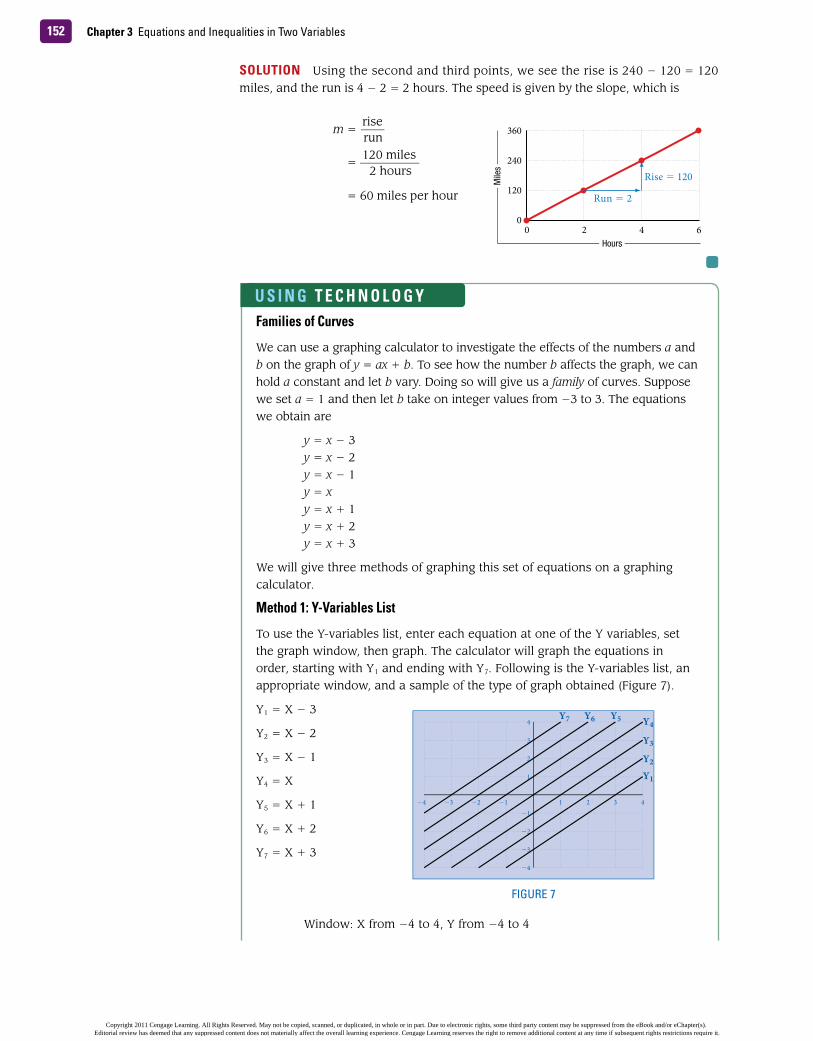
Chapter 3 Equations and Inequalities in Two Variables152
SOLuTION Using the second and third points, we see the rise is 240 − 120 = 120 miles, and the run is 4 − 2 = 2 hours. The speed is given by the slope, which is
m = rise _
run
= 120 miles _
2 hours
= 60 miles per hour
Families of Curves
We can use a graphing calculator to investigate the effects of the numbers a and b on the graph of y = ax + b. To see how the number b affects the graph, we can hold a constant and let b vary. Doing so will give us a family of curves. Suppose we set a = 1 and then let b take on integer values from −3 to 3. The equations we obtain are
y = x − 3 y = x − 2 y = x − 1 y = x y = x + 1 y = x + 2 y = x + 3
We will give three methods of graphing this set of equations on a graphing calculator.
method 1: Y-Variables List
To use the Y-variables list, enter each equation at one of the Y variables, set the graph window, then graph. The calculator will graph the equations in order, starting with Y 1 and ending with Y 7. Following is the Y-variables list, an appropriate window, and a sample of the type of graph obtained (Figure 7).
Y 1 = X − 3
Y 2 = X − 2
Y 3 = X − 1
Y 4 = X
Y 5 = X + 1
Y 6 = X + 2
Y 7 = X + 3
Window: X from −4 to 4, Y from −4 to 4
−3 −2 −1 1 2 3 4−4
−4
−3
−2
−1
1
2
3
4
Y1
Y2
Y3
Y4Y5Y6Y7
FIGURE 7
u S I N G T E C H N O L O G Y
0 2 4 6
120
0
240
360
Hours
Mile
s
Rise � 120
Run � 2
Copyright 2011 Cengage Learning. All Rights Reserved. May not be copied, scanned, or duplicated, in whole or in part. Due to electronic rights, some third party content may be suppressed from the eBook and/or eChapter(s). Editorial review has deemed that any suppressed content does not materially affect the overall learning experience. Cengage Learning reserves the right to remove additional content at any time if subsequent rights restrictions require it.

3.2 Problem Set 153
method 2: Programming
The same result can be obtained by programming your calculator to graph y = x + b for b = − 3, −2, −1, 0, 1, 2, and 3. Here is an outline of a program that will do this. Check the manual that came with your calculator to find the commands for your calculator.
Step 1: Clear screenStep 2: Set window for X from −4 to 4 and Y from −4 to 4Step 3: −3 n BStep 4: Label 1Step 5: Graph Y = X + BStep 6: B + 1 n BStep 7: If B < 4, go to 1Step 8: End
method 3: using Lists
On the TI-83/84 you can set Y 1 as follows
Y 1 = X + {−3, −2, −1, 0, 1, 2, 3}
When you press GRAPH, the calculator will graph each line from y = x + (−3) to y = x + 3.
Each of the three methods will produce graphs similar to those in Figure 7.
Problem Set 3.2
“Life is ten percent what happens to you and ninety percent how you respond to it.”
—Lou Holtz, 1937–present, American college football coach and motivational speaker
1. Do you think it is important to take notes as you read this book? Explain.
2. Why is it helpful to put the material you learn in your own words when you take notes or answer homework questions?
moving Toward Success
A Find the slope of each of the following lines from the given graph. [Example 1]
1.
x
y
2
−3
2.
x
y
−2
−3
Copyright 2011 Cengage Learning. All Rights Reserved. May not be copied, scanned, or duplicated, in whole or in part. Due to electronic rights, some third party content may be suppressed from the eBook and/or eChapter(s). Editorial review has deemed that any suppressed content does not materially affect the overall learning experience. Cengage Learning reserves the right to remove additional content at any time if subsequent rights restrictions require it.
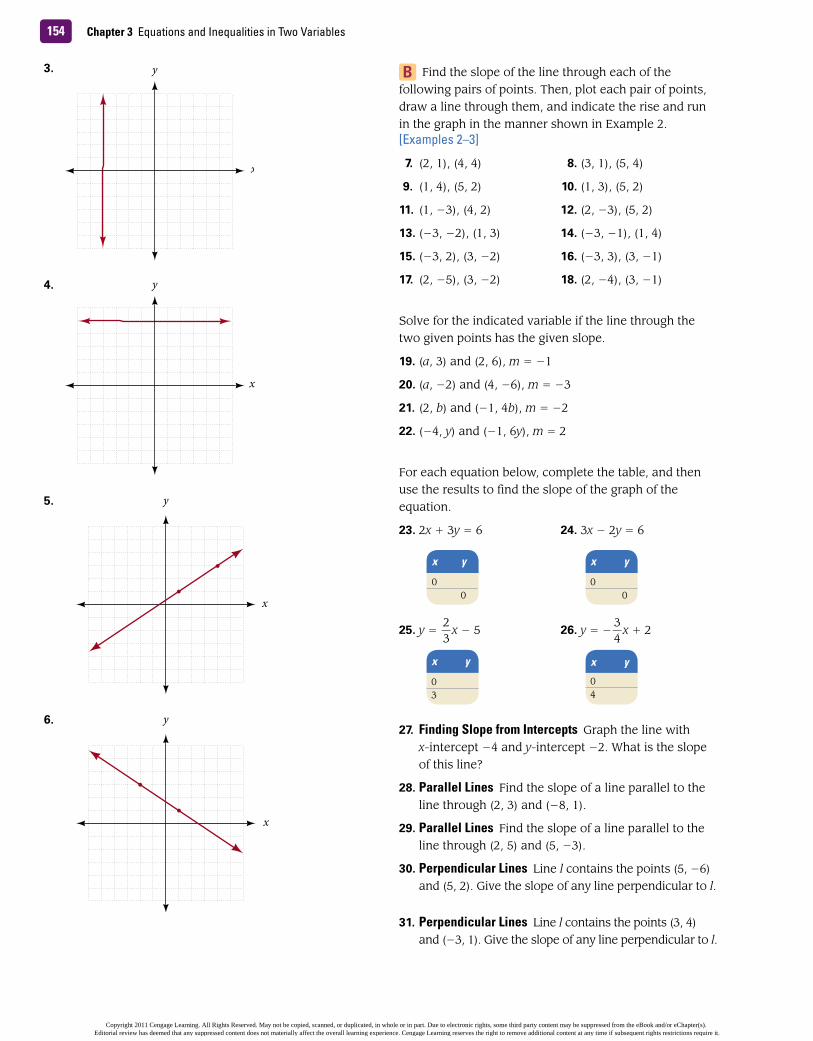
Chapter 3 Equations and Inequalities in Two Variables154
3.
4.
5.
6.
x
y
x
y
x
y
x
y
B Find the slope of the line through each of the following pairs of points. Then, plot each pair of points, draw a line through them, and indicate the rise and run in the graph in the manner shown in Example 2. [Examples 2–3]
7. (2, 1), (4, 4) 8. (3, 1), (5, 4)
9. (1, 4), (5, 2) 10. (1, 3), (5, 2)
11. (1, −3), (4, 2) 12. (2, −3), (5, 2)
13. (−3, −2), (1, 3) 14. (−3, −1), (1, 4)
15. (−3, 2), (3, −2) 16. (−3, 3), (3, −1)
17. (2, −5), (3, −2) 18. (2, −4), (3, −1)
Solve for the indicated variable if the line through the two given points has the given slope.
19. (a, 3) and (2, 6), m = −1
20. (a, −2) and (4, −6), m = −3
21. (2, b) and (−1, 4b), m = −2
22. (−4, y) and (−1, 6y), m = 2
For each equation below, complete the table, and then use the results to find the slope of the graph of the equation.
23. 2x + 3y = 6 24. 3x − 2y = 6
25. y = 2 _ 3
x − 5 26. y = −3 _
4 x + 2
27. Finding Slope from Intercepts Graph the line with x-intercept −4 and y-intercept −2. What is the slope of this line?
28. Parallel Lines Find the slope of a line parallel to the line through (2, 3) and (−8, 1).
29. Parallel Lines Find the slope of a line parallel to the line through (2, 5) and (5, −3).
30. Perpendicular Lines Line l contains the points (5, −6) and (5, 2). Give the slope of any line perpendicular to l.
31. Perpendicular Lines Line l contains the points (3, 4) and (−3, 1). Give the slope of any line perpendicular to l.
x y
0 0
x y
0 0
x y
0 3
x y
0 4
Copyright 2011 Cengage Learning. All Rights Reserved. May not be copied, scanned, or duplicated, in whole or in part. Due to electronic rights, some third party content may be suppressed from the eBook and/or eChapter(s). Editorial review has deemed that any suppressed content does not materially affect the overall learning experience. Cengage Learning reserves the right to remove additional content at any time if subsequent rights restrictions require it.

3.2 Problem Set 155
32. Parallel Lines Line l contains the points (−2, 1) and(4, −5). Find the slope of any line parallel to l.
33. Parallel Lines Line l contains the points (3, −4) and(−2, −6). Find the slope of any line parallel to l.
34. Perpendicular Lines Line l contains the points (−2, −5) and (1, −3). Find the slope of any line perpendicular to l.
35. Perpendicular Lines Line l contains the points (6, −3) and (−2, 7). Find the slope of any line perpendicular to l.
36. Graph the line with x-intercept 4 and y-intercept 2. What is the slope of this line?
37. Determine if each of the following tables could represent ordered pairs from an equation of a line.a. b.
38. The following lines have slope 2, 1 _ 2 , 0, and −1. Match
each line to its slope value.
39. Line l has a slope of 2 _ 3 . A horizontal change of 12 will
always be accompanied by how much of a vertical change?
40. For any line with slope 4 _ 5 , a vertical change of 8 is
always accompanied by how much of a horizontal change?
Applying the Concepts [Examples 4–5]
41. An object is traveling at a constant speed. The distance and time data are shown on the given graphs. Use the graphs to find the speed of the object.
x y
0 51 72 93 11
x y
−2 −5 0 −2 2 0 4 1
x
y
A
D
BC
a. b.
c. d.
42. Cycling A cyclist is traveling at a constant speed. The graph shows the distance the cyclist travels over time when there is no wind present, when she travels against the wind, and when she travels with the wind.
a. Use the concept of slope to find the speed of the cyclist under each of the three conditions.
b. Compare the speed of the cyclist when she is traveling without any wind to when she is riding against the wind. How do the two speeds differ?
c. Compare the speed of the cyclist when she is traveling without any wind to when she is riding with the wind. How do the two speeds differ?
d. What is the speed of the wind?
0 2 4 6
35
0
70
105
Hours
Mile
s
0 0.5 1 1.5 2
20
0
40
60
80
Hours
Kilo
met
ers
0 10 20 30
1200
0
2400
3600
Feet
Seconds0 5 10 15
140
0
280
420
Minutes
Met
ers
0.50 1 1.5 2
120
24364860728496
108
Kilo
met
ers
Time in Hours
No wind
Against wind
With wind
Copyright 2011 Cengage Learning. All Rights Reserved. May not be copied, scanned, or duplicated, in whole or in part. Due to electronic rights, some third party content may be suppressed from the eBook and/or eChapter(s). Editorial review has deemed that any suppressed content does not materially affect the overall learning experience. Cengage Learning reserves the right to remove additional content at any time if subsequent rights restrictions require it.

Chapter 3 Equations and Inequalities in Two Variables156
43. Non-Camera Phone Sales The table and line graph here each show the projected non-camera phone sales each year through 2010. Find the slope of each of the three line segments, A, B, and C.
44. Camera Phone Sales The table and line graph here show the projected sales of camera phones from 2006 to 2010. Find the slopes of line segments, A, B, and C.
45. Slope of a Highway A sign at the top of the Cuesta Grade, outside of San Luis Obispo,CA reads “7% downgrade next 3 miles.” The diagram shown here is a model of the Cuesta Grade that takes into account the information on that sign.a. At point B, the graph crosses the y-axis at 1,106
feet. How far is Point A from the origin?
Year 2006 2007 2008 2009 2010
Sales (in millions)
2006 2007 2008 2009 2010
100
200
300
400
500
Year
Non
–Cam
era P
hone
s (m
illio
ns)
Projected Non–Camera Phone Sales
AB
C
Year 2006 2007 2008 2009 2010
Sales (in millions)
2006 2007 2008 2009 2010
200
400
600
800
1000
Cam
era P
hone
s (m
illio
ns)
Year
Projected Camera Phone Sales
AB
C
b. What is the slope of the Cuesta Grade?
46. Health Care The graph shows the rising cost of health care. What is the slope of the line segment from 2008 to 2011?
47. Solar Energy The graph below shows the annual shipments of solar thermal collectors in the United States. Using the graph below, find the slope of the line connecting the first (1997, 8,000) and last (2008, 17,000) endpoints and then explain in words what the slope represents.
48. Age of New mothers The graph shows the increase in the average age of first time mothers in the U.S. since 1970. Find the slope of the line that connects the
0 10,000 20,0005,000 15,000
200
400
600
800
1,000
1,200
x
y
B
A
Cuesta Grade
Source: Centers for Medicare and Medicaid Services
Health Care Costs on the Rise
0
800
1600
2400
3200
4000
20142011200820052002
2,399.22,944.2
3,585.7
1,936.51,559.0
Billi
ons o
f Dol
lars
Source: Energy Information Association 2008
Solar Thermal Collectors
25000
200001500010000
5000
0‘97 ‘98 ‘99 ‘00 ‘01 ‘02 ‘03 ‘04 ‘05 ‘06 ‘07 ‘08
Copyright 2011 Cengage Learning. All Rights Reserved. May not be copied, scanned, or duplicated, in whole or in part. Due to electronic rights, some third party content may be suppressed from the eBook and/or eChapter(s). Editorial review has deemed that any suppressed content does not materially affect the overall learning experience. Cengage Learning reserves the right to remove additional content at any time if subsequent rights restrictions require it.

3.2 Problem Set 157
points (1975, 21.75) and (1990, 24.25). Round to the nearest hundredth. Explain in words what the slope represents.
49. Horse Racing The graph shows the amount of money bet on horse racing from 1985 to 2010. Use the chart to work the following problems involving slope.
a. Find the slope of the line from 1985 to 1990, and then explain in words what the slope represents.
b. Find the slope of the line from 2000 to 2005, and then explain in words what the slope represents.
50. Light Bulbs The chart shows a comparison of power usage between incandescent and LED light bulbs. Use the chart to work the following problems involving slope.
Source: http://www.childstats.gov
Waiting for the First Child
202122232425
‘05 ‘06‘00‘95‘90‘85‘80‘75‘70
26
Source: http://www.kentuckyderby.com, Thoroughbred Times
Betting the Ponies
44.834.465.4
104
163
20.2
0
50
100
150
200
2005 20102000199519901985
Mill
ions
of d
olla
rs
Source: Eartheasy.com
Incandescent vs. LED Light Bulbs
160
120
80
40
0450 800 1100 1600 2600 Light Output
(lumens)
Am
ount
of w
atts
use
d Incandescent Bulbs
LED Bulbs
a. Find the slope of the line for the incandescent bulb from the two endpoints and then explain in words what the slope represents.
b. Find the slope of the line for the LED bulb from the two endpoints and then explain in words what the slope represents.
c. Which light bulb is more efficient? Why?
maintaining Your Skills
The problems that follow review some of the more important skills you have learned in previous sections and chapters.
51. If 3x + 2y = 12, find y when x is 4.
52. If y = 3x − 1, find x when y is 0.
53. Solve the formula 3x + 2y = 12 for y.
54. Solve the formula y = 3x − 1 for x.
55. Solve the formula A = P + Prt for t.
56. Solve the formula S = πr 2 + 2πrh for h.
Getting Ready for the Next Section
Simplify.
57. 2 −1
_ 2
58. 3 − (−1)
_ −3 − 3
59. 5 − (−3)
_ 2 − 6
60. 3 −2
_ 3
x + 1
Solve for y.
61. y − b
_ x − 0
= m
62. 2x + 3y = 6
63. y − 3 = −2(x + 4)
64. y + 1 = −2
_ 3
(x − 3)
65. If y = −4
_ 3
x + 5, find y when x is 0.
66. If y = −4
_ 3
x + 5, find y when x is 3.
Copyright 2011 Cengage Learning. All Rights Reserved. May not be copied, scanned, or duplicated, in whole or in part. Due to electronic rights, some third party content may be suppressed from the eBook and/or eChapter(s). Editorial review has deemed that any suppressed content does not materially affect the overall learning experience. Cengage Learning reserves the right to remove additional content at any time if subsequent rights restrictions require it.

3.3
Chapter 3 Equations and Inequalities in Two Variables158
OBjECTIVES
Find the equation of a line given its slope and y-intercept.
B Find the slope and y-intercept from the equation of a line.
Find the equation of a line given the slope and a point on the line.
D Find the equation of a line given two points on the line.
A
C
3.3 The Equation of a Line
TICkET TO SuCCESSKeep these questions in mind as you read through the section. Then respond in your own words and in complete sentences.
1. What is the slope-intercept form of the equation of a line?2. How would you graph the line y = 1 __ 2 x + 3?3. How would you write the equation of a line using point-slope form?4. Use symbols to write the equation of a line in standard form.
The table and illustrations show some corresponding temperatures on the Fahrenheit and Celsius temperature scales. For example, water freezes at 32°F and 0°C, and boils at 212°F and 100°C.
If we plot all the points in the table using the x-axis for temperatures on the Celsius scale and the y-axis for temperatures on the Fahrenheit scale, we see that they line up in a straight line (Figure 1). This means that a linear equation in two variables will give a perfect description of the relationship between the two scales. That equation is
F = 9 _ 5
C + 32
The techniques we use to find the equation of a line from a set of points is what this section is all about.
Imag
e cop
yrigh
t ©St
even
Coli
ng, 2
009.
Used
unde
r lice
nse f
rom
Shut
terst
ock.c
om
°C°F
Icewater
32° 0°Boilingwater
°C°F212° 100°
Degrees Degrees Celsius Fahrenheit
0 32 25 77 50 122 75 167 100 212
Copyright 2011 Cengage Learning. All Rights Reserved. May not be copied, scanned, or duplicated, in whole or in part. Due to electronic rights, some third party content may be suppressed from the eBook and/or eChapter(s). Editorial review has deemed that any suppressed content does not materially affect the overall learning experience. Cengage Learning reserves the right to remove additional content at any time if subsequent rights restrictions require it.

3.31593.3 The Equation of a Line
A Finding the Line Using the Slope and InterceptsSuppose line l has slope m and y-intercept b. What is the equation of l? Because the y-intercept is b, we know the point (0, b) is on the line. If (x, y) is any other point on l, then using the definition for slope, we have
y − b _
x − 0 = m Definition of slope
y − b = mx Multiply both sides by x
y = mx + b Add b to both sides
This last equation is known as the slope-intercept form of the equation of a straight line.
When the equation is in this form, the slope of the line is always the coefficient of x, and the y-intercept is always the constant term.
ExAmPLE 1 Find the equation of the line with slope −4 _ 3 and y-intercept 5.
Then graph the line.
SOLuTION Substituting m = −4 _ 3 and b = 5 into the equation y = mx + b, we have
y = −4
_ 3
x + 5
Finding the equation from the slope and y-intercept is just that easy. If the slope is m and the y-intercept is b, then the equation is always y = mx + b. Now, let’s graph the line.
Because the y-intercept is 5, the graph goes through the point (0, 5). To find a second point on the graph, we can use the given slope of − 4 _
3 . We start at (0, 5) and
move 4 units down (that’s a rise of −4) and 3 units to the right (a run of 3). The point we end up at is (3, 1). Drawing a line that passes through (0, 5) and (3, 1), we have the graph of our equation. (Note that we could also let the rise = 4 and the run = −3 and obtain the same graph.) The graph is shown in Figure 2.
0 25 50 75 100 1250
50
100
150
200
250
Celsius temperatures (°C)
Fahr
enhe
it te
mpe
ratu
res (
°F)
x
y
FIGURE 1
Property: Slope-Intercept FormThe equation of any line with slope m and y-intercept b is given by
y = mx + b
Slope y-intercept) )
Copyright 2011 Cengage Learning. All Rights Reserved. May not be copied, scanned, or duplicated, in whole or in part. Due to electronic rights, some third party content may be suppressed from the eBook and/or eChapter(s). Editorial review has deemed that any suppressed content does not materially affect the overall learning experience. Cengage Learning reserves the right to remove additional content at any time if subsequent rights restrictions require it.

Chapter 3 Equations and Inequalities in Two Variables160
B Finding Slopes and Intercepts
ExAmPLE 2 Give the slope and y-intercept for the line 2x − 3y = 5.
SOLuTION To use the slope-intercept form, we must solve the equation for y in terms of x.
2x − 3y = 5
−3y = −2x + 5 Add −2x to both sides
y = 2 _ 3
x − 5 _ 3
Divide by −3
The last equation has the form y = mx + b. The slope must be m = 2 _ 3 , and the
y-intercept is b = −5 _ 3 .
ExAmPLE 3 Graph the equation 2x + 3y = 6 using the slope and y-intercept.
SOLuTION Although we could graph this equation by finding ordered pairs that are solutions to the equation and drawing a line through their graphs, it is sometimes easier to graph a line using the slope-intercept form of the equation.
Solving the equation for y, we have
2x + 3y = 6
3y = −2x + 6 Add −2x to both sides
y = −2
_ 3
x + 2 Divide by 3
The slope is m = −2 _ 3 and the y-intercept is b = 2. Therefore, the point (0, 2) is on the
graph, and the ratio of rise to run going from (0, 2) to any other point on the line is −2 _ 3 .
If we start at (0, 2) and move 2 units up (that’s a rise of 2) and 3 units to the left (a run of −3), we will be at another point on the graph. (We could also go down 2 units and right 3 units and still be assured of ending up at another point on the line because 2
_ −3
is the same as −2
_ 3 .)
y-intercept = 5
Rise = −4
Run = 3
(0, 5)
(3, 1)
−5 −4 −3 −2 −1 1 2 3 4 5
−5−4−3−2−1
12345
x
y
FIGURE 2
NOTEAs we mentioned earlier, the rectangular coordinate system is the tool we use to connect algebra and geometry. Example 3 illustrates this connection, as do the many other examples in this chapter. In Example 3, Descartes’ rectangular coordinate system allows us to associate the equation 2x + 3y = 6 (an algebraic concept) with the straight line (a geometric concept) shown in Figure 3.
Copyright 2011 Cengage Learning. All Rights Reserved. May not be copied, scanned, or duplicated, in whole or in part. Due to electronic rights, some third party content may be suppressed from the eBook and/or eChapter(s). Editorial review has deemed that any suppressed content does not materially affect the overall learning experience. Cengage Learning reserves the right to remove additional content at any time if subsequent rights restrictions require it.

1613.3 The Equation of a Line
C Finding the Line Using the Slope and a PointA second useful form of the equation of a straight line is the point-slope form.
Let line l contain the point (x 1, y 1) and have slope m. If (x, y) is any other point on l, then by the definition of slope we have
y − y 1 _ x − x 1
= m
Multiplying both sides by (x − x 1) gives us
(x − x 1) ⋅ y − y 1 _ x − x 1
= m(x − x 1)
y − y 1 = m(x − x 1)
This last equation is known as the point-slope form of the equation of a straight line.
This form of the equation of a straight line is used to find the equation of a line, either given one point on the line and the slope, or given two points on the line.
ExAmPLE 4 Find the equation of the line with slope −2 that contains the point (−4, 3). Write the answer in slope-intercept form.
SOLuTION Using (x 1, y 1) = (−4, 3) and m = −2
in y − y 1 = m(x − x 1) Point-slope form
gives us y − 3 = −2(x + 4) Note: x − (−4) = x + 4
y − 3 = −2x − 8 Multiply out right side
y = −2x − 5 Add 3 to each side
Figure 4 is the graph of the line that contains (−4, 3) and has a slope of −2. Notice that the y-intercept on the graph matches that of the equation we found.
Rise = 2
Run = −3
(0, 2)
y =− 23 x + 2
−5 −4 −3 −2 −1 1 2 3 4 5
−5−4−3−2−1
12345
x
y
FIGURE 3
Property: Point-Slope FormThe equation of the line through (x 1, y 1) with slope m is given by
y − y 1 = m(x − x 1)
Copyright 2011 Cengage Learning. All Rights Reserved. May not be copied, scanned, or duplicated, in whole or in part. Due to electronic rights, some third party content may be suppressed from the eBook and/or eChapter(s). Editorial review has deemed that any suppressed content does not materially affect the overall learning experience. Cengage Learning reserves the right to remove additional content at any time if subsequent rights restrictions require it.

Chapter 3 Equations and Inequalities in Two Variables162
D Finding the Line Using Points
ExAmPLE 5 Find the equation of the line that passes through the points (−3, 3) and (3, −1).
SOLuTION We begin by finding the slope of the line
m = 3 − (−1) _
−3 − 3 = 4
_ −6
= −2
_ 3
Using (x 1, y 1) = (3, −1) and m = −2
_ 3
in y − y 1 = m(x − x 1) yields
y + 1 = −2
_ 3
(x − 3)
y + 1 = −2
_ 3
x + 2 Multiply out right side
y = −2
_ 3
x + 1 Add −1 to each side
Figure 5 shows the graph of the line that passes through the points (−3, 3) and (3, −1). As you can see, the slope and y-intercept are −2 _
3 and 1, respectively.
−5 −4 −3 −2 −1 1 2 3 4 5
−5
−4
−3
−2
−1
1
2
3
4
5
x
y
Slope =−21 =−2
y-intercept = −5(0, −5)
(−4, 3) 1−2
FIGURE 4
NOTEIn Example 5, we could have used the point (−3, 3) instead of (3, −1) and obtained the same equation; that is, using (x 1, y 1) = (−3, 3) and m = −2 _ 3 in y − y 1 = m(x − x 1) gives us y − 3 = −2 _ 3 (x + 3)
y − 3 = −2 _ 3 x − 2
y = −2 _ 3 x + 1which is the same result we obtained using (3, −1).
−5 −4 −3 −2 −1 1 2 3 4 5
−5
−4
−3
−2
−1
1
2
3
4
5
x
y
Slope =−23
y-intercept = 1
(3, −1)
(−3, 3)
(0, 1)−2
3
FIGURE 5
Copyright 2011 Cengage Learning. All Rights Reserved. May not be copied, scanned, or duplicated, in whole or in part. Due to electronic rights, some third party content may be suppressed from the eBook and/or eChapter(s). Editorial review has deemed that any suppressed content does not materially affect the overall learning experience. Cengage Learning reserves the right to remove additional content at any time if subsequent rights restrictions require it.

1633.3 The Equation of a Line
The last form of the equation of a line that we will consider in this section is called standard form. It is used mainly to write equations in a form that is free of fractions and is easy to compare with other equations.
If we were to write the equation
y = −2
_ 3
x + 1
in standard form, we would first multiply both sides by 3 to obtain
3y = −2x + 3
Then we would add 2x to each side, yielding
2x + 3y = 3
which is a linear equation in standard form.
ExAmPLE 6 Give the equation of the line through (−1, 4) whose graph is perpendicular to the graph of 2x − y = −3. Write the answer in standard form.
SOLuTION To find the slope of 2x − y = −3, we solve for y.
2x − y = −3 y = 2x + 3
The slope of this line is 2. The line we are interested in is perpendicular to the line with slope 2 and must, therefore, have a slope of −1 _
2 .
Using (x 1, y 1) = (−1, 4) and m = −1 _ 2 , we have
y − y 1 = m(x − x 1)
y − 4 = −1
_ 2
(x + 1)
Because we want our answer in standard form, we multiply each side by 2.
2y − 8 = −1(x + 1) 2y − 8 = −x − 1 x + 2y − 8 = −1 x + 2y = 7
The last equation is in standard form.
As a final note, the following summary reminds us that all horizontal lines have equations of the form y = b and slopes of 0. Because they cross the y-axis at b, the y-intercept is b; there is no x-intercept. Vertical lines have no slope and equations of the form x = a. Each will have an x-intercept at a and no y-intercept. Finally, equations of the form y = mx have graphs that pass through the origin. The slope is always m and both the x-intercept and the y-intercept are 0.
Property: Standard FormIf a, b, and c are integers, then the equation of a line is in standard form when it has the form
ax + by = c
Copyright 2011 Cengage Learning. All Rights Reserved. May not be copied, scanned, or duplicated, in whole or in part. Due to electronic rights, some third party content may be suppressed from the eBook and/or eChapter(s). Editorial review has deemed that any suppressed content does not materially affect the overall learning experience. Cengage Learning reserves the right to remove additional content at any time if subsequent rights restrictions require it.
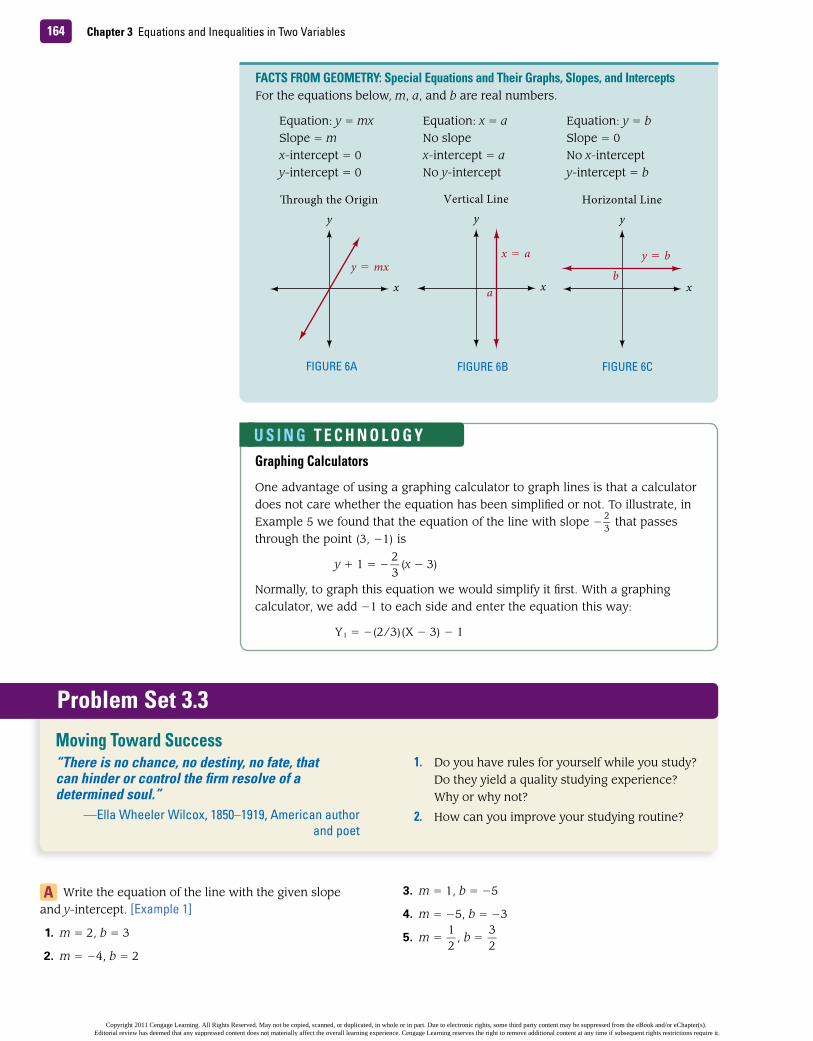
Chapter 3 Equations and Inequalities in Two Variables164
Graphing Calculators
One advantage of using a graphing calculator to graph lines is that a calculator does not care whether the equation has been simplified or not. To illustrate, in Example 5 we found that the equation of the line with slope −2 _
3 that passes
through the point (3, −1) is
y + 1 = −2
_ 3
(x − 3)
Normally, to graph this equation we would simplify it first. With a graphing calculator, we add −1 to each side and enter the equation this way:
Y 1 = −(2/3)(X − 3) − 1
u S I N G T E C H N O L O G Y
FACTS FROm GEOmETRY: Special Equations and Their Graphs, Slopes, and InterceptsFor the equations below, m, a, and b are real numbers.
Equation: y = mx Equation: x = a Equation: y = bSlope = m No slope Slope = 0x-intercept = 0 x-intercept = a No x-intercepty-intercept = 0 No y-intercept y-intercept = b
x
y�rough the Origin
y = mxx
yVertical Line
x = a
a x
yHorizontal Line
y = bb
FIGURE 6A FIGURE 6b FIGURE 6C
Problem Set 3.3
“There is no chance, no destiny, no fate, that can hinder or control the firm resolve of a determined soul.”
—Ella Wheeler Wilcox, 1850–1919, American author and poet
1. Do you have rules for yourself while you study? Do they yield a quality studying experience? Why or why not?
2. How can you improve your studying routine?
moving Toward Success
A Write the equation of the line with the given slope and y-intercept. [Example 1]
1. m = 2, b = 3
2. m = −4, b = 2
3. m = 1, b = −5
4. m = −5, b = −3
5. m = 1 _ 2
, b = 3 _ 2
Copyright 2011 Cengage Learning. All Rights Reserved. May not be copied, scanned, or duplicated, in whole or in part. Due to electronic rights, some third party content may be suppressed from the eBook and/or eChapter(s). Editorial review has deemed that any suppressed content does not materially affect the overall learning experience. Cengage Learning reserves the right to remove additional content at any time if subsequent rights restrictions require it.

3.3 Problem Set 165
6. m = 2 _ 3 , b = 5 _
6
7. m = 0, b = 4
8. m = 0, b = −2
Give the slope and y-intercept for each of the following equations. Sketch the graph using the slope and y-intercept. Give the slope of any line perpendicular to the given line. [Examples 2–3, 6]
9. y = 3x − 2
10. y = 2x + 3
11. 2x − 3y = 12
12. 3x − 2y = 12
13. 4x + 5y = 20
14. 5x − 4y = 20
For each of the following lines, name the slope and y-intercept. Then write the equation of the line in slope-intercept form.
15.
16.
x
y
1−1−2−3−4−5 3 4 52
1
−3−4−5
2345
−2−1
x
y
1−1−2−3−4−5 3 4 52
1
−3−4−5
2345
−2−1
17.
18.
C For each of the following problems, the slope and one point on a line are given. In each case, find the equation of that line. (Write the equation for each line in slope-intercept form.) [Example 4]
19. (−2, −5); m = 2
20. (−1, −5); m = 2
21. (−4, 1); m = −1
_ 2
22. (−2, 1); m = −1
_ 2
23. −1
_ 3
, 2 ; m = −3
24. −2
_ 3
, 5 ; m = −3
25. (−4, −2), m = 2 _ 3
26. (3, 4), m = −1
_ 3
27. (−5, 2), m = −1
_ 4
28. (−4, 3), m = 1 _ 6
x
y
1−1−2−3−4−5 3 4 52
1
−3−4−5
2345
−2−1
x
y
1−1−2−3−4−5 3 4 52
1
−3−4−5
2345
−2−1
Copyright 2011 Cengage Learning. All Rights Reserved. May not be copied, scanned, or duplicated, in whole or in part. Due to electronic rights, some third party content may be suppressed from the eBook and/or eChapter(s). Editorial review has deemed that any suppressed content does not materially affect the overall learning experience. Cengage Learning reserves the right to remove additional content at any time if subsequent rights restrictions require it.

Chapter 3 Equations and Inequalities in Two Variables166
D Find the equation of the line that passes through each pair of points. Write your answers in standard form. [Example 5]
29. (−2, −4), (1, −1)
30. (2, 4), (−3, −1)
31. (−1, −5), (2, 1)
32. (−1, 6), (1, 2)
33.1 _ 3
, −1 _
5 , −
1 _
3 , −1
34. −1
_ 2
, −1 _
2 ,1 _
2 ,
1 _
10
D Find the slope of a line (a) parallel and (b) perpendicular to the given line. [Example 6]
35. y = 3x − 4
36. y = −4x + 1
37. 3x + y = −2
38. 2x − y = −4
39. 2x + 5y = −11
40. 3x − 5y = −4
41. The equation 3x − 2y = 10 is a linear equation in standard form. From this equation, answer the following:
a. Find the x and y intercepts.
b. Find a solution to this equation other than the intercepts in part a.
c. Write this equation in slope-intercept form.
d. Is the point (2, 2) a solution to the equation?
42. The equation 4x + 3y = 8 is a linear equation in standard form. From this equation, answer the following:
a. Find the x and y intercepts.
b. Find a solution to this equation other than the intercepts in part a.
c. Write this equation in slope-intercept form.
d. Is the point (−3, 2) a solution to the equation?
43. The equation 3x _
4 − y _
2 = 1 is a linear equation in stan-
dard form. From this equation, answer the following:
a. Find the x and y intercepts.
b. Find a solution to this equation other than theintercepts in part a.
c. Write this equation in slope-intercept form.
d. Is the point (1, 2) a solution to the equation?
44. The equation 3x _
5 + 2y
_ 3 = 1 is a linear equation in
standard form. From this equation, answer the following:
a. Find the x and y intercepts.
b. Find a solution to this equation other than the intercepts in part a.
c. Write this equation in slope-intercept form.
d. Is the point (−5, 3) a solution to the equation?
The next two problems are intended to give you practice reading, and paying attention to the instructions that accompany the problems you are working. Working these problems is an excellent way to get ready for a test or a quiz.
45. Work each problem according to the instructions given:
a. Solve: −2x + 1 = −3
b. Find x when y is 0: −2x + y = −3
c. Find y when x is 0: −2x + y = −3
d. Graph: −2x + y = −3
e. Solve for y: −2x + y = −3
46. Work each problem according to the instructions given:
a. Solve: x _ 3 + 1 _
4 = 1
b. Find x when y is 0: x _ 3 + y _
4 = 1
c. Find y when x is 0: x _ 3 + y _
4 = 1
d. Graph: x _ 3 + y _
4 = 1
e. Solve for y: x _ 3 + y _
4 = 1
For each of the following lines, name the coordinates of any two points on the line. Then use those two points to find the equation of the line.
47.
x
y
1−1−2−3−4−5 3 4 52
1
−3−4−5
2345
−2−1
Copyright 2011 Cengage Learning. All Rights Reserved. May not be copied, scanned, or duplicated, in whole or in part. Due to electronic rights, some third party content may be suppressed from the eBook and/or eChapter(s). Editorial review has deemed that any suppressed content does not materially affect the overall learning experience. Cengage Learning reserves the right to remove additional content at any time if subsequent rights restrictions require it.

3.3 Problem Set 167
48.
49.
50.
51. Give the slope and y-intercept of y = −2. Sketch the graph.
52. For the line x = −3, sketch the graph, give the slope, and name any intercepts.
53. Find the equation of the line parallel to the graph of 3x − y = 5 that contains the point (−1, 4).
54. Find the equation of the line parallel to the graph of 2x − 4y = 5 that contains the point (0, 3).
55. Line l is perpendicular to the graph of the equation 2x − 5y = 10 and contains the point (−4, −3). Find the equation for l.
56. Line l is perpendicular to the graph of the equation −3x − 5y = 2 and contains the point (2, −6). Find the equation for l.
x
y
1−1−2−3−4−5 3 4 52
1
−3−4−5
2345
−2−1
x
y
1−1−2−3−4−5 3 4 52
1
−3−4− 5
2345
−2−1
x
y
1−1−2−3−4−5 3 4 5
−2−3
1
−4−5
2345
−12
57. Give the equation of the line perpendicular to the graph of y = −4x + 2 that has an x-intercept of −1.
58. Write the equation of the line parallel to the graph of 7x − 2y = 14 that has an x-intercept of 5.
59. Find the equation of the line with x-intercept 3 and y-intercept 2.
60. Find the equation of the line with x-intercept 2 and y-intercept 3.
Applying the Concepts
61. Horse Racing The graph shows the total amount of money wagered on the Kentucky Derby. Find an equation for the line segment between 2000 and 2005. Write the equation in slope-intercept form. Round the slope and intercept to the nearest tenth.
62. Solar Energy The graph shows the annual number of solar thermal collector shipments in the United States. Find an equation for the line segment that connects the points (2004, 13,750) and (2005, 15,000). Write your answer in slope-intercept form.
Source: http://www.kentuckyderby.com, Thoroughbred Times
Betting the Ponies
44.834.465.4
104
163
20.2
0
50
100
150
200
2005 20102000199519901985
Mill
ions
of d
olla
rs
Source: Energy Information Association 2008
Solar Thermal Collectors
25000
200001500010000
5000
0‘97 ‘98 ‘99 ‘00 ‘01 ‘02 ‘03 ‘04 ‘05 ‘06 ‘07 ‘08
Copyright 2011 Cengage Learning. All Rights Reserved. May not be copied, scanned, or duplicated, in whole or in part. Due to electronic rights, some third party content may be suppressed from the eBook and/or eChapter(s). Editorial review has deemed that any suppressed content does not materially affect the overall learning experience. Cengage Learning reserves the right to remove additional content at any time if subsequent rights restrictions require it.

Chapter 3 Equations and Inequalities in Two Variables168
63. Deriving the Temperature Equation The table from the introduction to this section is repeated here. The rows of the table give us ordered pairs (C, F).
a. Use any two of the ordered pairs from the table to derive the equation F = 9 _
5 C + 32.
b. Use the equation from part (a) to find the Fahr-enheit temperature that corresponds to a Celsius temperature of 30°.
64. maximum Heart Rate The table gives the maximum heart rate for adults 30, 40, 50, and 60 years old. Each row of the table gives us an ordered pair (A, M ).
a. Use any two of the ordered pairs from the table to derive the equation M = 220 − A, which gives the maximum heart rate M for an adult whose age is A.
b. Use the equation from part (a) to find the maxi-mum heart rate for a 25-year-old adult.
65. Textbook Cost To produce this textbook, suppose the publisher spent $215,000 for typesetting and $9.50 per book for printing and binding. The total cost to produce and print n books can be written as:
Total cost to produce n textbooks
Fixed cost + Variable cost=
C = 215,000 + 9.5n
a. Suppose the number of books printed in the first printing is 10,000. What is the total cost?
b. If the average cost is the total cost divided by the number of books printed, find the average cost of producing 10,000 textbooks.
Degrees DegreesCelsius Fahrenheit
C F
0 32 25 77 50 122 75 167100 212
Age maximum Heart Rate(years) (beats per minute)
A M
30 19040 18050 17060 160
Ceng
age L
earn
ing
c. Find the cost to produce one more textbook when you have already produced 10,000 textbooks.
66. Exercise Heart Rate In an aerobics class, the instructor indicates that her students’ exercise heart rate is 60% of their maximum heart rate, where maximum heart rate is 220 minus their age.a. Determine the equation that gives exercise heart
rate E in terms of age A. b. Use the equation to find the exercise heart rate
of a 22-year-old student. Round to the nearest whole number.
67. Daniel starts a new job in which he sells TVs. He earns $1,000 a month plus a certain amount for each TV he sells. The graph below shows the amount per month Daniel will make based on how many TVs he sells.
a. How much will he earn if he sells 20 TVs? b. How much will he earn if he sells 40 TVs? c. What is the slope of the line? d. How much does he make for each TV he
sells? e. Find the equation of the line where y is his
income and x is TV sales.
68. Mark gets a new job where he sells hats. He will earn $1,250 a month plus a certain amount for each hat he sells. The graph below shows the amount Mark will make based on how many hats he sells.
a. How much will he earn if he sells 300 hats?
5 10 15 20 25 30 35 400
5001,0001,5002,0002,5003,000
Inco
me i
n D
olla
rs ($
)
TV’s Sold
100 200 300 400 500 600 7000
5001,0001,5002,0002,5003,000
Inco
me i
n D
olla
rs ($
)
Hats Sold
Copyright 2011 Cengage Learning. All Rights Reserved. May not be copied, scanned, or duplicated, in whole or in part. Due to electronic rights, some third party content may be suppressed from the eBook and/or eChapter(s). Editorial review has deemed that any suppressed content does not materially affect the overall learning experience. Cengage Learning reserves the right to remove additional content at any time if subsequent rights restrictions require it.

3.3 Problem Set 169
b. How much does he have to sell to earn $2,500?
c. What is the slope of the line? d. How much does he make for each hat he
sells? e. Find the equation of the line.
Improving Your Quantitative Literacy
69. Courtney buys a new car. It cost $20,000 and will decrease in value each year. The graph below shows the value of the car after five years.
a. How much is the car worth after five years? b. Find the equation of the line connecting the
endpoints. c. Using your equation, how much will the car be
worth in ten years? What's wrong with the answer?
70. Definitions a. Use an online dictionary to find definitions for the
following words: interpolation and extrapolation
b. Which of the two words describes what you did in problem 69 part (c) above.
maintaining Your Skills
71. The length of a rectangle is 3 inches more than 4 times the width. The perimeter is 56 inches. Find the length and width.
72. One angle is 10 degrees less than four times another. Find the measure of each angle if:a. The two angles are complementary. b. The two angles are supplementary.
73. The cash register in a candy shop contains $66 at the beginning of the day. At the end of the day, it contains $732.50. If the sales tax rate is 7.5%, how much of the total is sales tax?
1 2 3 4 50
5,000
10,000
15,000
20,000
Valu
e in
Dol
lars
($)
Years
74. The third angle in an isosceles triangle is 20 degrees less than twice as large as each of the two base angles. Find the measure of each angle.
Getting Ready for the Next Section
75. Which of the following are solutions to x + y ≤ 4?
(0, 0) (4, 0) (2, 3)
76. Which of the following are solutions to y < 2x − 3?
(0, 0) (3, −2) (−3, 2)
77. Which of the following are solutions to y ≤ 1 _ 2 x ?
(0, 0) (2, 0) (−2, 0)
78. Which of the following are solutions to y > −2x ?
(0, 0) (2, 0) (−2, 0)
Extending The Concepts
The midpoint M of two points (x 1, y 1) and (x 2, y 2) is defined to be the average of each of their coordinates, so
M =x 1 + x 2 _ 2
, y 1 + y 2 _
2
For example, the midpoint of (−2, 3) and (6, 8) is given by
−2 + 6 _
2 ,
3 + 8 _
2 = 2,
11 _
2
For each given pair of points, find the equation of the line that is perpendicular to the line through these points and that passes through their midpoint. Answer using slope-intercept form.Note: This line is called the perpendicular bisector of the line segment connecting the two points.
79. (1, 4) and (7, 8)
80. (−2, 1) and (6, 7)
81. (−5, 1) and (−1, 4)
82. (−6, −2) and (2, 1)
Copyright 2011 Cengage Learning. All Rights Reserved. May not be copied, scanned, or duplicated, in whole or in part. Due to electronic rights, some third party content may be suppressed from the eBook and/or eChapter(s). Editorial review has deemed that any suppressed content does not materially affect the overall learning experience. Cengage Learning reserves the right to remove additional content at any time if subsequent rights restrictions require it.

3.4
Chapter 3 Equations and Inequalities in Two Variables170
OBjECTIVES
Graph linear inequalities in two variables. A
3.4 Linear Inequalities in Two Variables
TICkET TO SuCCESSKeep these questions in mind as you read through the section. Then respond in your own words and in complete sentences.
1. When graphing a linear inequality in two variables, how do you find the equation of the boundary line?
2. What is the significance of a broken line in the graph of an inequality?3. When graphing a linear inequality in two variables, how do you know which side
of the boundary line to shade?4. Does the graph of x + y < 4 include the boundary line? Explain.
A small movie theater holds 100 people. The owner charges more for adults than for children, so it is important to know the different combinations of adults and children that can be seated at one time. The shaded region in Figure 1 contains all the seating combinations. The line x + y = 100 shows the combinations for a full theater: The y-intercept corresponds to a theater full of adults, and the x-intercept corresponds to a theater full of children. In the shaded region below the line x + y = 100 are the combinations that occur if the theater is not full.
Shaded regions like the one shown in Figure 1 are produced by linear inequalities in two variables, which is the topic of this section.
Imag
e cop
yrigh
t ©M
ikael
Damk
ier, 2
009.
Used
unde
r lice
nse f
rom
Shut
terst
ock.c
om
FIGURE 1
0 20 40 60 80 1000
20
40
60
80
100
x
y
Children
Adul
ts
Copyright 2011 Cengage Learning. All Rights Reserved. May not be copied, scanned, or duplicated, in whole or in part. Due to electronic rights, some third party content may be suppressed from the eBook and/or eChapter(s). Editorial review has deemed that any suppressed content does not materially affect the overall learning experience. Cengage Learning reserves the right to remove additional content at any time if subsequent rights restrictions require it.
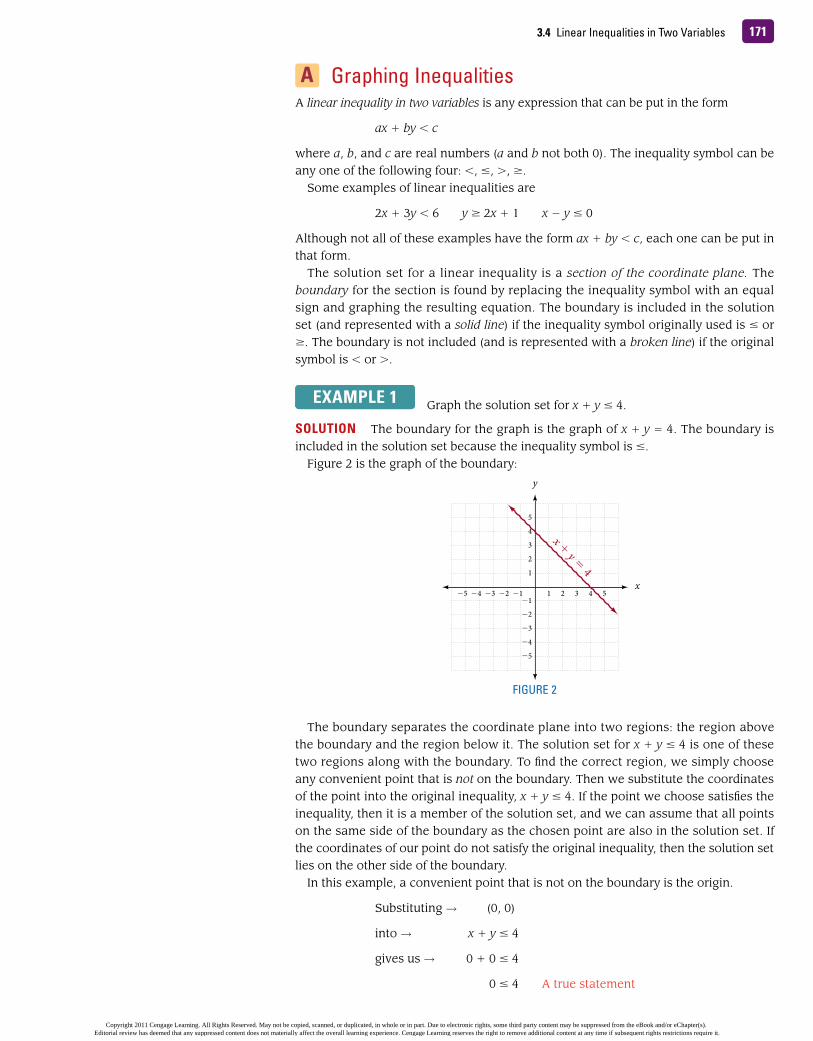
3.41713.4 Linear Inequalities in Two Variables
A Graphing InequalitiesA linear inequality in two variables is any expression that can be put in the form
ax + by < c
where a, b, and c are real numbers (a and b not both 0). The inequality symbol can be any one of the following four: <, ≤, >, ≥.
Some examples of linear inequalities are
2x + 3y < 6 y ≥ 2x + 1 x − y ≤ 0
Although not all of these examples have the form ax + by < c, each one can be put in that form.
The solution set for a linear inequality is a section of the coordinate plane. The boundary for the section is found by replacing the inequality symbol with an equal sign and graphing the resulting equation. The boundary is included in the solution set (and represented with a solid line) if the inequality symbol originally used is ≤ or ≥. The boundary is not included (and is represented with a broken line) if the original symbol is < or >.
ExAmPLE 1 Graph the solution set for x + y ≤ 4.
SOLuTION The boundary for the graph is the graph of x + y = 4. The boundary is included in the solution set because the inequality symbol is ≤.
Figure 2 is the graph of the boundary:
The boundary separates the coordinate plane into two regions: the region above the boundary and the region below it. The solution set for x + y ≤ 4 is one of these two regions along with the boundary. To find the correct region, we simply choose any convenient point that is not on the boundary. Then we substitute the coordinates of the point into the original inequality, x + y ≤ 4. If the point we choose satisfies the inequality, then it is a member of the solution set, and we can assume that all points on the same side of the boundary as the chosen point are also in the solution set. If the coordinates of our point do not satisfy the original inequality, then the solution set lies on the other side of the boundary.
In this example, a convenient point that is not on the boundary is the origin.
Substituting → (0, 0)
into → x + y ≤ 4
gives us → 0 + 0 ≤ 4
0 ≤ 4 A true statement
−5 −4 −3 −2 −1 1 2 3 4 5
−5
−4
−3
−2
−1
1
2
3
4
5
x
y
x + y = 4
FIGURE 2
Copyright 2011 Cengage Learning. All Rights Reserved. May not be copied, scanned, or duplicated, in whole or in part. Due to electronic rights, some third party content may be suppressed from the eBook and/or eChapter(s). Editorial review has deemed that any suppressed content does not materially affect the overall learning experience. Cengage Learning reserves the right to remove additional content at any time if subsequent rights restrictions require it.

Chapter 3 Equations and Inequalities in Two Variables172
Because the origin is a solution to the inequality x + y ≤ 4 and the origin is below the boundary, all other points below the boundary are also solutions.
Figure 3 is the graph of x + y ≤ 4.
The region above the boundary is described by the inequality x + y > 4.
Here is a list of steps to follow when graphing the solution set for a linear inequality in two variables.
ExAmPLE 2 Graph the solution set for y < 2x − 3.
SOLuTION The boundary is the graph of y = 2x − 3, a line with slope 2 and y-intercept −3. The boundary is not included because the original inequality symbol is <. We therefore use a broken line to represent the boundary in Figure 4.
−5 −4 −3 −2 −1 1 2 3 4 5
−5
−4
−3
−2
−1
1
2
3
4
5
x
y
x + y ≤ 4
(0, 0)
(Boundaryincluded)
FIGURE 3
Strategy To Graph a Linear Inequalitiy in Two Variables
Step 1: Replace the inequality symbol with an equal sign. The resulting equation represents the boundary for the solution set.
Step 2: Graph the boundary found in step 1 using a solid line if the boundary is included in the solution set (that is, if the original inequality symbol was either ≤ or ≥). Use a broken line to graph the boundary if it is not included in the solution set. (It is not included if the original inequality was either < or >.)
Step 3: Choose any convenient point not on the boundary and substitute the coordinates into the original inequality. If the resulting statement is true, the graph lies on the same side of the boundary as the chosen point. If the resulting statement is false, the solution set lies on the opposite side of the boundary.
Copyright 2011 Cengage Learning. All Rights Reserved. May not be copied, scanned, or duplicated, in whole or in part. Due to electronic rights, some third party content may be suppressed from the eBook and/or eChapter(s). Editorial review has deemed that any suppressed content does not materially affect the overall learning experience. Cengage Learning reserves the right to remove additional content at any time if subsequent rights restrictions require it.
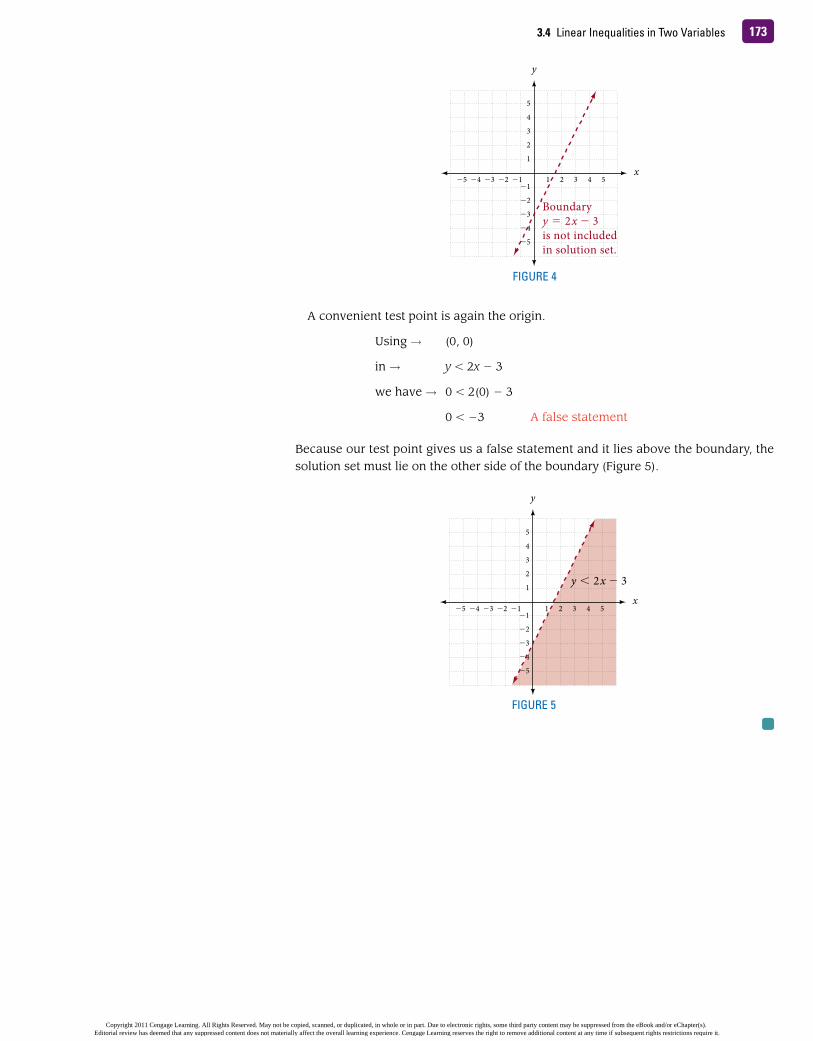
1733.4 Linear Inequalities in Two Variables
A convenient test point is again the origin.
Using → (0, 0)
in → y < 2x − 3
we have → 0 < 2(0) − 3
0 < −3 A false statement
Because our test point gives us a false statement and it lies above the boundary, the solution set must lie on the other side of the boundary (Figure 5).
−5 −4 −3 −2 −1 1 2 3 4 5
−5
−4
−3
−2
−1
1
2
3
4
5
x
y
Boundaryy = 2x − 3is not includedin solution set.
FIGURE 4
−5 −4 −3 −2 −1 1 2 3 4 5
−5
−4
−3
−2
−1
1
2
3
4
5
x
y
y < 2x − 3
FIGURE 5
Copyright 2011 Cengage Learning. All Rights Reserved. May not be copied, scanned, or duplicated, in whole or in part. Due to electronic rights, some third party content may be suppressed from the eBook and/or eChapter(s). Editorial review has deemed that any suppressed content does not materially affect the overall learning experience. Cengage Learning reserves the right to remove additional content at any time if subsequent rights restrictions require it.
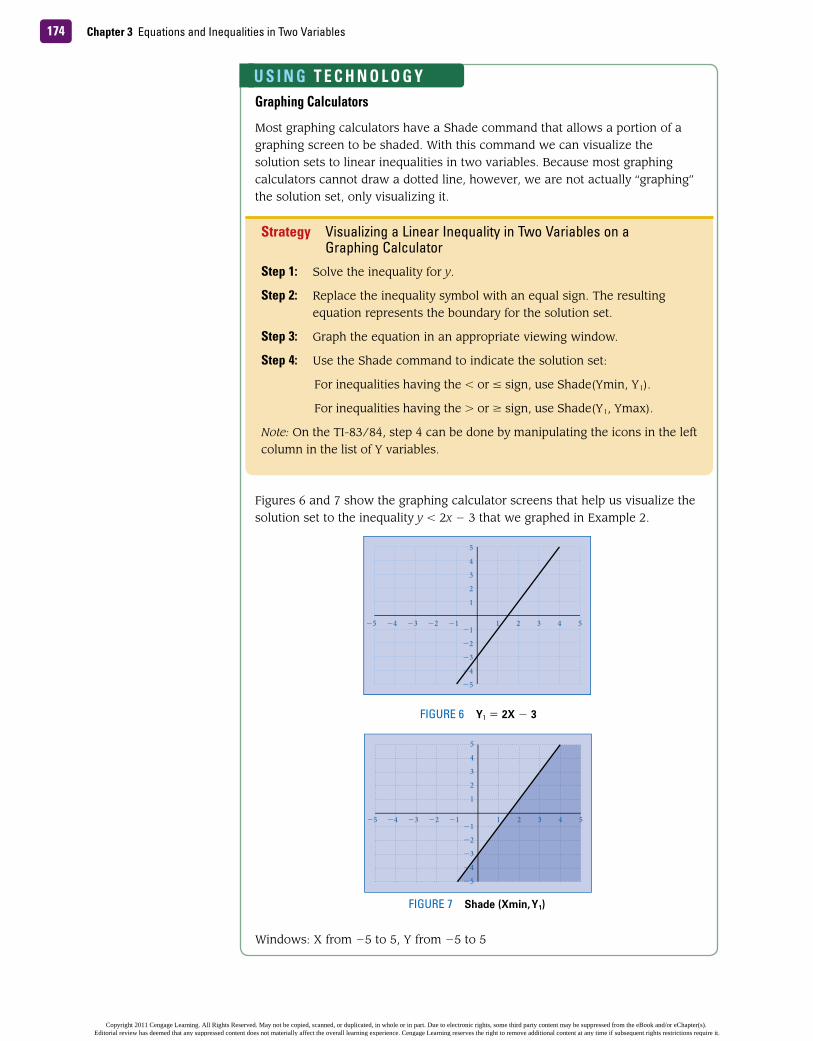
Chapter 3 Equations and Inequalities in Two Variables174
Graphing Calculators
Most graphing calculators have a Shade command that allows a portion of a graphing screen to be shaded. With this command we can visualize the solution sets to linear inequalities in two variables. Because most graphing calculators cannot draw a dotted line, however, we are not actually “graphing” the solution set, only visualizing it.
Figures 6 and 7 show the graphing calculator screens that help us visualize the solution set to the inequality y < 2x − 3 that we graphed in Example 2.
Windows: X from −5 to 5, Y from −5 to 5
Strategy Visualizing a Linear Inequality in Two Variables on a Graphing Calculator
Step 1: Solve the inequality for y.
Step 2: Replace the inequality symbol with an equal sign. The resulting equation represents the boundary for the solution set.
Step 3: Graph the equation in an appropriate viewing window.
Step 4: Use the Shade command to indicate the solution set:
For inequalities having the < or ≤ sign, use Shade(Ymin, Y 1).
For inequalities having the > or ≥ sign, use Shade(Y 1, Ymax).
Note: On the TI-83/84, step 4 can be done by manipulating the icons in the left column in the list of Y variables.
1
2
3
4
5
−5
−4
−3
−2
−11 2 3 4 5−5 −4 −3 −2 −1
FIGURE 6 Y1 = 2X − 3
−5
−4
−3
−2
−1
1
2
3
4
5
−5 −4 −3 −2 −1 1 2 3 4 5
FIGURE 7 Shade (Xmin, Y 1)
u S I N G T E C H N O L O G Y
Copyright 2011 Cengage Learning. All Rights Reserved. May not be copied, scanned, or duplicated, in whole or in part. Due to electronic rights, some third party content may be suppressed from the eBook and/or eChapter(s). Editorial review has deemed that any suppressed content does not materially affect the overall learning experience. Cengage Learning reserves the right to remove additional content at any time if subsequent rights restrictions require it.

1753.4 Linear Inequalities in Two Variables
ExAmPLE 3 Graph the solution set for x ≤ 5.
SOLuTION The boundary is x = 5, which is a vertical line. All points in Figure 8 to the left of the boundary have x-coordinates less than 5 and all points to the right have x-coordinates greater than 5.
ExAmPLE 4 Graph the solution set for y > 1 _ 4
x.
SOLuTION The boundary is the line y = 1 _ 4 x, which has a slope of 1 _
4 and passes
through the origin. The graph of the boundary line is shown in Figure 9. Since the boundary passes through the origin, we cannot use the origin as our test point. Remember, the test point cannot be on the boundary line. Let’s use the point (0, −4) as our test point. It lies below the boundary line. When we substitute the coordinates into our original inequality, the result is the false statement −4 > 0. This tells us that the solution set is on the other side of the boundary line. The solution set for our original inequality is shown in Figure 10.
−5 −4 −3 −2 −1 1 2 3 4 5
−5
−4
−3
−2
−1
1
2
3
4
5
x
y
Boundaryx = 5 is
included inthe solution
set.
x ≤ 5
FIGURE 8
−5 −4 −3 −2 −1 1 2 3 4 5
−5
−4
−3
−2
−1
1
2
3
4
5
x
y
y = – x14
Test pointis below theboundary
−5 −4 −3 −2 −1 1 2 3 4 5
−5
−4
−3
−2
−1
1
2
3
4
5
x
y
FIGURE 10FIGURE 9
Copyright 2011 Cengage Learning. All Rights Reserved. May not be copied, scanned, or duplicated, in whole or in part. Due to electronic rights, some third party content may be suppressed from the eBook and/or eChapter(s). Editorial review has deemed that any suppressed content does not materially affect the overall learning experience. Cengage Learning reserves the right to remove additional content at any time if subsequent rights restrictions require it.

Chapter 3 Equations and Inequalities in Two Variables176
A Graph the solution set for each of the following. [Examples 1–4]
1. x + y < 5 2. x + y ≤ 5
3. x − y ≥ −3 4. x − y > −3
5. 2x + 3y < 6 6. 2x − 3y > −6
7. −x + 2y > −4 8. −x − 2y < 4
9. 2x + y < 5 10. 2x + y < −5
11. y < 2x − 1 12. y ≤ 2x − 1
13. 3x − 4y < 12 14. −2x + 3y < 6
15. −5x + 2y ≤ 10 16. 4x − 2y ≤ 8
17. x ≥ 3 18. x > −2
19. y ≤ 4 20. y > −5
21. y < 2x 22. y > −3x
23. y ≥ 1 _ 2 x 24. y ≤ 1 _
3 x
25. y ≥ 3 _ 4 x − 2 26.
x _
3 + y _
2 > 1
27. y > −2 _
3 x + 3 28. x _
5 + y _
4 < 1
29. x _ 3
− y _ 2 > 1 30. −
x _
4 − y _
3 > 1
31. y ≤ −2 _
3 x 32. y ≥ 1 _
4 x
33. 5x − 3y < 0 34. 2x + 3y < 0
35. x _ 4
+ y _ 5 ≤ 1 36. x _
2 + y _
3 < 1
For each graph shown here, name the linear inequality in two variables that is represented by the shaded region.
37.
38.
39.
−5 −4 −3 −2 −1 1 2 3 4 5
−5−4−3−2−1
12345
x
y
−5 −4 −3 −2 −1 1 2 3 4 5
−5−4−3−2−1
12345
x
y
−5 −4 −3 −2 −1 1 2 3 4 5
−5−4−3−2−1
12345
x
y
Problem Set 3.4
“If there were dreams to sell, what would you buy?”
—Thomas Lovell beddoes, 1803–1849, british poet
1. Why are objectives and goals important to set for your study group?
2. Why is it important to come prepared to a study group session?
moving Toward Success
Copyright 2011 Cengage Learning. All Rights Reserved. May not be copied, scanned, or duplicated, in whole or in part. Due to electronic rights, some third party content may be suppressed from the eBook and/or eChapter(s). Editorial review has deemed that any suppressed content does not materially affect the overall learning experience. Cengage Learning reserves the right to remove additional content at any time if subsequent rights restrictions require it.

3.4 Problem Set 177
40.
41.
42.
The next two problems are intended to give you practice reading, and paying attention to, the instructions that accompany the problems you are working.
43. Work each problem according to the instructions given.
a. Solve: 1 _
3 + y _
2 < 1
b. Solve: 1 _
3 − y _
2 < 1
c. Solve for y: x _
3 + y _
2 = 1
d. Graph: y < −4 _
3 x + 4
−5 −4 −3 −2 −1 1 2 3 4 5
−5−4−3−2−1
12345
x
y
−5 −4 −3 −2 −1 1 2 3 4 5
−5−4−3−2−1
12345
x
y
−5 −4 −3 −2 −1 1 2 3 4 5
−5−4−3−2−1
12345
x
y
44. Work each problem according to the instructions given.
a. Solve: 3x + 4 ≥ −8
b. Solve: −3x + 4 ≥ −8
c. Solve for y: −3x + 4y = −8
d. Graph: 3x + 4y ≥ −8
Applying the Concepts
45. Number of People in a Dance Club A dance club holds a maximum of 200 people. The club charges one price for students and a higher price for nonstudents. If the number of students in the club at any time is x and the number of nonstudents is y, sketch a graph representing the people in the club. Then, shade the region in the first quadrant that contains all combinations of students and nonstudents that are in the club at any time.
46. many Perimeters Suppose you have 500 feet of fencing that you will use to build a rectangular livestock pen. Let x represent the length of the pen and y represent the width. Sketch a graph of the situation and shade the region in the first quadrant that contains all possible values of x and y that will give you a rectangle from 500 feet of fencing. (You don’t have to use all of the fencing, so the perimeter of the pen could be less than 500 feet.)
47. Gas mileage You have two cars. The first car travels an average of 12 miles on a gallon of gasoline, and the second averages 22 miles per gallon. Suppose you can afford to buy up to 30 gallons of gasoline this month. If the first car is driven x miles this month, and the second car is driven y miles this month, draw a graph and shade the region in the first quadrant that gives all the possible values of x and y that will keep you from buying more than 30 gallons of gasoline this month.
48. Student Loan Payments When considering how much debt to incur in student loans, it is advisable to keep your student loan payment after graduation to 8% or less of your starting monthly income. Let x represent your starting monthly salary and let y represent your monthly student loan payment, and write an inequality that describes this situation. Graph the inequality and shade the region in the first quadrant that is a solution to your inequality.
Copyright 2011 Cengage Learning. All Rights Reserved. May not be copied, scanned, or duplicated, in whole or in part. Due to electronic rights, some third party content may be suppressed from the eBook and/or eChapter(s). Editorial review has deemed that any suppressed content does not materially affect the overall learning experience. Cengage Learning reserves the right to remove additional content at any time if subsequent rights restrictions require it.
Chapter 3 Equations and Inequalities in Two Variables178
49. Solar and Wind Energy The chart shows the cost to install either solar panels or a wind turbine. A company that specializes in alternate energy sources is placing an order for more cables for both wind and solar energy solutions. If the total bill is some amount less than $11,440, graph the inequality and shade the region in the first quadrant that contains all the possible combinations of products.
50. Gas Prices The chart shows the breakdown of gas prices. CJ has two vehicles, a gasoline car and a diesel truck. Suppose that the price of gas and the price of diesel are both $4.20 per gallon. Shade the region in the first quadrant that contains all the possible combinations of money he paid for just the crude oil if the amount of gasoline and diesel sum to less than 15 gallons. If necessary, round to the nearest cent.
maintaining Your Skills
51. 1
_ 3
+ y _ 5 ≤ 26
_ 15
52. −1
_ 3
≥ 1 _ 6 − y _
2
53. 5t − 4 > 3t − 8
54. −3(t − 2) < 6 − 5(t + 1)
55. −9 < −4 + 5t < 6
56. −3 < 2t + 1 < 3
Source: a Limited 2006
Solar Versus Wind Energy Costs
Solar EnergyEquipment Cost:
Modules $6200Fixed Rack $1570Charge Controller $971Cable $440
TOTAL $9181
Wind EnergyEquipment Cost:
Turbine $3300Tower $3000Cable $715
TOTAL $7015
Wind EnergySolar EnergyE i t C tE i t C t
T bi $3300M d l $6200$62 Tkkddd
gCable $440C
TT
CCFM
EEo
TT
bhxo
ua
A
eg
du
mE
a
ee
ok
g
t
o
l
t
r
$$
$$$$$
1
47522
1
00
O
CTTT
qW
TT
bwr
iin
A
ern
mE
ne g
o :
$$
$$$
0
103
5
00
Source: Energy Information Administration 2008
What We Pay For In A Gallon of Gasoline
Gasoline Diesel
TaxesDistributing & MarketingRefiningCrude Oil68% 64%
10%11%
14% 15%
11%7%
Getting Ready for the Next Section
Complete each table using the given equation.
57. y = 7.5x 58. h = 32t − 16t 2
59. x = y 2 60. y = | x |
Extending the Concepts
Graph each inequality.
61. y < | x + 2 | 62. y > | x − 2 |
63. y > | x − 3 | 64. y < | x + 3 | 65. y ≤ | x − 1 | 66. y ≥ | x + 1 | 67. y < x 2 68. y > x 2 − 2
69. The Associated Students organization holds a Night at the Movies fundraiser. Student tickets are $1.00 each and nonstudent tickets are $2.00 each. The theater holds a maximum of 200 people. The club needs to collect at least $100 to make money. Sketch a graph of the inequality and shade the region in the first quadrant that contains all combinations of students and nonstudents that could attend the movie night so the club makes money.
x y
0 10 20
t h
0
1 _ 2
1
x y
0 1 −1
x y
−3 0 3
3.5
Copyright 2011 Cengage Learning. All Rights Reserved. May not be copied, scanned, or duplicated, in whole or in part. Due to electronic rights, some third party content may be suppressed from the eBook and/or eChapter(s). Editorial review has deemed that any suppressed content does not materially affect the overall learning experience. Cengage Learning reserves the right to remove additional content at any time if subsequent rights restrictions require it.

179
OBjECTIVES
Construct a table or a graph from a function rule.
B Identify the domain and range of a function or a relation.
C Determine whether a relation is also a function.
D Use the vertical line test to determine whether a graph is a function.
A
3.5 Introduction to Functions
3.5 Introduction to Functions
TICkET TO SuCCESSKeep these questions in mind as you read through the section. Then respond in your own words and in complete sentences.
1. Define function using the terms domain and range.2. Which variable is usually associated with the domain of a function?3. What is a relation?4. Explain the vertical line test.
International Laws of the Game for soccer state that the length of the playing field can be between 100 and 130 yards. Suppose you are laying out a field at a local park. The width of the field must be 60 yards due to some landscaping. How would you decide what the area of the field could be? In this section, we will learn how to find the area y as a function of the length x to lay out your regulation soccer field.
An Informal Look at FunctionsThe ad shown in the margin appeared in the help wanted section of the local newspaper the day I was writing this section of the book. We can use the information in the ad to continue an informal discussion of functions.
To begin, suppose you have a job that pays $7.50 per hour and that you work anywhere from 0 to 40 hours per week. The amount of money you make in one week depends on the number of hours you work that week. In mathematics, we say that your weekly earnings are a function of the number of hours you work. If we let the variable x represent hours and the variable y represent the money you make, then the relationship between x and y can be written as
y = 7.5x for 0 ≤ x ≤ 40
A Constructing Tables and Graphs
ExAmPLE 1 Construct a table and graph for the function
y = 7.5x for 0 ≤ x ≤ 40
Imag
e cop
yrigh
t ©ilk
er ca
niklig
il, 20
09. U
sed u
nder
licen
se fr
om S
hutte
rstoc
k.com
HELP WANTED
YARD PERSON
Full time 40 hrs. with weekend work required. Cleaning & loading trucks. $7.50/hr.
Valid CDL with clean record & drug screen required.
Submit current MVR to KCI, 225 Suburban Rd., SLO 93405
(805) 555-3304.
BABY SITTER
NEW
Full timewith weDelivery$8.50/h
Valid CDdrug scrCall (805
COM
Copyright 2011 Cengage Learning. All Rights Reserved. May not be copied, scanned, or duplicated, in whole or in part. Due to electronic rights, some third party content may be suppressed from the eBook and/or eChapter(s). Editorial review has deemed that any suppressed content does not materially affect the overall learning experience. Cengage Learning reserves the right to remove additional content at any time if subsequent rights restrictions require it.


![Solve Simultaneous Equations One Linear, one quadratic [Circle]](https://img.pdfslide.us/doc/110x75/56812d42550346895d9247e2/solve-simultaneous-equations-one-linear-one-quadratic-circle.jpg)