Embed Size (px)
Citation preview

2. Chapter II. The Impact of the China-U.S. Trade Agreement4
AbstractShould the China-U.S. trade agreement prompt relief because it averts a damaging trade war or concern because selective preferential access for the United States to China’s markets breaks multilateral rules against discrimination? The answer depends on how China implements the agreement. Simulations from a computable general equilibrium model suggest that the United States and China would be better off under this “managed trade” agreement than if the trade war had escalated. However, compared with the policy status quo, the deal will make everyone worse off except the United States and its input-supplying neighbor, Mexico. Real incomes in the rest of the world would decline by 0.16 percent, in East Asia (excluding China) by 0.30 percent and in China by 0.40 percent because of trade diversion. China can reverse those losses if, instead of granting the United States privileged entry, it opens its market for all trading partners. Global income would be 0.60 percent higher than under the managed trade scenario, and China’s income would be nearly 0.50 percent higher. Most developing countries in East Asia would be also better off, despite the partial erosion in their preferential access to the Chinese market. By creating a stronger incentive for China to open its markets to all, an exercise in bilateral mercantilism has the potential to become an instrument for multilateral liberalization.
Keywords: Trade wars, managed trade, preferential agreements
1. Introduction
The China-U.S. trade agreement has provoked the following contrasting sentiments: relief because the agreement averts (at least temporarily) a damaging trade war and anguish because the agreement to grant the United States selective, preferential access to the Chinese market breaks multilateral rules that prohibit (at least in principle) discrimination between trading partners. This note argues that the implications of the agreement for developing countries depend on how China implements the agreement. If China accommodates U.S. demands by granting the United States privileged access to a still-protected Chinese market, then the United States will benefit, but other countries and probably China will lose. If instead, China accommodates U.S. demands by liberalizing access to its market for all trading partners, then all countries including the United States and China would benefit. Therefore, an exercise in bilateral mercantilism can, by offering China an added incentive to open its markets to all, become an instrument for multilateral liberalization.
The China-U.S. trade agreement is a step in an evolving relationship between the two largest economies in the world. Figure II.2.1 provides a timeline of the trade tensions in the last two years. Before the agreement, the main policy tool the United States and China have used is tariffs. As noted in Bown (2020a), there have been two main breaking points in the China-U.S. relationship, both characterized by an escalation of tariffs. The first happened in the summer of 2018 when the average U.S. import tariff on Chinese goods went up from 3.8 to 12.0 percent and the Chinese import tariff on U.S. goods increased from 8.3 to 18.3 percent. The second breaking point took place in the summer of 2019, with U.S. tariffs increasing from 12 to 21 percent and Chinese tariffs also rising to 21 percent. While the China-U.S. agreement does not mention tariffs, upon its entry into force on February 14, 2020, both the United States and China have reduced their bilateral tariffs. Despite these changes, tariff protection remains high at 19 percent for U.S. tariffs on China’s exports and 20 percent for China on exports from the United States.
4 A joint product of the Chief Economist Office of East Asia and Pacific, and the Trade and Regional Integration Global Unit. Claudia Hofmann assisted with the legal analysis of the text in Section 2 and Maria Pereira with the simulations in Section 4. We are grateful to Chad Bown, Erik Churchill, Bert Hofman, Antonio Nucifora, Martin Raiser, Martin Rama, and Chunlin Zhang for helpful suggestions and discussions.
136
EAST ASIA AND PACIFIC ECONOMIC UPDATE APRIL 2020
PART II. SLOWING GROWTH AND TRADE TENSIONS
10158-EAP Economic Update_73177_Pt2-3.indd 13610158-EAP Economic Update_73177_Pt2-3.indd 136 4/1/20 2:08 PM4/1/20 2:08 PM

Figure II.2.1. A timeline of China-U.S. trade tensions
2018
July 625% tariffs on$34 billion
2019 2020
September 115% tariffs on$112 billion
January 15Phase I—U.S.-China tradeagreement
February 14Tariffs cut from15% to 7.5%on $120 billion
August 2325% tariffs on$16 billion
September 2410% tariffs on$200 billion(hiked to 25%on May, 2019)
July 625% tariffs on$34 billion
China tariffs on U.S. imports
U.S. tariffs on China imports
September 15%–10% tariffs on $75 billion
January 15Phase I—U.S.-China trade agreement (China promised toimport $200 billion of U.S. goods in 2020 and 2021)
February 14Tariffs cut from10% to 5% andfrom 5% to 2.5%on $75 billion
August 2325% tariffs on$16 billion
September 24Up to 10% tariffs on$60 billion(hiked to 25%on June, 2019)
Source: Li, M. 2018. CARD Trade War Tariffs Database. https://www.card.iastate.edu/china/trade-war-data/ (Accessed 02–06–2020).
In this evolving context, this paper looks at the Phase 1 China-U.S. trade agreement from three different points of view. First, we examine key features of the legal text of the agreement and compare it with other preferential trade agreements (PTAs) signed by the United States. Second, we draw on economic theory to analyze the implications of the agreement, especially for third countries. Finally, we use a computable general equilibrium model to quantify the effects of the agreement on trade and income under different scenarios.
The comparison of the legal text of the Phase 1 China-U.S. trade agreement with existing U.S. PTAs shows how different the current deal is from previous ones while recognizing that subsequent phases may add other dimensions to the agreement. First, despite the few novelties such as regulation of technology transfers and macroeconomic policies, the scope of the China-U.S. agreement is more limited, even in areas such as intellectual property protection, which are also covered in other PTAs. Second, the focus of the agreement is less on providing general obligations and more on specific actions by China to grant additional market access to U.S. exporters to achieve explicit import targets—admittedly, the main novelty and the most noticeable component of the deal. These elements, combined with other aspects of the agreement, such as the absence of any independent mechanism to solve disputes associated with the agreement, mark a significant departure from current practices in preferential arrangements. As discussed below, they could also pose risks to third countries.
Economic theory sheds light on some of the potential consequences of the China-U.S. trade agreement. For products that are freely traded, import targets above market-determined levels lower the welfare of the importing country more than they increase the welfare of the exporting country, and hence reduce global welfare. When trade is not free, increasing trade boosts the welfare of the importing and exporting countries, but import targets are generally inferior to a reduction in the trade barriers that impair trade flows in the first place. A key issue, especially from the perspective of third countries, is how these trade barriers are lowered: whether preferentially or on a nondiscriminatory basis. Discrimination
137
EAST ASIA AND PACIFIC IN THE TIME OF COVID-19
2. CHAPTER II. THE IMPACT OF THE CHINA-U.S. TRADE AGREEMENT
10158-EAP Economic Update_73177_Pt2-3.indd 13710158-EAP Economic Update_73177_Pt2-3.indd 137 4/1/20 2:08 PM4/1/20 2:08 PM

leads to trade diversion, implying a negative welfare effect on third countries and an ambiguous welfare effect on the importer. This analysis, therefore, supports two main policy conclusions: (i) increases in imports should be achieved through a reduction in trade barriers in protected sectors rather than pursuing quantitative targets through other means such as an explicit or implicit import subsidies (e.g., through purchases of state-owned enterprises); and (ii) expansion of imports should be implemented through non-discriminatory measures.
The computable general equilibrium model quantifies the trade and income effects of the China-U.S. agreement on the two countries and the rest of the world. Consistent with the theory, these effects depend on the way China decides to implement the agreement. When China meets the import targets through preferential treatment of the United States, the result is a positive income effect for China and the United States relative to the escalation of the trade war. However, compared to the policy status quo, the deal will make all countries worse off except the United States and its input-supplying neighbor, Mexico. Discriminatory measures, such as the preferential reduction in tariff or nontariff barriers or a subsidy for goods and services imports from the United States, disadvantage the exports of third countries in the Chinese market, leading to income losses. The biggest losses of income would be for China (0.38 percent), which will have to source some imports from less efficient sources, and for its current suppliers of manufactured goods in East Asia (0.32 percent) and commodities in Latin America (0.27 percent). But if China accommodates U.S. demands, not by granting the United States privileged entry but by liberalizing access to its market for all trading partners, then all countries would benefit. Global income would be 0.37 percent higher than under the managed trade scenario and China’s income would be 0.46 percent higher.
Most developing countries in East Asia lose from the agreement relative to status quo policies because of trade diversion. Lao PDR would experience the largest losses in terms of real income (–0.49 percent), while Cambodia is the only economy in East Asia that is positively affected by the China-U.S. agreement with a real income increase by 0.03 due to positive terms of trade effect. Other countries with sizeable losses are Malaysia, Thailand, the Philippines, Indonesia and, to a lesser extent, vietnam. If China achieves the import targets through a multilateral liberalization, there are two contrasting effects on East Asian developing countries. On the one hand, discrimination that favors U.S. producers is reduced. On the other hand, the preferential access that these countries have in the Chinese market thanks to the ASEAN-China trade agreements is in part eroded. Model simulations show that the first effect dominates, with six countries experiencing larger real incomes (between 0.90 percent for Lao PDR and 0.05 percent for Thailand) under the multilateral liberalization relative to managed trade. Indonesia is the only economy that would be slightly negatively affected by a nondiscriminatory opening of the Chinese market relative to managed trade.
To our knowledge, this is the first study that attempts to quantify the global impact of the China-U.S. trade agreement using a computable general equilibrium model. Earlier analyses focused on specific aspects of the agreement (e.g., Cohen, 2020, on issues concerning intellectual property rights) or on providing a first assessment based on existing trade patterns (Bown, 2020b; Ciuriak, 2020). Two recent notes by Chowdhry and Felbermayr (2020a, 2020b) are closer to our exercise. They use a gravity model to predict trade between China and its trading partners and compare these flows with the ones under the China-U.S. agreement. They show that, because the import targets foreseen by the deal are above-predicted trade flows, the agreement could lead to substantial trade diversion. Following a similar approach, Cali (2020) finds that the agreement would divert exports from Indonesia and other East Asian developing countries away from the Chinese market. Our study fits into the growing literature on the economic effects of the trade tensions between China and the United States and, more broadly, on the re-emergence of protectionism. A partial list of recent contributions includes Amiti et al. (2019), Blanchard et al. (2019), Constantinescu et al. (2019), Fajgelbaum et al. (2020), Freund et al. (2018), and Handley et al. (2020).
138
EAST ASIA AND PACIFIC ECONOMIC UPDATE APRIL 2020
PART II. SLOWING GROWTH AND TRADE TENSIONS
10158-EAP Economic Update_73177_Pt2-3.indd 13810158-EAP Economic Update_73177_Pt2-3.indd 138 4/1/20 2:08 PM4/1/20 2:08 PM

The rest of the chapter is organized as follows. Section 2 reviews the salient features of the China-U.S. agreement and compares it with other trade agreements signed by the United States. Section 3 focuses on the economics of import targets, while the results of the quantification exercise are presented in Section 4. Conclusions and policy implications are presented in Section 5.
2. The content of the agreement
This section briefly reviews the various chapters of the “Economic and Trade Agreement between the Government of the United States and the Government of the People’s Republic of China” (henceforth referred to as, “the China-U.S. agreement” or simply “the agreement”).5 Instead of conducting a detailed legal analysis of the text, we compare the agreement with other preferential trade agreements (PTAs) signed by the United States, relying on the information on the content of trade agreements (Mattoo et al., 2020). The goal is to highlight similarities and significant points of departure of the agreement with other PTAs as a first step to understand its potential effects on the two parties and third countries.
A focus on the content of the agreement is particularly pertinent in the context of the China-U.S. deal. PTAs typically aim at lowering (or eliminating) tariffs and other duties on “substantially all the trade” between members—a condition specified by the WTO rules on PTAs.6 These rules are designed to ensure that countries do not circumvent the most favored nation (MFN) rule against discrimination between trading partners by forming “trading blocs” for selected goods or services. The China-U.S. agreement does not mention tariff liberalization (although tariffs could be reduced to meet import targets) and focuses on regulating a set of policy areas beyond tariffs. While previous U.S. PTAs cover on average 19 policy areas,7 the China-U.S. agreement is limited to the seven listed below, leaving the negotiation of additional areas for an undefined Phase 2. The agreement seems to be conceived of as an instrument for one-sided, selective preferential access in a limited number of sectors rather than as either a means of broad-based liberalization or a full-fledged PTA.8
Chapters 1 and 2: Intellectual property and technology transfers
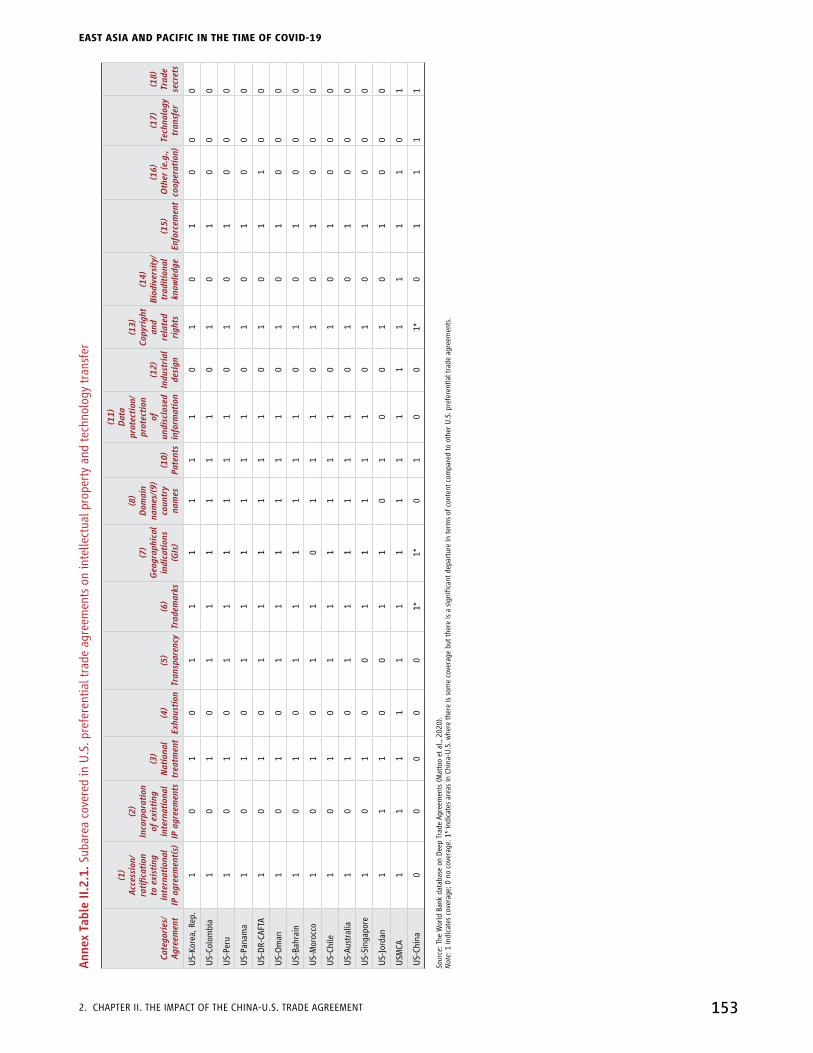
Chapters 1 and 2 of the agreement regulate intellectual property rights and technology transfers. As in other U.S. PTAs, the issue of technology transfer is (occasionally) touched upon in Intellectual Property (IP) chapters. There are, however, marked differences between the agreement and other agreements signed by the United States.9 First, for two sets of provisions, the agreement is deeper than other U.S. PTAs. These include trade secrets (Chapter 1, Section B), which are covered in the recently negotiated United States Mexico Canada Agreement (USMCA) but not in other U.S. PTAs, and technology transfers (Chapter 2), which are either absent from PTAs or feature in terms of general principles rather than concrete obligations.10 Second, the agreement contains rules on topics such as patents, geographical indications, trademarks, and copyrights (Chapter 1, Sections C–H), but with fewer details than previous PTAs. Third, the China-U.S.
5 The agreement is sometimes referred to as the “Phase 1 Agreement.” The text can be accessed here: https://ustr.gov/sites/default/files/files/agreements/phase%20one%20agreement/Economic_And_Trade_Agreement_Between_The_United_States_And_China_Text.pdf
6 See Article XXIv of the General Agreement on Tariffs and Trade (GATT), which regulates preferential trade agreements in goods, and Article v of the General Agreement on Trade in Services, which regulates preferential trade agreements in services between members of the World Trade Organization (WTO).
7 Policy areas most frequently covered in U.S. PTAs include areas that are not regulated by the WTO, such as investment, competition policy, and movements of capital. In other policy areas under the domain of the WTO, such as subsidies, technical barriers to trade, or public procurement, U.S. PTAs often include deeper commitments than those agreed at the multilateral level (Hofmann et al., 2019).
8 Indeed, the agreement does not feature on the USTR webpage showing free trade agreements.9 See Annex Table II.2.1 for a detailed summary of findings.10 For example, the China-U.S. agreement prevents the use of trade secrets; protects them from unauthorized disclosure, including by government authorities; and provides for criminal
procedures and penalties for unauthorized disclosure and misappropriation of a trade secret (Articles 1.5–1.9).
139
EAST ASIA AND PACIFIC IN THE TIME OF COVID-19
2. CHAPTER II. THE IMPACT OF THE CHINA-U.S. TRADE AGREEMENT
10158-EAP Economic Update_73177_Pt2-3.indd 13910158-EAP Economic Update_73177_Pt2-3.indd 139 4/1/20 2:08 PM4/1/20 2:08 PM

agreement does not include detailed rules on transparency, exhaustion of patent rights, and national treatment, as well as the ratification and incorporation of existing international IP agreements—presumably relying on existing WTO rules in these areas, which are in some cases more limited than those in other U.S. PTAs.
Chapter 3: Trade in food and agricultural products
Differently from the chapter on IP, it is difficult to find a counterpart to Chapter 3 on trade in food and agricultural products in other U.S. PTAs. Some of these provisions can be found in chapters covering sanitary and phytosanitary (SPS) measures or agriculture. In the chapter, there are two sets of provisions. First, and similarly to other U.S. PTAs, the agreement includes provisions on general obligations, including intensified cooperation, adoption of SPS measures that are science- and risk-based, and the prohibition of disguised restrictions on international trade (Article 3.1.1) that apply on an MFN basis. The second group of provisions aimed at facilitating access for U.S. products to the Chinese market through greater acceptance in China of U.S. standards and conformity assessment procedures for agricultural products (Annexes 1–17). Examples include commitments for China to take into consideration U.S. legislation (as in the case of infant formula) and specific time frames for China to allow the importation of regulated products from the United States (as for meat, poultry, and processed meat).
Chapter 4: Financial services
U.S. PTAs generally contain chapters on financial services, most recently including USMCA. These chapters are typically more complex than Chapter 4 of the China-U.S. agreement, containing provisions on definitions and scope, national treatment, transparency, market access, and sector-specific dispute resolution that applies to both parties. The scope of Chapter 4 is more limited in two respects. First, it primarily focuses on providing market access to specific U.S. financial institutions in China (e.g., institutions providing securities investment fund custody, credit rating, electronic payment, financial asset management, insurance, and securities, fund management, and future services), setting specific time frames for approving licenses by the Chinese authorities (Articles 4.2–4.7). Second, the United States generally accords nondiscriminatory treatment to Chinese financial institutions, but without specific obligations or time frames to comply. This asymmetry is also reflected in the language, which is overall binding for China (e.g., “shall remove,” “shall allow”) and softer for the United States (e.g., “will continue to allow,” “affirms”), whereas in other agreements, the United States assumes binding obligations.
Chapter 5: Macroeconomic policies and exchange rate matters and transparency
Issues concerning macroeconomic policies and exchange rate matters are new to U.S. trade agreements. Other than this agreement, only USMCA has a chapter dedicated to these issues. The agreement shares many similarities to the chapter in USMCA, although the latter contains additional provisions on definitions and scope and establishes an institutional framework for cooperation, i.e., a Macroeconomic Committee. Provisions in Chapter 5 apply to both parties and follow closely the language of USMCA on the same matter. Specifically, the provisions cover guiding principles and international commitments, including under the International Monetary Fund (IMF) Articles of Agreement to “avoid manipulating exchange rates or the international monetary system.” Moreover, parties commit to a “market-determined exchange rate regime” and to “refrain from competitive devaluations” (Article 5.2). In case of a dispute on these issues, parties can resort to the mechanism established in Chapter 7 of the agreement or, if the latter fails to arrive at a “mutually satisfactory resolution,” they can turn to the IMF for surveillance of macroeconomic policies and formal consultations (Article 5.4).
140
EAST ASIA AND PACIFIC ECONOMIC UPDATE APRIL 2020
PART II. SLOWING GROWTH AND TRADE TENSIONS
10158-EAP Economic Update_73177_Pt2-3.indd 14010158-EAP Economic Update_73177_Pt2-3.indd 140 4/1/20 2:09 PM4/1/20 2:09 PM
Chapter 6: Expanding trade
Chapter 6 outlines quantitative import commitments for China or “voluntary import expansions” (vIEs) as these measures have been called in the trade literature (explained in more detail below). The chapter sets out the general objective of improving the bilateral relationship through an expansion of trade. The chapter requires China over the years 2020 and 2021 to ensure that purchases and imports from the United States of specifically manufactured goods, agricultural goods, energy products, and services exceed the corresponding 2017 baseline amount by no less than $200 billion. The chapter provides that the United States “shall ensure to take appropriate steps to facilitate the availability of U.S. goods and services to be purchased and imported into China” (Article 6.2.4), suggesting that the United States bears some of the burdens of ensuring the targets are realized. The agreement allows China flexibility on how to achieve the targets, but states that “The Parties acknowledge that purchases will be made at market prices based on commercial considerations . . .” (Article 6.2.5). The limits of the practical applicability of this provision are discussed in the next section.
Chapter 7: Bilateral evaluation and dispute resolution
Chapter 7 creates an institutional structure to deal with the implementation of the agreement (Article 7.2) and potential disputes (Article 7.4). The chapter foresees the creation of a Trade Framework Group, which is led by the United States Trade Representative (USTR) and a designated vice Premier of the People’s Republic of China. The Trade Framework Group is the organ in charge of implementation and dispute resolution, with clear working procedures and time frames. Relative to recent U.S. PTAs, including USMCA, there are three main differences in this area. First, previous U.S. trade agreements establish independent panels from rosters that take full control of a dispute. Second, while the general idea of resolving a dispute through consultations and an institutional structure is in line with other U.S. PTAs, the main difference is that the USTR and its Chinese counterpart will be involved in the whole process and never hand over to an adjudicated body. Finally, the agreement lacks a “choice of forum” clause typical of other PTAs, confirming that third, independent parties are not envisioned in the dispute resolution process.
Summing up, a comparison of existing U.S. PTAs with the China-U.S. trade agreement shows that the latter has a number of significant differences: (i) while there are some new elements (e.g., trade secrets, technology transfers, and macroeconomic policies), the scope of the agreement is more limited even in areas such as IP where similar chapters can be found in other PTAs; (ii) the focus of the agreement is less on providing general obligations that can be applied on an MFN basis and more on specific actions by China to grant additional market access to U.S. exporters; and (iii) the dispute settlement framework, while reflecting some of the elements of other U.S. PTAs, departs from previous practices, as it dispenses completely with an independent mechanism.
3. The economics of import targets
Import targets, a defining element of the China-U.S. trade deal, aim at expanding the import of a specified set of products over a certain period. These quantitative targets are infrequent but not new tools of trade policy. In the trade literature, they are referred to as “voluntary import expansions” (vIEs)—a terminology that was first introduced by Bhagwati (1987) in the context of U.S.-Japan trade tensions of the 1980s.11
11 In July 1986, Japan and the United States signed an agreement in which Japan accepted that the foreign share of its semiconductor market would increase to 20 percent, from a level of 8 percent, over a period of five years. Irwin (2017) reports that Japan’s government had difficulty in getting domestic firms to comply with the agreement. Indeed, eight months after the agreement was signed, the United States declared Japan in noncompliance and imposed retaliatory tariffs. Eventually, retaliatory tariffs were lifted as the foreign share of Japan’s semiconductor market increased. Another agreement was signed between the United States and Japan in 1992 and concerned a voluntary import expansion in automobile parts. In early 1993, the United States considered negotiating a number of other vIEs with Japan, but the policy was not pursued. The United States focused instead on completing the negotiation of the Uruguay Round, which gave rise to the World Trade Organization.
141
EAST ASIA AND PACIFIC IN THE TIME OF COVID-19
2. CHAPTER II. THE IMPACT OF THE CHINA-U.S. TRADE AGREEMENT
10158-EAP Economic Update_73177_Pt2-3.indd 14110158-EAP Economic Update_73177_Pt2-3.indd 141 4/1/20 2:09 PM4/1/20 2:09 PM
Import targets or vIEs are the counterparts of voluntary Export Restraints (vERs). Just like vERs, voluntary import expansions aim at directly affecting quantities traded internationally. But rather than a ceiling on a country’s exports, they imply a floor on a country’s imports. While the goal of expanding trade may be viewed more positively than restricting it, vIEs are considered inefficient policy tools (Irwin, 1994). The reason is that they lead to economic distortions that depend on: (i) whether trade in the specific market subject to the vIE is free or impeded by some explicit or hidden protection; and (ii) whether we focus on the exporting country, the importing country, or third countries.12
In this section, we briefly review the economics of import targets and informally establish a number of findings that are helpful to understand the quantification analysis in the next section. For ease of exposition, we initially focus on a world with two economies: the United States (the exporter) and China (the importer). In this simpler setting, we show that under free trade a vIE requires an (implicit or explicit) import subsidy and then studies the welfare effects of this policy. We further argue that in a market where the importing country imposes tariff and/or nontariff barriers, an increase in trade boosts welfare both for the importer and the exporter, but a vIE is generally inferior to a reduction in trade barriers that would result in the same increase in trade as the vIE. Finally, we augment the model to consider a third country, the Rest of the World (ROW), which also exports the product to China. Because now there are two exporters, it makes a difference whether the increase in imports is achieved through discrimination or nondiscriminatory policy. We informally show that a discriminatory vIE leads to trade diversion, implying a negative welfare effect on third countries and an ambiguous welfare effect for the importer.
Under free trade, a VIE requires the use of an import subsidy, either explicitly or implicitly (e.g., through purchases of state-owned enterprises).
Consider a market of a good that is freely traded internationally. Assuming that there are no other frictions such as transportation costs, a single price prevails to buy and sell this product independently of the location. The effect of an import target is to increase the flow of goods in China (the importing country), causing a decrease in the domestic price of the product and an expansion of its import demand. In the United States (the exporting country), the effect of the vIE is the opposite: the lower supply of the goods increases its price in the United States and its export supply. In this context, importers of the good in China would face a loss, as they would buy products in the United States for a higher price than what they could obtain in China. This implies that the only way the vIE can be implemented in practice is if the Chinese government offers an import subsidy equal to the difference between the price of the product in the United States and the price in China for each unit imported. An alternative to this explicit import subsidy is a situation where an importer, say a state-owned enterprise or another public entity, incurs the loss. This is a form of implicit subsidy, as the loss would eventually appear as a negative entry in the balance sheet of the importing country’s government.
Under free trade, a VIE lowers the welfare of the importing country more than it increases the welfare of the exporting country and hence reduces global welfare.
As we have established, implementing an import target requires an explicit or implicit import subsidy. The subsidy/vIE lowers the price of the good in China (the importer) and increases it in the United States (the exporter). Producers are worse off in China, where they need to compete with subsidized foreign producers, and are better off in the United States, as the subsidy stimulates production to be sold in China. Consumers in China benefit from the lower prices, while the opposite is true for U.S. consumers. Finally, the Chinese government will have to bear the (direct or indirect) fiscal cost of the subsidy/vIE. Summing the gains and the losses, the net impact is a negative effect on welfare in China and a positive effect in the United States.
12 The effects of vIE also depend on whether the market operates under perfect or imperfect competition. For simplicity, we assume perfect competition, but the key results in this brief discussion generally apply also to imperfectly competitive markets. For a broader treatment of vIEs under imperfect competition, see Irwin (1994) and the references therein.
142
EAST ASIA AND PACIFIC ECONOMIC UPDATE APRIL 2020
PART II. SLOWING GROWTH AND TRADE TENSIONS
10158-EAP Economic Update_73177_Pt2-3.indd 14210158-EAP Economic Update_73177_Pt2-3.indd 142 4/1/20 2:09 PM4/1/20 2:09 PM

At the world level, the subsidy/vIE induces inefficiencies in production and consumption, which lower world welfare. Figure II.2.2 provides a textbook illustration of the welfare effects of a subsidy/vIE in a two-country model (Suranovic, 2010). The red and blue segments represent the quantity traded under free trade and the vIE, respectively. A higher price in the exporting country (PEX
vIE) and a lower price in the importing country (PIMvIE) correspond to the new quantity (Q)
under the vIE. The consumption and production distortions in the two countries (i.e., the net welfare losses) are the triangles in grey. The extent of these welfare losses depends on the slopes of the demand (D) and supply (S) curves (the demand and supply elasticities) and the size of the vIE. Larger deviations from the free trade (FT) equilibrium would be more costly, particularly when the demand or supply elasticity is larger. As the import targets in the China-U.S. agreement are defined at the aggregate level—not at the product level—there is some scope to design the policy to reduce policy distortions.
Figure II.2.2. Welfare effects of a vIE, two-country model
Importing country
P
D S
Q
PFT
Exporting country
P
D S
Q
PEXVIE
PFT
PEXVIE
PIMVIE PIM
VIE
DIMVIESIM
VIE SEXVIEDEX
VIE
Source: World Bank staff elaboration.
When trade is not free, increasing trade boosts the welfare of the importing and the exporting country, but a VIE is generally inferior to a reduction in trade barriers.
An argument in favor of a policy that expands imports can be made when international trade is impeded by a policy barrier, whether being a tariff or a nontariff barrier. Trade barriers create a wedge between the domestic price of the good in the importing country and the price in the exporting country, causing distortions in consumption and production in both countries. Expanding imports would, therefore, lower these inefficiencies and increase welfare. To achieve this goal, lowering or eliminating the trade barrier is a more efficient policy option than setting a quantitative target through a vIE. Intuitively, since trade barriers and vIEs both create distortions, the most efficient way to increase imports is to reduce the barrier, not to combine the barrier with an offsetting vIE. One could argue that this logic does not capture the main appeal of a quantitative target: a vIE implies a precise outcome, irrespective of prevailing conditions in the
143
EAST ASIA AND PACIFIC IN THE TIME OF COVID-19
2. CHAPTER II. THE IMPACT OF THE CHINA-U.S. TRADE AGREEMENT
10158-EAP Economic Update_73177_Pt2-3.indd 14310158-EAP Economic Update_73177_Pt2-3.indd 143 4/1/20 2:09 PM4/1/20 2:09 PM

economy over the period of the agreement. The targeted outcome, however, is also its main drawback: lowering or removing a trade barrier allows market forces to shape outcomes responding to changes in fundamentals, such as demand and technology shocks, through changes in prices. Thus, the economic distortions created by complying with the quantitative targets may be magnified by the coronavirus shock. A related problem with quantitative targets is that they leave substantial discretion to a government to pick winners arbitrarily, increasing the risk of rent-seeking activities.13
A discriminatory VIE leads to trade diversion, implying a negative welfare effect on third countries and an ambiguous welfare effect for the importer.
We next move to a three-country model and consider a discriminatory vIE, in which the Chinese government commits to import from the United States only, and U.S. producers benefit from privileged access to the Chinese market. As discussed above, China will increase imports from the United States, putting upward pressure on the U.S. export price and reducing imports from the rest of the world (ROW). The decline in demand for ROW exports will put downward pressure on their export price. This trade diversion has a negative welfare effect for ROW and a positive welfare effect for the United States.14 The impact on China’s welfare is negative if the market is under free trade and ambiguous in the case of a protected product. As is well known from the economics of preferential liberalization, the ambiguity for the importing country depends on the fact that increased imports from the United States may drive out less efficient domestic producers or more efficient producers from ROW.15 The second set of effects may result from the distortions created by the vIE in the importing market. Chinese producers, seeing the domestic price decline, may sell part of their production abroad. This form of “trade deflection” will have negative consequences for producers in third countries, which will suffer from the increased competition from Chinese exporters, and a positive effect on third-country consumers that will benefit from lower prices.
Summing up, this section supports three policy conclusions: (i) import targets should not be implemented for products that are freely traded; (ii) in protected sectors, increases in imports should be achieved through a reduction in trade barriers rather than through pursuing quantitative targets by other means; and (iii) expansion of imports should be implemented through MFN rather than discriminatory liberalization.
4. Quantifying the trade and income effects
In this section, we quantify the impact of import targets in the China-U.S. trade agreement on the trade and income of these two countries as well as on third countries under different scenarios.16 The simulations are based on a global dynamic computable general equilibrium model, Linkage, which uses the Global Trade Analysis Project (GTAP) database (Freund et al., 2018). The model tracks historical GDP growth, trade balances, and investment up to 2019 and then projects the developments in the global economy up to 2025. The commitments of China to buy more U.S. goods and services as per the text of the agreement are aggregated to the CGE model sectors (Figure II.2.3).17
13 Moving away from perfect competition, Irwin (1994) shows that vIEs are likely to lead to forms of collusion, such as the creation of cartels, between producers in imperfectly competitive markets. Hence, also in this context, a vIE is a suboptimal tool to increase trade.
14 In a general rather than partial equilibrium model with upward sloping supply curves, as the United States expands sales to China, it is likely to sell less at home and in third markets. Other countries that are now disadvantaged in China are likely to sell more to the United States and in third countries. In this broader context, welfare declines because of the costly reallocation of exports to destination markets induced by discriminatory conditions in China’s market.
15 See, for instance, Baldwin and Wyplosz (2004), Chapter 5. 16 The import targets in 2020 may be less feasible in light of the negative demand shock from the coronavirus. As the focus of the note is on the trade agreement and the extent and
duration of the coronavirus shock is uncertain, the scenarios assume demand in 2020 is not affected by the virus—though that does not preclude a temporary shock. To the extent demand is lower for the year in China, the attempt to reach the import targets will lead to more trade diversion and a larger loss in income for China and the ROW.
17 “For the category of manufactured goods identified in Annex 6.1, no less than $32.9 billion above the corresponding 2017 baseline amount is purchased and imported into China from the United States in calendar year 2020, and no less than $44.8 billion above the corresponding 2017 baseline amount is purchased and imported into China from the United States in calendar year 2021.”
144
EAST ASIA AND PACIFIC ECONOMIC UPDATE APRIL 2020
PART II. SLOWING GROWTH AND TRADE TENSIONS
10158-EAP Economic Update_73177_Pt2-3.indd 14410158-EAP Economic Update_73177_Pt2-3.indd 144 4/1/20 2:09 PM4/1/20 2:09 PM
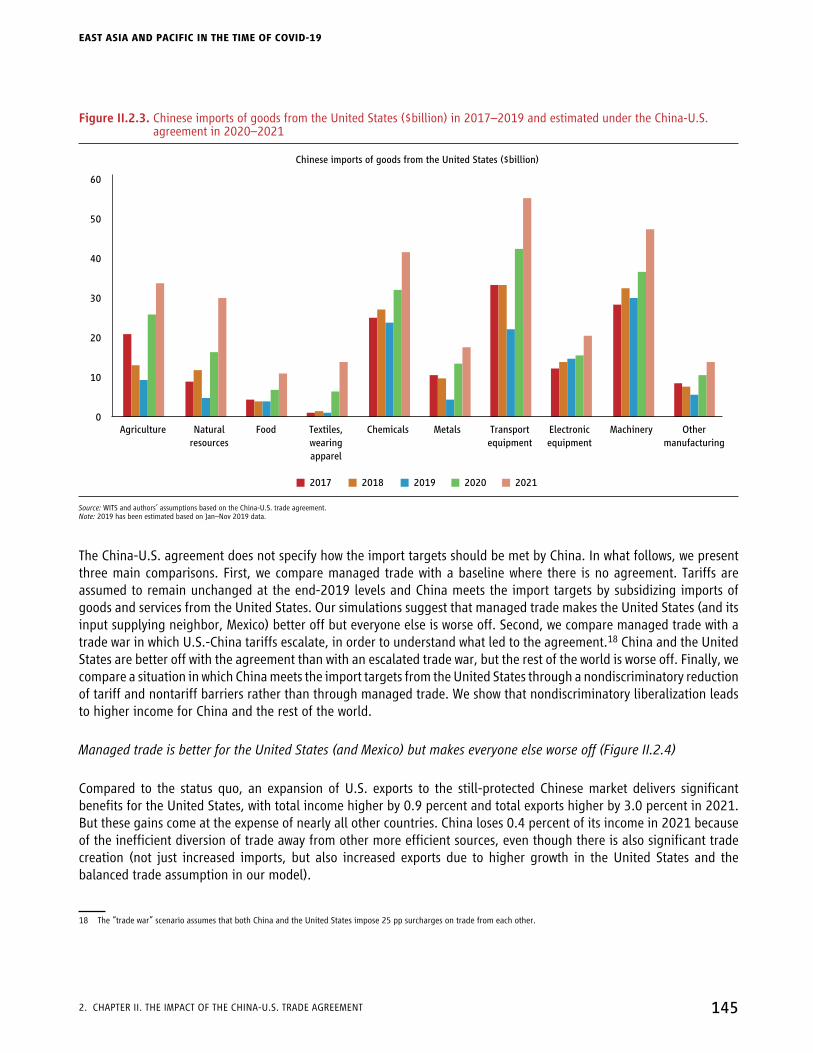
Figure II.2.3. Chinese imports of goods from the United States ($billion) in 2017–2019 and estimated under the China-U.S. agreement in 2020–2021
0
10
20
30
40
50
60
Agriculture Naturalresources
Food Textiles,wearingapparel
Chemicals Metals Transportequipment
Electronicequipment
Machinery Othermanufacturing
Chinese imports of goods from the United States ($billion)
2017 2018 2019 2020 2021
Source: WITS and authors’ assumptions based on the China-U.S. trade agreement.Note: 2019 has been estimated based on Jan–Nov 2019 data.
The China-U.S. agreement does not specify how the import targets should be met by China. In what follows, we present three main comparisons. First, we compare managed trade with a baseline where there is no agreement. Tariffs are assumed to remain unchanged at the end-2019 levels and China meets the import targets by subsidizing imports of goods and services from the United States. Our simulations suggest that managed trade makes the United States (and its input supplying neighbor, Mexico) better off but everyone else is worse off. Second, we compare managed trade with a trade war in which U.S.-China tariffs escalate, in order to understand what led to the agreement.18 China and the United States are better off with the agreement than with an escalated trade war, but the rest of the world is worse off. Finally, we compare a situation in which China meets the import targets from the United States through a nondiscriminatory reduction of tariff and nontariff barriers rather than through managed trade. We show that nondiscriminatory liberalization leads to higher income for China and the rest of the world.
Managed trade is better for the United States (and Mexico) but makes everyone else worse off (Figure II.2.4)
Compared to the status quo, an expansion of U.S. exports to the still-protected Chinese market delivers significant benefits for the United States, with total income higher by 0.9 percent and total exports higher by 3.0 percent in 2021. But these gains come at the expense of nearly all other countries. China loses 0.4 percent of its income in 2021 because of the inefficient diversion of trade away from other more efficient sources, even though there is also significant trade creation (not just increased imports, but also increased exports due to higher growth in the United States and the balanced trade assumption in our model).
18 The “trade war” scenario assumes that both China and the United States impose 25 pp surcharges on trade from each other.
145
EAST ASIA AND PACIFIC IN THE TIME OF COVID-19
2. ChapTer II. The IMpaCT OF The ChINa-U.S. Trade agreeMeNT
10158-EAP Economic Update_73177_Pt2-3.indd 14510158-EAP Economic Update_73177_Pt2-3.indd 145 4/7/20 10:29 AM4/7/20 10:29 AM

Figure II.2.4. Impacts of the managed trade scenario as compared to the trade policy status quo scenario (percent)
Totalexports
Income
0%
0%
1.0%
2.0%
1.0%
2.0%
3.0%
0.5%
Totalimports
UnitedStates
China Mexico LatinAmericaand the
Caribbean
East Asiaand
Pacificexcluding
China
South Asia Africa Europeand
CentralAsia
MiddleEastand
NorthAfrica
Highincome
countries
Worldexcluding
UnitedStatesand
China
0%
Source: Linkage model simulations.
The impact on the rest of the world is also negative, with income lower by 0.17 percent and trade lower by about 0.30 percent in 2021. The biggest relative loss of income and exports is in East Asia and the Pacific (excluding China) (–0.32 and –0.50 percent, respectively in 2021), followed by Latin America (–0.27 and –0.70 percent, respectively in 2021). For Mexico, the indirect benefits of improved U.S. access to China’s market through strong input-output linkages with the United States outweigh the direct costs of diminished competitiveness in the Chinese market compared to the United States. The forced, partial liberalization of the Chinese market slightly enhances global income, as anticipated in the analytical discussion.
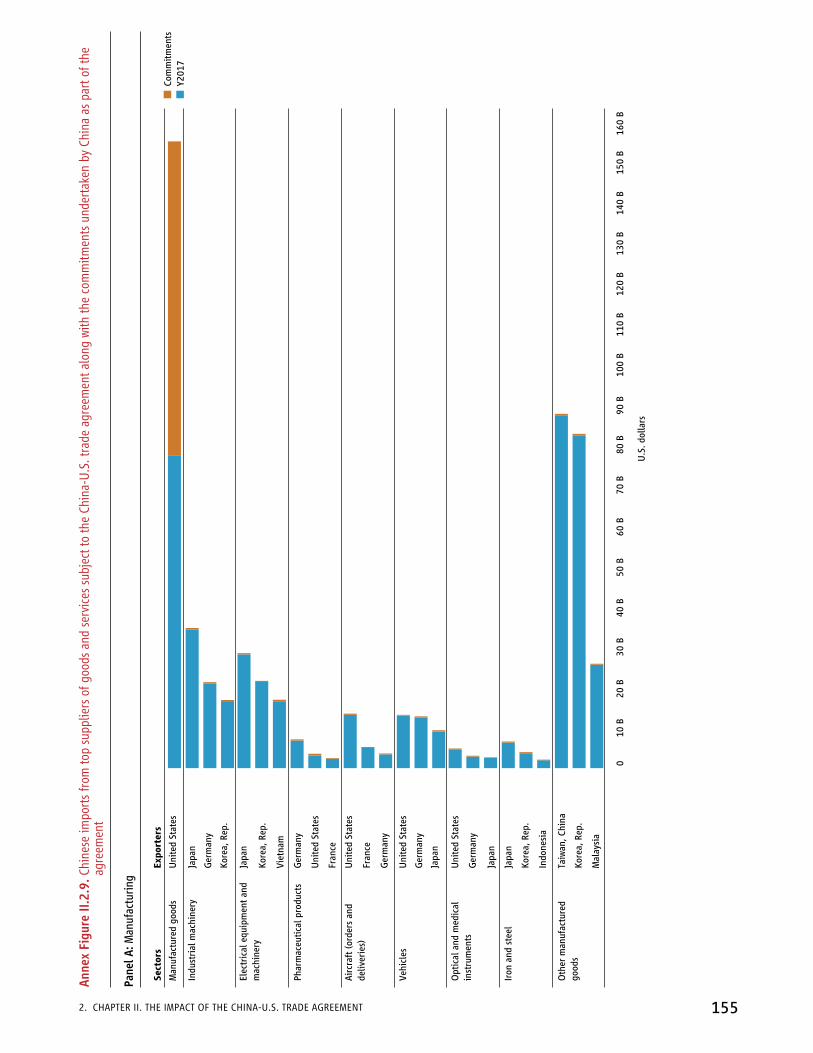
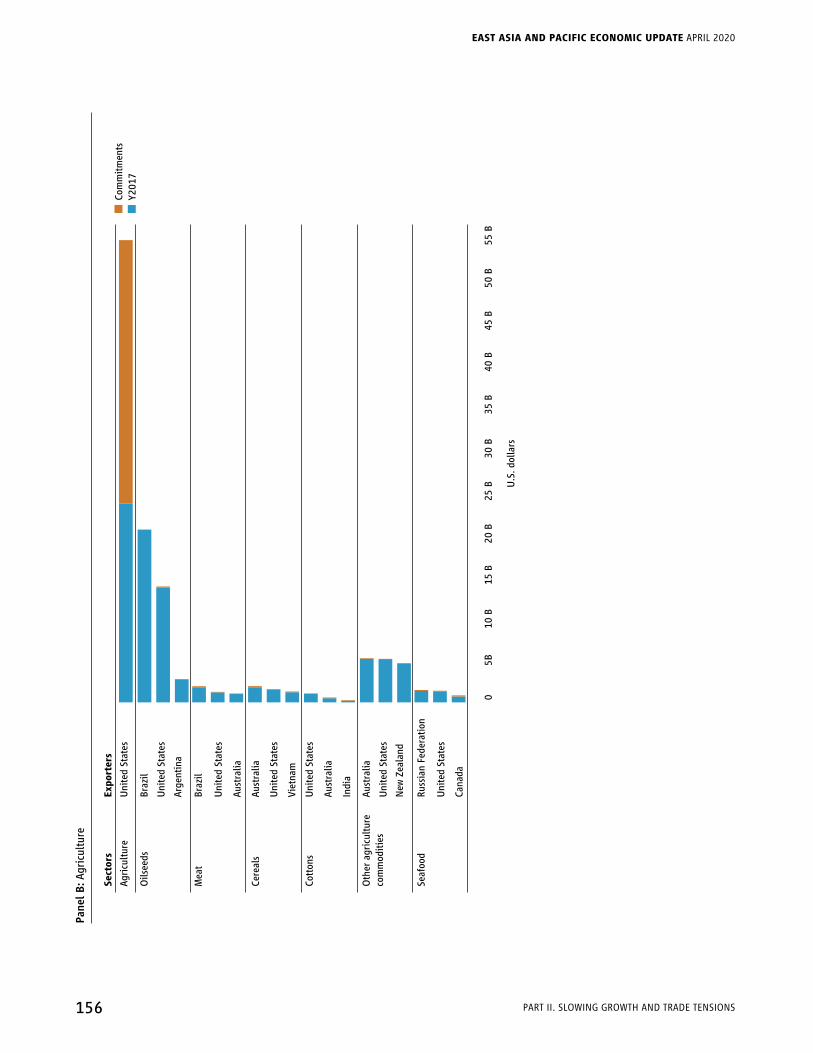
Countries that are likely to suffer losses due to trade diversion include exporters with the highest shares in the Chinese market for products targeted under the China-U.S. agreement (see Annex 3). In the agriculture sector, Brazil and Argentina are likely to export less oilseeds, meat, and cotton to China, while the Russian Federation’s and Ecuador’s seafood exports could suffer from trade diversion. In manufacturing, the biggest absolute market share losses are expected to be experienced by Japan and Germany, particularly in electrical equipment, aircraft, industrial machinery, optical and medical instruments, and vehicles, followed by vietnam, the Republic of Korea, Indonesia, and Malaysia. In energy sectors, Saudi Arabia, Australia, Russia, and Republic of Korea, as well as Angola, Indonesia, Mongolia, Turkmenistan, Singapore, and Malaysia face the potential risk of losses due to China’s commitment to buy more U.S. goods. Australia, Indonesia, and Mongolia supply coal, while Angola is an important exporter of crude oil.
146
EAST ASIA AND PACIFIC ECONOMIC UPDATE APRIL 2020
PART II. SLOWING GROWTH AND TRADE TENSIONS
10158-EAP Economic Update_73177_Pt2-3.indd 14610158-EAP Economic Update_73177_Pt2-3.indd 146 4/1/20 2:09 PM4/1/20 2:09 PM
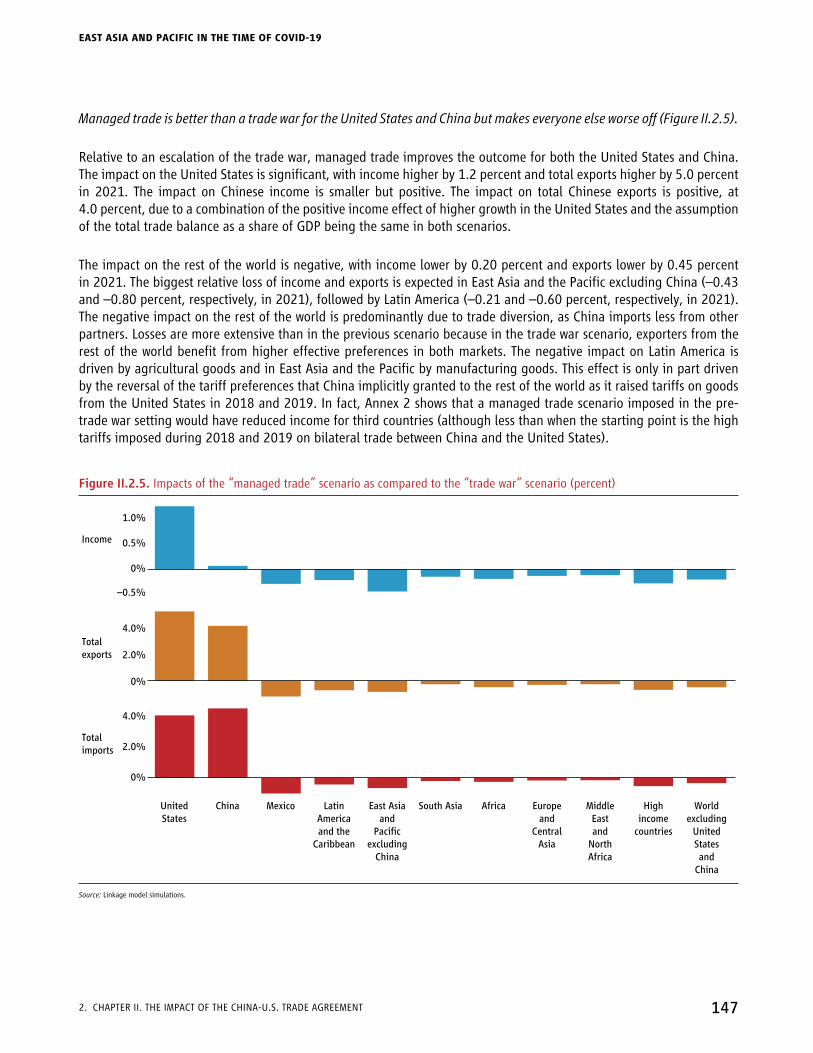
Managed trade is better than a trade war for the United States and China but makes everyone else worse off (Figure II.2.5).
Relative to an escalation of the trade war, managed trade improves the outcome for both the United States and China. The impact on the United States is significant, with income higher by 1.2 percent and total exports higher by 5.0 percent in 2021. The impact on Chinese income is smaller but positive. The impact on total Chinese exports is positive, at 4.0 percent, due to a combination of the positive income effect of higher growth in the United States and the assumption of the total trade balance as a share of GDP being the same in both scenarios.
The impact on the rest of the world is negative, with income lower by 0.20 percent and exports lower by 0.45 percent in 2021. The biggest relative loss of income and exports is expected in East Asia and the Pacific excluding China (–0.43 and –0.80 percent, respectively, in 2021), followed by Latin America (–0.21 and –0.60 percent, respectively, in 2021). The negative impact on the rest of the world is predominantly due to trade diversion, as China imports less from other partners. Losses are more extensive than in the previous scenario because in the trade war scenario, exporters from the rest of the world benefit from higher effective preferences in both markets. The negative impact on Latin America is driven by agricultural goods and in East Asia and the Pacific by manufacturing goods. This effect is only in part driven by the reversal of the tariff preferences that China implicitly granted to the rest of the world as it raised tariffs on goods from the United States in 2018 and 2019. In fact, Annex 2 shows that a managed trade scenario imposed in the pre-trade war setting would have reduced income for third countries (although less than when the starting point is the high tariffs imposed during 2018 and 2019 on bilateral trade between China and the United States).
Figure II.2.5. Impacts of the “managed trade” scenario as compared to the “trade war” scenario (percent)
Totalexports
Income
0%
0%
0%
1.0%
2.0%
2.0%
4.0%
4.0%
0.5%
–0.5%
Totalimports
UnitedStates
China Mexico LatinAmericaand the
Caribbean
East Asiaand
Pacificexcluding
China
South Asia Africa Europeand
CentralAsia
MiddleEastand
NorthAfrica
Highincome
countries
Worldexcluding
UnitedStatesand
China
Source: Linkage model simulations.
147
EAST ASIA AND PACIFIC IN THE TIME OF COVID-19
2. CHAPTER II. THE IMPACT OF THE CHINA-U.S. TRADE AGREEMENT
10158-EAP Economic Update_73177_Pt2-3.indd 14710158-EAP Economic Update_73177_Pt2-3.indd 147 4/1/20 2:09 PM4/1/20 2:09 PM

Achieving the import targets of the China-U.S. agreement through multilateral liberalization by China rather than managed trade would leave all countries, other than the United States and Mexico, better off (Figure II.2.6)
Next the impact of the China-U.S. agreement is assessed when import targets are met through multilateral liberalization rather than managed trade. Specifically, we compare the managed trade deal with the multilateral liberalization by China (15 percent reduction in tariffs and nontariff barriers) that achieve the same gains in U.S. exports to China as targeted under the China-U.S. agreement.
Figure II.2.6. Impact of the “multilateral liberalization” scenario compared to the “managed trade” scenario (percent)
Totalexports
Income
0%
0%
0%
1.0%
10.0%
10.0%
30.0%
20.0%
0.5%
–0.5%
Totalimports
UnitedStates
China Mexico LatinAmericaand the
Caribbean
East Asiaand
Pacificexcluding
China
South Asia Africa Europeand
CentralAsia
MiddleEastand
NorthAfrica
Highincome
countries
Worldexcluding
UnitedStatesand
China
20.0%
Source: Linkage model simulations.
Simulation results show that the United States is better off with China’s MFN liberalization relative to a trade war but less so than with managed trade because it does not get preferential access to the Chinese market.19 This is due to a negative term of trade effect for the United States (i.e., the price of its exports declines relative to the price of imports): because China’s aggregate imports surge substantially more, the price U.S. exporters receive is lower when China opens multilaterally than when the United States receives preferential access. Due to the vertical linkages between the Mexican and U.S. economies, the fate of Mexico is closely tied to that of the United States and it experiences a small loss relative to the managed trade scenario. All other countries, including China, are better off with multilateral liberalization by
19 See Annex Table II.2.3 for the impact of the “multilateral liberalization” scenario compared to the “trade war” scenario, which can be directly compared to the impact of the “managed trade” scenario as compared to the “trade war” scenario.
148
EAST ASIA AND PACIFIC ECONOMIC UPDATE APRIL 2020
PART II. SLOWING GROWTH AND TRADE TENSIONS
10158-EAP Economic Update_73177_Pt2-3.indd 14810158-EAP Economic Update_73177_Pt2-3.indd 148 4/1/20 2:09 PM4/1/20 2:09 PM

China. Global income rises by the largest amount, more than 0.50 percent in this scenario. The largest income gains would be registered in Latin America and other high-income countries (1.1 and 1.2 percent, respectively). But African countries would also experience large increases in income (0.8 percent) driven by higher exports.
Managed trade makes all developing East Asian countries except for Cambodia worse off (Figure II.2.7)
Most developing countries in East Asia lose from the agreement relative to status quo policies because of trade diversion. Laos would experience the largest losses in terms of real income (–0.49 percent) and exports (–0.66 percent). Other countries with sizeable losses are Malaysia, Thailand, the Philippines, and Indonesia. Their real incomes would decline by roughly 0.2 percent, while their exports would drop by around 0.3 percent. vietnam has a smaller loss in terms of real income (–0.10 percent) and exports (–0.07 percent). Cambodia is the only developing economy in East Asia that is positively affected by the China-U.S. agreement relative to the status quo policies. While its exports would contract by 0.03 percent, its real income would increase by 0.03 percent due to positive terms of trade effect.
Figure II.2.7. Impacts of the managed trade scenario as compared to the trade policy status quo scenario for East Asian developing countries (percent)
Totalexports
Income
0%
0%
0%
–0.2%
–0.4%
–0.6%
–0.2%
–0.4%
–0.6%
–0.2%
–0.4%
–0.6%
Totalimports
Lao PDR Thailand Malaysia Indonesia Philippines Vietnam Cambodia
Source: Linkage model simulations.
Achieving the import targets of the China-U.S. agreement through multilateral liberalization by China rather than managed trade would make all developing East Asian countries except Indonesia better off (Figure II.2.8)
If China achieves the import targets through an MFN reduction of tariffs and nontariff barriers, there are two contrasting effects on East Asian developing countries. On the one hand, as discussed above, discrimination that favors U.S. producers is reduced. On the other hand, the preferential access that these countries have in the Chinese market thanks to the ASEAN-China trade agreements is in part eroded. Still, this exercise shows that three countries (Lao PDR, vietnam,
149
EAST ASIA AND PACIFIC IN THE TIME OF COVID-19
2. CHAPTER II. THE IMPACT OF THE CHINA-U.S. TRADE AGREEMENT
10158-EAP Economic Update_73177_Pt2-3.indd 14910158-EAP Economic Update_73177_Pt2-3.indd 149 4/1/20 2:09 PM4/1/20 2:09 PM

and the Philippines) would have larger exports (between 2.90 percent for Lao PDR and 0.25 percent of the Philippines) and larger real income (between 0.9 percent for Lao PDR and 0.1 percent for the Philippines) under the multilateral liberalization relative to managed trade. Cambodia, Thailand, and Malaysia would see their export contract, but still, achieve higher real income under multilateral liberalization due to positive terms of trade effect. Indonesia is the only economy that would be negatively affected by a nondiscriminatory opening of the Chinese market relative to managed trade, with a slight decline in real income by –0.18 percent.
Figure II.2.8. Impact of the “multilateral liberalization” scenario compared to the “managed trade” scenario for East Asian developing countries (percent)
Totalexports
Income
0%
0%
0%
2.0%
2.0%
2.0%Totalimports
Lao PDR Thailand Malaysia Indonesia Philippines Vietnam Cambodia
Source: Linkage model simulations.
5. Making the agreement work for the development
Having identified the valuable opportunity offered by the agreement, it is useful also to highlight four risks—and how they might be averted.
First, even as the United States and China engage in the managed coupling, they face internal pressures to decouple. Growing strategic rivalry is creating a strong impulse in both the United States and China to reduce mutual dependence and increase self-sufficiency. yet, a deal that forces China to buy more from the United States encourages increased intertwining. This outcome may reflect the ascendancy within the United States of those who seek a new equilibrium of greater mutual openness over those who seek to reduce U.S. dependence; and of those within China who seek a more liberal economy over those who wish to maintain greater state control. But the unresolved tensions could make it hard to implement the deal through mutual liberalization—particularly if the United States persists with export restrictions and China maintains general trade barriers.
Second, even though the deal affirms in its preamble the benefits of market-based “harmonious development and expansion of world trade,” it could turn into an exercise in state-driven, bilateral mercantilism. The preamble emphasizes market-based outcomes, international norms, and catalyzing broader international cooperation. But the deal specifies quantitative goals for the expansion of U.S. exports to China and therefore risks diminishing the role of the market in China. That is because meeting the quantitative goals could lead to managed trade and strengthen the role of state-owned enterprises—whose reform is desirable and has been deferred.
150
EAST ASIA AND PACIFIC ECONOMIC UPDATE APRIL 2020
PART II. SLOWING GROWTH AND TRADE TENSIONS
10158-EAP Economic Update_73177_Pt2-3.indd 15010158-EAP Economic Update_73177_Pt2-3.indd 150 4/1/20 2:09 PM4/1/20 2:09 PM

Third, a deal that seeks trade creation could result in trade diversion, not just in China but also in the United States. As noted above, if China does not liberalize compared to the rest of the world, China’s bilateral commitments to the United States could result in reduced imports from other countries, including otherwise competitive developing countries. And the ability of the United States to realize its sales to China could come from reduced exports to other countries, at least until the capacity of U.S. firms and farms expands sufficiently—even as the United States operates at close to full employment. This double trade diversion could lead to trade distortions rather than beneficial trade liberalization.
Fourth, a deal that seeks to dispel uncertainty could make a trade policy permanently unpredictable. In principle, an agreement makes the world more predictable. But this agreement appears to deviate from multilateral rules against discrimination and guarantees against trade protection. By requiring bilateral purchases, the agreement marks a deeper departure from multilateral rules against discrimination than the preferential tariffs associated with typical bilateral and regional agreements. Moreover, instead of an independent multilateral dispute settlement, the United States has assumed the right to unilaterally judge and penalize China’s nonconformity with obligations that are not always clear, while China must either accept or withdraw from the agreement. The result could be a durable uncertainty in the trading system. Finally, the deal disrupts not just existing rules but the established process of reaching trade agreements. Instead of exchanging the carrot of market opening at home for the carrot of market opening abroad, it resorted to the stick of protection to induce enhanced access abroad. Therefore, even existing openness—which had previously been assured by multilateral legal bindings—can no longer be taken for granted.
Many of these risks can be averted if China chooses to multilateralize this bilateral agreement. One route is to implement the provisions unilaterally as far as possible on an MFN basis. The fact that China negotiated the current deal may be ground for skepticism about the likelihood of China implementing broad-based liberalization. However, the agreement itself may encourage greater reform. To the extent there are losses from trade diversion, there will be increased pressure for China to liberalize trade for all partners—to reduce the costly trade diversion and increase imports from the most efficient producers. These pressures are not just a theoretical possibility: evidence from Latin American trade agreements show that PTAs typically induce multilateral liberalization, and these effects tend to be stronger when preferences are granted to important suppliers (Estevadeordal et al., 2008).
Multilateral liberalization can be accomplished by implementing reforms in areas like services, intellectual property, and technology transfer that extend the benefits of the agreement to all trading partners. In some cases, as in the recognition of foreign standards and conformity assessment procedures in agriculture, multilateralization could be a challenge, but China could still strive to establish objective and transparent conditions of eligibility for recognition. In financial services, barriers to entry could be eliminated on an MFN basis and regulatory recognition extended on the basis of prudential considerations that do not discriminate between trading partners with like regulatory conditions. Realizing the quantitative targets may pose the most significant difficulty. As we have seen, the extent of multilateral liberalization needed is likely to be much greater than the required preferential access for the United States alone. Moreover, for a large country like China, the liberalization may involve giving up the freedom to impose “optimum tariffs” that exploit its market power. Nevertheless, the costs of any such “concession” are likely to be outweighed by the benefits of nondiscriminatory liberalization, as the simulations in this paper suggest.
A more ambitious route is for China to institutionally multilateralize its reforms by offering to legally bind them in the World Trade Organization. Such a “down payment” by China could dispel some of the skepticism about the possibility of achieving meaningful liberalization in the WTO context and may galvanize multilateral negotiations. Such a course could also make China’s obligations subject to an independent multilateral dispute resolution mechanism and may even help to revive this valuable function of the WTO. These developments would be in China’s interests as it emerges as a major trading nation. In this role, it will need the WTO as a means of anchoring its policies to reassure trading partners and also as a forum for negotiations without having to resort to costly bilateral negotiations, which create painful political frictions.
151
EAST ASIA AND PACIFIC IN THE TIME OF COVID-19
2. CHAPTER II. THE IMPACT OF THE CHINA-U.S. TRADE AGREEMENT
10158-EAP Economic Update_73177_Pt2-3.indd 15110158-EAP Economic Update_73177_Pt2-3.indd 151 4/1/20 2:09 PM4/1/20 2:09 PM
References
Amiti, M., S. J. Redding, and D. Weinstein. 2019. “The Impact of the 2018 Trade War on U.S. Prices and Welfare,” Journal of Economic Perspectives, 33 (4), 187–210.
Baldwin, R., and C. Wyplosz. 2004. The Economics of European Integration. McGraw Hill. Bhagwati, J. 1987. “vERs, Quid Pro Quo DFI and vIEs: Political-Economy-Theoretic Analyses.” International Economic
Journal, 1:1, 1–14.Blanchard, E. J., C. P. Bown, and D. Chor. 2019. “Did Trump’s Trade War Impact the 2018 Election?” NBER Working
Paper No. 26434.Bown, C. 2020a. “US-China Trade War Tariffs: An Up-to-Date Chart.” Peterson Institute for International Economics.Bown, C. 2020b. “Unappreciated hazards of the US-China phase one deal.” Peterson Institute for International Economics. Cali, M. 2020. “The trade impact of the US-China Trade Deal for Indonesia.” Unpublished manuscript. World Bank Group. Chowdhry, S., and G. Felbermayr. 2020a. “The US-China Trade Deal: How the EU and WTO lose from managed trade.”
Kiel Policy Brief 132, Kiel Institute for the World Economy.Chowdhry, S., and G. Felbermayr. 2020b. “The US-China trade deal and its impact on China’s key trading partners.” Kiel
Policy Brief 132, Kiel Institute for the World Economy.Ciuriak, D. 2020. “The US-China Trade Deal: Back of the Envelope Estimates of the Economic Impact.” Centre for
International Governance Innovation. Cohen, Mark. 2020. The Phase 1 IP Agreement: Its Fans and Discontents. China IPR, January 21, 2020. Retrieved from:
https://chinaipr.com/2020/01/21/the-phase-1-ip-agreement-its-fans-and-discontents/Constantinescu, C., A. Mattoo, M. Ruta, M. Maliszewska, and I. Osorio-Rodarte. 2019. Global Trade Watch 2018: Trade
Amid Tensions. World Bank Group.Estevadeordal, A., C. Freund, and E. Ornelas. 2008. “Does Regionalism Affect Trade Liberalization Towards Nonmembers?”
The Quarterly Journal of Economics, 123(4), 1531–1575.Fajgelbaum, P. D., P. K. Goldberg, P. J. Kennedy, and A. K. Khandelwal. 2020. “The Return to Protectionism,” The
Quarterly Journal of Economics, 135 (1), 1–55.Freund, C., M. J. Ferrantino, M. Maliszewska, and M. Ruta. 2018. “Impacts on Global Trade and Income of Current Trade
Disputes.” MTI practice note No. 2. World Bank Group. Handley, K., F. Kamal, and R. Monarch. 2020. “Rising Import Tariffs, Falling Export Growth: When Modern Supply Chains
Meet Old-Style Protectionism.” NBER Working Paper No. 26611.Hofmann, C., A. Osnago, and M. Ruta. 2019. The Content of Preferential Trade Agreements. World Trade Review, 18(3),
365–398.Irwin, C. 2017. Clashing over Commerce: A History of U.S. Trade Policy. University of Chicago Press. Irwin, D. 1994. Managed Trade: The Case against Import Targets. American Enterprise Institute. Washington D.C. Mattoo, A., N. Rocha, and M. Ruta. 2020. Handbook of Deep Trade Agreements. World Bank. Washington D.C.Suranovic, S. 2010. International Economics: Theory and Policy. Flat World Publisher.
152
EAST ASIA AND PACIFIC ECONOMIC UPDATE APRIL 2020
PART II. SLOWING GROWTH AND TRADE TENSIONS
10158-EAP Economic Update_73177_Pt2-3.indd 15210158-EAP Economic Update_73177_Pt2-3.indd 152 4/1/20 2:09 PM4/1/20 2:09 PM
Ann
ex T
able
II.2
.1. S
ubar
ea c
over
ed in
U.S
. pre
fere
ntia
l tra
de a
gree
men
ts o
n in
telle
ctua
l pro
pert
y an
d te
chno
logy
tran
sfer
Cate
gori
es/
Agre
emen
t
(1)
Ac
cess
ion/
rati
fica
tion
to
exi
stin
g in
tern
atio
nal
IP agreement(s)
(2)
Inco
rpor
atio
n of
exi
stin
g in
tern
atio
nal
IP agreements
(3)
N
atio
nal
trea
tmen
t(4
)
Exha
usti
on(5
)
Tran
spar
ency
(6)
Tr
adem
arks
(7)
G
eogr
aphi
cal
indi
cati
ons
(GIs
)
(8)
D
omai
n na
mes
/(9)
co
untr
y na
mes
(10)
Pa
tent
s
(11)
D
ata
prot
ecti
on/
prot
ecti
on
of
undi
sclo
sed
info
rmat
ion
(12)
In
dust
rial
de
sign
(13)
Co
pyri
ght
and
rela
ted
righ
ts
(14)
Bi
odiv
ersi
ty/
trad
itio
nal
know
ledg
e(1
5)
Enfo
rcem
ent
(16)
O
ther
(e.
g.,
coop
erat
ion)
(17)
Te
chno
logy
tr
ansf
er
(18)
Tr
ade
secr
ets
US-
Kore
a, R
ep.
1 0
1 0
1 1
1 1
1 1
0 1
0 1
0 0
0
US-
Colo
mbi
a 1
0 1
0 1
1 1
1 1
1 0
1 0
1 0
0 0
US-
Peru
1
0 1
0 1
1 1
1 1
1 0
1 0
1 0
0 0
US-
Pana
ma
1 0
1 0
1 1
1 1
1 1
0 1
0 1
0 0
0
US-
DR-
CAFT
A 1
0 1
0 1
11
1 1
1 0
1 0
1 1
0 0
US-
Om
an
1 0
1 0
1 1
1 1
1 1
0 1
0 1
0 0
0
US-
Bahr
ain
1 0
1 0
1 1
1 1
1 1
0 1
0 1
0 0
0
US-
Mor
occo
1
0 1
0 1
1 0
1 1
1 0
1 0
1 0
0 0
US-
Chile
1
0 1
0 1
1 1
1 1
1 0
1 0
1 0
0 0
US-
Aust
ralia
1
0 1
0 1
1 1
1 1
1 0
1 0
1 0
0 0
US-
Sing
apor
e 1
0 1
0 0
1 1
1 1
1 0
1 0
1 0
0 0
US-
Jord
an
1 1
1 0
0 1
1 0
1 0
0 1
0 1
0 0
0
USM
CA
1 1
1 1
1 1
1 1
1 1
1 1
1 1
1 0
1
US-
Chin
a 0
0 0
0 0
1*
1*
0 1
0 0
1*
0 1
1 1
1
Sour
ce: T
he W
orld
Ban
k da
taba
se o
n D
eep
Trad
e Ag
reem
ents
(Mat
too
et a
l., 2
020)
.N
ote:
1 in
dica
tes
cove
rage
; 0 n
o co
vera
ge. 1
* in
dica
tes
area
s in
Chi
na-U
.S. w
here
ther
e is
som
e co
vera
ge b
ut th
ere
is a
sig
nific
ant d
epar
ture
in te
rms
of c
onte
nt c
ompa
red
to o
ther
U.S
. pre
fere
ntia
l tra
de a
gree
men
ts.
153
EAST ASIA AND PACIFIC IN THE TIME OF COVID-19
2. CHAPTER II. THE IMPACT OF THE CHINA-U.S. TRADE AGREEMENT
10158-EAP Economic Update_73177_Pt2-3.indd 15310158-EAP Economic Update_73177_Pt2-3.indd 153 4/1/20 2:09 PM4/1/20 2:09 PM

Annex Table II.2.2. A managed trade deal imposed in the pre-trade war setting would have reduced welfare for all countries, except the United States
Managed trade imposed in 2018 as compared to the pre-trade war tariffs (percent)
Income Total exports Total imports
USA 0.08 0.24 0.19
CHN –0.04 0.20 0.21
EAP excl. China –0.03 –0.04 –0.04
SAR –0.01 –0.01 –0.01
Mexico 0.01 –0.02 –0.02
LAC –0.02 –0.05 –0.04
AFR –0.01 –0.02 –0.02
ECA –0.01 –0.02 –0.01
MENA (Egypt, Arab Rep.) –0.01 –0.02 –0.01
HICs –0.02 –0.04 –0.03
ROW –0.01 –0.03 –0.02
Global 0.00 0.03 0.03
World excluding USA and CHN –0.01 –0.03 –0.02
Source: Linkage model simulations.
Annex Table II.2.3. Impacts of the “multilateral liberalization” scenario as compared to the “trade war” scenario (percent)
Income Total exports Total imports
2020 2021 2020 2021 2020 2021
USA 0.67 0.72 2.98 3.03 2.40 2.49
CHN 0.68 0.52 32.05 32.87 34.55 35.52
EAP excluding China –0.27 –0.19 –0.72 –0.55 –0.39 –0.18
SAR –0.12 –0.05 0.06 0.14 0.19 0.28
Mexico –0.31 –0.35 –1.39 –1.56 –1.27 –1.45
LAC 0.70 0.85 2.42 2.61 1.97 2.29
AFR 0.45 0.59 1.09 1.22 0.98 1.16
ECA 0.24 0.23 0.17 0.12 0.50 0.47
MENA (Egypt, Arab Rep.) 0.02 0.06 –0.08 –0.11 0.04 0.03
HICs 0.94 0.96 2.15 2.36 2.53 2.60
ROW 0.55 0.67 0.64 0.77 0.83 0.98
Global 0.31 0.50 4.12 4.37 4.22 4.48
World excluding USA and CHN 0.38 0.43 0.39 0.44 0.67 0.73
Source: Linkage model simulations.
154
EAST ASIA AND PACIFIC ECONOMIC UPDATE APRIL 2020
PART II. SLOWING GROWTH AND TRADE TENSIONS
10158-EAP Economic Update_73177_Pt2-3.indd 15410158-EAP Economic Update_73177_Pt2-3.indd 154 4/1/20 2:09 PM4/1/20 2:09 PM
Anne
x Fi
gure
II.2
.9. C
hine
se im
port
s fr
om to
p su
pplie
rs o
f goo
ds a
nd s
ervi
ces
subj
ect t
o th
e Ch
ina-
U.S
. tra
de a
gree
men
t alo
ng w
ith th
e co
mm
itmen
ts u
nder
take
n by
Chi
na a
s pa
rt o
f the
ag
reem
ent
Pane
l A: M
anufacturing U
nite
d St
ates
Ger
man
y
Japa
n
Viet
nam
Uni
ted
Stat
es
Uni
ted
Stat
es
Fran
ce
Fran
ce
Uni
ted
Stat
es
Ger
man
y
Ger
man
y
Ger
man
y
Ger
man
y
Uni
ted
Stat
es
Japa
n
Japa
n
Japa
n
Japa
n
Kore
a, R
ep.
Kore
a, R
ep.
Kore
a, R
ep.
Kore
a, R
ep.
Indo
nesi
a
Taiw
an, C
hina
Mal
aysi
a
0 10
B20
B30
B40
B50
B60
B70
B80
B
U.S
. dol
lars
Com
mit
men
ts
90 B
100
B11
0 B
120
B13
0 B
140
B15
0 B
160
B
Man
ufac
ture
d go
ods
Sect
ors
Expo
rter
s
Indu
stri
al m
achi
nery
Airc
raft
(or
ders
and
deliv
erie
s)
Opt
ical
and
med
ical
inst
rum
ents
Phar
mac
euti
cal p
rodu
cts
Vehi
cles
Elec
tric
al e
quip
men
t an
dm
achi
nery
Iron
and
ste
el
Oth
er m
anuf
actu
red
good
s
Y201
7
1552. CHAPTER II. THE IMPACT OF THE CHINA-U.S. TRADE AGREEMENT
10158-EAP Economic Update_73177_Pt2-3.indd 15510158-EAP Economic Update_73177_Pt2-3.indd 155 4/1/20 2:09 PM4/1/20 2:09 PM
Pane
l B: Agriculture
Uni
ted
Stat
es
Uni
ted
Stat
es
Braz
il
Aust
ralia
Uni
ted
Stat
es
Uni
ted
Stat
es
Viet
nam
Aust
ralia
Russ
ian
Fede
rati
on
Uni
ted
Stat
es
Indi
a
Uni
ted
Stat
es
Aust
ralia
Aust
ralia
Braz
il
New
Zea
land
Cana
da
Arge
ntin
a
Uni
ted
Stat
es
0 5B
10 B
15 B
20 B
25 B
30 B
35 B
40 B
U.S
. dol
lars
Com
mit
men
ts
45 B
50 B
55 B
Agri
cult
ure
Sect
ors
Expo
rter
s
Oils
eeds
Cott
ons
Seaf
ood
Cere
als
Oth
er a
gric
ultu
reco
mm
odit
ies
Mea
t
Y201
7
156
EAST ASIA AND PACIFIC ECONOMIC UPDATE APRIL 2020
PART II. SLOWING GROWTH AND TRADE TENSIONS
10158-EAP Economic Update_73177_Pt2-3.indd 15610158-EAP Economic Update_73177_Pt2-3.indd 156 4/1/20 2:09 PM4/1/20 2:09 PM
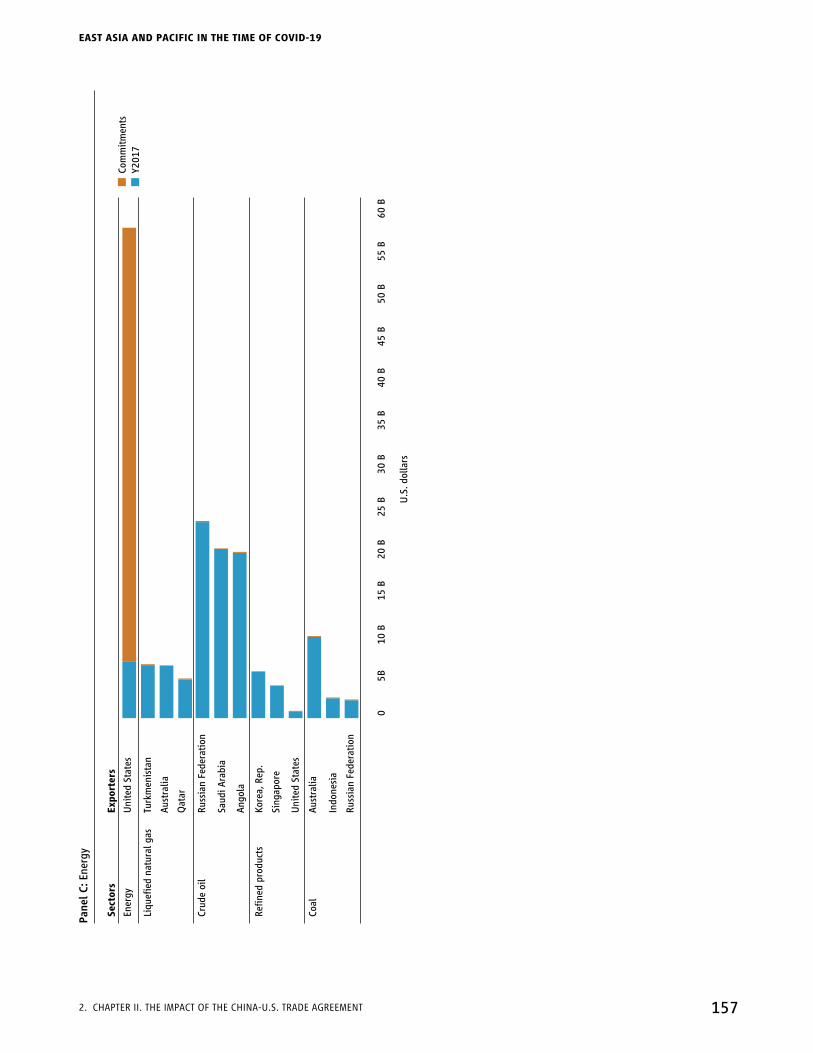
Pane
l C: Energy
Uni
ted
Stat
es
Aust
ralia
Turk
men
ista
n
Ango
la
Aust
ralia
Sing
apor
e
Uni
ted
Stat
es
Indo
nesi
a
Russ
ian
Fede
rati
on
Kore
a, R
ep.
Russ
ian
Fede
rati
on
Qat
ar
Saud
i Ara
bia
Com
mit
men
tsEn
ergy
Sect
ors
Expo
rter
s
Liqu
efied
nat
ural
gas
Coal
Refin
ed p
rodu
cts
Crud
e oi
l
0 5B
10 B
15 B
20 B
25 B
30 B
35 B
40 B
U.S
. dol
lars
45 B
50 B
60 B
55 B
Y201
7
157
EAST ASIA AND PACIFIC IN THE TIME OF COVID-19
2. CHAPTER II. THE IMPACT OF THE CHINA-U.S. TRADE AGREEMENT
10158-EAP Economic Update_73177_Pt2-3.indd 15710158-EAP Economic Update_73177_Pt2-3.indd 157 4/1/20 2:09 PM4/1/20 2:09 PM

Pane
l D: Services
Uni
ted
Stat
es
Japa
n
Uni
ted
Stat
es
Uni
ted
King
dom
Uni
ted
King
dom
Uni
ted
Stat
es
Kore
a, R
epub
lic o
f
Uni
ted
Stat
es
Ger
man
y
Japa
n
Uni
ted
Stat
es
Kore
a, R
epub
lic o
f
Japa
n
Com
mit
men
tsSe
rvic
es
Sect
ors
Expo
rter
s
Char
ges
for
use
of IP
Clou
d an
dre
late
d se
rvic
es
Fina
ncia
l ser
vice
s an
d in
sura
nce
Busi
ness
tra
vel
and
tour
ism
Ger
man
y
Japa
n
Uni
ted
Stat
esO
ther
ser
vice
s
0 10
B20
B30
B40
B50
B60
B70
B80
B
U.S
. dol
lars
90 B
100
B12
0 B
110
B13
0 B
Y201
7
Sour
ce: P
anel
s A,
B, C
, aut
hor’
s ca
lcul
atio
ns u
sing
dat
a fr
om C
hina
Cus
tom
s; P
anel
D, a
utho
r’s
calc
ulat
ion
usin
g da
ta fr
om W
TO.
Not
e: In
Pan
el D
, yea
r 20
16 is
the
late
st y
ear
avai
labl
e fo
r bi
late
ral s
ervi
ces
trad
e da
ta b
y se
ctor
s.
158
EAST ASIA AND PACIFIC ECONOMIC UPDATE APRIL 2020
PART II. SLOWING GROWTH AND TRADE TENSIONS
10158-EAP Economic Update_73177_Pt2-3.indd 15810158-EAP Economic Update_73177_Pt2-3.indd 158 4/1/20 2:09 PM4/1/20 2:09 PM