Embed Size (px)
Citation preview
8/8/2019 2. Chapter 2 - Example Applications _a4
http://slidepdf.com/reader/full/2-chapter-2-example-applications-a4 1/11
Chapter 2 Example Applications______________________________________________
14
CHAPTER 2
EXAMPLE APPLICATIONS
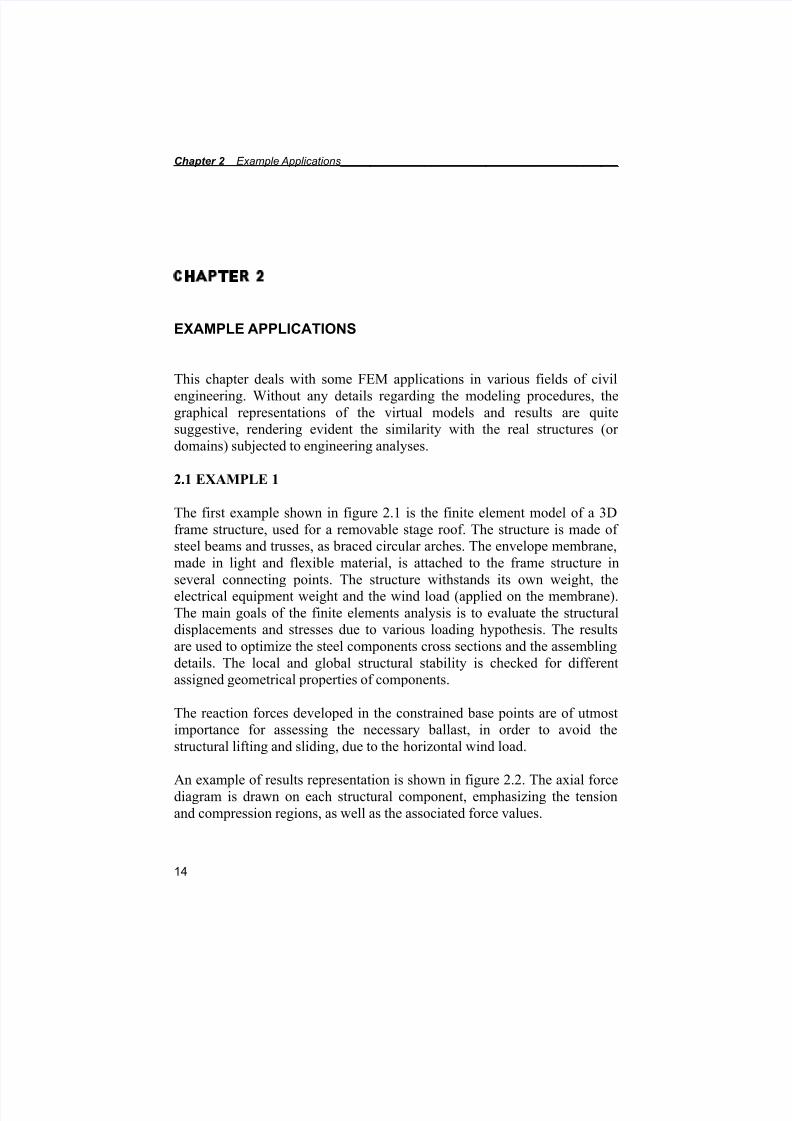
This chapter deals with some FEM applications in various fields of civil
engineering. Without any details regarding the modeling procedures, thegraphical representations of the virtual models and results are quite
suggestive, rendering evident the similarity with the real structures (or
domains) subjected to engineering analyses.
2.1 EXAMPLE 1
The first example shown in figure 2.1 is the finite element model of a 3D
frame structure, used for a removable stage roof. The structure is made of
steel beams and trusses, as braced circular arches. The envelope membrane,
made in light and flexible material, is attached to the frame structure in
several connecting points. The structure withstands its own weight, the
electrical equipment weight and the wind load (applied on the membrane).
The main goals of the finite elements analysis is to evaluate the structural
displacements and stresses due to various loading hypothesis. The results
are used to optimize the steel components cross sections and the assembling
details. The local and global structural stability is checked for different
assigned geometrical properties of components.
The reaction forces developed in the constrained base points are of utmost
importance for assessing the necessary ballast, in order to avoid the
structural lifting and sliding, due to the horizontal wind load.
An example of results representation is shown in figure 2.2. The axial forcediagram is drawn on each structural component, emphasizing the tension
and compression regions, as well as the associated force values.

8/8/2019 2. Chapter 2 - Example Applications _a4
http://slidepdf.com/reader/full/2-chapter-2-example-applications-a4 2/11
______________________Basics of the Finite Element Method Applied in Civil Engineering
15
Fig. 2.1 Three dimensional finite element model for removable stage roof
Fig. 2.2 Axial force diagrams due to gravity and transversal wind load (N)

8/8/2019 2. Chapter 2 - Example Applications _a4
http://slidepdf.com/reader/full/2-chapter-2-example-applications-a4 3/11
Chapter 2 Example Applications______________________________________________
16
2.2 EXAMPLE 2
The second example refers to a dam-foundation interaction analysis, in the
design process of a gravity dam. The stress distribution over the dam body
and the structural stability is related to the dam’s cross section. The contact
stresses between the dam and the foundation layer are also significant for
design and in direct relationship with the dam’s geometry. As a massive
structure, the 3D effects should be taken into account.
Thus, the 3D model shown in figure 2.3 includes two main components: the
dam body, divided into separate blocks by joints with potential relative
movement, and the surrounding rock mass, following the geometry of the
valley. The different material properties of the dam body and the rock massare accordingly assigned.
Fig. 2.3 Three dimensional finite element model of a gravity dam and its
foundation rock mass
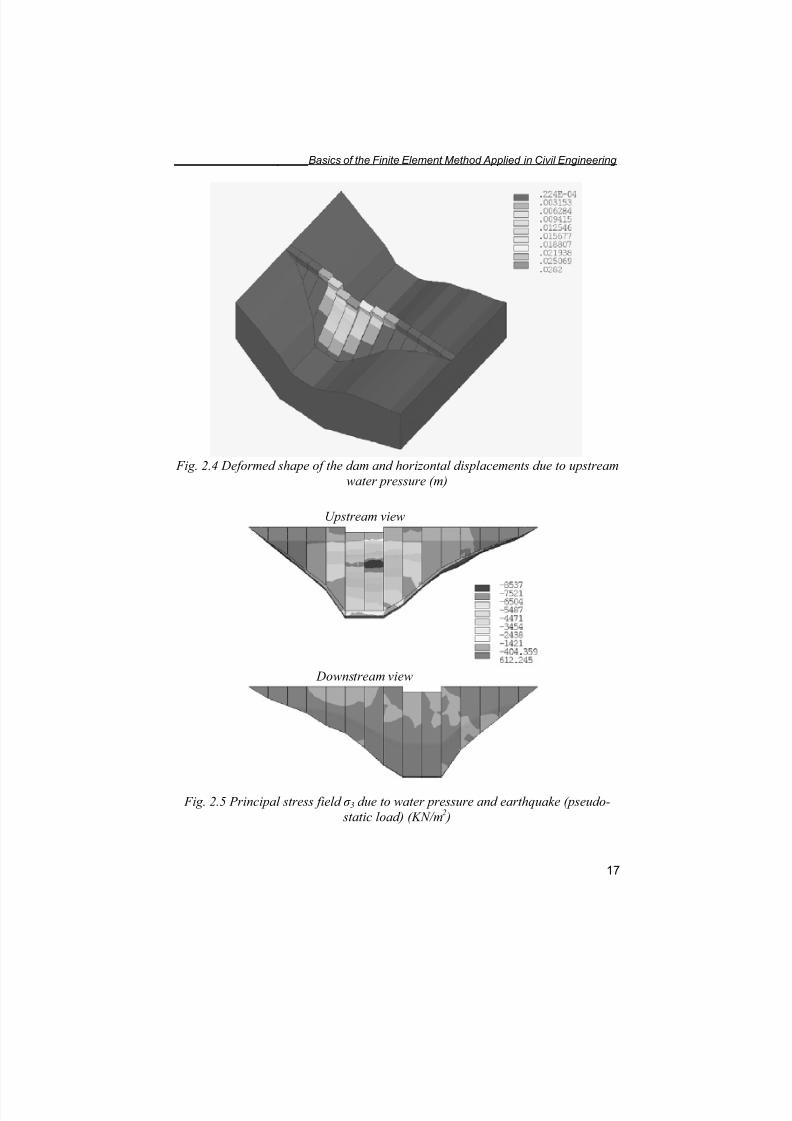
In figure 2.4 the horizontal displacement distribution is shown over the
deformed shape of the structure, due to water pressure applied on theupstream face of the dam. The displacement scale is larger then the
geometrical representation scale, in order to emphasize the joints behavior.
8/8/2019 2. Chapter 2 - Example Applications _a4
http://slidepdf.com/reader/full/2-chapter-2-example-applications-a4 4/11
______________________Basics of the Finite Element Method Applied in Civil Engineering
17
Fig. 2.4 Deformed shape of the dam and horizontal displacements due to upstream
water pressure (m)
Fig. 2.5 Principal stress field σ 3 due to water pressure and earthquake (pseudo-
static load) (KN/m2 )
Upstream view
Downstream view

8/8/2019 2. Chapter 2 - Example Applications _a4
http://slidepdf.com/reader/full/2-chapter-2-example-applications-a4 5/11
Chapter 2 Example Applications______________________________________________
18
The principal compression stress distribution σ 3 is represented on bothupstream and downstream faces of the dam in figure 2.5. These results are
the consequence of inertia loads due to the dam’s own mass and the
dynamic water pressure applied during an upstream-downstream
earthquake.
Internal stresses can be represented using cross sections throughout the
finite element model. The main cross section corresponding to block no. 9
(figure 2.6) shows the detail of the drainage outlet gallery. The figures in
the legend besides the drawing are values of the vertical stress σ z calculated
in the horizontal loading hypothesis (neglecting gravity loads). The span
between the minimum and maximum values is divided into 9 equal
intervals, each corresponding to a different color over the cross section.Sometimes, local extreme or abnormal values may be ignored after a careful
understanding of the discrete solution.
Fig. 2.6 Vertical stress field distribution σ z due to water pressure and earthquake
(pseudo-static load (KN/m2 )
2.3 EXAMPLE 3
Another type of analysis refers to seepage phenomena and water discharge
assessment, related to hydraulic structures. The results of such analyses mayexplain an unusual loss of reservoir storage and also suggest the best water
tightening solutions. The uplift pressures acting on the bottom of quasi
8/8/2019 2. Chapter 2 - Example Applications _a4
http://slidepdf.com/reader/full/2-chapter-2-example-applications-a4 6/11
______________________Basics of the Finite Element Method Applied in Civil Engineering
19
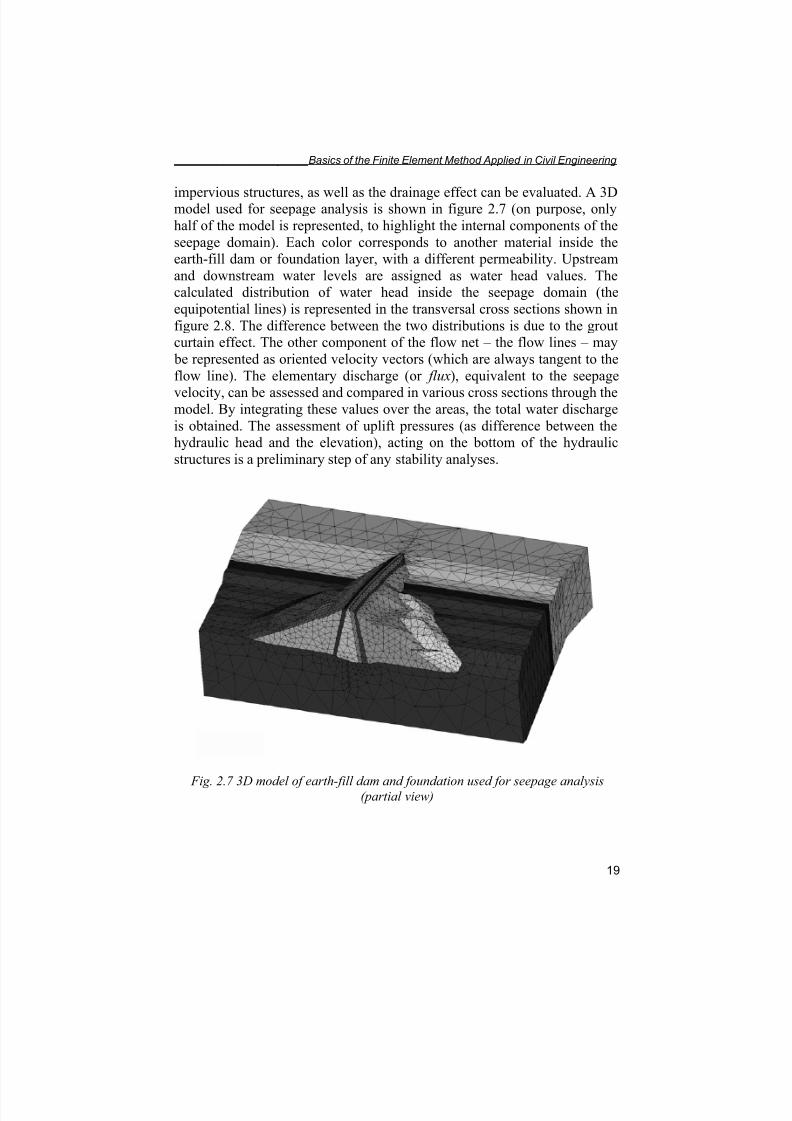
impervious structures, as well as the drainage effect can be evaluated. A 3Dmodel used for seepage analysis is shown in figure 2.7 (on purpose, only
half of the model is represented, to highlight the internal components of the
seepage domain). Each color corresponds to another material inside the
earth-fill dam or foundation layer, with a different permeability. Upstream
and downstream water levels are assigned as water head values. The
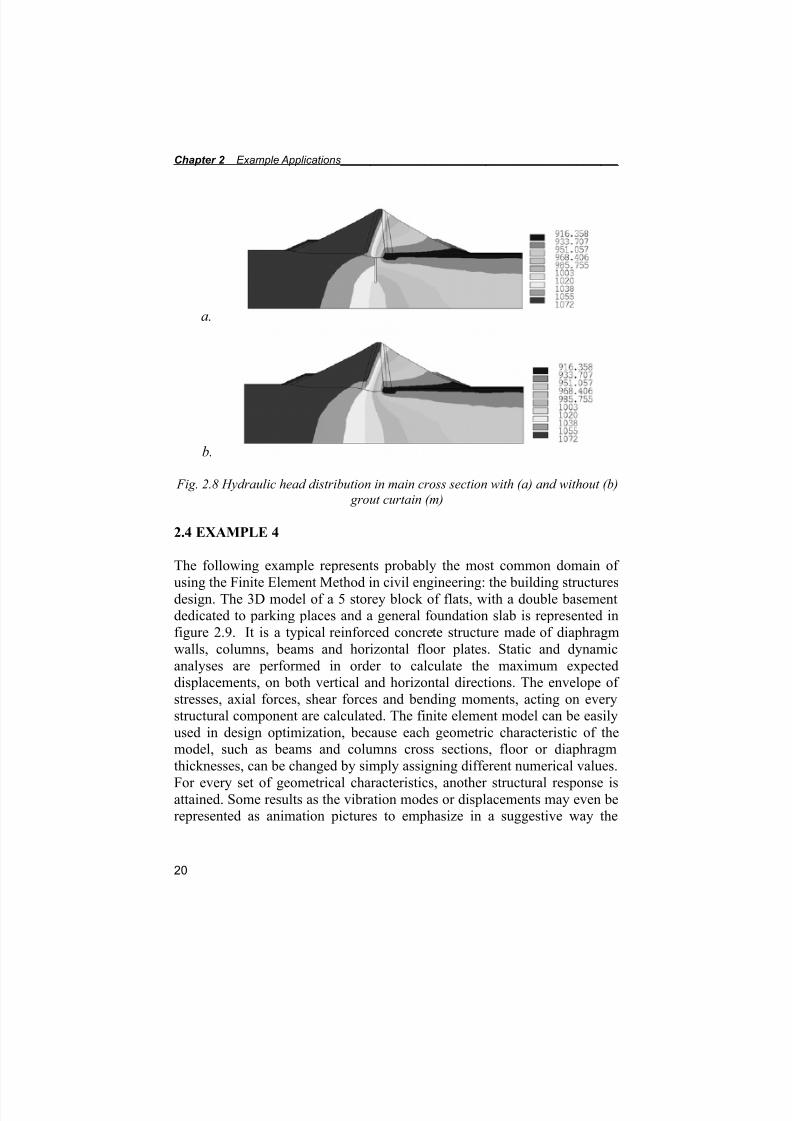
calculated distribution of water head inside the seepage domain (the
equipotential lines) is represented in the transversal cross sections shown in
figure 2.8. The difference between the two distributions is due to the grout
curtain effect. The other component of the flow net – the flow lines – may
be represented as oriented velocity vectors (which are always tangent to the
flow line). The elementary discharge (or flux), equivalent to the seepage
velocity, can be assessed and compared in various cross sections through themodel. By integrating these values over the areas, the total water discharge
is obtained. The assessment of uplift pressures (as difference between the
hydraulic head and the elevation), acting on the bottom of the hydraulic
structures is a preliminary step of any stability analyses.
Fig. 2.7 3D model of earth-fill dam and foundation used for seepage analysis(partial view)
8/8/2019 2. Chapter 2 - Example Applications _a4
http://slidepdf.com/reader/full/2-chapter-2-example-applications-a4 7/11
Chapter 2 Example Applications______________________________________________
20
a.
b.
Fig. 2.8 Hydraulic head distribution in main cross section with (a) and without (b)
grout curtain (m)
2.4 EXAMPLE 4
The following example represents probably the most common domain of
using the Finite Element Method in civil engineering: the building structuresdesign. The 3D model of a 5 storey block of flats, with a double basement
dedicated to parking places and a general foundation slab is represented in
figure 2.9. It is a typical reinforced concrete structure made of diaphragm
walls, columns, beams and horizontal floor plates. Static and dynamic
analyses are performed in order to calculate the maximum expected
displacements, on both vertical and horizontal directions. The envelope of
stresses, axial forces, shear forces and bending moments, acting on every
structural component are calculated. The finite element model can be easily
used in design optimization, because each geometric characteristic of the
model, such as beams and columns cross sections, floor or diaphragm
thicknesses, can be changed by simply assigning different numerical values.
For every set of geometrical characteristics, another structural response isattained. Some results as the vibration modes or displacements may even be
represented as animation pictures to emphasize in a suggestive way the

8/8/2019 2. Chapter 2 - Example Applications _a4
http://slidepdf.com/reader/full/2-chapter-2-example-applications-a4 8/11
______________________Basics of the Finite Element Method Applied in Civil Engineering
21
structural behavior. As examples of graphical representation, thelongitudinal (a) and transversal (b) displacements are shown in plan view in
figure 2.10. Both horizontal displacements are shown on the deformed
shape of the structure.
Fig. 2.9 3D model of a 5 storey building, double basement and foundation slab.Structural analysis.
a. b.
Fig. 2.10 Top view of lateral displacements due to seismic load (pseudo-static
analysis) applied on: (a) longitudinal direction; b) transversal direction (m).
8/8/2019 2. Chapter 2 - Example Applications _a4
http://slidepdf.com/reader/full/2-chapter-2-example-applications-a4 9/11
Chapter 2 Example Applications______________________________________________
22
2.5 EXAMPLE 5
The interaction between structural components and the surrounding rock or
earth mass is typical for underground structures, such as motorway, railroad
or hydraulic tunnels. The FEM represents an ideal tool for modeling the
excavation process, the stress and displacement field evolution inside the
rock mass and the tunnel lining for various loading hypotheses. The virtual
models are useful for design optimization, regarding the shape of the cross
section and the lining thickness. No other procedure allows taking into
consideration the rock mass heterogeneity, with its unsymmetrical effects
over the sustaining structure. Additionally, time-dependent response
dictated by the rheological properties of the ground may also be considered.
Modeling the initial stressing effects due to the anchorage system is also possible.
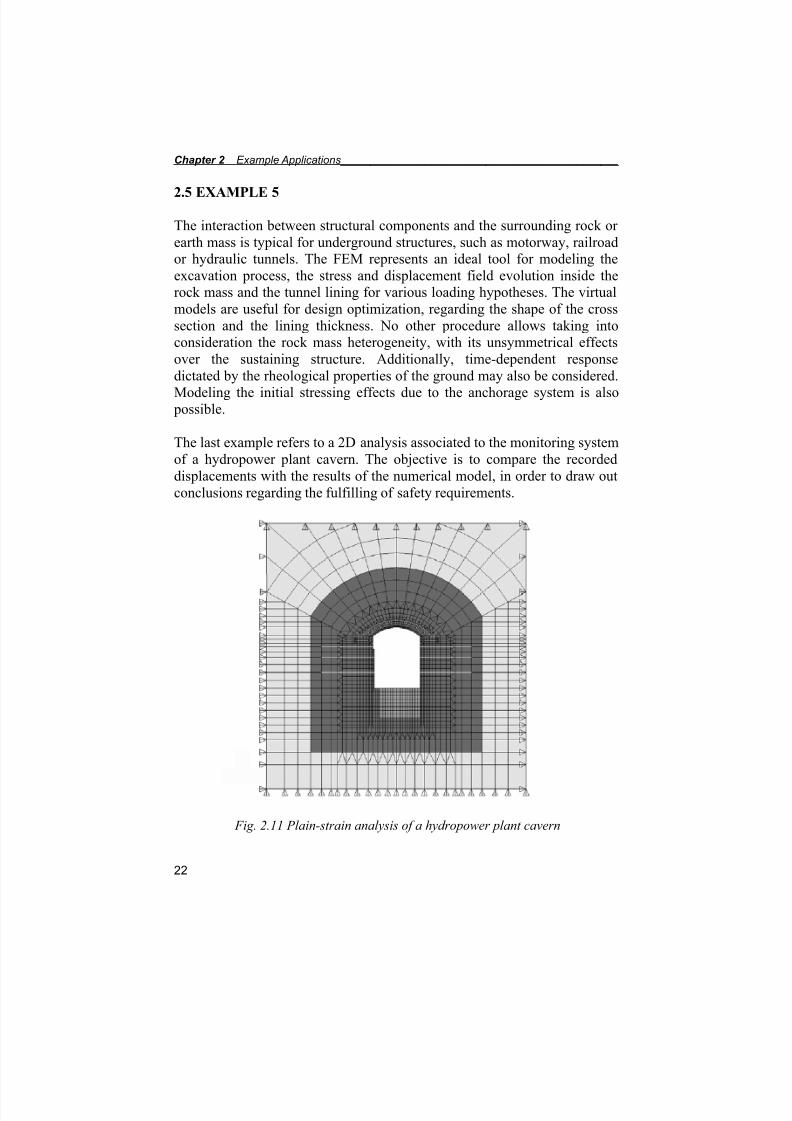
The last example refers to a 2D analysis associated to the monitoring system
of a hydropower plant cavern. The objective is to compare the recorded
displacements with the results of the numerical model, in order to draw out
conclusions regarding the fulfilling of safety requirements.
Fig. 2.11 Plain-strain analysis of a hydropower plant cavern

8/8/2019 2. Chapter 2 - Example Applications _a4
http://slidepdf.com/reader/full/2-chapter-2-example-applications-a4 10/11
______________________Basics of the Finite Element Method Applied in Civil Engineering
23
The 2D finite element model is represented in figure 2.11. The variousmaterial properties distribution is emphasized by different shadings. The
boundary condition symbols are represented around the contour of the
model. The horizontal pre-stressed anchors are also noticeable.
Fig. 2.12 Horizontal displacements due to the pre-stressed anchorage system (m)
Fig. 2.13 Initial horizontal stress distribution due to the anchorage system (KN/m2 )

8/8/2019 2. Chapter 2 - Example Applications _a4
http://slidepdf.com/reader/full/2-chapter-2-example-applications-a4 11/11
Chapter 2 Example Applications______________________________________________
24
The analysis objective is to determine the displacements of the concretevault, starting with the initial service conditions, by combining various
loading hypotheses due to rock mass relaxation, payload, rock failure zones,
thermal field, etc.
Some results concerning the peculiar load step assigned to the anchorage
system effect are represented in figures 2.12 and 2.13. Both horizontal
displacements and stresses are relative values, obtained for this load
combination only. In the results processing phase, they should be added to
the outcomes of other loading hypotheses, in order to draw out the envelope
of diverse effects.