Embed Size (px)
Citation preview

International Journal of Mechanical Engineering and Technology (IJMET), ISSN 0976
– 6340(Print), ISSN 0976 – 6359(Online) Volume 3, Issue 3, Sep- Dec (2012) © IAEME
7
ANALYSIS OF CUSTOMER SATISFACTION USING QUALITY
FUNCTION DEPLOYMENT
Parul Gupta
a , R.K. Srivastava
b
aAssociate Professor, Department of Mechanical Engineering,
Moradabad Institute of Technology, Moradabad-244001,Uttar Pradesh,India b
Professor, Motilal Nehru National Institute of Technology, Allahabad,
E-mail: [email protected], E-mail: [email protected]
ABSTRACT
QFD is a tool that bridges the distance between an organization and its customers. To accomplish that
goal it is important to know the customer’s needs or requirements (Customer Voice) so that they can
be involved from the early phases of the planning process. This implies implementing technological
solutions by specialists (Technician Voice) to determine the customer’s requirements.
QFD provides many benefits for an organization during product development. The most important of
these benefits are a strong focus on the customer, improved communication, and better teamwork
across the organization. This paper present three modified quality function deployment model and
illustrative examples
Keywords:- Customer Satisfaction, Kano Model, Quality function deployment (QFD), House of
Quality, Customer Satisfaction.
I. INTRODUCTION
Quality function deployment (QFD) is defined by Cecilia Temponi, John Yen and W.Amos
Tiao as “a multiattribute measurement method that brings together major components of an
organization and the complex task of capturing customer’s expectations and ultimately delivering
customer satisfaction”.
Quality function deployment is a customer driven tool in implementing total quality
management. Among lots of TQM methods, QFD has been used to translate customer needs and
wants into technical design requirements by integrating marketing, design engineering,
manufacturing, and other relevant functions of an organization.(Akao, 1990)
As an approach to design, QFD is a concept that Akao introduced in Japan in 1966. It was first put
into use at Mitsubishi’s Kobe shipyard site in 1972,and then Toyota and its suppliers developed it
further for a rust prevention study. After the concept of QFD was introduced in the US by King in
1983, many US firms, such as Procter&Gamble, Raychem, Digital Equipment, Hewlett-Packard,
AT&T, ITT, GM and Ford applied QFD to improving communication, product development, and
measurement of processes and systems (Park,1998).
Customer satisfaction has been a matter of concern to most of the companies. Satisfaction
ratings are being used as an indicator of the performance of services and products and help to form
INTERNATIONAL JOURNAL OF MECHANICAL ENGINEERING AND TECHNOLOGY (IJMET)
ISSN 0976 – 6340 (Print)
ISSN 0976 – 6359 (Online)
Volume 3, Issue 3, Septmebr - December (2012), pp. 07-21
© IAEME: www.iaeme.com/ijmet.html
Journal Impact Factor (2012): 3.8071 (Calculated by GISI)
www.jifactor.com
IJMET
© I A E M E

International Journal of Mechanical Engineering and Technology (IJMET), ISSN 0976
– 6340(Print), ISSN 0976 – 6359(Online) Volume 3, Issue 3, Sep- Dec (2012) © IAEME
8
ulate strategies of the companies. Hanan and Karp have stated that “Customer satisfaction is the
ultimate objective of every business: not to supply, not to sell, not to service, but to satisfy the needs
that drive customers to do business.” Market success of a product is also important from the
environment point of view, since a product which is not sold, becomes the most useless product from
both economical and environmental point of view. It has environmental impacts without having any
value for the customer .
II.QFD PROCESS
QFD employs several matrices to clearly establish relationships between company functions
and customer satisfaction. These matrices are based on the ``what-how'' matrix, which is called HOQ.
QFD is an iterative process performed by a multifunctional team. The team will use the matrices to
translate customer needs to process step specifications. The matrices explicitly relate the data
produced in one stage of the process to the decisions that must be made at the next process stage.
Product planning is the first matrix. Customers’ desires, in customers' own words (whats), are
determined and translated into technical description (hows) or proposed performance characteristics
of the product. The second QFD matrix relates potential product features to the delivery of
performance characteristics. Process characteristics and production requirements are related to
engineering and marketing characteristics with the third and fourth matrices. (Temponi,1998)
Figure 1- Quality Function Deployment Process
III.HOUSE OF QUALITY’S GENERAL DESCRIPTION AND PROCESS
House of Quality, introduced by Hauser and Clausing, is the most commonly used matrix in
traditional QFD methodology in order to translate the desires of customers into product design or
engineering characteristics and subsequently into product characteristics, process plans and
production requirements. The house of quality is applied for identifying customer requirements and
establishing priorities of design requirements to satisfy CRs. The aim is providing right products for
the right customers.
The house is made up of three main parts: the customer attributes or customer requirements
(horizontal section); engineering characteristics or design requirements (vertical section) and the
center of the house.

International Journal of Mechanical Engineering and Technology (IJMET), ISSN 0976
– 6340(Print), ISSN 0976 – 6359(Online) Volume 3, Issue 3, Sep- Dec (2012) © IAEME
9
Figure 2- A typical HOQ matrix with a 1-3-9 rating scheme
Customer requirements section indicates “the voice of customers”. It shows the requirement of
the customers and what they think is important in the product and also relative importance of the
different customer attributes. Design requirements section records the technical aspects of designing a
product. It indicates, “How the customer wants can be met”. The objectives and targets section
(basement of the house) indicates the relative importance of the different engineering characteristics
and also indicates target levels or measures of effectiveness for each. The roof of the house indicates
the positive and negative relationships between the design requirements. (Hauser and Clausing,
1988).The center of the house describes the correlation between the design requirements and the
customer attributes. The strength and direction of each relationship is represented by a graphical
symbol creating a matrix of symbols indicating how well each engineering characteristic meets each
customer attribute (Hauser and Clausing, 1988).
In conventional QFD applications, a cell (i, j) in the relationship matrix of HOQ( i.e., ith row
and jth column of HOQ) is assigned 1, 3, 9 (or 1, 5, 9) to represent a weak, medium, or strong
relationship between ith CR (called Cri) and jth DR called DRj) , respectively. The absolute and
relative importance of DRs are computed using the relative importance of CRs and the relationship
ratings (i.e., 1–3–9 or 1–5–9) . For each DR, the absolute importance rating is computed as:
∑=
=
m
i
ijij RWAI1
where AIj =absolute technical importance rating of DRj, j=1, . . . ,n, Wi =degree of importance
(i.e.,importance weight) of CRi , i=1, . . . ,m, Rij =relationship rating representing the strength of the
relationship between CRi and DRj.
The absolute importance rating can then be transformed into the relative importance rating, RIj
is shown as
∑=
=n
k
k
j
j
AI
AIRI
1

International Journal of Mechanical Engineering and Technology (IJMET), ISSN 0976
– 6340(Print), ISSN 0976 – 6359(Online) Volume 3, Issue 3, Sep- Dec (2012) © IAEME
10
The larger the RIj, the more important is DRj. Thus without consideration of any other
constraints (e.g., cost and time), DRs should be incorporated into the product of interest in the order of
their relative importance rating to achieve more customer satisfaction.
IV. THREE EXTENSIONS OF QFD
QFD provides many benefits for an organization during product development. The most
important of these benefits are a strong focus on the customer, improved communication, and better
teamwork across the organization (Bossert, 1991). The process of linking houses together especially
benefits the development process by maintaining the "voice of the customer" throughout the entire
process, establishing clear relationships between multiple groups, and providing a means for
incorporating more and more levels of detail into the process (Hauser and Clausing, 1988).
Besides these advantages many researchers express some deficiencies and disabilities of QFD
in product development stage. Researcher has generally focused on potential lacks of QFD and HOQ
and some of them describe possible alternatives to overcome these problems. Next sections in this
paper present three modified quality function deployment model and illustrative examples.
1. A new integrative decision model for prioritizing design requirements
The conventional HOQ employs a rating scale (e.g. 1-3-9,1-3-5 or 1-5-9) to indicate the degree
of strength between (weak-medium-strong) customer requirements and design requirements.
Although conventional HOQ approach, presented by Hauser and Clausing, it is easy to understand
and use, there are several methodological issues associated with it, namely;
• Determination of the degree of importance of CRS
• Assignment of the relationship ratings between CRs and DRs,
• Adjustment of the relationship ratings between CRs and DRs, called normalization, in order
to insure a more meaningful representation of the DR priorities
• Incorporation of the correlations between DRs to a decision process for determining
appropriate DRs
• Consideration of cost trade-offs among DRs.
Some research has been done to resolve these methodological issues. Lu and Armacost applied
the Analytical Hierarchy Process (AHP) to determine the degree of importance of CRs. Wasserman
presented a linear integer programming model for maximizing customer satisfaction subject to a cost
constraint with a linear function and a procedure for normalizing the relationship ratings between CRs
and DRs. However, Taeho Park and Kwang-Jae Kim thought that main problem is the usage of
conventional rating scheme. Therefore, they realized the necessity of development of a better
relationship rating scheme between CRs and DRs and integration of the correlations between DRs to a
decision model for determining appropriate DRs to satisfy CRs.
Taeho Park and Kwang-Jae Kim state three problems of conventional rating scheme.
1. Choice of rating scale is very subjective and there are no scientific bases for any of the
choices.
2. The conventional relationship rating scheme primarily shows ordinal ranks of relationship
between CRs and DRs rather than a continuum of rating values indicating a sliding scale of
relationship strength. As a result, the absolute importance ratings of DRs in the conventional HOQ
present ordinal importance ranks of DRs in their contribution to customer satisfaction rather than
more meaningfully, showing the differences of DRs in contributing to customer satisfaction in their
magnitude.

International Journal of Mechanical Engineering and Technology (IJMET), ISSN 0976
– 6340(Print), ISSN 0976 – 6359(Online) Volume 3, Issue 3, Sep- Dec (2012) © IAEME
11
3. The information of correlations between DRs was not used in calculating priorities of the
DRs and determining appropriate DRs for a design problem. It is necessary to devise a mechanism for
accommodating the dependencies of DRs in calculating importance ratings of DRs, and to incorporate
the correlation between DRs into the decision process of determining appropriate DRs subject to some
organizational constraints, such as cost and time. For example, when two DRs with a high correlation
are selected at the same time, there may be cost savings in installing them in a product.
In order to overcome these problems, Park and Kim presented a modified HOQ model to
determine an optimal set of DRs. Park and Kim integrates two aspects into Wassermann’s QFD
planning process and Lu’s integrative HOQ model: (1) Employing a new rating scheme for the
relationship between CRs and DRs, using a most commonly used multi-attribute decision method
(swing method). (2) Considering correlation between DRs for selecting an optimal set of DRs. Phases
of the new integrative HOQ model of Taeho Park and Kwang-Jae Kim are shown below:
Figure 3- Phases of new integrative HOQ model
In phase 1, the swing method,which is a part of the SMART (Simple Multi-Attribute Rating
Technique) is used by Park and Kim to obtain the relationship ratings between CRs and DRs.
A detailed step-by-step procedure for assessing the relationship between 2CR and DRs of HOQ
using the swing method is illustrated below. It is presumed that 1DR , 2DR and 4DR have important
effects on the customer satisfaction of 2CR , whereas 3DR is not related to 2CR as manifested by the
symbols recorded in the second row of the chart.
Step 1: Show the design team two alternatives: one leads to the worst consequence with respect
to 2CR ( i.e., 0421 === DRDRDR ) , and the other one leads to the best design condition (i.e., DR
1421 === DRDRDR ).
International Journal of Mechanical Engineering and Technology (IJMET), ISSN 0976
– 6340(Print), ISSN 0976 – 6359(Online) Volume 3, Issue 3, Sep- Dec (2012) © IAEME
12
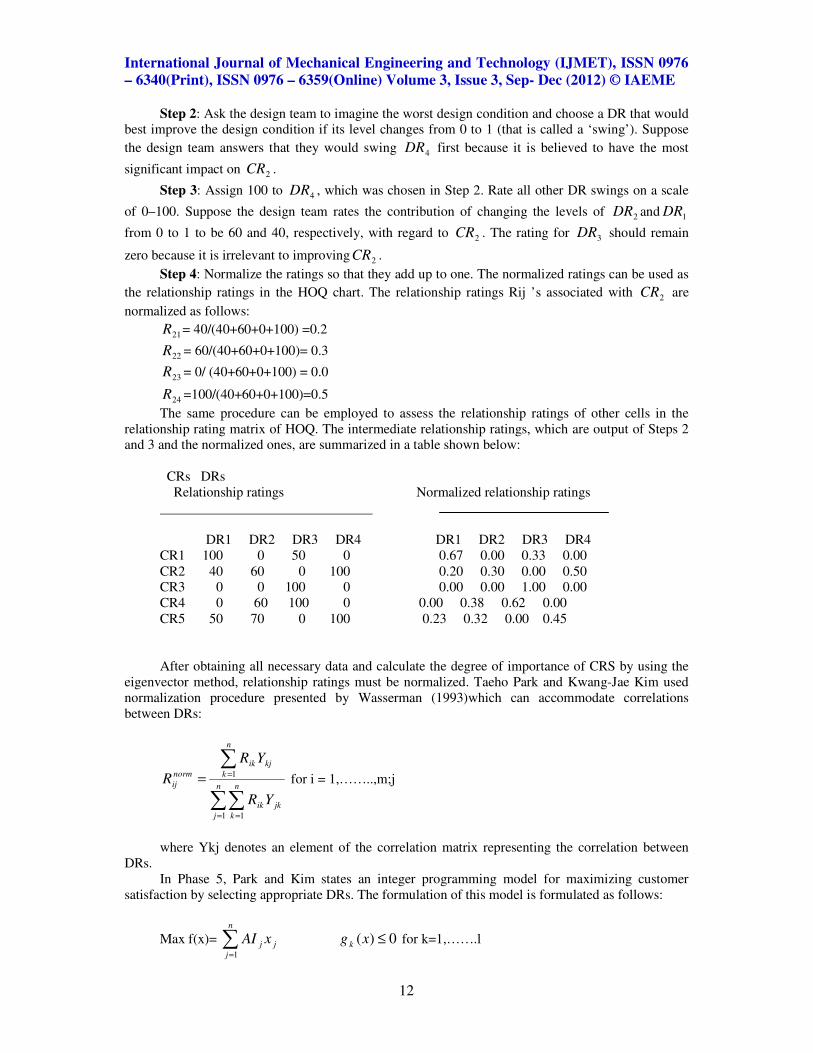
Step 2: Ask the design team to imagine the worst design condition and choose a DR that would
best improve the design condition if its level changes from 0 to 1 (that is called a ‘swing’). Suppose
the design team answers that they would swing 4DR first because it is believed to have the most
significant impact on 2CR .
Step 3: Assign 100 to 4DR , which was chosen in Step 2. Rate all other DR swings on a scale
of 0–100. Suppose the design team rates the contribution of changing the levels of 2DR and 1DR
from 0 to 1 to be 60 and 40, respectively, with regard to 2CR . The rating for 3DR should remain
zero because it is irrelevant to improving 2CR .
Step 4: Normalize the ratings so that they add up to one. The normalized ratings can be used as
the relationship ratings in the HOQ chart. The relationship ratings Rij ’s associated with 2CR are
normalized as follows:
21R = 40/(40+60+0+100) =0.2
22R = 60/(40+60+0+100)= 0.3
23R = 0/ (40+60+0+100) = 0.0
24R =100/(40+60+0+100)=0.5
The same procedure can be employed to assess the relationship ratings of other cells in the
relationship rating matrix of HOQ. The intermediate relationship ratings, which are output of Steps 2
and 3 and the normalized ones, are summarized in a table shown below:
CRs DRs
Relationship ratings Normalized relationship ratings
DR1 DR2 DR3 DR4 DR1 DR2 DR3 DR4
CR1 100 0 50 0 0.67 0.00 0.33 0.00
CR2 40 60 0 100 0.20 0.30 0.00 0.50
CR3 0 0 100 0 0.00 0.00 1.00 0.00
CR4 0 60 100 0 0.00 0.38 0.62 0.00
CR5 50 70 0 100 0.23 0.32 0.00 0.45
After obtaining all necessary data and calculate the degree of importance of CRS by using the
eigenvector method, relationship ratings must be normalized. Taeho Park and Kwang-Jae Kim used
normalization procedure presented by Wasserman (1993)which can accommodate correlations
between DRs:
∑∑
∑
= =
=
=n
j
n
k
jkik
n
k
kjik
norm
ij
YR
YR
R
1 1
1 for i = 1,……..,m;j
where Ykj denotes an element of the correlation matrix representing the correlation between
DRs.
In Phase 5, Park and Kim states an integer programming model for maximizing customer
satisfaction by selecting appropriate DRs. The formulation of this model is formulated as follows:
Max f(x)= ∑=
n
j
jj xAI1
0)( ≤xg k for k=1,…….l

International Journal of Mechanical Engineering and Technology (IJMET), ISSN 0976
– 6340(Print), ISSN 0976 – 6359(Online) Volume 3, Issue 3, Sep- Dec (2012) © IAEME
13
where =jAI absolute technical importance rating of jDR , jx =0–1 decision variable for jDR
(i.e., if jDR is selected, 1=jx . Otherwise, it is 0), x=a decision variable vector, }{ jx , j=1, . . . ,n,
kg (x)=kth organizational resource constraint, l=number of organizational resource
constraints(Park,1997).
The objective function of this formula is to maximize a total absolute technical importance
rating from selected DRs, which represents the magnitude of customer satisfaction. When selecting
DRs to implement, the conventional QFD doesn’t take into account trade-offs between the amount of
customer satisfaction achieved from the selected DRs and the use of organizational resources, such as
cost and time.
King and Wasserman developed simple linear cost constraint function which for g(x) to select
the most appropriate DRs under a limitation of a given target cost. Function called as ‘Knapsack’
problem approach is illustrated as follows:
0.....)( 11 ≤−++= Bxcxcxg nn
This means that DRs should be selected in a decreasing order of the technical importance
rating/cost ratios until the total cost of selected DRs doesn’t exceed the limited repair budget.
Park and Kim state that in the case where correlations exist among some DRs, some savings in
resource consumption are most likely expected when two or more correlated DRs are simultaneously
installed into a product or service design. Since most practical QFD problems, as Wasserman 1993
addressed, involve some degree of dependencies among DRs, they think it is more appropriate to
express the g(x) function in a quadratic form such that
Bxxsxcxg ji
n
j
n
i
n
j
ijjj −−=∑ ∑∑= = >1 1 1
)(
where ijs is saving of resource (e.g., cost) usage associated with simultaneous
implementation of ith and jth DRs.
Case study: Application to building indoor air quality improvement
Taeho Park and Kwang-Jae Kim has been applied proposed decision model to an indoor air
quality improvement problem as an illustrative example.
After a study conducted in 2012 problems caused by poor indoor air quality identified as
follows: (1) stuffiness, (2) temperature, (3) dust particles, (4) ventilation, (5) odors, (6) housekeeping,
and (7) flies. Then a customer study was conducted using a pair wise comparison method in the AHP
data collection process. Since a group of secretaries working daily in the BT building participated in
the survey, a geometric mean which is an 8th root of the product of judgments provided by eight
individuals was used to combine group judgments. Following table shows the results.
Temperature Dust Ventilation Odors House Flies
Stuffiness 1.0 2.7 2.2 1.1 1.1 2.4
Temperature 3.5 1.2 1.2 1.6 1.2
Dust Particles 0.82 0.54 0.63 1.4
Ventilation 1.8 1.3 1.8
Odors 2.0 1.7
Housekeeping 2.4
Eigen values of the judgment matrix in the table that are the importance weights of CRs, are
then calculated as 0.202, 0.187, 0.085, 0.152, 0.157, 0.132 and 0.084, respectively. Figure 4 presents
an HOQ matrix for the BT building indoor air quality problem, including (1) degrees of importance of
CRs as obtained from the AHP analysis, (2) normalized relationship ratings between CRs and DRs
obtained using swing method and normalization of relationship ratings (3) correlation between DRs,
and (4) cost required to install the DRs.

International Journal of Mechanical Engineering and Technology (IJMET), ISSN 0976
– 6340(Print), ISSN 0976 – 6359(Online) Volume 3, Issue 3, Sep- Dec (2012) © IAEME
14
Figure 4- HOQ matrix for the indoor air quality problem for the BT building
According to the results of prioritization of DRs, it is found that upgrading an air delivery
system (DR6) is most important for improving building occupants’ satisfaction with indoor air
quality, and the installation of a CO monitoring station with sensors (DR14) is least important.
If a repair budget is enough to complete all recommendations, the problem will become very
trivial. However, however, when available organizational resources are limited, a further analysis is
necessary to select which DRs should be completed; so Park and Kim found the cost savings that is
occurred when two related DRs are installed at the same time. For example, upgrading air plenum
walls (DR1) and replacing all fan plenum door seals with new ones (DR2) require Rs.18000 and
Rs.12000 respectively, when each of them is completed separately. When both of them are included
in a repair contact, Rs.4500 out of Rs.30000 is discounted because of savings in time. Therefore, they
form this quadratic integer programming technique;
Objective function: Max f(x)=∑=
16
1j
jj xAI
Budget constraint :
Bxxsxxsxxsxxsxxsxxsxcxc ≤−−−−−−++ 151215,1212612.611611,6929,210110,1212,1161611 .....

International Journal of Mechanical Engineering and Technology (IJMET), ISSN 0976
– 6340(Print), ISSN 0976 – 6359(Online) Volume 3, Issue 3, Sep- Dec (2012) © IAEME
15
Cost savings occurring when two DRs are completed at the same time illustrated below.
Pair of DRs Cost saving from simultaneous installation
DR1 and DR2 Rs.4,500
DR1 and DR10 Rs.10,200
DR2 and DR9 Rs.4,050
DR6 and DR11 Rs.28,500
DR6 and DR12 Rs.10,500
DR12 and DR15 Rs.5,250
Taeho Park and Kwang Jae-Kim solved above quadratic programming module by assuming
that repair budget of Rs.200000and they found out;
1. Objective value function of the total importance rating: 0.8484
2. Decision variables: DR1=.......DR9=1; DR10=DR11=0;DR12=.......DR16=1
3. Total cost required:Rs.1,98,700
If the budget is at least Rs.450,000 (Rs.513,000(∑=
16
1j
jc )- Rs.63,000 (∑∑= >
16
1
16
j ij
ijs )),all DRs can be
installed, resulting in the objective function. Therefore, 84.5% customer satisfaction can be achieved
only 44.2% (198,700/450,000) of total investment required.
Park and Kim present these results in a sensitivity analysis shown below.
Figure 5- Sensitivity and performance analysis for customer satisfaction improvement over
budget increment
In this graph, the achieved level of customer satisfaction increased as a higher budget was
allowed, with increments of Rs.25,000.However,the marginal rate of increase diminished as the level
of baseline budget become higher. For instance; the increase of the budget from Rs.100,000 to
Rs.125,000 increased the customer satisfaction by 9.4% (66.2-56.8) while the increase caused by the
budget change from Rs.200,000 to Rs.225,000 was only 1.4%. Therefore, they stated that as the

International Journal of Mechanical Engineering and Technology (IJMET), ISSN 0976
– 6340(Print), ISSN 0976 – 6359(Online) Volume 3, Issue 3, Sep- Dec (2012) © IAEME
16
customer satisfaction level increases by investment in technology, equipment and training, more effort
and investment are required to achieve the same level of additional customer satisfaction. In this case,
the customer satisfaction level will remain at 88.5% without DR11, which will replace the existing
standard profile control system with a direct digital control DDC System. To improve the level
further, a considerable amount of budget (Rs.211,500=Rs.240,000(cost for DR alone)-Rs.28,500
(savings) is required. However, the control system conversion will improve the customer satisfaction
level by 11.5%.
The proposed model is compared with a Knap-sack model shown in Wasserman that does not
take cost savings into account. Since he doesn’t take into account an organizational constraint of cost
savings, it can’t allow for installing additional DRs, which might be selected with cost savings. Thus
the Knapsack model results in no greater customer satisfaction than the proposed model.
In conclusion, Taeho Park and Kwang-Jae Kim stated that The new relationship rating scheme
using the swing method measures decision-makers’ opinions on the relationship between CRs and
DRs more systematically and accurately than the conventional relationship rating scale used in HOQ.
Since the new relationship rating scheme relies on a simple additive multi-attribute model, it is easy to
use; thus, it is a very handy and useful tool for practitioners. In addition, it converts decision-makers’
thoughts of the relationship between CRs and DRs into a continuum of rating values so that the QFD
problem can be formulated into a mathematical programming problem subject to limited resources
e.g., budget in an organization. As a result, the QFD problem could be extended to resource allocation
problems in the operations management field. In other words, the investment will be justified with a
better working environment, more customer satisfaction and more market share resulting from better
decision making.
2.Integrating Kano’s model in the planning matrix of QFD
K.C.Tan and X.X.Shen state in their articles that the quality of a product or service is ultimately
judged in terms of customer satisfaction. Focusing on listening to the voice of the customer (VOC),
quality function deployment has been used as a quality improvement and product development
technique in many fields. In order to achieve total customer satisfaction in an effective way, QFD
practitioners should go beyond listening to the VOC. Therefore, Tan and Shen recommended that
Kano’s model (which will be described below briefly) should be incorporated into the planning matrix
of QFD to help accurately and deeply understand the nature of the VOC.
Review of Kano’s model First, Professor N.Kano has developed a very useful diagram for characterizing customer needs
in 1984. Then King, Clausing and Cohen developed this model, which divides products or service
features into three distinct categories, each of which affect customers in a different way. (Matzler,
1998)
• One-dimensional attributes: With regard to one-dimensional attributes, customer
satisfaction is proportional to the level of fulfillment. It means that it result in customer satisfaction
when fulfilled and dissatisfaction when not fulfilled. The higher the level of fulfillment, the higher the
customer’s satisfaction. These attributes are usually explicitly demanded by the customer. For
example, when customers want to buy a new car, “mileage” may be such an attribute.
• Attractive attributes: These attributes are the product criteria, which have the greatest
influence on how satisfied a customer will be with a given product. These attributes neither explicitly
expressed nor expected by the customer. Although fulfilling these requirements leads to more than
proportional satisfaction, their absence doesn’t cause dissatisfaction because as mentioned customers
are unaware of what they are missing.
• Must be attributes: These attributes are basic criteria of a product. If the product or service
doesn’t meet the need sufficiently, the customers become very dissatisfied. On the other hand, as the
customer takes these requirements for granted, their fulfillment will not increase his satisfaction.
Fulfilling the must-be attributes will only lead to a state of not dissatisfied. The customer regards the
must be attributes as prerequisites; he takes them for granted and therefore doesn’t explicitly demand

International Journal of Mechanical Engineering and Technology (IJMET), ISSN 0976
– 6340(Print), ISSN 0976 – 6359(Online) Volume 3, Issue 3, Sep- Dec (2012) © IAEME
17
them. Must be requirements are in any case a decisive competitive factor, and if they are not fulfilled,
the customer will not be interested in the product at all.
Figure 6- The Kano model
A proposed approach to using Kano’s model
In this proposed approach developed by Tan and Shen, there are mainly two issues with which
QFD practitioners must be confronted; classifying customer attributes into Kano categories and
choosing the proper transformation function for customer attributes in each category. The data needed
in classifying customer attributes are obtained through a Kano questionnaire that consists of a pair of
questions.
They expressed the relationship between customer satisfaction and product or service
performance existing in Kano’s model can be quantified by using an appropriate function with
parameters. Specifically, the relationship can be expressed as s=f(k,p), where s represents the
customer satisfaction, p represents the product or service performance and k is the adjustment
parameter for each Kano category.
Kano’s model tells us that not all customer satisfaction attributes are equal. Not only are some
more important to the customer than others, but also some are important to the customer in different
ways than others. As it is shown at graphic, the attractive attributes result more easily in customer
satisfaction than must-be attributes do. Moreover for attractive attributes, the customer satisfaction
increases progressively with the improvement of the product performance. Therefore, for attractive
attributes, we can get ∆s/s>∆p/p where s and p represent the customer satisfaction degree and product
performance level. Similarly for one dimensional attributes, ∆s/s=∆p/p , for must be attributes,
∆s/s<∆p/p . In other words, using a parameter k, the above three relationship formula can be
expressed by one equation, ∆s/s=k(∆p/p). Thus, for attractive attributes, k>1, for one dimensional
attributes k=1, for must be attributes, 0<k<1.
Case example
K.C.Tan and X.X. Shen illustrated their approach by a case example to show the integration of
Kano model into QFD by adjusting the raw priority of each customer attribute.
The QFD is applied to this case study for the definition and design of “good web pages”. After
careful information gathering, several main customer attributes and their corresponding priorities(
using a 1-5 scale) are identified. Furthermore two other web pages are chosen to make a competitive
analysis. Then customers are asked to rate their satisfaction degree for both own web page and two
competitors’ pages using a 1-5 scale. To implement the proposed integrative approach, customers are
also asked to group properly their requirements into Kano categories.

International Journal of Mechanical Engineering and Technology (IJMET), ISSN 0976
– 6340(Print), ISSN 0976 – 6359(Online) Volume 3, Issue 3
Figure 7- The VOC with customer perception and Kano category
Tan and Shen claim that in traditional QFD, customer perception data are usually used to make
a competitive analysis and based on this analysis, a customer satisfaction target is set for each
customer attribute. Adopting the standard adjustment of improvement ratio, the raw importa
consequently be adjusted. However, the adjusted importance may not accurately represent what we
really need. The traditional QFD of this case is shown below.
Figure 8- The traiditional planning matrix for “good web pages”
In this matrix Kano’s attributes are not taken into consideration so the relationship
between customer satisfaction and performance considered as linear and constant. For instance, taking
easy-to red text as an example, its customer satisfaction target i
degree has to be increased by 150% in order to achieve the satisfaction target and to satisfy customers.
For this target, in the traditional planning matrix the raw importance is increased by 150%
accordingly. However, according to the previous Kano model analysis, it is judged as a must
attribute. For a must-be attribute, Kano’s model clearly tells us that the customer satisfaction target
cannot be achieved even after increasing the raw importance by 150%. For this,
should be increased more than 150% to achieve its desired satisfaction.
After developing Kano’s model K.C.Tan and X.X.Shen form this approximate transformation
function for the adjusted ratio in order to integrate Kano’s model to QFDk
adj IRIR )( 0=
International Journal of Mechanical Engineering and Technology (IJMET), ISSN 0976
6359(Online) Volume 3, Issue 3, Sep- Dec (2012)
18
The VOC with customer perception and Kano category
traditional QFD, customer perception data are usually used to make
a competitive analysis and based on this analysis, a customer satisfaction target is set for each
customer attribute. Adopting the standard adjustment of improvement ratio, the raw importa
consequently be adjusted. However, the adjusted importance may not accurately represent what we
really need. The traditional QFD of this case is shown below.
The traiditional planning matrix for “good web pages”
In this matrix Kano’s attributes are not taken into consideration so the relationship
between customer satisfaction and performance considered as linear and constant. For instance, taking
to red text as an example, its customer satisfaction target is set as 3. the customer satisfaction
degree has to be increased by 150% in order to achieve the satisfaction target and to satisfy customers.
For this target, in the traditional planning matrix the raw importance is increased by 150%
according to the previous Kano model analysis, it is judged as a must
be attribute, Kano’s model clearly tells us that the customer satisfaction target
cannot be achieved even after increasing the raw importance by 150%. For this, the must be attribute
should be increased more than 150% to achieve its desired satisfaction.
After developing Kano’s model K.C.Tan and X.X.Shen form this approximate transformation
function for the adjusted ratio in order to integrate Kano’s model to QFD:
International Journal of Mechanical Engineering and Technology (IJMET), ISSN 0976
) © IAEME
traditional QFD, customer perception data are usually used to make
a competitive analysis and based on this analysis, a customer satisfaction target is set for each
customer attribute. Adopting the standard adjustment of improvement ratio, the raw importance can
consequently be adjusted. However, the adjusted importance may not accurately represent what we
In this matrix Kano’s attributes are not taken into consideration so the relationship
between customer satisfaction and performance considered as linear and constant. For instance, taking
s set as 3. the customer satisfaction
degree has to be increased by 150% in order to achieve the satisfaction target and to satisfy customers.
For this target, in the traditional planning matrix the raw importance is increased by 150%
according to the previous Kano model analysis, it is judged as a must-be
be attribute, Kano’s model clearly tells us that the customer satisfaction target
the must be attribute
After developing Kano’s model K.C.Tan and X.X.Shen form this approximate transformation

International Journal of Mechanical Engineering and Technology (IJMET), ISSN 0976
– 6340(Print), ISSN 0976 – 6359(Online) Volume 3, Issue 3
Where adjIR is the adjusted improvement ratio
the Kano parameter for different categories. In this equation, k is the only parameter for QFD
practitioners to choose. After classifying the customer attributes into proper Kano categories, the
corresponding k can be chosen. In this case, Tan and Shen chose the k value ½, 1 and 2 for must
one dimensional and attractive attributes, respectively. R
Figure 9- The planning matrix with Kano category
From this planning matrix with Kano category, it can be seen that the raw priorities are adjusted
differently from the traditional method
as an example again. In the traditional planning matrix, its percentage importance is 10.8% while it
becomes 15.4 after incorporating the Kano analysis. Thus, the importance has been increased
they previously analysed. For other customer attributes, it is similar.
In conclusion, K.C.Tan and X.X.Shen use the Kano model to help differentiate among
customer requirements, to obtain an imaginative understanding of customer needs and to unders
the nature of the VOC and make strategic planning.
3. A knowledge-based approach to the quality function deployment
Jae Kyeong Kim, Chang Hee Han, Sang Hyun Choi, Soung Hie Kim presented that o
major difficulties of QFD in practice, is the
the size of a HOQ can grow very fast. This implies the need for a huge amount of time and effort to
develop as well as fill out the HOQ chart. Notwithstanding the rapid growth of QFD methodologies
on the specific procedure, development of efficient methodologies for developing the HOQ charts has
scarcely been addressed. Thus, These researchers suggest a knowledge
HOQ chart for a new product. The main idea of our suggested met
International Journal of Mechanical Engineering and Technology (IJMET), ISSN 0976
6359(Online) Volume 3, Issue 3, Sep- Dec (2012)
19
is the adjusted improvement ratio 0IR is the original improvement ratio and k is
the Kano parameter for different categories. In this equation, k is the only parameter for QFD
actitioners to choose. After classifying the customer attributes into proper Kano categories, the
corresponding k can be chosen. In this case, Tan and Shen chose the k value ½, 1 and 2 for must
one dimensional and attractive attributes, respectively. Resulting QFD matrix is illustrated below
The planning matrix with Kano category
From this planning matrix with Kano category, it can be seen that the raw priorities are adjusted
differently from the traditional method. Tan and Shen took the customer attribute “easy
as an example again. In the traditional planning matrix, its percentage importance is 10.8% while it
becomes 15.4 after incorporating the Kano analysis. Thus, the importance has been increased
they previously analysed. For other customer attributes, it is similar.
In conclusion, K.C.Tan and X.X.Shen use the Kano model to help differentiate among
customer requirements, to obtain an imaginative understanding of customer needs and to unders
the nature of the VOC and make strategic planning.
based approach to the quality function deployment
Jae Kyeong Kim, Chang Hee Han, Sang Hyun Choi, Soung Hie Kim presented that o
major difficulties of QFD in practice, is the large size of the HOQ. Even for a simple product design,
the size of a HOQ can grow very fast. This implies the need for a huge amount of time and effort to
develop as well as fill out the HOQ chart. Notwithstanding the rapid growth of QFD methodologies
the specific procedure, development of efficient methodologies for developing the HOQ charts has
scarcely been addressed. Thus, These researchers suggest a knowledge-based approach to build a
HOQ chart for a new product. The main idea of our suggested methodology is as follows:
International Journal of Mechanical Engineering and Technology (IJMET), ISSN 0976
) © IAEME
is the original improvement ratio and k is
the Kano parameter for different categories. In this equation, k is the only parameter for QFD
actitioners to choose. After classifying the customer attributes into proper Kano categories, the
corresponding k can be chosen. In this case, Tan and Shen chose the k value ½, 1 and 2 for must-be,
esulting QFD matrix is illustrated below
From this planning matrix with Kano category, it can be seen that the raw priorities are adjusted
. Tan and Shen took the customer attribute “easy-to read text”
as an example again. In the traditional planning matrix, its percentage importance is 10.8% while it
becomes 15.4 after incorporating the Kano analysis. Thus, the importance has been increased just as
In conclusion, K.C.Tan and X.X.Shen use the Kano model to help differentiate among
customer requirements, to obtain an imaginative understanding of customer needs and to understand
Jae Kyeong Kim, Chang Hee Han, Sang Hyun Choi, Soung Hie Kim presented that one of the
large size of the HOQ. Even for a simple product design,
the size of a HOQ can grow very fast. This implies the need for a huge amount of time and effort to
develop as well as fill out the HOQ chart. Notwithstanding the rapid growth of QFD methodologies
the specific procedure, development of efficient methodologies for developing the HOQ charts has
based approach to build a
hodology is as follows:

International Journal of Mechanical Engineering and Technology (IJMET), ISSN 0976
– 6340(Print), ISSN 0976 – 6359(Online) Volume 3, Issue 3, Sep- Dec (2012) © IAEME
20
1. Similar products have similar attributes of HOQ charts like customer requirements,
engineering characteristics, and so on. If similar HOQ charts are built into a same class, managing the
HOQ charts is more efficient.
2. HOQ charts in the same class arc classified into a rule tree according to their similarity
degree. The main reason is to locate more similar charts nearby for the efficient selection.
3. IF-THEN typed knowledge retrieves the more similar HOQ chart from the selected class
base for a new product. Based on the retrieved HOQ charts, human experts can modify the chart with
ease. If one HOQ chart is not enough, more than two charts will be used for a new product. In that
ease, the criteria of selection is degree of similarity of a rule tree.
4. More QFD analysis is performed, the knowledge base and case base becomes more richer.
That means more suitable HOQ chart(s) may be provided for a new product.
In most cases, the QFD model is usually applicable to only one specific design problem, even
though developing QFD model needs much time and effort from multiple functional groups.
However, these researchers often investigate that some prior knowledge from the experience of
developing a QFD model can be utilized to resolve other similar QFD situations. From this
investigation, they consider a class analysis to combine the prior knowledge so that they handle a set
of similar QFD situations simultaneously. Although a concrete example or definition of similarity is
not found (Holtzman 1989), QFD class concept would be helpful in modeling HOQ charts in an
efficient way.
Kim, Han and Choi suggest a class analysis, which regards a QFD analysis as an integrator of
QFD knowledge and treats a set of QFD having some degree of similarity as a single unit. For this
purpose, first they develop a rule tree and then suggested If-Then typed knowledge-based approach.
Designing a decision class involves many trade-offs. If the decision class is too narrowly
defined, it will represent too few individual products; if it is defined in a general manner, its
corresponding class analysis will lose the benefits of domain specificity and may be prohibited
expensively. Therefore, it is necessary to design a decision class that is neither too restrictive nor too
comprehensive.(Kim,1998)
Knowledge based-methodology is consists of the following five phases:
Phase 1: Build a class of similar QFD cases.
Products are characterized by attributes like customer's age, customer's monthly income, market
region, ere such that an individual product is characterized by its attribute values.
Phase 2: Construct a rule tree for the class
Each product has a number of attributes and can be classified into a particular subclass. STIG
(Splitting Using Total Information Gain) algorithm (Kim, 1993) is used to construct a IF-THEN typed
rule tree.
Phase 3: Classification of a new QFD situation into a proper class using a rule tree. IF-THEN
typed knowledge retrieves the very similar HOQ charts from the selected class base with a new
product.
Phase 4: Based on the retrieved HOQ chart, human experts can modify HOQ charts with ease.
The retrieved HOQ charts have proper customer requirements and engineering characteristics for the
new product, but some part of them may be modified or deleted. New requirements and characteristics
may be added. With the retrieved HOQ chart, human expert can save time and effort at a considerable
amount.
Phase 5: Updating the class base, knowledge base, and data base by adding a new generated
HOQ chart to the class for the later use.
V. CONCLUSION
Quality function is a very dynamic topic and also house of quality is a very flexible model that
many researchers have developed them in case of different subjects and areas. This paper has tried to
explain three of them; a new model for prioritizing design requirements, a proposed approach that
integrate Kano’s model into QFD and a knowledge based approach to QFD. These new approaches

International Journal of Mechanical Engineering and Technology (IJMET), ISSN 0976
– 6340(Print), ISSN 0976 – 6359(Online) Volume 3, Issue 3, Sep- Dec (2012) © IAEME
21
may also have some deficiencies but as mentioned earlier, it is very progressive topic that further
researches will remove these deficiencies and make QFD applicable for different areas efficiently and
effectively.
REFERENCES
1. Determination of an optimal set of design requirements using house of quality; Taeho Park,
Kwang-Jae Kim, Journal of Operations Management 16 (1998) 569-581
2. QFD not just a tool but a way of quality management, Cor P.M. Govers, International Journal
of Production Economics (2001) 151-159
3. Ernzer, M., Kopp, K. (2003), “Application of Kano Method to Life Cycle Design ” , IEEE
Proceedings of EcoDesign: Third Intern ational Symposium on Environmentally Conscious
Design and Inverse Manufacturing , Tokyo Japan, December 8-11,383389
4. Integrating Kano’s model in the planning matrix of quality function deployment; K.C. Tan,
X.X. Shen, Total Quality Management, Vol:11 No:8 (2000) 1141-1151
5. 5. Hanan, M. and Karp, P. (1989 ), “Customer Satisfaction, how to M a xi mise , M eas ure a
nd Mark et y o ur C omp a ny ’s U lt imate Product ”. New York.
6. Determination of information system development priority using Quality Function
Deployment; Chang Hee Han, Jae Kyeong Kim, Sang Hyun Choi, Soung Hie Kim;
Computers Industry Engineering (1998) Vol:35 241-244.
7. A Knowledge-Based Approach to the Quality Function Deployment; Chang Hee Han, Jae
Kyeong Kim, Sang Hyun Choi, Soung Hie Kim; Computers Industry Engineering (1998)
Vol:35, 233-236
8. House of quality: A fuzzy-logic based requirements analysis; Cecilia Temponi, John Yen,
W.Amos Tiao; European Journal of Operations Research 117 (1999) 340-354
9. How to make product development projects more successful by integrating Kano’s model of
customer satisfaction into Quality Function Deployment; Kurt Matzler, Hans H. Hinterhuber;
Technovation vol:18 (1998) 25-38
10. Quality Function Deployment and decision analysis; Gwen Delano, Gregory S. Parnell,
Charles Smith, Matt Vence; International Journal of Operations&Production Management
(2000) Vol:20 591-601