Embed Size (px)
Citation preview
107GYODA Koichi et al.
1 Introduction
Current communication networks in use typically consist of an access network that connects the user terminal and the local tele-phone exchange or base station, and a core network (backbone) that mutually connects the local telephone exchange and base sta-tions. In the case of core networks, wired con-nections that make use of optical fiber cables have recently come into widespread use, whereas wireless connections, such as micro-wave links, were used in the past. Access net-works, on the other hand, recently use both wired connections that make use of cables, such as copper wires used in conventional telephone systems or optical fibers used in the FTTH service, and wireless connections, such as cell phone networks and wireless LANs. Wireless communications in particular have come into widespread use to respond to the increasing need for users to be connected “anytime, anywhere, with anyone,” along with the need for the improved performance and advanced functionality of the user terminals,
and advancement of communication systems. These kinds of communication networks
can provide reliable, high-speed mobile com-munication under usual circumstances. How-ever, in the event of a large-scale disaster, communication may be lost due to physical damage or a power outage, which causes the base station or core network to fail, irrespec-tive of whether the access network is function-ing. Even if the base station and core network remain operational, communication becomes very difficult immediately after a disaster occurs due to network congestion caused by the large number of simultaneous communica-tion requests or calls as users try to confirm the safety of their friends and loved ones. To cope with occasions when there is physical damage or a power outage at the base station or core network, mobile network service oper-ators such as cell phone companies should prepare a backup system consisting of a tem-porary base station and emergency power source, and should immediately start work to recover the damaged network. Nevertheless, communication remains impossible until the
2-3 Performance Evaluation of Wireless Ad Hoc Network for Disaster Communication
GYODA Koichi, Hoang Nam Nguyen, HADA Yasushi, OKADA Kazunori, and TAKIZAWA Osamu
The wireless ad hoc network is expected to be used as an alternative of the existing mobile communication network to make users communicate when a large-scale disaster occurs. It is also expected to be deployed to search robot rescue system in a closed space of disaster struck area. In this paper, we propose two communication models by use of wireless ad hoc network. One is a real city communication model considering the disaster occurs. The other is a search robot communication model in the closed spaces. We analyze and evaluate the communication performance of these two network models by using the network simulator.
KeywordsEmergency communication, Ad hoc network, Network model, Simulation

Journal of the National Institute of Information and Communications Technology Vol. 58 Nos. 1/2 2011108
recovery operation is completed. To prevent network congestion that may occur immedi-ately after a disaster, the service operators lim-it the number of user terminals that can access the base stations. This is called communica-tion restriction control. With this restriction, however, a number of user terminals become inaccessible, causing the users to become anx-ious if the state persists.
Under these circumstances, it is expected that wireless ad hoc networks will be used as the means of communication, which will alle-viate user anxiety. A wireless ad hoc network is autonomous distributed communication based on wireless communication between user terminals. Connection with user terminals that cannot be directly reached wirelessly is established via other user terminals that are available for wireless access. A wireless ad hoc network is an effective alternative to existing mobile communication networks in the event of a large-scale disaster because it does not require any base stations and because the communication path is automatically reconfigured in accordance with the load on the user terminals, which acts as relay node. If it goes out of wireless coverage, other avail-able user terminals are reselected.
A wireless ad hoc network is also effective for transmitting data about a disaster site since it can be used as an alternative to the existing mobile communication network as described above. As an example, an application is being studied concerning communication with robots that operate immediately after a disas-ter has occurred to search confined spaces, such as underground malls or buildings that have collapsed or are in danger of collapse. This kind of work is dangerous and could lead to a secondary disaster if rescue personnel enter such locations to rescue victims, without understanding the conditions inside. To pre-vent a secondary disaster, the Fire and Disas-ter Management Agency has been studying the use of search robots equipped with chemical sensors and video cameras that assists in understanding the conditions inside confined spaces. It is preferable that wireless communi-
cation is used between the search robot and the control terminal, which is located remotely in a safe place. In the case of wireless commu-nication, however, distance may become a constraint. It is hoped that this constraint can be overcome through the use of a wireless ad hoc network configured with multiple search robots which can examine the conditions inside confined spaces.
This paper presents two practical models based on the use of a wireless ad hoc network in the event of a disaster. The study also shows results of communication performance evaluation of each model observed by analysis using a network simulator.
The first model is an urban communica-tion model where wireless ad hoc communica-tion is used in the event of a large-scale disas-ter as an alternative to existing mobile com-munication. It assumes communication with highly real-time requirements, such as voice calls and video calls. The second model is a robot communication model, where wireless ad hoc communication is used immediately after a large-scale disaster for search robots that operate within confined spaces, such as an underground mall or subway. It assumes the communication of video data sent from video cameras equipped with search robots to the control terminal, and the transmission of con-trol signals for search robots.
In Chapter 2, the simulation is validated by comparing the urban moving model, which is presented in this paper, and the conventional Random Waypoint model, which has been used most commonly. Optimization of proto-col attribute values to improve performance is also discussed. Next, details of the network performance is examined for the communica-tion model implemented in the event of a disaster, by assuming that the application will handle video data and that the required vol-ume of data is communicated for this purpose. In addition, the network performance is evalu-ated, considering the influence of buildings, which makes the scenario more closely resem-ble a real-world environment. Evaluation is conducted by increasing the number of relay-
109GYODA Koichi et al.
node user terminals to improve network per-formance.
In Chapter 3, the second model is exam-ined by introducing a hybrid ad hoc network consists of wired and wireless networks for robot communication. The final goal of robot communication is to connect all robots and control terminals through the wireless ad hoc network. However, as an interim until it becomes more realistic, partial use of a wired network is proposed. The hybrid ad hoc net-work can offer the advantages of both wired and wireless communication. The perfor-mance is evaluated by configuring the net-work in a confined space that is rectangular. Two different scenarios are used to simulate the movement of search robots. Next, the per-formance is evaluated in the same manner as for a confined space that is crank-shaped.
2 Performance evaluation of wire-less ad hoc network in urban disaster communication model
2.1 Performance evaluation in the urban communication model
2.1.1 Configuration of the mobile user terminal model
Because a wireless ad hoc network con-sists of mobile user terminal, any evaluation of the performance cannot ignore how user terminals move around. More precisely, it is important to consider what model should be used to simulate the movement of user termi-nals. The Random Waypoint model is the most basic model, which is extensively used as a moving model for user terminals when evalu-ating the performance of a wireless ad hoc network. The movement of user terminals that comprise the network in the Random Way-point model is specified as follows:
• The initial position and destination of each user terminal shall be randomly set within the specified area.
• Each user terminal shall move linearly at a constant speed from the initial position its toward destination. The speed shall be ran-domly set between 0 and the maximum
speed. • When a user terminal reaches its destina-
tion, it shall remain there for a randomly set interval time. Then, it shall start mov-ing again toward a new destination at a constant speed, in which case the new des-tination and the speed shall also be set ran-domly.
• Each user terminal shall repeat the above actions during the simulation. The Random Waypoint model is a useful
platform when applied genuinely to the per-formance evaluation of network protocols. However, to evaluate performance that assumes the actual use of a wireless ad hoc network, the model shall be able to simulate the actual movement of user terminals more realistically than the Random Waypoint mod-el. For this reason, a new model was created and introduced to the study. The new model simulates actual urban roads along which user terminals move. This model is hereinafter called the Real City model. When selecting an urban area simulated by the Real City model, by reference to [1], the following consider-ations were made to simplify comparison with the Random Waypoint model and simulation:
• The area shall be a square 500 × 500 meters.
• The roads are laid out in a grid and inter-sect perpendicularly in as many cases as possible. Based on the above considerations, the
Real City model was created by simulating an area (inside of the black frame) in Aoba-ku, Sendai-shi, Miyagi prefecture, as shown in Fig. 1.
In the Real City model, two road types were modeled, one narrow and one wide. A “narrow” road was defined to allow user ter-minals to exist in the middle of it, with user terminals being able to move in both direc-tions. A “wide” road was defined so that user terminals could move along them with either of two lines set in parallel at 15-meter inter-vals toward only one direction that differed from another line. The probability of selecting a direction at an intersection or a T-junction

Journal of the National Institute of Information and Communications Technology Vol. 58 Nos. 1/2 2011110
was specified as shown in Fig. 2, in accor-dance with Manhattan Model [2], which is a standard propagation model in urban mobile communication. Six values were specified as user terminals mobility (the maximum speed at which user terminals could move); 0 m/s, 1 m/s, 2 m/s, 4 m/s, 8 m/s, and 10 m/s. Here, if we take the traffic on roads and congestion into account, various movement speeds should be possible in the situation where even cars and motorbikes sometimes need to go slowly. Therefore, randomly selected movement speed which is equal to or less than the maximum value of the user terminals mobility should be assigned to each user terminal as the initial value, and the user terminals should move at this specified speed. More precisely, the val-ues for user terminal mobility assume the fol-lowing movement respectively:(1) 0 m/s: User terminals remain stationery(2) 1 m/s: Walking(3) 2 m/s: A combined situation where users
walk and ride light vehicles such as bicycles
(4) 4 m/s: In addition to 2 m/s, the inclusion of driving very low-speed vehicles
(5) 8 m/s: In addition to 4 m/s, the inclusion of driving low-speed vehicles
(6) 10 m/s: In addition to 8 m/s, the inclusion of driving medium speed vehicles
Note that the Real City model changed the locations of part of the roads or added extra
roads that do not exist, which does not perfect-ly correspond with the actual geography of roads in the simulated area. 2.1.2 Simulation results and discus-
sions by using different user ter-minal models
We evaluated the performance of the wire-less ad hoc network using the network simula-tor for both cases where the Random Way-point model and the Real City model are used. Because 2.4GHz wireless LAN is used popu-larly, we used IEEE802.11b/g (11Mbps) wire-less LAN protocol in the simulation. The range of the wireless link is set to 100m.
We used the Ad hoc On-Demand Distance Vector Routing Protocol (AODV) [3] and the Optimized Link State Routing Protocol (OLSR) [4] as the routing protocol, which are typical routing protocols for wireless ad hoc networks. UDP was used as the data transmis-sion protocol with consideration given to the requirements for real-time communication. We used the data delivery rate as the perfor-mance evaluation parameter. The data delivery rate is defined as the ratio of received and transmitted data by all user terminals.
When one user terminal, T1, starts commu-nication, other user terminals, T2, T3, ..., which exist within the range of wireless link of T1 are considered accessible. If the final destination user terminal, Tn, are accessible, a communi-cation path is established directly. If Tn is not
Fig.1 Map of the urban area that the Real City model simulates
Fig.2 Probability of selecting direction at intersections and T-junctions
Intersection of narrow roads
Intersection of narrow and wide roads
Intersection of wide and narrow roads
Intersection of wide roads
Intersection of narrow roads
T-junction of wide and narrow roads

111GYODA Koichi et al.
accessible, a path is created via other user ter-minals, T2, T3, ..., and data is transmitted and received between T1 and Tn over the created path. Paths can be destroyed and reestablished repeatedly by user terminals’ movement, which causes the amount of data received by Tn to change, and thus the data delivery rate also changes accordingly. In addition, when the distance between two locations is d and the wavelength at the used frequency is λ, propagation loss LdB between the two locations is calculated by the free space propagation loss formula:
LdB 20 log4d
(1) (1)
In this simulation under the conditions described above, the threshold value of propa-gation loss in the accessible state LdB = 80 dB is calculated by substituting d = 100 m and λ = 0.125 m into formula (1).
We used OPNET [5] as the network simula-tor. OPNET was developed at Massachusetts Institute of Technology (MIT) and released in 1987 as the first commercial network simula-tor. Since then, OPNET has been extensively used around the world as an industry standard tool.
Figure 3 shows the change in data delivery rate against user terminal mobility when there are 50 user terminals under the following con-ditions: All 50 user terminals continue trans-mitting 64 bytes (= 512 bits) of data at the intervals of 0.25 seconds for 900 seconds to randomly selected destination user terminals. In this case, data transmitted by 1 user termi-nal is 2,048 bits/second, and data transmitted over the entire network is 102,400 bits/second. To prevent data transmitted by each user ter-minal from colliding, the data transmission start time was randomly set within 1 second from the start of simulation. Also, simulations were conducted for five different patterns of initial positions of user terminals. The data delivery rate shows the mean value of data delivery rates obtained by these simulations respectively. In addition, the pause time in the
Random Waypoint model was set to 0 for comparison to the Real City model.
From Fig. 3, we observed the following:• When user terminal mobility is set to 0
m/s, the data delivery rates are the same regardless of the user terminal movement model. This is because the accessible/non-accessible state between user terminals is entirely determined by the initial positions and does not change over time.
• When user terminal mobility is set to val-ues other than 0 m/s, the data delivery rate with OLSR is lower than that with AODV irrespective of the user terminal movement model. This can happen because OLSR is a proactive protocol whereas AODV is a reactive protocol. OLSR continues ex-changing neighbor user terminal informa-tion all the time, for which the data over-head can become larger than that of AODV.
• When user terminal mobility is set to a value other than 0 m/s, the data delivery rate decreases along with the increase in user terminal mobility. This is considered to be due to the change in accessible/non-accessible state between user terminals over time, as well the increased mobility of user terminals, which causes path reconfiguration more frequently. By such
Fig.3 Change of data delivery rate against user terminal mobility
Journal of the National Institute of Information and Communications Technology Vol. 58 Nos. 1/2 2011112
frequent path reconfiguration, the proba-bility that data becomes unreachable is assumed to increase.
• In the AODV Random Waypoint simula-tion, the data delivery rate is higher in 1 m/s and 2 m/s than 0 m/s. This is assumed to be due to the fact that the paths, which are created after the user terminals had moved from their initial positions, can be kept for relatively long time if user termi-nal mobility is low. On the other hand, with the same user terminal mobility, the OLSR Random Waypoint is assumed to have lower data delivery rate caused by the overhead of exchanging neighbor user terminal information.
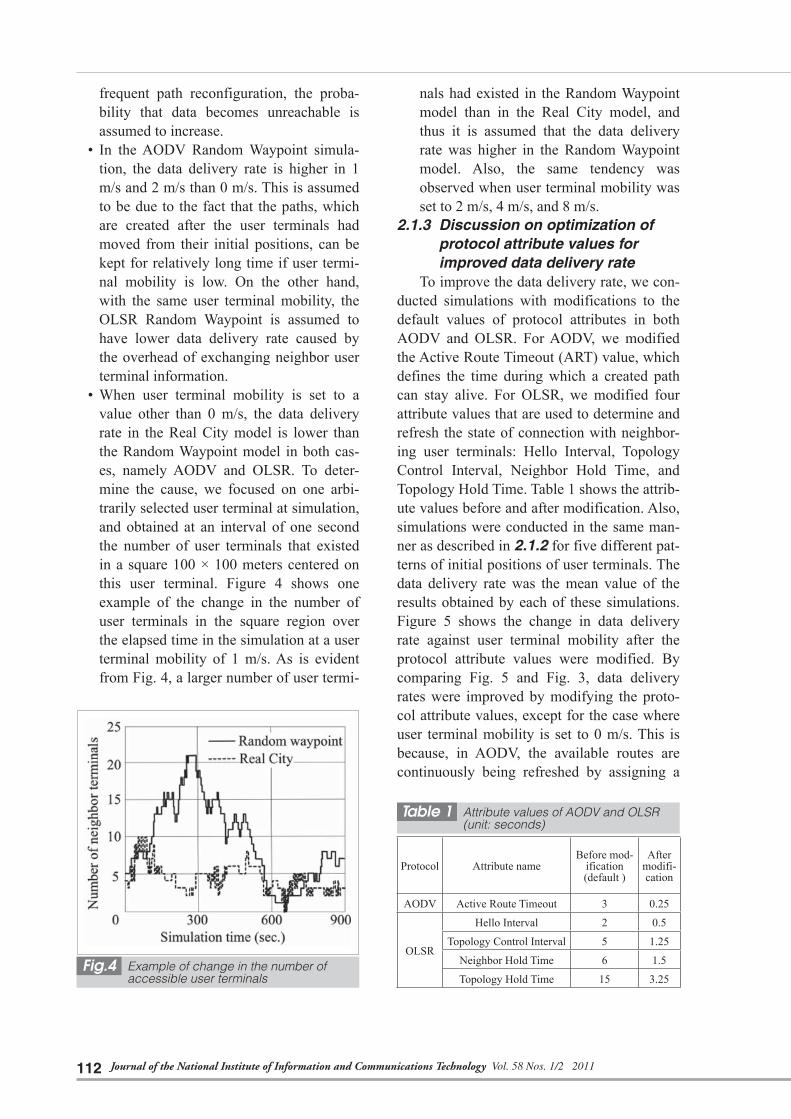
• When user terminal mobility is set to a value other than 0 m/s, the data delivery rate in the Real City model is lower than the Random Waypoint model in both cas-es, namely AODV and OLSR. To deter-mine the cause, we focused on one arbi-trarily selected user terminal at simulation, and obtained at an interval of one second the number of user terminals that existed in a square 100 × 100 meters centered on this user terminal. Figure 4 shows one example of the change in the number of user terminals in the square region over the elapsed time in the simulation at a user terminal mobility of 1 m/s. As is evident from Fig. 4, a larger number of user termi-
nals had existed in the Random Waypoint model than in the Real City model, and thus it is assumed that the data delivery rate was higher in the Random Waypoint model. Also, the same tendency was observed when user terminal mobility was set to 2 m/s, 4 m/s, and 8 m/s.
2.1.3 Discussion on optimization of protocol attribute values for improved data delivery rate
To improve the data delivery rate, we con-ducted simulations with modifications to the default values of protocol attributes in both AODV and OLSR. For AODV, we modified the Active Route Timeout (ART) value, which defines the time during which a created path can stay alive. For OLSR, we modified four attribute values that are used to determine and refresh the state of connection with neighbor-ing user terminals: Hello Interval, Topology Control Interval, Neighbor Hold Time, and Topology Hold Time. Table 1 shows the attrib-ute values before and after modification. Also, simulations were conducted in the same man-ner as described in 2.1.2 for five different pat-terns of initial positions of user terminals. The data delivery rate was the mean value of the results obtained by each of these simulations. Figure 5 shows the change in data delivery rate against user terminal mobility after the protocol attribute values were modified. By comparing Fig. 5 and Fig. 3, data delivery rates were improved by modifying the proto-col attribute values, except for the case where user terminal mobility is set to 0 m/s. This is because, in AODV, the available routes are continuously being refreshed by assigning a
Table 1 Attribute values of AODV and OLSR (unit: seconds)
Protocol Attribute nameBefore mod-
ification (default )
After modifi-cation
AODV Active Route Timeout 3 0.25
OLSR
Hello Interval 2 0.5
Topology Control Interval 5 1.25
Neighbor Hold Time 6 1.5
Topology Hold Time 15 3.25Fig.4 Example of change in the number of
accessible user terminals

113GYODA Koichi et al.
smaller value to ART. Similarly in OLSR, the connection state with neighboring user termi-nals is refreshed more frequently by making four attribute values smaller. Nevertheless, the data delivery rate in the Real City model remains equal to or lower than 0.7 in the case of AODV and 0.5 in the case of OLSR. In addition, it is possible that, by modifying these attribute values, the volume of data packets required for path control increases, which may lead to a shorter battery life of user terminals due to the higher power consumption. Further technological developments are required to improve the data delivery rate while suppress-ing power consumption. These are future issues to be studied.
Also, when user terminal mobility is set to 0 m/s, paths do not change over time. But with modified protocol attribute values, the volume of packets used for updating paths and refresh-ing connection state increases, resulting in a decreased data delivery rate. The decrease is as small as approximately 3% with AODV, but is relatively large at 19% in the case of OLSR.
2.2 Performance evaluation in disaster communication model
2.2.1 Configuration of disaster com-munication model
In Section 2.1, we discussed the data
delivery rate of the entire network based on the assumption that all user terminals commu-nicate while moving, transmitting a relatively small amount of data to randomly selected destination user terminals. In this section, we discuss our simulations of detailed network performance when a relatively large amount of data is transmitted in accordance with the application terminals that we specified, such as video data. Here, the communication model assumes that a disaster has actually occurred.
For the purpose of relaying data communi-cation from a disaster area to a location with an available existing infrastructure network, we assume, as an example of a communica-tion model, the use of a wireless ad hoc net-work in the case of a large-scale disaster occurring in an urban center. Data communi-cation of this type would be required in a res-cue operation by rescue team that is deployed in a disaster area where the existing infrastruc-ture network is temporarily unavailable.
The disaster area is assumed to be in the center of a square 500 × 500 meters, and the location with the available existing infrastruc-ture network is assumed to be located in the bottom right corner of this square. Fixed ter-minals are installed at the center and the bot-tom right corner of the square. To establish a connection between these two terminals, a wireless ad hoc network consists of user ter-minals that move along the roads while com-municating. The Real City model is used as the movement model for user terminals, which communicate data. The wireless LAN settings are the same as the simulations in Section 2.1. In Section 2.1 we discussed modification of AODV and OLSR protocol attribute values. However, the simulations in this section aims to obtain basic data, so the attribute values are set to the default values.
The application is assumed to handle vid-eo data in consideration of real time require-ment. The two fixed terminals transmit 17,280 bytes (= 138,240 bits) of data to each other on UDP at intervals of one second. This is an equivalent of one video stream data prepared in OPNET by default, which transmits 128
Fig.5 Change in data delivery rate against user terminal mobility with modified protocol attribute values
Journal of the National Institute of Information and Communications Technology Vol. 58 Nos. 1/2 2011114
×120 pixel frames at 1 frame/second. The ini-tialization process, which is required for the actual transmission of video streaming, is omitted in this section. 2.2.2 Simulation results and discus-
sions by using different initial lay-outs of user terminals
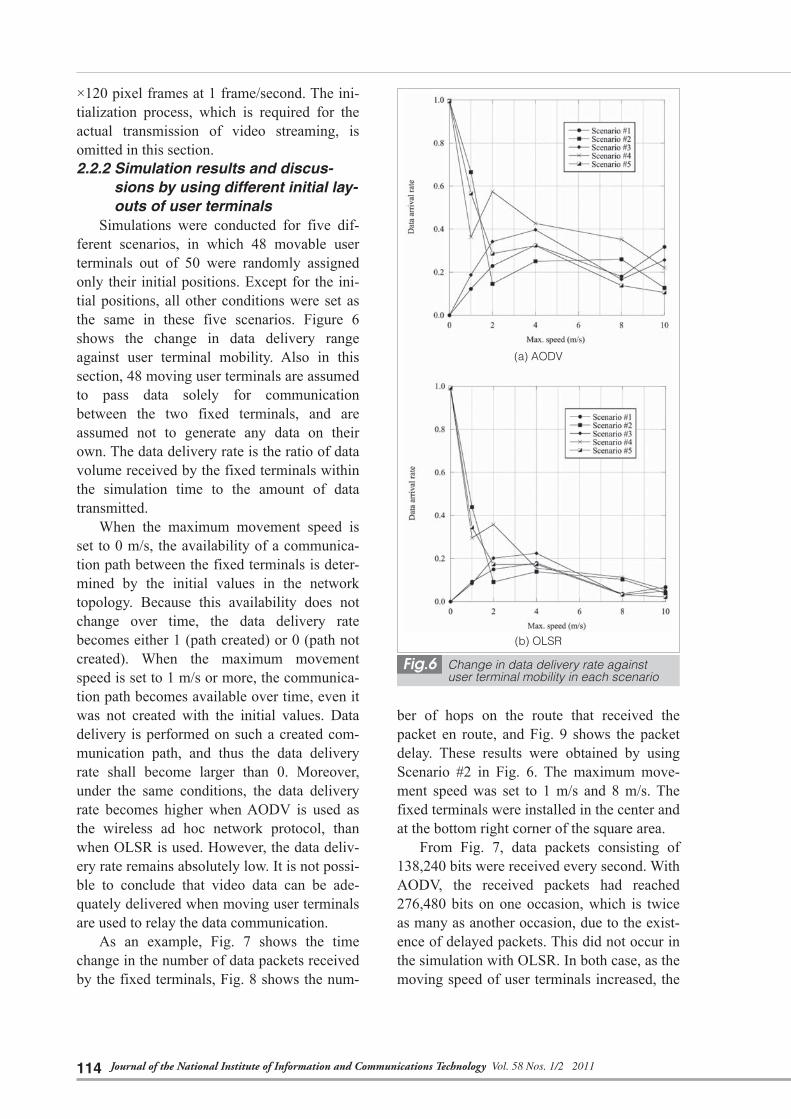
Simulations were conducted for five dif-ferent scenarios, in which 48 movable user terminals out of 50 were randomly assigned only their initial positions. Except for the ini-tial positions, all other conditions were set as the same in these five scenarios. Figure 6 shows the change in data delivery range against user terminal mobility. Also in this section, 48 moving user terminals are assumed to pass data solely for communication between the two fixed terminals, and are assumed not to generate any data on their own. The data delivery rate is the ratio of data volume received by the fixed terminals within the simulation time to the amount of data transmitted.
When the maximum movement speed is set to 0 m/s, the availability of a communica-tion path between the fixed terminals is deter-mined by the initial values in the network topology. Because this availability does not change over time, the data delivery rate becomes either 1 (path created) or 0 (path not created). When the maximum movement speed is set to 1 m/s or more, the communica-tion path becomes available over time, even it was not created with the initial values. Data delivery is performed on such a created com-munication path, and thus the data delivery rate shall become larger than 0. Moreover, under the same conditions, the data delivery rate becomes higher when AODV is used as the wireless ad hoc network protocol, than when OLSR is used. However, the data deliv-ery rate remains absolutely low. It is not possi-ble to conclude that video data can be ade-quately delivered when moving user terminals are used to relay the data communication.
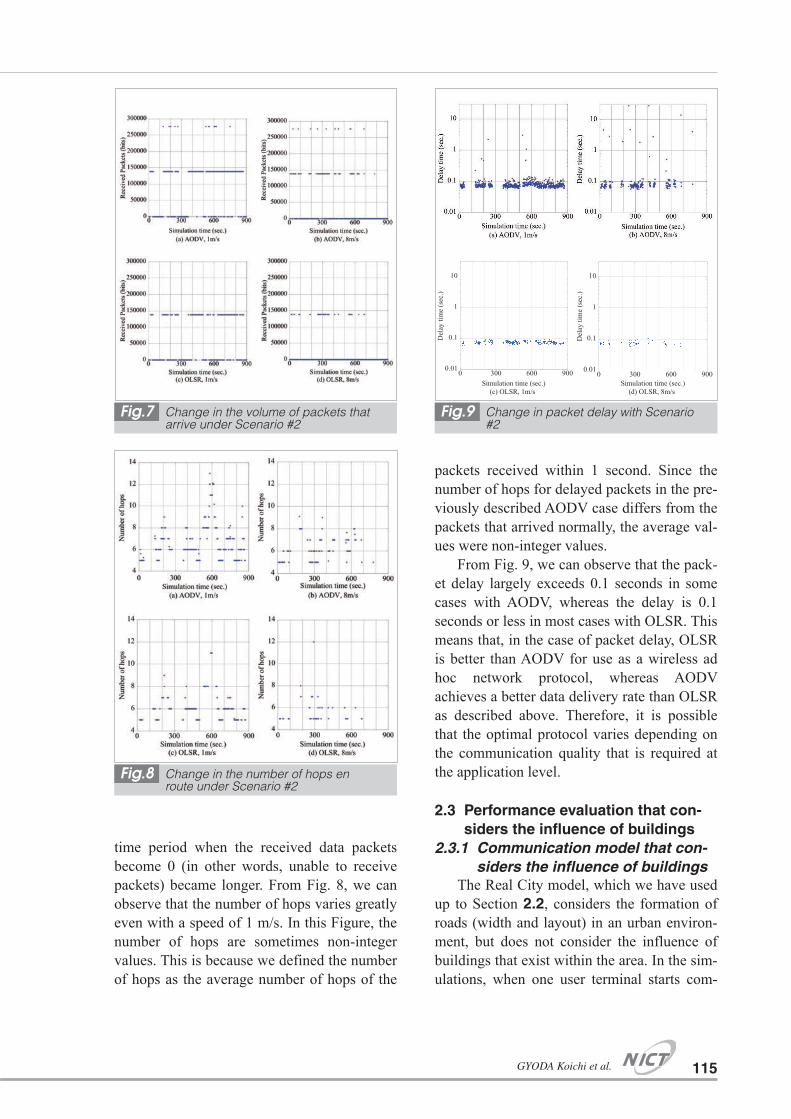
As an example, Fig. 7 shows the time change in the number of data packets received by the fixed terminals, Fig. 8 shows the num-
ber of hops on the route that received the packet en route, and Fig. 9 shows the packet delay. These results were obtained by using Scenario #2 in Fig. 6. The maximum move-ment speed was set to 1 m/s and 8 m/s. The fixed terminals were installed in the center and at the bottom right corner of the square area.
From Fig. 7, data packets consisting of 138,240 bits were received every second. With AODV, the received packets had reached 276,480 bits on one occasion, which is twice as many as another occasion, due to the exist-ence of delayed packets. This did not occur in the simulation with OLSR. In both case, as the moving speed of user terminals increased, the
Fig.6 Change in data delivery rate against user terminal mobility in each scenario
(a) AODV
(b) OLSR
115GYODA Koichi et al.
time period when the received data packets become 0 (in other words, unable to receive packets) became longer. From Fig. 8, we can observe that the number of hops varies greatly even with a speed of 1 m/s. In this Figure, the number of hops are sometimes non-integer values. This is because we defined the number of hops as the average number of hops of the
packets received within 1 second. Since the number of hops for delayed packets in the pre-viously described AODV case differs from the packets that arrived normally, the average val-ues were non-integer values.
From Fig. 9, we can observe that the pack-et delay largely exceeds 0.1 seconds in some cases with AODV, whereas the delay is 0.1 seconds or less in most cases with OLSR. This means that, in the case of packet delay, OLSR is better than AODV for use as a wireless ad hoc network protocol, whereas AODV achieves a better data delivery rate than OLSR as described above. Therefore, it is possible that the optimal protocol varies depending on the communication quality that is required at the application level.
2.3 Performance evaluation that con-siders the influence of buildings
2.3.1 Communication model that con-siders the influence of buildings
The Real City model, which we have used up to Section 2.2, considers the formation of roads (width and layout) in an urban environ-ment, but does not consider the influence of buildings that exist within the area. In the sim-ulations, when one user terminal starts com-
Fig.7 Change in the volume of packets that arrive under Scenario #2
Fig.8 Change in the number of hops en route under Scenario #2
Fig.9 Change in packet delay with Scenario #2
0.01
0.1
1
10
0 300 600 900
Del
ay ti
me
(sec
.)
Simulation time (sec.)(c) OLSR, 1m/s
0.01
0.1
1
10
0 300 600 900
Del
ay ti
me
(sec
.)
Simulation time (sec.)(d) OLSR, 8m/s

Journal of the National Institute of Information and Communications Technology Vol. 58 Nos. 1/2 2011116
munication, the accessible user terminals are defined as others that exist within the range of a circle centered on the starting user terminal, with the radius determined by the range of the wireless link. However, in an actual situation, not all such user terminals that exist in a circle are available for communication due to the effect of buildings and so on. In this section, we create and discuss the model that considers more factors and thus more closely resembles the real world situation.
In this model, we assume that buildings exist in all locations other than roads. When one user terminal starts communication, to reach the other user terminals around it, prop-agation loss is calculated from the relative position. The surrounding user terminals are considered accessible only when this calculat-ed value is below the predefined threshold. Propagation loss is calculated after the clear-ance terminals is evaluated. If there is no clearance, the calculation considers diffraction caused by the buildings, then applies Formulas (2) – (4) which extend the free space propaga-tion loss Formula (1) [6].
LdB 20 log4dn
(2) (2)
kj kj1 dj1 qj1, k0 1
dj kj sj1 dj1, d0 0
(3) (3)
qj j j q9090
v
, q90 0.5, v 1.5 (4)
(4)
Here, the maximum diffraction number, n = 3, was used.
Also, in this model, user terminals are assumed to be located below the height of the buildings. The clearance is determined only in two dimensions (in the horizontal plane), and thus diffraction of the vertical direction is not considered. The threshold value for the propa-gation loss was set to 80 dB, which is the same as in Section 2.1.2.
2.3.2 Simulation results and discus-sions of the communication between two fixed terminals
In Section 2.2, we conducted simulations where relatively large amount of data are transmitted. In this section, we conduct simu-lations with a relatively small amount of data. Out of 50 user terminals, one terminal is installed in the center of the area and one ter-minal is installed in the bottom right corner. These fixed terminals transmit 64-byte packets at an interval of 0.25 seconds on UDP. The other 48 moving user terminals are assumed to only relay communication by forwarding transmitted packets between the fixed termi-nals. Based on this condition, the correlation of the data delivery ratio of the fixed terminals (the average of five different scenarios) and the maximum movement speed of the moving user terminals is evaluated with and without consideration of the influence of buildings. The result of the comparison is shown in Fig. 10. From Fig. 10, we observed that, even a certain level of data delivery rate was achieved if the influence of building was ignored. By taking this influence into consid-eration, both AODV and OLSR achieved a very low data delivery rate, and it became almost impossible to communicate data.2.3.3 Discussion on optimizing the
protocol attribute values for improved data delivery rate
We conducted simulations to improve the data delivery rate by modifying the protocol attribute values. The simulations were made for both AODV and OLSR, which were used as the routing protocol. Attribute values before and after modification are the same as in Sec-tion 2.1.3, and are shown in Table 1. Figure 11 shows the change in the data delivery rate (the average of five different scenarios) com-pared to user terminal mobility after the proto-col attribute values were modified. From Figs. 10 and 11, we observed that a certain improve-ment was achieved in the data delivery rate if the influence of buildings was ignored, but when taking this influence into consideration, the data delivery rate was almost unchanged

117GYODA Koichi et al.
and remained very low, even when modified protocol attribute values were used.
2.4 Performance evaluation with an increased in the number of user terminals
2.4.1 Results and discussions of simu-lated communication between two fixed terminals
As described in Section 2.3, if the effect of buildings is considered in communication between two fixed terminals, the data delivery rate did not improve by modifying the attri-bute values of the routing protocols. A possi-ble cause of the problem is that the number of user terminals involved in path creation between two fixed terminals was too small. In this case, the data delivery ratio could be expected to improve by increasing the number of user terminals moving within the area.
With the same communication model as Section 2.3, we conducted simulations using totals of 100, 200, and 400 user terminals within the area. Figure 12 shows the correla-tion of the data delivery rate of fixed terminals and the maximum movement speed of user terminals. The result for OSLR with 400 user terminals was not obtained because the simu-lation would have taken an unrealistically long time to execute.
With AODV, the data delivery rate dras-tically improved when the number of user ter-minals was increased from 50 to 100. The data delivery rate improved further when the num-ber was increased to 200. However, when the number of user terminals is increased to 400, data delivery rate barely changes from the case when 200 user terminals are used. With OLSR, the data delivery rate improves by increasing the number of user terminals to 200, but in cases where the mobility values are larger, the absolute value for the data delivery rate remains low.2.4.2 Optimization of routing protocol
attribute valuesFurther simulations were made for both
AODV and OLSR using the modified protocol attribute values. The attribute values before and after modification are the same as in the previous sections, as shown in Table 1. Figure 13 shows the change in the data delivery rate (the average of five scenarios) against user ter-minal mobility after the protocol attribute val-ues were modified. With AODV, the data delivery rate is very low when the number of user terminals is 50. By increasing the number of user terminals, data delivery rate improved and became higher than the case where the protocol attribute values were not changed, as shown by a comparison of Fig. 13 (a) and Fig.
Fig.10 Change in data delivery rate against user terminal mobility when two fixed terminals communicate
Fig.11 Change in data delivery rate against user terminal mobility with modified protocol attribute values

Journal of the National Institute of Information and Communications Technology Vol. 58 Nos. 1/2 2011118
12 (a). When the number of user terminals was increased to 200, the data delivery rate achieved 90% or more with the maximum movement speed of 4 m/s or less. When the number of user terminals was increased to 400, the data delivery rate achieved 90% or more with a maximum movement speed of 10 m/s or less.
According to a research report on trends in post and telecommunication utilization (Research for Households) [7] issued by the
Ministry of Internal Affairs and Communica-tion in 2008, the utilization ratio of cell phones by individuals over six years old is 75.4%. The population density of people over six years old in the simulated area of Aoba-ku, Sendai-shi, Miyagi prefecture is 861 people per square kilometer as of October 2009 according to statistical information provided by the city of Sendai [8]. From these values, the estimated number of available cell phones in the simulated area of a square 500 × 500
Fig.12 Change in data delivery rate against user terminal mobility when the num-ber of user terminals is increased
Fig.13 Change in data delivery rate against user terminal mobility when parameter attribute values are changed
(a) AODV
(b) OLSR
(a) AODV
(b) OLSR

119GYODA Koichi et al.
meters is 162. This figure can help us antici-pate that a certain level of communication can be provided by implementing a wireless ad hoc network feature in the cell phones that people usually use. Nevertheless, the data delivery rate is insufficient even if all such cell phones are used to create a wireless ad hoc network in an emergency. To improve the data delivery rate, we should consider provid-ing relay terminals and that can be used in an emergency, in addition to using available cell phones.
With OLSR, the data delivery rate remained almost at 0 at every maximum movement speed when the number of user ter-minals was 50. By increasing the number to 100, the data delivery rate was improved. As is evident when comparing Fig. 13 (b) and Fig. 12 (b), the data delivery rate was higher than the case where the protocol attribute val-ues were not modified, except for a mobility value of 0 m/s. However, compared to the AODV result obtained with the same 100 user terminals, OLSR showed a lower data delivery rate at every maximum movement speed. The results of OSLR with 200 and 400 user termi-nals were not obtained because the simulation would have taken an unrealistically long time to execute. However, it is reasonable to assume that the data delivery rate would be unlikely to exceed the results for AODV by increasing the number of user terminals. This is because, due to the nature of OLSR, even with an increased number of user terminals, continuously exchange routing information requires a heavy amount of packet transmis-sion, which may impede any improvement in the data delivery rate.
3 Performance evaluation of a hybrid ad hoc network for search robots in a confined space
3.1 Proposal for a hybrid ad hoc net-work for search robots in a con-fined space
As a means of adequately understanding
the conditions inside a confined space when using search robots (SR), one possibility is to configure a multihop wireless network con-sisting of multiple SRs. Communication should be between the control terminal (CT), which controls the robots, and SR, which operates in a confined space where there is no radio transmission from the CT. Such commu-nication can be relayed by the other SRs. However, it is very likely that sufficient per-formance can be achieved at the current stage due to issues such as packet delay. Another method is wired connection between SR and CT, which can ensure superior communication performance. However, this means of commu-nication greatly reduces the amount of free-dom in SR operation due to the cable. We should strive for future study on wireless ad hoc networks whereby all SR-CT communica-tion is enabled. In the meantime, however, we propose a realistic solution that consists of a hybrid ad hoc network, which has the advan-tages of both wired and wireless communica-tion. This network consists of SRs, which are equipped with wireless terminals, an access point (AP) that is set by robots called trailer robots (TRs), and wired LAN cables that con-nect AP and CT. The TR is engaged only in laying wire cables and APs, and does not par-ticipate in the search operation. SR establishes wireless communication directly with the AP that is laid by the TR. The AP has both a wire-less LAN interface and a wired LAN inter-face, and communicates with CT via a wired LAN. With the use of this hybrid network, communication performance between the SR and the CT is expected to be higher than in a multihop wireless network, while the freedom of movement in SR operation can be main-tained.
In Section 3.2 and later sections, a hybrid ad hoc network is modeled for use in a rectan-gular confined space and a crank-shaped con-fined space. We also discuss evaluating the performance using two different scenarios applied to SR movement.

Journal of the National Institute of Information and Communications Technology Vol. 58 Nos. 1/2 2011120
3.2 Modeling of a hybrid ad hoc net-work for use in search operations within a rectangular confined space
Figure 14 shows the model for a hybrid ad hoc network in a rectangular confined space. Here, we assume that there are no obstacles in the confined space. The following section describes how the robots move in the search operations and how the hybrid ad hoc network is configured.a) TR departs from the starting point shown in
Fig. 14, moves in a straight line at constant velocity, installing a 700-meter long Ether-net cable equipped with IEEE 802.11g wireless LAN APs at every 50 meters, and stops. In total, 15 APs are installed, includ-ing the one installed at the starting point. The control terminal (CT) is connected at the starting point. Channels are configured so that neighboring APs can prevent any overlap in the wireless LAN frequency.
b) SRs depart from the starting point, and move in accordance with the scenarios described later. SRs are equipped with wireless terminals, and make wireless com-munication with the installed APs by using IEEE 802.11g wireless LAN. The CT con-trols the SRs by means of wired and wire-less communication, while video data from cameras on the SRs is transmitted to the CT by means of wireless and wired communi-cation. Along with the movement, each SR continues communication through roaming APs that are installed, and continues to transmit video data from its camera to the CT.
In total, there are 14 SRs.
We designed two movement scenarios for SRs: the simultaneous scenario and the sequential scenario. The simulations were conducted using these scenarios. Details of the scenarios are described in the following sec-tion. 3.2.1 Simultaneous scenario
In this scenario, 14 SRs depart simultane-ously from the starting point when TR starts moving. The movement of each SR follows the sequence below: i ) During the time Tm, move at a specified
velocity in the direction in which TR moves (x > 0) and in the direction of a ran-domly defined angle θ (‒90˚< θ < 90˚).
ii ) Stop during the time Ts. iii) During the time Tm, move in the direction
of a randomly defined angle θ (‒180˚< θ < 180˚).
iv) Stop during the time Ts. v ) Repeat i) to iv) for (NSR ‒ 1 ) × 10 times.
NSR is the number assigned to each SR, and shall satisfy 1 ≤ NSR ≤ 14.
vi) Repeat iii) and iv). 3.2.2 Sequential scenario
In this scenario, when 100 seconds have elapsed from the time when TR started mov-ing, one out of the fourteen SRs departs from the starting point. In 25 second, the next SR departs from the starting point. In the same manner, one SR departs every 25 seconds from the starting point sequentially. Each SR is assigned a number, as are the 14 APs other than the AP at the starting point. The SR moves lineally toward the location of AP, which has a corresponding number, then moves in accordance with the following sequence: i ) During the time Tm, move in the direction
of a randomly defined angle θ (‒180˚< θ < 180˚).
ii ) Stop during the time Ts. iii) Repeat i) and ii).
3.3 Results and discussions of simula-tion in a rectangular confined space
By using the models in Section 3.2, we
Starting point
Fig.14 Model of hybrid ad hoc network in a rectangular shaped close space
121GYODA Koichi et al.
conducted the simulation for each scenario. The parameters used for the simulation are shown in Table 2. For the simulation, OPNET ver. 11.5 was used.
We used two values as performance evalu-ation indicators: coverage rate and data deliv-ery rate. The coverage rate is the ratio of the area that was captured at least once by the cameras installed on all SRs that moved dur-ing the simulation time. The ratio of the cap-tured area against total area size of the con-fined space is applied. Here, the camera installed on the SR can capture the range with-in a circle having a radius of five meters cen-tered on the position of SR. The coverage rate is assumed to be an indicator that represents how much of the confined space was searched. The data delivery rate is evaluated for video data and control data respectively. The data delivery rate for video data is the ratio of the amount of video data received by the CT from the SRs against the amount of transmitted video data from the SRs. The data delivery rate of the control data is the ratio of the amount of control data received by the SRs and CT against the amount of control data transmitted by the CT and SRs.
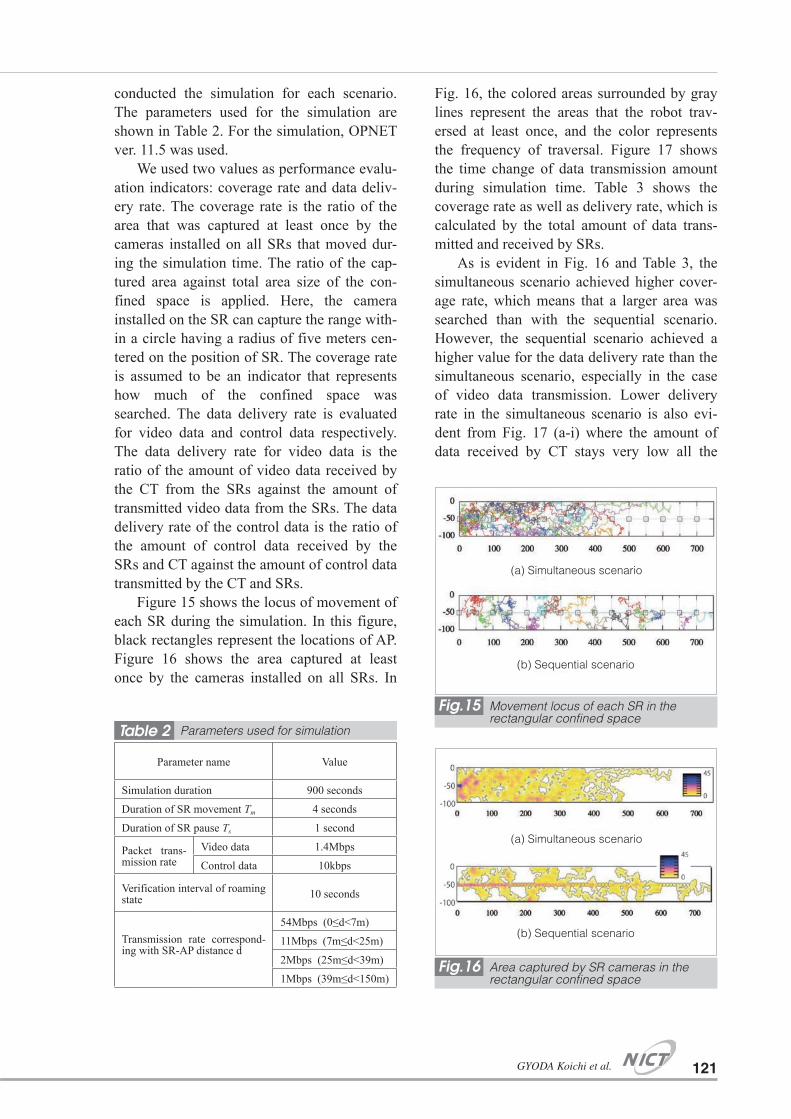
Figure 15 shows the locus of movement of each SR during the simulation. In this figure, black rectangles represent the locations of AP. Figure 16 shows the area captured at least once by the cameras installed on all SRs. In
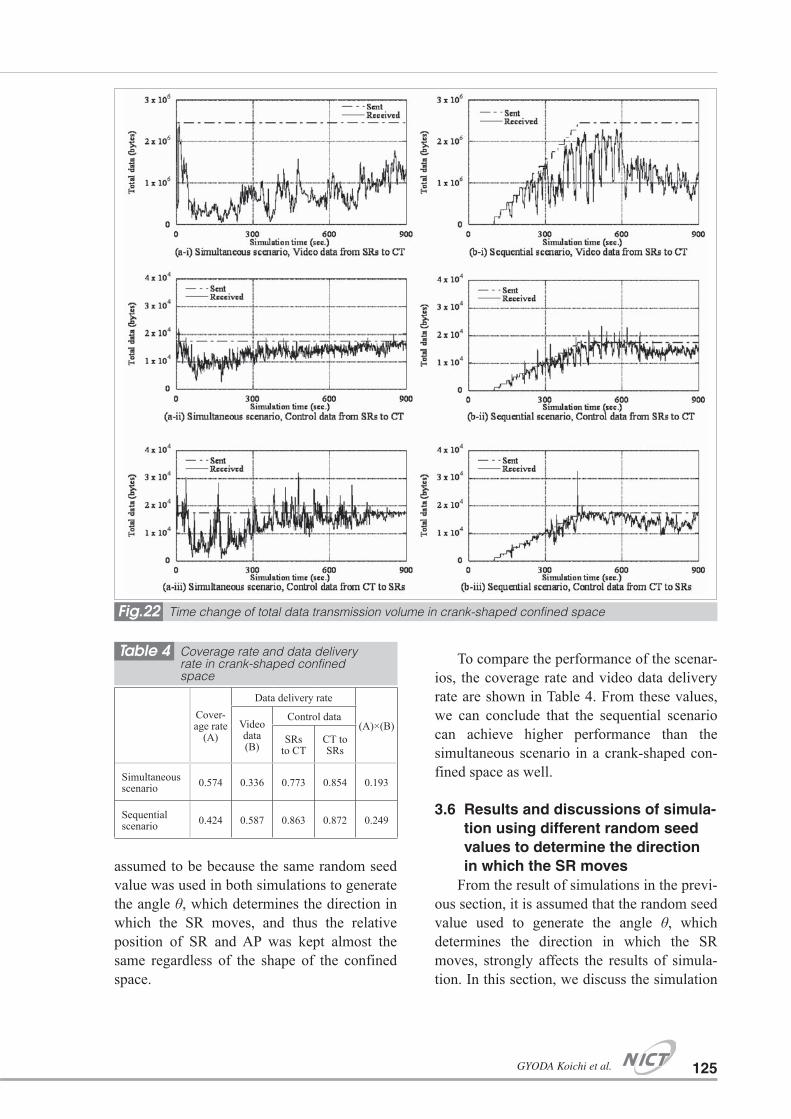
Fig. 16, the colored areas surrounded by gray lines represent the areas that the robot trav-ersed at least once, and the color represents the frequency of traversal. Figure 17 shows the time change of data transmission amount during simulation time. Table 3 shows the coverage rate as well as delivery rate, which is calculated by the total amount of data trans-mitted and received by SRs.
As is evident in Fig. 16 and Table 3, the simultaneous scenario achieved higher cover-age rate, which means that a larger area was searched than with the sequential scenario. However, the sequential scenario achieved a higher value for the data delivery rate than the simultaneous scenario, especially in the case of video data transmission. Lower delivery rate in the simultaneous scenario is also evi-dent from Fig. 17 (a-i) where the amount of data received by CT stays very low all the
Parameter name Value
Simulation duration 900 seconds
Duration of SR movement Tm 4 seconds
Duration of SR pause Ts 1 second
Packet trans-mission rate
Video data 1.4Mbps
Control data 10kbps
Verification interval of roaming state 10 seconds
Transmission rate correspond-ing with SR-AP distance d
54Mbps (0≤d<7m)
11Mbps (7m≤d<25m)
2Mbps (25m≤d<39m)
1Mbps (39m≤d<150m)
Table 2 Parameters used for simulation
Fig.15 Movement locus of each SR in the rectangular confined space
Fig.16 Area captured by SR cameras in the rectangular confined space
(a) Simultaneous scenario
(a) Simultaneous scenario
(b) Sequential scenario
(b) Sequential scenario

Journal of the National Institute of Information and Communications Technology Vol. 58 Nos. 1/2 2011122
time, except for a while after the start of simu-lation. A possible cause of this issue may be that a large number of SRs attempt to access the APs simultaneously at the start of simula-tion in the simultaneous scenario, which may have caused packet collision at the APs. This
is evident from the fact that, in Fig. 16, which shows the area captured at least once by all SR cameras, the SRs traversed around the starting point many times, according to the area color. In the sequential scenario, according to the area color shown in Fig. 16, it is evident that the SRs are more distributed than in the case of the simultaneous scenario. As a result, it is assumed that packet collisions occurred less frequently than in the case of the simultaneous scenario.
Also, the video data delivery rate is observed to decrease in the sequential scenario after 600 seconds of simulation time. To iden-tify the reason, we investigated the time change of the wireless LAN transmission rate between the SRs and APs during simulation. The wireless LAN transmission rate gradually
Cover-age rate
(A)
Data delivery rate
(A)×(B)Video data (B)
Control data
SRs to CT
CT to SRs
Simultaneous scenario 0.594 0.296 0.759 0.834 0.176
Sequential scenario 0.464 0.588 0.885 0.879 0.273
Table 3 Coverage rate and data delivery rate in rectangular shaped confined space
Fig.17 Time change of total data transmission volume in rectangular confined space

123GYODA Koichi et al.
varies in accordance with the distance between the SR and AP within the range of 1 Mbps to 54 Mbps, as shown in Table 2. Figure 18 shows time change of the number of SRs using each transmission rate. When comparing Fig. 18 (b) to Fig. 17 (b-i), the fluctuation in the number of SRs that use a transmission rate larger than 2 Mbps closely corresponds with the trend in change of received data amount. This means that, when transmitting video data, a transmission rate of 1 Mbps does not pro-vide sufficient bandwidth, and data from the SRs using this transmission rate is not deliv-ered to the CT. In the simultaneous scenarios as well, when comparing Fig. 18 (a) to Fig. 17 (a-i), the fluctuation in the number of SRs that use a transmission rate larger than 2 Mbps closely corresponds with the trend in the change of received data amount.
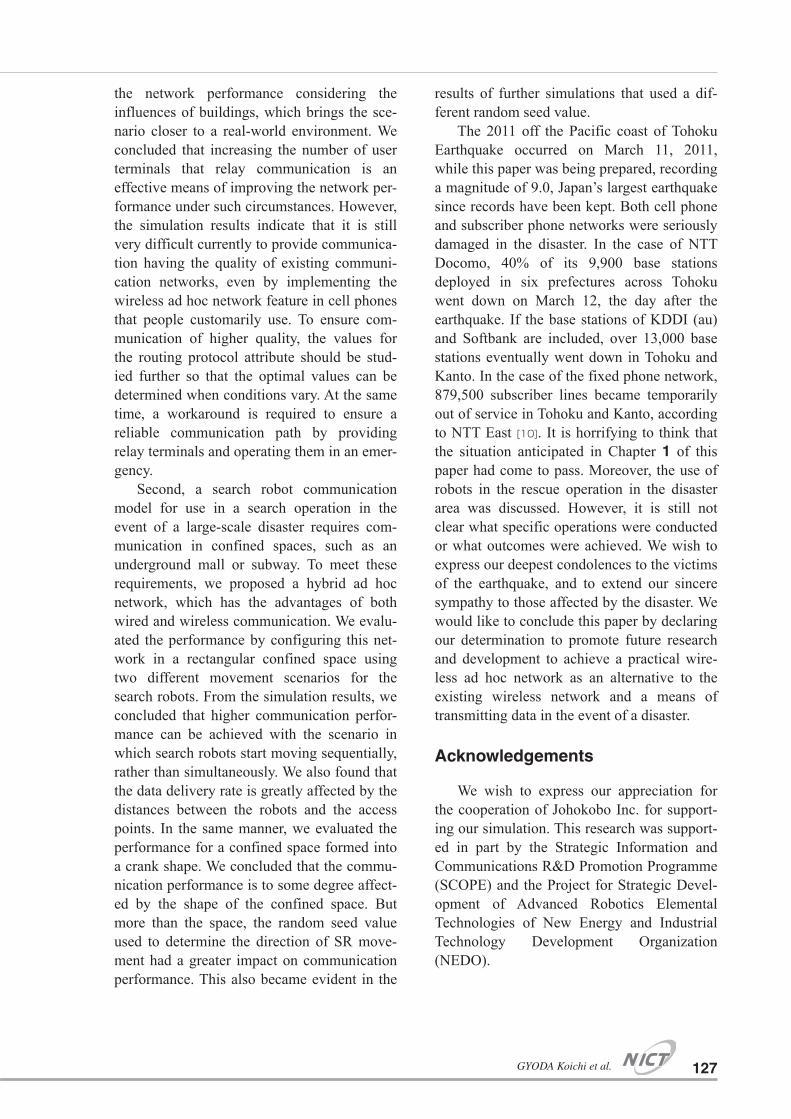
To compare the performance of the scenar-ios, the coverage rate and video data delivery rate are shown in Table 3. From these values, we can conclude that the sequential scenario achieves higher performance than the simulta-
neous scenario. As is evident in Table 3, the sequential scenario achieved a higher value also for the control data delivery rate.
3.4 Modeling of hybrid ad hoc network for use in search operation within a crank shaped confined space
In this section, we describe the modeling of hybrid ad hoc network for use in a confined space that is shaped into the form of a crank, as shown in Fig. 19. As in Section 3.2, we assume that no obstacle exists in the confined space. The following section describes how the robots move during the search operation and how the hybrid ad hoc network is config-ured:a) As in Section 3.2, TR departs from the
starting point shown in Fig. 19, moves in a straight line at a constant velocity, installing a 700 meter long Ethernet cable equipped with IEEE 802.11g wireless LAN APs every 50 meters. After moving 250 meters, turn right through 90 degrees. After moving 200 meters, turn left through 90 degrees, then move 250 meters, and stop.
b) As in Section 3.2, SRs depart from the starting point, and move in accordance with the simultaneous scenario or the sequential scenario. However, in the simultaneous sce-nario, the direction of movement differs depending on the position of the SR. If the SR position is in the area (A) or (C) shown in Fig. 19, i) of the simultaneous scenario in Section 3.2 is executed. If the SR position is in the area (B) shown in Fig. 19, x > 0 in
0
2
4
6
8
10
12
14
0 100 200 300 400 500 600 700 800 900Simulation time (sec.)
Num
ber o
f SRs
54Mbps 11Mbps 2Mbps 1Mbps
(a)
0
2
4
6
8
10
12
14
0 100 200 300 400 500 600 700 800 900Simulation time (sec.)
Num
ber o
f SRs
54Mbps 11Mbps 2Mbps 1Mbps
(b)
Fig.18 Time change of SR transmission rate in rectangular confined space
Starting point
Fig.19 Model of hybrid ad hoc network in a crank shaped close space
(a) Simultaneous scenario
(b) Sequential scenario
Journal of the National Institute of Information and Communications Technology Vol. 58 Nos. 1/2 2011124
i) is replaced by y < 0. This means that the angle is determined so that SR moves from the top to the bottom of this figure. Further-more, in the sequential scenario, each SR traces the movement locus of TR when moving to the corresponding AP.
We designed two movement scenarios for SRs: the simultaneous scenario and the sequential scenario. The simulations were conducted using these scenarios.
3.5 Results and discussions of simula-tion in the crank-shaped confined space
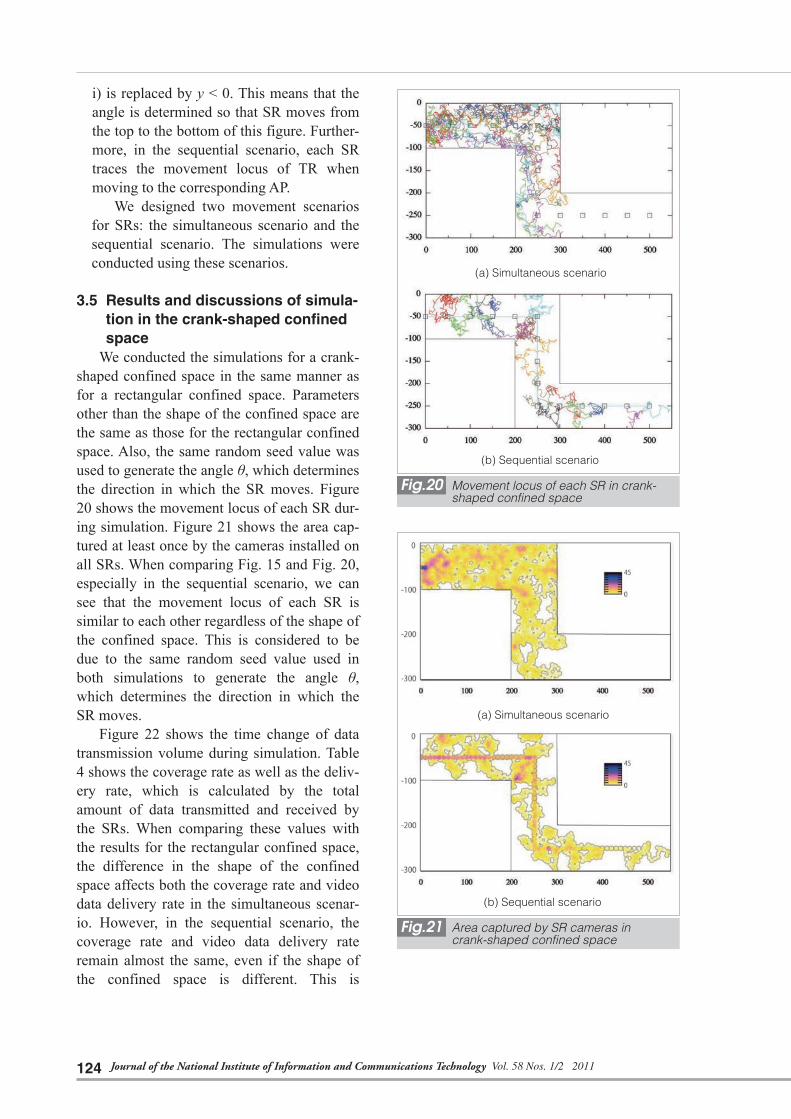
We conducted the simulations for a crank-shaped confined space in the same manner as for a rectangular confined space. Parameters other than the shape of the confined space are the same as those for the rectangular confined space. Also, the same random seed value was used to generate the angle θ, which determines the direction in which the SR moves. Figure 20 shows the movement locus of each SR dur-ing simulation. Figure 21 shows the area cap-tured at least once by the cameras installed on all SRs. When comparing Fig. 15 and Fig. 20, especially in the sequential scenario, we can see that the movement locus of each SR is similar to each other regardless of the shape of the confined space. This is considered to be due to the same random seed value used in both simulations to generate the angle θ, which determines the direction in which the SR moves.
Figure 22 shows the time change of data transmission volume during simulation. Table 4 shows the coverage rate as well as the deliv-ery rate, which is calculated by the total amount of data transmitted and received by the SRs. When comparing these values with the results for the rectangular confined space, the difference in the shape of the confined space affects both the coverage rate and video data delivery rate in the simultaneous scenar-io. However, in the sequential scenario, the coverage rate and video data delivery rate remain almost the same, even if the shape of the confined space is different. This is
Fig.20 Movement locus of each SR in crank-shaped confined space
Fig.21 Area captured by SR cameras in crank-shaped confined space
(a) Simultaneous scenario
(b) Sequential scenario
(a) Simultaneous scenario
(b) Sequential scenario
125GYODA Koichi et al.
assumed to be because the same random seed value was used in both simulations to generate the angle θ, which determines the direction in which the SR moves, and thus the relative position of SR and AP was kept almost the same regardless of the shape of the confined space.
To compare the performance of the scenar-ios, the coverage rate and video data delivery rate are shown in Table 4. From these values, we can conclude that the sequential scenario can achieve higher performance than the simultaneous scenario in a crank-shaped con-fined space as well.
3.6 Results and discussions of simula-tion using different random seed values to determine the direction in which the SR moves
From the result of simulations in the previ-ous section, it is assumed that the random seed value used to generate the angle θ, which determines the direction in which the SR moves, strongly affects the results of simula-tion. In this section, we discuss the simulation
Table 4 Coverage rate and data delivery rate in crank-shaped confined space
Fig.22 Time change of total data transmission volume in crank-shaped confined space
Cover-age rate
(A)
Data delivery rate
(A)×(B)Video data (B)
Control data
SRs to CT
CT to SRs
Simultaneous scenario 0.574 0.336 0.773 0.854 0.193
Sequential scenario 0.424 0.587 0.863 0.872 0.249

Journal of the National Institute of Information and Communications Technology Vol. 58 Nos. 1/2 2011126
for which a different random seed value was applied. Figure 23 shows the movement locus of the SR when the simultaneous scenario is used in the rectangular and crank-shaped con-fined spaces. Figure 24 shows the area cap-tured at least once by the cameras installed on all SRs. Table 5 shows the coverage rate as well as the delivery rate, which is calculated by the total amount of data transmitted and received by the SRs. A comparison of Table 5, Table 3, and Table 4 shows that the coverage rate and video data delivery rate diverge large-ly when the random seed value was changed, especially in the case of the crank-shaped con-fined space. This is because, as evident when comparing Fig. 20 (a) and Fig. 24 (b), chang-ing the random seed value causes the move-ment locus of the SR to change greatly as well.
4 Conclusion
In this paper, we proposed two practical models for the use of a wireless ad hoc net-work in the event of a disaster, and presented evaluation results obtained through the analy-sis of network performance for each model by using the network simulator.
First, to design an urban communication model that can be used in the event of a large-scale disaster, we simulated the actual road geography of an existing urban area, and pro-posed the Real City model in which user ter-minals move along the simulated roads. We also conducted a comparison with the conven-tional Random Waypoint model, which is in most widespread use. We concluded that the data delivery rate in the Real City model is lower than in the Random Waypoint model, and showed that the data delivery rate can be improved by optimizing the routing protocol attribute values. Next, we evaluated the details of the network performance for the Real City model applied in the event of an actual disas-ter by assuming that the application handles video data, and communication is made for the required amount of data in accordance with this purpose. In addition, we evaluated
Table 5 Coverage rate and data delivery rate when the random seed value is changed in the simultaneous scenario
Fig.23 Movement locus of each SR when the random seed value is changed in the simultaneous scenario
Fig.24 Area captured by SR cameras when the random seed value is changed in the simultaneous scenario
(a) Rectangular confined space
(a) Rectangular confined space
(b) Crank-shaped confined space
(b) Crank-shaped confined space
Cover-age rate
(A)
Data delivery rate
(A)×(B)Video data (B)
Control data
SRs to CT
CT to SRs
Rectangular confined space
0.537 0.299 0.745 0.719 0.161
Crank-shaped confined space
0.531 0.298 0.753 0.787 0.158
127GYODA Koichi et al.
the network performance considering the influences of buildings, which brings the sce-nario closer to a real-world environment. We concluded that increasing the number of user terminals that relay communication is an effective means of improving the network per-formance under such circumstances. However, the simulation results indicate that it is still very difficult currently to provide communica-tion having the quality of existing communi-cation networks, even by implementing the wireless ad hoc network feature in cell phones that people customarily use. To ensure com-munication of higher quality, the values for the routing protocol attribute should be stud-ied further so that the optimal values can be determined when conditions vary. At the same time, a workaround is required to ensure a reliable communication path by providing relay terminals and operating them in an emer-gency.
Second, a search robot communication model for use in a search operation in the event of a large-scale disaster requires com-munication in confined spaces, such as an underground mall or subway. To meet these requirements, we proposed a hybrid ad hoc network, which has the advantages of both wired and wireless communication. We evalu-ated the performance by configuring this net-work in a rectangular confined space using two different movement scenarios for the search robots. From the simulation results, we concluded that higher communication perfor-mance can be achieved with the scenario in which search robots start moving sequentially, rather than simultaneously. We also found that the data delivery rate is greatly affected by the dis tances between the robots and the access points. In the same manner, we evaluated the performance for a confined space formed into a crank shape. We concluded that the commu-nication performance is to some degree affect-ed by the shape of the confined space. But more than the space, the random seed value used to determine the direction of SR move-ment had a greater impact on communication performance. This also became evident in the
results of further simulations that used a dif-ferent random seed value.
The 2011 off the Pacific coast of Tohoku Earthquake occurred on March 11, 2011, while this paper was being prepared, recording a magnitude of 9.0, Japan’s largest earthquake since records have been kept. Both cell phone and subscriber phone networks were seriously damaged in the disaster. In the case of NTT Docomo, 40% of its 9,900 base stations deployed in six prefectures across Tohoku went down on March 12, the day after the earthquake. If the base stations of KDDI (au) and Softbank are included, over 13,000 base stations eventually went down in Tohoku and Kanto. In the case of the fixed phone network, 879,500 subscriber lines became temporarily out of service in Tohoku and Kanto, according to NTT East [10]. It is horrifying to think that the situation anticipated in Chapter 1 of this paper had come to pass. Moreover, the use of robots in the rescue operation in the disaster area was discussed. However, it is still not clear what specific operations were conducted or what outcomes were achieved. We wish to express our deepest condolences to the victims of the earthquake, and to extend our sincere sympathy to those affected by the disaster. We would like to conclude this paper by declaring our determination to promote future research and development to achieve a practical wire-less ad hoc network as an alternative to the existing wireless network and a means of transmitting data in the event of a disaster.
Acknowledgements
We wish to express our appreciation for the cooperation of Johokobo Inc. for support-ing our simulation. This research was support-ed in part by the Strategic Information and Communications R&D Promotion Programme (SCOPE) and the Project for Strategic Devel-opment of Advanced Robotics Elemental Technologies of New Energy and Industrial Technology Development Organization (NEDO).

Journal of the National Institute of Information and Communications Technology Vol. 58 Nos. 1/2 2011128
References 1 S. Komaki , “Wireless LAN and Ubiquitous Network,” pp. 175–180, Maruzen, 2004. (in Japanese)
2 ARIB IMT-2000 Study Committee, “Evaluation Methodology for IMT-2000 Radio Transmission Technolo-
gies (Version 1.1) ,” pp. 35–37, Sep. 1998.
3 C. Perkins, E. B. Royer, and S. Das, “Ad Hoc On Demand Distance Vector (AODV) Routing,” IETF RFC
3561, Jul. 2003.
4 T. Clausen and P. Jacquet, “Optimized Link State Routing Protocol (OLSR),” IETF RFC 3626, Oct. 2003.
5 OPNET Technologies Website, http://www.opnet.com/
6 J.-E.Berg, “A Recursive Method For Street Microcell Path Loss Calculations,” Proc. of PIMRC’95, Vol. 1,
pp. 140–143, Sep. 1995.
7 Report of survey on the trend of communication usage by the Ministry of Internal Affairs and Communi-
cations (family unit edition),
http://www.soumu.go.jp/johotsusintokei/statistics/pdf/HR200800_001.pdf
(in Japanese)
8 The population data of basic resident register by age and by town in Sendai city ,
http://www.city.sendai.jp/kikaku/seisaku/toukei/jinkou/kakusai/h2110.xls
(in Japanese)
9 T. Masaki, M. Teshima, and T. Miyasaka, “Wireless LAN Antenna Location in Notebook PCs,” Toshiba
review, Vol. 58, No. 11, pp. 21–24, 2003.
10 S. Okabayashi “There is no knowing when telephone system will be restored,” The ASAHI Shinbun,
Tokyo 14th ed., p. 7, Mar. 25th 2011. (in Japanese)
(Accepted March 30, 2011)

129GYODA Koichi et al.
†1 Currently, Professor, Department of Electrical Communications, College of Engineering, Shibaura Institute of Technology†2 Currently, Lecturer, University of Engineering and Technology, Vietnam National University†3 Currently, Associate Professor, Department of Mechanical Systems Engineering, Faculty of Engineering, Kogakuin University†4 Currently, Senior Researcher, Space Communication Systems Laboratory, Wireless Network Research Institute†5 Currently, Manager, Technology Transfer Promotion Office, Outcome Promotion Department
GYODA Koichi, Ph.D.†1
Associate Professor, Department of Electrical Communications, College of Engineering, Shibaura Institute of Technology / Former: Senior Researcher, Disaster Management and Mitigation Group, Information Security Research Center (April 2006 – March 2008)
Antenna Enginnering, Emergency Communication System
Hoang Nam Nguyen, Ph.D.†2
Expert Researcher, Disaster Management and Mitigation Group, Information Security Research Center (April 2006 – March 2011)
Communication Networks for Emergency and Crisis Management: Issues of System Models, Security, Capacity and Quality-of-Service
HADA Yasushi, Ph.D.†3
Expert Researcher, Disaster Management and Mitigation Group, Information Security Research Center (April 2007 – March 2011)
Robotics, Intelligent Systems, Ubiquitous Network
OKADA Kazunori, Ph.D.†4
Senior Researcher, Disaster Management and Mitigation Group, Information Security Research Center (April 2006 – March 2011) / Visiting Professor, Graduate School of Information Systems, The University of Electro-Communications
Communication Network, Mobile Communications, Emergency Communications
TAKIZAWA Osamu, Ph.D.†5
Group Leader, Disaster Management and Mitigation Group (April 2006 – March 2011) / Group Leader, Security Fundamentals Group (May 2008 – March 2010), Information Security Research Center
Telecommunication for Disaster Management, Application Security