Embed Size (px)
Citation preview
arX
iv:1
312.
3181
v1 [
astr
o-ph
.GA
] 1
1 D
ec 2
013
TRIGONOMETRIC PARALLAXES TO STAR-FORMING
REGIONS WITHIN 4 kpc OF THE GALACTIC CENTER
A. Sanna1, M. J. Reid2, K. M. Menten1, T. M. Dame2, B. Zhang1, M. Sato1, A.
Brunthaler1, L. Moscadelli3, K. Immer1
ABSTRACT
We report four trigonometric parallaxes for high-mass star-forming regions
within 4 kpc of the Galactic center. These measurements were made with the
VLBA as part of the BeSSeL Survey. By associating these sources kinematically
with large-scale features in CO and H i longitude-velocity diagrams, we begin to
outline some major features of the inner Milky Way: the Connecting arm, the
near and far 3 kpc arms, and the Norma arm. The Connecting arm in the first
Galactic quadrant lies closer to the Galactic center than the far 3 kpc arm and is
offset by the long-bar’s major axis near its leading edge, supporting the presence
of an inner Lindblad resonance. Assuming the 3 kpc arms are a continuous
physical structure, the relative Galactocentric distance of its near and far sides
suggests highly elliptical streamlines of gas around the bar(s) and a bar corotation
radius, rCR & 3.6 kpc. At a Galactic longitude near 10◦ and a heliocentric
distance of about 5 kpc, the near 3 kpc arm and the Norma arm intersect on
a face-on view of our Galaxy, while passing at different Galactic latitudes. We
provide an accurate distance measurement to the W31 star-forming complex of
4.95+0.51−0.43 kpc from the Sun, which associates it with a bright CO feature belonging
to the near 3 kpc arm.
Subject headings: astrometry — Galaxy: fundamental parameters — Galaxy:
kinematics and dynamics — masers — techniques: high angular resolution —
stars: individual: W31, G010.62−00.38, G010.47+00.02
1Max-Planck-Institut fur Radioastronomie, Auf dem Hugel 69, 53121 Bonn, Germany
2Harvard-Smithsonian Center for Astrophysics, 60 Garden Street, Cambridge, MA 02138, USA
3INAF, Osservatorio Astrofisico di Arcetri, Largo E. Fermi 5, 50125 Firenze, Italy
– 2 –
1. Introduction
The so-called Galactic Molecular Ring (GMR) is a ridge of intense emission which dom-
inates the appearance of extended CO gas in the longitude-velocity (ℓ-v) diagram of our
Galaxy (e.g., Dame et al. 2001). This prominent feature marks a region of enhanced molec-
ular density roughly halfway between the Sun and the Galactic center, at Galactocentric
radii (R) between 4 and 6 kpc, which has been shown to likely trace gas emission from the
inner spiral arms (e.g., Dobbs & Burkert 2012). Toward the Galactic center, the inner edge
of the GMR would coincide with the Scutum-Centaurus arm, which we have recently located
at an average Galactocentric radius of about 5 kpc (Sato et al., submitted.). Hereafter, we
will refer to the region from the inner edge of the GMR to the Galactic center as the inner
Milky Way.
As part of the Bar and Spiral Structure Legacy (BeSSeL) Survey 1, we started a detailed
study of the gas distribution and velocity field in the inner Milky Way, via trigonometric par-
allaxes and proper motions of masers in high-mass star-forming regions (HMSFRs). In this
paper, we constrain some structures located in between the GMR and the Central Molecular
Zone (CMZ; e.g., Morris & Serabyn 1996) in the first Galactic quadrant. These structures
include the Connecting arm (e.g., Fux 1999; Marshall et al. 2008), the near and far 3 kpc
arms (e.g., Dame & Thaddeus 2008), and the Norma arm as it is traced toward the Galactic
center (e.g., Bronfman et al. 2000). The Connecting arm has received little discussion in
the literature (e.g., Fux 1999 for a short summary; see also Rodriguez-Fernandez & Combes
2008, and references therein). It has been suggested to possibly appear similar to dust lanes
observed in optical images of external galaxies along the extent of their bars, roughly con-
necting the nuclear ring with the inner tips of the spiral arms (e.g., see the Hubble Space
Telescope composite view of the prototypical barred spiral galaxy NGC1300, or that of
NGC1097). These dust lanes, often observed offset toward the leading edges of the bar
structure in barred spirals, have been identified as tracers of shocks (e.g., Roberts et al.
1979; Athanassoula 1992b). In the following discussion, we will assume a general picture of
the inner Galaxy as depicted in Churchwell et al. (2009), which accounts for the presence of
two bar-like components: the boxy-bulge (i.e., the Galactic bar) and the long bar.
In this paper, we present trigonometric parallax measurements of 22 GHz H2O and
12 GHz CH3OH masers obtained with the Very Long Baseline Array (VLBA) for four sites
of massive star formation located in the inner Galaxy.
1See the BeSSeL website at the following URL: http://bessel.vlbi-astrometry.org/
– 3 –
2. OBSERVATIONS
We conducted multi-epoch VLBA (program BR145) 2 observations of the 616−523 H2O
(rest frequency 22.235079 GHz) and the 20 − 3−1E CH3OH (rest frequency 12.178597 GHz)
maser emission toward the four HMSFRs listed in Table 1. In order to measure trigonomet-
ric parallaxes and proper motions, we switched rapidly between a maser target and three
or four extragalactic continuum sources. These calibrators were selected from our survey
(Immer et al. 2011) and included ICRF sources (Fey et al. 2004) with accurate positions
(±2 mas). We placed four geodetic-like blocks throughout each 7-hour track, in order to
measure and remove atmospheric delays for each antenna. Details about the observational
strategy can be found in Reid et al. (2009a, see also Sato et al. 2010). Observation and
source information are summarized in Tables 1 and 2.
Four adjacent intermediate frequency (IF) bands, each 8 MHz wide, were recorded in
dual circular polarization; each band was correlated to produce 256 spectral channels. The
channel width of 31.25 kHz corresponds to a spectral resolution of 0.42 and 0.77 km s−1
for the H2O and CH3OH maser transitions, respectively. The third IF band was centered
about the LSR velocity (VLSR) of the strongest maser feature detected in our preparatory
survey, as reported in Table 1 (under program BR145A). The data were processed with the
VLBA DiFX software correlator in Socorro (Deller et al. 2007) using an averaging time of
about 1 s, which limited the instantaneous field of view of the interferometer to about 3′′ and
5′′ for the H2O and CH3OH maser observations, respectively. Data were reduced with the
NRAO Astronomical Image Processing System (AIPS) following the procedure described in
Reid et al. (2009a), using a ParselTongue scripting interface (Kettenis et al. 2006). Total-
power spectra of the 22.2 and 12.2 GHz maser emission toward G010.47+00.02, G010.62–
00.38, G012.02–00.03, and G023.70–00.19 from the first epoch data are shown in Figure 1.
3. RESULTS
We modeled the position offsets of compact maser spots with respect to background
sources as a function of time, in order to determine their parallaxes and proper motions (e.g.,
Reid et al. 2009a for details). During the fitting procedure, we quantified “a posteriori” the
systematic errors, via error-floors added in quadrature to the formal fitting uncertainties,
for the E–W and N–S offsets. These error floors were iteratively adjusted to yield values
2The VLBA is operated by the National Radio Astronomy Observatory (NRAO). The NRAO is a facility
of the National Science Foundation operated under cooperative agreement by Associated Universities, Inc.
– 4 –
of chi-squared per degree of freedom near unity. Results of the parallax and proper motion
fitting for each maser spot and QSO used are listed in Table 3 and displayed in Figures 2
to 5. For each source, individual parallax measurements with multiple maser spots and QSOs
were combined in a final measurement and plotted in the right panel of Figure 2 to 5. The
formal uncertainties of the combined fits were multiplied by√N , where N is the number
of maser spots, to account for the possibility of correlated position shifts among the maser
spots. Details on individual parallax fittings are presented in Appendix A. In Figure 6, the
Galactic locations of our sources are superposed on a schematic face-on view of the Galaxy
(re-scaled for a Sun-Galactic center distance of 8.38 kpc), with a number of spatial features
updated from the recent literature, such as the position of the Galactic (e.g., Gerhard 2002)
and long (Benjamin et al. 2005) bars as well as the streamline model of the 3 kpc arms by
Green et al. (2011).
For each source, the line-of-sight velocity component (VLSR) and the eastward and north-
ward motions on the plane of the sky (µx, µy) give the 3-dimensional velocity vector of the
star-forming region as measured with respect to the equatorial heliocentric reference frame
(after adding the standard Solar motion to VLSR). In previous papers, to investigate devi-
ations from a circular rotation about the Galactic center (i.e., the peculiar motion of the
HMSFR), we have moved to a reference frame rotating with the Galaxy (e.g., Reid et al.
2009b). However, for sources with Galactocentric distances R < 4 kpc, which may move
along highly elliptical streamlines under the influence of the bulge/bar potential, we trans-
form to a reference frame at rest at the Galactic center: (UG.C.s ,VG.C.
s ,WG.C.s ). UG.C.
s , VG.C.s ,
and WG.C.s are directed toward the Galactic center, in the direction of Galactic rotation and
toward the North Galactic Pole, respectively, at the location of each source3. In Table 4, we
summarize our results together with those obtained for the other inner Galaxy sources in
the literature. In this calculation, we adopted a current “best-estimate” of the Galactic pa-
rameters, R0 = 8.38 kpc and Θ0 = 243 km s−1, from the trigonometric parallaxes measured
with maser lines (Reid 2013) and the revised Hipparcos measurements of the Solar motion
from Schonrich et al. (2010).
3With respect to velocity components in a rotating reference frame (Us,Vs,Ws), the following relation
holds: UG.C.
s = Us,VG.C.
s = Vs +Θ(R),WG.C.
s = Ws, where Θ(R) gives the circular Galactic rotation at the
source location (cf. Reid et al. 2009b).
– 5 –
3.1. Individual Sources
It is possible to associate each of the present HMSFRs to prominent large-scale features
in CO and H i longitude-velocity diagrams of the inner Galaxy (|ℓ| < 30◦). In Figure 7, we
present a longitude-velocity diagram of extended gas emission from the Galactic CO survey
by Dame et al. (2001) with a number of structures relevant for discussing the inner few kpc
of the Galactic center. The near and far 3 kpc arms appear as outlined by Dame & Thaddeus
(2008), as parallel lanes within the range of longitudes where they can be followed clearly
in CO (−12◦ < ℓ < +13◦). Note that the far 3 kpc arm shows only weakly in Figure 7
(see Dame & Thaddeus 2008 for a detailed analysis). In the first quadrant, the line-of-sight
velocity pattern of the near side of the Connecting arm, indicated in Figure 7 following the
analysis by Fux (1999, e.g., his Figure 1 and Section 6.1), passes through the peak of the
terminal velocity curve at positive longitudes. While crossing the ℓ-v pattern of the far 3 kpc
arm at a Galactic longitude near 10◦, this feature is better isolated at negative latitudes in
both H i and CO (e.g., Figure 4 of Marshall et al. 2008). An approximate locus for the
Norma/4 kpc arm in the ℓ-v diagram is obtained by assuming a logarithmic spiral with the
following constraints: 1) an expanding motion fixed at ℓ = 0◦ of −29.3 km s−1, as obtained
from CO spectra in absorption toward the Galactic center (first noticed by Kerr 1967 in H i;
see also Greaves & Williams 1994 for CS absorption); 2) a southern tangent at a Galactic
longitude of −32.5◦ (e.g., Bronfman 2008, his Figure 2); 3) a northern tangent near 25◦ (e.g.,
Table 1 of Englmaier & Gerhard 1999, their “inner Scutum tangent”). The HMSFRs are not
expected to follow the lines in Figure 7 to any better than the 3–9 km s−1 velocity dispersion
of the molecular cloud population (e.g., Combes 1991, their Section 3.2.1). Similarly, velocity
dispersions measured from hydrogen profiles show characteristic broadening by ∼ 7 km s−1,
that may be regarded as an upper limit due to the presence of blending features (e.g., Burton
1974).
In the following, we present our results for each source and list the associated arms in the
last column of Table 4. Note that we also include two sources from previous measurements
that are of interest for a general discussion (G009.62+00.19 and G023.44−00.18).
G009.62+00.19. According to Sanna et al. (2009), on the basis of a CO latitude-
velocity analysis, this HMSFR is associated with gas along the Norma Arm at a distance
of 5.15+0.77−0.66 kpc from the Sun, which corresponds to a Galactocentric radius of 3.4 kpc for
R0 = 8.38 kpc. On the one hand, the near 3 kpc arm has an LSR velocity blueshifted by
15 to 20 km s−1 at the same longitude. The brightest CO emission from the near 3 kpc
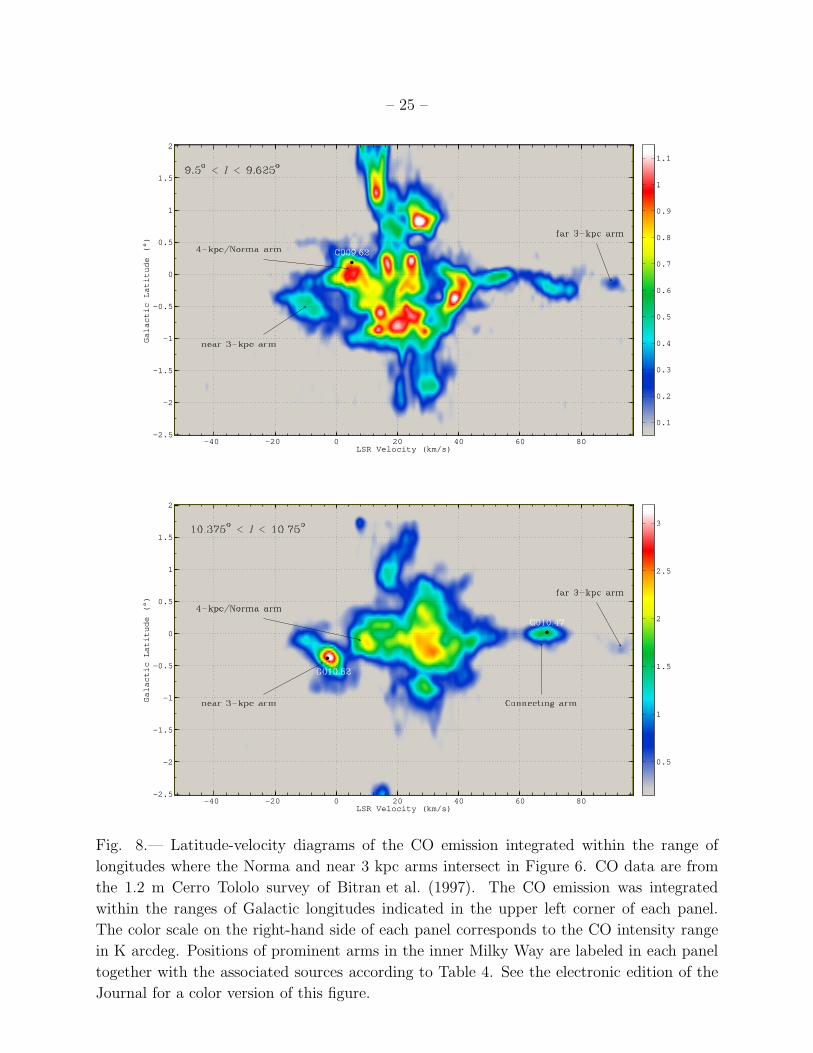
arm lies below the Galactic plane at Galactic longitudes greater than ≈ 6◦ and is offset by
about 0.5◦ in latitude, with respect to the midplane of the Galaxy, at the Galactic longitude
of the maser site (Figure 8; see also Figure 3 of Dame & Thaddeus 2008). On the other
– 6 –
hand, at ℓ ≈ 9.5◦ the Norma arm peaks at velocities between 0-10 km s−1 centered at about
zero latitude, in agreement with the Galactic location and LSR velocity of G009.62+00.19
(Figure 8). We also note that the star-forming region appears to expand from the Galactic
center at a velocity of about 36 km s−1, close to the Norma value of ≈ 30 km s−1 at zero
longitude 4 (Table 4).
G010.47+00.02. At a parallax distance of 8.55+0.63−0.55 kpc from the Sun, our measurement
translates to a Galactocentric radius of 1.6 kpc, assuming R0 = 8.38 kpc. The LSR velocity
of large-scale emission associated with G010.47+00.02 (∼ 70 km s−1) falls in the ℓ-v locus of
the Connecting arm in the first quadrant, about 20 km s−1 lower than a close by ℓ-v feature
associated with the far 3 kpc arm (Figure 7). At the longitude of the source, the far 3 kpc
arm shows a bump of faint emission below the Galactic plane (Figure 8; see also Figure 3
of Dame & Thaddeus 2008), whereas G010.47+00.02 lies close to zero latitude, a few tens
of parsec above the Galactic plane. On the other hand, by comparing the velocity profile
of the Connecting arm at ℓ ∼ 10.5◦ with the latitude-velocity maps of Bitran et al. (1997,
our Figure 8), one can clearly see a strong CO feature centered at zero latitude at the LSR
velocity of G010.47+00.02. Therefore, we associate G010.47+00.02 with gas condensations
belonging to the Connecting arm.
G010.62−00.38. The combined parallax measurement for G010.62−00.38 is 0.202 ±0.019 mas, which corresponds to a distance of 4.95+0.51
−0.43 kpc from the Sun and a Galactocentric
radius of 3.6 kpc (for R0 = 8.38 kpc). This prominent site of star formation has a combination
of slightly negative LSR velocity (−3 km s−1) and negative Galactic latitude, which associates
the star-forming region with a bright CO feature belonging to the near 3 kpc arm (Figure 8,
lower panel). In this range of longitudes, the Norma and near 3 kpc arms are clearly separated
by about 20 km s−1 at different distances below the Galactic plane (Figure 8). G010.62−00.38
belongs to the W31 star-forming complex that has been long thought to have an intrinsic,
large, non-circular motion of several tens of km s−1. While hydrogen recombination lines
from the large-scale H ii complex show velocities near zero, which could be associated with
either nearby or very distant gas, absorption features from different molecules/transitions
have been detected up to velocities of about 50 km s−1 (see discussion in, e.g., Wilson 1974;
Caswell et al. 1975; Fish et al. 2003). Along nearly circular orbits, the terminal velocity at
ℓ ≈ 10◦ would be in excess of three times the absorption cutoff assuming a IAU Galactic
rotation speed, which would locate G010.62−00.38 on the near side of the tangent point
4In Table 4, we have assumed as the peak LSR velocity of the molecular cloud that from the CS(2–
1) survey by Bronfman et al. (1996, +5 km s−1), which is representative of the average velocity over the
whole region. In Sanna et al. (2009), we assumed a slightly smaller velocity associated with the individual
star-forming site G009.62+00.19 E.
– 7 –
(e.g., Fish et al. 2003, their Figure 1). While this argument has been questioned on the
basis of a general deficiency of CO and H i gas within a Galactocentric radius of about 3 kpc
(e.g., Figure 6 of Corbel & Eikenberry 2004), the current parallax distance of 5 kpc from
the Sun indeed places W31 on the near edge of the Galactic gas hole, assuming the W31
cluster of H ii regions is physically related (cf. Corbel & Eikenberry 2004, their Figure 8).
The observed absorption cutoff is due to the radial expansion of G010.62−00.38 from the
Galactic center (∼ 60 km s−1), as inferred from its full-space kinematics (Table 4).
G012.02−00.03. We measured a combined trigonometric parallax of 0.106± 0.008 mas
for this source, corresponding to a distance of 9.43+0.77−0.66 kpc from the Sun and a Galactocentric
radius of 2.1 kpc (for R0 = 8.38 kpc). In Figure 7, the ℓ-v position of G012.02−00.03 is
associated with the locus of the far 3 kpc arm in the first Galactic quadrant, which lies close
to zero latitude at the longitude of our source (Dame & Thaddeus 2008, their Figure 3).
For ℓ ≈ 12◦, the current parallax measurement locates the far 3 kpc arm at almost half the
distance to the Galactic center of the near 3 kpc arm at a similar longitudes (Figure 6),
which has a direct implication for interpreting the nature of the 3 kpc feature of our Galaxy
(see Section 4.1).
G023.44−00.18. Brunthaler et al. (2009) measured this massive star-forming region
to be at a heliocentric distance of 5.88+1.37−0.93 kpc, or a Galactocentric radius of 3.8 kpc for
R0 = 8.38 kpc, in the general direction of the northern Norma tangent in the first Galactic
quadrant (Figure 7). According to Dame et al. (1986, their Figure 10b), at the longitude
of the source, velocities in excess of +100 km s−1 are expected for the inner regions of the
Norma arm, whereas material in the Scutum arm would show LSR velocities which are more
than 30 km s−1 below that of G023.44−00.18. Therefore, we associate G023.44−00.18 as
belonging to the Norma arm near its tangent.
G023.70–00.19. The distance to this star formation site is 6.21+1.0−0.80 kpc, which corre-
sponds to a Galactocentric radius of 3.7 kpc (for R0 = 8.38 kpc). This measurement locates
G023.70−00.19 only a few hundred pc away from G023.44−00.18 in a similar direction be-
low the Galactic plane, which argues for an association with the Norma arm. As shown in
Figure 7, its LSR velocity of about +77 km s−1 associates the star-forming region to gas
emission at the low-longitude edge of a “gas hole” near ℓ ∼ 25◦. According to Cohen et al.
(1980, their Figure 2), molecular gas at velocities between 70-90 km s−1 and Galactic lon-
gitudes between 23◦ and 25◦ is associated with the Norma arm. At a similar longitude,
gas belonging to the nearby Scutum arm shows LSR velocities less than +60 km s−1 that
involves CO emission below the gas hole. Therefore, we associate G023.70–00.19 with gas
condensations in the Norma arm.
– 8 –
4. Discussion
Together with the two previous measurements listed in Table 4, the HMSFRs pre-
sented here sample the inner regions of the Milky Way at Galactic longitudes from +9.6◦
to +23.7◦ and Galactocentric radii between 1.6 and 3.8 kpc. In the inner Galaxy, the mass
distribution of the Galactic (nested) bar(s) provides non-axisymmetric gravitational pertur-
bations on gas and stellar orbits, whereas a nearly flat rotation curve is generally measured
between Galactocentric radii of about 4 to 13 kpc (e.g., Reid et al. 2009b, Honma et al.
2012). Under the influence of a bar potential, highly non-circular streamlines of gas and
stellar orbits are indeed expected as for the families of periodic orbits, x1, x2, and x3 (e.g.,
Contopoulos & Papayannopoulos 1980; van Albada & Sanders 1982; Athanassoula 1992a);
these streamlines would appear on ℓ − v diagrams as parallelogram-shaped features (e.g.,
Binney et al. 1991; Bureau & Athanassoula 1999). A comparison of the measured LSR ve-
locities with those expected for circular orbits (e.g., Englmaier & Gerhard 1999) at the lon-
gitudes and Galactocentric distances of our sample shows, in general, differences of several
tens of km s−1 (e.g., Sanna et al. 2009). From Table 4, a weighted average of the rotation
speed of HMSFRs in the inner Milky Way differs by about −40±5 km s−1 from the rotation
speed at the Solar circle of Θ0 = 243 km s−1 (Reid 2013). This value is significantly lower
than the average peculiar motion derived for HMSFRs at Galactocentric radii greater than
4 kpc, which lag Galactic rotation by less than 10 km s−1 (e.g., Xu et al. 2013). We note
that this result does not depend sensitively on the value of Θ0 assumed in the calculation.
Evidence for a substantially flat rotation curve which drops inwards at small Galactocentric
radii are commonly observed for barred galaxies with rotation velocities comparable to the
Milky Way (e.g., Sofue et al. 1999).
Moving from the star-forming region closest to the Galactic center (G010.47+00.02) to
the one farthest from the center (G023.44−00.18), we start to fix the positions of the major
arm-like features of the inner Milky Way on a coherent face-on view (Figure 6). In the
following, we describe these constraints in brief. Within about 3 kpc of the Galactic center
and outside the CMZ, three CO features pointed out on the ℓ-v diagram of Figure 7 dominate
the gas kinematics, the near and far 3 kpc arms (yellow lines) and the Connecting arm (green
line). The Connecting arm, as fixed by the position of G010.47+00.02 at R= 1.6+0.2−0.1 kpc,
apparently runs along the far edge of the long bar, probably closer to the Galactic center
than the far 3 kpc arm, constrained at a similar longitude by the position of G012.02−00.03
at R= 2.1+0.5−0.3 kpc. The distance measurement to G010.62−00.38 further constrains the
position of the near side of the 3 kpc arm at a Galactocentric radius (R= 3.6+0.4−0.4 kpc) almost
twice that of G012.02−00.03. Despite early claims that the near 3 kpc arm was deficient in
star formation activity (e.g., Lockman 1980), at the position of our sources the CO velocity-
integrated maps show local peaks of emission (Figure 3 of Dame & Thaddeus 2008), which
– 9 –
pinpoint enhanced star formation such as in the prominent W31 complex. This is also
in agreement with the recent detection of several, massive, star formation sites from the
Methanol Multibeam Survey that are associated in longitude, latitude, and velocity with the
brightest CO emission along the 3 kpc arms (cf. Figure 2 of Green et al. 2009 and Figure 3
of Dame & Thaddeus 2008).
In the first Galactic quadrant, outward of 3 kpc from the Galactic center but within the
GMR, an annulus of less than 2 kpc in radius encompasses the northern Scutum-Centaurus,
Norma, and near 3 kpc arm tangents (Figure 6). This is evident, for instance, in the Galactic
Ring Survey of extended 13CO emission along the Galactic plane, with prominent concentra-
tions at ℓ ∼ 31◦ and 23◦ (Jackson et al. 2006, their Figure 1). While interarm distances are
expected to decrease as the arms converge to the end of the (long) bar at a Galactocentric
azimuth near 45◦ (i.e., the angle between the Sun and the source as viewed from the Galactic
center, β), our distance measurements for G009.62+00.19 and G010.62−00.38 show that the
Norma and near 3 kpc arms nearly overlap at a Galactic longitude of 10◦ (β ∼ 14◦) on
a face-on view of the Milky Way (Figure 6). On the other hand, a b-v analysis of the CO
emission from the arms at this longitude reveals that their gas distributions do not mix, with
the near 3 kpc arm passing under (at lower Galactic latitudes) the Norma arm (Figure 8).
4.1. Topics on the Inner Arm Features
The small number of measured distances to sources in the inner portion of the Galaxy
precludes a thorough discussion on individual arm features at this time. Similarly, an analysis
of the inner rotation curve (R< 4 kpc), which one would expect to have a strong azimuthal
dependence, is also premature. However, our measurements still allow us to start discussing
two specific topics.
Firstly, if the star-forming region G010.47+00.02 is located in the Connecting arm at
a longitude of ℓ ∼ 10.5◦, then it is close to the far edge of both the Galactic and “long”
bars in the first Galactic quadrant (Figure 6). According to Roberts et al. (1979, their
Section 4), streamlines of gas crossing the major axis of a bar strongly decelerate near their
maximum radial excursion, where gas approaches a potential minimum (e.g., Figure 5 and 6
of Roberts et al. 1979). A major effect of slowing down abruptly would be that gas piles
up until a shock occurs (i.e., the locus of the Connecting arm). We find for G010.47+00.02
that the VG.C.s velocity component of 122± 16 km s−1 (in the direction of Galactic rotation)
is slower by almost a factor of 2 than the circular rotation speed beyond 4 kpc in the
Galaxy. While the rotation curve is expected to drop toward the center owing to less mass
enclosed, a nearby HMSFR belonging to the far 3 kpc arm (G012.02−00.03) shows a rotation
– 10 –
speed of 215 ± 27 km s−1. This evidence suggests that the VG.C.s value of G010.47+00.02 is
likely related to the local gas dynamics, and represents an argument in favor of the shock
phenomenon as the origin of its peculiar motion. The position of the Connecting arm with
respect to the axis of the bar(s), and the direction of the gas flow along the Connecting
arm itself (UG.C.s component in Table 4), should be intimately related to the presence of
an inner Lindblad resonance (ILR) close to the Galactic center (e.g., Roberts et al. 1979;
Athanassoula 1992b; Athanassoula & Bureau 1999). If an ILR is present, or equivalently if
the x2 family of stable periodic orbits exist (i.e., orbits oriented perpendicular to the bar
major axis), the shock locus should be offset toward the leading edge of the bar; the larger
the x2 orbit along the bar minor axis, the bigger will be the offset of the Connecting arm with
respect to the major axis of the bar (e.g., Figure 5 of Athanassoula 1992b). The position of
G010.47+00.02 is offset by about 1.3 kpc (i.e., ≈ 2σ) from the direction of the major axis
of the long bar. While we cannot rule out an overestimate of our distance measurement by
2σ, the current measurement supports the Connecting arm being shifted forward (clockwise
in phase) toward the far side of the bar in the first Galactic quadrant, or alternatively it
supports the presence of an ILR. Roberts et al. (1979, their Figure 6) also predict that a
shock-focusing phenomenon should develop where an ILR is present. Given that, forced
by the ILR, the Connecting arm would be inclined with respect to the orientation of the
bar’s major axis, then streamlines of gas at different Galactocentric radii would enter the
shock front at different angles. As a result, gas along the Connecting arm in the outer
bar regions would have a net inward motion toward the Galactic center with velocities of
some tens of km s−1; at some Galactocentric radii inwards, the gas motion along the shocked
layer would invert direction, showing an instantaneous velocity component outward from the
Galactic center with velocities of the order of 100 km s−1. The overall effect of the shock-
focusing phenomenon would be to channel gas at some Galactocentric radii and enhanced
star formation activity would be expected in the region of converging flows. According to
Roberts et al. (1979), a detection of an outward motion along the Connecting arm would
be an independent confirmation for the presence of an ILR in the bar region. Our data
show a combination of offset shock and inward motion that would confine the shock-focusing
phenomenon (if present) to Galactocentric radii within about 1.6 kpc from the Galactic
center.
A second topic concerns the nature of the near and far 3 kpc arms (e.g., see the review
in Section 3.2 of Green et al. 2011). We follow the interpretation of the 3 kpc arms as a
continuous physical structure as opposed to, for instance, a combination of two, separate,
lateral arms. This assumption is based on a better match of the former interpretation to
the ℓ-v locus of the 3 kpc arm features (cf. Figure 7, 10, and 11 in Green et al. 2011).
In this context, two main ideas have been forwarded: 1) that of a circular ring with an
– 11 –
expanding motion away from the Galactic center (e.g., van der Kruit 1971), and 2) that
of an elliptical streamline of gas around the bar region (e.g., Peters 1975). An important
difference between the two models is related to the position of the 3 kpc arm with respect
to the radius of the corotation resonance (rCR, associated with the rotation pattern of the
bars): elliptical orbits are expected inside rCR, whereas nearly circular orbits should oc-
cur outside (e.g., Contopoulos & Papayannopoulos 1980). The Galactocentric radius of the
near 3 kpc arm at the position of G010.62−00.38 (R= 3.6+0.4−0.4 kpc) is almost two times
greater than the Galactocentric radius of the far 3 kpc arm, as inferred from the position
of G012.02−00.03 (R= 2.1+0.5−0.3 kpc). This does not match the expected constant radius for
a circular ring and seems to favor a highly eccentric orbit. If the interpretation of elliptical
orbits holds, we also note that the maximum Galactocentric radius measured for the 3 kpc
arms (for G010.62−00.38) provides a lower limit to the radius of corotation at rCR & 3.6 kpc,
consistent with previous findings from the literature (e.g., Englmaier & Gerhard 1999, their
Section 4.5).
In Figure 6, the elliptical model by Green et al. (2011) for the 3 kpc feature provides a
good match to the position of the two HMSFRs. This model assumes that gas belonging to
the 3 kpc arms flows along an elliptical streamline and has a constant angular momentum
at any given point of the ellipse, with a value of 320 km s−1 kpc. Locally, the tangential
velocity is given by the ratio of the angular momentum and the Galactocentric radius at that
point. Our measured proper motions for G010.62−00.38 and G012.02−00.03 give values of
the angular momentum higher than 400 km s−1 kpc. By increasing the angular momentum
value, the model by Green et al. still provides a reasonable fit to the data, but requires
a shift of the ellipse orientation at smaller angles with respect to the Sun-Galactic center
direction (e.g., Figure 8 of Green et al. 2011). Whether or not the orientation of the ellipse
fits better the direction of the long (β ∼ 45◦) or the Galactic bar (β ∼ 20◦) would be a hint
as to which bar component dominates the gas response. While our data still do not constrain
the ellipse orientation with sufficient accuracy, we should be able to assess these issues with
stronger statistical support when more parallax measurements in the inner Milky Way will
be available.
This work was partially funded by the ERC Advanced Investigator Grant GLOSTAR
(247078). This work made use of the Swinburne University of Technology software correlator,
developed as part of the Australian Major National Research Facilities Programme and
operated under licence.
Facilities: VLBA.
– 12 –
A. Parallax and Proper Motion Fitting Details
Maser spots for parallax fitting were selected according to the following criteria: 1) spots
persisting over one year that belong to isolated features, in order to avoid emission blended
between different maser centers; 2) compact maser spots, unresolved by the VLBA beam
or slightly resolved but with a stable, deconvolved, position angle; 3) strong maser spots
(∼ 1− 10 Jy beam−1) with typical signal-to-noise ratios of more than a hundred.
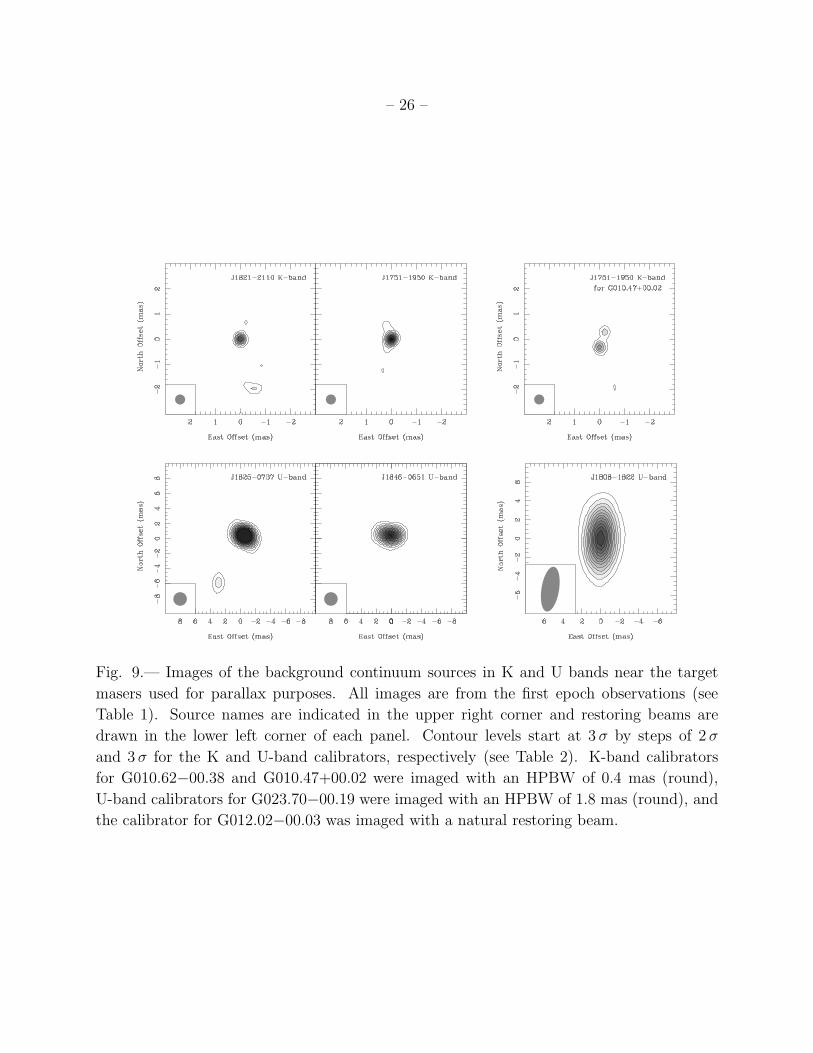
G010.62−00.38. For the purposes of a maser reference position, we employed three
spots at the LSR velocities of −14.2, −1.1, and +1.0 km s−1 from the H2O maser distribution
measured within the field of view of the VLBA. Among the calibrators observed in K band,
the two stronger QSOs in Table 2, J1821−2110 and J1751−1950, served as a background
reference position and their images from the first epoch data are shown in Figure 9. The
angular separation on the plane of the sky (θsep) between the background QSOs and the
target maser is reported in Table 2. The ICRF J1751−1950 was detected at each epoch
above a 5σ level; at the third epoch, the peak intensity of J1821−2110 fell below a 3σ
level due to poor phase stability between the maser and the calibrator (because of poor
weather conditions) and was not used. Due to the lack of the third epoch data, parallax
fitting with the calibrator J1821−2110 results in a higher correlation between the parallax
sinusoid and the (linear) proper motion component from each maser spot. Since we expect no
detectable proper motion for the extragalactic sources, parallax fitting with J1821−2110 was
constrained with proper motions determined from J1751−1950 for each spot. The error-floors
determined by combining the measurements of the three maser spots with respect to the two
QSOs were ±0.05 mas in the E–W direction and ±0.07 mas in the N–S direction. Since water
maser cloudlets have typical proper motions of tens of km s−1, determining a secular proper
motion for the HMSFR requires to correct for maser velocity components. We estimated
this contribution from the average proper motion of all maser features (80) determined as in
Sanna et al. (2010) with respect to the reference spot at +1.1 km s−1, used for the parallax
fitting and with the more accurate proper motion measurement. The average, internal,
velocity components are −0.01± 0.03 mas yr−1 toward the east and +0.28± 0.02 mas yr−1
toward the north, where we report the standard error of the mean. Thus, the secular
proper motion of the HMSFR is estimated to be −0.366 ± 0.081 mas yr−1 and −0.600 ±0.055 mas yr−1 in the east and north directions, respectively. We explicitly note that these
small uncertainties may still be affected by a further uncertainty of several tenth of mas yr−1,
due to the complexity of G010.62−00.38 as a cluster of young stellar objects (e.g., Liu et al.
2011). At our measured distance, these values correspond to −8.6± 1.9 km s−1 and −14.1±1.3 km s−1 eastward and northward, respectively. Completing the kinematic information,
we assume an LSR velocity of −3.0 ± 2.7 km s−1 for the HMSFR G010.62−00.38, obtained
from the large-scale rest velocity of the CS (1−0) and NH3 (1,1) line emission (Anglada et al.
– 13 –
1996).
G010.47+00.02. As a maser reference position, we combined the positions of seven
spots associated with seven distinct maser cloudlets spread over a region of about 0.4 arcsec
in size (Table 3). Imaging of the calibrators for G010.47+00.02 was optimized by setting an
elevation cutoff of 25◦ for each antenna. Among the set of calibrators observed in combination
with G010.47+00.02, only the ICRF calibrator J1751−1950, at an angular offset of 3◦ from
the target maser (Table 2), had a distinct peak of emission at all epochs and has been used
as a background reference position in the parallax measurement (Figure 9). The error-floors
determined from the simultaneous fitting of these seven maser spots were ±0.01 mas and
±0.09 mas toward the E–W and N–S directions, respectively. As for G010.62−00.38, we
estimated the secular proper motion of the star-forming region by subtracting the relative
motion of all measured maser features (11) with respect to the reference spot at +68.0 km s−1
(Table 3). The average internal velocity components are +0.073±0.006 mas yr−1 toward the
east and −0.22± 0.08 mas yr−1 toward the north, where we report the standard error of the
mean. Thus, the total motion of the whole source is estimated to be −3.860±0.015 mas yr−1
and −6.403±0.076 mas yr−1 in the east and north directions, respectively. At our measured
distance, these values correspond to −156.4± 0.6 km s−1 and −259.5± 3.1 km s−1 eastward
and northward, respectively.
G012.02−00.03. The 12.2 GHz methanol maser from G012.02−00.03 consists of a single
spectral feature persisting during the four observing epochs with emission extended over an
area of a few mas (squared). The brightness distribution is centrally peaked and we employed
the peak positions of two velocity channels, at +108.0 and +108.8 km s−1, as maser reference
positions. While the U-band calibrators were easily detected at all epochs, only the closer
QSO J1808–1822 (see Table 2) had a stable spatial morphology (deconvolved size) suitable
for an accurate parallax measurement. The error-floors from these combined measurements
were ±0.01 mas and ±0.19 mas toward the E–W and N–S directions, respectively. Methanol
masers move with typical velocities of only a few kms−1 that are very close to the systemic
velocity of the molecular cloud core they are associated with. Therefore, we will neglect their
contribution for computing the secular proper motion of G012.02−00.03. By averaging the
proper motion inferred from the two maser spots, we obtain Galactic velocity components
of −183.6± 1.0 km s−1 and −346.7± 11.8 km s−1 eastward and northward, respectively.
G023.70−0.19. For the parallax measurement of G023.70–00.19 we made use of three
maser spots, two of them are associated with the peak position of the 12.2 GHz methanol
maser emission (at +77.5 and +79.0 km s−1) and a third spot is associated with an isolated
maser cloudlets at about 21 mas to the south of the peak emission (at +76.7 km s−1). Only
measurements with the two closer calibrators (see Table 2), J1825−0737 and J1846−0651,
– 14 –
gave individual error-floors in the E-W direction smaller than 0.1 mas for each maser spot and
were used in the parallax estimate. These final error-floors were ±0.06 mas and ±0.15 mas
toward the E–W and N–S directions, respectively. By averaging the proper motion inferred
from the three maser spots, we obtain Galactic velocity components of −94.4 ± 2.0 km s−1
and −187.4± 4.0 km s−1 eastward and northward, respectively. Toward the maser position,
CS (2−1) line emission shows an LSR velocity of +68.3 km s−1 (Bronfman et al. 1996), about
ten km s−1 slower than the peak velocity of the H110α line at the same position (Sewilo et al.
2004, +76.5 km s−1). In order to resolve the near/far kinematic distance ambiguity, Sewilo
et al. observed the H2CO(110−111) line in absorption against the H ii region up to velocities
of +86 km s−1, with an H2CO absorption component at the same velocity of the CS line.
Following these evidence, we assume a central LSR velocity for the HMSFR G023.70–00.19
of +76.5± 10 km s−1, that better matches the 12 GHz CH3OH maser velocities of Figure 1,
which usually trace more quiescent gas dynamics close to the systemic velocity of the region
(< 5− 10 km s−1).
REFERENCES
Anglada, G., Estalella, R., Pastor, J., Rodriguez, L. F., & Haschick, A. D. 1996, ApJ, 463,
205
Athanassoula, E., & Bureau, M. 1999, ApJ, 522, 699
Athanassoula, E. 1992, MNRAS, 259, 328
Athanassoula, E. 1992, MNRAS, 259, 345
Benjamin, R. A., et al. 2005, ApJ, 630, L149
Beuther, H., Schilke, P., Menten, K. M., et al. 2002, ApJ, 566, 945
Binney, J., Gerhard, O. E., Stark, A. A., Bally, J., & Uchida, K. I. 1991, MNRAS, 252, 210
Bitran, M., Alvarez, H., Bronfman, L., May, J., & Thaddeus, P. 1997, A&AS, 125, 99
Bronfman, L., Nyman, L.-A., & May, J. 1996, A&AS, 115, 81
Bronfman, L., Casassus, S., May, J., & Nyman, L.-A. 2000, A&A, 358, 521
Bronfman, L. 2008, Ap&SS, 313, 81
Brunthaler, A., Reid, M. J., Menten, K. M., et al. 2009, ApJ, 693, 424
– 15 –
Bureau, M., & Athanassoula, E. 1999, ApJ, 522, 686
Burton, W. B. 1974, Galactic Radio Astronomy, 60, 551
Caswell, J. L., Murray, J. D., Roger, R. S., Cole, D. J., & Cooke, D. J. 1975, A&A, 45, 239
Churchwell, E., Babler, B. L., Meade, M. R., et al. 2009, PASP, 121, 213
Clemens, D. P., Sanders, D. B., & Scoville, N. Z. 1988, ApJ, 327, 139
Cohen, R. J., & Davies, R. D. 1976, MNRAS, 175, 1
Cohen, R. S., Cong, H., Dame, T. M., & Thaddeus, P. 1980, ApJ, 239, L53
Combes, F. 1991, ARA&A, 29, 195
Contopoulos, G., & Papayannopoulos, T. 1980, A&A, 92, 33
Corbel, S., & Eikenberry, S. S. 2004, A&A, 419, 191
Dame, T. M., Elmegreen, B. G., Cohen, R. S., & Thaddeus, P. 1986, ApJ, 305, 892
Dame, T. M., Hartmann, D., & Thaddeus, P. 2001, ApJ, 547, 792
Dame, T. M., & Thaddeus, P. 2008, ApJ, 683, L143
Dame, T. M., & Thaddeus, P. 2011, ApJ, 734, L24
Deller, A. T., Tingay, S. J., Bailes, M., & West, C. 2007, PASP, 119, 318
Dobbs, C. L., & Burkert, A. 2012, MNRAS, 421, 2940
Downes, D., Wilson, T. L., Bieging, J., & Wink, J. 1980, A&AS, 40, 379
Englmaier, P., & Gerhard, O. 1999, MNRAS, 304, 512
Fey, A. L., Ma, C., Arias, E. F., et al. 2004, AJ, 127, 3587
Fish, V. L., Reid, M. J., Wilner, D. J., & Churchwell, E. 2003, ApJ, 587, 701
Fux, R. 1999, A&A, 345, 787
Gerhard, O. 2002, The Dynamics, Structure & History of Galaxies: A Workshop in Honour
of Professor Ken Freeman, 273, 73
Greaves, J. S., & Williams, P. G. 1994, A&A, 290, 259
– 16 –
Green, J. A., McClure-Griffiths, N. M., Caswell, J. L., et al. 2009, ApJ, 696, L156
Green, J. A., Caswell, J. L., McClure-Griffiths, N. M., et al. 2011, ApJ, 733, 27
Hofner, P., & Churchwell, E. 1996, A&AS, 120, 283
Honma, M., Nagayama, T., Ando, K., et al. 2012, PASJ, 64, 136
Hou, L. G., Han, J. L., & Shi, W. B. 2009, A&A, 499, 473
Immer, K., Brunthaler, A., Reid, M. J., et al. 2011, ApJS, 194, 25
Kerr, F. J. 1967, Radio Astronomy and the Galactic System, 31, 239
Kettenis, M., van Langevelde, H. J., Reynolds, C., & Cotton, B. 2006, Astronomical Data
Analysis Software and Systems XV, 351, 497
Jackson, J. M., Rathborne, J. M., Shah, R. Y., et al. 2006, ApJS, 163, 145
Liu, H. B., Zhang, Q., & Ho, P. T. P. 2011, ApJ, 729, 100
Lockman, F. J. 1980, ApJ, 241, 200
Marshall, D. J., Fux, R., Robin, A. C., & Reyle, C. 2008, A&A, 477, L21
Morris, M., & Serabyn, E. 1996, ARA&A, 34, 645
Peters, W. L., III 1975, ApJ, 195, 617
Petrov, L., Kovalev, Y. Y., Fomalont, E., & Gordon, D. 2005, AJ, 129, 1163
Reid, M. J., Menten, K. M., Brunthaler, A., Zheng, X. W., Moscadelli, L., & Xu, Y. 2009a,
ApJ, 693, 397
Reid, M. J., et al. 2009, ApJ, 700, 137
Reid, M. J. 2013, IAU Symposium, 289, 188
Roberts, W. W., Jr., Huntley, J. M., & van Albada, G. D. 1979, ApJ, 233, 67
Rodriguez-Fernandez, N. J., & Combes, F. 2008, A&A, 489, 115
Sanna, A., Reid, M. J., Moscadelli, L., et al. 2009, ApJ, 706, 464
Sanna, A., Moscadelli, L., Cesaroni, R., Tarchi, A., Furuya, R. S., & Goddi, C. 2010, A&A,
517, A71
– 17 –
Sato, M., Reid, M. J., Brunthaler, A., & Menten, K. M. 2010, ApJ, 720, 1055
Sewilo, M., Watson, C., Araya, E., et al. 2004, ApJS, 154, 553
Schonrich, R., Binney, J., & Dehnen, W. 2010, MNRAS, 403, 1829
Sofue, Y., Tutui, Y., Honma, M., et al. 1999, ApJ, 523, 136
Steiman-Cameron, T. Y., Wolfire, M., & Hollenbach, D. 2010, ApJ, 722, 1460
Taylor, J. H., & Cordes, J. M. 1993, ApJ, 411, 674
Vallee, J. P. 2008, AJ, 135, 1301
van Albada, T. S., & Sanders, R. H. 1982, MNRAS, 201, 303
van der Kruit, P. C. 1971, A&A, 13, 405
Wilkinson, P. N., Browne, I. W. A., Patnaik, A. R., Wrobel, J. M., & Sorathia, B. 1998,
MNRAS, 300, 790
Wilson, T. L. 1974, A&A, 31, 83
Xu, Y., Li, J. J., Reid, M. J., et al. 2013, ApJ, 769, 15
This preprint was prepared with the AAS LATEX macros v5.2.
– 18 –
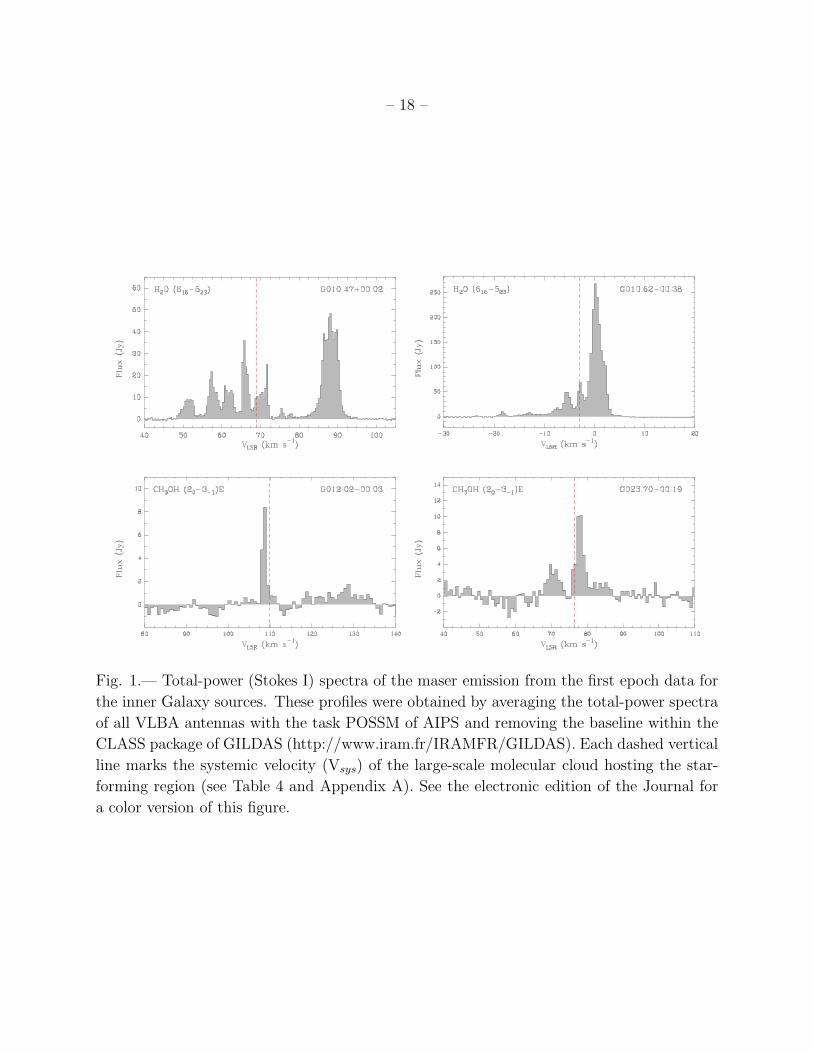
Fig. 1.— Total-power (Stokes I) spectra of the maser emission from the first epoch data for
the inner Galaxy sources. These profiles were obtained by averaging the total-power spectra
of all VLBA antennas with the task POSSM of AIPS and removing the baseline within the
CLASS package of GILDAS (http://www.iram.fr/IRAMFR/GILDAS). Each dashed vertical
line marks the systemic velocity (Vsys) of the large-scale molecular cloud hosting the star-
forming region (see Table 4 and Appendix A). See the electronic edition of the Journal for
a color version of this figure.
– 19 –
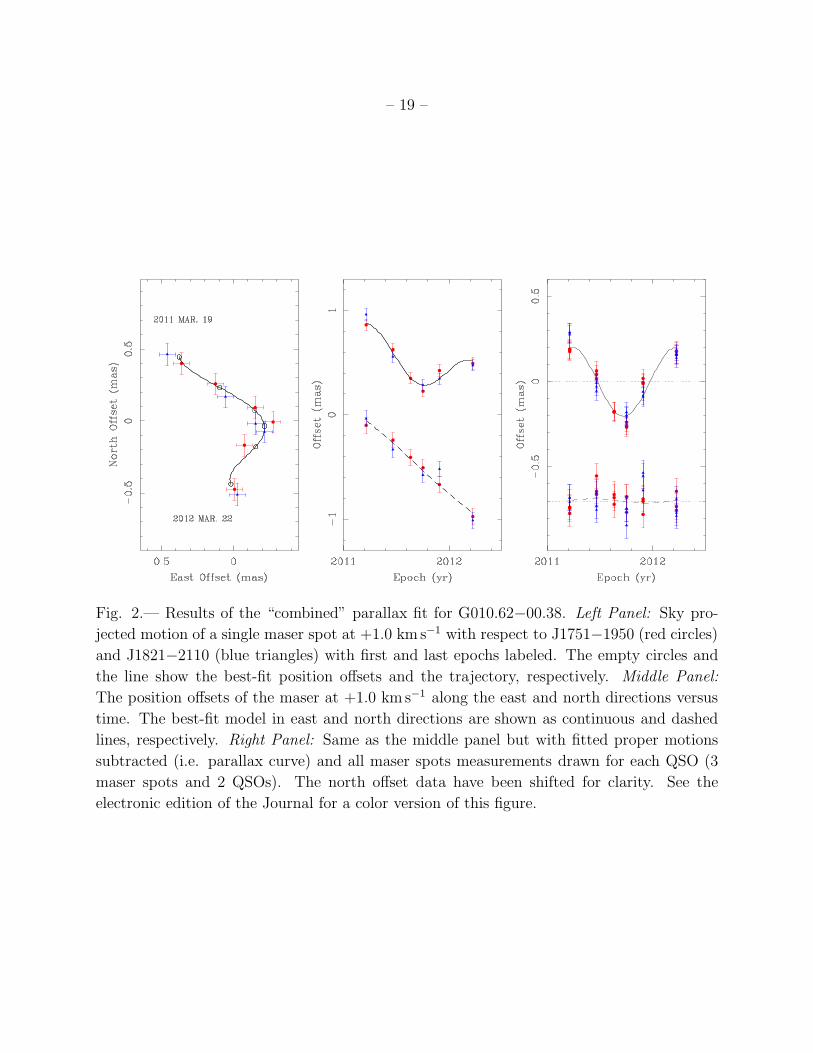
Fig. 2.— Results of the “combined” parallax fit for G010.62−00.38. Left Panel: Sky pro-
jected motion of a single maser spot at +1.0 km s−1 with respect to J1751−1950 (red circles)
and J1821−2110 (blue triangles) with first and last epochs labeled. The empty circles and
the line show the best-fit position offsets and the trajectory, respectively. Middle Panel:
The position offsets of the maser at +1.0 km s−1 along the east and north directions versus
time. The best-fit model in east and north directions are shown as continuous and dashed
lines, respectively. Right Panel: Same as the middle panel but with fitted proper motions
subtracted (i.e. parallax curve) and all maser spots measurements drawn for each QSO (3
maser spots and 2 QSOs). The north offset data have been shifted for clarity. See the
electronic edition of the Journal for a color version of this figure.
– 20 –
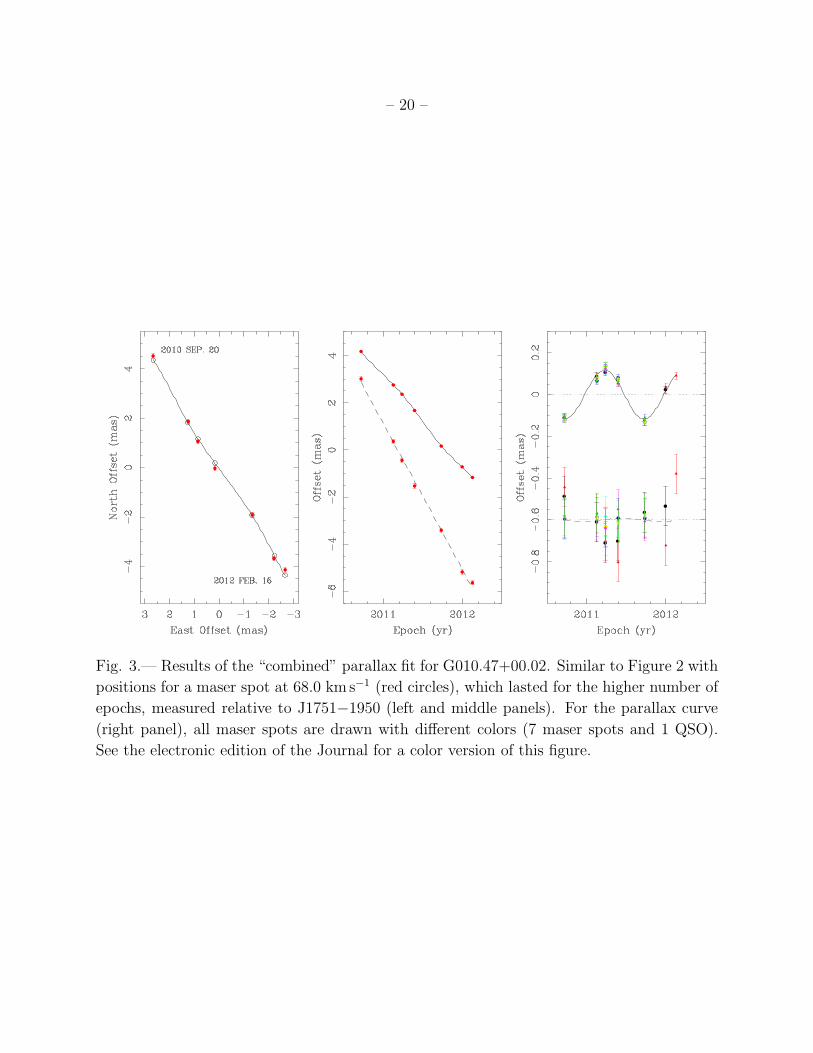
Fig. 3.— Results of the “combined” parallax fit for G010.47+00.02. Similar to Figure 2 with
positions for a maser spot at 68.0 km s−1 (red circles), which lasted for the higher number of
epochs, measured relative to J1751−1950 (left and middle panels). For the parallax curve
(right panel), all maser spots are drawn with different colors (7 maser spots and 1 QSO).
See the electronic edition of the Journal for a color version of this figure.
– 21 –
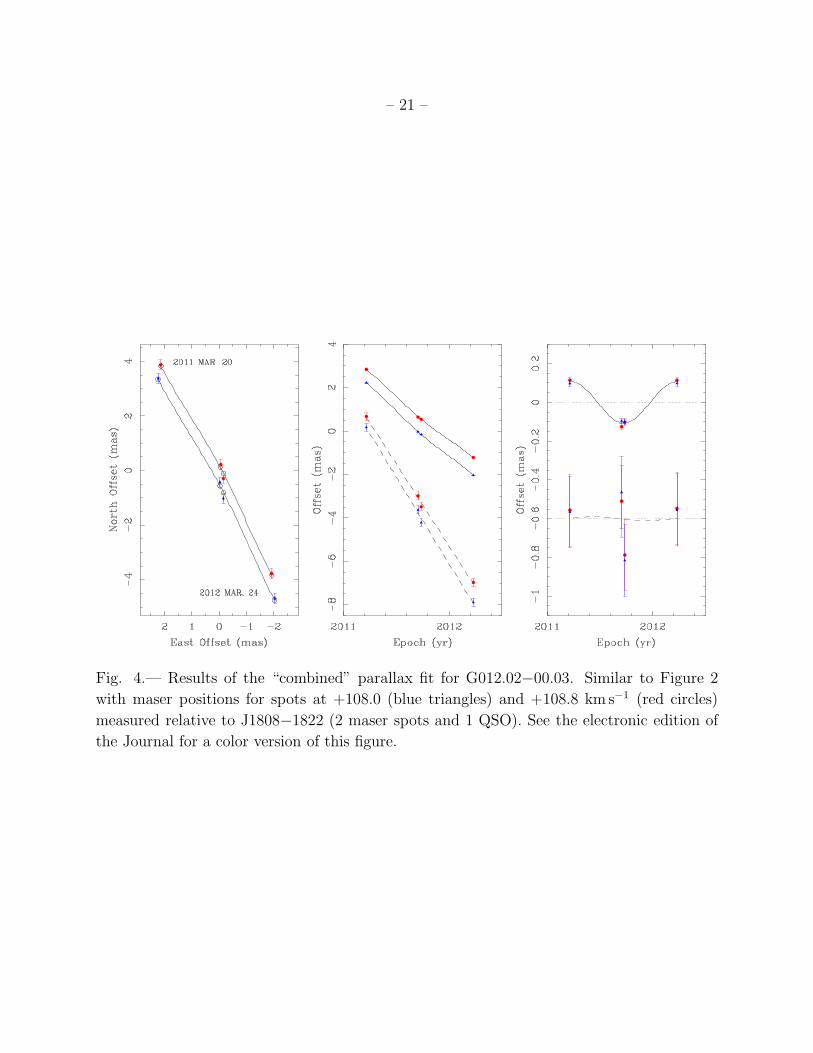
Fig. 4.— Results of the “combined” parallax fit for G012.02−00.03. Similar to Figure 2
with maser positions for spots at +108.0 (blue triangles) and +108.8 km s−1 (red circles)
measured relative to J1808−1822 (2 maser spots and 1 QSO). See the electronic edition of
the Journal for a color version of this figure.
– 22 –
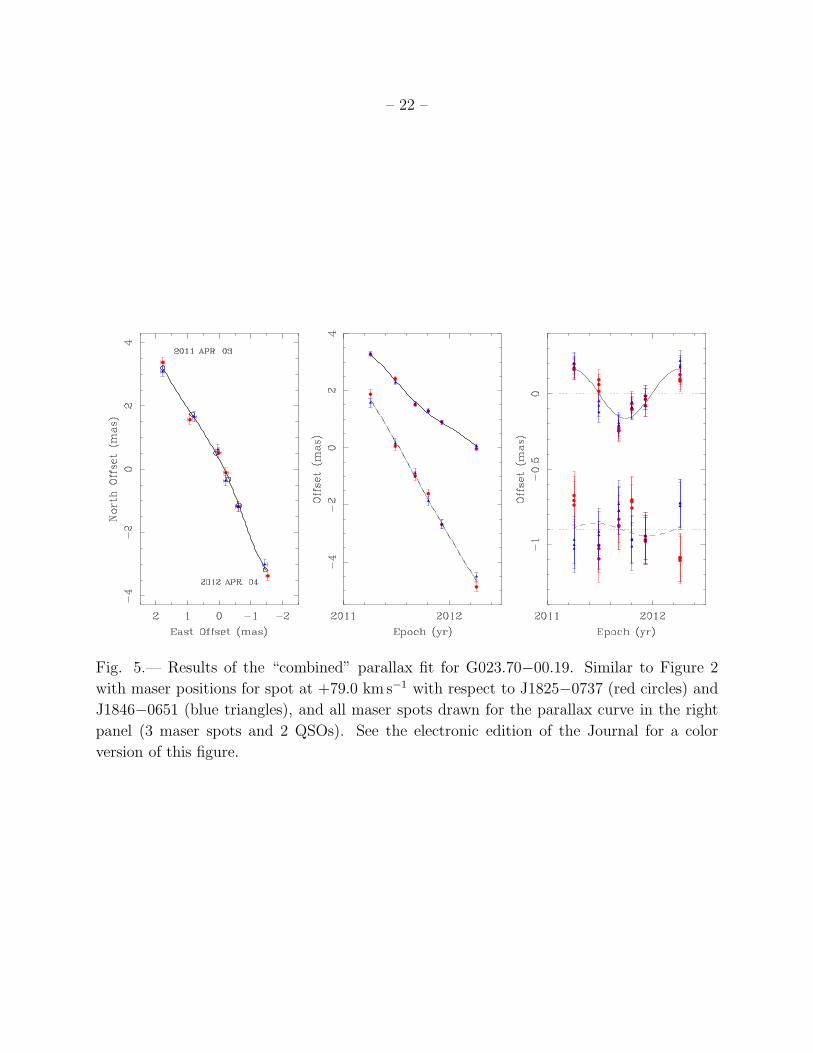
Fig. 5.— Results of the “combined” parallax fit for G023.70−00.19. Similar to Figure 2
with maser positions for spot at +79.0 km s−1 with respect to J1825−0737 (red circles) and
J1846−0651 (blue triangles), and all maser spots drawn for the parallax curve in the right
panel (3 maser spots and 2 QSOs). See the electronic edition of the Journal for a color
version of this figure.
– 23 –
-10
-5
0
-5 0 5
0
0y (kpc)
x (kpc)
Perseus Arm
Sagittarius Arm
Scutum-Centaurus
Norma Arm
Sun
Q1Q4
Q2Q3
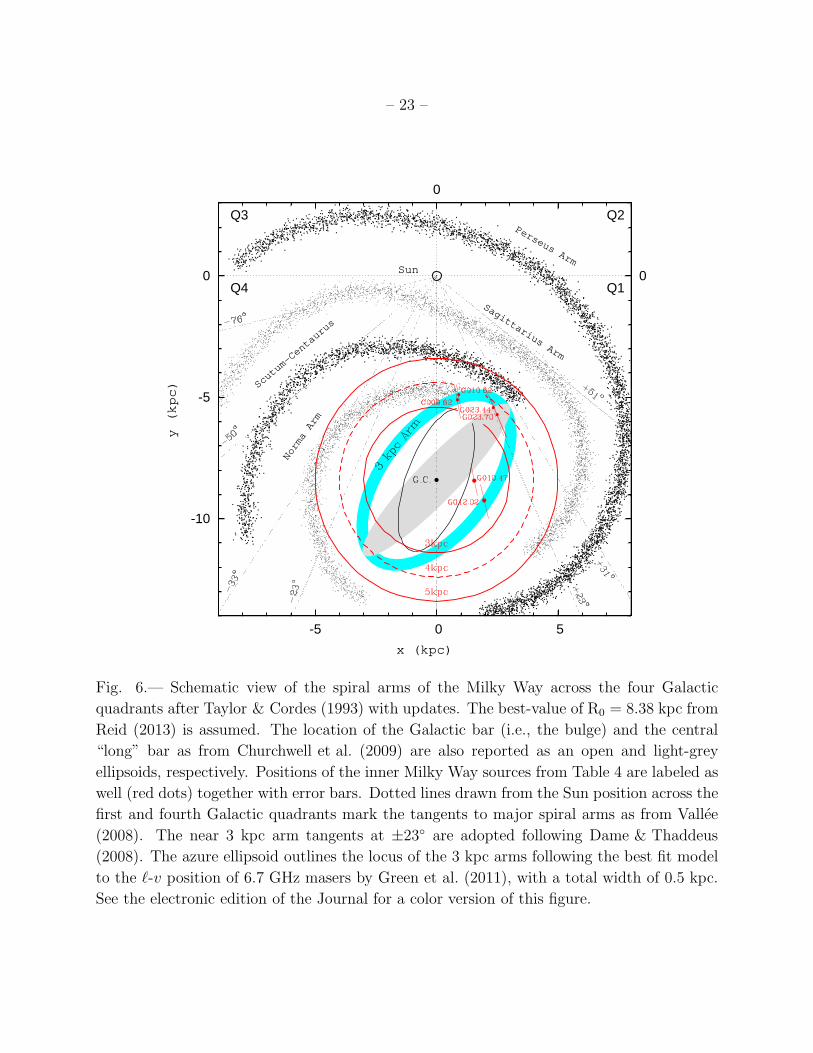
Fig. 6.— Schematic view of the spiral arms of the Milky Way across the four Galactic
quadrants after Taylor & Cordes (1993) with updates. The best-value of R0 = 8.38 kpc from
Reid (2013) is assumed. The location of the Galactic bar (i.e., the bulge) and the central
“long” bar as from Churchwell et al. (2009) are also reported as an open and light-grey
ellipsoids, respectively. Positions of the inner Milky Way sources from Table 4 are labeled as
well (red dots) together with error bars. Dotted lines drawn from the Sun position across the
first and fourth Galactic quadrants mark the tangents to major spiral arms as from Vallee
(2008). The near 3 kpc arm tangents at ±23◦ are adopted following Dame & Thaddeus
(2008). The azure ellipsoid outlines the locus of the 3 kpc arms following the best fit model
to the ℓ-v position of 6.7 GHz masers by Green et al. (2011), with a total width of 0.5 kpc.
See the electronic edition of the Journal for a color version of this figure.
– 24 –
Galactic Longitude (°)
LSR Velocity (km/s)
−30−20−1001020−200
−150
−100
−50
0
50
100
150
200
Near 3−kpc
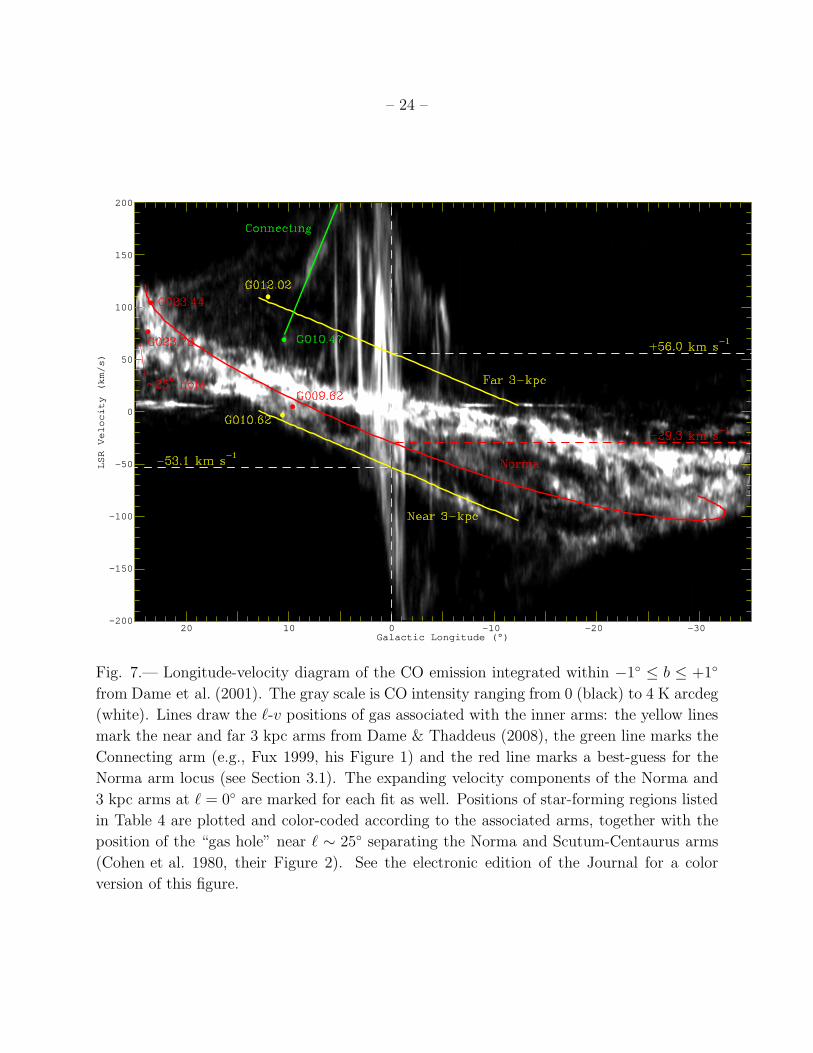
Fig. 7.— Longitude-velocity diagram of the CO emission integrated within −1◦ ≤ b ≤ +1◦
from Dame et al. (2001). The gray scale is CO intensity ranging from 0 (black) to 4 K arcdeg
(white). Lines draw the ℓ-v positions of gas associated with the inner arms: the yellow lines
mark the near and far 3 kpc arms from Dame & Thaddeus (2008), the green line marks the
Connecting arm (e.g., Fux 1999, his Figure 1) and the red line marks a best-guess for the
Norma arm locus (see Section 3.1). The expanding velocity components of the Norma and
3 kpc arms at ℓ = 0◦ are marked for each fit as well. Positions of star-forming regions listed
in Table 4 are plotted and color-coded according to the associated arms, together with the
position of the “gas hole” near ℓ ∼ 25◦ separating the Norma and Scutum-Centaurus arms
(Cohen et al. 1980, their Figure 2). See the electronic edition of the Journal for a color
version of this figure.
– 25 –
LSR Velocity (km/s)
Galactic Latitude (°)
−40 −20 0 20 40 60 80−2.5
−2
−1.5
−1
−0.5
0
0.5
1
1.5
2
0.1
0.2
0.3
0.4
0.5
0.6
0.7
0.8
0.9
1
1.1
LSR Velocity (km/s)
Galactic Latitude (°)
−40 −20 0 20 40 60 80−2.5
−2
−1.5
−1
−0.5
0
0.5
1
1.5
2
0.5
1
1.5
2
2.5
3
Fig. 8.— Latitude-velocity diagrams of the CO emission integrated within the range of
longitudes where the Norma and near 3 kpc arms intersect in Figure 6. CO data are from
the 1.2 m Cerro Tololo survey of Bitran et al. (1997). The CO emission was integrated
within the ranges of Galactic longitudes indicated in the upper left corner of each panel.
The color scale on the right-hand side of each panel corresponds to the CO intensity range
in K arcdeg. Positions of prominent arms in the inner Milky Way are labeled in each panel
together with the associated sources according to Table 4. See the electronic edition of the
Journal for a color version of this figure.
– 26 –
Fig. 9.— Images of the background continuum sources in K and U bands near the target
masers used for parallax purposes. All images are from the first epoch observations (see
Table 1). Source names are indicated in the upper right corner and restoring beams are
drawn in the lower left corner of each panel. Contour levels start at 3 σ by steps of 2 σ
and 3 σ for the K and U-band calibrators, respectively (see Table 2). K-band calibrators
for G010.62−00.38 and G010.47+00.02 were imaged with an HPBW of 0.4 mas (round),
U-band calibrators for G023.70−00.19 were imaged with an HPBW of 1.8 mas (round), and
the calibrator for G012.02−00.03 was imaged with a natural restoring beam.
– 27 –
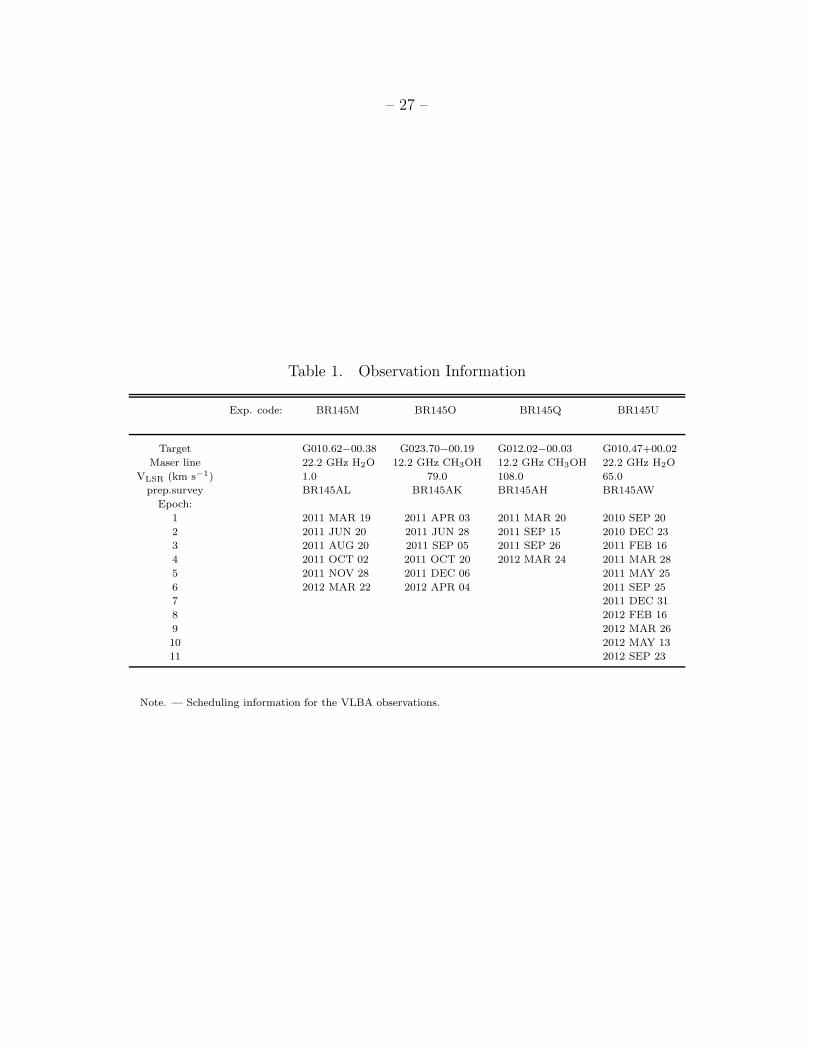
Table 1. Observation Information
Exp. code: BR145M BR145O BR145Q BR145U
Target G010.62−00.38 G023.70−00.19 G012.02−00.03 G010.47+00.02
Maser line 22.2 GHz H2O 12.2 GHz CH3OH 12.2 GHz CH3OH 22.2 GHz H2O
VLSR (km s−1) 1.0 79.0 108.0 65.0
prep.survey BR145AL BR145AK BR145AH BR145AW
Epoch:
1 2011 MAR 19 2011 APR 03 2011 MAR 20 2010 SEP 20
2 2011 JUN 20 2011 JUN 28 2011 SEP 15 2010 DEC 23
3 2011 AUG 20 2011 SEP 05 2011 SEP 26 2011 FEB 16
4 2011 OCT 02 2011 OCT 20 2012 MAR 24 2011 MAR 28
5 2011 NOV 28 2011 DEC 06 2011 MAY 25
6 2012 MAR 22 2012 APR 04 2011 SEP 25
7 2011 DEC 31
8 2012 FEB 16
9 2012 MAR 26
10 2012 MAY 13
11 2012 SEP 23
Note. — Scheduling information for the VLBA observations.
– 28 –
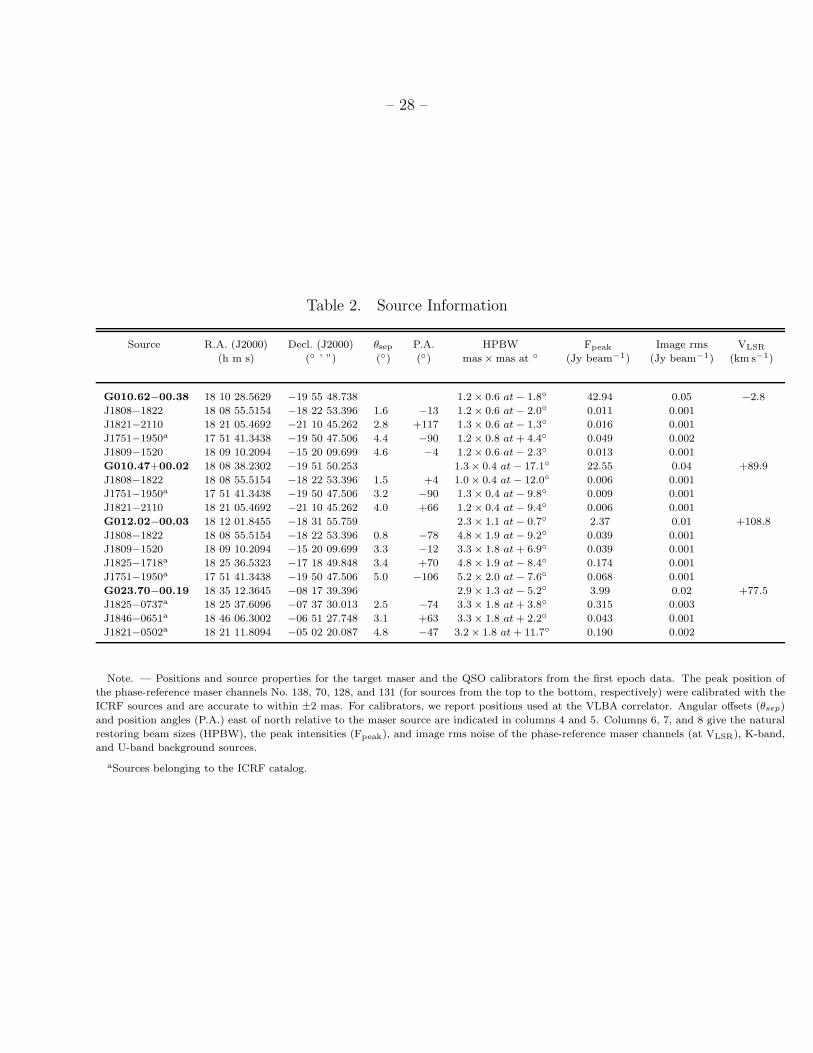
Table 2. Source Information
Source R.A. (J2000) Decl. (J2000) θsep P.A. HPBW Fpeak Image rms VLSR
(h m s) (◦ ’ ”) (◦) (◦) mas×mas at ◦ (Jy beam−1) (Jy beam−1) (km s−1)
G010.62−00.38 18 10 28.5629 −19 55 48.738 1.2× 0.6 at− 1.8◦ 42.94 0.05 −2.8
J1808−1822 18 08 55.5154 −18 22 53.396 1.6 −13 1.2× 0.6 at− 2.0◦ 0.011 0.001
J1821−2110 18 21 05.4692 −21 10 45.262 2.8 +117 1.3× 0.6 at− 1.3◦ 0.016 0.001
J1751−1950a 17 51 41.3438 −19 50 47.506 4.4 −90 1.2× 0.8 at+ 4.4◦ 0.049 0.002
J1809−1520 18 09 10.2094 −15 20 09.699 4.6 −4 1.2× 0.6 at− 2.3◦ 0.013 0.001
G010.47+00.02 18 08 38.2302 −19 51 50.253 1.3× 0.4 at − 17.1◦ 22.55 0.04 +89.9
J1808−1822 18 08 55.5154 −18 22 53.396 1.5 +4 1.0× 0.4 at − 12.0◦ 0.006 0.001
J1751−1950a 17 51 41.3438 −19 50 47.506 3.2 −90 1.3× 0.4 at− 9.8◦ 0.009 0.001
J1821−2110 18 21 05.4692 −21 10 45.262 4.0 +66 1.2× 0.4 at− 9.4◦ 0.006 0.001
G012.02−00.03 18 12 01.8455 −18 31 55.759 2.3× 1.1 at− 0.7◦ 2.37 0.01 +108.8
J1808−1822 18 08 55.5154 −18 22 53.396 0.8 −78 4.8× 1.9 at− 9.2◦ 0.039 0.001
J1809−1520 18 09 10.2094 −15 20 09.699 3.3 −12 3.3× 1.8 at+ 6.9◦ 0.039 0.001
J1825−1718a 18 25 36.5323 −17 18 49.848 3.4 +70 4.8× 1.9 at− 8.4◦ 0.174 0.001
J1751−1950a 17 51 41.3438 −19 50 47.506 5.0 −106 5.2× 2.0 at− 7.6◦ 0.068 0.001
G023.70−00.19 18 35 12.3645 −08 17 39.396 2.9× 1.3 at− 5.2◦ 3.99 0.02 +77.5
J1825−0737a 18 25 37.6096 −07 37 30.013 2.5 −74 3.3× 1.8 at+ 3.8◦ 0.315 0.003
J1846−0651a 18 46 06.3002 −06 51 27.748 3.1 +63 3.3× 1.8 at+ 2.2◦ 0.043 0.001
J1821−0502a 18 21 11.8094 −05 02 20.087 4.8 −47 3.2× 1.8 at + 11.7◦ 0.190 0.002
Note. — Positions and source properties for the target maser and the QSO calibrators from the first epoch data. The peak position of
the phase-reference maser channels No. 138, 70, 128, and 131 (for sources from the top to the bottom, respectively) were calibrated with the
ICRF sources and are accurate to within ±2 mas. For calibrators, we report positions used at the VLBA correlator. Angular offsets (θsep)
and position angles (P.A.) east of north relative to the maser source are indicated in columns 4 and 5. Columns 6, 7, and 8 give the natural
restoring beam sizes (HPBW), the peak intensities (Fpeak), and image rms noise of the phase-reference maser channels (at VLSR), K-band,
and U-band background sources.
aSources belonging to the ICRF catalog.
– 29 –
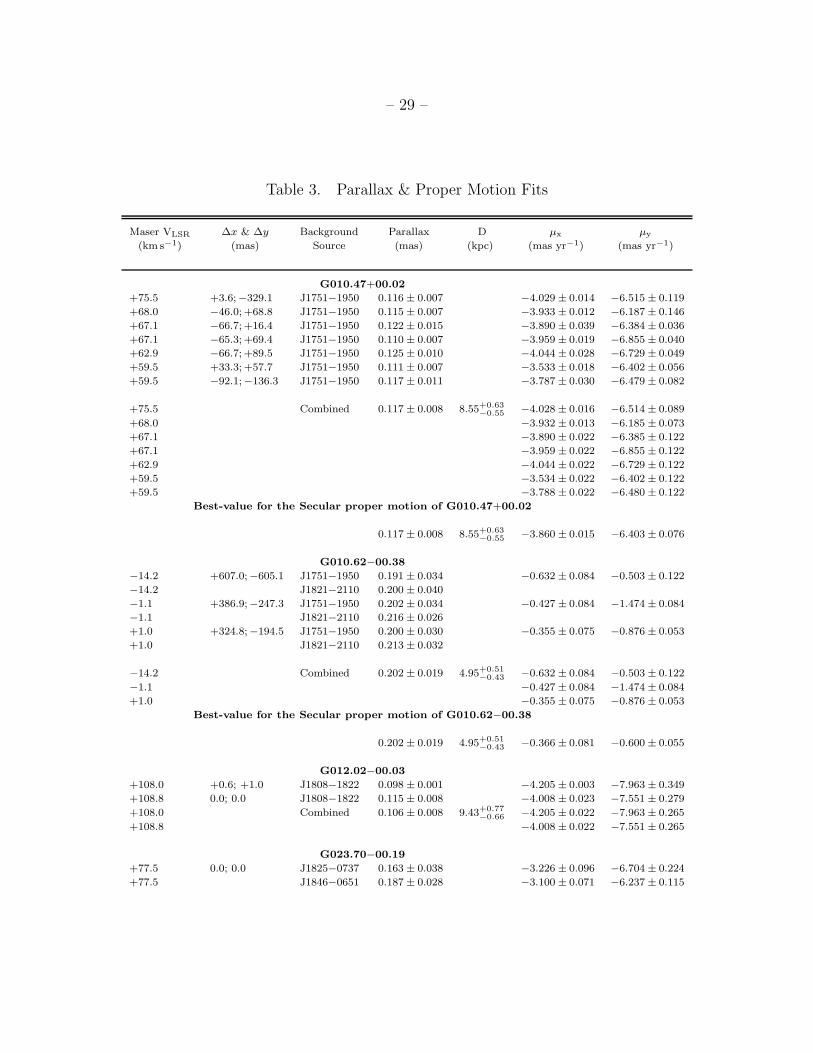
Table 3. Parallax & Proper Motion Fits
Maser VLSR ∆x & ∆y Background Parallax D µx µy
(km s−1) (mas) Source (mas) (kpc) (mas yr−1) (mas yr−1)
G010.47+00.02
+75.5 +3.6;−329.1 J1751−1950 0.116 ± 0.007 −4.029 ± 0.014 −6.515 ± 0.119
+68.0 −46.0; +68.8 J1751−1950 0.115 ± 0.007 −3.933 ± 0.012 −6.187 ± 0.146
+67.1 −66.7; +16.4 J1751−1950 0.122 ± 0.015 −3.890 ± 0.039 −6.384 ± 0.036
+67.1 −65.3; +69.4 J1751−1950 0.110 ± 0.007 −3.959 ± 0.019 −6.855 ± 0.040
+62.9 −66.7; +89.5 J1751−1950 0.125 ± 0.010 −4.044 ± 0.028 −6.729 ± 0.049
+59.5 +33.3; +57.7 J1751−1950 0.111 ± 0.007 −3.533 ± 0.018 −6.402 ± 0.056
+59.5 −92.1;−136.3 J1751−1950 0.117 ± 0.011 −3.787 ± 0.030 −6.479 ± 0.082
+75.5 Combined 0.117 ± 0.008 8.55+0.63−0.55 −4.028 ± 0.016 −6.514 ± 0.089
+68.0 −3.932 ± 0.013 −6.185 ± 0.073
+67.1 −3.890 ± 0.022 −6.385 ± 0.122
+67.1 −3.959 ± 0.022 −6.855 ± 0.122
+62.9 −4.044 ± 0.022 −6.729 ± 0.122
+59.5 −3.534 ± 0.022 −6.402 ± 0.122
+59.5 −3.788 ± 0.022 −6.480 ± 0.122
Best-value for the Secular proper motion of G010.47+00.02
0.117 ± 0.008 8.55+0.63−0.55 −3.860 ± 0.015 −6.403 ± 0.076
G010.62−00.38
−14.2 +607.0;−605.1 J1751−1950 0.191 ± 0.034 −0.632 ± 0.084 −0.503 ± 0.122
−14.2 J1821−2110 0.200 ± 0.040
−1.1 +386.9;−247.3 J1751−1950 0.202 ± 0.034 −0.427 ± 0.084 −1.474 ± 0.084
−1.1 J1821−2110 0.216 ± 0.026
+1.0 +324.8;−194.5 J1751−1950 0.200 ± 0.030 −0.355 ± 0.075 −0.876 ± 0.053
+1.0 J1821−2110 0.213 ± 0.032
−14.2 Combined 0.202 ± 0.019 4.95+0.51−0.43 −0.632 ± 0.084 −0.503 ± 0.122
−1.1 −0.427 ± 0.084 −1.474 ± 0.084
+1.0 −0.355 ± 0.075 −0.876 ± 0.053
Best-value for the Secular proper motion of G010.62−00.38
0.202 ± 0.019 4.95+0.51−0.43 −0.366 ± 0.081 −0.600 ± 0.055
G012.02−00.03
+108.0 +0.6; +1.0 J1808−1822 0.098 ± 0.001 −4.205 ± 0.003 −7.963 ± 0.349
+108.8 0.0; 0.0 J1808−1822 0.115 ± 0.008 −4.008 ± 0.023 −7.551 ± 0.279
+108.0 Combined 0.106 ± 0.008 9.43+0.77−0.66 −4.205 ± 0.022 −7.963 ± 0.265
+108.8 −4.008 ± 0.022 −7.551 ± 0.265
G023.70−00.19
+77.5 0.0; 0.0 J1825−0737 0.163 ± 0.038 −3.226 ± 0.096 −6.704 ± 0.224
+77.5 J1846−0651 0.187 ± 0.028 −3.100 ± 0.071 −6.237 ± 0.115
– 30 –
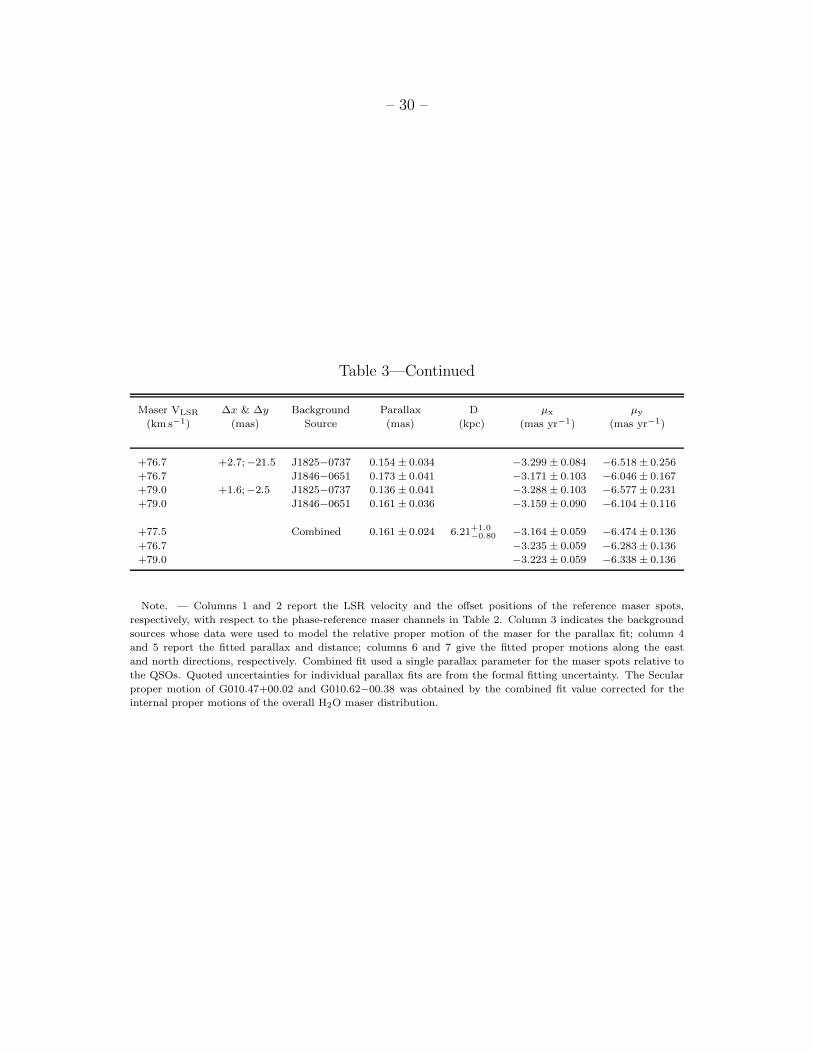
Table 3—Continued
Maser VLSR ∆x & ∆y Background Parallax D µx µy
(km s−1) (mas) Source (mas) (kpc) (mas yr−1) (mas yr−1)
+76.7 +2.7;−21.5 J1825−0737 0.154 ± 0.034 −3.299 ± 0.084 −6.518± 0.256
+76.7 J1846−0651 0.173 ± 0.041 −3.171 ± 0.103 −6.046± 0.167
+79.0 +1.6;−2.5 J1825−0737 0.136 ± 0.041 −3.288 ± 0.103 −6.577± 0.231
+79.0 J1846−0651 0.161 ± 0.036 −3.159 ± 0.090 −6.104± 0.116
+77.5 Combined 0.161 ± 0.024 6.21+1.0−0.80 −3.164 ± 0.059 −6.474± 0.136
+76.7 −3.235 ± 0.059 −6.283± 0.136
+79.0 −3.223 ± 0.059 −6.338± 0.136
Note. — Columns 1 and 2 report the LSR velocity and the offset positions of the reference maser spots,
respectively, with respect to the phase-reference maser channels in Table 2. Column 3 indicates the background
sources whose data were used to model the relative proper motion of the maser for the parallax fit; column 4
and 5 report the fitted parallax and distance; columns 6 and 7 give the fitted proper motions along the east
and north directions, respectively. Combined fit used a single parallax parameter for the maser spots relative to
the QSOs. Quoted uncertainties for individual parallax fits are from the formal fitting uncertainty. The Secular
proper motion of G010.47+00.02 and G010.62−00.38 was obtained by the combined fit value corrected for the
internal proper motions of the overall H2O maser distribution.
–31
–
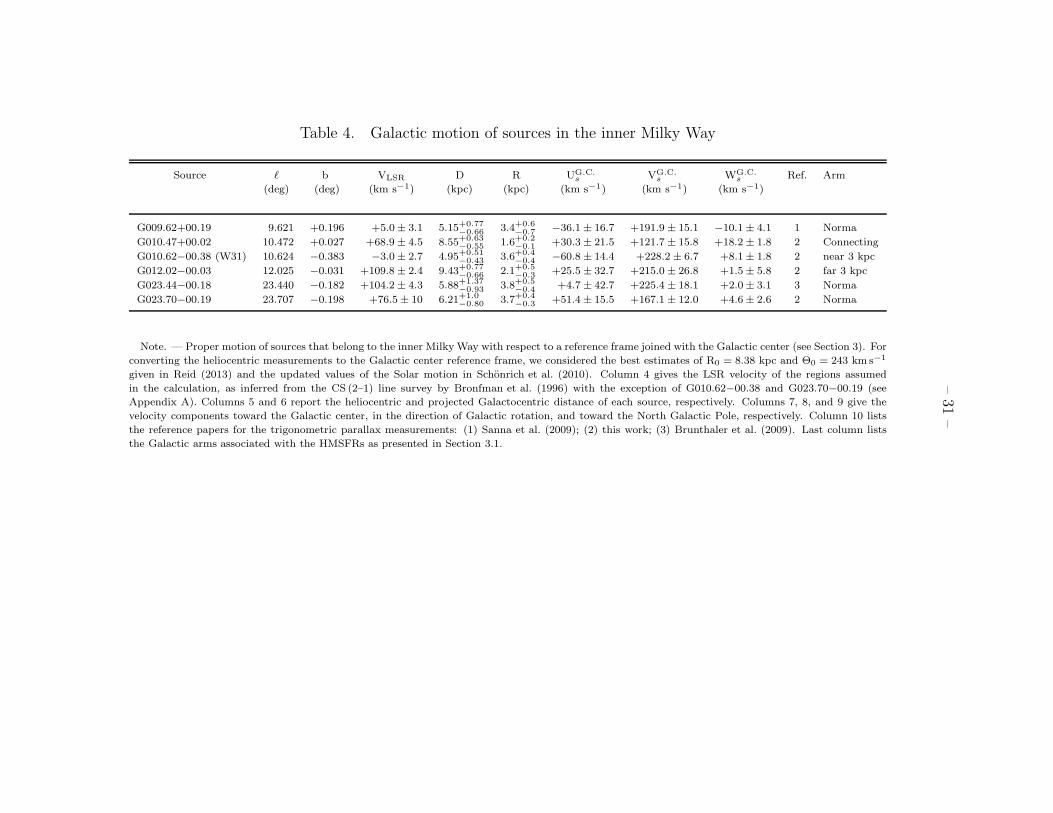
Table 4. Galactic motion of sources in the inner Milky Way
Source ℓ b VLSR D R UG.C.
sVG.C.
sWG.C.
sRef. Arm
(deg) (deg) (km s−1) (kpc) (kpc) (km s−1) (km s−1) (km s−1)
G009.62+00.19 9.621 +0.196 +5.0± 3.1 5.15+0.77−0.66 3.4+0.6
−0.7 −36.1± 16.7 +191.9 ± 15.1 −10.1± 4.1 1 Norma
G010.47+00.02 10.472 +0.027 +68.9± 4.5 8.55+0.63−0.55 1.6+0.2
−0.1 +30.3± 21.5 +121.7 ± 15.8 +18.2± 1.8 2 Connecting
G010.62−00.38 (W31) 10.624 −0.383 −3.0± 2.7 4.95+0.51−0.43 3.6+0.4
−0.4 −60.8± 14.4 +228.2± 6.7 +8.1± 1.8 2 near 3 kpc
G012.02−00.03 12.025 −0.031 +109.8± 2.4 9.43+0.77−0.66 2.1+0.5
−0.3 +25.5± 32.7 +215.0 ± 26.8 +1.5± 5.8 2 far 3 kpc
G023.44−00.18 23.440 −0.182 +104.2± 4.3 5.88+1.37−0.93 3.8+0.5
−0.4 +4.7± 42.7 +225.4 ± 18.1 +2.0± 3.1 3 Norma
G023.70−00.19 23.707 −0.198 +76.5± 10 6.21+1.0−0.80 3.7+0.4
−0.3 +51.4± 15.5 +167.1 ± 12.0 +4.6± 2.6 2 Norma
Note. — Proper motion of sources that belong to the inner MilkyWay with respect to a reference frame joined with the Galactic center (see Section 3). For
converting the heliocentric measurements to the Galactic center reference frame, we considered the best estimates of R0 = 8.38 kpc and Θ0 = 243 km s−1
given in Reid (2013) and the updated values of the Solar motion in Schonrich et al. (2010). Column 4 gives the LSR velocity of the regions assumed
in the calculation, as inferred from the CS (2–1) line survey by Bronfman et al. (1996) with the exception of G010.62−00.38 and G023.70−00.19 (see
Appendix A). Columns 5 and 6 report the heliocentric and projected Galactocentric distance of each source, respectively. Columns 7, 8, and 9 give the
velocity components toward the Galactic center, in the direction of Galactic rotation, and toward the North Galactic Pole, respectively. Column 10 lists
the reference papers for the trigonometric parallax measurements: (1) Sanna et al. (2009); (2) this work; (3) Brunthaler et al. (2009). Last column lists
the Galactic arms associated with the HMSFRs as presented in Section 3.1.


![arXiv:2011.15126v3 [cs.CV] 2 Apr 2021](https://img.pdfslide.us/doc/110x75/61a61f1f2a73d7144f627969/arxiv201115126v3-cscv-2-apr-2021.jpg)


![arXiv:2008.00541v1 [physics.optics] 2 Aug 2020](https://img.pdfslide.us/doc/110x75/6195634c2a157652a72075cf/arxiv200800541v1-2-aug-2020.jpg)


![arXiv:1805.11229v4 [math.OA] 2 Mar 2020](https://img.pdfslide.us/doc/110x75/61b33107ef54d677e35c77f6/arxiv180511229v4-mathoa-2-mar-2020.jpg)
![arXiv:1910.01236v1 [cs.CV] 2 Oct 2019](https://img.pdfslide.us/doc/110x75/61ea8e02dca20922cc5c5847/arxiv191001236v1-cscv-2-oct-2019.jpg)

![arXiv:1301.4566v2 [stat.ML] 2 May 2013](https://img.pdfslide.us/doc/110x75/61e8a58f7684da0f53671cca/arxiv13014566v2-statml-2-may-2013.jpg)
![arXiv:2004.01173v1 [math.OC] 2 Apr 2020](https://img.pdfslide.us/doc/110x75/61bd285361276e740b0ff360/arxiv200401173v1-mathoc-2-apr-2020.jpg)
![arXiv:1307.0433v2 [cs.DC] 2 Jul 2013](https://img.pdfslide.us/doc/110x75/61c49ce25583e2787e7620e4/arxiv13070433v2-csdc-2-jul-2013.jpg)
![arXiv:2111.01392v1 [cs.SI] 2 Nov 2021](https://img.pdfslide.us/doc/110x75/61bd362b61276e740b1074eb/arxiv211101392v1-cssi-2-nov-2021.jpg)