Embed Size (px)
Citation preview

1 Half-year Financial Report 30 June 2011
Half-year Financial Report as of 30 June 2011

2Piaggio Group
1 Report on Operations 5Introduction 7Key operating and financial data 8Corporate structure 10Company boards 13Significant events during first half of 2011 14Background 15
The market 15The regulatory framework 18
Financial position and performance of the Group 22Consolidated income statement 22Consolidated statement of financial position 24Consolidated Cash Flow Statement 25Alternative non-GAAP performance measures 26
Results by operating segment 28Two-wheeler 30Commercial Vehicles 34
Events occurring after the end of the period 37Operating outlook 38Transactions with related parties 39
Relations with the Parent Company 39Piaggio and its production sites 40Piaggio and research and development 42Piaggio and human resources 44
Staff 44Organisational development 44Developing Human Capital 45Reviews 45Piaggio Way 45Training 45Health and Safety 46Industrial relations 47
Corporate Governance 48Stock option plan 50Economic glossary 53
2 Abbreviated Half-Year Financial Statements, Consolidated Financial Statements and Notes as of 30 June 2011 54Consolidated Income Statement 56Consolidated Statement of Comprehensive Income 57Consolidated Statement of Financial Position 58Consolidated Cash Flow Statement 59Consolidated Net Debt (Net Financial Debt) 60Changes in Consolidated Shareholders’ Equity 62Notes to the Abbreviated Half-Year Financial Statements as of 30 June 2011 64Certification of the Abbreviated Half-Year Financial Statements pursuant to article 154 bis of Italian Legislative Decree 58/98 109Report of the Independent Auditors on the limited auditing of the Abbreviated Half-Year Financial Statements 110
Contents
4Piaggio Group
5 Half-year Financial Report 30 June 2011
RepoRt on opeRations
Introduction 7Key operating and financial data 8Corporate structure 10Company boards 13Significant events during first half of 2011 14Background 15Financial position and performance of the Group 22Results by operating segment 28Events occurring after the end of the period 37Operating outlook 38Transactions with related parties 39Piaggio and its production sites 40Piaggio and research and development 42Piaggio and human resources 44Corporate Governance 48Stock option plan 50Economic glossary 53

6Piaggio Group
7 Half-year Financial Report 30 June 2011
This Half-year Financial Report as of 30 June 2011 was drafted in compliance with Italian Legislative Decree no. 58/1998 and subsequent amendments, as well as the Consob Regulation on Issuers.This Half-year Financial Report was drafted in compliance with the International Financial Reporting Standards (« IFRS ») issued by the International Accounting Standards Board (« IASB ») and ratified by the EU, and according to IAS 34 - Interim Financial Reporting, applying the same accounting standards as those adopted when drafting the Consolidated Financial Statements as of 31 December 2010, with the exception of items in the Notes in the section on Accounting standards, amendments and interpretations applied as of 1 January 2011.
Introduction
8Piaggio Group
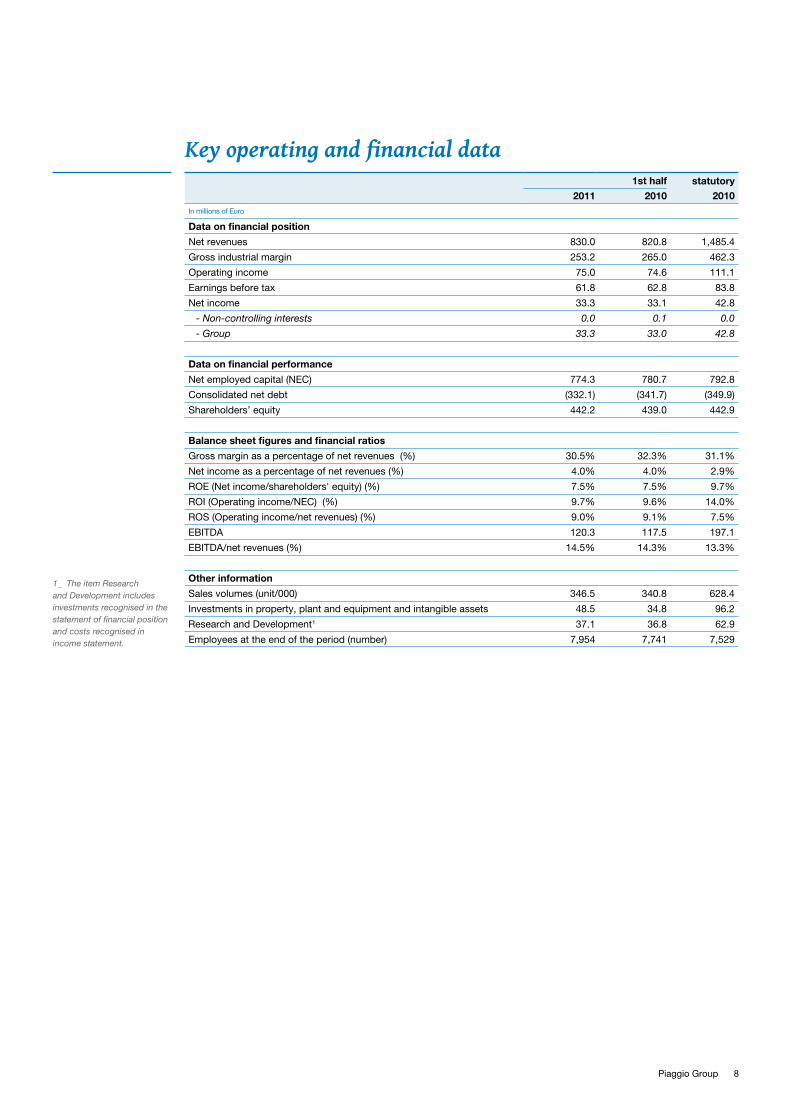
Key operating and financial data 1st half statutory
2011 2010 2010In millions of Euro
Data on financial position
Net revenues 830.0 820.8 1,485.4
Gross industrial margin 253.2 265.0 462.3
Operating income 75.0 74.6 111.1
Earnings before tax 61.8 62.8 83.8
Net income 33.3 33.1 42.8
- Non-controlling interests 0.0 0.1 0.0
- Group 33.3 33.0 42.8
Data on financial performance
Net employed capital (NEC) 774.3 780.7 792.8
Consolidated net debt (332.1) (341.7) (349.9)
Shareholders’ equity 442.2 439.0 442.9
Balance sheet figures and financial ratios
Gross margin as a percentage of net revenues (%) 30.5% 32.3% 31.1%
Net income as a percentage of net revenues (%) 4.0% 4.0% 2.9%
ROE (Net income/shareholders' equity) (%) 7.5% 7.5% 9.7%
ROI (Operating income/NEC) (%) 9.7% 9.6% 14.0%
ROS (Operating income/net revenues) (%) 9.0% 9.1% 7.5%
EBITDA 120.3 117.5 197.1
EBITDA/net revenues (%) 14.5% 14.3% 13.3%
Other information
Sales volumes (unit/000) 346.5 340.8 628.4
Investments in property, plant and equipment and intangible assets 48.5 34.8 96.2
Research and Development1 37.1 36.8 62.9
Employees at the end of the period (number) 7,954 7,741 7,529
1_ The item Research and Development includes investments recognised in the statement of financial position and costs recognised in income statement.

9 Half-year Financial Report 30 June 2011
10Piaggio Group
PIAGGIOVEHICLESPVT.LTD
India99,99%
PIAGGIOVIETNAMCO.LTD
Vietnam87,5%
PIAGGIOVESPA B.V.
Holland100%
PIAGGIOGROUPJAPAN
Japan100%
PIAGGIOLIMITED
United Kingdom99,99%
PIAGGIOHELLAS
S.A.
Greece100%
PIAGGIODEUTSCHLAND
GMBH
Germany100%
PIAGGIOFRANCE SAS
France100%
PIAGGIOGROUP
AMERICAS INC.
USA100%
APRILIABRASIL S.A.
Brazil51%
PIAGGIOGROUP
CANADA INC.
Canada100%PIAGGIO
HRVATSKA DOO
Croatia75%
PIAGGIOASIA
PACIFIC LTD
Singapore100%
PIAGGIOESPANA SLU
Spain100%
APRILIA WORLD
SERVICE B.V.
Holland100%
APRILIA WORLD
SERVICE B.V.
Swiss Branch
PIAGGIOFINANCE S.A.
Luxembourg99,9%
APRILIA RACING SRL
Italy100%
NACIONAL MOTOR SA
Spain100%
DERBIRACING SL
Spain100% APRILIA WORLD
SERVICE HOLDING DO BRASIL Ltda
Brazil99,99%
51%
PIAGGIO CHINACO.LTD
Hong Kong99,99%
ZONGSHENPIAGGIOFOSHAN
MOTORCYCLECO.TLDChina45%
32,5% 12,5%
1%
36,5%
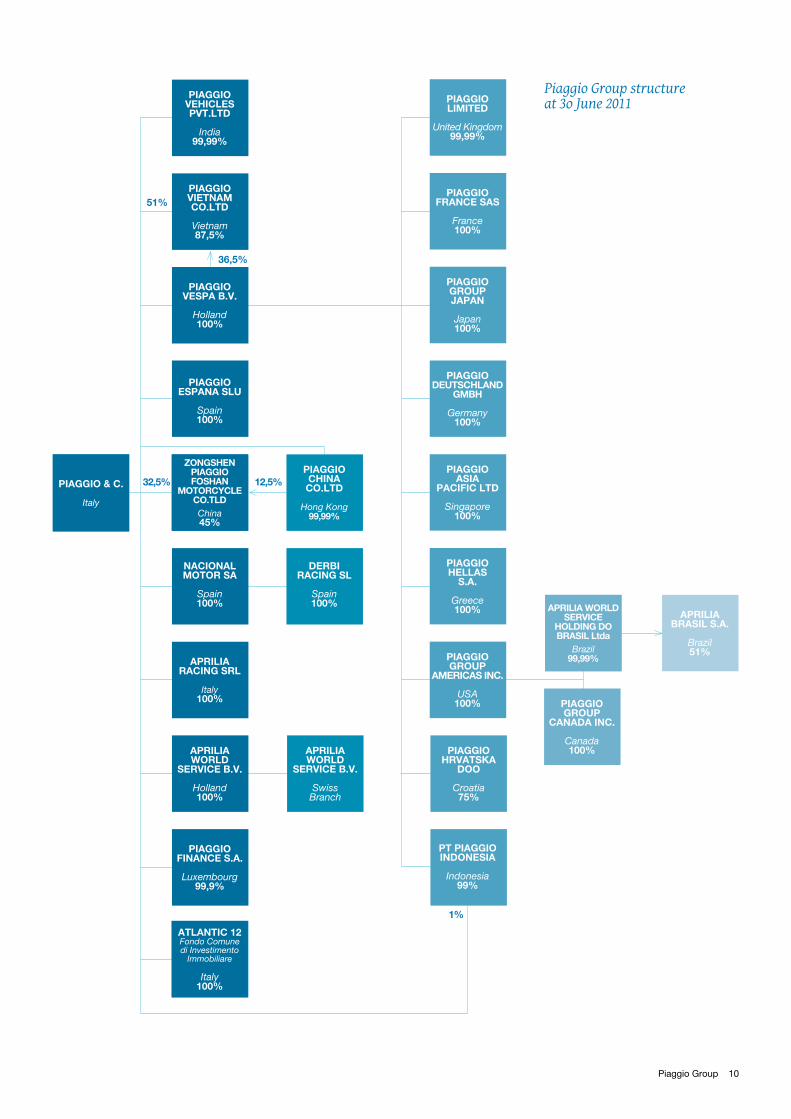
Piaggio Group structureat 3o June 2011
PT PIAGGIO INDONESIA
Indonesia99%
ATLANTIC 12Fondo Comune di Investimento
Immobiliare
Italy100%
PIAGGIO & C.
Italy
11 Half-year Financial Report 30 June 2011
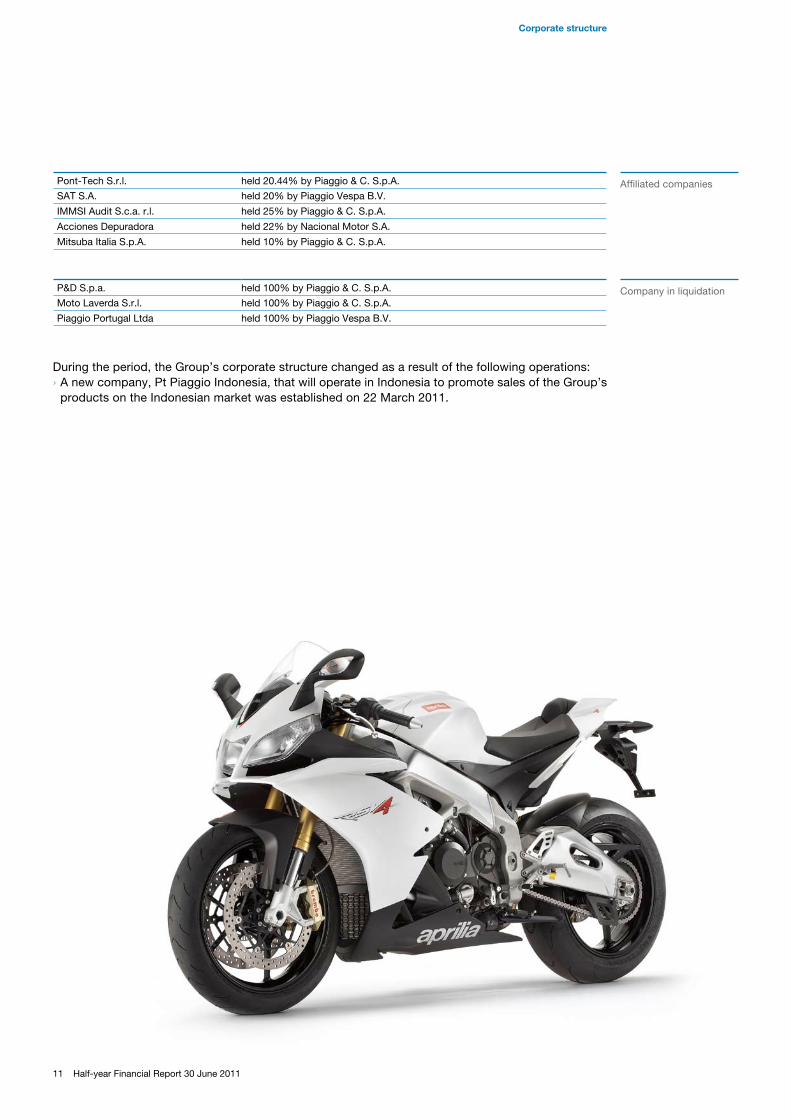
During the period, the Group’s corporate structure changed as a result of the following operations:A new company, Pt Piaggio Indonesia, that will operate in Indonesia to promote sales of the Group’s ›products on the Indonesian market was established on 22 March 2011.
Corporate structure
Pont-Tech S.r.l. held 20.44% by Piaggio & C. S.p.A.
SAT S.A. held 20% by Piaggio Vespa B.V.
IMMSI Audit S.c.a. r.l. held 25% by Piaggio & C. S.p.A.
Acciones Depuradora held 22% by Nacional Motor S.A.
Mitsuba Italia S.p.A. held 10% by Piaggio & C. S.p.A.
P&D S.p.a. held 100% by Piaggio & C. S.p.A.
Moto Laverda S.r.l. held 100% by Piaggio & C. S.p.A.
Piaggio Portugal Ltda held 100% by Piaggio Vespa B.V.
Affiliated companies
Company in liquidation
12Piaggio Group
13 Half-year Financial Report 30 June 2011
Company boards
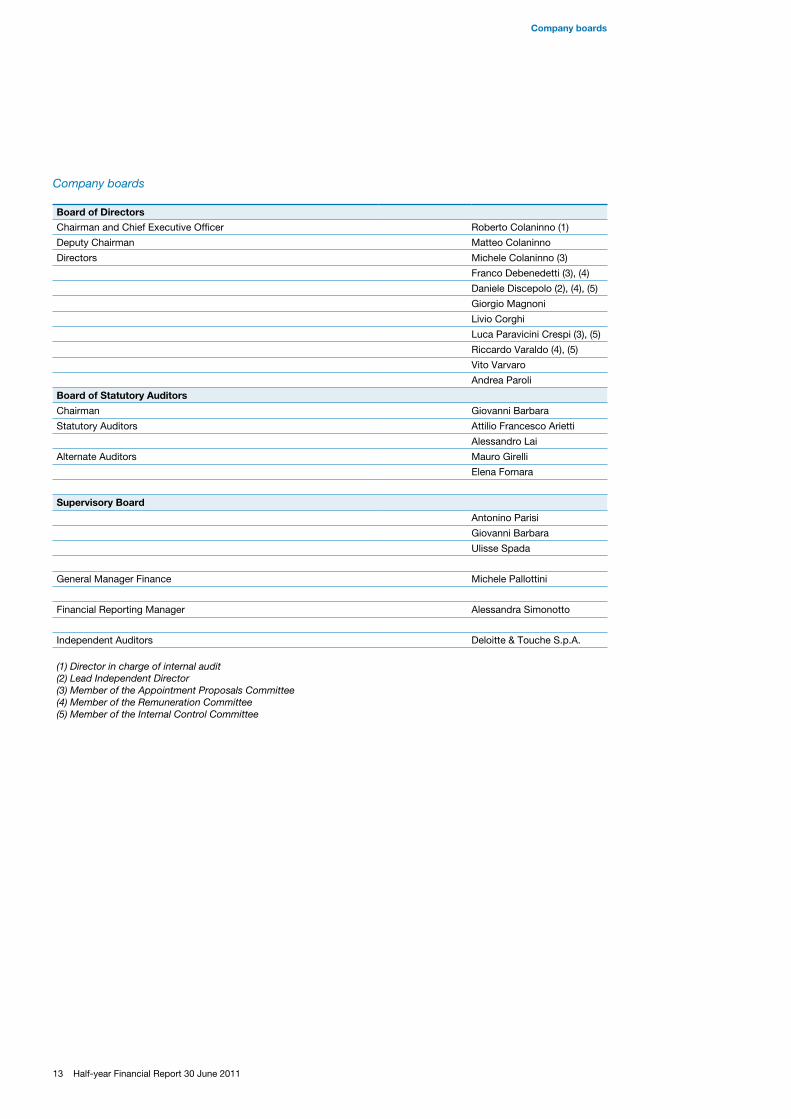
Board of Directors
Chairman and Chief Executive Officer Roberto Colaninno (1)
Deputy Chairman Matteo Colaninno
Directors Michele Colaninno (3)
Franco Debenedetti (3), (4)
Daniele Discepolo (2), (4), (5)
Giorgio Magnoni
Livio Corghi
Luca Paravicini Crespi (3), (5)
Riccardo Varaldo (4), (5)
Vito Varvaro
Andrea Paroli
Board of Statutory Auditors
Chairman Giovanni Barbara
Statutory Auditors Attilio Francesco Arietti
Alessandro Lai
Alternate Auditors Mauro Girelli
Elena Fornara
Supervisory Board
Antonino Parisi
Giovanni Barbara
Ulisse Spada
General Manager Finance Michele Pallottini
Financial Reporting Manager Alessandra Simonotto
Independent Auditors Deloitte & Touche S.p.A.
(1) Director in charge of internal audit(2) Lead Independent Director(3) Member of the Appointment Proposals Committee(4) Member of the Remuneration Committee(5) Member of the Internal Control Committee
Company boards
14Piaggio Group
13 January 2011 - Davide Scotti became Manager of Piaggio Product Development and Strategies Management, replacing Maurizio Roman who left the company.
25 January 2011 - The production site at Vinh Phuc, Vietnam, was awarded ISO 14001:2004 certification (environmental certification).
27 January 2011 - The new range of the Piaggio Porter commercial vehicles, with new Euro 5 petrol and diesel engines, was unveiled.
16 March 2011 - The Vespa PX with a 125cc and 150cc engine and four manual gears, was launched on the market.
22 March 2011 - A new company was established in Indonesia, which will directly sell the Group’s vehicles, which have so far been distributed by importers.
6 April 2011 - A new industrial area, situated in the province of Vinh Phuc, near Hanoi, was inaugurated, where the Group’s Vietnamese site will be expanded (from the current 26,000 m2 to approximately 50,000 m2).
7 June 2011 - The Chairman and CEO of the Piaggio Group, Roberto Colaninno, announced the inception of a new Research Centre at Foshan, China, that will be held 100% by the Piaggio Group and will be involved in developing new engines and new vehicles specifically designed for the needs of Asian markets. The Foshan Research Centre is part of an innovative organisational network model, that will integrate all the Research, Development and Purchasing activities undertaken by the Group at present in Europe, India and China, at a worldwide level.
17 June 2011 - Production of the Piaggio MP3 reached the 100,000 mark, demonstrating the remarkable success of this revolutionary scooter model.
30 June 2011 - The 125cc and 200cc versions of the Scarabeo were restyled and upgraded.
Significant events during first half of 2011
15 Half-year Financial Report 30 June 2011
Background
The market
Two-wheeler
In the first half of 2011, the world market for motorised two-wheelers exceeded 25 million vehicles sold, a 4% increase compared to the same period in 2010.
This strong growth trend is mainly due to the Indian market, with 6.3 million vehicles sold and an 18.2% increase compared to the previous year, becoming the country with the highest growth rate in percentage terms in the first six months of 2011.
China is still the world’s leading market with more than 8 million vehicles sold, but sales dropped by more than 9% compared to 2010.
The Asian area, known as Asean 5, also made a major contribution to growth on the world market, registering an increase of +10.2% (over 7 million units sold). Indonesia ranked top in this area, with a growth rate of 13% and sales volumes topping 4 million units, to account for 55% of sales in South East Asia. Vietnam consolidated its position as second market in the area, with nearly 1.5 million units sold (+16%) followed by Thailand with 900 thousand units sold (-2.6%), while the last two Asean 5 countries, the Philippines and Malaysia, increased sales volumes by +1.6% and +1.0% respectively.
In other Asian countries, the development of the Taiwanese market was important, with an 18% growth in the first six months of 2011, bringing total sales to more than 280 thousand units.
The North American two-wheeler market continued to be affected by the world crisis. However, during the first half of 2011, this decline was extremely limited compared to 2010 (-1%) with approximately 290 thousand units sold. Sales in the United States, which account for approximately 90% of the entire area, increased by 1% with approximately 257 thousand units sold.
The growth trend in Latin America continued in the first half of 2011 (+8%) mainly due to increased sales in Brazil (the area’s reference market), with more than 1 million units sold, equal to an increase of 18% compared to the first half of 2010.
Europe, the main reference area for the Piaggio Group, continued to be negatively affected by the global economic recession and reported a decrease in sales of 7% compared to the first half of 2010, which affected the scooter (-8%) and motorcycle (-6%) segments. Both the over 50cc (-7%) and 50cc (-6%) sectors reported sales decreases. In particular, in the over 50cc segment, scooter sales decreased by 9%, while motorcycle sales fell by 6%. In the 50cc segment, scooter sales dropped by 6% and motorcycle sales by 5%.
The scooter market
ItalyThe Italian scooter market closed the first half of 2011 with 144 thousand vehicles registered, accounting for a decrease of 18% compared to the 176 thousand vehicles of the same period in 2010. The decrease concerned both the 50cc segment (-18% with 36 thousand units sold) and over 50cc segment, with 108 thousand units sold, equal to a 19% decrease compared to the first half of the previous year.
EuropeIn the first half of 2011, sales on the scooter market in Europe fell by 8%, from 569 thousand units in the first half of 2010 to 525 thousand in the first half of 2011.The 50cc scooter segment performed badly, with a 6% decrease in sales, and the number of vehicles sold falling from 272 thousand units in the first half of 2010 to 256 thousand units in 2011.
Background
The marketThe regulatory framework
16Piaggio Group
The over 50cc scooter segment was affected to a greater extent, with a 9% decrease in sales and the number of vehicles sold accounting for 270 thousand units compared to 296 thousand in the same period in 2010.Italy is still the most important market in Europe, with 144 thousand units sold, followed by France with 99 thousand units and Germany with 57 thousand units. Spain ranked fourth with 48 thousand vehicles, while the United Kingdom ended the period with 16 thousand units sold.The French market grew by 3% compared to the previous year, from 97 thousand to 99 thousand units. This increase was driven by the 50cc scooter segment, with sales increasing by 12%, while sales in the over 50cc segment fell by 8%.The German market was affected by a downturn (-5%) with approximately 57 thousand units sold in the first half of 2011. This negative trend was due to the 50cc scooter segment, which fell by 11%, while the Over 50cc scooter segment grew by 7%.The Spanish market was hit by a considerable decrease of 11%, with 48 thousand vehicles sold. This poor performance was caused above all by the sharp drop in the 50cc scooter segment (-30%), while the downturn in the over 50cc segment was less accentuated (-5%).The British market grew by 17% compared to the same period in 2010, with just under 16 thousand vehicles sold. Both the 50cc (+7%) and over 50cc (+25%) segments improved.
North America Sales on the North American scooter market increased in the first half of 2011 (+20%) totalling 21 thousand units. Sales in the United States (which accounts for 85% of the reference area) picked up considerably (+28%), to stand at 18 thousand units. The over 50cc scooter segment performed best (+52%), while the number of vehicles sold in the 50cc scooter segment also increased (+3%).
South America Brazil continues to remain the area of greatest importance including for the scooter market reaching 234,000 units in the first six months, for a growth of 35.5% compared to the first half of 2010.Sales of scooters amounted to 204,500 Cub scooters (scooters with gears) (up +33% over the first half of 2010) and 29,300 automatic scooters (up +55% compared to the same period of the previous year).In the automatic scooter segment, models up to 125cc ranked top with around 25,000 units sold (+40% compared to the first six months of 2010), while models over 125cc rose from 1,000 in the first half of 2010 to 4,300 in the same period of 2011.
VietnamThe Vietnamese market mainly concerns scooters, as sales in the motorcycle segment are not particularly significant. The two main product segments are Cub scooters (924 thousand units in the first half of 2011, +14% over 2010) and automatic scooters (356 thousand units, up 16% over 2010). The 50cc scooter segment is not operative on this market. In the Cub segment, 51cc to 115 cc models were the best performers, with approximately 830 thousand units sold, accounting for 90% of the entire segment.In the automatic scooter segment, 115cc-125cc models ranked top (56.3%), with 102 thousand sold in the first half of 2011, and a two-fold increase in sales over 2010. The 51cc-115cc segment decreased by 6.5%, while sales in the over 125 cc segment went up from 1,520 units to approximately 2,800.
The motorcycle market
ItalyIn the first half of 2011, the motorcycle market (including 50cc motorcycles) in Italy fell by 10%, from 66 thousand units in the first half of 2010 to 59 thousand units. This performance is mainly due to the downturn in the 51cc-125cc motorcycle subsegment (down by 13%, with sales of 4 thousand units) and the 126-750cc motorcycle subsegment (down by 23%, with sales of 20 thousand vehicles). Large engine motorcycles partly offset the negative trend of other segments. Sales in the first half of 2011 went up to 33
17 Half-year Financial Report 30 June 2011
thousand units against 32 thousand in 2010 (+1%). The 50cc motorcycle segment declined, with just under 3 thousand units sold (-7%).
EuropeOn a European level, sales decreased on the motorcycle market (including 50cc motorcycles) in the first half of 2011, from 360 thousand units in the first half of 2010 to 339 thousand units in the same period in 2011 (-6%). The most significant downturn was in the 126-750cc segment, with sales falling from 125 thousand units in 2010 to 106 thousand units in 2011 (-16%). This was followed by the 51-125cc segment, with sales dropping from 48 thousand units to 44 thousand units (-8%) and the 50cc segment, with sales falling by -5% and 25 thousand units sold in the first half of 2011.Like the Italian market, aggregate European figures for the over 750cc motorcycle segment showed an increase in the first half of 2011 (+2%), with more than 165 thousand units sold.France remained the leading European market (76 thousand units), followed by Germany, with 66 thousand units, which was ahead of Italy with 59 thousand units, and the United Kingdom (35 thousand units) and Spain (26 thousand units).
North America After a considerable decline following the world crisis, sales on the North American motorcycle market dropped only slightly in the first half of 2011 (-2%), and this was mainly attributable to the Canadian market. During the period in question, sales volumes in the United States were steady compared to the previous year. Over 750cc motorcycles accounted for 62% of the market, with a 3% increase, which offset the loss of the 50cc motorcycle segment (-36%); the 51-125cc motorcycle (-20%) segment and 126-750cc (-2%) motorcycle segment.
South AmericaThe South American reference market for motorcycles is also Brazil.Motorcycle sales in Brazil in the first six months of 2011 grew 13.9% with 798 thousand units sold.Top ranking models are in the 126cc to 300cc with 477 thousand units sold in the first six months of 2011, an increase of 25.6% over the same period of the previous year.
Commercial Vehicles
EuropeIn the first half of 2011, the European market (EU27+EFTA) for light commercial vehicles (vehicles with a maximum mass of up to 3.5 tons), where the Piaggio Group operates, accounted for 0.86 million units registered, for a growth of 9.7% over the first half of 2010.The trend of main countries in this area was as follows: Italy registered a decrease of 0.8%, with sales falling from 102,726 units in the first half of 2010 to 101,878 in the first half of 2011, Spain also witnessed a drop of 13.3%, while the French and German markets registered an increase of 5.1%, and 19.9%, respectively.
IndiaThe Indian three-wheeler market - where Piaggio Vehicles Private Limited, a subsidiary of Piaggio & C. S.p.A., operates - went up from 223,876 units in the first half of 2010 to 253,038 in the first half of 2011, registering a 13% increase.Within this market, the passenger transport vehicles segment continued its growth trend, selling 197,728 units, up 12.46%, while the cargo segment reported an increase of 15.11%, with sales going up from 48,048 to 55,310 units. The traditional three-wheeler market is flanked by the four-wheeler light commercial vehicles (LCV) market (cargo vehicles for goods transport) where Piaggio Vehicles Private Limited operates with the Apé Truk and Apé Mini. The LCV cargo market accounted for sales of 153,198 units in the first half of 2011, up 23.2% over the same period in 2010.
Background The marketThe regulatory framework
18Piaggio Group
The regulatory framework
Two-wheeler
ItalyAs of 1 April 2011, to obtain a licence to drive mopeds riders must pass a riding test (riders who were eighteen or over on 30 September 2005 are exempt) in addition to the written test required since 2005 whose contents are identical to those for Italian A and A1 licences. An extra house of lessons has been added to the classes for the written test related to the operation of mopeds in the event of an emergency, bringing the course duration to 13 hours instead of 12.
Italian Legislative Decree no. 59 of 18 April 2011 implements the European Directive 2006/126 on driving licences and will come into force on 19 January 2013. The following are introduced with the new law:
the current licence to ride mopeds has been turned into an AM category licence; ›an A2 category licence has been created, for riders of motorcycles with a maximum power ≤ 35 kW, ›a power/weight ratio below 0.2 kW/kg and which do not derive from a version that is over 70 kW. The minimum age for this licence is 18 years;at 24 years of age, riders can directly apply for an A category licence, without having had previous riding ›experience, or at 20 years of age, if they already have an A2 category licence.riders can ride a motor tricycle with a maximum power above 15 kW in Italy, at 21 years of age, with ›either a category A or B licence.
These new aspects introduced by the Directive will only concern licences issued from 19 January 2013 onwards, and will not affect the rights of riders who already hold a licence.
The Gazzetta Ufficiale no. 76 of 2 April 2011 published the decree requiring owners of mopeds with old vehicle ID (registered prior to 14 July 2006), to obtain the number plates currently required by the Highway Code, as well as vehicle transit documents, based on specific deadlines, in order to ride on roads.
Italian Legislative Decree no. 68 of 6 May 2011, on tax federalism, published in the Gazzetta Ufficiale of 12 May 2011, introduces a number of amendments concerning provincial registration taxes (IPT). Registration taxes for new vehicles and for the transfer of owned vehicles in some categories (cars and motor tricycles) will be increased. It is possible that decrees implementing the abovementioned Law Decree apply tax increases to motorcycles “above a certain power” (which is not specified), presumably starting from 2012.
In May 2011 the Gazzetta Ufficiale published legislative decree no. 55 of 31 March 2011, which introduces a system to control and reduce greenhouse gas emissions, and criteria for biofuel sustainability, implementing Directive 2009/30/EC of 23 April 2009. As a result, new fuels may be available in future at commercial depots and fuel stations, including E10 (petrol with an ethanol content up to 10%). Fuel stations will also have to keep a list indicating vehicles which are compatible with this fuel, for customers to consult.
EuropeThe draft European Regulation on the type approval of two-, three- and four-wheelers - submitted by the European Commission at the end of last year - is now being evaluated by the European Parliament and Council. The proposal includes new requirements which concern in particular, the reorganisation of current two- and three-wheelers and quadricycles, simplification of the current legal framework, a reduction in pollution levels based on steps that will introduce increasingly stricter emission levels, new requirements for vehicle design and construction focussed on safety, and new administrative and technical requirements to increase member state surveillance of non-EU vehicles.An initial vote from the Internal Market and Consumer Protection Committee is expected after the summer, while plenary session voting should take place at the end of the year.
19 Half-year Financial Report 30 June 2011
At the end of March 2011 the European Commission published its White Paper on Transport, a document that includes a far-reaching strategic plan that aims to revolutionise the European transport system over the next 40 years, increasing the competitive edge of mobility in Europe and reducing dependence on conventional energy sources.
In Spain, following the early implementation of the new European Directive on driving licences, regulations have already come into force that will become mandatory for the rest of the EU from 19 January 2013. Therefore, the licences recently issued by Spain will not be recognised in the rest of the European Union for another year and a half, creating a restriction on the right of Spanish citizens to move freely within the European Union.In addition, the Spanish government is evaluating the possibility of making current regulations for obtaining licences to ride motorcycles of an unlimited power even stricter.
In France, as established by decree no. 201-1390, as from 1 January 2011 persons wishing to ride mopeds/motorcycles with an engine capacity up to 125 cc and with a power up to 11 kW or a tricycle have to hold a category B licence for at least two years and attend a 7-hour course at a driving school; alternatively they must prove they have already been riding a vehicle for the 5 years prior to the decree coming into force, with proof from their insurance company.France’s Interministerial Committee for Road Safety (CISR) is considering the possibility of making licences invalid if the rider cannot prove he/she has ridden and therefore insured their vehicle in the previous 5 years.
AsiaIn Taiwan, the Taiwanese Environmental Protection Agency (EPA) is assessing the possibility of setting pollution limits equivalent to Euro 4 limits of EU member states for motorcycles, from 2014 onwards.
In Vietnam, vehicle type approval tests will include evaporative emission testing, as from 19 May 2012.
Commercial Vehicles
ItalyAs in the case of two-wheelers, riders of three-wheeler mopeds and light quadricycles (minicars) will have to take a practical test, in addition to the mandatory theoretical test, from April, to obtain a licence. Regardless of the type of vehicle they choose to take the test with, the licence will enable successful candidates to ride all two- and three-wheeler mopeds and light quadricycles.
In May 2011, the IX Italian Parliamentary (Transport) Committee submitted its evaluation of the EU draft regulation on future EU type approval (COM(2010)542 def) to the EU, indicating some critical factors concerning the limited time for applying future procedures and the strict maximum mass limit established for quadricycles. In addition, the IX Parliamentary Committee requested the EU Commission to evaluate the possibility of introducing mandatory safety tests for the type approval of some types of quadricycles.
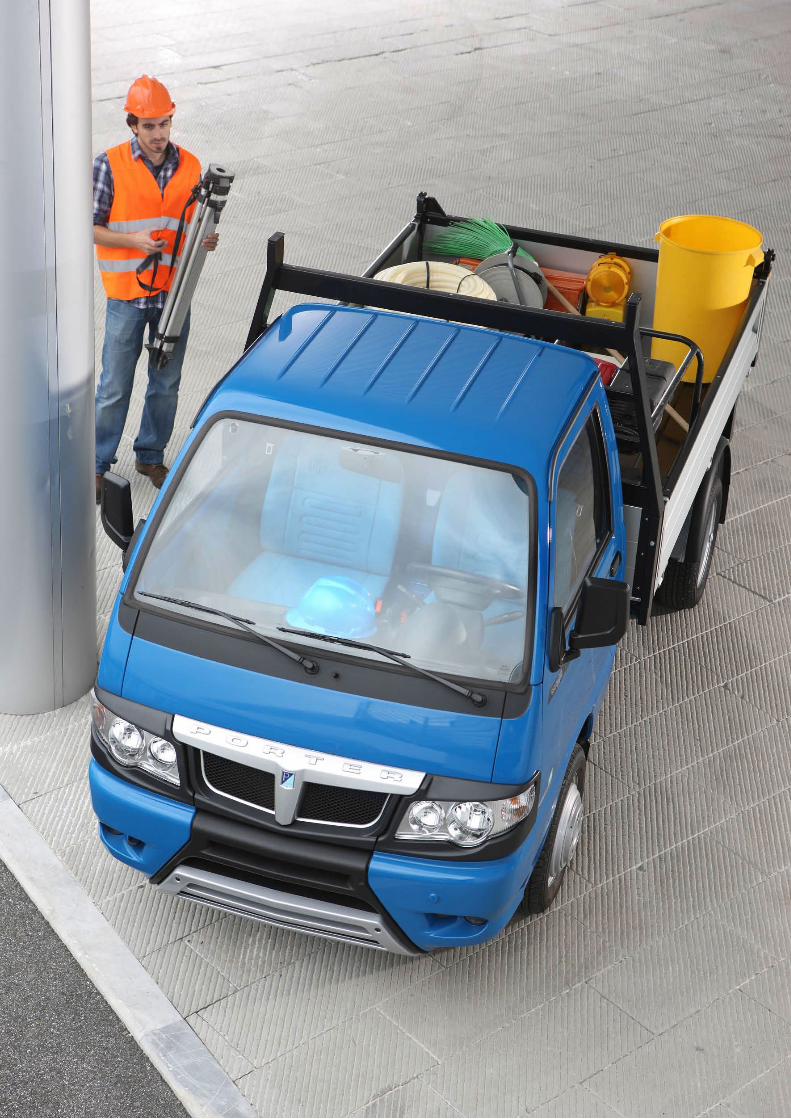
EuropeAs from 7 February 2011, in compliance with the Directive 2008/89/EC, M1 category vehicles (cars) and N1 category vehicles (for the transport of goods, such as the Porter) with new type approval shall have daytime running lights. This requirement has been introduced by the European Union in order to improve road safety through vehicle visibility.
On 11 May 2011, Regulation no. 510/2011 of the European Parliament and Council was approved, which establishes CO2 emission levels for light commercial vehicles. Under the Regulation, small-scale manufacturers of N1 vehicles may defer the new pollutant emission limits, and maintain higher emission values. In the autumn, the European Commission will begin drafting the parameters which manufacturers must comply with to obtain this deferment.
Background The marketThe regulatory framework
20Piaggio Group
IndiaActivities continued in India to update national laws on vehicle safety and pollution to international standards. In particular, the process to update requirements concerning pollutant emissions produced by vehicles in major cities to European standards is ongoing, and safety regulations are being aligned with UNECE standards.
21 Half-year Financial Report 30 June 2011
22Piaggio Group
Consolidated income statement
Vehicles
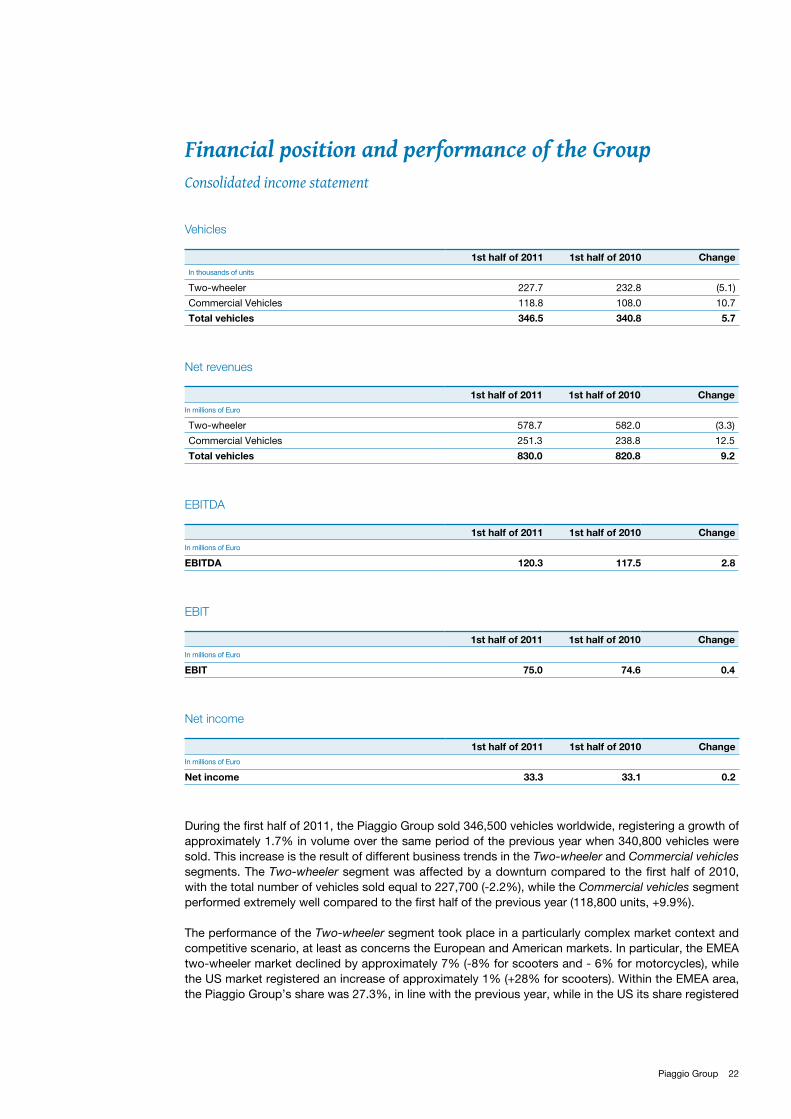
During the first half of 2011, the Piaggio Group sold 346,500 vehicles worldwide, registering a growth of approximately 1.7% in volume over the same period of the previous year when 340,800 vehicles were sold. This increase is the result of different business trends in the Two-wheeler and Commercial vehicles segments. The Two-wheeler segment was affected by a downturn compared to the first half of 2010, with the total number of vehicles sold equal to 227,700 (-2.2%), while the Commercial vehicles segment performed extremely well compared to the first half of the previous year (118,800 units, +9.9%).
The performance of the Two-wheeler segment took place in a particularly complex market context and competitive scenario, at least as concerns the European and American markets. In particular, the EMEA two-wheeler market declined by approximately 7% (-8% for scooters and - 6% for motorcycles), while the US market registered an increase of approximately 1% (+28% for scooters). Within the EMEA area, the Piaggio Group’s share was 27.3%, in line with the previous year, while in the US its share registered
1st half of 2011 1st half of 2010 ChangeIn thousands of units
Two-wheeler 227.7 232.8 (5.1)
Commercial Vehicles 118.8 108.0 10.7
Total vehicles 346.5 340.8 5.7
Net revenues
EBITDA
EBIT
Net income
1st half of 2011 1st half of 2010 ChangeIn millions of Euro
Two-wheeler 578.7 582.0 (3.3)
Commercial Vehicles 251.3 238.8 12.5
Total vehicles 830.0 820.8 9.2
1st half of 2011 1st half of 2010 ChangeIn millions of Euro
EBITDA 120.3 117.5 2.8
1st half of 2011 1st half of 2010 ChangeIn millions of Euro
EBIT 75.0 74.6 0.4
1st half of 2011 1st half of 2010 ChangeIn millions of Euro
Net income 33.3 33.1 0.2
Financial position and performance of the Group
23 Half-year Financial Report 30 June 2011
Consolidated income statementConsolidated statement of financial positionConsolidated Cash Flow StatementAlternative non-GAAP performance measures
Financial position and performance of the Group
a growth on the scooter market (from 24.4% to 24.6%). In Asia, the Group’s performance was positive (37,200 units sold, +25.7% compared to the first half of 2010), based in particular on the success of the Vietnamese subsidiary.
The Commercial Vehicles business performed particularly well on the Indian market, where the subsidiary Piaggio Vehicles Private Limited sold more than 111,400 units and increased its excellent sales figure of the previous half year by 11%.
In terms of consolidated turnover, the Group ended the first half of 2011 with increased net revenues compared to the first half of 2010, equal to 830.0 million euro (+1.1%). In particular, the Two-wheeler segment was affected by a downturn compared to the first six months of 2010 with a total turnover of 578.7 million euro (-0.6%), while the Commercial vehicles business performed excellently, with a turnover of approximately 251.3 million euro (+12.5 million euro, +5.2%). Consequently, the turnover composition changed considerably compared to 2010; in particular, sales in the Two-wheeler segment fell from 70.9% of total turnover in the first half of 2010 to 69.7% of total turnover in the first half of 2011; whereas, the same parameter in the Commercial Vehicles segment rose from 29.1% in the first half of 2010 to 30.3% in the first half of 2011.
Turnover from the Two-wheeler segment basically reflects the trend for volumes: the EMEA market registered a drop in turnover due to the aforesaid market downturn. The increase in turnover in the North American and Asian markets was less than the corresponding growth in sales due to a different mix of sold products.
In terms of the trend on Commercial Vehicles business turnover, the excellent performance achieved by the subsidiary Piaggio Vehicles Private Limited in terms of units sold (+11% compared to the first half of 2010) generated a corresponding increase in turnover. The drop in turnover registered on the European market was greater than the decline in sales due to the greater weight of three wheelers on total sales.
The Group’s gross industrial margin defined as the difference between “net revenues” and “cost to sell” decreased compared to the first half of the previous year. In absolute terms, the margin was equal to 253.2 million euro (-11.8 million euro down compared to the first half of 2010), while in relation to net turnover, it was equal to 30.5% (32.3% in the first half of 2010). The decrease in percentage terms, due mainly to the different business mix between the Two-wheeler and Commercial vehicles businesses, described previously, remained within 1.8 percentage points, thanks to important actions taken to curb product costs.For example, the “cost to sell” includes costs for materials (direct and consumables), accessory purchase costs (transport of incoming material, customs, warehousing), employee costs for direct and indirect manpower and relative expenses, work carried out by third parties, energy costs, depreciation of property, plant, equipment and industrial equipment, maintenance and cleaning costs net of sundry cost recovery recharged to suppliers. Amortisation/depreciation included in the gross industrial margin was equal to 16.4 million euro (16.4 million euro in the first half of 2010).
Operating expenses incurred during 2011 totalled 178.2 million euro, 12.3 million euro less compared to the same period of the previous year (190.5 million euro), and highlight the Group’s constant focus on keeping costs down and maintaining high profitability levels.For example, operating expenses include employee costs, costs for services and lease and rental costs, as well as operating costs net of operating income not included in the gross industrial margin. Operating expenses also include amortisation/depreciation not included in the gross industrial margin, amounting to 29.0 million euro (26.5 million euro in the first half of 2010).
These trends in the income statement resulted in a consolidated EBITDA, defined as operating income gross of amortisation/depreciation, which was higher compared to the first half of 2010, totalling 120.3 million euro (117.5 million euro in the first half of 2010). In relation to turnover, EBITDA totalled 14.5%, for
24Piaggio Group
an improvement compared to the budget forecasts and slightly higher than the 14.3% registered in the first half of last year. In terms of Operating Income (EBIT), the performance of the half year in progress also improved compared to the first six months of 2010, with a consolidated EBIT totalling 75.0 million euro for an increase of 0.4 million euro over the same period in 2010; in relation to turnover, EBIT was equal to 9.0%, compared to 9.1% for the first half of 2010.
The result of financial assets worsened compared to the first half of last year, with Net Charges amounting to 13.1 million euro (11.8 million euro in the first half of 2010). This growth is related to an increase in costs of Euribor index-linked loans and a negative effect from currency management.
Consolidated net profit stood at 33.3 million euro (4.0% of turnover), slightly up on the figure for the first half of 2010, of 33.1 million euro (4.0% of turnover). Income tax for the period is estimated at 28.5 million euro, equivalent to 46.1% of earnings before tax.
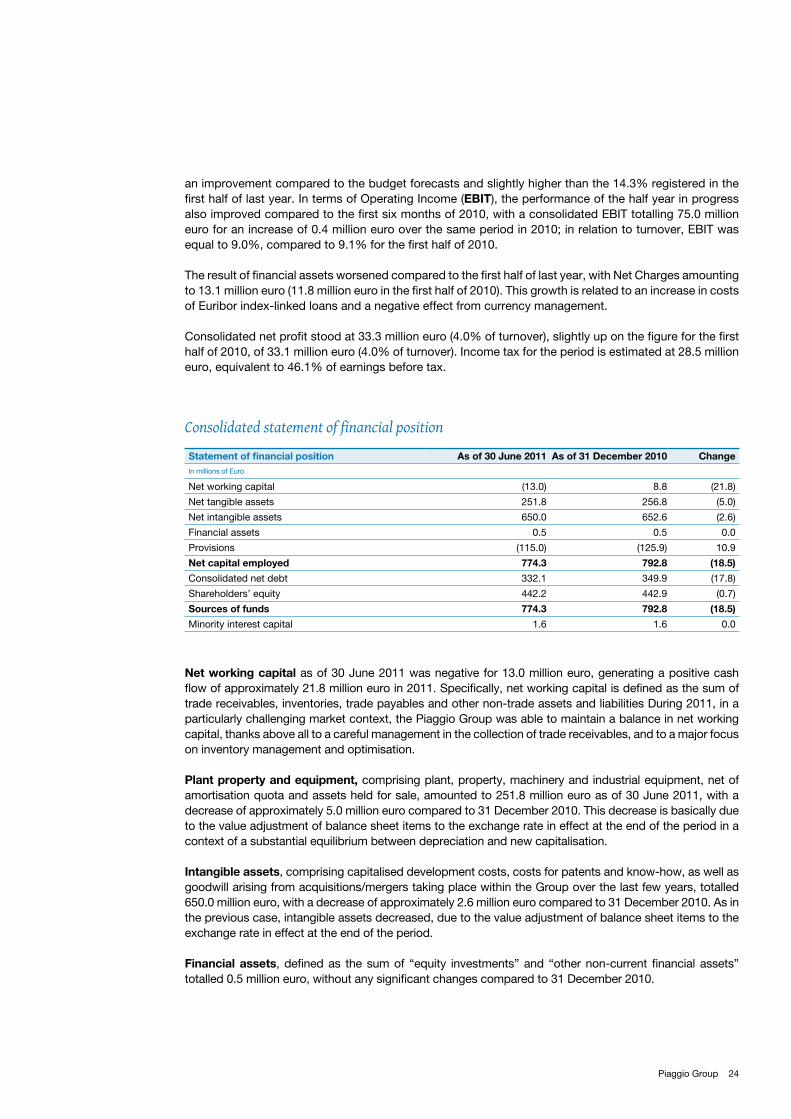
Consolidated statement of financial position
Net working capital as of 30 June 2011 was negative for 13.0 million euro, generating a positive cash flow of approximately 21.8 million euro in 2011. Specifically, net working capital is defined as the sum of trade receivables, inventories, trade payables and other non-trade assets and liabilities During 2011, in a particularly challenging market context, the Piaggio Group was able to maintain a balance in net working capital, thanks above all to a careful management in the collection of trade receivables, and to a major focus on inventory management and optimisation.
Plant property and equipment, comprising plant, property, machinery and industrial equipment, net of amortisation quota and assets held for sale, amounted to 251.8 million euro as of 30 June 2011, with a decrease of approximately 5.0 million euro compared to 31 December 2010. This decrease is basically due to the value adjustment of balance sheet items to the exchange rate in effect at the end of the period in a context of a substantial equilibrium between depreciation and new capitalisation.
Intangible assets, comprising capitalised development costs, costs for patents and know-how, as well as goodwill arising from acquisitions/mergers taking place within the Group over the last few years, totalled 650.0 million euro, with a decrease of approximately 2.6 million euro compared to 31 December 2010. As in the previous case, intangible assets decreased, due to the value adjustment of balance sheet items to the exchange rate in effect at the end of the period.
Financial assets, defined as the sum of “equity investments” and “other non-current financial assets” totalled 0.5 million euro, without any significant changes compared to 31 December 2010.
Statement of financial position As of 30 June 2011 As of 31 December 2010 ChangeIn millions of Euro
Net working capital (13.0) 8.8 (21.8)
Net tangible assets 251.8 256.8 (5.0)
Net intangible assets 650.0 652.6 (2.6)
Financial assets 0.5 0.5 0.0
Provisions (115.0) (125.9) 10.9
Net capital employed 774.3 792.8 (18.5)
Consolidated net debt 332.1 349.9 (17.8)
Shareholders’ equity 442.2 442.9 (0.7)
Sources of funds 774.3 792.8 (18.5)
Minority interest capital 1.6 1.6 0.0
25 Half-year Financial Report 30 June 2011
Provisions, comprising retirement funds and employee benefits, other long term provisions, from the current portion of other long term provisions, as well as deferred tax liabilities, totalled 115.0 million euro, registering a decrease compared to 31 December 2010 (- 10.9 million euro).
As fully described in the next section on the “Consolidated Cash Flow Statement”, net financial debt as of 30 June 2011 was equal to 332.1 million euro, compared to 349.9 million euro as of 31 December 2010. The improvement of approximately 17.8 million euro in consolidated net debt is mainly due to the positive operating cash flow trend, as well as the good management of net working capital, which allow for the self-financing of investments, as well as the distribution of dividends amounting to a sum of 25.7 million euro.
Shareholders’ equity as of 30 June 2011 amounted to 442.2 million euro, down 0.7 million euro compared to 31 December 2010.
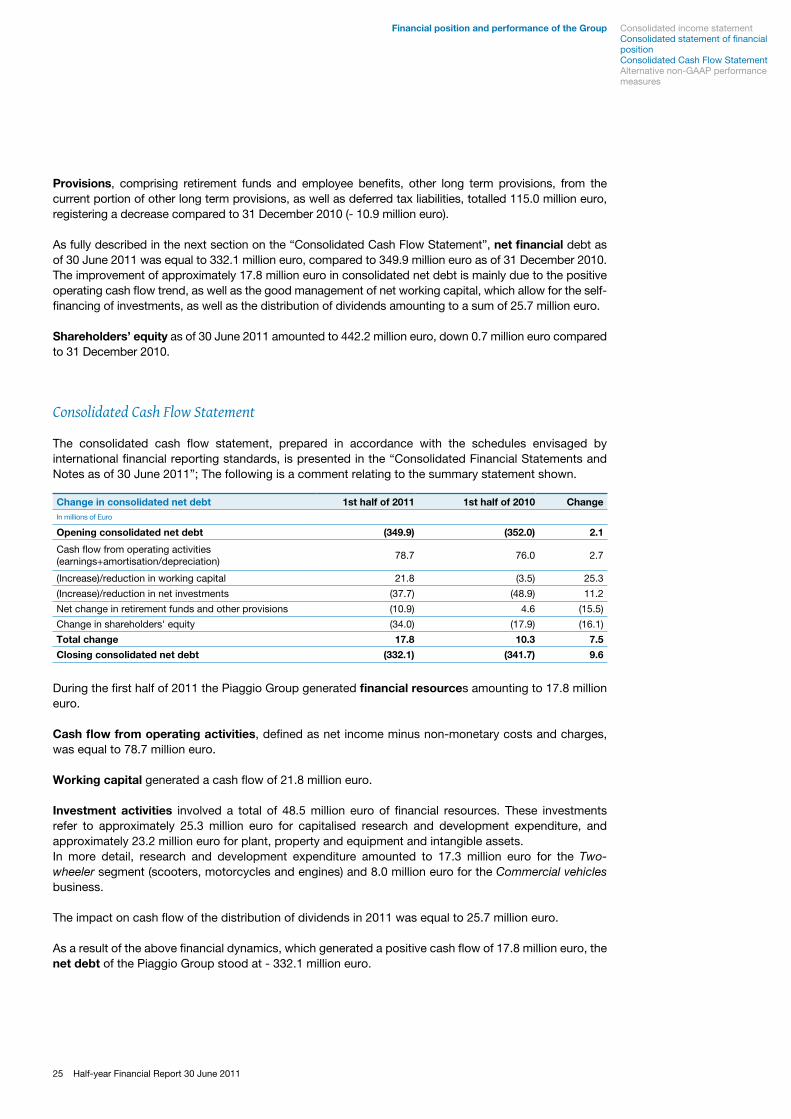
Consolidated Cash Flow Statement
The consolidated cash flow statement, prepared in accordance with the schedules envisaged by international financial reporting standards, is presented in the “Consolidated Financial Statements and Notes as of 30 June 2011”; The following is a comment relating to the summary statement shown.
During the first half of 2011 the Piaggio Group generated financial resources amounting to 17.8 million euro.
Cash flow from operating activities, defined as net income minus non-monetary costs and charges, was equal to 78.7 million euro.
Working capital generated a cash flow of 21.8 million euro.
Investment activities involved a total of 48.5 million euro of financial resources. These investments refer to approximately 25.3 million euro for capitalised research and development expenditure, and approximately 23.2 million euro for plant, property and equipment and intangible assets. In more detail, research and development expenditure amounted to 17.3 million euro for the Two-wheeler segment (scooters, motorcycles and engines) and 8.0 million euro for the Commercial vehicles business.
The impact on cash flow of the distribution of dividends in 2011 was equal to 25.7 million euro.
As a result of the above financial dynamics, which generated a positive cash flow of 17.8 million euro, the net debt of the Piaggio Group stood at - 332.1 million euro.
Change in consolidated net debt 1st half of 2011 1st half of 2010 ChangeIn millions of Euro
Opening consolidated net debt (349.9) (352.0) 2.1
Cash flow from operating activities (earnings+amortisation/depreciation)
78.7 76.0 2.7
(Increase)/reduction in working capital 21.8 (3.5) 25.3
(Increase)/reduction in net investments (37.7) (48.9) 11.2
Net change in retirement funds and other provisions (10.9) 4.6 (15.5)
Change in shareholders' equity (34.0) (17.9) (16.1)
Total change 17.8 10.3 7.5
Closing consolidated net debt (332.1) (341.7) 9.6
Consolidated income statementConsolidated statement of financial positionConsolidated Cash Flow StatementAlternative non-GAAP performance measures
Financial position and performance of the Group
26Piaggio Group
Alternative non-GAAP performance measures
In accordance with CESR recommendation CESR/05-178b on alternative performance measures, in addition to IFRS financial measures, Piaggio has included other non-IFRS measures in its Report on Operations.
These are presented in order to measure the trend of the Group’s operations to a better extent and should not be considered as an alternative to IFRS measures.In particular the following alternative performance measures have been used:
EBITDA › : defined as operating income gross of amortisation/depreciation;Gross industrial margin › defined as the difference between net revenues and the cost to sell;Cost to sell › : this includes costs for materials (direct and consumables), accessory purchase costs (transport of incoming material, customs, warehousing), employee costs for direct and indirect manpower and relative expenses, work carried out by third parties, energy costs, depreciation of property, plant, equipment and industrial equipment, maintenance and cleaning costs net of sundry cost recovery recharged to suppliers.Net debt: › gross financial debt, minus cash on hand and other cash and cash equivalents, as well as other current financial receivables. These Consolidated Financial Statements include a table indicating the statement of financial position items used to determine the measure.
27 Half-year Financial Report 30 June 2011
Conto economico consolidatoSituazione patrimoniale consolidataRendiconto finanziario consolidatoIndicatori alternativi di performance “non-GAAP”
Andamento economico-finanziario del Gruppo
28Piaggio Group
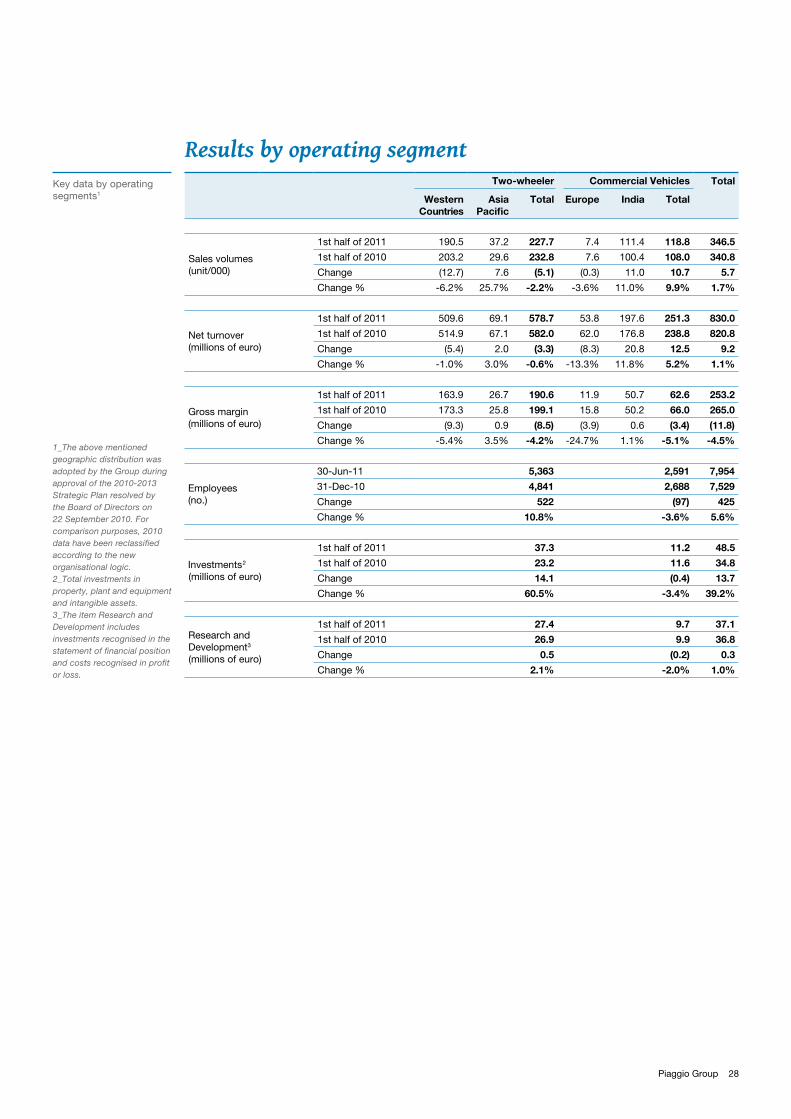
Results by operating segment Key data by operating segments1
1_The above mentioned geographic distribution was adopted by the Group during approval of the 2010-2013 Strategic Plan resolved by the Board of Directors on 22 September 2010. For comparison purposes, 2010 data have been reclassified according to the new organisational logic.2_Total investments in property, plant and equipment and intangible assets.3_The item Research and Development includes investments recognised in the statement of financial position and costs recognised in profit or loss.
Two-wheeler Commercial Vehicles Total
Western Countries
AsiaPacific
Total Europe India Total
Sales volumes (unit/000)
1st half of 2011 190.5 37.2 227.7 7.4 111.4 118.8 346.5
1st half of 2010 203.2 29.6 232.8 7.6 100.4 108.0 340.8
Change (12.7) 7.6 (5.1) (0.3) 11.0 10.7 5.7
Change % -6.2% 25.7% -2.2% -3.6% 11.0% 9.9% 1.7%
Net turnover (millions of euro)
1st half of 2011 509.6 69.1 578.7 53.8 197.6 251.3 830.0
1st half of 2010 514.9 67.1 582.0 62.0 176.8 238.8 820.8
Change (5.4) 2.0 (3.3) (8.3) 20.8 12.5 9.2
Change % -1.0% 3.0% -0.6% -13.3% 11.8% 5.2% 1.1%
Gross margin (millions of euro)
1st half of 2011 163.9 26.7 190.6 11.9 50.7 62.6 253.2
1st half of 2010 173.3 25.8 199.1 15.8 50.2 66.0 265.0
Change (9.3) 0.9 (8.5) (3.9) 0.6 (3.4) (11.8)
Change % -5.4% 3.5% -4.2% -24.7% 1.1% -5.1% -4.5%
Employees(no.)
30-Jun-11 5,363 2,591 7,954
31-Dec-10 4,841 2,688 7,529
Change 522 (97) 425
Change % 10.8% -3.6% 5.6%
Investments2
(millions of euro)
1st half of 2011 37.3 11.2 48.5
1st half of 2010 23.2 11.6 34.8
Change 14.1 (0.4) 13.7
Change % 60.5% -3.4% 39.2%
Research and Development3
(millions of euro)
1st half of 2011 27.4 9.7 37.1
1st half of 2010 26.9 9.9 36.8
Change 0.5 (0.2) 0.3
Change % 2.1% -2.0% 1.0%
29 Half-year Financial Report 30 June 2011
Two-wheelerCommercial Vehicles
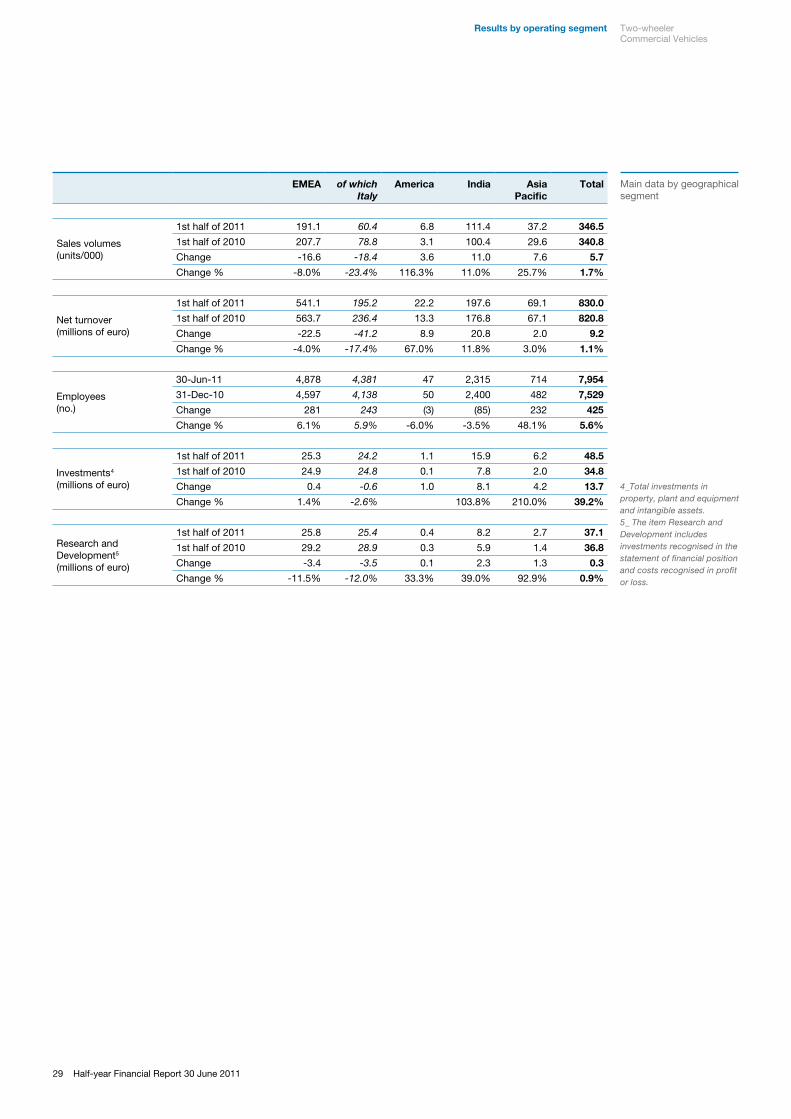
Results by operating segment
Main data by geographical segment
EMEA of whichItaly
America India Asia Pacific
Total
Sales volumes (units/000)
1st half of 2011 191.1 60.4 6.8 111.4 37.2 346.5
1st half of 2010 207.7 78.8 3.1 100.4 29.6 340.8
Change -16.6 -18.4 3.6 11.0 7.6 5.7
Change % -8.0% -23.4% 116.3% 11.0% 25.7% 1.7%
Net turnover (millions of euro)
1st half of 2011 541.1 195.2 22.2 197.6 69.1 830.0
1st half of 2010 563.7 236.4 13.3 176.8 67.1 820.8
Change -22.5 -41.2 8.9 20.8 2.0 9.2
Change % -4.0% -17.4% 67.0% 11.8% 3.0% 1.1%
Employees(no.)
30-Jun-11 4,878 4,381 47 2,315 714 7,954
31-Dec-10 4,597 4,138 50 2,400 482 7,529
Change 281 243 (3) (85) 232 425
Change % 6.1% 5.9% -6.0% -3.5% 48.1% 5.6%
Investments4
(millions of euro)
1st half of 2011 25.3 24.2 1.1 15.9 6.2 48.5
1st half of 2010 24.9 24.8 0.1 7.8 2.0 34.8
Change 0.4 -0.6 1.0 8.1 4.2 13.7
Change % 1.4% -2.6% 103.8% 210.0% 39.2%
Research and Development5
(millions of euro)
1st half of 2011 25.8 25.4 0.4 8.2 2.7 37.1
1st half of 2010 29.2 28.9 0.3 5.9 1.4 36.8
Change -3.4 -3.5 0.1 2.3 1.3 0.3
Change % -11.5% -12.0% 33.3% 39.0% 92.9% 0.9%
4_Total investments in property, plant and equipment and intangible assets.5_ The item Research and Development includes investments recognised in the statement of financial position and costs recognised in profit or loss.
30Piaggio Group
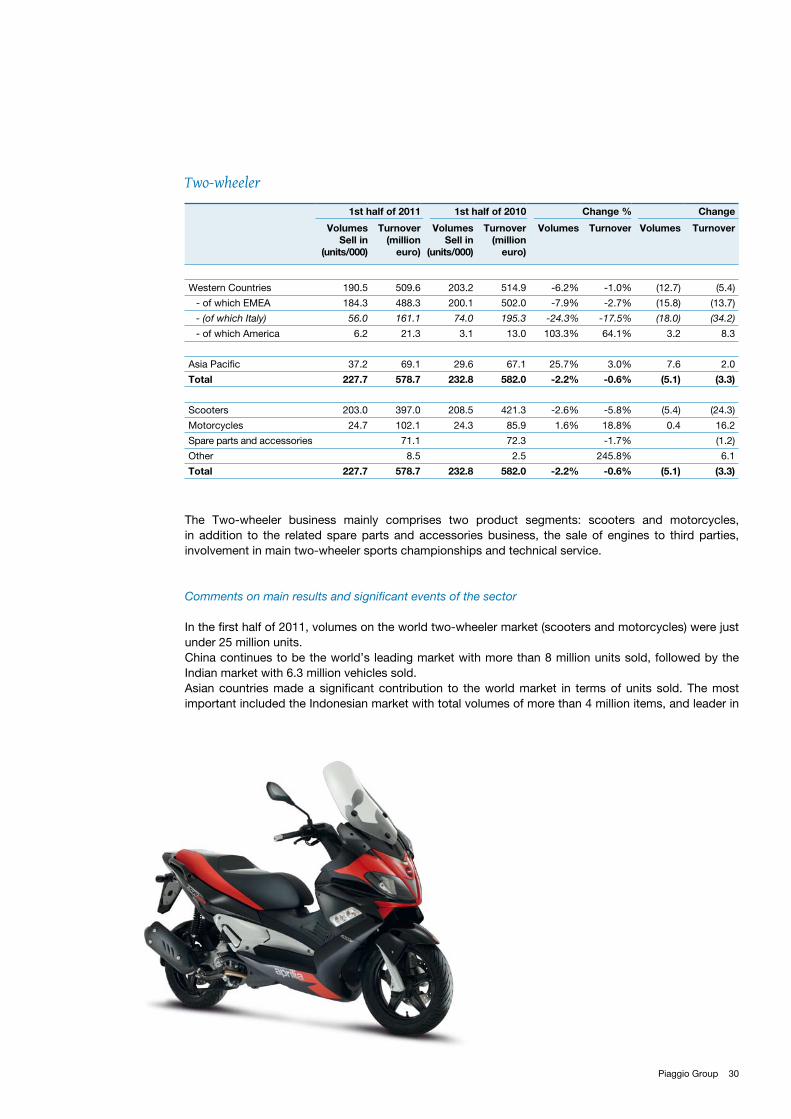
Two-wheeler
The Two-wheeler business mainly comprises two product segments: scooters and motorcycles, in addition to the related spare parts and accessories business, the sale of engines to third parties, involvement in main two-wheeler sports championships and technical service.
Comments on main results and significant events of the sector
In the first half of 2011, volumes on the world two-wheeler market (scooters and motorcycles) were just under 25 million units. China continues to be the world’s leading market with more than 8 million units sold, followed by the Indian market with 6.3 million vehicles sold.Asian countries made a significant contribution to the world market in terms of units sold. The most important included the Indonesian market with total volumes of more than 4 million items, and leader in
1st half of 2011 1st half of 2010 Change % Change
Volumes Sell in
(units/000)
Turnover(million
euro)
Volumes Sell in
(units/000)
Turnover(million
euro)
Volumes Turnover Volumes Turnover
Western Countries 190.5 509.6 203.2 514.9 -6.2% -1.0% (12.7) (5.4)
- of which EMEA 184.3 488.3 200.1 502.0 -7.9% -2.7% (15.8) (13.7)
- (of which Italy) 56.0 161.1 74.0 195.3 -24.3% -17.5% (18.0) (34.2)
- of which America 6.2 21.3 3.1 13.0 103.3% 64.1% 3.2 8.3
Asia Pacific 37.2 69.1 29.6 67.1 25.7% 3.0% 7.6 2.0
Total 227.7 578.7 232.8 582.0 -2.2% -0.6% (5.1) (3.3)
Scooters 203.0 397.0 208.5 421.3 -2.6% -5.8% (5.4) (24.3)
Motorcycles 24.7 102.1 24.3 85.9 1.6% 18.8% 0.4 16.2
Spare parts and accessories 71.1 72.3 -1.7% (1.2)
Other 8.5 2.5 245.8% 6.1
Total 227.7 578.7 232.8 582.0 -2.2% -0.6% (5.1) (3.3)
31 Half-year Financial Report 30 June 2011
South East Asia, followed by Vietnam, recording a steady growth and 1.5 million units sold, and Thailand stands at 900 thousand units. In these areas (China, India, rest of Asia) the market is generally characterised by low-cost, small engine, compact vehicles, designed for primary mobility requirements, while the premium market is slowly yet steadily gaining ground.The European market continued the same negative trend in first half of 2011 which had characterised 2010.Europe accounted for 864 thousand units sold in the first half of 2011, with a 7% decrease in sales on the two-wheeler market compared to 2010 (-6% in the motorcycle segment and -8% in the scooter segment). In the Americas, the decrease in the North American market stopped, which stood at 290,000 vehicles sold, while the South American market continued to grow (+8%) driven by Brazil, the main market of the area.
In this international scenario, the Piaggio Group retained its leadership position on the European market in the first half of 2011, with a market share of approximately 27.3%, thanks also to its continued leadership in the scooter segment, and increased share of the motorcycle segment.With production at its own site in Vinh Phuc, the Group also consolidated its position on the Vietnamese market with successful sales of its Vespa model, joined by the Liberty 125 and 150 cc model in the first half of 2011. The Group held on to its strong position on the North American scooter market, where it has consolidated its leadership with a market share of just under 25%, and where it is committed to increasing its profile in the motorcycle segment, through the Aprilia and Moto Guzzi brands.
Brands and products
The Piaggio Group operates on the two-wheeler market with a portfolio of 7 brands that have enabled it to establish and consolidate a leadership position in Europe: Piaggio, Vespa, Gilera, Aprilia, Scarabeo, Moto Guzzi and Derbi. The brands offer a complementary product range, so that the Group can supply the market with a fully comprehensive range to target the needs of different customer groups.
Engines for Piaggio, Vespa, Gilera, Derbi, Scarabeo and Moto Guzzi brands are designed and manufactured by the company. For Aprilia, the Group manufactures engines for the scooter segment, the V-twin 750cc and V-quad 1000cc.
Piaggio. With a wide range of models covering all main scooter segments, Piaggio is one of Europe’s and the world’s leading brands. The huge success of Piaggio has been built up around the ease of use, design and outstanding functionality of its products. The 2011 Piaggio line has been enhanced with the release of the new MP3 Yourban, lighter and easier to handle on city streets and the new MP3 Touring, with revamped aesthetics and technology with 500ie engine joining the 300ie, 400ie and hybrid engines.
Vespa. Vespa is the best known Piaggio brand around the world. It is synonymous with style and elegance and will be celebrating its 65th birthday in 2011. The Vespa range has always featured models that have all the distinctive heritage of the brand combined with a unique design and steel body.The Vespa PX model was reintroduced in 2011, in line with Euro 3 emission standard, and four new special series were presented to the market: Vespa GTS Touring, Vespa S Sport, GTV and LXV Vie della Moda.
Gilera. The Gilera brand features models in both the scooter and motorcycle segments. The brand came into being in 1909 and was acquired by the Piaggio Group in 1969. Gilera is known for its successes in racing, winning six world championship manufacturer’s titles and eight world championship rider’s titles.
Two-wheelerCommercial Vehicles
Results by operating segment
32Piaggio Group
Gilera is a brand designed for a young, vibrant market and dynamic motorcyclists.
Derbi. The Derbi brand features a range of scooters from 50cc to 300cc and a range of motorcycles from 50cc to 125cc. Its customer target is young, in the 14 - 17 years age group, making it one of the biggest manufacturers in the 50cc segment. The brand has won 21 world titles, gaining a leadership position in Spain and on the 50cc and 125cc motorcycle market.
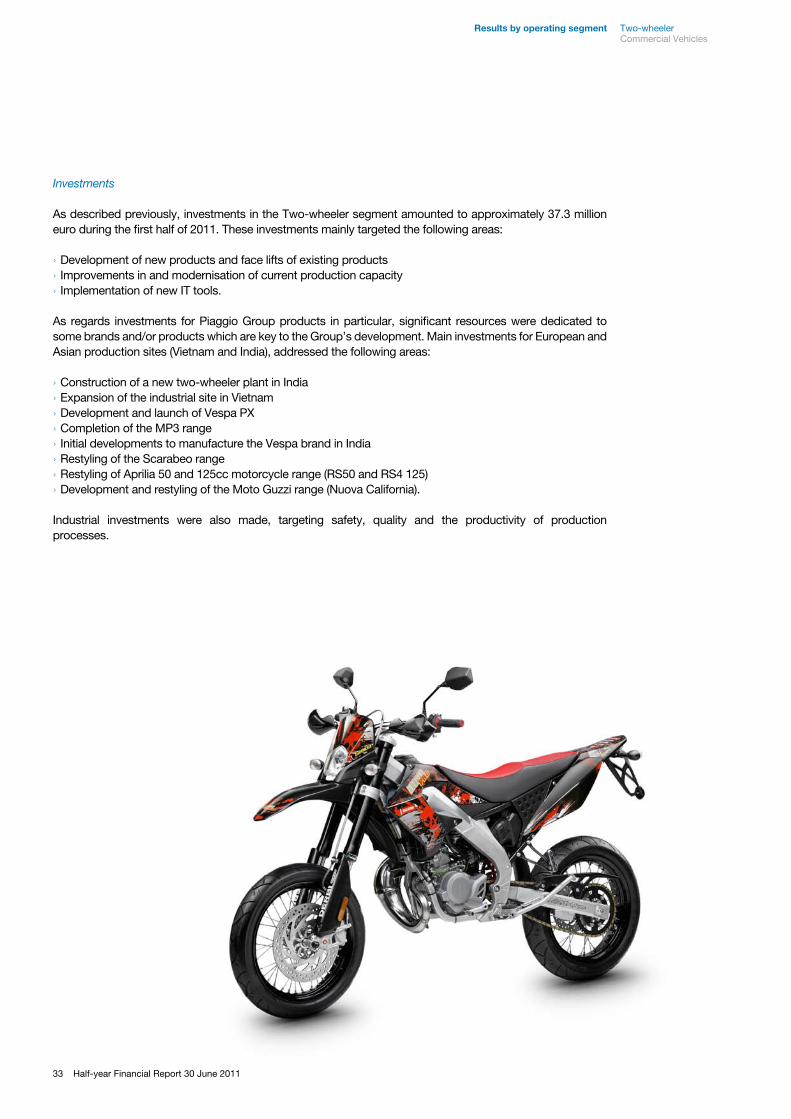
Aprilia. The Aprilia brand includes a range of scooters from 50cc to 300cc and a range of motorcycles from 50cc to 1000cc. The brand is synonymous worldwide with a sporting style thanks to its huge number of wins in leading championships, the outstanding performance of its products, their innovation and cutting-edge design.The first half of 2011 witnessed the application of its racing technology with the introduction of APRC on the RSV4 and the new Tuono V4R and restyling of the range of small sports motorcycles, introducing the RS50 and RS4 125 with four-stroke engine.
Scarabeo. The Scarabeo brand offers a wide range of scooters from 50cc to 500cc, and is the Group’s premium brand, along with the Vespa. The Scarabeo brand was launched by Aprilia in 1993, and is the first brand to have introduced high-wheeled scooters in Europe.Two new features were introduced to the range in 2011 with the restyling of Sarabeo Medio and special series Scarabeo 50 YourZ.
Moto Guzzi. The Moto Guzzi brand came into being in 1921, and is one of the most well-known motorcycle brands in Europe, with a strong brand loyalty among customers. In 1970 Moto Guzzi gained worldwide popularity when it became the motorcycle of choice of the police in Los Angeles, California. Moto Guzzis, which have always been unique with their distinctive 90° V twin cylinder engines, are perfect for touring and combine a stylish traditional design with the latest technologies in the world of motorcycles. In terms of products, the standard Stelvio and NTX were introduced during the first six months of the year.
Comments on main results and significant events of the sector
During the first half of 2011, the Piaggio Group sold a total of 227,700 units in the two-wheeler segment, worldwide, accounting for a net turnover equal to approximately 578.7 million euro, including spare parts and accessories (71.1 million euro, -1.7%). In 2011, the Piaggio Group reconfirmed its leadership position on the European scooter market.
As explained in the previous paragraphs, Piaggio Group’s performance in 2011 was highly penalised by the drop in demand on the Italian and European markets. This downturn concerned both the scooter and motorcycle segments.On the other hand, growth in the Asian area was strong compared to the previous year, with sales and turnover increasing by 25.7% and 3.0% respectively, in part thanks to the start-up of sales of Liberty manufactured in the Vietnamese plant.
The MP3 range and its various models (125cc, 250cc, 300cc, 400cc and 500cc) continued to be a success story in 2011, guaranteeing the Piaggio Group an overall turnover of approximately 52.1 million euro, thanks to the 11,000 units sold. Likewise, the Vespa - the Piaggio Group’s iconic brand in the two-wheeler sector, performed extremely well on the world market, with a turnover equal to 155.8 million euro, with approximately 76,000 units sold.
Turnover from the motorcycle segment was given a strong boost by the Aprilia RSV4 and thanks to the excellent results achieved in the Superbike World Championships, its different versions produced a very satisfactory turnover for the Group.
33 Half-year Financial Report 30 June 2011
Investments
As described previously, investments in the Two-wheeler segment amounted to approximately 37.3 million euro during the first half of 2011. These investments mainly targeted the following areas:
Development of new products and face lifts of existing products ›Improvements in and modernisation of current production capacity ›Implementation of new IT tools. ›
As regards investments for Piaggio Group products in particular, significant resources were dedicated to some brands and/or products which are key to the Group’s development. Main investments for European and Asian production sites (Vietnam and India), addressed the following areas:
Construction of a new two-wheeler plant in India ›Expansion of the industrial site in Vietnam ›Development and launch of Vespa PX ›Completion of the MP3 range ›Initial developments to manufacture the Vespa brand in India ›Restyling of the Scarabeo range ›Restyling of Aprilia 50 and 125cc motorcycle range (RS50 and RS4 125) ›Development and restyling of the Moto Guzzi range (Nuova California). ›
Industrial investments were also made, targeting safety, quality and the productivity of production processes.
Two-wheelerCommercial Vehicles
Results by operating segment
34Piaggio Group
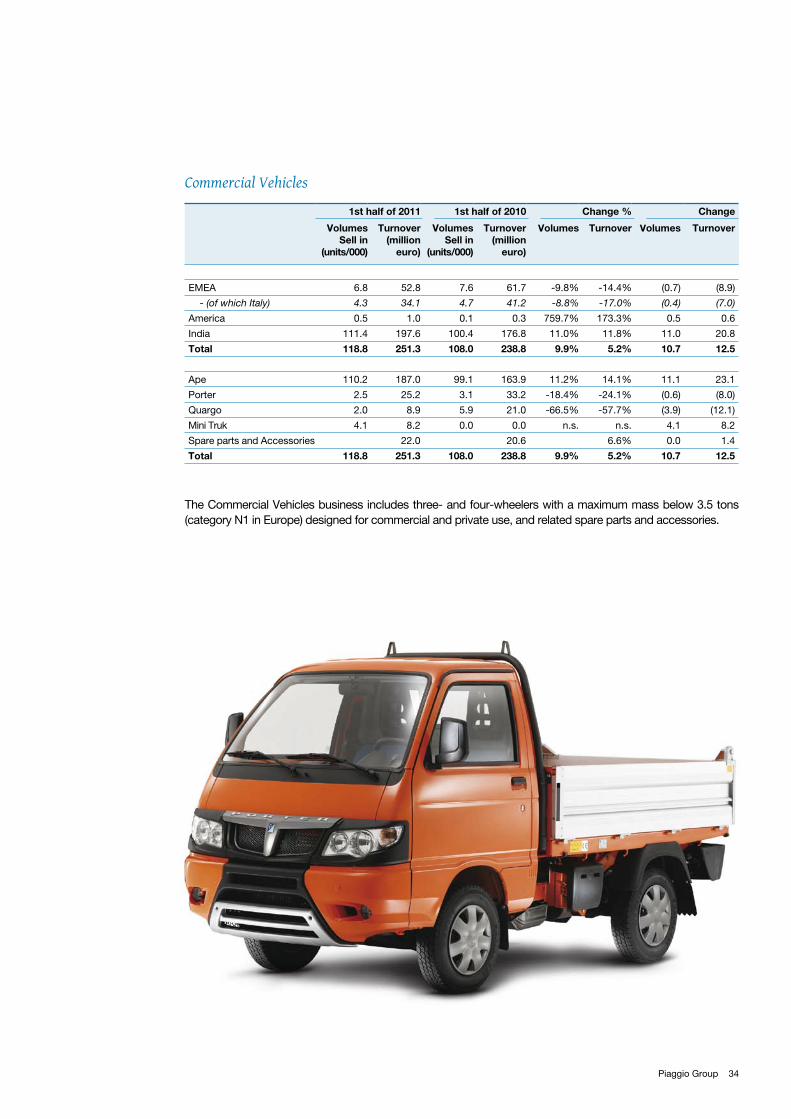
Commercial Vehicles
The Commercial Vehicles business includes three- and four-wheelers with a maximum mass below 3.5 tons (category N1 in Europe) designed for commercial and private use, and related spare parts and accessories.
1st half of 2011 1st half of 2010 Change % Change
Volumes Sell in
(units/000)
Turnover(million
euro)
Volumes Sell in
(units/000)
Turnover(million
euro)
Volumes Turnover Volumes Turnover
EMEA 6.8 52.8 7.6 61.7 -9.8% -14.4% (0.7) (8.9)
- (of which Italy) 4.3 34.1 4.7 41.2 -8.8% -17.0% (0.4) (7.0)
America 0.5 1.0 0.1 0.3 759.7% 173.3% 0.5 0.6
India 111.4 197.6 100.4 176.8 11.0% 11.8% 11.0 20.8
Total 118.8 251.3 108.0 238.8 9.9% 5.2% 10.7 12.5
Ape 110.2 187.0 99.1 163.9 11.2% 14.1% 11.1 23.1
Porter 2.5 25.2 3.1 33.2 -18.4% -24.1% (0.6) (8.0)
Quargo 2.0 8.9 5.9 21.0 -66.5% -57.7% (3.9) (12.1)
Mini Truk 4.1 8.2 0.0 0.0 n.s. n.s. 4.1 8.2
Spare parts and Accessories 22.0 20.6 6.6% 0.0 1.4
Total 118.8 251.3 108.0 238.8 9.9% 5.2% 10.7 12.5
35 Half-year Financial Report 30 June 2011
Comments on main results and significant events of the sector
In the first half of 2011, the Commercial Vehicles business generated a turnover of approximately 251.3 million euro, including approximately 22.0 million euro relative to spare parts and accessories, registering a 5.2% increase over the previous year. The same trend also applies to units sold in the period, which amounted to 118,800 items, and an increase of 9.9%. On the European + American market, the Piaggio Group sold 7,400 units in 2011, generating a net total turnover of 53.8 million euro, including spare parts and accessories for 10.5 million euro. The decrease compared to the same period of the previous year, equal to 200 units and to approximately 8.3 million euro turnover, is mainly due to the highly negative trend of the cab truck segment (0-2.5t) on main markets served which, going against the trend of the total LCV market in Europe, recorded a decrease of 28.9% in the first half of 2011. In relation to this trend, Piaggio, with its Porter and Porter Maxxi, limited the fall in sales to 18%. On the other hand, Ape increased its sales by 3% compared to 2010, reaching 4,189 units.On the Indian three-wheeler market, which grew by around 13% compared to the previous year, Piaggio Vehicles Private Limited continued to maintain its role as a reference player and market leader, with a share of 38.3%. Sales of three wheelers went up from 95,045 units in the first half of 2010 to 106,028 in the first half of 2011, registering an increase of 11.56%, in line with the above mentioned market growth. Detailed analysis of the market shows that Piaggio Vehicles Private Limited consolidated its role as market leader in the cargo segment. Piaggio Vehicles Private Limited reached a 58.4% share (57.4% in 2010), due above all to the Piaggio Apé 501 and numerous possibilities for customisation. Its market share also remained steady in the Passenger segment, standing at 32.7% (35.6% in 2010). On the four-wheeler market, volumes sold by Piaggio Vehicles Private Limited in the first half of 2010 were basically steady, at 5,374 units. Export performance was particularly significant, with the number of units going up from 4,995 in the first half of 2010 to approximately 9,004 units in the first half of 2011.
Innovation and products in the first half of 2011
With the marketing of new Euro 5 engines in the first half of 2011, Piaggio’s Commercial Vehicles Europe range has been completed. Production began on the new Piaggio P120 diesel engine (1200cc 2 cylinder, 8 valve, turbodiesel common rail direct injection engine, with EGR and DPF emission containment systems), and the GreenPower version (bifuel petrol + factory-fitted methane system).In a year in which Italy celebrated the 150th anniversary of its unification, the Ape 50 150° Anniversario Unità d’Italia was launched, a special limited edition series with exclusive red and green interior, a livery sporting the Italian flag and official logo, chrome-plated mirrors and black rims with silver edge.
Investments
Investments for 11.2 million euro were made in the first half of 2011, most earmarked for the Diesel engine project and related installation activities for the Indian and European range.In particular, development activities in India required investments for the installation of the Diesel engine on the Apé Truk and to expand production capacity for three-wheeler vehicles.In Europe, product development investment activities involved the completion of installation of Diesel engines and “Multitech Eu.” Methane and Petrol engines on the Porter.
Two-wheelerCommercial Vehicles
Results by operating segment
36Piaggio Group
37 Half-year Financial Report 30 June 2011
1 July 2011 - Simest sold 12.5% of Piaggio Vietnam to Piaggio & C.. Following this operation, Piaggio Vietnam is held 100% by the Group.
Following the Board of Directors’ meeting of 13 July 2011 – which resolved to authorise the issue of long-term debt securities for a total nominal amount of 75 million USD – on 25 July 2011 Piaggio & C. S.p.A. finalised the private placement of Senior Unsecured Notes on the American market (US Private Placement) entirely subscribed by an institutional investor for an amount of 75 USD, with last maturity at 10 years and coupon at 6.50%. The income will be used to refinance the debt, improving the profile by increasing the average maturity and a further differentiation of lenders.
Events occurring after the end of the period
Events occurring afterthe end of the period
38Piaggio Group
During 2011, the Piaggio Group will continue its strategy of developing its industrial and commercial presence on main Asian markets, consolidating its leadership position on the Indian market in the three- and four-wheeler light commercial vehicles segments and obtaining further market shares in the scooter business in Asia Pacific.The Piaggio Group will begin a new and decisive stage of development for operations in Asia, involving a major expansion of industrial and business operations throughout the area, with the aim of achieving a turnover on Asian markets in the next four years equal to 1 billion euro.
R&D activities will focus on renewing the Group’s product ranges of scooters, motorcycles and commercial vehicles – with particular attention on the development of low consumption, environmentally friendly engines.
Operating outlook
39 Half-year Financial Report 30 June 2011
Net sales, costs, payables and receivables as of 30 June 2011 involving parent, subsidiaries and affiliated companies relate to the sale of goods or services which are a part of normal operations of the Group.Transactions are carried out at normal market values, depending on the characteristics of the goods and services provided.The information on transactions with related parties, including information required by Consob in its communication of 28 July 2006, is given in note E of the Consolidated Financial Statements.The procedure for transactions with related parties, pursuant to article 4 of Consob Regulation no. 17221 of 12 March 2010 as amended, approved by the Council on 30 September 2010, is published on the institutional site of the Issuer www.piaggiogroup.com, under Governance.
Relations with the Parent Company
Piaggio & C. S.p.A. is subject to the management and coordination of IMMSI S.p.A. pursuant to article 2497 et seq. of the Italian Civil Code. During the period, this management and coordination concerned the following activities:
As regards mandatory financial disclosure, and in particular the financial statements and reports on ›operations of the Group, IMMSI has produced a group manual containing the accounting standards adopted and options chosen for implementation, in order to give a consistent and fair view of the Consolidated Financial Statements.
IMMSI has defined procedures and times for preparing the budget and in general the industrial plan of ›Group companies, as well as final management analysis to support management control activities.
IMMSI has also provided services for the development and management of Company assets, with a ›view to optimising resources within the Group, and provided property consultancy services and other administrative services.
Lastly, IMMSI has provided consultancy services and assistance for the Company and subsidiaries ›concerning extraordinary financing operations, organisation, strategy and coordination, as well as services intended to optimise the financial structure of the Group.
Pursuant to article 2.6.2, section 13 of the Regulation of Stock Markets organised and managed by Borsa Italiana S.p.A., the conditions as of article 37 of Consob regulation no. 16191/2007 exist.
Relations with the Parent Company
Transactions with related parties
Transactions with related parties
40Piaggio Group
The Piaggio Group has a strong international presence.At its Italian headquarters in Pontedera (in the province of Pisa), the Group has set up the most important industrial complex in the European two-wheeler sector, in addition to a further two sites in Italy (at Scorzè and Mandello del Lario) and one in Spain (at Martorelles) for the manufacture of vehicles for the European market.
The Group also has its own production sites in India (at Baramati, in the state of Maharashtra) for the manufacture of commercial vehicles, and in Vietnam (at Vinh Phuc), with a site which went into production in June 2009 and manufactures two-wheeler vehicles.
The main operations take place during the first half of 2011 concerning these sites, aimed at developing and streamlining production capacity, are outlined below.
Pontedera Sites
Two-Wheeler and Engine production sites
As part of mechanical processing, industrial-scale production of the following new components for relative engines was completed: Integral Drive Shaft (Motoguzzi 1400 California engine), Crankcase, Drive Shaft, Hub Assembly, Cam Axles (350 engine), Drive Shaft, Cam Axles (850cc engine for John Deere). Industrial-scale production of crankcase components and gears for the LEM engine, and the hub assembly for the Liberty Electric engine are underway.Units for processing 350cc engine crankcases were started up, and the ICOM washing plant (aluminium crankcase) was reconditioned.
As concerns engine assembly, installations for new assembly lines for the 350cc engine and 850cc engine for the customer John were completed. The industrial-scale production of equipment for assembly of the Liberty Electric engine is underway. A new production line is being developed for assembly of the LEm engine, scheduled for start up in the first half of 2012. Wireless coverage of the Engines Site was completed.
As regards vehicle welding, the continuous wire welding unit for ZIP and Stalker vehicles and the MP3 steering tube was renovated, while in terms of vehicle painting, actions were defined in technical terms for the inclusion of the new SIP (Product Routing System). The SIP should be installed in the second half of 2011 and is scheduled for start up in the first half of 2012.
As concerns two-wheeler vehicle assembly, processes for assembly of the MP3 YOURBAN, and Vespa PX were given the go ahead. A new pallet automatic transfer line has been installed to assemble MP3 suspension.
Commercial Vehicles Plants
As regards painting, activities to install and optimise programmes on 2 new ABB robots fitted with electrostatic torques on the VRN Ape line, were completed.
Piaggio and its production sites
41 Half-year Financial Report 30 June 2011
Scorzè Plant
Activities for the industrial-scale production of the RS4 50/125 and Tuono 1000 v4 were completed.
The project to requalify the scooter production building was completed, with the disposal and complete replacement of old asbestos cement slabs.
Mandello del Lario Plant
The construction of the new porter’s lodge is being completed and is expected to open in the second half of 2011 and demolition of former mechanical processing buildings and the warehouse area was completed.A new motorcycles packaging line was installed and has been operating since April 2011.The certification and conformity of equipment for engine and vehicle assembly was also completed.
Baramati Plant
Work continued in the first half of 2011 to build the new two-wheeler plant in India and for the installations needed to manufacture the new HE engine.
Hanoi Plant
The second vehicle assembly line went into operation. Mass production of the Vespa Lx/S, Liberty 125/150cc, and ZIP began.
The industrial site is being expanded, with the construction of new industrial buildings for mechanical processing and for engine and spare parts assembly. The work started in the first half of 2011 and is expected to be completed in the first six months of 2012.
World Class Manufacturing Project
The Piaggio Production System (PPS) is wholeheartedly committed to improving the production system of all Italian plants, based on three factors: work methodologies, tools to analyse processes and human resources. Its actions so far have concerned improvement planning.30 comparative audits have been conducted for methodologies and knowledge already in use, creating 26 Good Practices to be extended from the best site to all other sites, as well as 31 improvement projects.As concerns methodologies and knowledge to develop, the first part of training for Plant Managers was performed.
Piaggio and its production sites Pontedera PlantScorzè PlantMandello del Lario PlantBaramati PlanHanoi PlanWorld Class Manufacturing Project
42Piaggio Group
Anticipating customer requirements, creating products that are innovative in terms of their technology, style and functionality, pursuing research for a better quality of life are all fields of excellence in which the Piaggio Group excels, as well as a means for measuring its leadership position on the market.The Piaggio Group develops these areas through research and development in 5 centres in Italy, India and Vietnam.
In particular, its main goal is to satisfy the latest needs for mobility while reducing the environmental impact and consumption of its vehicles and guaranteeing an excellent performance, producing a new generation of vehicles that are:
environmentally-friendly › , and namely that can reduce emissions of pollutant gases and CO2 in urban areas, based on developments in traditional technologies and a greater use of renewable and sustainable energy sources; reliable and safe, › to get about town easily, helping to reduce traffic congestion and guaranteeing high standards of active, passive and preventive safety; recyclable › , to minimise environmental impact, even at the end of their useful life cycle; cost-effective › , to reduce running costs per kilometre.
Piaggio’s research and development is strongly focussed on two main themes: developing engines that are even more environmentally friendly and with an even better performance, and vehicles with an improved functionality and safety.
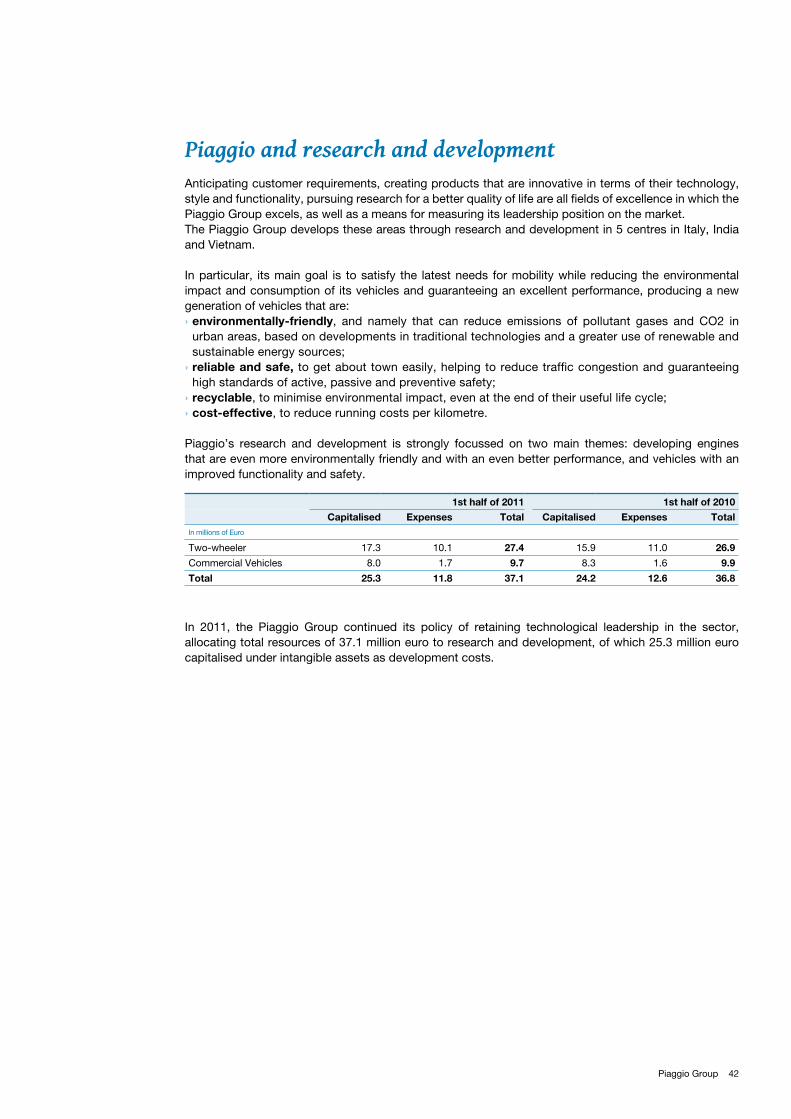
1st half of 2011 1st half of 2010
Capitalised Expenses Total Capitalised Expenses TotalIn millions of Euro
Two-wheeler 17.3 10.1 27.4 15.9 11.0 26.9
Commercial Vehicles 8.0 1.7 9.7 8.3 1.6 9.9
Total 25.3 11.8 37.1 24.2 12.6 36.8
Piaggio and research and development
In 2011, the Piaggio Group continued its policy of retaining technological leadership in the sector, allocating total resources of 37.1 million euro to research and development, of which 25.3 million euro capitalised under intangible assets as development costs.
43 Half-year Financial Report 30 June 2011
44Piaggio Group
Staff
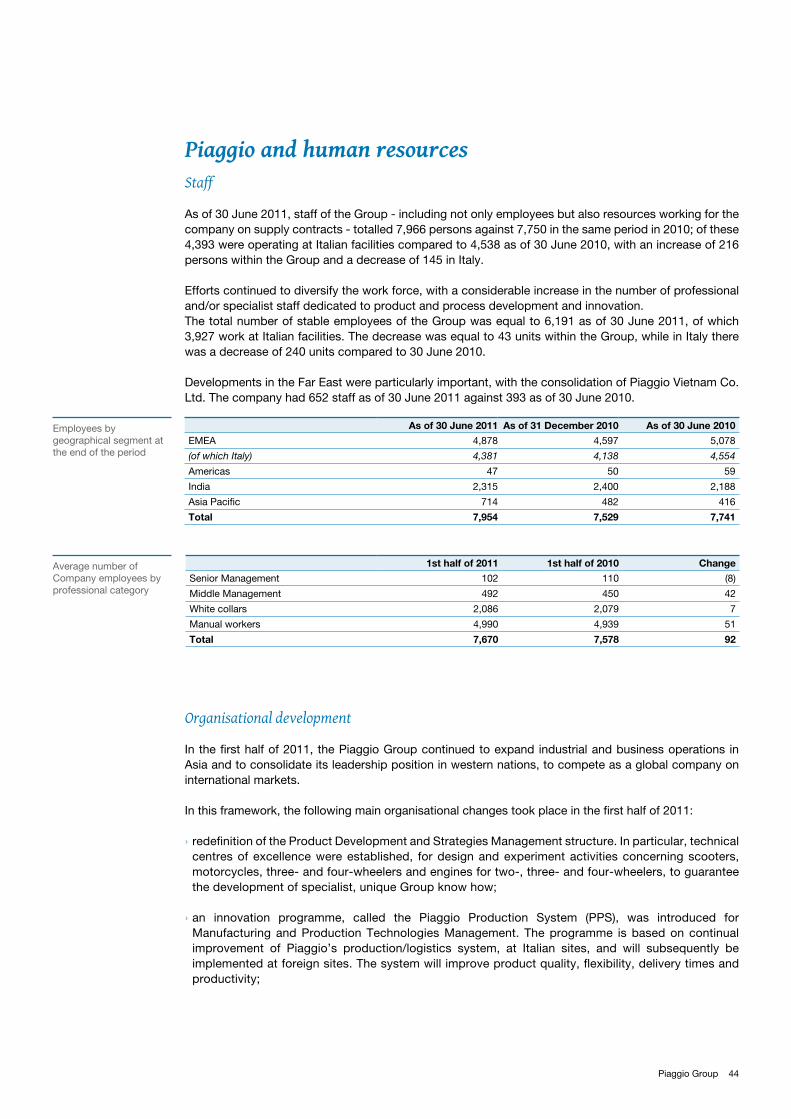
As of 30 June 2011, staff of the Group - including not only employees but also resources working for the company on supply contracts - totalled 7,966 persons against 7,750 in the same period in 2010; of these 4,393 were operating at Italian facilities compared to 4,538 as of 30 June 2010, with an increase of 216 persons within the Group and a decrease of 145 in Italy.
Efforts continued to diversify the work force, with a considerable increase in the number of professional and/or specialist staff dedicated to product and process development and innovation.The total number of stable employees of the Group was equal to 6,191 as of 30 June 2011, of which 3,927 work at Italian facilities. The decrease was equal to 43 units within the Group, while in Italy there was a decrease of 240 units compared to 30 June 2010.
Developments in the Far East were particularly important, with the consolidation of Piaggio Vietnam Co. Ltd. The company had 652 staff as of 30 June 2011 against 393 as of 30 June 2010.
Organisational development
In the first half of 2011, the Piaggio Group continued to expand industrial and business operations in Asia and to consolidate its leadership position in western nations, to compete as a global company on international markets.
In this framework, the following main organisational changes took place in the first half of 2011:
redefinition of the Product Development and Strategies Management structure. In particular, technical ›centres of excellence were established, for design and experiment activities concerning scooters, motorcycles, three- and four-wheelers and engines for two-, three- and four-wheelers, to guarantee the development of specialist, unique Group know how;
an innovation programme, called the Piaggio Production System (PPS), was introduced for ›Manufacturing and Production Technologies Management. The programme is based on continual improvement of Piaggio’s production/logistics system, at Italian sites, and will subsequently be implemented at foreign sites. The system will improve product quality, flexibility, delivery times and productivity;
Employees by geographical segment at the end of the period
Average number of Company employees by professional category
As of 30 June 2011 As of 31 December 2010 As of 30 June 2010
EMEA 4,878 4,597 5,078
(of which Italy) 4,381 4,138 4,554
Americas 47 50 59
India 2,315 2,400 2,188
Asia Pacific 714 482 416
Total 7,954 7,529 7,741
1st half of 2011 1st half of 2010 Change
Senior Management 102 110 (8)
Middle Management 492 450 42
White collars 2,086 2,079 7
Manual workers 4,990 4,939 51
Total 7,670 7,578 92
Piaggio and human resources
45 Half-year Financial Report 30 June 2011
Piaggio and human resources
the structures of the Spare Parts, Accessories and After Sales Technical Service Business Unit ›were thoroughly revised, for continual improvement of quality levels of after sales services, with headquarters set up for spare parts and accessories service, after sales network development, marketing and logistics;
the “Vietnam Engine and Factory” project was launched, with the aim of developing production of a ›new 125 3V engine at the new Vietnam site;
a Marketing Support function for the Two Wheeler Marketing Structure of the Indian company Piaggio ›Vehicles Private Limited reporting to the Chairman and CEO of Piaggio & C was established, for a greater integration of operations and development of market segments for two-wheeler products in India;
the Group entered the Indonesian market in June, with a new subsidiary PT. Piaggio Indonesia. Thanks ›to an efficient business organisation, the subsidiary will be able to develop the marketing of Group vehicles and assess the Indonesian market in depth, in terms of products, customer expectations and prices.
Developing Human Capital
The development of the core competencies required by a changing business and market is a priority for the Piaggio Group. This is why the development of people and careers are rooted in building, maintaining and developing these competencies.During 2011, improvement actions were launched, in particular for competencies evaluation and the Piaggio Way programme.
Reviews
Competency models form the basis for criteria used by the Group in personnel appraisal processes. During the first half of 2011, the new Piaggio evaluation process was launched at a Group level. The Evaluation Management System concerns all Group office staff, middle management and executives.
Piaggio Way
The new Piaggio Way programme continued during 2011 in Europe, the United States and Asia. The programme, which will last for a maximum of four years, will select staff classified as Young Talent and Managerial Talent, and give them the chance to take part in fast-track development programmes (job rotation, strategic and international projects, events with the involvement of top management, coaching, bespoke training).
Training
Training addresses all roles, levels of responsibility, professional groups and individuals who are motivated to improving their own professional value in keeping with the Company’s development and its evolving corporate culture. In the first few months of 2011, training activities were consolidated, with 32,032 hours of training provided for the Group’s entire workforce, of which 22,043 hours in Italy,
StaffOrganisational developmentDeveloping Human CapitalReviewsPiaggio WayTrainingHealth and SafetyIndustrial relations
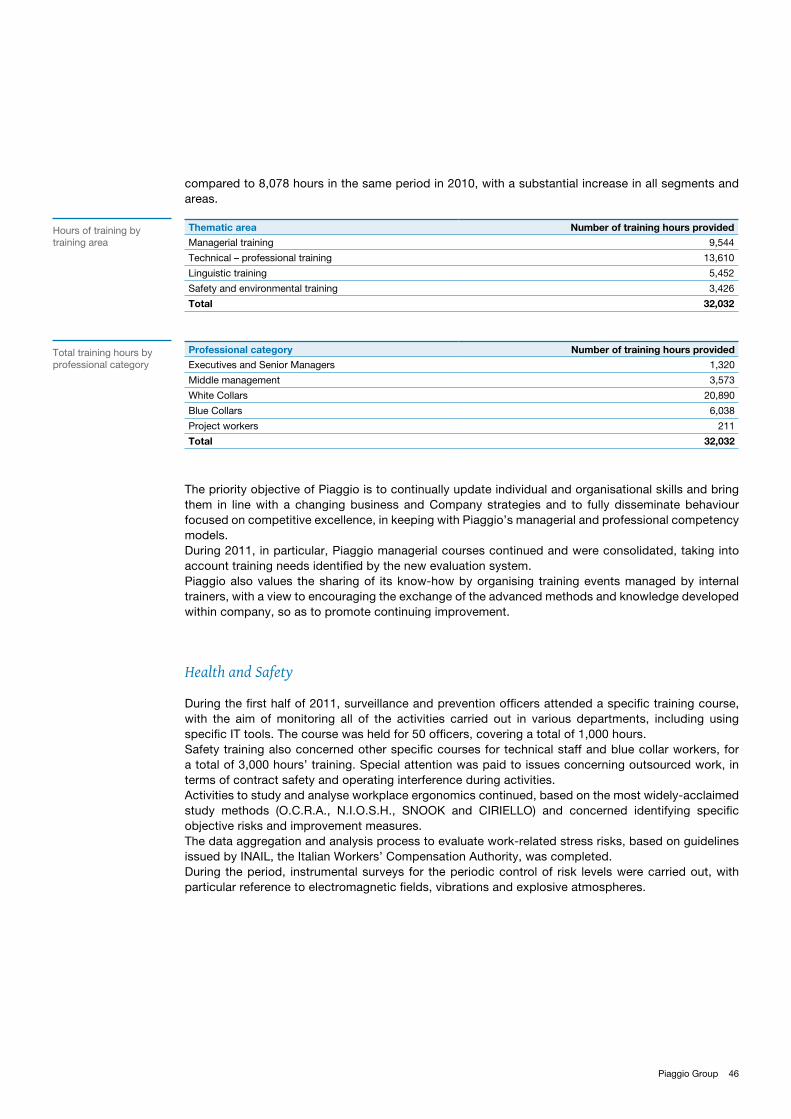
46Piaggio Group
compared to 8,078 hours in the same period in 2010, with a substantial increase in all segments and areas.
The priority objective of Piaggio is to continually update individual and organisational skills and bring them in line with a changing business and Company strategies and to fully disseminate behaviour focused on competitive excellence, in keeping with Piaggio’s managerial and professional competency models.During 2011, in particular, Piaggio managerial courses continued and were consolidated, taking into account training needs identified by the new evaluation system.Piaggio also values the sharing of its know-how by organising training events managed by internal trainers, with a view to encouraging the exchange of the advanced methods and knowledge developed within company, so as to promote continuing improvement.
Health and Safety
During the first half of 2011, surveillance and prevention officers attended a specific training course, with the aim of monitoring all of the activities carried out in various departments, including using specific IT tools. The course was held for 50 officers, covering a total of 1,000 hours.Safety training also concerned other specific courses for technical staff and blue collar workers, for a total of 3,000 hours’ training. Special attention was paid to issues concerning outsourced work, in terms of contract safety and operating interference during activities.Activities to study and analyse workplace ergonomics continued, based on the most widely-acclaimed study methods (O.C.R.A., N.I.O.S.H., SNOOK and CIRIELLO) and concerned identifying specific objective risks and improvement measures.The data aggregation and analysis process to evaluate work-related stress risks, based on guidelines issued by INAIL, the Italian Workers’ Compensation Authority, was completed.During the period, instrumental surveys for the periodic control of risk levels were carried out, with particular reference to electromagnetic fields, vibrations and explosive atmospheres.
Thematic area Number of training hours provided
Managerial training 9,544
Technical – professional training 13,610
Linguistic training 5,452
Safety and environmental training 3,426
Total 32,032
Hours of training by training area
Total training hours by professional category
Professional category Number of training hours provided
Executives and Senior Managers 1,320
Middle management 3,573
White Collars 20,890
Blue Collars 6,038
Project workers 211
Total 32,032
47 Half-year Financial Report 30 June 2011
Industrial relations
During the first half of 2011, industrial relations at Company sites dealt with and defined a number of situations arising from the continuing economic and financial crisis which caused a downturn on European motor vehicle markets and the need to update 2011 production plants to industry trends.
As regards the Pontedera site, the company and trade union organisations signed a framework agreement in March confirming the 2011 investment plan and its focus on product development and manufacturing, the construction of the new Global Spare Parts Centre, and strategic aspect of the engines and vehicles (scooters and commercial vehicles) research centre.A reduction in personnel and direct and indirect workers totalling 400 persons was agreed on, based on two mobility procedures: one procedure for laying off 100 office workers and middle managers, and the other for laying off 300 workers. The flexibility required, recognised by the 2009 trade union agreement, was confirmed, based on which temporary workers are employed in relation to production schedules. Use of the Wage Guarantee Fund was limited to February, for a total of 27,412 hours. Various parts of the 2009 supplementary trade union agreement were dealt with, including the Results Bonus (final figures for 2010 and 2011 objectives).
A trade union agreement was entered into, in January, for the Noale and Scorzè sites. Based on the agreement, an important plan to guarantee the economic and financial sustainability of the Company’s investment plan will be shared, with major cost reductions and actual recovery of the technical structure’s efficiency and productivity. The need to streamline staff activities and consequently downsize employees was identified for the Noale site, with estimated cuts concerning 200 people, also considering the current market context. Procedures to adopt to achieve these objectives were jointly agreed on:
mobility, with 80 people laid off at the Noale site and 15 at Aprilia Racing; ›solidarity contracts to rebalance working hours with activities; ›transfers to other group sites with greater professional opportunities, also with a view to maintaining and ›developing Group know how; identification of new local employment opportunities, also with the support of dedicated, qualified external ›structures assisted by specific training activities.
At the Scorzè site, which has a production mission that has been confirmed, the use of solidarity contracts will continue in 2011 for a further 12 months, with a reduction in working hours for all site employees, effectively bringing work in line with volumes scheduled on a monthly basis, to meet market requests.The Ministry of Employment and P.S. are completing the authorisation procedure for solidarity contracts concerning these sites.
As regards the Moto Guzzi production site, staff reorganisation was completed in 2010, and a trade union agreement entered into for the use of solidarity contracts (approved with decree no. 59717 of 31 May 2011). In the first half of 2011, the use of solidarity contracts was not necessary, as work volumes were sufficient to fully absorb available human resources.
In the first half of 2011, the trend of hours lost through industrial action increased in Italy, following a micro-conflict caused by a minority active in one trade union organisation.
In May 2011, the Spanish company Nacional Motor and the Piaggio Branch at Martorelles (Barcelona), presented an Expediente de Regulación de Empleo, with a plan to restructure various activities at these sites. Negotiations are underway at various trade union levels and with government representatives as provided for by Spanish laws.
Piaggio and human resources StaffOrganisational developmentDeveloping Human CapitalReviewsPiaggio WayTrainingHealth and SafetyIndustrial relations
48Piaggio Group
Profile
The Company is organised in accordance with the traditional administration and control model mentioned in articles 2380 bis et seq of the Italian Civil Code, with the Shareholders’ Meeting, the Board of Directors and the Board of Statutory Auditors.
Roberto Colaninno is Chairman and Chief Executive Officer of the Company, Matteo Colaninno is Deputy Chairman and Michele Pallottini is General Manager Finance.
The Company has adopted the Corporate Governance Code of Borsa Italiana S.p.A. and observes all principles of corporate governance contained in the code. With reference to Article 7 of the Code, as amended on 24 March 2010, the Company is currently working to comply with newly introduced recommendations concerning the remuneration of directors and executives with strategic responsibilities.
The Company is subject to the management and coordination of IMMSI S.p.A. pursuant to article 2497 et seq. of the Italian Civil Code.
Board of Directors
The Board of Directors of the Company in office at the date of this Report comprised 11 members appointed by the Ordinary General Meeting of Shareholders of 16 April 2009, based on the one candidate list submitted by the majority shareholder IMMSI S.p.A.. The Board of Directors will remain in office until the date of the Shareholders’ Meeting called for approval of the financial statements for the financial year ended 31 December 2011.
The number and authority of non-executive and independent directors are such that they ensure that their opinion has a significant weight in the Issuer’s Board decisions. The non-executive and independent directors bring their specific competencies to Board discussions, contributing to the making of decisions that conform to corporate interests.
Committees
The Board of Directors has appointed an Appointment Proposals Committee, a Remuneration Committee, an Internal Control Committee and a Related Party Transactions Committee.
Internal control system
The Board defines the guidelines of the internal control system, considered as a combination of processes aimed at monitoring the efficiency of corporate operations, the reliability of financial information, compliance with laws and regulations and the safekeeping of corporate assets.In this context, the Board of Directors is assisted by a Director appointed to oversee operation of the internal control system and an Internal Control Committee.The Board of Directors, in response to a proposal by the Appointed Director and having obtained the opinion of the Internal Control Committee, appointed the Internal Control Supervisor, ensuring that he/she receives adequate means to carry out his/her functions, including - as regards the operating structure and internal organisational procedures - access to information needed for his/her position.During 2010, the Company also updated its organisation, management and control model pursuant to Legislative Decree 231/2001.
Corporate Governance
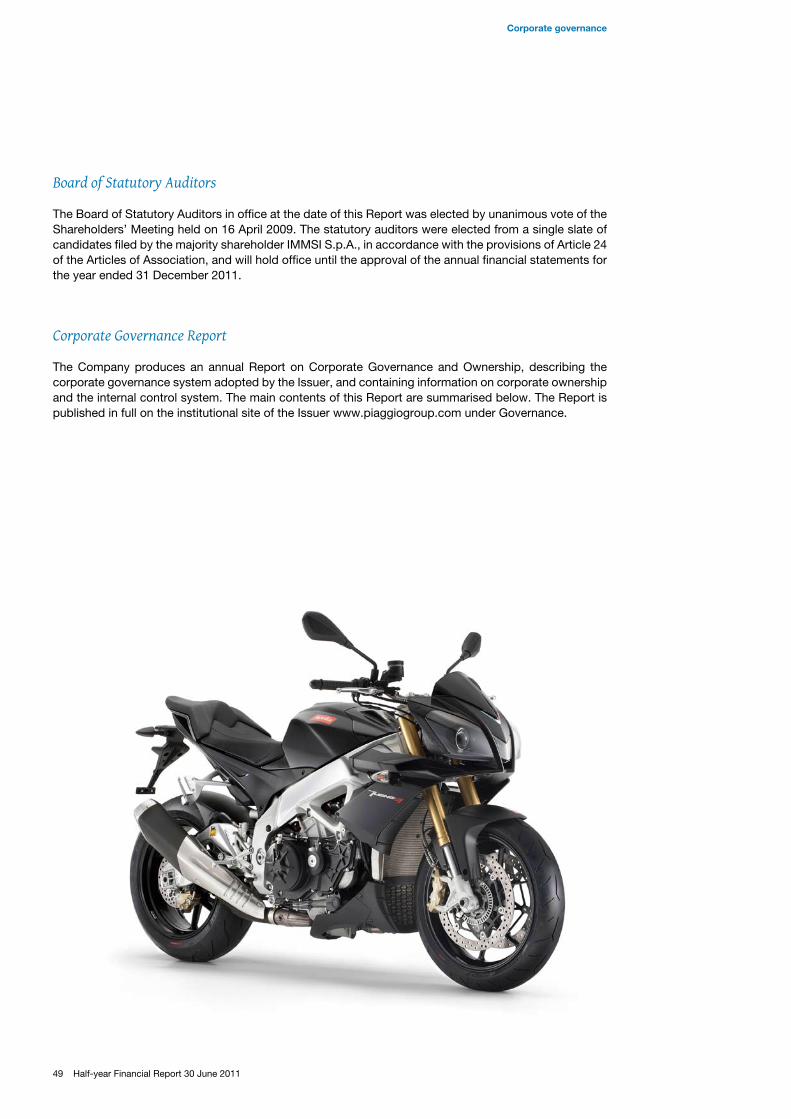
49 Half-year Financial Report 30 June 2011
Board of Statutory Auditors
The Board of Statutory Auditors in office at the date of this Report was elected by unanimous vote of the Shareholders’ Meeting held on 16 April 2009. The statutory auditors were elected from a single slate of candidates filed by the majority shareholder IMMSI S.p.A., in accordance with the provisions of Article 24 of the Articles of Association, and will hold office until the approval of the annual financial statements for the year ended 31 December 2011.
Corporate Governance Report
The Company produces an annual Report on Corporate Governance and Ownership, describing the corporate governance system adopted by the Issuer, and containing information on corporate ownership and the internal control system. The main contents of this Report are summarised below. The Report is published in full on the institutional site of the Issuer www.piaggiogroup.com under Governance.
Corporate governance
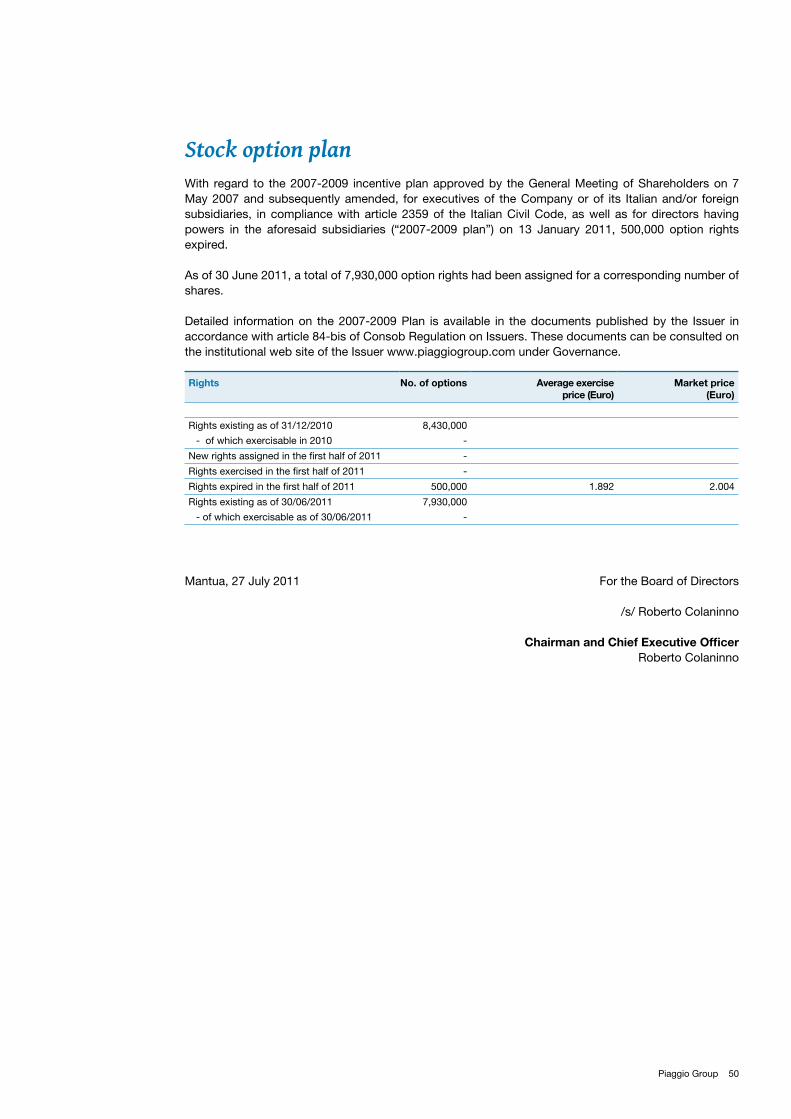
50Piaggio Group
With regard to the 2007-2009 incentive plan approved by the General Meeting of Shareholders on 7 May 2007 and subsequently amended, for executives of the Company or of its Italian and/or foreign subsidiaries, in compliance with article 2359 of the Italian Civil Code, as well as for directors having powers in the aforesaid subsidiaries (“2007-2009 plan”) on 13 January 2011, 500,000 option rights expired.
As of 30 June 2011, a total of 7,930,000 option rights had been assigned for a corresponding number of shares.
Detailed information on the 2007-2009 Plan is available in the documents published by the Issuer in accordance with article 84-bis of Consob Regulation on Issuers. These documents can be consulted on the institutional web site of the Issuer www.piaggiogroup.com under Governance.
Rights No. of options Average exercise price (Euro)
Market price (Euro)
Rights existing as of 31/12/2010 8,430,000
- of which exercisable in 2010 -
New rights assigned in the first half of 2011 -
Rights exercised in the first half of 2011 -
Rights expired in the first half of 2011 500,000 1.892 2.004
Rights existing as of 30/06/2011 7,930,000
- of which exercisable as of 30/06/2011 -
Stock option plan
Mantua, 27 July 2011 For the Board of Directors
/s/ Roberto Colaninno
Chairman and Chief Executive OfficerRoberto Colaninno
51 Half-year Financial Report 30 June 2011

52Piaggio Group
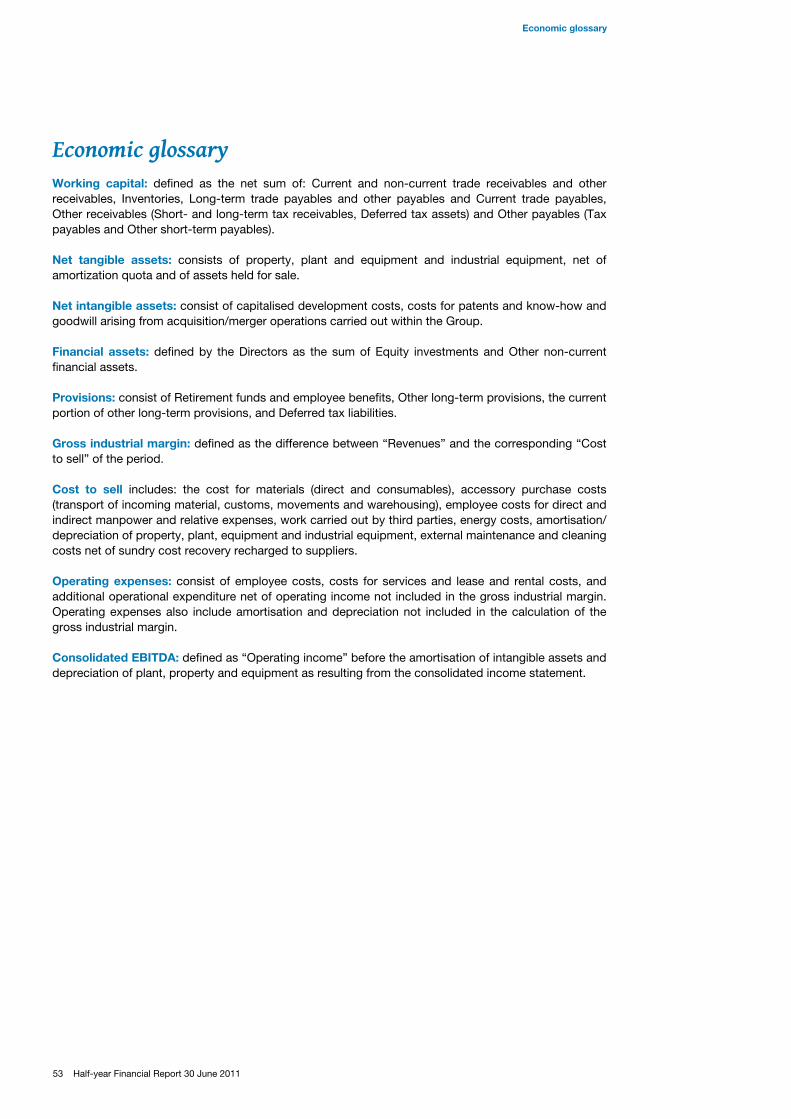
53 Half-year Financial Report 30 June 2011
Working capital: defined as the net sum of: Current and non-current trade receivables and other receivables, Inventories, Long-term trade payables and other payables and Current trade payables, Other receivables (Short- and long-term tax receivables, Deferred tax assets) and Other payables (Tax payables and Other short-term payables).
Net tangible assets: consists of property, plant and equipment and industrial equipment, net of amortization quota and of assets held for sale.
Net intangible assets: consist of capitalised development costs, costs for patents and know-how and goodwill arising from acquisition/merger operations carried out within the Group.
Financial assets: defined by the Directors as the sum of Equity investments and Other non-current financial assets.
Provisions: consist of Retirement funds and employee benefits, Other long-term provisions, the current portion of other long-term provisions, and Deferred tax liabilities.
Gross industrial margin: defined as the difference between “Revenues” and the corresponding “Cost to sell” of the period.
Cost to sell includes: the cost for materials (direct and consumables), accessory purchase costs (transport of incoming material, customs, movements and warehousing), employee costs for direct and indirect manpower and relative expenses, work carried out by third parties, energy costs, amortisation/depreciation of property, plant, equipment and industrial equipment, external maintenance and cleaning costs net of sundry cost recovery recharged to suppliers.
Operating expenses: consist of employee costs, costs for services and lease and rental costs, and additional operational expenditure net of operating income not included in the gross industrial margin. Operating expenses also include amortisation and depreciation not included in the calculation of the gross industrial margin.
Consolidated EBITDA: defined as “Operating income” before the amortisation of intangible assets and depreciation of plant, property and equipment as resulting from the consolidated income statement.
Economic glossary
Economic glossary
54Piaggio Group
55 Half-year Financial Report 30 June 2011
abbReviated HalF-YeaR Financial statements, COnSOLIDATeD FInAnCIAL STATeMenTS AnD nOTeS AS OF 30 June 2011
Consolidated Income Statement 56Consolidated Statement of Comprehensive Income 57Consolidated Statement of Financial Position 58Consolidated Cash Flow Statement 59Consolidated Net Debt (Net Financial Debt) 60Changes in Consolidated Shareholders’ Equity 62Notes to the Abbreviated Half-Year Financial Statements as of 30 June 2011 64Certification of the Abbreviated Half-Year Financial Statements pursuant to article 154 bis of Italian Legislative Decree 58/98 107Report of the Independent Auditors on the limited auditing of the Abbreviated Half-Year Financial Statements 108
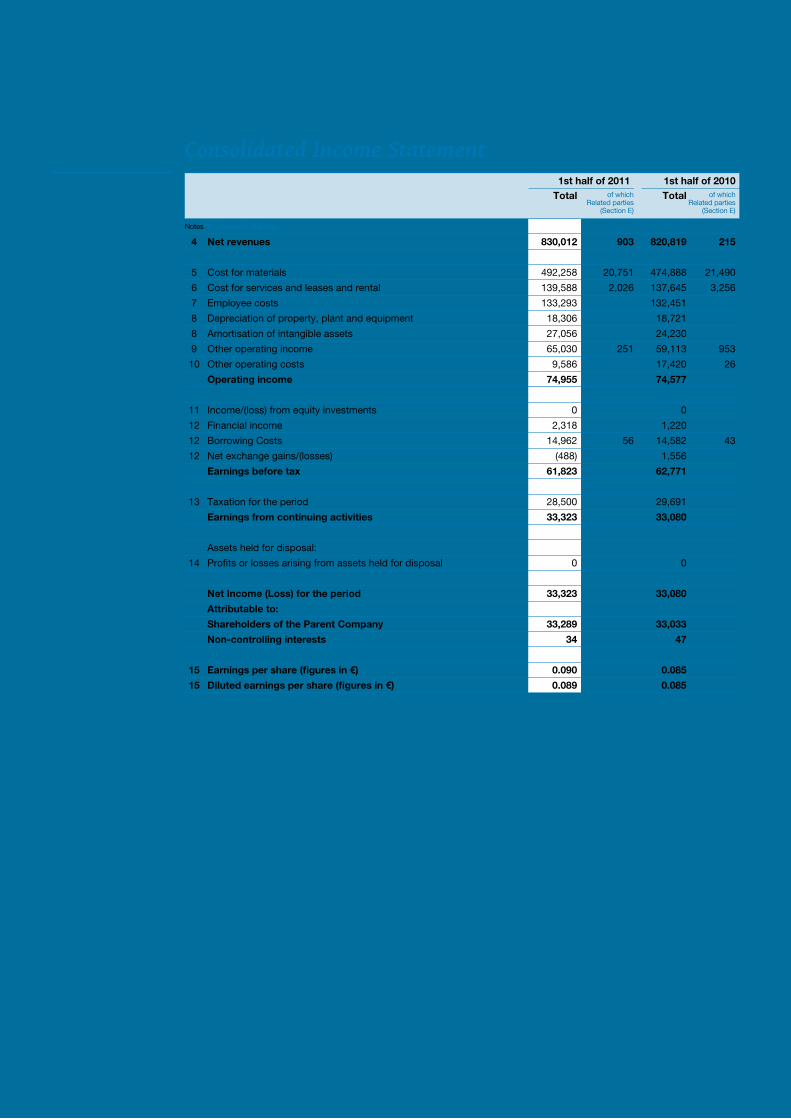
56Piaggio Group
Consolidated Income Statement1st half of 2011 1st half of 2010
Total of which Related parties
(Section E)
Total of which Related parties
(Section E)
Notes In thousands of Euros
4 Net revenues 830,012 903 820,819 215
5 Cost for materials 492,258 20,751 474,888 21,490
6 Cost for services and leases and rental 139,588 2,026 137,645 3,256
7 Employee costs 133,293 132,451
8 Depreciation of property, plant and equipment 18,306 18,721
8 Amortisation of intangible assets 27,056 24,230
9 Other operating income 65,030 251 59,113 953
10 Other operating costs 9,586 17,420 26
Operating income 74,955 74,577
11 Income/(loss) from equity investments 0 0
12 Financial income 2,318 1,220
12 Borrowing Costs 14,962 56 14,582 43
12 Net exchange gains/(losses) (488) 1,556
Earnings before tax 61,823 62,771
13 Taxation for the period 28,500 29,691
Earnings from continuing activities 33,323 33,080
Assets held for disposal:
14 Profits or losses arising from assets held for disposal 0 0
Net Income (Loss) for the period 33,323 33,080
Attributable to:
Shareholders of the Parent Company 33,289 33,033
Non-controlling interests 34 47
15 Earnings per share (figures in €) 0.090 0.085
15 Diluted earnings per share (figures in €) 0.089 0.085
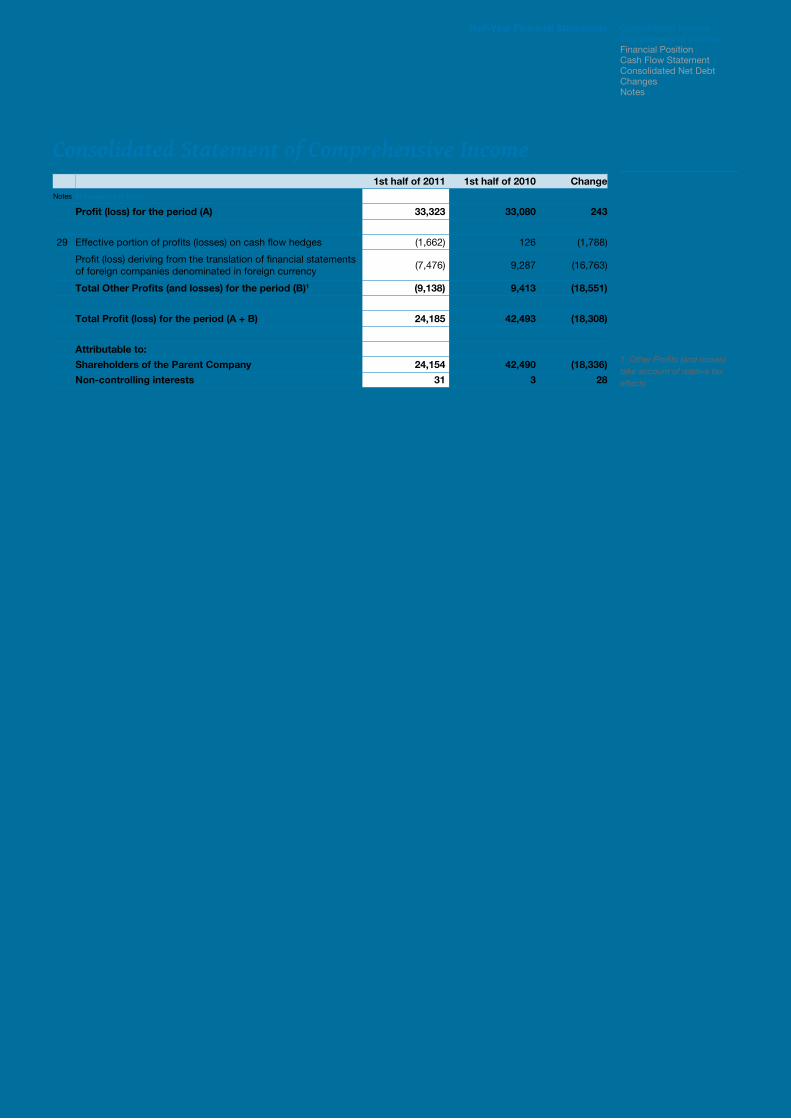
57 Half-year Financial Report 30 June 2011
Consolidated Income Comprehensive IncomeFinancial PositionCash Flow StatementConsolidated Net Debt ChangesNotes
Half-Year Financial Statements
Consolidated Statement of Comprehensive Income1st half of 2011 1st half of 2010 Change
In thousands of Euros
Profit (loss) for the period (A) 33,323 33,080 243
Effective portion of profits (losses) on cash flow hedges (1,662) 126 (1,788)
Profit (loss) deriving from the translation of financial statements of foreign companies denominated in foreign currency
(7,476) 9,287 (16,763)
Total Other Profits (and losses) for the period (B)1 (9,138) 9,413 (18,551)
Total Profit (loss) for the period (A + B) 24,185 42,493 (18,308)
Attributable to:
Shareholders of the Parent Company 24,154 42,490 (18,336)
Non-controlling interests 31 3 28
29
1_Other Profits (and losses) take account of relative tax effects
Notes
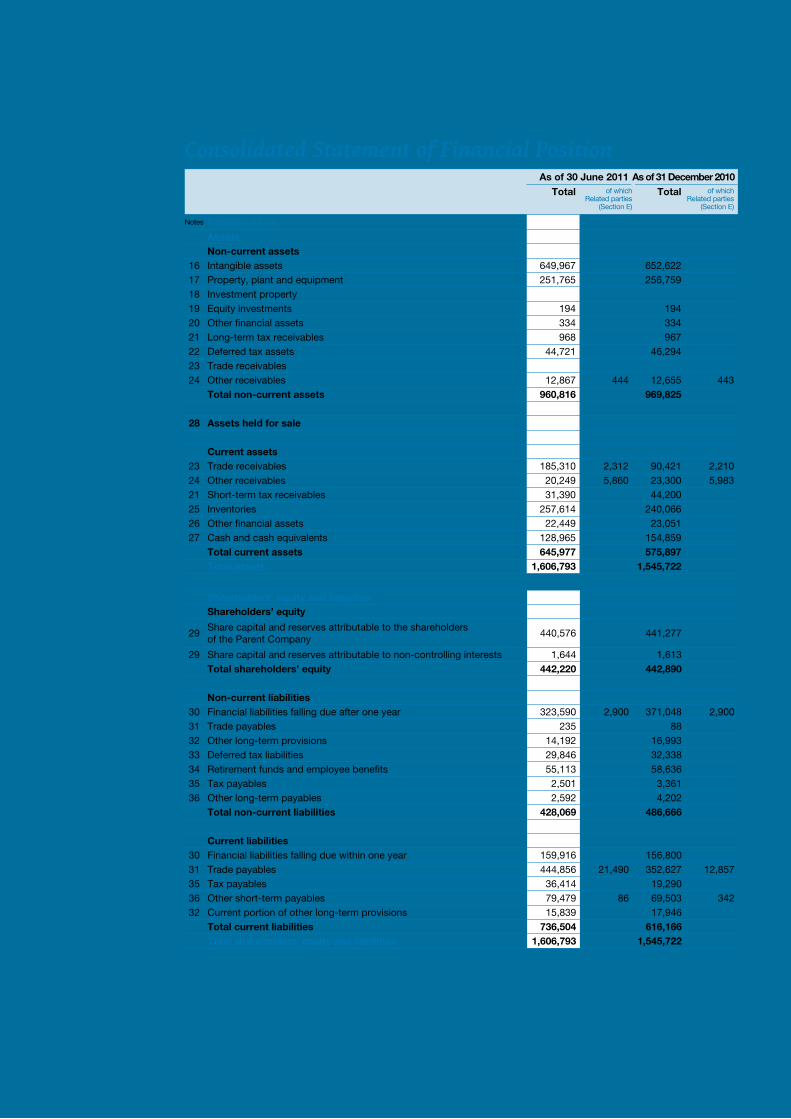
58Piaggio Group
As of 30 June 2011 As of 31 December 2010 Total of which
Related parties (Section E)
Total of which Related parties
(Section E)
Notes In thousands of Euros
AssetsNon-current assets
16 Intangible assets 649,967 652,62217 Property, plant and equipment 251,765 256,75918 Investment property19 Equity investments 194 19420 Other financial assets 334 33421 Long-term tax receivables 968 96722 Deferred tax assets 44,721 46,29423 Trade receivables 24 Other receivables 12,867 444 12,655 443 Total non-current assets 960,816 969,825
28 Assets held for sale
Current assets23 Trade receivables 185,310 2,312 90,421 2,21024 Other receivables 20,249 5,860 23,300 5,98321 Short-term tax receivables 31,390 44,20025 Inventories 257,614 240,06626 Other financial assets 22,449 23,05127 Cash and cash equivalents 128,965 154,859 Total current assets 645,977 575,897 Total assets 1,606,793 1,545,722
Shareholders’ equity and liabilitiesShareholders’ equity
29Share capital and reserves attributable to the shareholders of the Parent Company
440,576 441,277
29 Share capital and reserves attributable to non-controlling interests 1,644 1,613 Total shareholders’ equity 442,220 442,890
Non-current liabilities30 Financial liabilities falling due after one year 323,590 2,900 371,048 2,90031 Trade payables 235 8832 Other long-term provisions 14,192 16,99333 Deferred tax liabilities 29,846 32,33834 Retirement funds and employee benefits 55,113 58,63635 Tax payables 2,501 3,36136 Other long-term payables 2,592 4,202 Total non-current liabilities 428,069 486,666
Current liabilities30 Financial liabilities falling due within one year 159,916 156,80031 Trade payables 444,856 21,490 352,627 12,85735 Tax payables 36,414 19,29036 Other short-term payables 79,479 86 69,503 34232 Current portion of other long-term provisions 15,839 17,946 Total current liabilities 736,504 616,166 Total shareholders’ equity and liabilities 1,606,793 1,545,722
Consolidated Statement of Financial Position
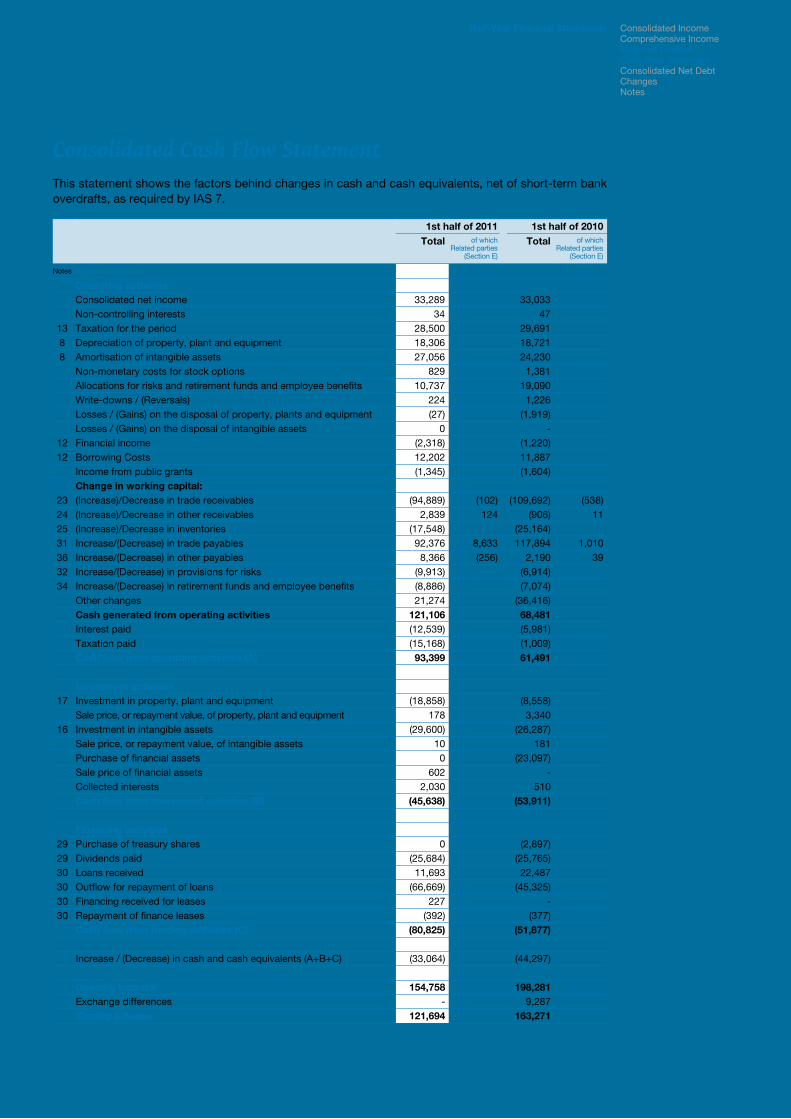
59 Half-year Financial Report 30 June 2011
1st half of 2011 1st half of 2010Total of which
Related parties (Section E)
Total of which Related parties
(Section E)
Notes In thousands of Euros
Operating activitiesConsolidated net income 33,289 33,033Non-controlling interests 34 47
13 Taxation for the period 28,500 29,6918 Depreciation of property, plant and equipment 18,306 18,7218 Amortisation of intangible assets 27,056 24,230
Non-monetary costs for stock options 829 1,381Allocations for risks and retirement funds and employee benefits 10,737 19,090Write-downs / (Reversals) 224 1,226Losses / (Gains) on the disposal of property, plants and equipment (27) (1,919)Losses / (Gains) on the disposal of intangible assets 0 -
12 Financial income (2,318) (1,220)12 Borrowing Costs 12,202 11,887
Income from public grants (1,345) (1,604)Change in working capital:
23 (Increase)/Decrease in trade receivables (94,889) (102) (109,692) (538)24 (Increase)/Decrease in other receivables 2,839 124 (906) 1125 (Increase)/Decrease in inventories (17,548) (25,164)31 Increase/(Decrease) in trade payables 92,376 8,633 117,894 1,01036 Increase/(Decrease) in other payables 8,366 (256) 2,190 3932 Increase/(Decrease) in provisions for risks (9,913) (6,914)34 Increase/(Decrease) in retirement funds and employee benefits (8,886) (7,074)
Other changes 21,274 (36,416) Cash generated from operating activities 121,106 68,481
Interest paid (12,539) (5,981)Taxation paid (15,168) (1,009)
Cash flow from operating activities (A) 93,399 61,491
Investment activities17 Investment in property, plant and equipment (18,858) (8,558)
Sale price, or repayment value, of property, plant and equipment 178 3,34016 Investment in intangible assets (29,600) (26,287)
Sale price, or repayment value, of intangible assets 10 181Purchase of financial assets 0 (23,097)Sale price of financial assets 602 -Collected interests 2,030 510
Cash flow from investment activities (B) (45,638) (53,911)
Financing activities29 Purchase of treasury shares 0 (2,897)29 Dividends paid (25,684) (25,765)30 Loans received 11,693 22,48730 Outflow for repayment of loans (66,669) (45,325)30 Financing received for leases 227 -30 Repayment of finance leases (392) (377) Cash flow from funding activities (C) (80,825) (51,877)
Increase / (Decrease) in cash and cash equivalents (A+B+C) (33,064) (44,297) Opening balance 154,758 198,281
Exchange differences - 9,287 Closing balance 121,694 163,271
This statement shows the factors behind changes in cash and cash equivalents, net of short-term bank overdrafts, as required by IAS 7.
Consolidated Cash Flow Statement
Half-Year Financial Statements Consolidated Income Comprehensive IncomeFinancial PositionCash Flow StatementConsolidated Net Debt ChangesNotes
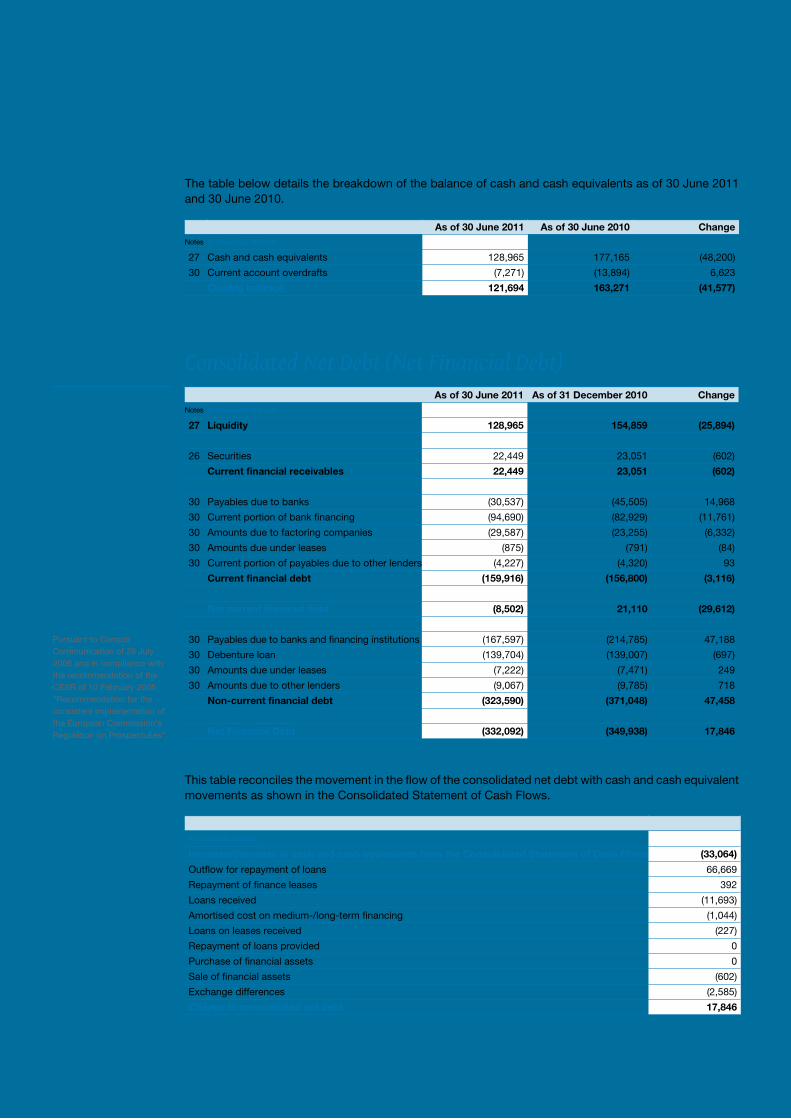
60Piaggio Group
The table below details the breakdown of the balance of cash and cash equivalents as of 30 June 2011 and 30 June 2010.
As of 30 June 2011 As of 30 June 2010 ChangeNotes In thousands of Euros
27 Cash and cash equivalents 128,965 177,165 (48,200)
30 Current account overdrafts (7,271) (13,894) 6,623
Closing balance 121,694 163,271 (41,577)
Consolidated net Debt (net Financial Debt)As of 30 June 2011 As of 31 December 2010 Change
Notes In thousands of Euros
27 Liquidity 128,965 154,859 (25,894)
26 Securities 22,449 23,051 (602)
Current financial receivables 22,449 23,051 (602)
30 Payables due to banks (30,537) (45,505) 14,968
30 Current portion of bank financing (94,690) (82,929) (11,761)
30 Amounts due to factoring companies (29,587) (23,255) (6,332)
30 Amounts due under leases (875) (791) (84)
30 Current portion of payables due to other lenders (4,227) (4,320) 93
Current financial debt (159,916) (156,800) (3,116)
Net current financial debt (8,502) 21,110 (29,612)
30 Payables due to banks and financing institutions (167,597) (214,785) 47,188
30 Debenture loan (139,704) (139,007) (697)
30 Amounts due under leases (7,222) (7,471) 249
30 Amounts due to other lenders (9,067) (9,785) 718
Non-current financial debt (323,590) (371,048) 47,458
Net Financial Debt (332,092) (349,938) 17,846
Pursuant to Consob Communication of 28 July 2006 and in compliance with the recommendation of the CESR of 10 February 2005 “Recommendation for the consistent implementation of the European Commission’s Regulation on Prospectuses“.
This table reconciles the movement in the flow of the consolidated net debt with cash and cash equivalent movements as shown in the Consolidated Statement of Cash Flows.
In thousands of Euros
Increase/decrease in cash and cash equivalents from the Consolidated Statement of Cash Flows (33,064)
Outflow for repayment of loans 66,669
Repayment of finance leases 392
Loans received (11,693)
Amortised cost on medium-/long-term financing (1,044)
Loans on leases received (227)
Repayment of loans provided 0
Purchase of financial assets 0
Sale of financial assets (602)
Exchange differences (2,585)
Change in consolidated net debt 17,846
61 Half-year Financial Report 30 June 2011
Conto EconomicoStato patrimonialeRendiconto finanziarioPosizione finanziaria netta Prospetto Note esplicative e integrative
000000000000
00 Bilancio 2010
Gruppo Piaggio
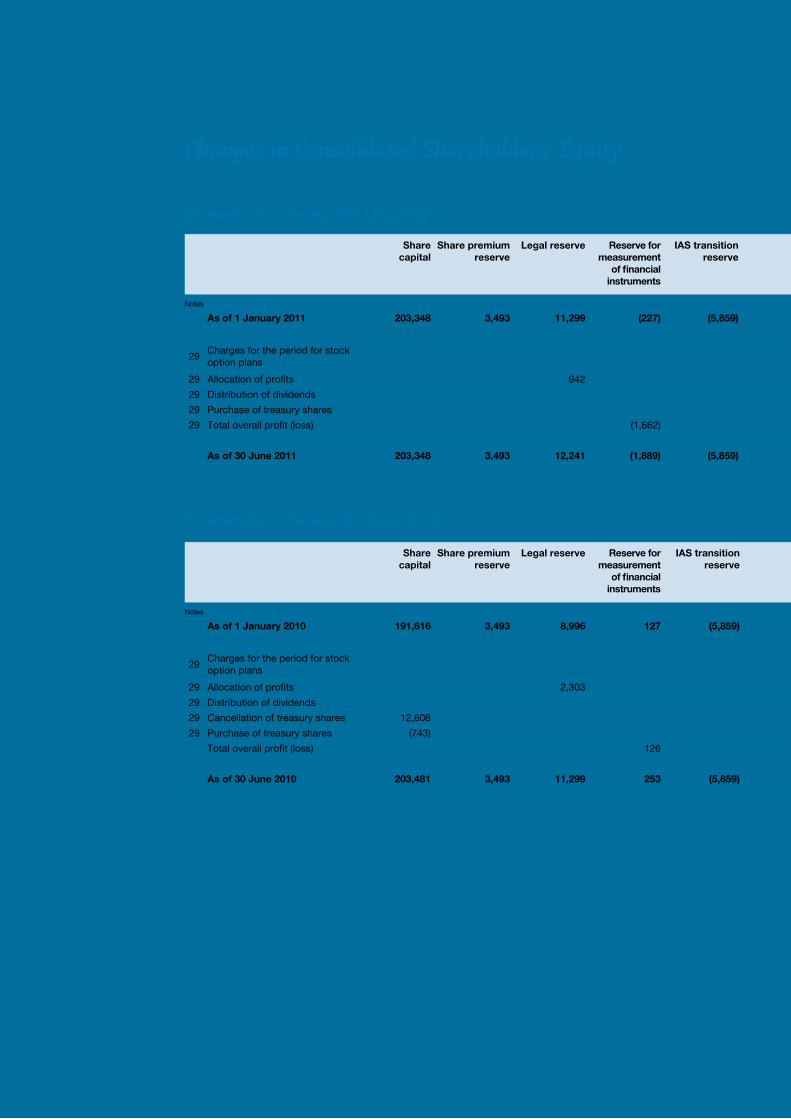
62Piaggio Group
Changes in Consolidated Shareholders’ Equity
Movements from 1 January 2011 / 30 June 2011
Movements from 1 January 2010 / 30 June 2010
Share capital
Share premium reserve
Legal reserve Reserve for measurement
of financial instruments
IAS transition reserve
Group consolidation
reserve
Group conversion
reserve
Stock option reserve
Performance reserve
Consolidated Group
shareholders’ equity
Non-controlling interests
capital and reserves
Total shareholders’
equity
Notes In thousands of Euros
As of 1 January 2011 203,348 3,493 11,299 (227) (5,859) 993 (1,850) 11,929 218,151 441,277 1,613 442,890
29Charges for the period for stock option plans
829 829 829
29 Allocation of profits 942 (942) 0 0
29 Distribution of dividends (25,684) (25,684) (25,684)
29 Purchase of treasury shares
29 Total overall profit (loss) (1,662) (7,473) 33,289 24,154 31 24,185
As of 30 June 2011 203,348 3,493 12,241 (1,889) (5,859) 993 (9,323) 12,758 224,814 440,576 1,644 442,220
Share capital
Share premium reserve
Legal reserve Reserve for measurement
of financial instruments
IAS transition reserve
Group consolidation
reserve
Group conversion
reserve
Stock option reserve
Performance reserve
Consolidated Group
shareholders’ equity
Non-controlling interests
capital and reserves
Total shareholders’
equity
Notes In thousands of Euros
As of 1 January 2010 191,616 3,493 8,996 127 (5,859) 993 (5,468) 9,279 218,484 421,661 2,141 423,802
29Charges for the period for stock option plans
1,381 1,381 1,381
29 Allocation of profits 2,303 (2,303) 0 0
29 Distribution of dividends (25,765) (25,765) (25,765)
29 Cancellation of treasury shares 12,608 (12,608) 0 0
29 Purchase of treasury shares (743) (2,154) (2,897) (2,897)
Total overall profit (loss) 126 9,331 33,514 42,971 (478) 42,493
As of 30 June 2010 203,481 3,493 11,299 253 (5,859) 993 3,863 10,660 209,168 437,351 1,663 439,014
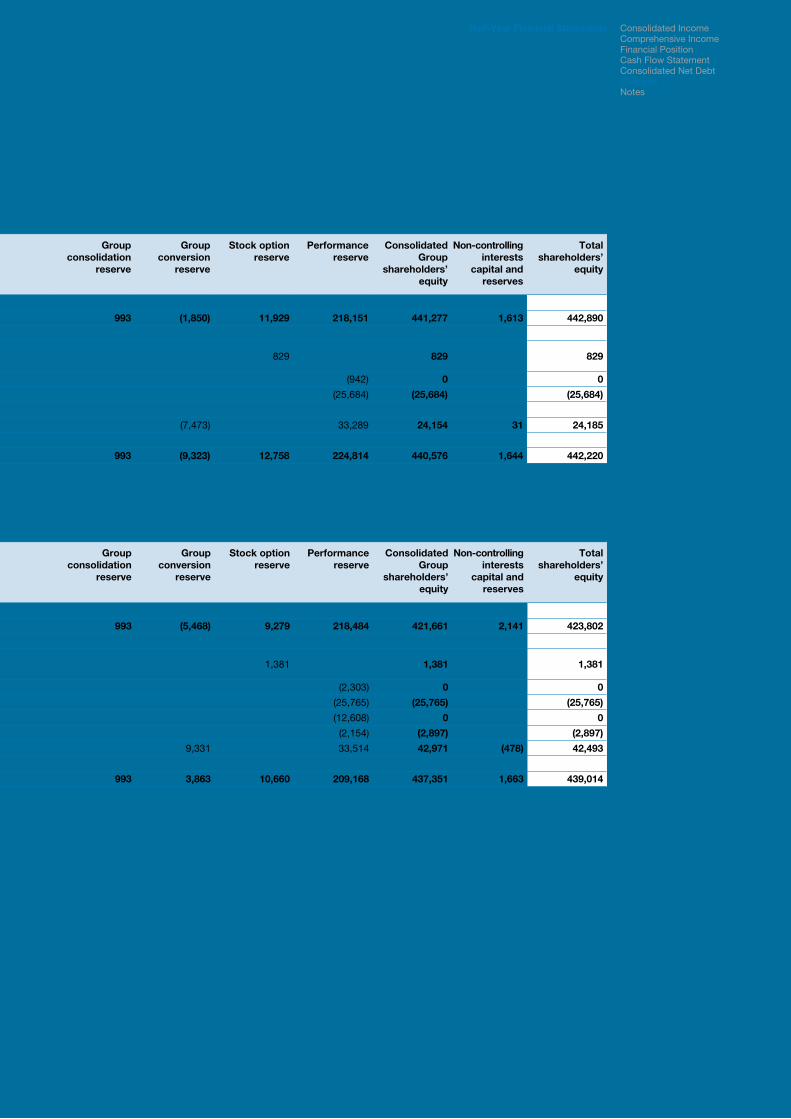
63 Half-year Financial Report 30 June 2011
Half-Year Financial Statements
Share capital
Share premium reserve
Legal reserve Reserve for measurement
of financial instruments
IAS transition reserve
Group consolidation
reserve
Group conversion
reserve
Stock option reserve
Performance reserve
Consolidated Group
shareholders’ equity
Non-controlling interests
capital and reserves
Total shareholders’
equity
Notes In thousands of Euros
As of 1 January 2011 203,348 3,493 11,299 (227) (5,859) 993 (1,850) 11,929 218,151 441,277 1,613 442,890
29Charges for the period for stock option plans
829 829 829
29 Allocation of profits 942 (942) 0 0
29 Distribution of dividends (25,684) (25,684) (25,684)
29 Purchase of treasury shares
29 Total overall profit (loss) (1,662) (7,473) 33,289 24,154 31 24,185
As of 30 June 2011 203,348 3,493 12,241 (1,889) (5,859) 993 (9,323) 12,758 224,814 440,576 1,644 442,220
Share capital
Share premium reserve
Legal reserve Reserve for measurement
of financial instruments
IAS transition reserve
Group consolidation
reserve
Group conversion
reserve
Stock option reserve
Performance reserve
Consolidated Group
shareholders’ equity
Non-controlling interests
capital and reserves
Total shareholders’
equity
Notes In thousands of Euros
As of 1 January 2010 191,616 3,493 8,996 127 (5,859) 993 (5,468) 9,279 218,484 421,661 2,141 423,802
29Charges for the period for stock option plans
1,381 1,381 1,381
29 Allocation of profits 2,303 (2,303) 0 0
29 Distribution of dividends (25,765) (25,765) (25,765)
29 Cancellation of treasury shares 12,608 (12,608) 0 0
29 Purchase of treasury shares (743) (2,154) (2,897) (2,897)
Total overall profit (loss) 126 9,331 33,514 42,971 (478) 42,493
As of 30 June 2010 203,481 3,493 11,299 253 (5,859) 993 3,863 10,660 209,168 437,351 1,663 439,014
Consolidated Income Comprehensive IncomeFinancial PositionCash Flow StatementConsolidated Net Debt ChangesNotes
64Piaggio Group
A) General aspects
Piaggio & C. S.p.A. (the Company) is a joint-stock company established in Italy at the Register of Companies of Pisa. The main operations of the company and its subsidiaries (the Group) are described in the Report on Operations.The Abbreviated Half-year Financial Statements are expressed in Euros (€) since this is the currency in which most of the Group’s transactions take place. Foreign assets are booked in accordance with currently effective international accounting standards.
Scope of consolidationThe scope of consolidation changed compared to the Consolidated Financial Statements as of 31 December 2010 and 30 June 2010 due to the establishment of a new company in Indonesia on 22 March 2011. As the change is of a limited extent, comparability with data from previous periods has not been affected.
1. Conformity to International Accounting Standards
These Abbreviated Half-Year Financial Statements have been drafted in compliance with the International Accounting Standards (IAS/IFRS) in force at that date, issued by the International Accounting Standards Board and approved by the European Commission, as well as in compliance with the provisions established in Article 9 of Legislative Decree no. 38/2005 (CONSOB Resolution no. 15519 dated 27 July 2006 containing the “Provisions for the presentation of financial statements”, CONSOB Resolution no. 15520 dated 27 July 2006 containing the “Changes and additions to the Regulation on Issuers adopted by Resolution no. 11971/99”, CONSOB communication no. 6064293 dated 28 July 2006 containing the “Corporate reporting required in accordance with Article 114, paragraph 5 of Leg. Decree no. 58/98”). The interpretations of the International Financial Reporting Interpretations Committee (“IFRIC”), previously the Standing Interpretations Committee (“SIC”), were also taken into account.During the drafting of these Abbreviated Half-Year Financial Statements, prepared in compliance with IAS 34 - Interim Financial Reporting, the same accounting standards adopted in the drafting of the Consolidated Financial Statements as of 31 December 2010 were applied, with the exception of items in section 2.1 “Accounting standards, amendments and interpretations applied as from 1 January 2011”.
The preparation of the interim financial statements requires management to make estimates and assumptions which have an impact on the values of revenues, costs, consolidated balance sheet assets and liabilities and on the information regarding contingent assets and liabilities at the date of the interim financial statements. If these management estimates and assumptions should, in future, differ from the actual situation, they will be changed as appropriate in the period in which the circumstances change.
It should also be noted that some assessment processes, in particular more complex ones such as establishing any impairment of fixed assets, are generally undertaken in full only when preparing the annual financial statements, when all the potentially necessary information is available, except in cases where there are indications of impairment which require an immediate assessment of any impairment loss.
The Group’s activities, especially those regarding the two-wheeler segment, are subject to significant seasonal changes in sales during the year.
Income tax is recognised on the basis of the best estimate of the average weighted tax rate for the entire financial period.
These Abbreviated Half-Year Financial Statements have been subject to a limited audit by Deloitte & Touche S.p.A..
Notes to the Abbreviated Half-Year Financial Statements as of 30 June 2011
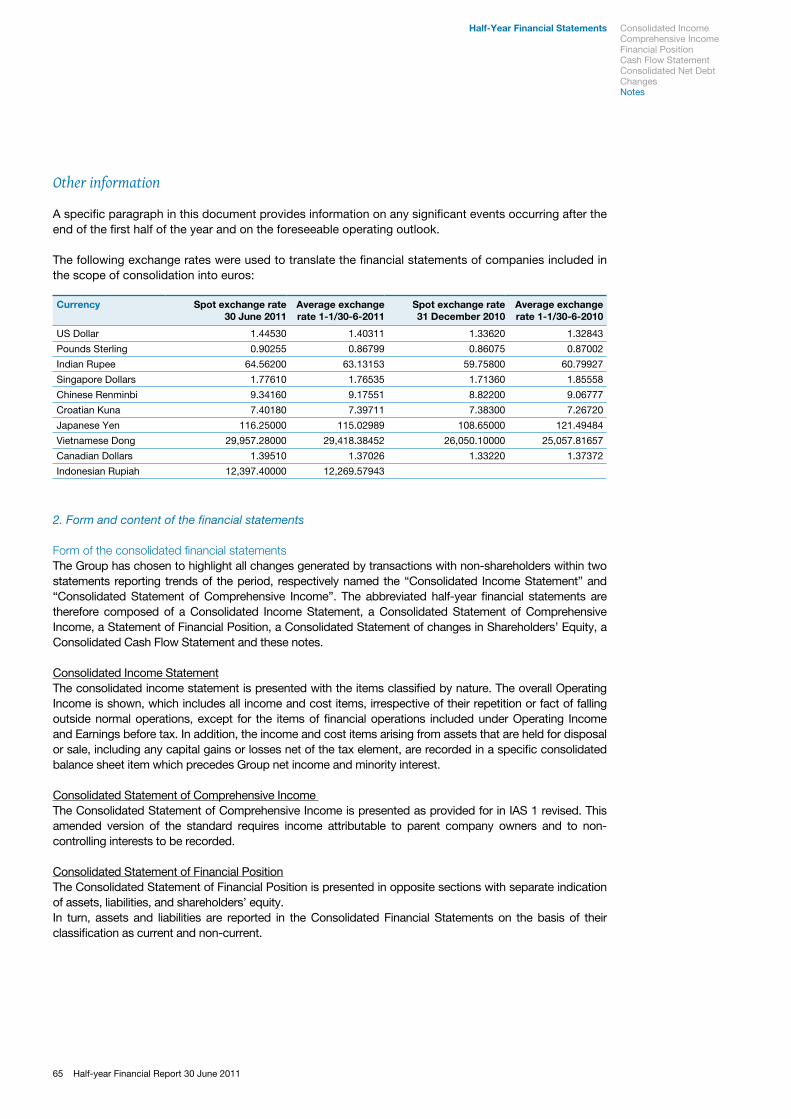
65 Half-year Financial Report 30 June 2011
Other information
A specific paragraph in this document provides information on any significant events occurring after the end of the first half of the year and on the foreseeable operating outlook.
The following exchange rates were used to translate the financial statements of companies included in the scope of consolidation into euros:
2. Form and content of the financial statements
Form of the consolidated financial statementsThe Group has chosen to highlight all changes generated by transactions with non-shareholders within two statements reporting trends of the period, respectively named the “Consolidated Income Statement” and “Consolidated Statement of Comprehensive Income”. The abbreviated half-year financial statements are therefore composed of a Consolidated Income Statement, a Consolidated Statement of Comprehensive Income, a Statement of Financial Position, a Consolidated Statement of changes in Shareholders’ Equity, a Consolidated Cash Flow Statement and these notes.
Consolidated Income StatementThe consolidated income statement is presented with the items classified by nature. The overall Operating Income is shown, which includes all income and cost items, irrespective of their repetition or fact of falling outside normal operations, except for the items of financial operations included under Operating Income and Earnings before tax. In addition, the income and cost items arising from assets that are held for disposal or sale, including any capital gains or losses net of the tax element, are recorded in a specific consolidated balance sheet item which precedes Group net income and minority interest.
Consolidated Statement of Comprehensive Income The Consolidated Statement of Comprehensive Income is presented as provided for in IAS 1 revised. This amended version of the standard requires income attributable to parent company owners and to non-controlling interests to be recorded.
Consolidated Statement of Financial PositionThe Consolidated Statement of Financial Position is presented in opposite sections with separate indication of assets, liabilities, and shareholders’ equity.In turn, assets and liabilities are reported in the Consolidated Financial Statements on the basis of their classification as current and non-current.
Half-Year Financial Statements
Currency Spot exchange rate 30 June 2011
Average exchange rate 1-1/30-6-2011
Spot exchange rate 31 December 2010
Average exchange rate 1-1/30-6-2010
US Dollar 1.44530 1.40311 1.33620 1.32843
Pounds Sterling 0.90255 0.86799 0.86075 0.87002
Indian Rupee 64.56200 63.13153 59.75800 60.79927
Singapore Dollars 1.77610 1.76535 1.71360 1.85558
Chinese Renminbi 9.34160 9.17551 8.82200 9.06777
Croatian Kuna 7.40180 7.39711 7.38300 7.26720
Japanese Yen 116.25000 115.02989 108.65000 121.49484
Vietnamese Dong 29,957.28000 29,418.38452 26,050.10000 25,057.81657
Canadian Dollars 1.39510 1.37026 1.33220 1.37372
Indonesian Rupiah 12,397.40000 12,269.57943
Consolidated Income Comprehensive IncomeFinancial PositionCash Flow StatementConsolidated Net Debt ChangesNotes
66Piaggio Group
Consolidated Cash Flow StatementThe Consolidated Cash Flow Statement is divided into cash-flow generating areas. The Consolidated Statement of Cash Flows model adopted by the Piaggio Group has been prepared using the indirect method. The cash and cash equivalents recorded in the Statement of Cash Flows include the Statement of Financial Position balances for this item at the reference date. Financial flows in foreign currency have been converted at the average exchange rate for the period. Income and costs related to interest, dividends received and income taxes are included in the cash flow generated from operations.
Change in consolidated shareholders’ equityAs from 1 January 2009, the consolidated statement of changes in equity has been revised, as required by IAS 1 revised. The statement includes the Consolidated Statement of Comprehensive Income separately indicating amounts attributable to owners of the parent and non-controlling interests, amounts of owner-generated transactions and any effects of retroactive application or retroactive determination pursuant to IAS 8. Reconciliation between the opening and closing balance of each item for the period is presented.
2.1. Accounting standards, amendments and interpretations applied as of 1 January 2011
The following accounting standards, amendments and interpretations have been applied for the first time by the Group as from 1 January 2011.
IFRS 3 - Business combinations: › the amendment clarifies that components of non-controlling interests do not entitle holders to receive a proportional share of net assets of the subsidiary, which must be valued at fair value or as required by applicable international standards. Moreover, the Board further analysed the issue of share-based payments which are replaced in business combinations, adding specific guidelines clarifying accounting treatment.IFRS 7 – Financial Instruments: Disclosures: › the change refers to the interaction between additional qualitative and quantitative information required by the standard on the nature and extent of risks concerning financial instruments. This should help readers of financial statements to associate presented information and obtain a general description of the nature and extent of risks concerning financial instruments. The requirement to disclose financing activities which have expired but not been renegotiated or impaired and to disclose the fair value of collaterals has been eliminated.IAS 1 – Presentation of Financial Statements: › the amendment requires the reconciliation of changes in all items of equity to be presented in the notes and the financial statements.IAS 34 – Interim financial reporting: › guidelines have been added on additional information to be included in Interim Financial Statements. IAS 32 – Financial instruments: › Presentation - Classification of rights issues, to regulate the accounting of rights issues (rights, options or warrants) in a currency other than the operating currency of the issuer. These rights were previously accounted for as liabilities from derivative financial instruments. The amendment requires these rights, in certain conditions, to be classified as Shareholders’ equity regardless of the currency in which the exercise price is denominated.IAS 24 – Related party disclosures › – which simplifies the type of information required in the case of transactions with related parties controlled by the State, and clarifies the definition of related parties.
2.2 Amendments and interpretations effective as from 1 January 2011 and not relevant for the Group
The following amendments and interpretations, applicable as from 1 January 2011, regulate specific cases and case histories which are not present within the Group at the date of these Abbreviated Half-Year Financial Statements:
a minor amendment to IFRIC 14 – › The Limit on a Defined Benefit Asset, Minimum Funding Requirements and their Interaction – which allows companies to prepay minimum funding contributions and recognise them as an asset.
67 Half-year Financial Report 30 June 2011
IFRIC 19 – › Extinguishing Financial Liabilities with Equity Instruments – which provides guidelines on the recognition of the extinction of a financial liability through the issue of an equity instrument. The interpretation establishes that if a business renegotiates extinguishing conditions of a financial liability and the creditor accepts extinguishing through the issue of the company’s shares, the shares issued by the company will become a part of the price paid for extinguishing the financial liability and shall be valued at fair value; the difference between the book value of the extinguished financial liability and opening value of equity instruments shall be recorded in the consolidated income statement of the period.
2.3 Accounting standards, amendments and interpretations which are not yet applicable and adopted in advance by the Group
On 12 November 2009 the IASB published IFRS 9 – Financial Instruments - on classifying and measuring financial assets as from 1 January 2013. This is the first step in a project which will entirely replace IAS 39 in stages. The new standard uses a single approach based on procedures for financial instrument management and on contract cash flows of financial assets to determine valuation criteria replacing different regulations in IAS 39. The new standard will also have a single method to determine impairment losses from financial assets.
On 7 October 2010 IASB published some amendments to IFRS 7 – Financial instruments: Disclosures, applicable for accounting periods commencing on or after 1 July 2011. The purpose is to improve understanding of transfer transactions of financial assets, including understanding the possible effects of any risks that may remain with the entity that transferred the assets. The amendments also require additional disclosures if a disproportionate amount of transfer transactions are undertaken around the end of a reporting period.
On 20 December 2010 the IASB issued a minor amendment to IFRS 1 – First-time Adoption of International Financial Reporting Standards to eliminate the reference to the date 1 January 2004 described as the date of transition to IFRS and to provide guidance on the presentation of financial statements following a period of hyperinflation.The amendment will be applicable as from 1 July 2011.
On 20 December 2010 the IASB issued a minor amendment to IAS 12 – Income Taxes which requires businesses to measure deferred tax assets and liabilities arising from an asset based on the manner in which the carrying amount of the asset will be recovered. Consequently SIC 21 Income taxes – Recovery of Revalued Non-Depreciable Assets – will no longer be applicable. The amendment will be applicable as from 1 January 2012.
On 12 May 2011 the IASB issued standard IFRS 10 - Consolidated Financial Statements which will replace SIC 12 Consolidation - Special purpose entities and parts of IAS 27 - Consolidated and Separate Financial Statements what will be renamed Separate financial statements and will regulate the accounting treatment of equity investments in separate financial statements. The new standard deviates from existing standards by identifying the concept of control as the determinant factor for the purposes of consolidation of a company in the consolidated financial statements of the parent company. It also provides a guide for determining the existence of control where it is difficult to establish. The standard is applicable in a retrospective manner as of 1 January 2013.
On 12 May 2011 the IASB issued the standard IFRS 11 – Joint arrangements which will replace IAS 31 – Interests in Joint Ventures and SIC 13 – Jointly controlled entities - Non-monetary contributions by venturer. The new standard provides methods for identifying joint arrangements based on the rights and obligations under such arrangements rather than their actual legal form and establishes the equity method as the only accounting treatment for jointly controlled entities in consolidated financial statements. The standard is applicable in a retrospective manner as of 1 January 2013. After the issue of the standard
Half-Year Financial Statements Consolidated Income Comprehensive IncomeFinancial PositionCash Flow StatementConsolidated Net Debt ChangesNotes
68Piaggio Group
IAS 28 – Investments in associates it was amended to include jointly controlled entities within its field of application, as of the date the standard became effective.
On 12 May 2011 the IASB issued standard IFRS 12 – Disclosure on interests in other entities which is a new and complete standard on disclosures to provide on all types of investments including in subsidiaries, joint arrangements, associates, special purpose entities and unconsolidated structured entities. The standard is applicable in a retrospective manner as of 1 January 2013.
On 12 May 2011 the IASB issued the standard IFRS 13 – Fair value measurement which explains how fair value is to be determined for financial statements and applied to all the standards which require it or allow fair value measurement of the disclosure of information based on fair value. The standard shall be applicable as of 1 January 2013.
On 16 June 2011 IASB issued an amendment to IAS 1 – Presentation of financial statements to require entities to group all items presented in “Other comprehensive income” based on whether they are potentially reclassifiable to profit or loss. The amendment is applicable to financial years started after or on 1 July 2012.
On 16 June 2011 the IASB issued an amendment to IAS 19 – Employee benefits which eliminates the option of deferring recognition of actuarial gains and losses with the corridor approach, requiring disclosure of the provision deficit or surplus in the statement of financial position, and recognition of cost items linked to employment and net borrowing costs in profit and loss, and recognition of actuarial gains and losses resulting from remeasurement of assets and liabilities in “Other comprehensive income”. In addition, the performance of an asset included in net borrowing costs must be calculated based on the discount rate of the liability and no longer on the expected return of the assets. Lastly, the amendment introduces enhanced disclosures to provide in the notes. The amendment is applicable in retrospective manner from the financial year starting after or on 1 January 2013.
At the date of issue of these Abbreviated Half-Year Financial Statements, competent bodies of the European Union had not completed the approval process necessary for the application of these amendments and standards.
69 Half-year Financial Report 30 June 2011
B) Segment reporting
3. Reporting by operating segments
The application of IFRS 8 - Operating Segments - is mandatory as of 1 January 2009. This principle requires operating segments to be identified on the basis of an internal reporting system which top company management utilises to allocate resources and to assess performance. The previous principle IAS 14 - Segment Reporting - required, on the other hand, that sectors (primary or secondary) be identified on the basis of risks and benefits which refer to the sectors themselves; the reporting system only represents the starting point for this identification.
The information for operating segments presented below reflects the internal reporting utilised by management for making strategic decisions.During the course of 2008, it should be noted that the Piaggio Group adopted a new organisational structure with a view to focusing Group resources by “functional area” and by “geographical area”. As a result, internal reporting has been modified to reflect this organisational change; it was therefore based on functional areas subdivided into the following geographical areas.
The “Two-Wheeler” and “Commercial Vehicles” divisions are the two functional areas of the Group. They have been identified considering the types of products sold. The results of these functional areas are considered by management in order to assess attained performances. The business figures and margins are in line with those used in internal reporting.
The functional areas - within the reports provided to management - are further broken down by geographical segment. In particular for the “Two-Wheeler” segment, figures are presented with reference to “Western Countries”, and “Pacific Asia”. With regards to “Commercial Vehicles” the identified geographical segments are “Europe” and “India”. The above mentioned geographic distribution was adopted by the Group during approval of the 2010-2013 Strategic Plan resolved by the Board of Directors on 22 September 2010. For comparison purposes, published 2010 data have been reprocessed according to the new organisational logic.The following consolidated income statement analysis provides information on the contribution in relation to the consolidated values of the “Two-Wheeler” and “Commercial Vehicles” functional areas.As previously illustrated in comments on the Piaggio Group financial position and performance, consolidated EBITDA was defined as the “Operating Income” gross of amortisation/depreciation of intangible assets and amortisation/depreciation of plant, property and equipment, as reported within the consolidated income statement.
Half-Year Financial Statements Consolidated Income Comprehensive IncomeFinancial PositionCash Flow StatementConsolidated Net Debt ChangesNotes
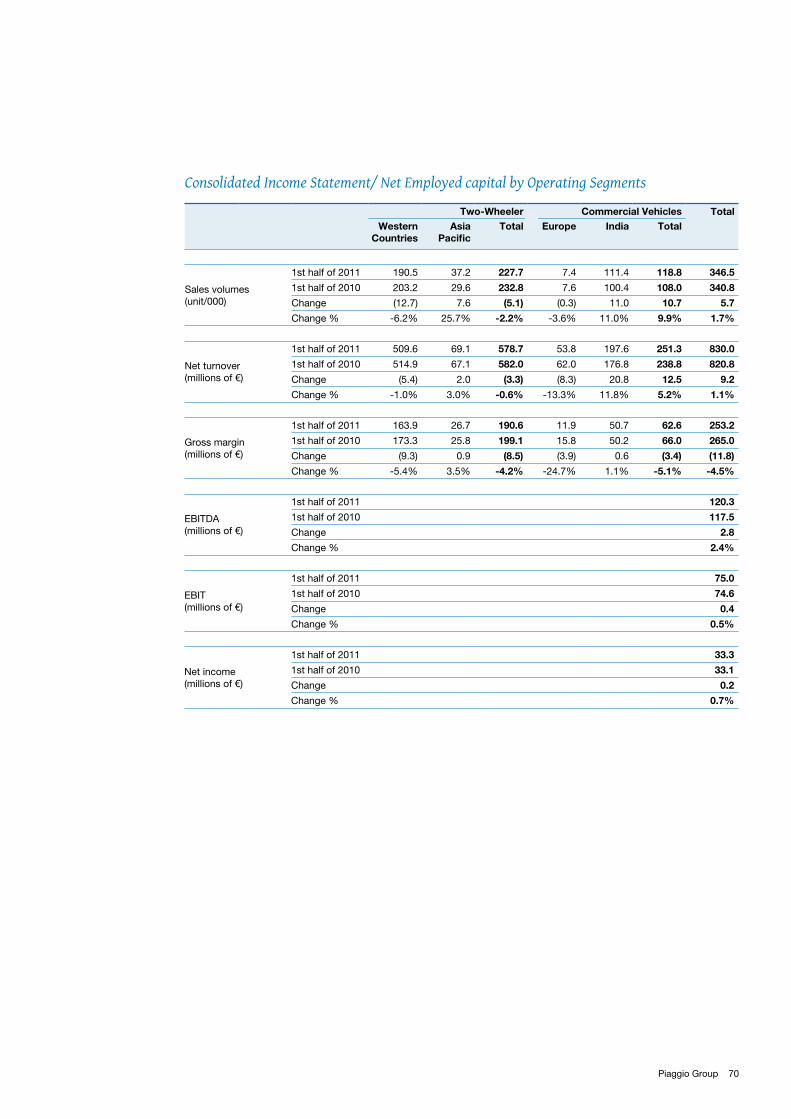
70Piaggio Group
Two-Wheeler Commercial Vehicles TotalWestern
CountriesAsia
PacificTotal Europe India Total
Sales volumes (unit/000)
1st half of 2011 190.5 37.2 227.7 7.4 111.4 118.8 346.5
1st half of 2010 203.2 29.6 232.8 7.6 100.4 108.0 340.8
Change (12.7) 7.6 (5.1) (0.3) 11.0 10.7 5.7
Change % -6.2% 25.7% -2.2% -3.6% 11.0% 9.9% 1.7%
Net turnover (millions of €)
1st half of 2011 509.6 69.1 578.7 53.8 197.6 251.3 830.0
1st half of 2010 514.9 67.1 582.0 62.0 176.8 238.8 820.8
Change (5.4) 2.0 (3.3) (8.3) 20.8 12.5 9.2
Change % -1.0% 3.0% -0.6% -13.3% 11.8% 5.2% 1.1%
Gross margin (millions of €)
1st half of 2011 163.9 26.7 190.6 11.9 50.7 62.6 253.2
1st half of 2010 173.3 25.8 199.1 15.8 50.2 66.0 265.0
Change (9.3) 0.9 (8.5) (3.9) 0.6 (3.4) (11.8)
Change % -5.4% 3.5% -4.2% -24.7% 1.1% -5.1% -4.5%
EBITDA(millions of €)
1st half of 2011 120.3
1st half of 2010 117.5
Change 2.8
Change % 2.4%
EBIT(millions of €)
1st half of 2011 75.0
1st half of 2010 74.6
Change 0.4
Change % 0.5%
Net income (millions of €)
1st half of 2011 33.3
1st half of 2010 33.1
Change 0.2
Change % 0.7%
Consolidated Income Statement/ net employed capital by Operating Segments
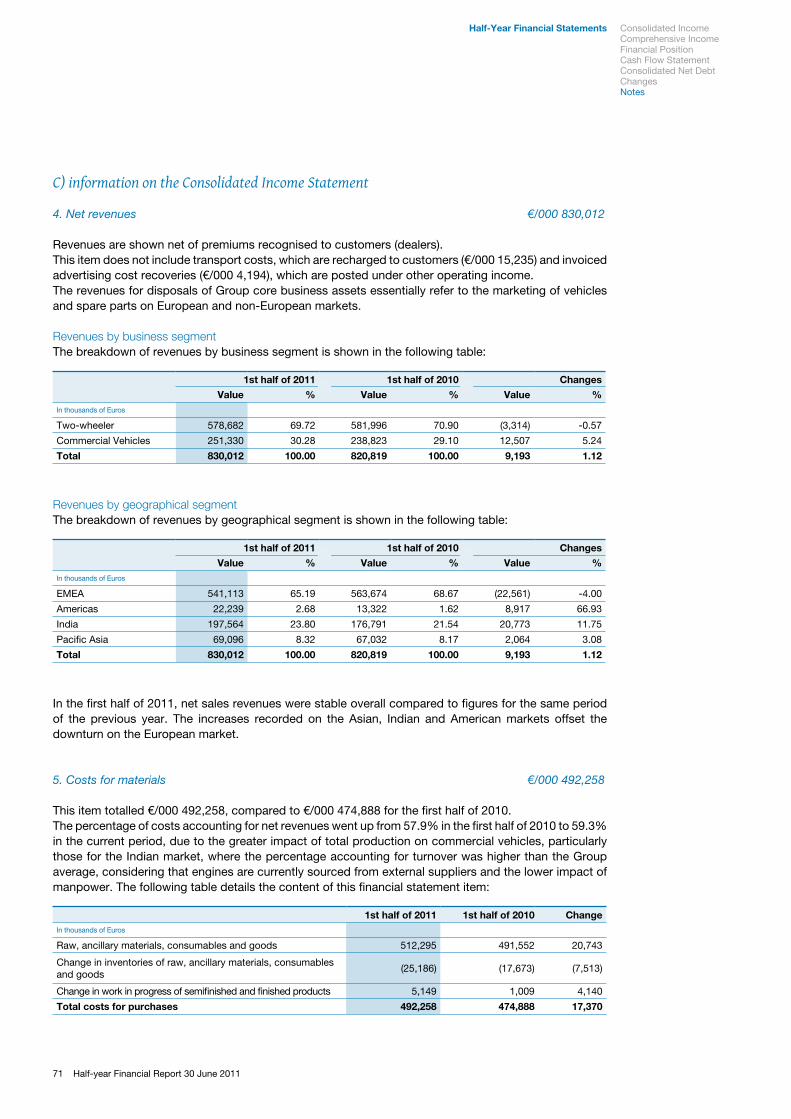
71 Half-year Financial Report 30 June 2011
Two-Wheeler Commercial Vehicles TotalWestern
CountriesAsia
PacificTotal Europe India Total
Sales volumes (unit/000)
1st half of 2011 190.5 37.2 227.7 7.4 111.4 118.8 346.5
1st half of 2010 203.2 29.6 232.8 7.6 100.4 108.0 340.8
Change (12.7) 7.6 (5.1) (0.3) 11.0 10.7 5.7
Change % -6.2% 25.7% -2.2% -3.6% 11.0% 9.9% 1.7%
Net turnover (millions of €)
1st half of 2011 509.6 69.1 578.7 53.8 197.6 251.3 830.0
1st half of 2010 514.9 67.1 582.0 62.0 176.8 238.8 820.8
Change (5.4) 2.0 (3.3) (8.3) 20.8 12.5 9.2
Change % -1.0% 3.0% -0.6% -13.3% 11.8% 5.2% 1.1%
Gross margin (millions of €)
1st half of 2011 163.9 26.7 190.6 11.9 50.7 62.6 253.2
1st half of 2010 173.3 25.8 199.1 15.8 50.2 66.0 265.0
Change (9.3) 0.9 (8.5) (3.9) 0.6 (3.4) (11.8)
Change % -5.4% 3.5% -4.2% -24.7% 1.1% -5.1% -4.5%
EBITDA(millions of €)
1st half of 2011 120.3
1st half of 2010 117.5
Change 2.8
Change % 2.4%
EBIT(millions of €)
1st half of 2011 75.0
1st half of 2010 74.6
Change 0.4
Change % 0.5%
Net income (millions of €)
1st half of 2011 33.3
1st half of 2010 33.1
Change 0.2
Change % 0.7%
C) information on the Consolidated Income Statement
4. Net revenues €/000 830,012
Revenues are shown net of premiums recognised to customers (dealers). This item does not include transport costs, which are recharged to customers (€/000 15,235) and invoiced advertising cost recoveries (€/000 4,194), which are posted under other operating income.The revenues for disposals of Group core business assets essentially refer to the marketing of vehicles and spare parts on European and non-European markets.
Revenues by business segmentThe breakdown of revenues by business segment is shown in the following table:
1st half of 2011 1st half of 2010 Changes
Value % Value % Value %In thousands of Euros
Two-wheeler 578,682 69.72 581,996 70.90 (3,314) -0.57
Commercial Vehicles 251,330 30.28 238,823 29.10 12,507 5.24
Total 830,012 100.00 820,819 100.00 9,193 1.12
Revenues by geographical segmentThe breakdown of revenues by geographical segment is shown in the following table:
In the first half of 2011, net sales revenues were stable overall compared to figures for the same period of the previous year. The increases recorded on the Asian, Indian and American markets offset the downturn on the European market.
5. Costs for materials €/000 492,258
This item totalled €/000 492,258, compared to €/000 474,888 for the first half of 2010.The percentage of costs accounting for net revenues went up from 57.9% in the first half of 2010 to 59.3% in the current period, due to the greater impact of total production on commercial vehicles, particularly those for the Indian market, where the percentage accounting for turnover was higher than the Group average, considering that engines are currently sourced from external suppliers and the lower impact of manpower. The following table details the content of this financial statement item:
1st half of 2011 1st half of 2010 Changes
Value % Value % Value %In thousands of Euros
EMEA 541,113 65.19 563,674 68.67 (22,561) -4.00
Americas 22,239 2.68 13,322 1.62 8,917 66.93
India 197,564 23.80 176,791 21.54 20,773 11.75
Pacific Asia 69,096 8.32 67,032 8.17 2,064 3.08
Total 830,012 100.00 820,819 100.00 9,193 1.12
1st half of 2011 1st half of 2010 ChangeIn thousands of Euros
Raw, ancillary materials, consumables and goods 512,295 491,552 20,743
Change in inventories of raw, ancillary materials, consumables and goods
(25,186) (17,673) (7,513)
Change in work in progress of semifinished and finished products 5,149 1,009 4,140
Total costs for purchases 492,258 474,888 17,370
Half-Year Financial Statements Consolidated Income Comprehensive IncomeFinancial PositionCash Flow StatementConsolidated Net Debt ChangesNotes
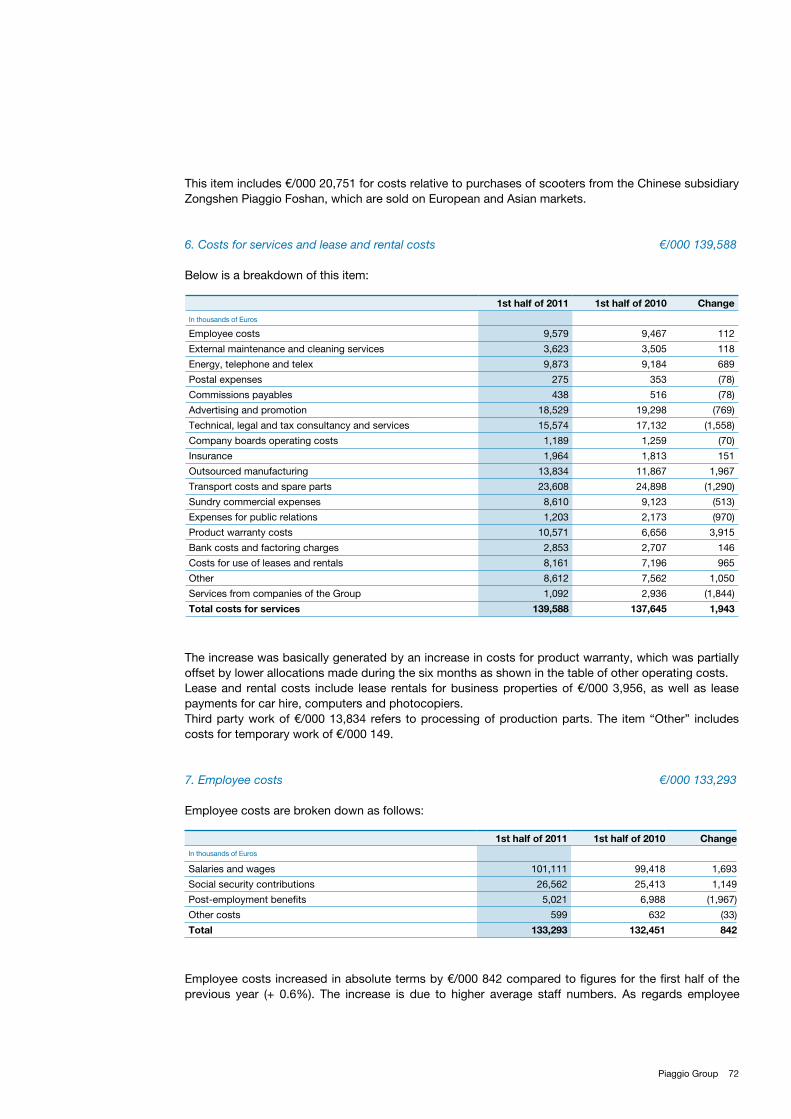
72Piaggio Group
This item includes €/000 20,751 for costs relative to purchases of scooters from the Chinese subsidiary Zongshen Piaggio Foshan, which are sold on European and Asian markets.
6. Costs for services and lease and rental costs €/000 139,588
Below is a breakdown of this item:
1st half of 2011 1st half of 2010 Change
In thousands of Euros
Employee costs 9,579 9,467 112
External maintenance and cleaning services 3,623 3,505 118
Energy, telephone and telex 9,873 9,184 689
Postal expenses 275 353 (78)
Commissions payables 438 516 (78)
Advertising and promotion 18,529 19,298 (769)
Technical, legal and tax consultancy and services 15,574 17,132 (1,558)
Company boards operating costs 1,189 1,259 (70)
Insurance 1,964 1,813 151
Outsourced manufacturing 13,834 11,867 1,967
Transport costs and spare parts 23,608 24,898 (1,290)
Sundry commercial expenses 8,610 9,123 (513)
Expenses for public relations 1,203 2,173 (970)
Product warranty costs 10,571 6,656 3,915
Bank costs and factoring charges 2,853 2,707 146
Costs for use of leases and rentals 8,161 7,196 965
Other 8,612 7,562 1,050
Services from companies of the Group 1,092 2,936 (1,844)
Total costs for services 139,588 137,645 1,943
The increase was basically generated by an increase in costs for product warranty, which was partially offset by lower allocations made during the six months as shown in the table of other operating costs.Lease and rental costs include lease rentals for business properties of €/000 3,956, as well as lease payments for car hire, computers and photocopiers.Third party work of €/000 13,834 refers to processing of production parts. The item “Other” includes costs for temporary work of €/000 149.
7. Employee costs €/000 133,293
Employee costs are broken down as follows:
1st half of 2011 1st half of 2010 ChangeIn thousands of Euros
Salaries and wages 101,111 99,418 1,693
Social security contributions 26,562 25,413 1,149
Post-employment benefits 5,021 6,988 (1,967)
Other costs 599 632 (33)
Total 133,293 132,451 842
Employee costs increased in absolute terms by €/000 842 compared to figures for the first half of the previous year (+ 0.6%). The increase is due to higher average staff numbers. As regards employee
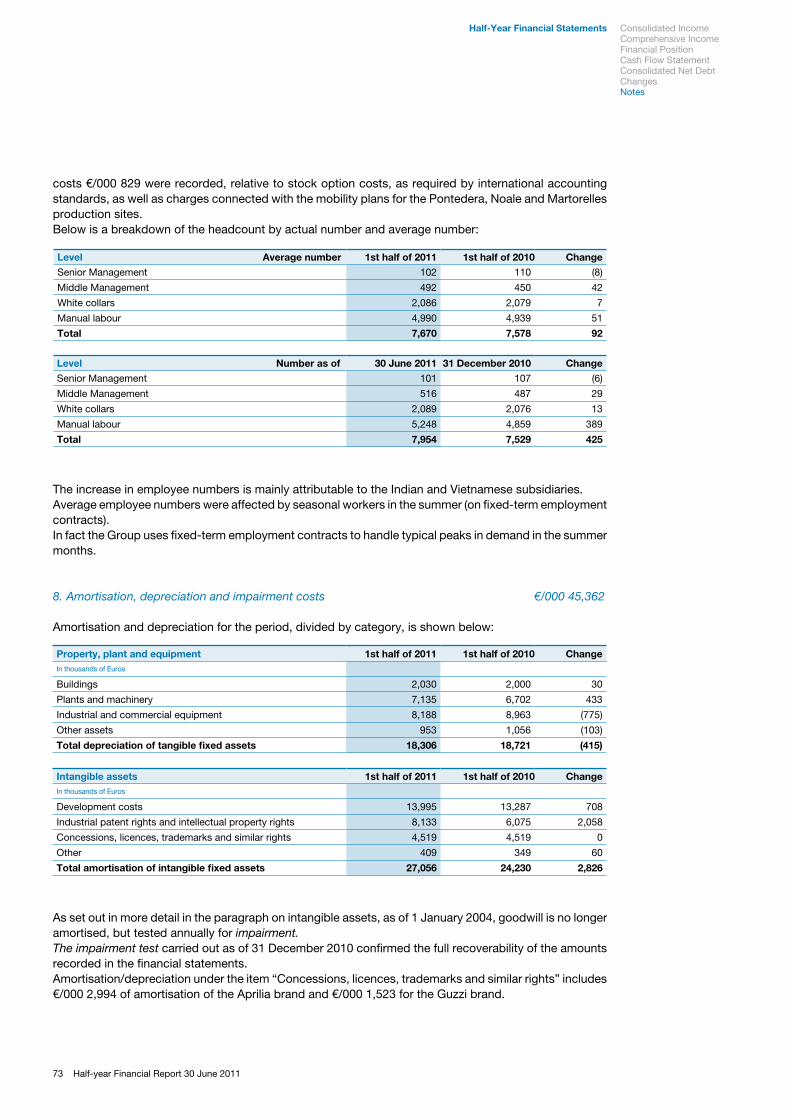
73 Half-year Financial Report 30 June 2011
Level Average number 1st half of 2011 1st half of 2010 Change
Senior Management 102 110 (8)
Middle Management 492 450 42
White collars 2,086 2,079 7
Manual labour 4,990 4,939 51
Total 7,670 7,578 92
Level Number as of 30 June 2011 31 December 2010 Change
Senior Management 101 107 (6)
Middle Management 516 487 29
White collars 2,089 2,076 13
Manual labour 5,248 4,859 389
Total 7,954 7,529 425
The increase in employee numbers is mainly attributable to the Indian and Vietnamese subsidiaries. Average employee numbers were affected by seasonal workers in the summer (on fixed-term employment contracts). In fact the Group uses fixed-term employment contracts to handle typical peaks in demand in the summer months.
8. Amortisation, depreciation and impairment costs €/000 45,362
Amortisation and depreciation for the period, divided by category, is shown below:
Property, plant and equipment 1st half of 2011 1st half of 2010 ChangeIn thousands of Euros
Buildings 2,030 2,000 30
Plants and machinery 7,135 6,702 433
Industrial and commercial equipment 8,188 8,963 (775)
Other assets 953 1,056 (103)
Total depreciation of tangible fixed assets 18,306 18,721 (415)
Intangible assets 1st half of 2011 1st half of 2010 ChangeIn thousands of Euros
Development costs 13,995 13,287 708
Industrial patent rights and intellectual property rights 8,133 6,075 2,058
Concessions, licences, trademarks and similar rights 4,519 4,519 0
Other 409 349 60
Total amortisation of intangible fixed assets 27,056 24,230 2,826
As set out in more detail in the paragraph on intangible assets, as of 1 January 2004, goodwill is no longer amortised, but tested annually for impairment. The impairment test carried out as of 31 December 2010 confirmed the full recoverability of the amounts recorded in the financial statements. Amortisation/depreciation under the item “Concessions, licences, trademarks and similar rights” includes €/000 2,994 of amortisation of the Aprilia brand and €/000 1,523 for the Guzzi brand.
Half-Year Financial Statements
costs €/000 829 were recorded, relative to stock option costs, as required by international accounting standards, as well as charges connected with the mobility plans for the Pontedera, Noale and Martorelles production sites. Below is a breakdown of the headcount by actual number and average number:
Consolidated Income Comprehensive IncomeFinancial PositionCash Flow StatementConsolidated Net Debt ChangesNotes
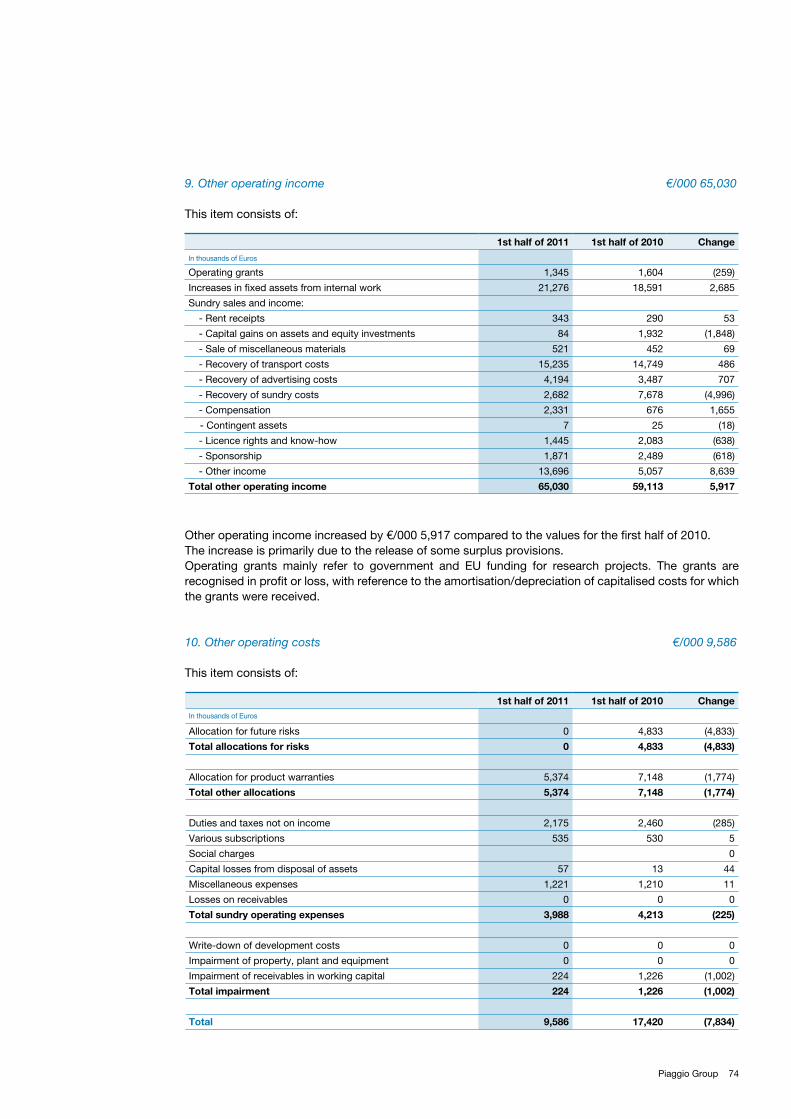
74Piaggio Group
9. Other operating income €/000 65,030
This item consists of:
1st half of 2011 1st half of 2010 Change
In thousands of Euros
Operating grants 1,345 1,604 (259)
Increases in fixed assets from internal work 21,276 18,591 2,685
Sundry sales and income:
- Rent receipts 343 290 53
- Capital gains on assets and equity investments 84 1,932 (1,848)
- Sale of miscellaneous materials 521 452 69
- Recovery of transport costs 15,235 14,749 486
- Recovery of advertising costs 4,194 3,487 707
- Recovery of sundry costs 2,682 7,678 (4,996)
- Compensation 2,331 676 1,655
- Contingent assets 7 25 (18)
- Licence rights and know-how 1,445 2,083 (638)
- Sponsorship 1,871 2,489 (618)
- Other income 13,696 5,057 8,639
Total other operating income 65,030 59,113 5,917
Other operating income increased by €/000 5,917 compared to the values for the first half of 2010. The increase is primarily due to the release of some surplus provisions. Operating grants mainly refer to government and EU funding for research projects. The grants are recognised in profit or loss, with reference to the amortisation/depreciation of capitalised costs for which the grants were received.
10. Other operating costs €/000 9,586
This item consists of:
1st half of 2011 1st half of 2010 ChangeIn thousands of Euros
Allocation for future risks 0 4,833 (4,833)
Total allocations for risks 0 4,833 (4,833)
Allocation for product warranties 5,374 7,148 (1,774)
Total other allocations 5,374 7,148 (1,774)
Duties and taxes not on income 2,175 2,460 (285)
Various subscriptions 535 530 5
Social charges 0
Capital losses from disposal of assets 57 13 44
Miscellaneous expenses 1,221 1,210 11
Losses on receivables 0 0 0
Total sundry operating expenses 3,988 4,213 (225)
Write-down of development costs 0 0 0
Impairment of property, plant and equipment 0 0 0
Impairment of receivables in working capital 224 1,226 (1,002)
Total impairment 224 1,226 (1,002)
Total 9,586 17,420 (7,834)
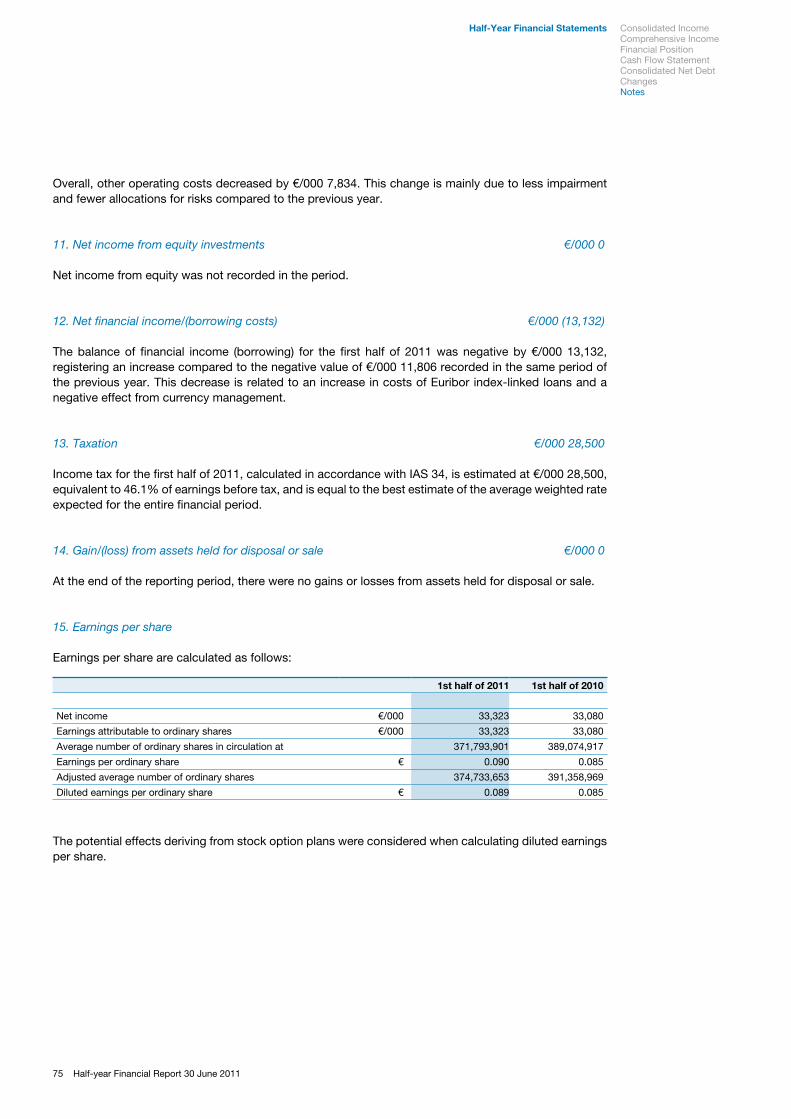
75 Half-year Financial Report 30 June 2011
Overall, other operating costs decreased by €/000 7,834. This change is mainly due to less impairment and fewer allocations for risks compared to the previous year.
11. Net income from equity investments €/000 0
Net income from equity was not recorded in the period.
12. Net financial income/(borrowing costs) €/000 (13,132)
The balance of financial income (borrowing) for the first half of 2011 was negative by €/000 13,132, registering an increase compared to the negative value of €/000 11,806 recorded in the same period of the previous year. This decrease is related to an increase in costs of Euribor index-linked loans and a negative effect from currency management.
13. Taxation €/000 28,500
Income tax for the first half of 2011, calculated in accordance with IAS 34, is estimated at €/000 28,500, equivalent to 46.1% of earnings before tax, and is equal to the best estimate of the average weighted rate expected for the entire financial period.
14. Gain/(loss) from assets held for disposal or sale €/000 0
At the end of the reporting period, there were no gains or losses from assets held for disposal or sale.
15. Earnings per share
Earnings per share are calculated as follows:
The potential effects deriving from stock option plans were considered when calculating diluted earnings per share.
Half-Year Financial Statements
1st half of 2011 1st half of 2010
Net income €/000 33,323 33,080
Earnings attributable to ordinary shares €/000 33,323 33,080
Average number of ordinary shares in circulation at 371,793,901 389,074,917
Earnings per ordinary share € 0.090 0.085
Adjusted average number of ordinary shares 374,733,653 391,358,969
Diluted earnings per ordinary share € 0.089 0.085
Consolidated Income Comprehensive IncomeFinancial PositionCash Flow StatementConsolidated Net Debt ChangesNotes
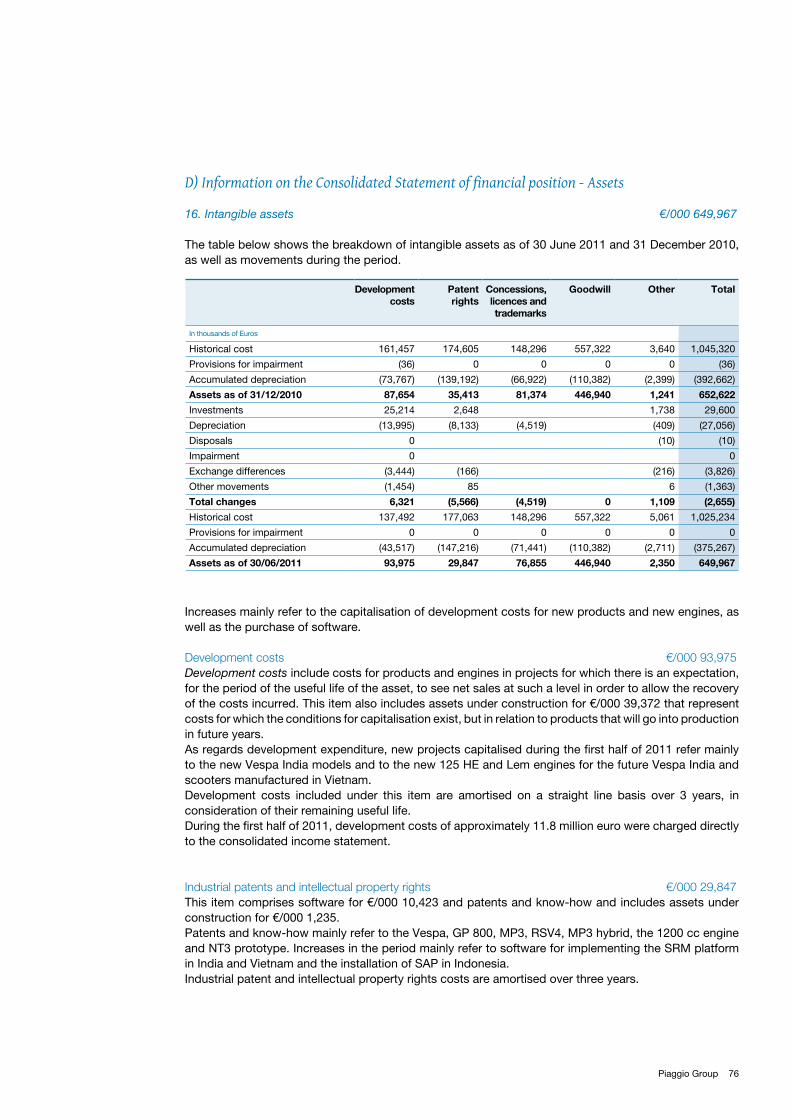
76Piaggio Group
D) Information on the Consolidated Statement of financial position - Assets
16. Intangible assets €/000 649,967
The table below shows the breakdown of intangible assets as of 30 June 2011 and 31 December 2010, as well as movements during the period.
Increases mainly refer to the capitalisation of development costs for new products and new engines, as well as the purchase of software.
Development costs €/000 93,975Development costs include costs for products and engines in projects for which there is an expectation, for the period of the useful life of the asset, to see net sales at such a level in order to allow the recovery of the costs incurred. This item also includes assets under construction for €/000 39,372 that represent costs for which the conditions for capitalisation exist, but in relation to products that will go into production in future years.As regards development expenditure, new projects capitalised during the first half of 2011 refer mainly to the new Vespa India models and to the new 125 HE and Lem engines for the future Vespa India and scooters manufactured in Vietnam.Development costs included under this item are amortised on a straight line basis over 3 years, in consideration of their remaining useful life.During the first half of 2011, development costs of approximately 11.8 million euro were charged directly to the consolidated income statement.
Industrial patents and intellectual property rights €/000 29,847This item comprises software for €/000 10,423 and patents and know-how and includes assets under construction for €/000 1,235.Patents and know-how mainly refer to the Vespa, GP 800, MP3, RSV4, MP3 hybrid, the 1200 cc engine and NT3 prototype. Increases in the period mainly refer to software for implementing the SRM platform in India and Vietnam and the installation of SAP in Indonesia.Industrial patent and intellectual property rights costs are amortised over three years.
Development costs
Patent rights
Concessions, licences and trademarks
Goodwill Other Total
In thousands of Euros
Historical cost 161,457 174,605 148,296 557,322 3,640 1,045,320
Provisions for impairment (36) 0 0 0 0 (36)
Accumulated depreciation (73,767) (139,192) (66,922) (110,382) (2,399) (392,662)
Assets as of 31/12/2010 87,654 35,413 81,374 446,940 1,241 652,622
Investments 25,214 2,648 1,738 29,600
Depreciation (13,995) (8,133) (4,519) (409) (27,056)
Disposals 0 (10) (10)
Impairment 0 0
Exchange differences (3,444) (166) (216) (3,826)
Other movements (1,454) 85 6 (1,363)
Total changes 6,321 (5,566) (4,519) 0 1,109 (2,655)
Historical cost 137,492 177,063 148,296 557,322 5,061 1,025,234
Provisions for impairment 0 0 0 0 0 0
Accumulated depreciation (43,517) (147,216) (71,441) (110,382) (2,711) (375,267)
Assets as of 30/06/2011 93,975 29,847 76,855 446,940 2,350 649,967
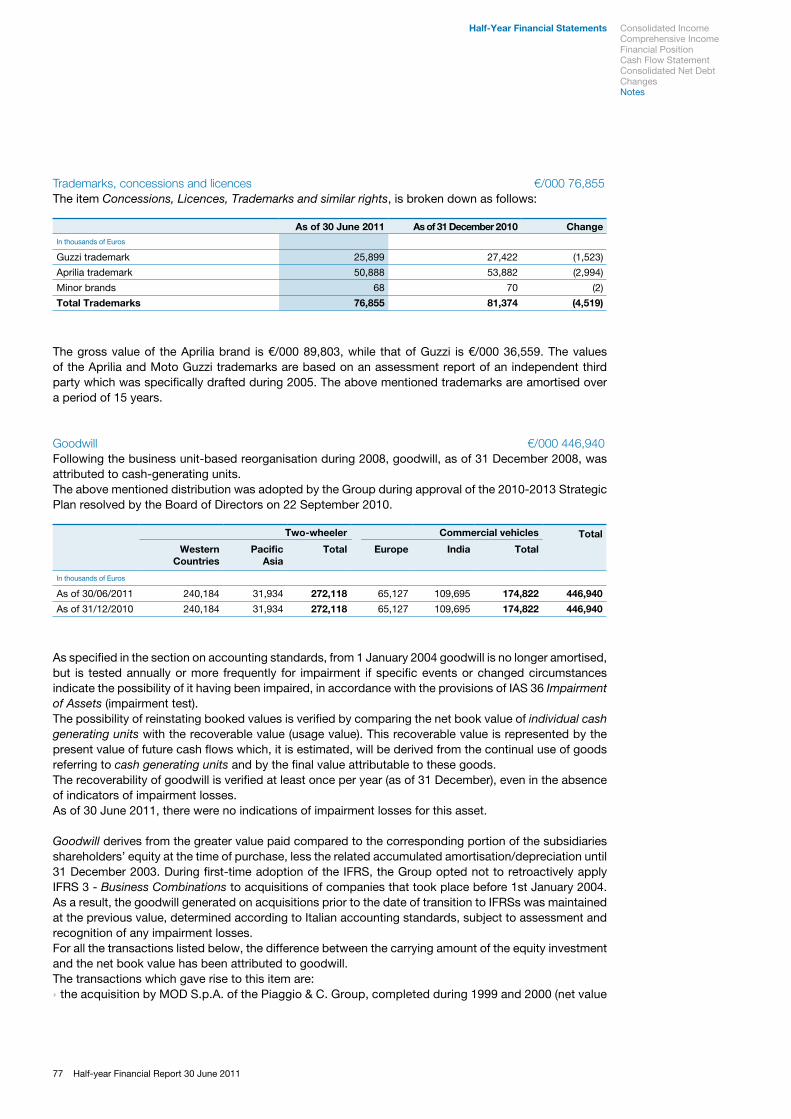
77 Half-year Financial Report 30 June 2011
Trademarks, concessions and licences €/000 76,855The item Concessions, Licences, Trademarks and similar rights, is broken down as follows:
As of 30 June 2011 As of 31 December 2010 ChangeIn thousands of Euros
Guzzi trademark 25,899 27,422 (1,523)
Aprilia trademark 50,888 53,882 (2,994)
Minor brands 68 70 (2)
Total Trademarks 76,855 81,374 (4,519)
The gross value of the Aprilia brand is €/000 89,803, while that of Guzzi is €/000 36,559. The values of the Aprilia and Moto Guzzi trademarks are based on an assessment report of an independent third party which was specifically drafted during 2005. The above mentioned trademarks are amortised over a period of 15 years.
Goodwill €/000 446,940Following the business unit-based reorganisation during 2008, goodwill, as of 31 December 2008, was attributed to cash-generating units.The above mentioned distribution was adopted by the Group during approval of the 2010-2013 Strategic Plan resolved by the Board of Directors on 22 September 2010.
Two-wheeler Commercial vehicles Total
Western Countries
Pacific Asia
Total Europe India Total
In thousands of Euros As of 30/06/2011 240,184 31,934 272,118 65,127 109,695 174,822 446,940
As of 31/12/2010 240,184 31,934 272,118 65,127 109,695 174,822 446,940
As specified in the section on accounting standards, from 1 January 2004 goodwill is no longer amortised, but is tested annually or more frequently for impairment if specific events or changed circumstances indicate the possibility of it having been impaired, in accordance with the provisions of IAS 36 Impairment of Assets (impairment test). The possibility of reinstating booked values is verified by comparing the net book value of individual cash generating units with the recoverable value (usage value). This recoverable value is represented by the present value of future cash flows which, it is estimated, will be derived from the continual use of goods referring to cash generating units and by the final value attributable to these goods. The recoverability of goodwill is verified at least once per year (as of 31 December), even in the absence of indicators of impairment losses. As of 30 June 2011, there were no indications of impairment losses for this asset.
Goodwill derives from the greater value paid compared to the corresponding portion of the subsidiaries shareholders’ equity at the time of purchase, less the related accumulated amortisation/depreciation until 31 December 2003. During first-time adoption of the IFRS, the Group opted not to retroactively apply IFRS 3 - Business Combinations to acquisitions of companies that took place before 1st January 2004. As a result, the goodwill generated on acquisitions prior to the date of transition to IFRSs was maintained at the previous value, determined according to Italian accounting standards, subject to assessment and recognition of any impairment losses.For all the transactions listed below, the difference between the carrying amount of the equity investment and the net book value has been attributed to goodwill.The transactions which gave rise to this item are:
the acquisition by MOD S.p.A. of the Piaggio & C. Group, completed during 1999 and 2000 (net value ›
Half-Year Financial Statements Consolidated Income Comprehensive IncomeFinancial PositionCash Flow StatementConsolidated Net Debt ChangesNotes
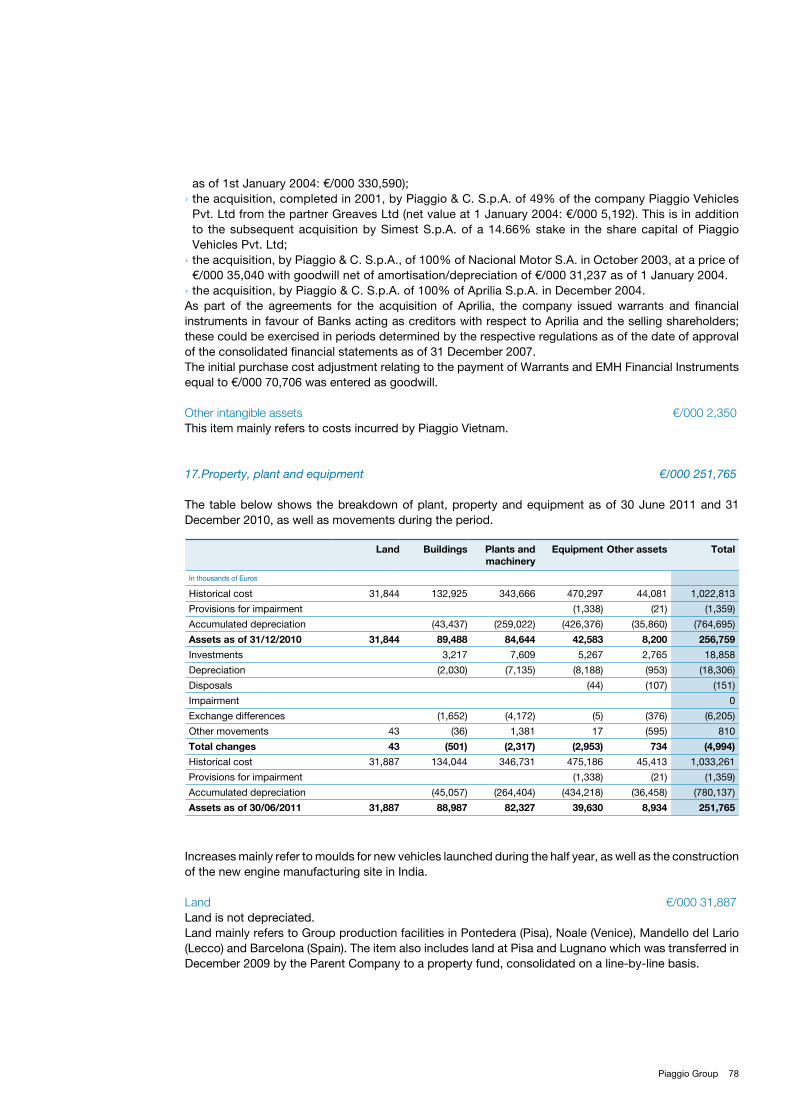
78Piaggio Group
as of 1st January 2004: €/000 330,590);the acquisition, completed in 2001, by Piaggio & C. S.p.A. of 49% of the company Piaggio Vehicles ›Pvt. Ltd from the partner Greaves Ltd (net value at 1 January 2004: €/000 5,192). This is in addition to the subsequent acquisition by Simest S.p.A. of a 14.66% stake in the share capital of Piaggio Vehicles Pvt. Ltd;the acquisition, by Piaggio & C. S.p.A., of 100% of Nacional Motor S.A. in October 2003, at a price of ›€/000 35,040 with goodwill net of amortisation/depreciation of €/000 31,237 as of 1 January 2004.the acquisition, by Piaggio & C. S.p.A. of 100% of Aprilia S.p.A. in December 2004. ›
As part of the agreements for the acquisition of Aprilia, the company issued warrants and financial instruments in favour of Banks acting as creditors with respect to Aprilia and the selling shareholders; these could be exercised in periods determined by the respective regulations as of the date of approval of the consolidated financial statements as of 31 December 2007. The initial purchase cost adjustment relating to the payment of Warrants and EMH Financial Instruments equal to €/000 70,706 was entered as goodwill.
Other intangible assets €/000 2,350This item mainly refers to costs incurred by Piaggio Vietnam.
17.Property, plant and equipment €/000 251,765
The table below shows the breakdown of plant, property and equipment as of 30 June 2011 and 31 December 2010, as well as movements during the period.
Land Buildings Plants and machinery
Equipment Other assets Total
In thousands of Euros
Historical cost 31,844 132,925 343,666 470,297 44,081 1,022,813
Provisions for impairment (1,338) (21) (1,359)
Accumulated depreciation (43,437) (259,022) (426,376) (35,860) (764,695)
Assets as of 31/12/2010 31,844 89,488 84,644 42,583 8,200 256,759
Investments 3,217 7,609 5,267 2,765 18,858
Depreciation (2,030) (7,135) (8,188) (953) (18,306)
Disposals (44) (107) (151)
Impairment 0
Exchange differences (1,652) (4,172) (5) (376) (6,205)
Other movements 43 (36) 1,381 17 (595) 810
Total changes 43 (501) (2,317) (2,953) 734 (4,994)
Historical cost 31,887 134,044 346,731 475,186 45,413 1,033,261
Provisions for impairment (1,338) (21) (1,359)
Accumulated depreciation (45,057) (264,404) (434,218) (36,458) (780,137)
Assets as of 30/06/2011 31,887 88,987 82,327 39,630 8,934 251,765
Increases mainly refer to moulds for new vehicles launched during the half year, as well as the construction of the new engine manufacturing site in India.
Land €/000 31,887Land is not depreciated.Land mainly refers to Group production facilities in Pontedera (Pisa), Noale (Venice), Mandello del Lario (Lecco) and Barcelona (Spain). The item also includes land at Pisa and Lugnano which was transferred in December 2009 by the Parent Company to a property fund, consolidated on a line-by-line basis.
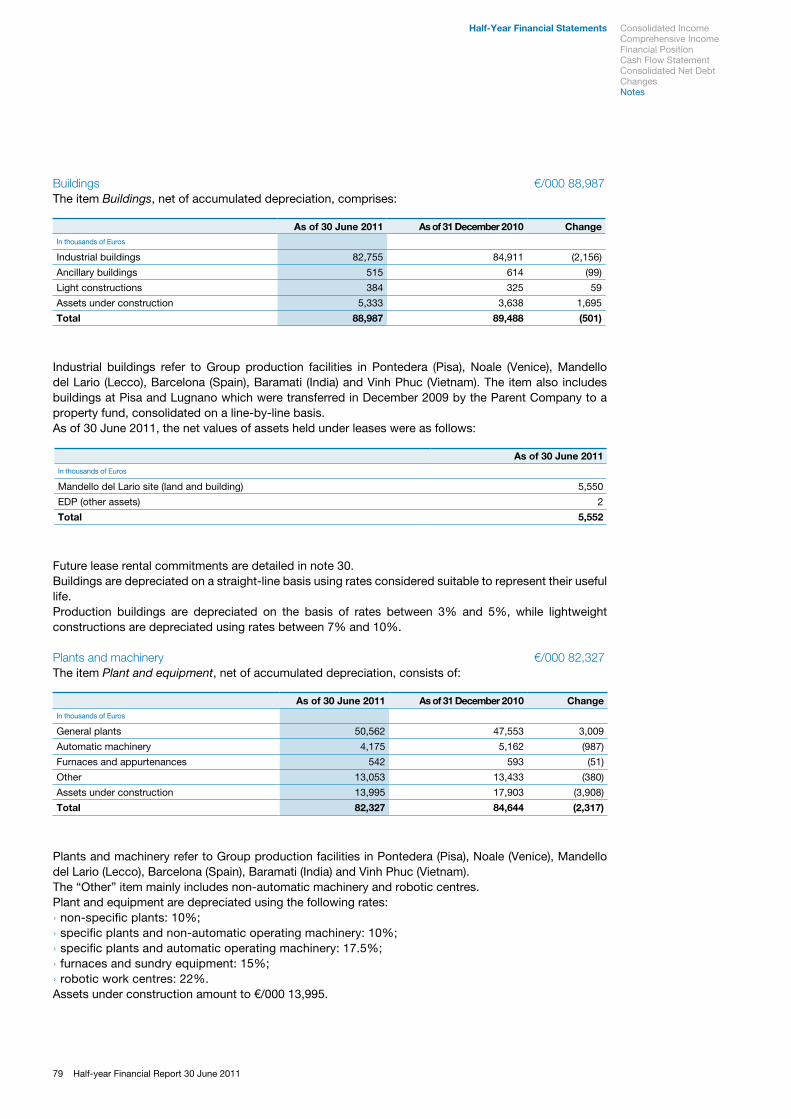
79 Half-year Financial Report 30 June 2011
Buildings €/000 88,987The item Buildings, net of accumulated depreciation, comprises:
As of 30 June 2011 As of 31 December 2010 ChangeIn thousands of Euros
Industrial buildings 82,755 84,911 (2,156)
Ancillary buildings 515 614 (99)
Light constructions 384 325 59
Assets under construction 5,333 3,638 1,695
Total 88,987 89,488 (501)
Industrial buildings refer to Group production facilities in Pontedera (Pisa), Noale (Venice), Mandello del Lario (Lecco), Barcelona (Spain), Baramati (India) and Vinh Phuc (Vietnam). The item also includes buildings at Pisa and Lugnano which were transferred in December 2009 by the Parent Company to a property fund, consolidated on a line-by-line basis.As of 30 June 2011, the net values of assets held under leases were as follows:
As of 30 June 2011In thousands of Euros
Mandello del Lario site (land and building) 5,550
EDP (other assets) 2
Total 5,552
Future lease rental commitments are detailed in note 30.Buildings are depreciated on a straight-line basis using rates considered suitable to represent their useful life.Production buildings are depreciated on the basis of rates between 3% and 5%, while lightweight constructions are depreciated using rates between 7% and 10%.
Plants and machinery €/000 82,327The item Plant and equipment, net of accumulated depreciation, consists of:
As of 30 June 2011 As of 31 December 2010 ChangeIn thousands of Euros
General plants 50,562 47,553 3,009
Automatic machinery 4,175 5,162 (987)
Furnaces and appurtenances 542 593 (51)
Other 13,053 13,433 (380)
Assets under construction 13,995 17,903 (3,908)
Total 82,327 84,644 (2,317)
Plants and machinery refer to Group production facilities in Pontedera (Pisa), Noale (Venice), Mandello del Lario (Lecco), Barcelona (Spain), Baramati (India) and Vinh Phuc (Vietnam).The “Other” item mainly includes non-automatic machinery and robotic centres.Plant and equipment are depreciated using the following rates:
non-specific plants: 10%; ›specific plants and non-automatic operating machinery: 10%; ›specific plants and automatic operating machinery: 17.5%; ›furnaces and sundry equipment: 15%; ›robotic work centres: 22%. ›
Assets under construction amount to €/000 13,995.
Half-Year Financial Statements Consolidated Income Comprehensive IncomeFinancial PositionCash Flow StatementConsolidated Net Debt ChangesNotes
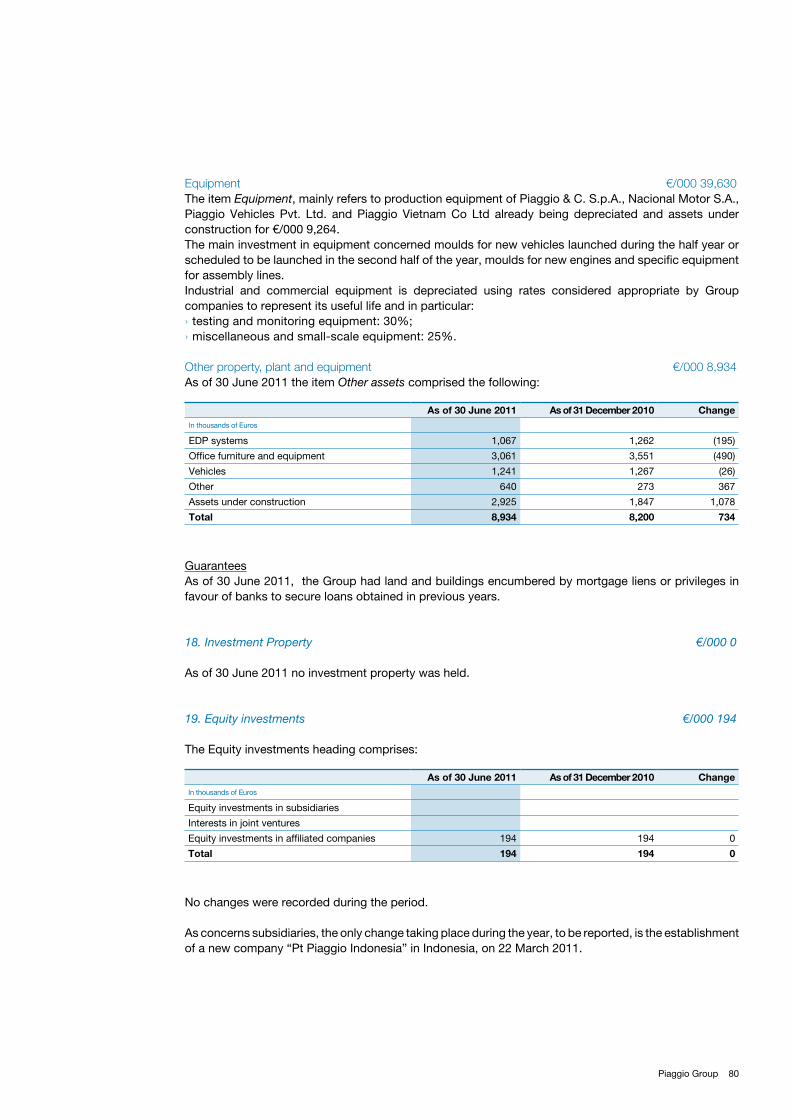
80Piaggio Group
Equipment €/000 39,630The item Equipment, mainly refers to production equipment of Piaggio & C. S.p.A., Nacional Motor S.A., Piaggio Vehicles Pvt. Ltd. and Piaggio Vietnam Co Ltd already being depreciated and assets under construction for €/000 9,264.The main investment in equipment concerned moulds for new vehicles launched during the half year or scheduled to be launched in the second half of the year, moulds for new engines and specific equipment for assembly lines.Industrial and commercial equipment is depreciated using rates considered appropriate by Group companies to represent its useful life and in particular:
testing and monitoring equipment: 30%; ›miscellaneous and small-scale equipment: 25%. ›
Other property, plant and equipment €/000 8,934As of 30 June 2011 the item Other assets comprised the following:
As of 30 June 2011 As of 31 December 2010 ChangeIn thousands of Euros
EDP systems 1,067 1,262 (195)
Office furniture and equipment 3,061 3,551 (490)
Vehicles 1,241 1,267 (26)
Other 640 273 367
Assets under construction 2,925 1,847 1,078
Total 8,934 8,200 734
GuaranteesAs of 30 June 2011, the Group had land and buildings encumbered by mortgage liens or privileges in favour of banks to secure loans obtained in previous years.
18. Investment Property €/000 0
As of 30 June 2011 no investment property was held.
19. Equity investments €/000 194
The Equity investments heading comprises:
As of 30 June 2011 As of 31 December 2010 ChangeIn thousands of Euros
Equity investments in subsidiaries
Interests in joint ventures
Equity investments in affiliated companies 194 194 0
Total 194 194 0
No changes were recorded during the period.
As concerns subsidiaries, the only change taking place during the year, to be reported, is the establishment of a new company “Pt Piaggio Indonesia” in Indonesia, on 22 March 2011.
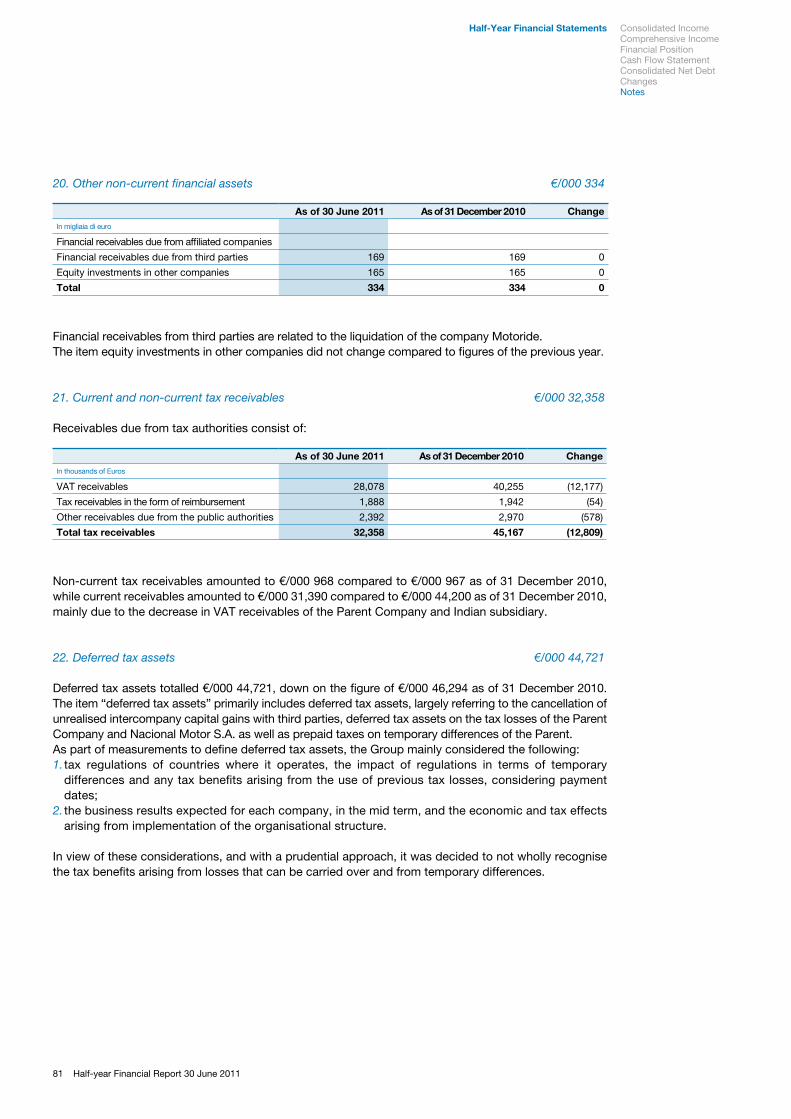
81 Half-year Financial Report 30 June 2011
20. Other non-current financial assets €/000 334
As of 30 June 2011 As of 31 December 2010 ChangeIn migliaia di euro
Financial receivables due from affiliated companies
Financial receivables due from third parties 169 169 0
Equity investments in other companies 165 165 0
Total 334 334 0
Financial receivables from third parties are related to the liquidation of the company Motoride.The item equity investments in other companies did not change compared to figures of the previous year.
21. Current and non-current tax receivables €/000 32,358
Receivables due from tax authorities consist of:
As of 30 June 2011 As of 31 December 2010 ChangeIn thousands of Euros
VAT receivables 28,078 40,255 (12,177)
Tax receivables in the form of reimbursement 1,888 1,942 (54)
Other receivables due from the public authorities 2,392 2,970 (578)
Total tax receivables 32,358 45,167 (12,809)
Non-current tax receivables amounted to €/000 968 compared to €/000 967 as of 31 December 2010, while current receivables amounted to €/000 31,390 compared to €/000 44,200 as of 31 December 2010, mainly due to the decrease in VAT receivables of the Parent Company and Indian subsidiary.
22. Deferred tax assets €/000 44,721
Deferred tax assets totalled €/000 44,721, down on the figure of €/000 46,294 as of 31 December 2010. The item “deferred tax assets” primarily includes deferred tax assets, largely referring to the cancellation of unrealised intercompany capital gains with third parties, deferred tax assets on the tax losses of the Parent Company and Nacional Motor S.A. as well as prepaid taxes on temporary differences of the Parent.As part of measurements to define deferred tax assets, the Group mainly considered the following:
tax regulations of countries where it operates, the impact of regulations in terms of temporary 1. differences and any tax benefits arising from the use of previous tax losses, considering payment dates;the business results expected for each company, in the mid term, and the economic and tax effects 2. arising from implementation of the organisational structure.
In view of these considerations, and with a prudential approach, it was decided to not wholly recognise the tax benefits arising from losses that can be carried over and from temporary differences.
Half-Year Financial Statements Consolidated Income Comprehensive IncomeFinancial PositionCash Flow StatementConsolidated Net Debt ChangesNotes
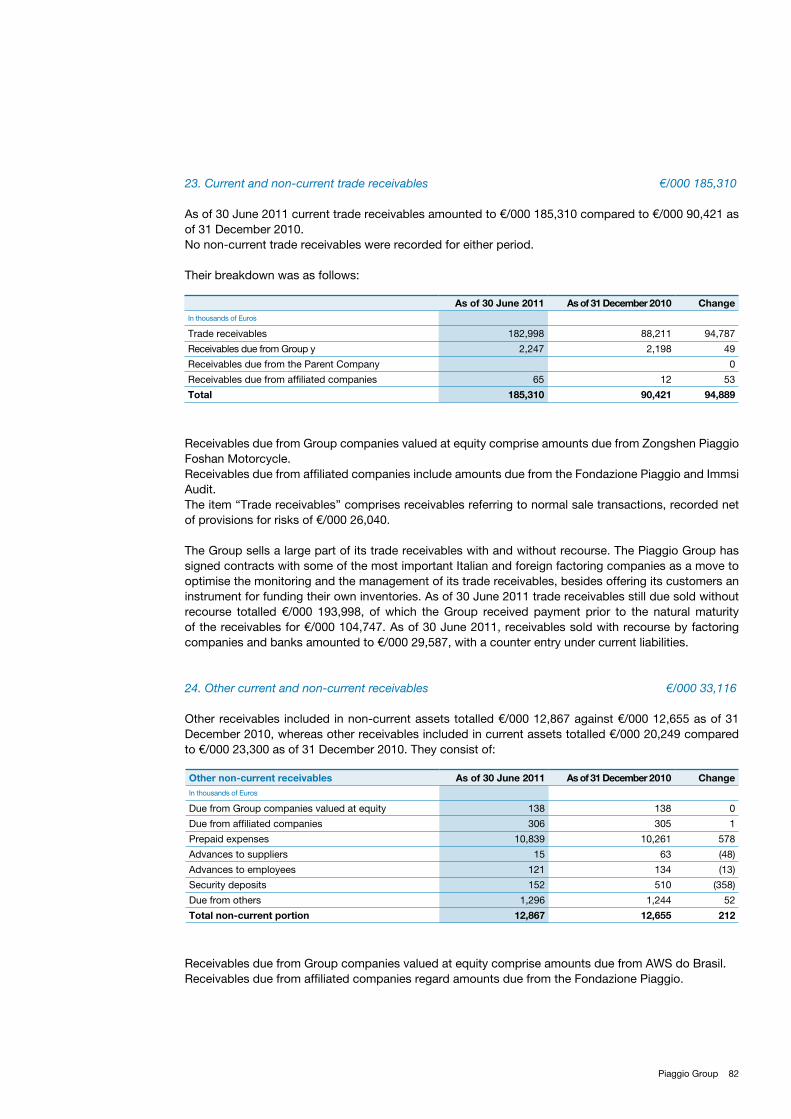
82Piaggio Group
23. Current and non-current trade receivables €/000 185,310
As of 30 June 2011 current trade receivables amounted to €/000 185,310 compared to €/000 90,421 as of 31 December 2010. No non-current trade receivables were recorded for either period.
Their breakdown was as follows:
As of 30 June 2011 As of 31 December 2010 ChangeIn thousands of Euros
Trade receivables 182,998 88,211 94,787
Receivables due from Group y 2,247 2,198 49
Receivables due from the Parent Company 0
Receivables due from affiliated companies 65 12 53
Total 185,310 90,421 94,889
Receivables due from Group companies valued at equity comprise amounts due from Zongshen Piaggio Foshan Motorcycle.Receivables due from affiliated companies include amounts due from the Fondazione Piaggio and Immsi Audit.The item “Trade receivables” comprises receivables referring to normal sale transactions, recorded net of provisions for risks of €/000 26,040.
The Group sells a large part of its trade receivables with and without recourse. The Piaggio Group has signed contracts with some of the most important Italian and foreign factoring companies as a move to optimise the monitoring and the management of its trade receivables, besides offering its customers an instrument for funding their own inventories. As of 30 June 2011 trade receivables still due sold without recourse totalled €/000 193,998, of which the Group received payment prior to the natural maturity of the receivables for €/000 104,747. As of 30 June 2011, receivables sold with recourse by factoring companies and banks amounted to €/000 29,587, with a counter entry under current liabilities.
24. Other current and non-current receivables €/000 33,116
Other receivables included in non-current assets totalled €/000 12,867 against €/000 12,655 as of 31 December 2010, whereas other receivables included in current assets totalled €/000 20,249 compared to €/000 23,300 as of 31 December 2010. They consist of:
Other non-current receivables As of 30 June 2011 As of 31 December 2010 ChangeIn thousands of Euros
Due from Group companies valued at equity 138 138 0
Due from affiliated companies 306 305 1
Prepaid expenses 10,839 10,261 578
Advances to suppliers 15 63 (48)
Advances to employees 121 134 (13)
Security deposits 152 510 (358)
Due from others 1,296 1,244 52
Total non-current portion 12,867 12,655 212
Receivables due from Group companies valued at equity comprise amounts due from AWS do Brasil.Receivables due from affiliated companies regard amounts due from the Fondazione Piaggio.
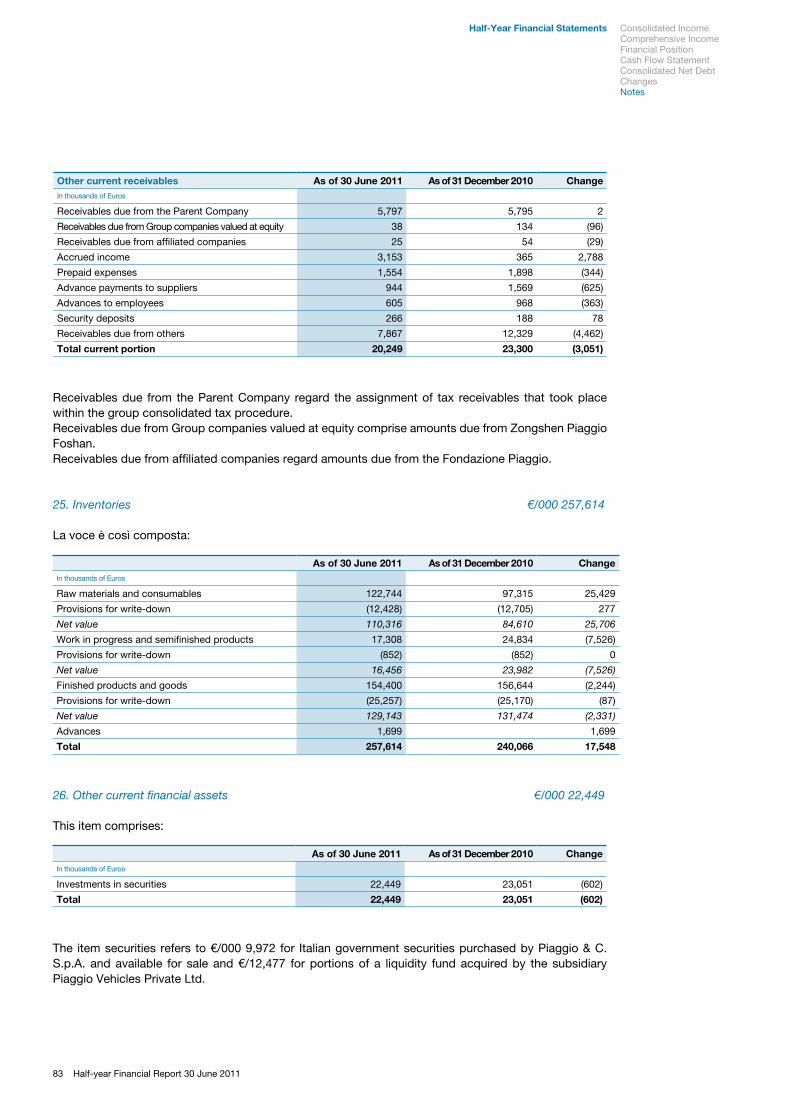
83 Half-year Financial Report 30 June 2011
Other current receivables As of 30 June 2011 As of 31 December 2010 ChangeIn thousands of Euros
Receivables due from the Parent Company 5,797 5,795 2
Receivables due from Group companies valued at equity 38 134 (96)
Receivables due from affiliated companies 25 54 (29)
Accrued income 3,153 365 2,788
Prepaid expenses 1,554 1,898 (344)
Advance payments to suppliers 944 1,569 (625)
Advances to employees 605 968 (363)
Security deposits 266 188 78
Receivables due from others 7,867 12,329 (4,462)
Total current portion 20,249 23,300 (3,051)
Receivables due from the Parent Company regard the assignment of tax receivables that took place within the group consolidated tax procedure. Receivables due from Group companies valued at equity comprise amounts due from Zongshen Piaggio Foshan.Receivables due from affiliated companies regard amounts due from the Fondazione Piaggio.
25. Inventories €/000 257,614
La voce è così composta:
As of 30 June 2011 As of 31 December 2010 ChangeIn thousands of Euros
Raw materials and consumables 122,744 97,315 25,429
Provisions for write-down (12,428) (12,705) 277
Net value 110,316 84,610 25,706
Work in progress and semifinished products 17,308 24,834 (7,526)
Provisions for write-down (852) (852) 0
Net value 16,456 23,982 (7,526)
Finished products and goods 154,400 156,644 (2,244)
Provisions for write-down (25,257) (25,170) (87)
Net value 129,143 131,474 (2,331)
Advances 1,699 1,699
Total 257,614 240,066 17,548
26. Other current financial assets €/000 22,449
This item comprises:
As of 30 June 2011 As of 31 December 2010 ChangeIn thousands of Euros
Investments in securities 22,449 23,051 (602)
Total 22,449 23,051 (602)
The item securities refers to €/000 9,972 for Italian government securities purchased by Piaggio & C. S.p.A. and available for sale and €/12,477 for portions of a liquidity fund acquired by the subsidiary Piaggio Vehicles Private Ltd.
Half-Year Financial Statements Consolidated Income Comprehensive IncomeFinancial PositionCash Flow StatementConsolidated Net Debt ChangesNotes
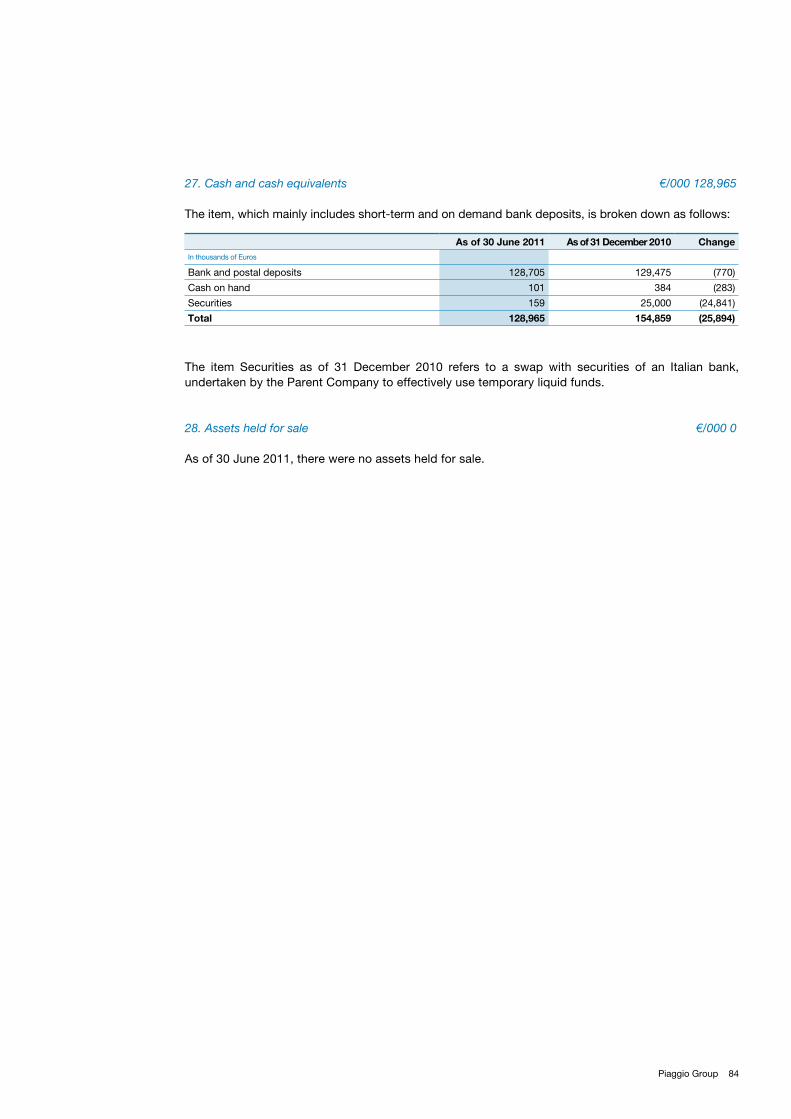
84Piaggio Group
27. Cash and cash equivalents €/000 128,965
The item, which mainly includes short-term and on demand bank deposits, is broken down as follows:
As of 30 June 2011 As of 31 December 2010 ChangeIn thousands of Euros
Bank and postal deposits 128,705 129,475 (770)
Cash on hand 101 384 (283)
Securities 159 25,000 (24,841)
Total 128,965 154,859 (25,894)
The item Securities as of 31 December 2010 refers to a swap with securities of an Italian bank, undertaken by the Parent Company to effectively use temporary liquid funds.
28. Assets held for sale €/000 0
As of 30 June 2011, there were no assets held for sale.
85 Half-year Financial Report 30 June 2011
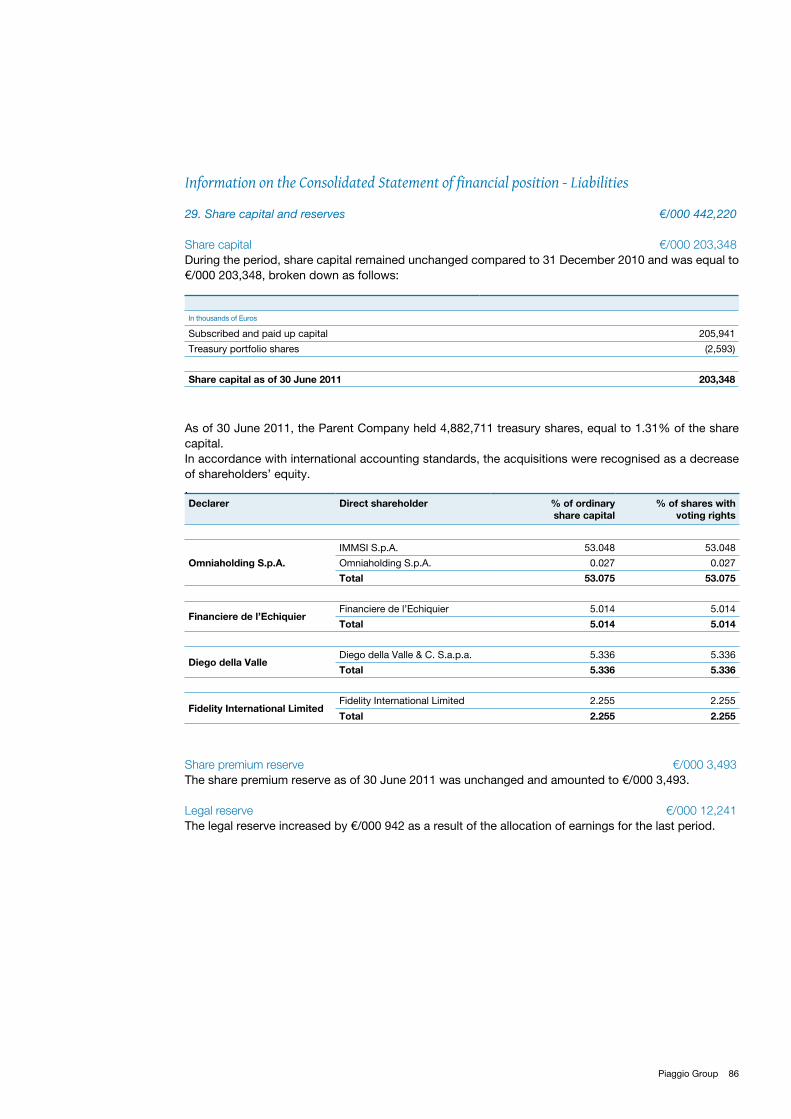
86Piaggio Group
Information on the Consolidated Statement of financial position - Liabilities
29. Share capital and reserves €/000 442,220
Share capital €/000 203,348During the period, share capital remained unchanged compared to 31 December 2010 and was equal to €/000 203,348, broken down as follows:
In thousands of Euros
Subscribed and paid up capital 205,941
Treasury portfolio shares (2,593)
Share capital as of 30 June 2011 203,348
Declarer Direct shareholder % of ordinary share capital
% of shares with voting rights
Omniaholding S.p.A.
IMMSI S.p.A. 53.048 53.048
Omniaholding S.p.A. 0.027 0.027
Total 53.075 53.075
Financiere de l’EchiquierFinanciere de l’Echiquier 5.014 5.014
Total 5.014 5.014
Diego della ValleDiego della Valle & C. S.a.p.a. 5.336 5.336
Total 5.336 5.336
Fidelity International LimitedFidelity International Limited 2.255 2.255
Total 2.255 2.255
As of 30 June 2011, the Parent Company held 4,882,711 treasury shares, equal to 1.31% of the share capital.In accordance with international accounting standards, the acquisitions were recognised as a decrease of shareholders’ equity..
Share premium reserve €/000 3,493The share premium reserve as of 30 June 2011 was unchanged and amounted to €/000 3,493.
Legal reserve €/000 12,241 The legal reserve increased by €/000 942 as a result of the allocation of earnings for the last period.
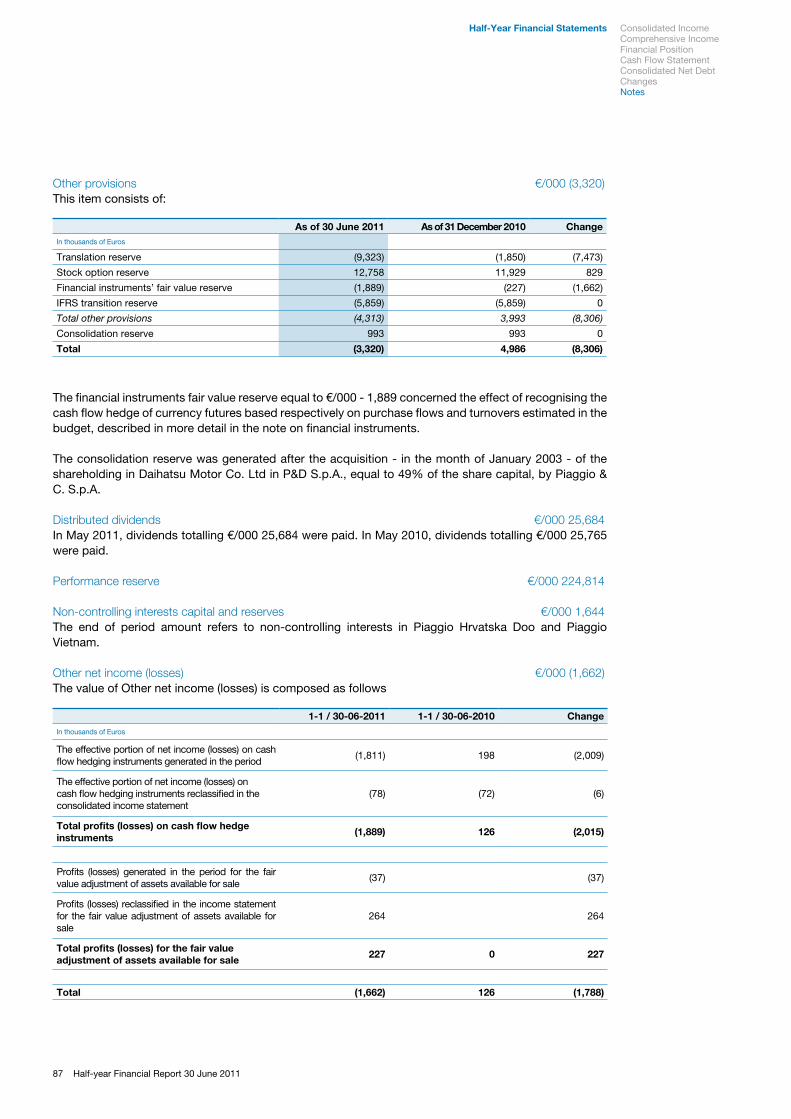
87 Half-year Financial Report 30 June 2011
Other provisions €/000 (3,320)This item consists of:
As of 30 June 2011 As of 31 December 2010 ChangeIn thousands of Euros
Translation reserve (9,323) (1,850) (7,473)
Stock option reserve 12,758 11,929 829
Financial instruments’ fair value reserve (1,889) (227) (1,662)
IFRS transition reserve (5,859) (5,859) 0
Total other provisions (4,313) 3,993 (8,306)
Consolidation reserve 993 993 0
Total (3,320) 4,986 (8,306)
The financial instruments fair value reserve equal to €/000 - 1,889 concerned the effect of recognising the cash flow hedge of currency futures based respectively on purchase flows and turnovers estimated in the budget, described in more detail in the note on financial instruments.
The consolidation reserve was generated after the acquisition - in the month of January 2003 - of the shareholding in Daihatsu Motor Co. Ltd in P&D S.p.A., equal to 49% of the share capital, by Piaggio & C. S.p.A.
Distributed dividends €/000 25,684In May 2011, dividends totalling €/000 25,684 were paid. In May 2010, dividends totalling €/000 25,765 were paid.
Performance reserve €/000 224,814
Non-controlling interests capital and reserves €/000 1,644The end of period amount refers to non-controlling interests in Piaggio Hrvatska Doo and Piaggio Vietnam.
Other net income (losses) €/000 (1,662)The value of Other net income (losses) is composed as follows
1-1 / 30-06-2011 1-1 / 30-06-2010 ChangeIn thousands of Euros
The effective portion of net income (losses) on cash flow hedging instruments generated in the period
(1,811) 198 (2,009)
The effective portion of net income (losses) on cash flow hedging instruments reclassified in the consolidated income statement
(78) (72) (6)
Total profits (losses) on cash flow hedge instruments
(1,889) 126 (2,015)
Profits (losses) generated in the period for the fair value adjustment of assets available for sale
(37) (37)
Profits (losses) reclassified in the income statement for the fair value adjustment of assets available for sale
264 264
Total profits (losses) for the fair value adjustment of assets available for sale
227 0 227
Total (1,662) 126 (1,788)
Half-Year Financial Statements Consolidated Income Comprehensive IncomeFinancial PositionCash Flow StatementConsolidated Net Debt ChangesNotes
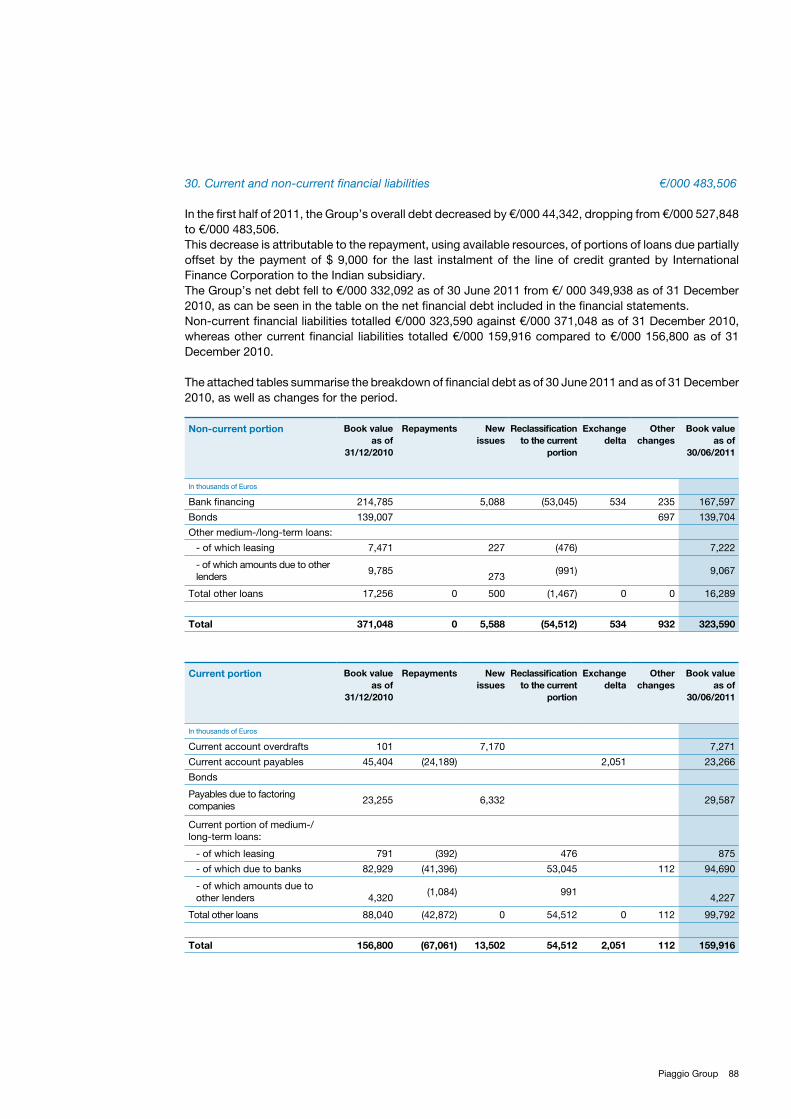
88Piaggio Group
30. Current and non-current financial liabilities €/000 483,506
In the first half of 2011, the Group’s overall debt decreased by €/000 44,342, dropping from €/000 527,848 to €/000 483,506.This decrease is attributable to the repayment, using available resources, of portions of loans due partially offset by the payment of $ 9,000 for the last instalment of the line of credit granted by International Finance Corporation to the Indian subsidiary.The Group’s net debt fell to €/000 332,092 as of 30 June 2011 from €/ 000 349,938 as of 31 December 2010, as can be seen in the table on the net financial debt included in the financial statements.Non-current financial liabilities totalled €/000 323,590 against €/000 371,048 as of 31 December 2010, whereas other current financial liabilities totalled €/000 159,916 compared to €/000 156,800 as of 31 December 2010. The attached tables summarise the breakdown of financial debt as of 30 June 2011 and as of 31 December 2010, as well as changes for the period.
Non-current portion Book value as of
31/12/2010
Repayments New issues
Reclassification to the current
portion
Exchange delta
Other changes
Book value as of
30/06/2011
In thousands of Euros
Bank financing 214,785 5,088 (53,045) 534 235 167,597
Bonds 139,007 697 139,704
Other medium-/long-term loans:
- of which leasing 7,471 227 (476) 7,222
- of which amounts due to other lenders
9,785
273 (991) 9,067
Total other loans 17,256 0 500 (1,467) 0 0 16,289
Total 371,048 0 5,588 (54,512) 534 932 323,590
Current portion Book value as of
31/12/2010
Repayments New issues
Reclassification to the current
portion
Exchange delta
Other changes
Book value as of
30/06/2011
In thousands of Euros
Current account overdrafts 101 7,170 7,271
Current account payables 45,404 (24,189) 2,051 23,266
Bonds
Payables due to factoring companies
23,255 6,332 29,587
Current portion of medium-/long-term loans:
- of which leasing 791 (392) 476 875
- of which due to banks 82,929 (41,396) 53,045 112 94,690
- of which amounts due to other lenders
4,320
(1,084) 991
4,227
Total other loans 88,040 (42,872) 0 54,512 0 112 99,792
Total 156,800 (67,061) 13,502 54,512 2,051 112 159,916
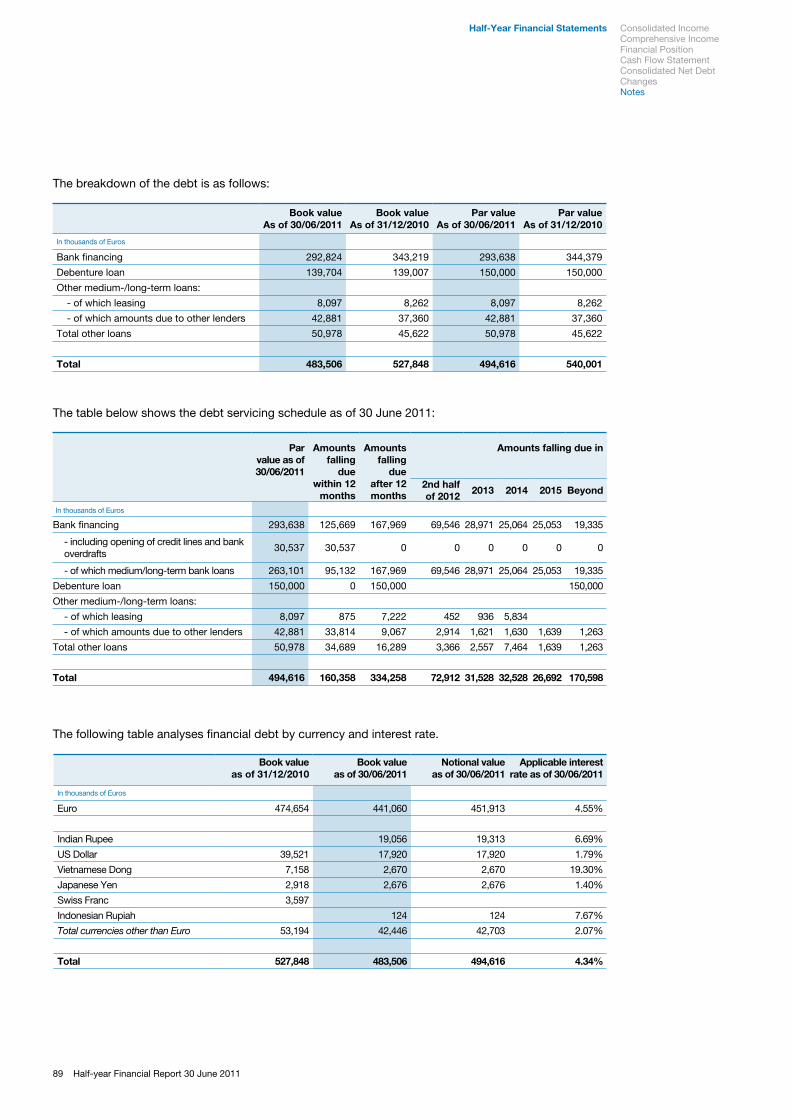
89 Half-year Financial Report 30 June 2011
The breakdown of the debt is as follows:
Book valueAs of 30/06/2011
Book valueAs of 31/12/2010
Par valueAs of 30/06/2011
Par valueAs of 31/12/2010
In thousands of Euros
Bank financing 292,824 343,219 293,638 344,379
Debenture loan 139,704 139,007 150,000 150,000
Other medium-/long-term loans:
- of which leasing 8,097 8,262 8,097 8,262
- of which amounts due to other lenders 42,881 37,360 42,881 37,360
Total other loans 50,978 45,622 50,978 45,622
Total 483,506 527,848 494,616 540,001
The table below shows the debt servicing schedule as of 30 June 2011:
The following table analyses financial debt by currency and interest rate.
Book valueas of 31/12/2010
Book valueas of 30/06/2011
Notional valueas of 30/06/2011
Applicable interest rate as of 30/06/2011
In thousands of Euros
Euro 474,654 441,060 451,913 4.55%
Indian Rupee 19,056 19,313 6.69%
US Dollar 39,521 17,920 17,920 1.79%
Vietnamese Dong 7,158 2,670 2,670 19.30%
Japanese Yen 2,918 2,676 2,676 1.40%
Swiss Franc 3,597
Indonesian Rupiah 124 124 7.67%
Total currencies other than Euro 53,194 42,446 42,703 2.07%
Total 527,848 483,506 494,616 4.34%
Half-Year Financial Statements
Parvalue as of 30/06/2011
Amounts falling
due within 12
months
Amounts falling
due after 12 months
Amounts falling due in
2nd half of 2012
2013 2014 2015 Beyond
In thousands of Euros
Bank financing 293,638 125,669 167,969 69,546 28,971 25,064 25,053 19,335
- including opening of credit lines and bank overdrafts
30,537 30,537 0 0 0 0 0 0
- of which medium/long-term bank loans 263,101 95,132 167,969 69,546 28,971 25,064 25,053 19,335
Debenture loan 150,000 0 150,000 150,000
Other medium-/long-term loans:
- of which leasing 8,097 875 7,222 452 936 5,834
- of which amounts due to other lenders 42,881 33,814 9,067 2,914 1,621 1,630 1,639 1,263
Total other loans 50,978 34,689 16,289 3,366 2,557 7,464 1,639 1,263
Total 494,616 160,358 334,258 72,912 31,528 32,528 26,692 170,598
Consolidated Income Comprehensive IncomeFinancial PositionCash Flow StatementConsolidated Net Debt ChangesNotes
90Piaggio Group
Medium and long-term bank debt amounts to €/000 262,287 (of which €/000 167,597 non-current and €/000 94,690 current) and consists of the following loans:
a €/000 107,143 medium-term loan from the European Investment Bank to finance Research & ›Development investments planned for the period 2009-2012. The loan will fall due in February 2016 and has an initial amortisation quota of 14 six-monthly instalments to be repaid at a variable rate equal to the six-month Euribor plus a spread of 1.323%. The contractual terms envisage loan covenants but exclude guarantees. It should be noted that, in reference to the 2010 period, these parameters were comfortably met;a €/000 89,585 (par value €/000 90,000) medium-term loan from a pool of banks granted in July 2009 ›to the Parent Company by Banca Nazionale del Lavoro as banking agent and paid in August 2009. The loan will fall due in August 2012, with an initial grace period of 18 months and three six-monthly instalments. The economic terms provide for a variable interest rate linked to the six-month Euribor rate plus an initial margin of 1.90%. This margin may vary from a minimum of 1.65% to a maximum of 2.20% based on the Net financial debt / Ebitda ratio (as of 30 June 2011 this margin was equal to 1.90%). Guarantees are not issued. However in line with market practice, some financial parameters must be complied with. It should be noted that, in reference to the first half of 2011, these parameters were comfortably met;€/000 28,358 (par value €/000 28,500) loan to the Parent company from Mediobanca and Banca Intesa ›San Paolo. In April 2006, this loan was syndicated to a restricted pool of banks and is part of a more articulated loan package. The loan package consisted of an initial instalment of €/000 150,000 (par value) which has been fully drawn on (as of 30 June 2011 €/000 28,500 was still due) and a second instalment of €/000 100,000 to be used as a credit line (still unused as of 30 June 2011). The structure envisages a 7-year term, with a grace period of 18 months and 11 six-monthly instalments with the last maturity on 23 December 2012 for the loan instalment, a variable interest rate linked to the six-month Euribor rate to which a variable spread between a maximum of 2.10% and a minimum of 0.65% is added depending on the Net Financial Debt/EBITDA ratio (as of 30 June 2011 this margin was equal to 1.15%). For the instalment relating to the credit line there is a commitment fee of 0.25%. Guarantees are not issued. However in line with market practice, some financial parameters must be complied with. It should be noted that, in reference to the first half of 2011, these parameters were comfortably met;a €/000 15,625 five-year unsecured loan from Interbanca entered into in September 2008; ›a €/000 491 loan from Interbanca in accordance with Law 346/88 regarding subsidies for applied ›research, secured by a mortgage lien on property;€/000 2,691 as a non-interest bearing loan originally granted by Banca Antonveneta to a subsidiary of ›the Aprilia Group following the acquisition charged to the Parent Company; the lump sum due date is in 2011; a €/000 1,145 subsidised loan from Banca Intesa San Paolo under Law 346/88 regarding applied ›research;a €/000 2,901 subsidised loan from Banca Intesa San Paolo under Law 346/88 regarding applied ›research;a €/000 1,500 eight-year subsidised loan from ICCREA in December 2008 granted under Law 100/90 ›and linked to the SIMEST equity investment in the Vietnamese company;€/000 12,848 (nominal amount €/000 13,105) medium-term loan for USD/000 19,000 granted by ›International Finance Corporation (a World Bank member) to the subsidiary Piaggio Vehicles Private Limited on which interest matures at a variable rate plus a margin of 2.55%. The loan will fall due on 15 January 2018 and has an amortisation quota of six-monthly instalments from January 2014. A guarantee has been provided by the Parent Company and, in line with market practice, some financial parameters must be met. It should be noted that, in reference to the first half of 2011, these parameters were comfortably met.
The item Bonds amounting to €/000 139,704 (nominal value €/000 150,000) refers to the high-yield debenture loan issued on 4 December 2009 by the Parent Company Piaggio & C. S.p.A., for a nominal amount of €/000 150,000, falling due on 1 December 2016 and with a semi-annual coupon with fixed
91 Half-year Financial Report 30 June 2011
annual nominal rate of 7%. Standard & Poor’s and Moody’s confirmed their ratings of BB and Ba2 in 2010, both revising their outlook from negative to stable.
The items Medium-/long-term bank debt and Bonds include loans which, in accounting terms, have been recognised on an amortised cost basis (pooled loan BNL, pooled loan Mediobanca/Intesa, International Finance Corporation loan and debenture loan). According to this criterion, the nominal amount of the liability is decreased by the amount of relative costs of issue and/or stipulation, in addition to any costs relating to refinancing of previous liabilities. The amortisation of these costs is determined on an effective interest rate basis, and namely the rate which discounts the future flows of interest payable and reimbursements of capital at the net carrying amount of the financial liability.
Medium-/long-term payables due to other lenders amount to €/000 21,391 (of which €/000 16,289 falling due beyond twelve months; €/000 5,102 is the current portion of other loans). These are broken down as follows:
property lease of €/000 8,097 granted by Unicredit Leasing to the merged Moto Guzzi S.p.A. (non- ›current portion equal to €/000 7,222); subsidised loans for a total of €/000 13,294 provided by the Ministry of Economic Development ›and Ministry of Education using regulations to encourage exports and investment in research and development (non-current portion of €/000 9,067).
Advances from factoring operations with recourse relative to trade receivables are equal to €/000 29,587.
Financial instrumentsExchange RiskIn the first half of 2011, the exchange risk was managed in line with Group policy, which aims to neutralise the possible negative effects of exchange rate changes on company cash-flow, by hedging the business risk which concerns changes in company profitability compared to the annual business budget on the basis of a key change (the so-called “budget change”) and of the transaction risk, which concerns the differences between the exchange rate recorded in the financial statements for receivables or payables in foreign currency and that recorded in the related receipt or payment. Exposure to the business risk consists of envisaged payables and receivables in foreign currency, taken from the budget for sales and purchases reclassified by currency and accrued on a monthly basis. Exposure to the settlement risk consists of receivables and payables in foreign currency acquired in the accounting system at any moment. The hedge must at all times be equal to 100% of the import, export or net settlement exposure for each currency.As regards contracts in place to hedge the exchange risk of foreign transactions (business risk), as of 30 June 2011 Piaggio & C. S.p.A. had in place the following forward purchase contracts (accounted for on a regulation date basis):
for a value of CHF/000 1,400 corresponding to €/000 1,176 (valued at the forward exchange rate), ›with average maturity on 15 July 2011;for a value of GBP/000 5,330 corresponding to €/000 5,988 (valued at the forward exchange rate), ›with average maturity on 12 August 2011;for a value of JPY/000 297,000 corresponding to €/000 2,537 (valued at the forward exchange rate), ›with average maturity on 01 August 2011;for a value of USD/000 8,540 corresponding to €/000 5,963 (valued at the forward exchange rate), ›with average maturity on 21 July 2011;
and forward sales contracts:
for a value of CAD/000 805 corresponding to €/000 581 (valued at the forward exchange rate), with ›average maturity on 08 August 2011;
Half-Year Financial Statements Consolidated Income Comprehensive IncomeFinancial PositionCash Flow StatementConsolidated Net Debt ChangesNotes
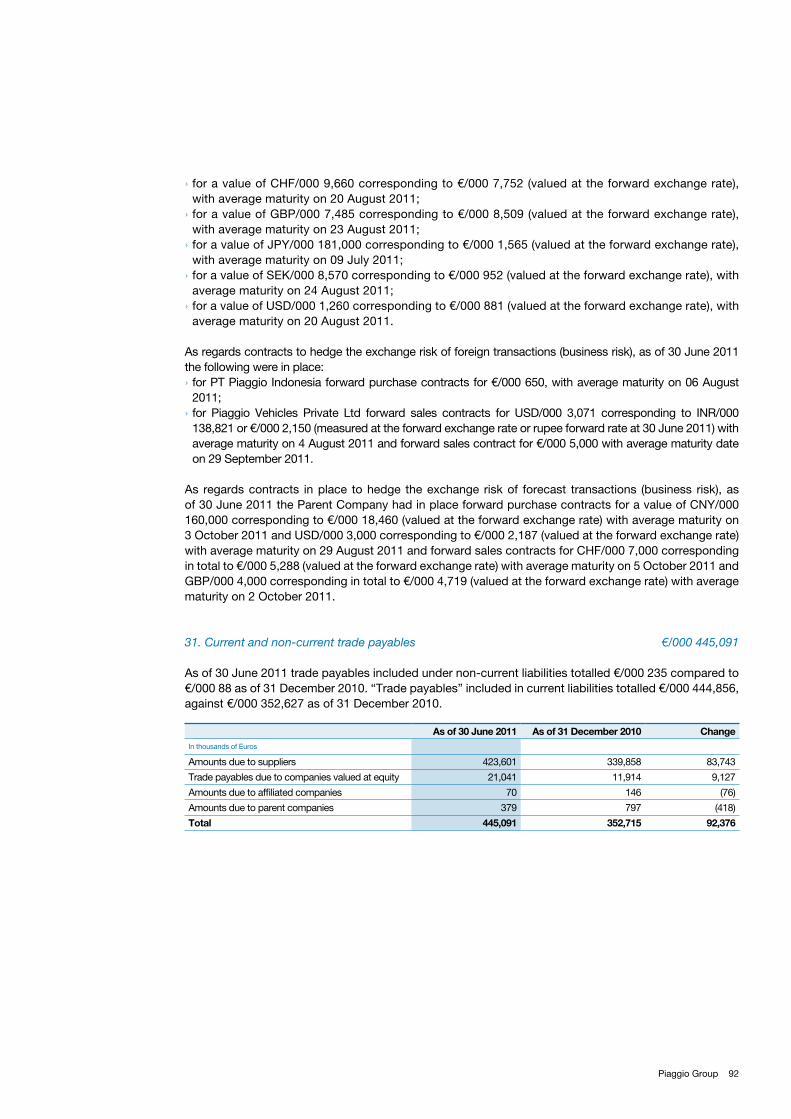
92Piaggio Group
for a value of CHF/000 9,660 corresponding to €/000 7,752 (valued at the forward exchange rate), ›with average maturity on 20 August 2011;for a value of GBP/000 7,485 corresponding to €/000 8,509 (valued at the forward exchange rate), ›with average maturity on 23 August 2011;for a value of JPY/000 181,000 corresponding to €/000 1,565 (valued at the forward exchange rate), ›with average maturity on 09 July 2011;for a value of SEK/000 8,570 corresponding to €/000 952 (valued at the forward exchange rate), with ›average maturity on 24 August 2011;for a value of USD/000 1,260 corresponding to €/000 881 (valued at the forward exchange rate), with ›average maturity on 20 August 2011.
As regards contracts to hedge the exchange risk of foreign transactions (business risk), as of 30 June 2011 the following were in place:
for PT Piaggio Indonesia forward purchase contracts for €/000 650, with average maturity on 06 August ›2011;for Piaggio Vehicles Private Ltd forward sales contracts for USD/000 3,071 corresponding to INR/000 ›138,821 or €/000 2,150 (measured at the forward exchange rate or rupee forward rate at 30 June 2011) with average maturity on 4 August 2011 and forward sales contract for €/000 5,000 with average maturity date on 29 September 2011.
As regards contracts in place to hedge the exchange risk of forecast transactions (business risk), as of 30 June 2011 the Parent Company had in place forward purchase contracts for a value of CNY/000 160,000 corresponding to €/000 18,460 (valued at the forward exchange rate) with average maturity on 3 October 2011 and USD/000 3,000 corresponding to €/000 2,187 (valued at the forward exchange rate) with average maturity on 29 August 2011 and forward sales contracts for CHF/000 7,000 corresponding in total to €/000 5,288 (valued at the forward exchange rate) with average maturity on 5 October 2011 and GBP/000 4,000 corresponding in total to €/000 4,719 (valued at the forward exchange rate) with average maturity on 2 October 2011.
31. Current and non-current trade payables €/000 445,091
As of 30 June 2011 trade payables included under non-current liabilities totalled €/000 235 compared to €/000 88 as of 31 December 2010. “Trade payables” included in current liabilities totalled €/000 444,856, against €/000 352,627 as of 31 December 2010.
As of 30 June 2011 As of 31 December 2010 ChangeIn thousands of Euros
Amounts due to suppliers 423,601 339,858 83,743
Trade payables due to companies valued at equity 21,041 11,914 9,127
Amounts due to affiliated companies 70 146 (76)
Amounts due to parent companies 379 797 (418)
Total 445,091 352,715 92,376
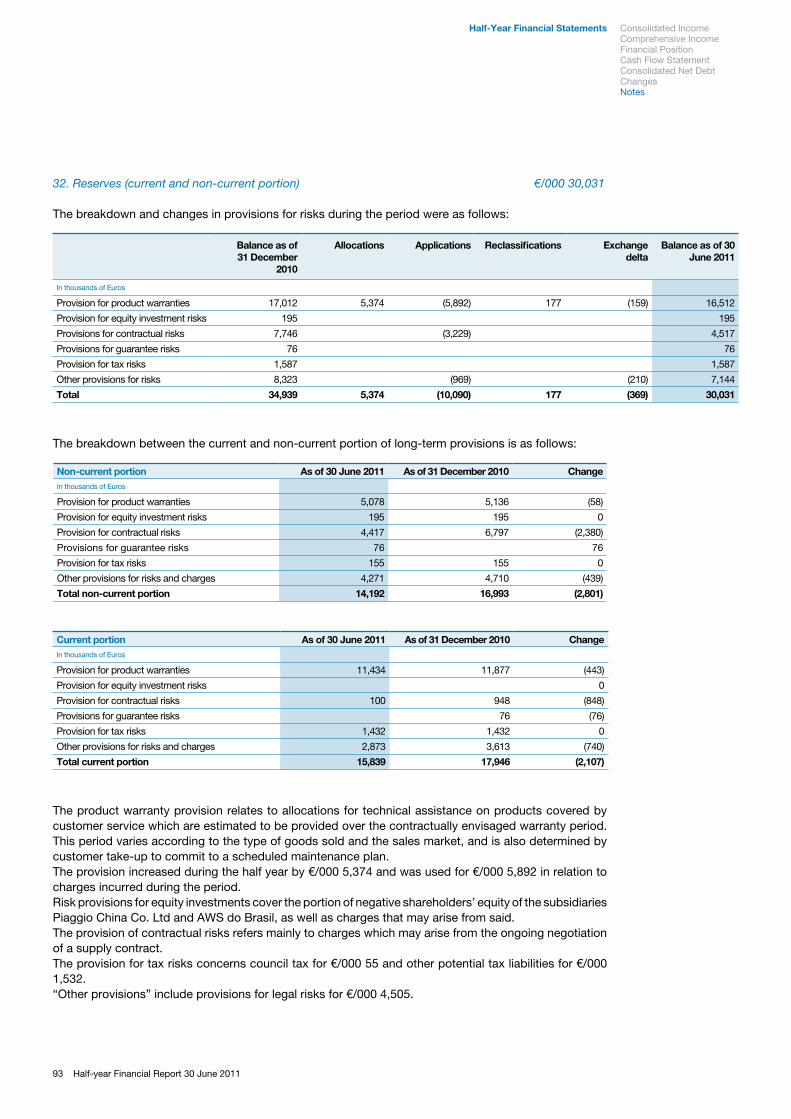
93 Half-year Financial Report 30 June 2011
32. Reserves (current and non-current portion) €/000 30,031
The breakdown and changes in provisions for risks during the period were as follows:
Balance as of 31 December
2010
Allocations Applications Reclassifications Exchange delta
Balance as of 30 June 2011
In thousands of Euros
Provision for product warranties 17,012 5,374 (5,892) 177 (159) 16,512
Provision for equity investment risks 195 195
Provisions for contractual risks 7,746 (3,229) 4,517
Provisions for guarantee risks 76 76
Provision for tax risks 1,587 1,587
Other provisions for risks 8,323 (969) (210) 7,144
Total 34,939 5,374 (10,090) 177 (369) 30,031
The breakdown between the current and non-current portion of long-term provisions is as follows:
Non-current portion As of 30 June 2011 As of 31 December 2010 ChangeIn thousands of Euros
Provision for product warranties 5,078 5,136 (58)
Provision for equity investment risks 195 195 0
Provision for contractual risks 4,417 6,797 (2,380)
Provisions for guarantee risks 76 76
Provision for tax risks 155 155 0
Other provisions for risks and charges 4,271 4,710 (439)
Total non-current portion 14,192 16,993 (2,801)
Current portion As of 30 June 2011 As of 31 December 2010 ChangeIn thousands of Euros
Provision for product warranties 11,434 11,877 (443)
Provision for equity investment risks 0
Provision for contractual risks 100 948 (848)
Provisions for guarantee risks 76 (76)
Provision for tax risks 1,432 1,432 0
Other provisions for risks and charges 2,873 3,613 (740)
Total current portion 15,839 17,946 (2,107)
The product warranty provision relates to allocations for technical assistance on products covered by customer service which are estimated to be provided over the contractually envisaged warranty period. This period varies according to the type of goods sold and the sales market, and is also determined by customer take-up to commit to a scheduled maintenance plan.The provision increased during the half year by €/000 5,374 and was used for €/000 5,892 in relation to charges incurred during the period.Risk provisions for equity investments cover the portion of negative shareholders’ equity of the subsidiaries Piaggio China Co. Ltd and AWS do Brasil, as well as charges that may arise from said.The provision of contractual risks refers mainly to charges which may arise from the ongoing negotiation of a supply contract. The provision for tax risks concerns council tax for €/000 55 and other potential tax liabilities for €/000 1,532.“Other provisions” include provisions for legal risks for €/000 4,505.
Half-Year Financial Statements Consolidated Income Comprehensive IncomeFinancial PositionCash Flow StatementConsolidated Net Debt ChangesNotes
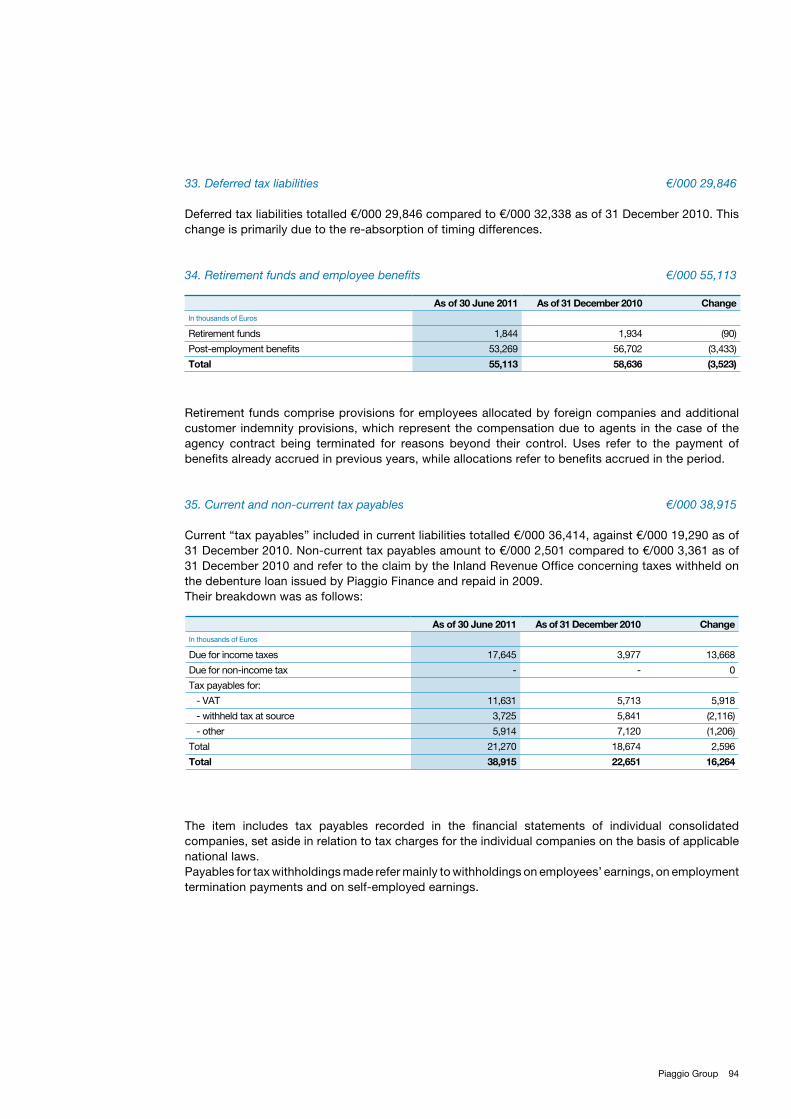
94Piaggio Group
33. Deferred tax liabilities €/000 29,846
Deferred tax liabilities totalled €/000 29,846 compared to €/000 32,338 as of 31 December 2010. This change is primarily due to the re-absorption of timing differences.
34. Retirement funds and employee benefits €/000 55,113
As of 30 June 2011 As of 31 December 2010 ChangeIn thousands of Euros
Retirement funds 1,844 1,934 (90)
Post-employment benefits 53,269 56,702 (3,433)
Total 55,113 58,636 (3,523)
Retirement funds comprise provisions for employees allocated by foreign companies and additional customer indemnity provisions, which represent the compensation due to agents in the case of the agency contract being terminated for reasons beyond their control. Uses refer to the payment of benefits already accrued in previous years, while allocations refer to benefits accrued in the period.
35. Current and non-current tax payables €/000 38,915
Current “tax payables” included in current liabilities totalled €/000 36,414, against €/000 19,290 as of 31 December 2010. Non-current tax payables amount to €/000 2,501 compared to €/000 3,361 as of 31 December 2010 and refer to the claim by the Inland Revenue Office concerning taxes withheld on the debenture loan issued by Piaggio Finance and repaid in 2009. Their breakdown was as follows:
As of 30 June 2011 As of 31 December 2010 ChangeIn thousands of Euros
Due for income taxes 17,645 3,977 13,668
Due for non-income tax - - 0
Tax payables for:
- VAT 11,631 5,713 5,918
- withheld tax at source 3,725 5,841 (2,116)
- other 5,914 7,120 (1,206)
Total 21,270 18,674 2,596
Total 38,915 22,651 16,264
The item includes tax payables recorded in the financial statements of individual consolidated companies, set aside in relation to tax charges for the individual companies on the basis of applicable national laws.Payables for tax withholdings made refer mainly to withholdings on employees’ earnings, on employment termination payments and on self-employed earnings.
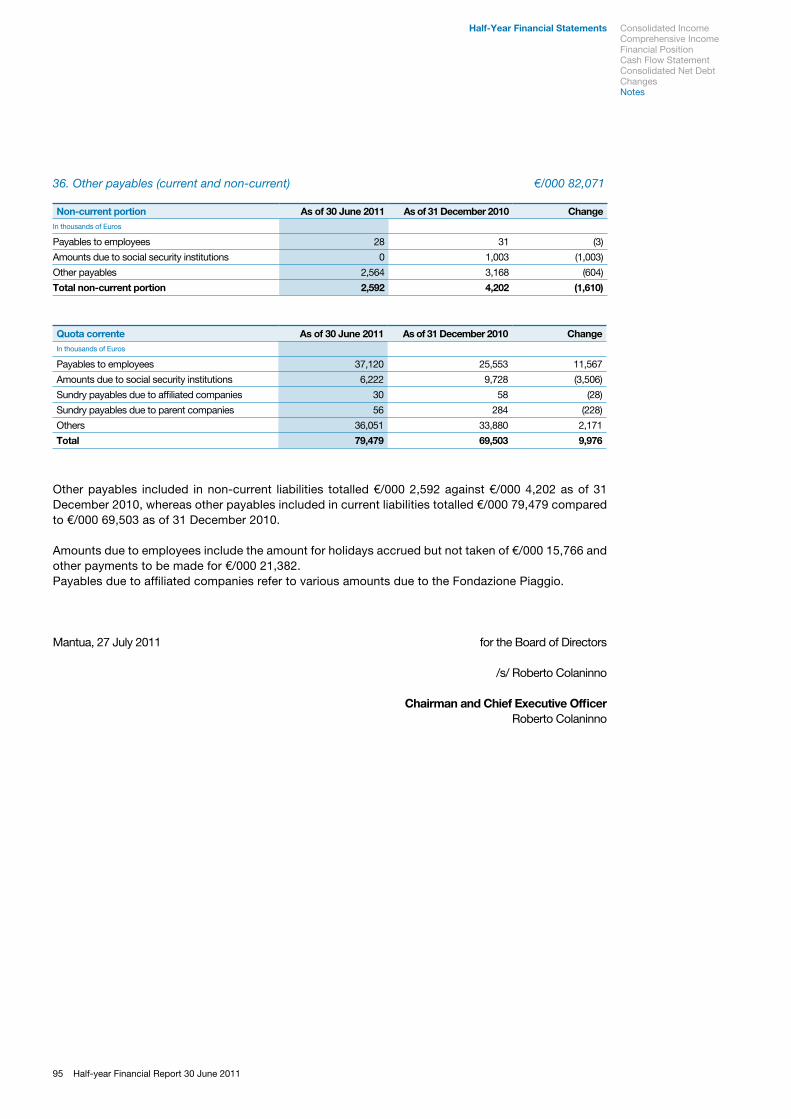
95 Half-year Financial Report 30 June 2011
36. Other payables (current and non-current) €/000 82,071
Non-current portion As of 30 June 2011 As of 31 December 2010 ChangeIn thousands of Euros
Payables to employees 28 31 (3)
Amounts due to social security institutions 0 1,003 (1,003)
Other payables 2,564 3,168 (604)
Total non-current portion 2,592 4,202 (1,610)
Quota corrente As of 30 June 2011 As of 31 December 2010 ChangeIn thousands of Euros
Payables to employees 37,120 25,553 11,567
Amounts due to social security institutions 6,222 9,728 (3,506)
Sundry payables due to affiliated companies 30 58 (28)
Sundry payables due to parent companies 56 284 (228)
Others 36,051 33,880 2,171
Total 79,479 69,503 9,976
Other payables included in non-current liabilities totalled €/000 2,592 against €/000 4,202 as of 31 December 2010, whereas other payables included in current liabilities totalled €/000 79,479 compared to €/000 69,503 as of 31 December 2010.
Amounts due to employees include the amount for holidays accrued but not taken of €/000 15,766 and other payments to be made for €/000 21,382.Payables due to affiliated companies refer to various amounts due to the Fondazione Piaggio.
Mantua, 27 July 2011 for the Board of Directors
/s/ Roberto Colaninno
Chairman and Chief Executive Officer Roberto Colaninno
Half-Year Financial Statements Consolidated Income Comprehensive IncomeFinancial PositionCash Flow StatementConsolidated Net Debt ChangesNotes
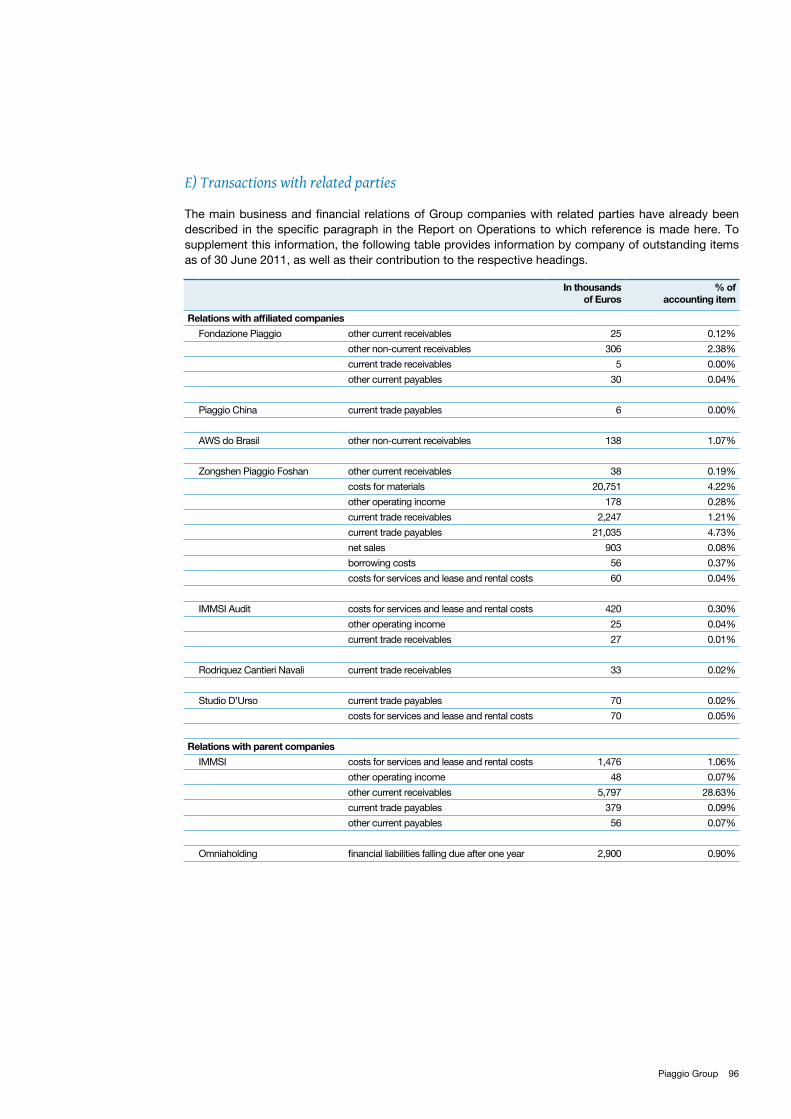
96Piaggio Group
e) Transactions with related parties
The main business and financial relations of Group companies with related parties have already been described in the specific paragraph in the Report on Operations to which reference is made here. To supplement this information, the following table provides information by company of outstanding items as of 30 June 2011, as well as their contribution to the respective headings.
In thousands of Euros
% of accounting item
Relations with affiliated companies
Fondazione Piaggio other current receivables 25 0.12%
other non-current receivables 306 2.38%
current trade receivables 5 0.00%
other current payables 30 0.04%
Piaggio China current trade payables 6 0.00%
AWS do Brasil other non-current receivables 138 1.07%
Zongshen Piaggio Foshan other current receivables 38 0.19%
costs for materials 20,751 4.22%
other operating income 178 0.28%
current trade receivables 2,247 1.21%
current trade payables 21,035 4.73%
net sales 903 0.08%
borrowing costs 56 0.37%
costs for services and lease and rental costs 60 0.04%
IMMSI Audit costs for services and lease and rental costs 420 0.30%
other operating income 25 0.04%
current trade receivables 27 0.01%
Rodriquez Cantieri Navali current trade receivables 33 0.02%
Studio D’Urso current trade payables 70 0.02%
costs for services and lease and rental costs 70 0.05%
Relations with parent companies
IMMSI costs for services and lease and rental costs 1,476 1.06%
other operating income 48 0.07%
other current receivables 5,797 28.63%
current trade payables 379 0.09%
other current payables 56 0.07%
Omniaholding financial liabilities falling due after one year 2,900 0.90%
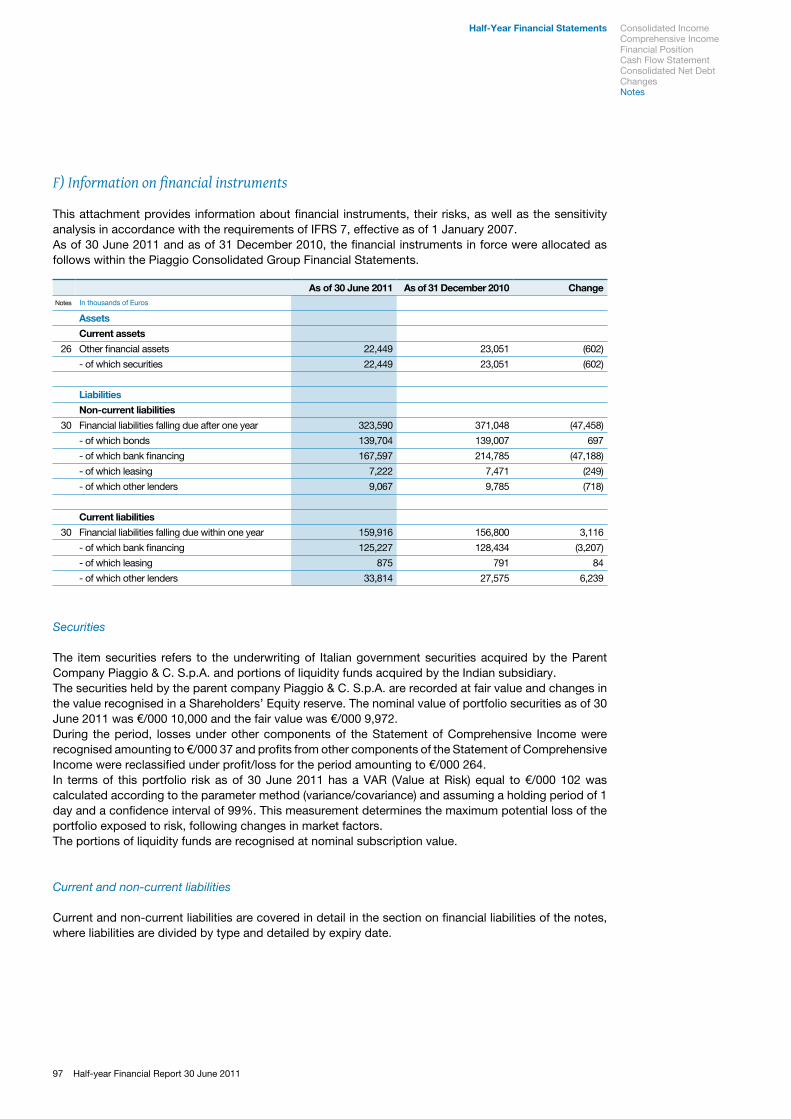
97 Half-year Financial Report 30 June 2011
F) Information on financial instruments
This attachment provides information about financial instruments, their risks, as well as the sensitivity analysis in accordance with the requirements of IFRS 7, effective as of 1 January 2007.As of 30 June 2011 and as of 31 December 2010, the financial instruments in force were allocated as follows within the Piaggio Consolidated Group Financial Statements.
As of 30 June 2011 As of 31 December 2010 Change
Assets
Current assets
Other financial assets 22,449 23,051 (602)
- of which securities 22,449 23,051 (602)
Liabilities
Non-current liabilities
Financial liabilities falling due after one year 323,590 371,048 (47,458)
- of which bonds 139,704 139,007 697
- of which bank financing 167,597 214,785 (47,188)
- of which leasing 7,222 7,471 (249)
- of which other lenders 9,067 9,785 (718)
Current liabilities
Financial liabilities falling due within one year 159,916 156,800 3,116
- of which bank financing 125,227 128,434 (3,207)
- of which leasing 875 791 84
- of which other lenders 33,814 27,575 6,239
Notes
26
30
30
In thousands of Euros
Securities
The item securities refers to the underwriting of Italian government securities acquired by the Parent Company Piaggio & C. S.p.A. and portions of liquidity funds acquired by the Indian subsidiary. The securities held by the parent company Piaggio & C. S.p.A. are recorded at fair value and changes in the value recognised in a Shareholders’ Equity reserve. The nominal value of portfolio securities as of 30 June 2011 was €/000 10,000 and the fair value was €/000 9,972.During the period, losses under other components of the Statement of Comprehensive Income were recognised amounting to €/000 37 and profits from other components of the Statement of Comprehensive Income were reclassified under profit/loss for the period amounting to €/000 264.In terms of this portfolio risk as of 30 June 2011 has a VAR (Value at Risk) equal to €/000 102 was calculated according to the parameter method (variance/covariance) and assuming a holding period of 1 day and a confidence interval of 99%. This measurement determines the maximum potential loss of the portfolio exposed to risk, following changes in market factors.The portions of liquidity funds are recognised at nominal subscription value.
Current and non-current liabilities
Current and non-current liabilities are covered in detail in the section on financial liabilities of the notes, where liabilities are divided by type and detailed by expiry date.
Half-Year Financial Statements Consolidated Income Comprehensive IncomeFinancial PositionCash Flow StatementConsolidated Net Debt ChangesNotes
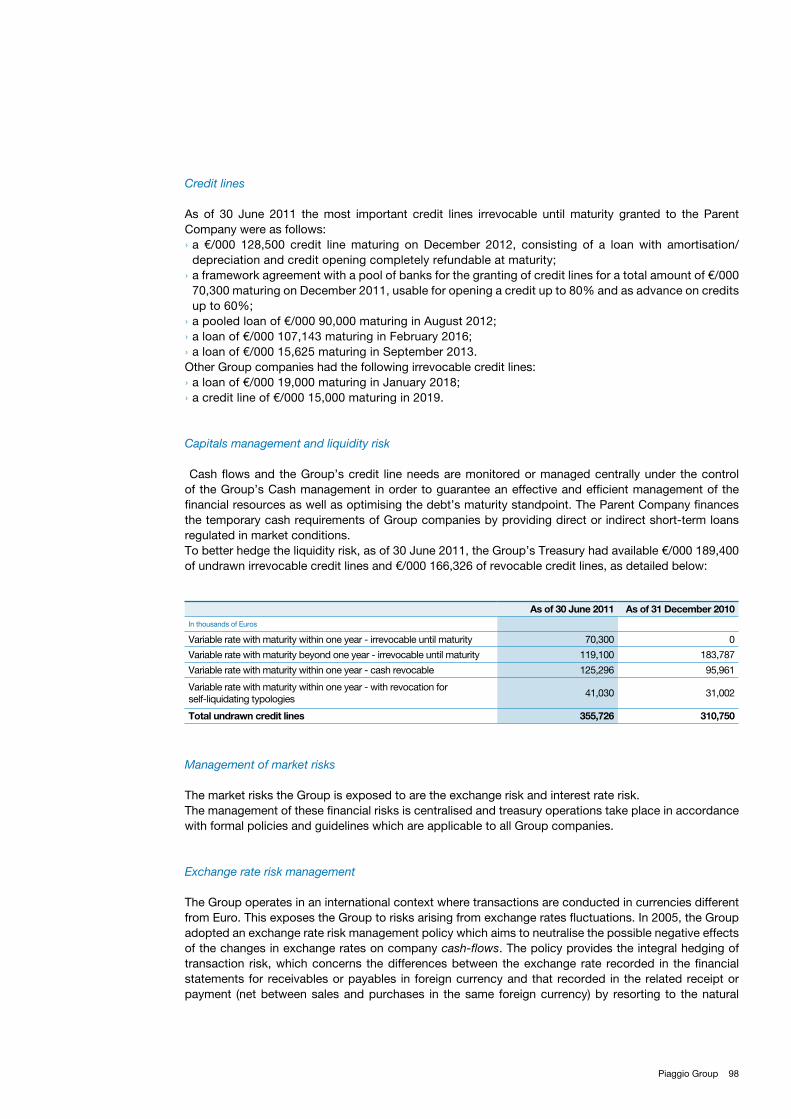
98Piaggio Group
Credit lines
As of 30 June 2011 the most important credit lines irrevocable until maturity granted to the Parent Company were as follows:
a €/000 128,500 credit line maturing on December 2012, consisting of a loan with amortisation/ ›depreciation and credit opening completely refundable at maturity; a framework agreement with a pool of banks for the granting of credit lines for a total amount of €/000 ›70,300 maturing on December 2011, usable for opening a credit up to 80% and as advance on credits up to 60%; a pooled loan of €/000 90,000 maturing in August 2012; ›a loan of €/000 107,143 maturing in February 2016; ›a loan of €/000 15,625 maturing in September 2013. ›
Other Group companies had the following irrevocable credit lines:a loan of €/000 19,000 maturing in January 2018; ›a credit line of €/000 15,000 maturing in 2019. ›
Capitals management and liquidity risk
Cash flows and the Group’s credit line needs are monitored or managed centrally under the control of the Group’s Cash management in order to guarantee an effective and efficient management of the financial resources as well as optimising the debt’s maturity standpoint. The Parent Company finances the temporary cash requirements of Group companies by providing direct or indirect short-term loans regulated in market conditions.To better hedge the liquidity risk, as of 30 June 2011, the Group’s Treasury had available €/000 189,400 of undrawn irrevocable credit lines and €/000 166,326 of revocable credit lines, as detailed below:
As of 30 June 2011 As of 31 December 2010In thousands of Euros
Variable rate with maturity within one year - irrevocable until maturity 70,300 0
Variable rate with maturity beyond one year - irrevocable until maturity 119,100 183,787
Variable rate with maturity within one year - cash revocable 125,296 95,961
Variable rate with maturity within one year - with revocation for self-liquidating typologies
41,030 31,002
Total undrawn credit lines 355,726 310,750
Management of market risks
The market risks the Group is exposed to are the exchange risk and interest rate risk.The management of these financial risks is centralised and treasury operations take place in accordance with formal policies and guidelines which are applicable to all Group companies.
Exchange rate risk management
The Group operates in an international context where transactions are conducted in currencies different from Euro. This exposes the Group to risks arising from exchange rates fluctuations. In 2005, the Group adopted an exchange rate risk management policy which aims to neutralise the possible negative effects of the changes in exchange rates on company cash-flows. The policy provides the integral hedging of transaction risk, which concerns the differences between the exchange rate recorded in the financial statements for receivables or payables in foreign currency and that recorded in the related receipt or payment (net between sales and purchases in the same foreign currency) by resorting to the natural
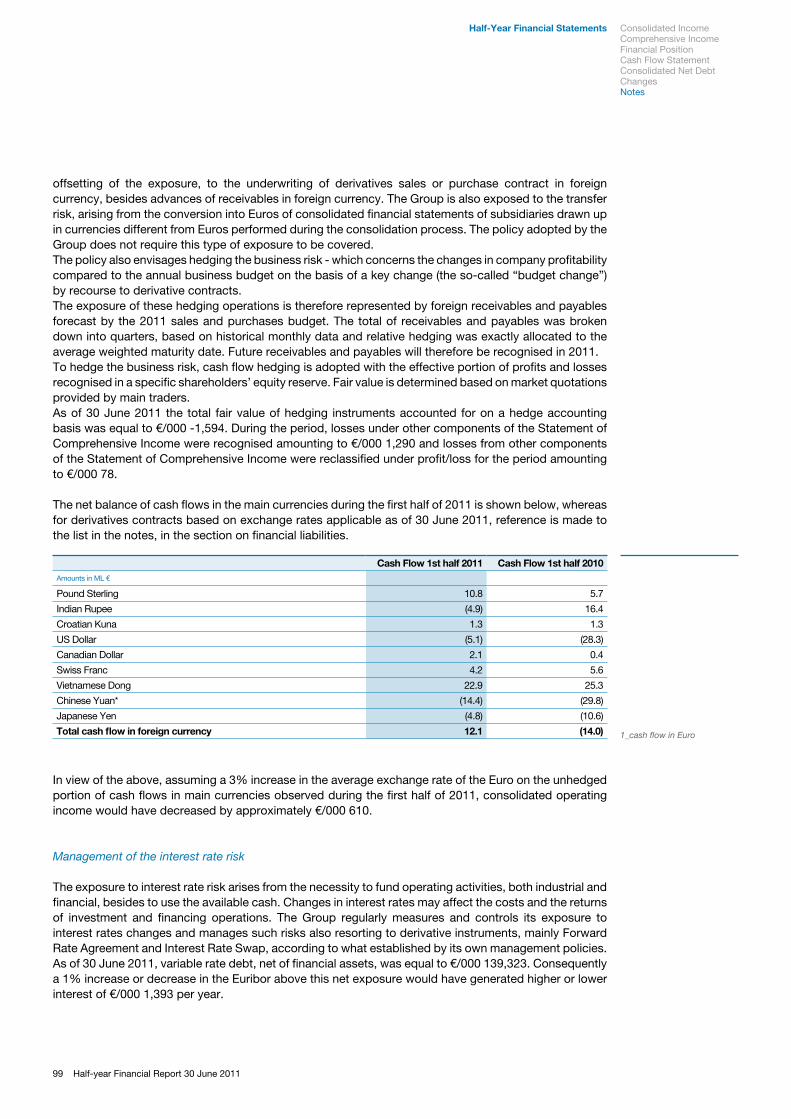
99 Half-year Financial Report 30 June 2011
offsetting of the exposure, to the underwriting of derivatives sales or purchase contract in foreign currency, besides advances of receivables in foreign currency. The Group is also exposed to the transfer risk, arising from the conversion into Euros of consolidated financial statements of subsidiaries drawn up in currencies different from Euros performed during the consolidation process. The policy adopted by the Group does not require this type of exposure to be covered. The policy also envisages hedging the business risk - which concerns the changes in company profitability compared to the annual business budget on the basis of a key change (the so-called “budget change”) by recourse to derivative contracts.The exposure of these hedging operations is therefore represented by foreign receivables and payables forecast by the 2011 sales and purchases budget. The total of receivables and payables was broken down into quarters, based on historical monthly data and relative hedging was exactly allocated to the average weighted maturity date. Future receivables and payables will therefore be recognised in 2011.To hedge the business risk, cash flow hedging is adopted with the effective portion of profits and losses recognised in a specific shareholders’ equity reserve. Fair value is determined based on market quotations provided by main traders.As of 30 June 2011 the total fair value of hedging instruments accounted for on a hedge accounting basis was equal to €/000 -1,594. During the period, losses under other components of the Statement of Comprehensive Income were recognised amounting to €/000 1,290 and losses from other components of the Statement of Comprehensive Income were reclassified under profit/loss for the period amounting to €/000 78.
The net balance of cash flows in the main currencies during the first half of 2011 is shown below, whereas for derivatives contracts based on exchange rates applicable as of 30 June 2011, reference is made to the list in the notes, in the section on financial liabilities.
Cash Flow 1st half 2011 Cash Flow 1st half 2010Amounts in ML € Pound Sterling 10.8 5.7
Indian Rupee (4.9) 16.4
Croatian Kuna 1.3 1.3
US Dollar (5.1) (28.3)
Canadian Dollar 2.1 0.4
Swiss Franc 4.2 5.6
Vietnamese Dong 22.9 25.3
Chinese Yuan* (14.4) (29.8)
Japanese Yen (4.8) (10.6)
Total cash flow in foreign currency 12.1 (14.0) 1_cash flow in Euro
In view of the above, assuming a 3% increase in the average exchange rate of the Euro on the unhedged portion of cash flows in main currencies observed during the first half of 2011, consolidated operating income would have decreased by approximately €/000 610.
Management of the interest rate risk
The exposure to interest rate risk arises from the necessity to fund operating activities, both industrial and financial, besides to use the available cash. Changes in interest rates may affect the costs and the returns of investment and financing operations. The Group regularly measures and controls its exposure to interest rates changes and manages such risks also resorting to derivative instruments, mainly Forward Rate Agreement and Interest Rate Swap, according to what established by its own management policies. As of 30 June 2011, variable rate debt, net of financial assets, was equal to €/000 139,323. Consequently a 1% increase or decrease in the Euribor above this net exposure would have generated higher or lower interest of €/000 1,393 per year.
Half-Year Financial Statements Consolidated Income Comprehensive IncomeFinancial PositionCash Flow StatementConsolidated Net Debt ChangesNotes
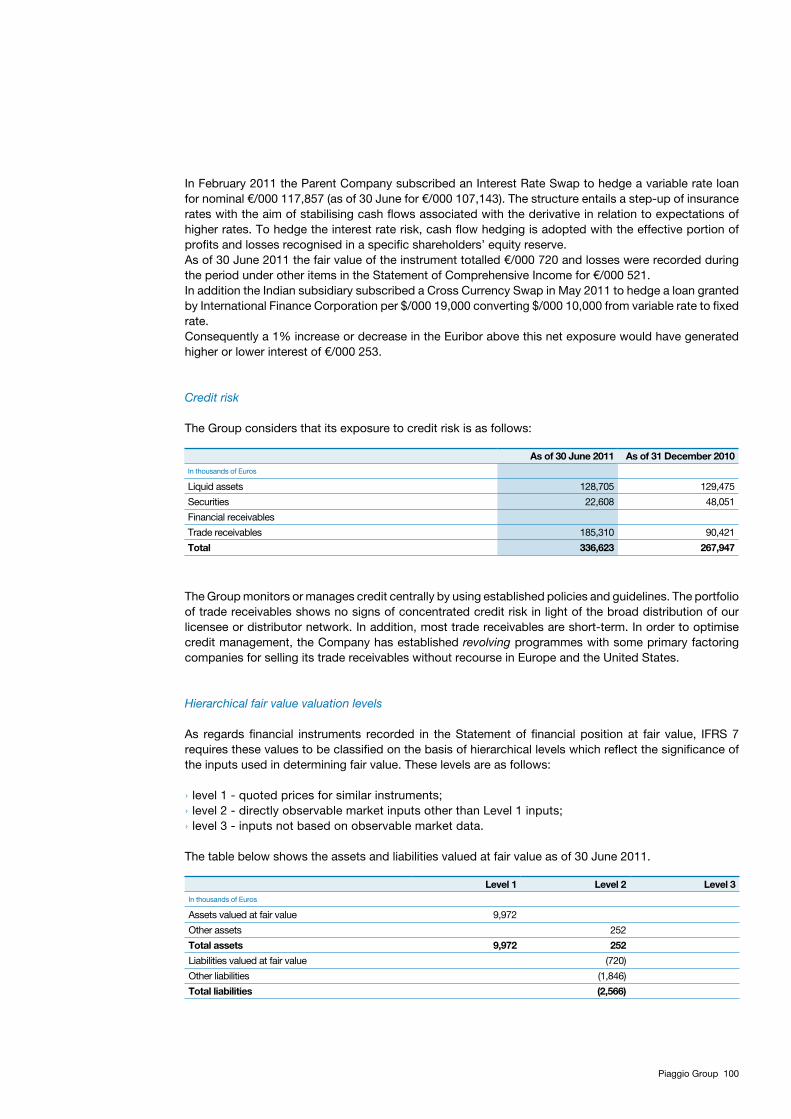
100Piaggio Group
In February 2011 the Parent Company subscribed an Interest Rate Swap to hedge a variable rate loan for nominal €/000 117,857 (as of 30 June for €/000 107,143). The structure entails a step-up of insurance rates with the aim of stabilising cash flows associated with the derivative in relation to expectations of higher rates. To hedge the interest rate risk, cash flow hedging is adopted with the effective portion of profits and losses recognised in a specific shareholders’ equity reserve. As of 30 June 2011 the fair value of the instrument totalled €/000 720 and losses were recorded during the period under other items in the Statement of Comprehensive Income for €/000 521. In addition the Indian subsidiary subscribed a Cross Currency Swap in May 2011 to hedge a loan granted by International Finance Corporation per $/000 19,000 converting $/000 10,000 from variable rate to fixed rate.Consequently a 1% increase or decrease in the Euribor above this net exposure would have generated higher or lower interest of €/000 253.
Credit risk
The Group considers that its exposure to credit risk is as follows:
As of 30 June 2011 As of 31 December 2010In thousands of Euros
Liquid assets 128,705 129,475
Securities 22,608 48,051
Financial receivables
Trade receivables 185,310 90,421
Total 336,623 267,947
The Group monitors or manages credit centrally by using established policies and guidelines. The portfolio of trade receivables shows no signs of concentrated credit risk in light of the broad distribution of our licensee or distributor network. In addition, most trade receivables are short-term. In order to optimise credit management, the Company has established revolving programmes with some primary factoring companies for selling its trade receivables without recourse in Europe and the United States.
Hierarchical fair value valuation levels
As regards financial instruments recorded in the Statement of financial position at fair value, IFRS 7 requires these values to be classified on the basis of hierarchical levels which reflect the significance of the inputs used in determining fair value. These levels are as follows:
level 1 - quoted prices for similar instruments; ›level 2 - directly observable market inputs other than Level 1 inputs; ›level 3 - inputs not based on observable market data. ›
The table below shows the assets and liabilities valued at fair value as of 30 June 2011.
Level 1 Level 2 Level 3In thousands of Euros
Assets valued at fair value 9,972
Other assets 252
Total assets 9,972 252
Liabilities valued at fair value (720)
Other liabilities (1,846)
Total liabilities (2,566)
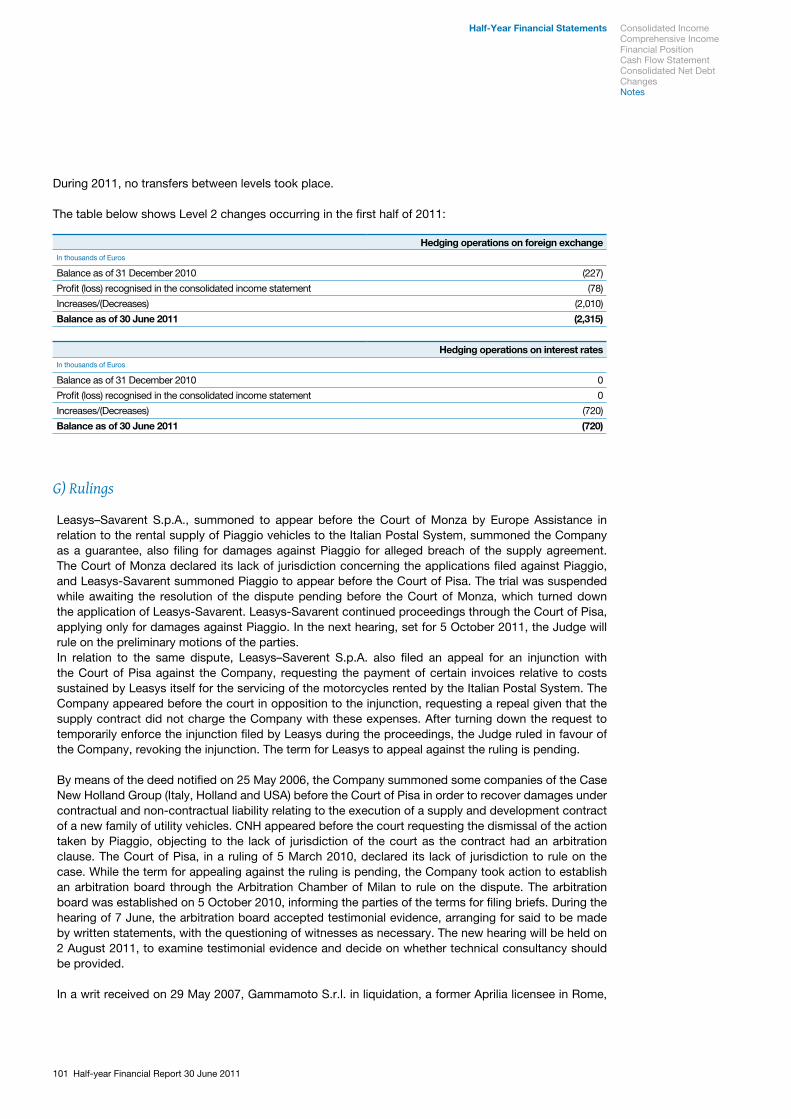
101 Half-year Financial Report 30 June 2011
During 2011, no transfers between levels took place.
The table below shows Level 2 changes occurring in the first half of 2011:
Hedging operations on foreign exchangeIn thousands of Euros
Balance as of 31 December 2010 (227)
Profit (loss) recognised in the consolidated income statement (78)
Increases/(Decreases) (2,010)
Balance as of 30 June 2011 (2,315)
Hedging operations on interest ratesIn thousands of Euros
Balance as of 31 December 2010 0
Profit (loss) recognised in the consolidated income statement 0
Increases/(Decreases) (720)
Balance as of 30 June 2011 (720)
G) Rulings
Leasys–Savarent S.p.A., summoned to appear before the Court of Monza by Europe Assistance in relation to the rental supply of Piaggio vehicles to the Italian Postal System, summoned the Company as a guarantee, also filing for damages against Piaggio for alleged breach of the supply agreement. The Court of Monza declared its lack of jurisdiction concerning the applications filed against Piaggio, and Leasys-Savarent summoned Piaggio to appear before the Court of Pisa. The trial was suspended while awaiting the resolution of the dispute pending before the Court of Monza, which turned down the application of Leasys-Savarent. Leasys-Savarent continued proceedings through the Court of Pisa, applying only for damages against Piaggio. In the next hearing, set for 5 October 2011, the Judge will rule on the preliminary motions of the parties. In relation to the same dispute, Leasys–Saverent S.p.A. also filed an appeal for an injunction with the Court of Pisa against the Company, requesting the payment of certain invoices relative to costs sustained by Leasys itself for the servicing of the motorcycles rented by the Italian Postal System. The Company appeared before the court in opposition to the injunction, requesting a repeal given that the supply contract did not charge the Company with these expenses. After turning down the request to temporarily enforce the injunction filed by Leasys during the proceedings, the Judge ruled in favour of the Company, revoking the injunction. The term for Leasys to appeal against the ruling is pending.
By means of the deed notified on 25 May 2006, the Company summoned some companies of the Case New Holland Group (Italy, Holland and USA) before the Court of Pisa in order to recover damages under contractual and non-contractual liability relating to the execution of a supply and development contract of a new family of utility vehicles. CNH appeared before the court requesting the dismissal of the action taken by Piaggio, objecting to the lack of jurisdiction of the court as the contract had an arbitration clause. The Court of Pisa, in a ruling of 5 March 2010, declared its lack of jurisdiction to rule on the case. While the term for appealing against the ruling is pending, the Company took action to establish an arbitration board through the Arbitration Chamber of Milan to rule on the dispute. The arbitration board was established on 5 October 2010, informing the parties of the terms for filing briefs. During the hearing of 7 June, the arbitration board accepted testimonial evidence, arranging for said to be made by written statements, with the questioning of witnesses as necessary. The new hearing will be held on 2 August 2011, to examine testimonial evidence and decide on whether technical consultancy should be provided.
In a writ received on 29 May 2007, Gammamoto S.r.l. in liquidation, a former Aprilia licensee in Rome,
Half-Year Financial Statements Consolidated Income Comprehensive IncomeFinancial PositionCash Flow StatementConsolidated Net Debt ChangesNotes
102Piaggio Group
brought a case against the Company before the Court of Rome for contractual and non-contractual liability. The Company opposed the injunction fully disputing the validity of Gammamoto’s claims and objecting to the lack of jurisdiction of the Judge in charge. The Judge, accepting the petition formulated by the Company, declared its lack of jurisdiction with regards to the dispute. Gammamoto appealed against the ruling on the grounds of lack of jurisdiction at the Court of Cassation, which ruled that the Court of Venice, already indicated in the ruling of the Court of Rome, had jurisdiction. Gammamoto continued proceedings through the Court of Venice, and the case has been adjourned to 19 September 2011. The proceedings undertaken by Gammamoto at the Court of Rome against Piaggio, Intesa Mediofactoring and Banca Popolare del Lazio, to ascertain the undue drawing of the guarantee by Intesa Mediofactoring, a factor company of Piaggio in relation to Gammamoto, concluded with a ruling that the Court through which Gammamoto took action lacked jurisdiction, which instead was of the Court of Milan. The Company is awaiting for proceedings to be continued by Gammamoto.
Da Lio S.p.A., by means of a writ received on 15 April 2009 - summoned the Company before the Court of Pisa to claim compensation for the alleged damages sustained for various reasons as a result of the termination of supply relationships. The Company appeared in court requesting the rejection of all opposing requests. Da Lio requested a joinder with the opposition concerning the injunction obtained by Piaggio to return the moulds retained by the supplier at the end of the supply agreement. Judgements were considered and a ruling issued pursuant to article 186ter of the Code of Civil Proceedings, on 7 June 2011, ordering Piaggio to pay the sum of Euro 109,586.60, in addition to interest relative to sums not which were not disputed. Proceedings were adjourned to 14 March 2012 with the start of the preliminary investigation.
The Canadian Scooter Corp. (CSC), sole distributor of Piaggio for Canada, summoned Piaggio & C. S.p.A., Piaggio Group Americas Inc. and Nacional Motor S.A to appear before the Court of Toronto (Canada) to obtain compensation for damages sustained due to the alleged infringement of regulations established by Canadian law on franchising (the Arthur Wishart Act). At present, an attempt to settle the dispute through mediation (a type of alternative dispute resolution) is ongoing. Piaggio also took independent legal action against the Bank of Nova Scotia in relation to the non-payment of three letters of credit issued by the bank as a guarantee of supplies made by Piaggio in favour of CSC. Piaggio’s claim was however rejected, due to an inaccuracy in the wording of the guarantee.
Following the appeal made by the Company pursuant to article 700 of the Code of Civil Proceedings, the Court of Naples, as a precautionary measure, issued an injunction against LML Italia S.r.l., a company distributing models of scooters in Italy manufactured by LML India Ltd, preventing it from using the “Piaggio”, “Vespa” and “Vespa PX” brands on its sales information, advertising and promotional materials, stating that the continual matching of LML products with the Vespa manufactured by Piaggio constituted grounds for unfair competition. This ruling was also confirmed in an appeal. Piaggio therefore initiated proceedings with the Court of Naples to obtain damages for the unlawful use of Piaggio marks and for acts of unfair competition adopted by LML. The case has been adjourned to 6 December 2011 for specification of the pleadings. LML India, in turn, referring to the arbitration clause in settlement agreements signed with Piaggio in 1999 to end the joint venture established in India, summoned the Company to appear before an arbitration board in Singapore to obtain compensation for alleged damages sustained by LML India due to the effect of legal action taken by Piaggio against LML Italia. Arbitration ruled against all applications submitted by LML India.
In an appeal pursuant to article 140 of the Consumer’s Code, the consumer association Altroconsumo requested the Court of Pisa to order Piaggio to take necessary measures to recall the first series of the Gilera Runner from the market (manufacture was stopped in 2005), claiming the existence of a design defect in the vehicle tank which would not make the motorcycle safe. In particular, to support its claims, Altroconsumo reported two fires caused over the years by two accidents in which a first series Gilera Runner was involved and attached crash tests carried out on the same type of motorcycles.Piaggio opposed the proceedings undertaken by Altroconsumo, opposing the alleged existence of a
103 Half-year Financial Report 30 June 2011
design defect and hazardous nature of the vehicle, filing a specific technical appraisal. The case has been adjourned to 26 July 2011 for discussion.
The amounts allocated by the Company for the potential risks deriving from the current dispute appear to be consistent with the predictable outcome of the disputes.
As regards tax claim cases involving the Parent Company Piaggio & C S.p.A., two appeals are ongoing against two tax assessments notified to the Company and relative to the 2002 and 2003 tax years. These assessments originate from an audit conducted by the Inland Revenue Office in 2007 at the Company’s offices, following information filed in the Formal Notice of Assessment issued in 2002 following a general audit. As concerns the assessments, a ruling in the first instance in favour of the Company was made for both the 2002 and 2003 tax years. The Inland Revenue Office has so far appealed against the sentence relative to 2002 and with reference to the ruling, a decision in the second instance is pending. For both cases, the Company has not considered it necessary to allocate provisions, in view of the positive opinions expressed by consultants appointed as counsel.The main tax disputes of other Group companies concern P&D S.p.A. in liquidation and Piaggio Vehicles PVT Ltd.More specifically, and in reference to P&D SpA in Liquidation, a dispute arose in relation to the tax assessments issued by the Inland Revenue Office for the 2000, 2001 and 2002 tax years and based on an audit conducted in 1999, with the issue of a Formal Notice of Assessment. As concerns the aforesaid tax assessments, a sentence in the first instance was ruled in favour of P&D S.p.A., against which the Financial Administration made an appeal. As a result the Company appeared before the tribunal and a decision from the Regional Tax Tribunal of Florence is pending. The Company has not considered it necessary to allocate provisions, in view of the positive opinions expressed by consultants appointed as counsel.As regards Piaggio Vehicles PVT Ltd, several disputes concerning different tax years from 1998 to 2010 are ongoing relative to direct and indirect tax assessments. The Indian company has partly paid the contested amounts, that will be paid back when proceedings are successfully concluded in its favour, and has made provisions in the financial statements for the contested amounts. Lastly, Piaggio France S.A. and Piaggio Deutschland GmbH received a relative notice of assessment, following general assessments in 2009 and 2010 by the tax authorities in their countries. In both cases, the companies filed briefs with the competent office to reduce claims and have started proceedings with the local Financial Administration. In particular, as regards Piaggio Deutschland GmbH, agreements are near conclusion to settle the case using measures to avoid litigation, as provided for by local laws.The company has already made provisions for the amount, which shall be paid following the settlement of measures.
H) Subsequent events
To date, no events have occurred after 30 June 2011 that make additional notes or adjustments to these Financial Statements necessary.
In this regard, reference is made to the Report on Operations for significant events after 30 June 2011.
Half-Year Financial Statements Consolidated Income Comprehensive IncomeFinancial PositionCash Flow StatementConsolidated Net Debt ChangesNotes
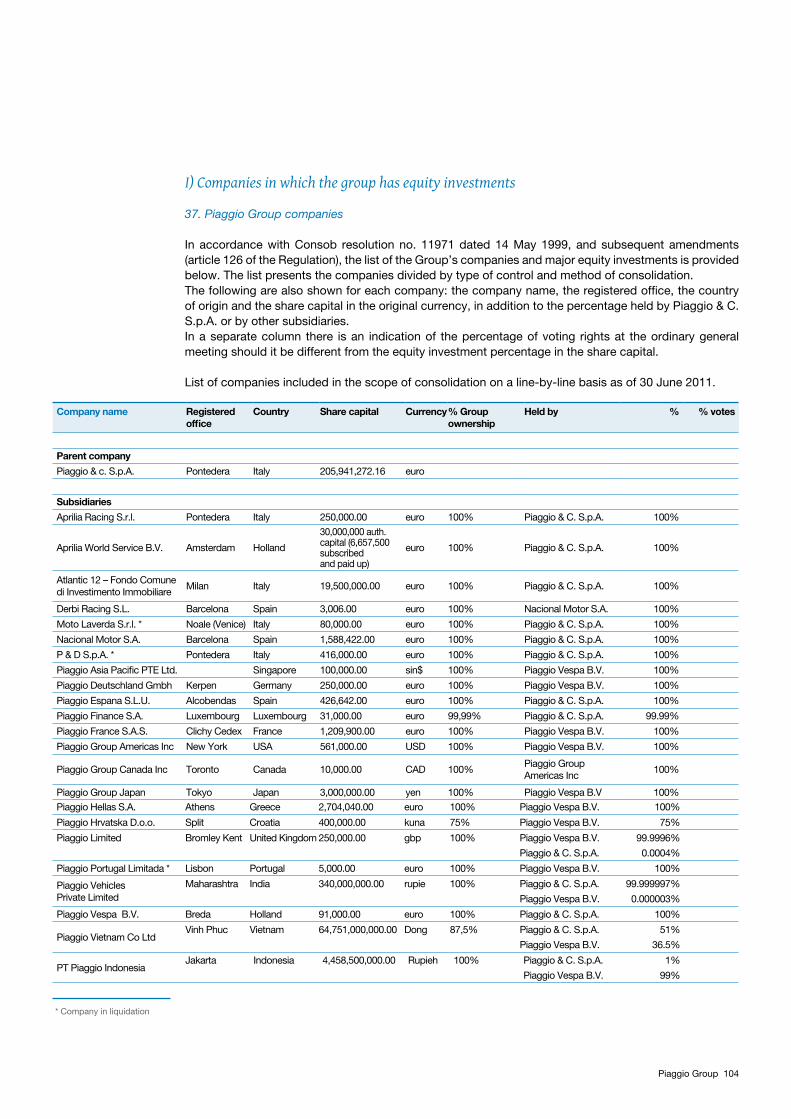
104Piaggio Group
I) Companies in which the group has equity investments
37. Piaggio Group companies
In accordance with Consob resolution no. 11971 dated 14 May 1999, and subsequent amendments (article 126 of the Regulation), the list of the Group’s companies and major equity investments is provided below. The list presents the companies divided by type of control and method of consolidation.The following are also shown for each company: the company name, the registered office, the country of origin and the share capital in the original currency, in addition to the percentage held by Piaggio & C. S.p.A. or by other subsidiaries. In a separate column there is an indication of the percentage of voting rights at the ordinary general meeting should it be different from the equity investment percentage in the share capital.
List of companies included in the scope of consolidation on a line-by-line basis as of 30 June 2011.
Company name Registered office
Country Share capital Currency% Group ownership
Held by % % votes
Parent company
Piaggio & c. S.p.A. Pontedera Italy 205,941,272.16 euro
Subsidiaries
Aprilia Racing S.r.l. Pontedera Italy 250,000.00 euro 100% Piaggio & C. S.p.A. 100%
Aprilia World Service B.V. Amsterdam Holland
30,000,000 auth. capital (6,657,500 subscribed and paid up)
euro 100% Piaggio & C. S.p.A. 100%
Atlantic 12 – Fondo Comune di Investimento Immobiliare
Milan Italy 19,500,000.00 euro 100% Piaggio & C. S.p.A. 100%
Derbi Racing S.L. Barcelona Spain 3,006.00 euro 100% Nacional Motor S.A. 100%
Moto Laverda S.r.l. * Noale (Venice) Italy 80,000.00 euro 100% Piaggio & C. S.p.A. 100%
Nacional Motor S.A. Barcelona Spain 1,588,422.00 euro 100% Piaggio & C. S.p.A. 100%
P & D S.p.A. * Pontedera Italy 416,000.00 euro 100% Piaggio & C. S.p.A. 100%
Piaggio Asia Pacific PTE Ltd. Singapore 100,000.00 sin$ 100% Piaggio Vespa B.V. 100%
Piaggio Deutschland Gmbh Kerpen Germany 250,000.00 euro 100% Piaggio Vespa B.V. 100%
Piaggio Espana S.L.U. Alcobendas Spain 426,642.00 euro 100% Piaggio & C. S.p.A. 100%
Piaggio Finance S.A. Luxembourg Luxembourg 31,000.00 euro 99,99% Piaggio & C. S.p.A. 99.99%
Piaggio France S.A.S. Clichy Cedex France 1,209,900.00 euro 100% Piaggio Vespa B.V. 100%
Piaggio Group Americas Inc New York USA 561,000.00 USD 100% Piaggio Vespa B.V. 100%
Piaggio Group Canada Inc Toronto Canada 10,000.00 CAD 100%Piaggio Group Americas Inc
100%
Piaggio Group Japan Tokyo Japan 3,000,000.00 yen 100% Piaggio Vespa B.V 100%
Piaggio Hellas S.A. Athens Greece 2,704,040.00 euro 100% Piaggio Vespa B.V. 100%
Piaggio Hrvatska D.o.o. Split Croatia 400,000.00 kuna 75% Piaggio Vespa B.V. 75%
Piaggio Limited Bromley Kent United Kingdom 250,000.00 gbp 100% Piaggio Vespa B.V. 99.9996%
Piaggio & C. S.p.A. 0.0004%
Piaggio Portugal Limitada * Lisbon Portugal 5,000.00 euro 100% Piaggio Vespa B.V. 100%
Piaggio Vehicles Private Limited
Maharashtra India 340,000,000.00 rupie 100% Piaggio & C. S.p.A. 99.999997%
Piaggio Vespa B.V. 0.000003%
Piaggio Vespa B.V. Breda Holland 91,000.00 euro 100% Piaggio & C. S.p.A. 100%
Piaggio Vietnam Co LtdVinh Phuc Vietnam 64,751,000,000.00 Dong 87,5% Piaggio & C. S.p.A. 51%
Piaggio Vespa B.V. 36.5%
PT Piaggio IndonesiaJakarta Indonesia 4,458,500,000.00 Rupieh 100% Piaggio & C. S.p.A. 1%
Piaggio Vespa B.V. 99%
* Company in liquidation
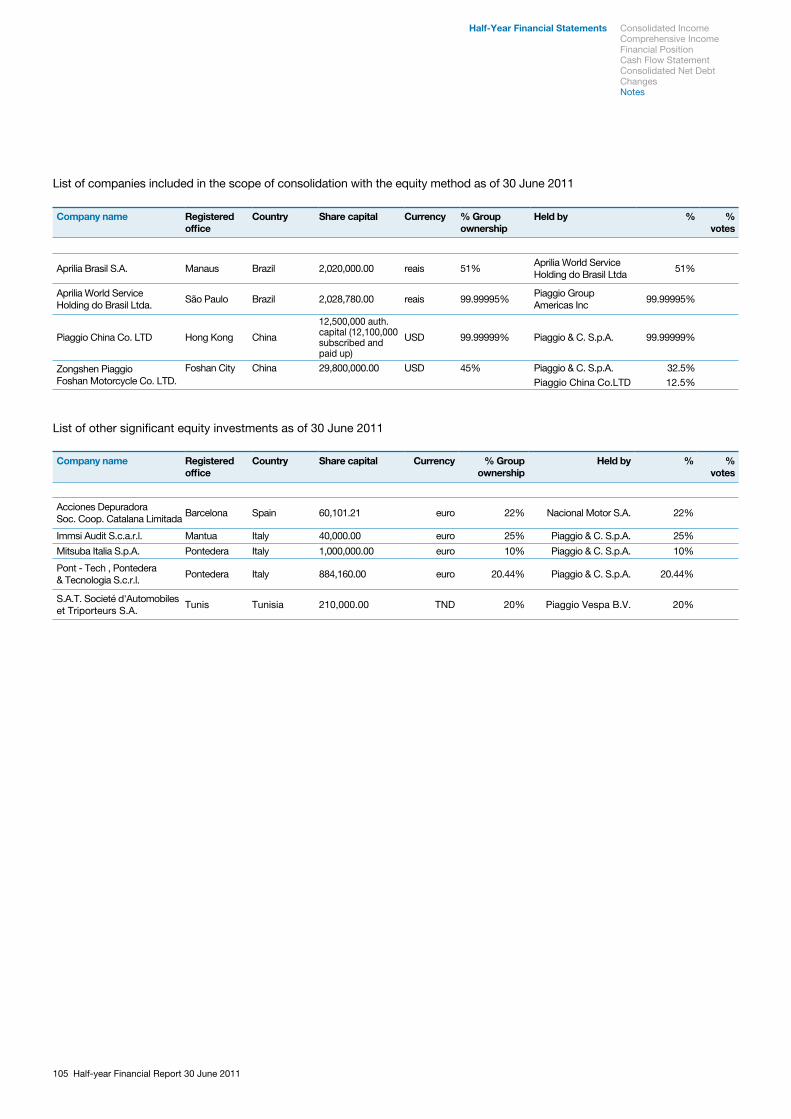
105 Half-year Financial Report 30 June 2011
Half-Year Financial Statements
Company name Registered office
Country Share capital Currency % Group ownership
Held by % % votes
Aprilia Brasil S.A. Manaus Brazil 2,020,000.00 reais 51%Aprilia World Service Holding do Brasil Ltda
51%
Aprilia World Service Holding do Brasil Ltda.
São Paulo Brazil 2,028,780.00 reais 99.99995%Piaggio Group Americas Inc
99.99995%
Piaggio China Co. LTD Hong Kong China
12,500,000 auth. capital (12,100,000 subscribed and paid up)
USD 99.99999% Piaggio & C. S.p.A. 99.99999%
Zongshen Piaggio Foshan Motorcycle Co. LTD.
Foshan City China 29,800,000.00 USD 45% Piaggio & C. S.p.A. 32.5% Piaggio China Co.LTD 12.5%
Company name Registered office
Country Share capital Currency % Group ownership
Held by % % votes
Acciones Depuradora Soc. Coop. Catalana Limitada
Barcelona Spain 60,101.21 euro 22% Nacional Motor S.A. 22%
Immsi Audit S.c.a.r.l. Mantua Italy 40,000.00 euro 25% Piaggio & C. S.p.A. 25%
Mitsuba Italia S.p.A. Pontedera Italy 1,000,000.00 euro 10% Piaggio & C. S.p.A. 10%
Pont - Tech , Pontedera & Tecnologia S.c.r.l.
Pontedera Italy 884,160.00 euro 20.44% Piaggio & C. S.p.A. 20.44%
S.A.T. Societé d'Automobiles et Triporteurs S.A.
Tunis Tunisia 210,000.00 TND 20% Piaggio Vespa B.V. 20%
List of companies included in the scope of consolidation with the equity method as of 30 June 2011
List of other significant equity investments as of 30 June 2011
Consolidated Income Comprehensive IncomeFinancial PositionCash Flow StatementConsolidated Net Debt ChangesNotes
106Piaggio Group
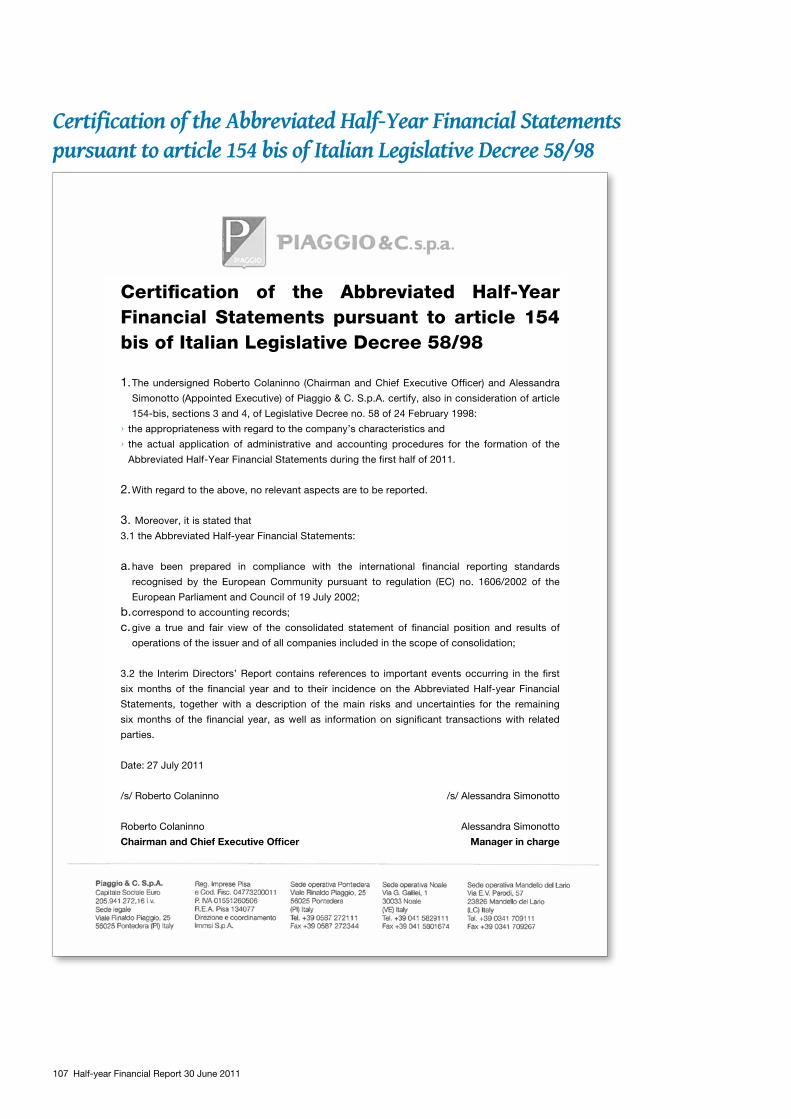
107 Half-year Financial Report 30 June 2011
Certification of the Abbreviated Half-Year Financial Statements pursuant to article 154 bis of Italian Legislative Decree 58/98
Certification of the Abbreviated Half-Year Financial Statements pursuant to article 154 bis of Italian Legislative Decree 58/98
The undersigned Roberto Colaninno (Chairman and Chief Executive Officer) and Alessandra 1. Simonotto (Appointed Executive) of Piaggio & C. S.p.A. certify, also in consideration of article
154-bis, sections 3 and 4, of Legislative Decree no. 58 of 24 February 1998:
the appropriateness with regard to the company’s characteristics and ›the actual application of administrative and accounting procedures for the formation of the ›Abbreviated Half-Year Financial Statements during the first half of 2011.
With regard to the above, no relevant aspects are to be reported. 2.
Moreover, it is stated that 3. 3.1 the Abbreviated Half-year Financial Statements:
have been prepared in compliance with the international financial reporting standards a. recognised by the European Community pursuant to regulation (EC) no. 1606/2002 of the
European Parliament and Council of 19 July 2002;
correspond to accounting records; b. give a true and fair view of the consolidated statement of financial position and results of c. operations of the issuer and of all companies included in the scope of consolidation;
3.2 the Interim Directors’ Report contains references to important events occurring in the first
six months of the financial year and to their incidence on the Abbreviated Half-year Financial
Statements, together with a description of the main risks and uncertainties for the remaining
six months of the financial year, as well as information on significant transactions with related
parties.
Date: 27 July 2011
/s/ Roberto Colaninno /s/ Alessandra Simonotto
Roberto Colaninno Alessandra Simonotto
Chairman and Chief Executive Officer Manager in charge
108Piaggio Group
Report of the Independent Auditors on the limited auditing of the Abbreviated Half-Year Financial Statements
109 Half-year Financial Report 30 June 2011
DA AGGIORNARE
Management and coordinationIMMSI S.p.A.Share capital EUR 205,941,272.16 fully paid upRegistered office: Viale R. Piaggio 25, Pontedera (Pisa)Pisa Register of Companies and Tax Code 04773200011Pisa Economic and Administrative Index no. 134077
Contacts
Investor RelatorRaffaele LupottoEmail: [email protected]. +390587 272286Fax +390587 276093
Piaggio & C. SpAVia Rinaldo Piaggio 2556025 Pontedera (PI)


112Piaggio Group00 Bilancio 2010
Conto EconomicoStato patrimonialeRendiconto finanziarioPosizione finanziaria netta Prospetto Note esplicative e integrative
000000000000
Piaggio & C S.p.A.


![Barco 6 months ended Barco/Investor relations...Barco | 6 months ended 30 June 2012 3 KEY FIGURES 2012 2011 [ in thousands of euro ] 1st half 1st half Net sales 530,994 490,300 Gross](https://img.pdfslide.us/doc/110x75/5ae250537f8b9ad47c8cf484/barco-6-months-ended-barcoinvestor-relationsbarco-6-months-ended-30-june-2012.jpg)