Embed Size (px)
Citation preview
1
Pakistan Investment Research
BMA Flashnote Monday, April 26, 2021
BMA Capital Management Ltd. 801 Unitower, I.I.Chundrigar Road, Karachi, 74000, Pakistan For
further queries. Last page of this report contains important disclosures and disclaimers. Please
contact: [email protected] or call UAN: 111-262-111
Fauji Fertilizer Bin Qasim Limited
1QCY21: EARNINGS REVIEW Higher DAP margins lead to earnings turnaround
REP—005
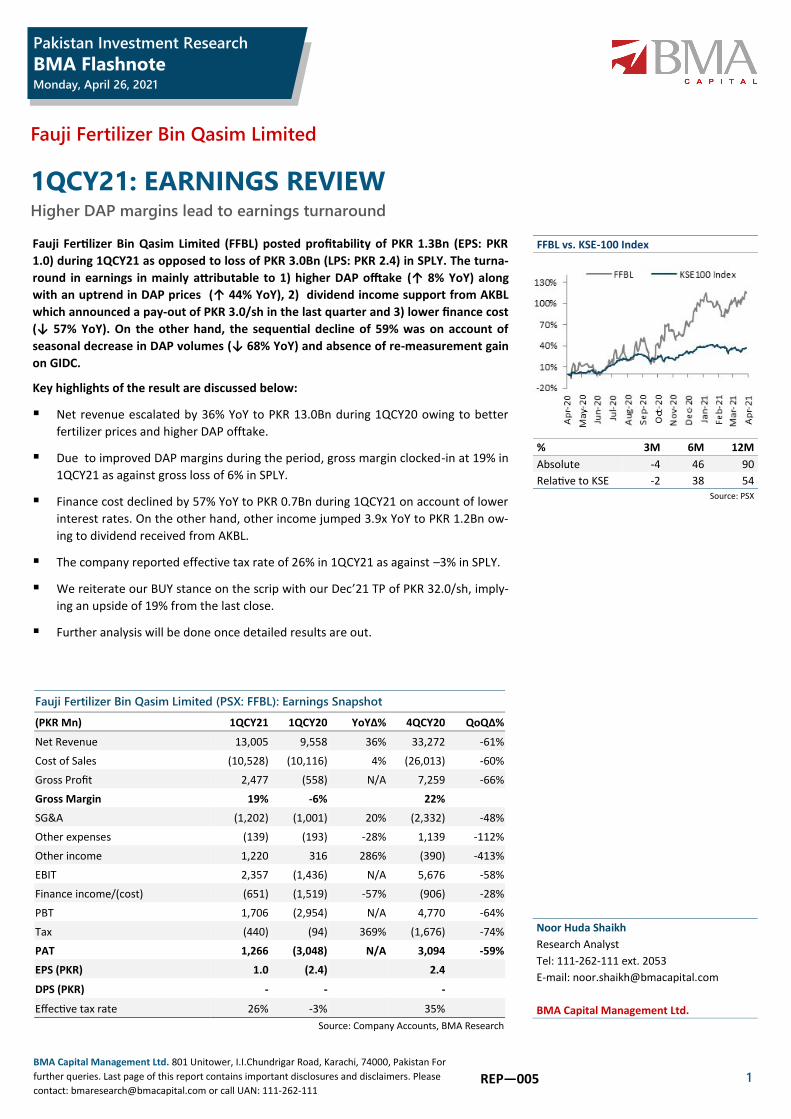
Fauji Fertilizer Bin Qasim Limited (FFBL) posted profitability of PKR 1.3Bn (EPS: PKR
1.0) during 1QCY21 as opposed to loss of PKR 3.0Bn (LPS: PKR 2.4) in SPLY. The turna-
round in earnings in mainly attributable to 1) higher DAP offtake (↑ 8% YoY) along
with an uptrend in DAP prices (↑ 44% YoY), 2) dividend income support from AKBL
which announced a pay-out of PKR 3.0/sh in the last quarter and 3) lower finance cost
(↓ 57% YoY). On the other hand, the sequential decline of 59% was on account of
seasonal decrease in DAP volumes (↓ 68% YoY) and absence of re-measurement gain
on GIDC.
Key highlights of the result are discussed below:
Net revenue escalated by 36% YoY to PKR 13.0Bn during 1QCY20 owing to better
fertilizer prices and higher DAP offtake.
Due to improved DAP margins during the period, gross margin clocked-in at 19% in
1QCY21 as against gross loss of 6% in SPLY.
Finance cost declined by 57% YoY to PKR 0.7Bn during 1QCY21 on account of lower
interest rates. On the other hand, other income jumped 3.9x YoY to PKR 1.2Bn ow-
ing to dividend received from AKBL.
The company reported effective tax rate of 26% in 1QCY21 as against –3% in SPLY.
We reiterate our BUY stance on the scrip with our Dec’21 TP of PKR 32.0/sh, imply-
ing an upside of 19% from the last close.
Further analysis will be done once detailed results are out.
Noor Huda Shaikh
Research Analyst
Tel: 111-262-111 ext. 2053
E-mail: [email protected]
BMA Capital Management Ltd.
FFBL vs. KSE-100 Index
% 3M 6M 12M
Absolute -4 46 90
Relative to KSE -2 38 54 Source: PSX
Fauji Fertilizer Bin Qasim Limited (PSX: FFBL): Earnings Snapshot
(PKR Mn) 1QCY21 1QCY20 YoYΔ% 4QCY20 QoQΔ%
Net Revenue 13,005 9,558 36% 33,272 -61%
Cost of Sales (10,528) (10,116) 4% (26,013) -60%
Gross Profit 2,477 (558) N/A 7,259 -66%
Gross Margin 19% -6% 22%
SG&A (1,202) (1,001) 20% (2,332) -48%
Other expenses (139) (193) -28% 1,139 -112%
Other income 1,220 316 286% (390) -413%
EBIT 2,357 (1,436) N/A 5,676 -58%
Finance income/(cost) (651) (1,519) -57% (906) -28%
PBT 1,706 (2,954) N/A 4,770 -64%
Tax (440) (94) 369% (1,676) -74%
PAT 1,266 (3,048) N/A 3,094 -59%
EPS (PKR) 1.0 (2.4) 2.4
DPS (PKR) - - -
Effective tax rate 26% -3% 35%
Source: Company Accounts, BMA Research
Disclaimer
This research report is for information purposes only and does not constitute nor is it intended as an offer or solicitation for the purchase or sale of securities or other financial instruments. Neither the information contained in this research report nor any future information made available with the subject matter contained herein will form the basis of any contract. Information and opinions contained herein have been compiled or arrived at by BMA Capital Management Limited from publicly availa-ble information and sources that BMA Capital Management Limited believed to be reliable. Whilst every care has been taken in preparing this research report, no re-search analyst, director, officer, employee, agent or adviser of any member of BMA Capital Management Limited gives or makes any representation, warranty or under-taking, whether express or implied, and accepts no responsibility or liability as to the reliability, accuracy or completeness of the information set out in this research report. Any responsibility or liability for any information contained herein is expressly disclaimed. All information contained herein is subject to change at any time without notice. No member of BMA Capital Management Limited has an obligation to update, modify or amend this research report or to otherwise notify a reader thereof in the event that any matter stated herein, or any opinion, projection, forecast or estimate set forth herein, changes or subsequently becomes inaccurate, or if research on the subject company is withdrawn. Furthermore, past performance is not indicative of future results.
The investments and strategies discussed herein may not be suitable for all investors or any particular class of investor. Investors should make their own investment decisions using their own independent advisors as they believe necessary and based upon their specific financial situations and investment objectives when investing. Investors should consult their independent advisors if they have any doubts as to the applicability to their business or investment objectives of the information and the strategies discussed herein. This research report is being furnished to certain persons as permitted by applicable law, and accordingly may not be reproduced or circu-lated to any other person without the prior written consent of a member of BMA Capital Management Limited. This research report may not be relied upon by any retail customers or person to whom this research report may not be provided by law. Unauthorized use or disclosure of this research report is strictly prohibited. Mem-bers of BMA Capital Management and/or their respective principals, directors, officers and employees may own, have positions or effect transactions in the securities or financial instruments referred herein or in the investments of any issuers discussed herein, may engage in securities transactions in a manner inconsistent with the research contained in this research report and with respect to securities or financial instruments covered by this research report, may sell to or buy from customers on a principal basis and may serve or act as director, placement agent, advisor or lender, or make a market in, or may have been a manager or a co-manager of the most recent public offering in respect of any investments or issuers of such securities or financial instruments referenced in this research report or may perform any other investment banking or other services for, or solicit investment banking or other business from any company mentioned in this research report. Investing in Pakistan involves a high degree of risk and many persons, physical and legal, may be restricted from dealing in the securities market of Pakistan. Investors should perform their own due diligence before investing. No part of the compensation of the authors of this research report was, is or will be directly or indirectly related to the specific recommendations or views contained in the research report. By accepting this research report, you agree to be bound by the foregoing limitations.
BMA Capital Management Limited and / or any of its affiliates, which operate outside Pakistan, do and seek to do business with the company(s) covered in this research document. Investors should consider this research report as only a single factor in making their investment decision. BMA Research Policy prohibits research personnel from disclosing a recommendation, investment rating, or investment thesis for review by an issuer/company prior to the publication of a research report containing such rating, recommendation or investment thesis.
Stock Rating
Investors should carefully read the definitions of all rating used within every research reports. In addition, research reports carry an analyst’s independent view and investors should ensure careful reading of the entire research reports and not infer its contents from the rating ascribed by the analyst. Ratings should not be used or relied upon as investment advice. An investor’s decision to buy, hold or sell a stock should depend on said individual’s circumstances and other considerations. BMA Capital Limited uses a three tier rating system: i) Buy, ii) Neutral and iii) Underperform (new rating system effective Jan 1’18) with our rating being based on total stock returns versus BMA’s index target return for the year. A table presenting BMA’s rating definitions is given below:
Old rating system
Valuation Methodology
To arrive at our period end target prices, BMA Capital uses different valuation methodologies including
Discounted cash flow (DCF, DDM)
Relative Valuation (P/E, P/B, P/S etc.)
Equity & Asset return based methodologies (EVA, Residual Income etc.)
Buy >15% expected total return
Hold 10%-15% expected total return
Underperform <10% expected total return
*Total stock return = capital gain + dividend yield
Overweight Total sector return > expected market return
Marketweight Expected market return
Underweight Total stock return < expected market return
BMA Flashnote
Fauji Fertilizer Bin Qasim Limited
Monday, April 26, 2021 2