Embed Size (px)
Citation preview
1Q18 Results Presentation
13 November 2017
Disclaimer
This is a presentation of general information relating to the current activities of the Health Management International Ltd (“HMI”). It is
given in summary form and does not purport to be complete. In addition, the presentation may contain forward-looking statements
relating to financial trends for future periods, compared to the results for previous periods. Some of the statements contained herein
are not historical facts but are statements of future expectations relating to the financial conditions, results of operations and
businesses and related plans and objectives. The information is based on certain views and assumptions and would thus involve
risks and uncertainties. Actual future performance, outcomes and results may differ materially from those expressed in these forward-
looking statements as a result of a number of risks, uncertainties and assumptions. Representative examples of these factors include
(without limitation) general industry and economic conditions, interest rate trends, cost of capital and capital availability, competition
from other companies, shifts in customer demands, customers and partners, changes in operating expenses, including employee
wages, benefits and training, governmental and public policy changes, and the continued availability of financing in the amounts and
the terms necessary to support future business. Such statements are not and should not be construed as a representation as to the
future of HMI and should not be regarded as a forecast or projection of future performance. No reliance should therefore be placed
on these forward-looking statements, which are based on the current view of the management of HMI on future events. The
presentation is also not to be relied upon as advice to investors or potential investors and does not take into account the investment
objectives, financial situation or needs of any particular investor. HMI accepts no responsibility whatsoever with respect to the use of
this document or any part thereof.
2
Key 1Q18 Highlights
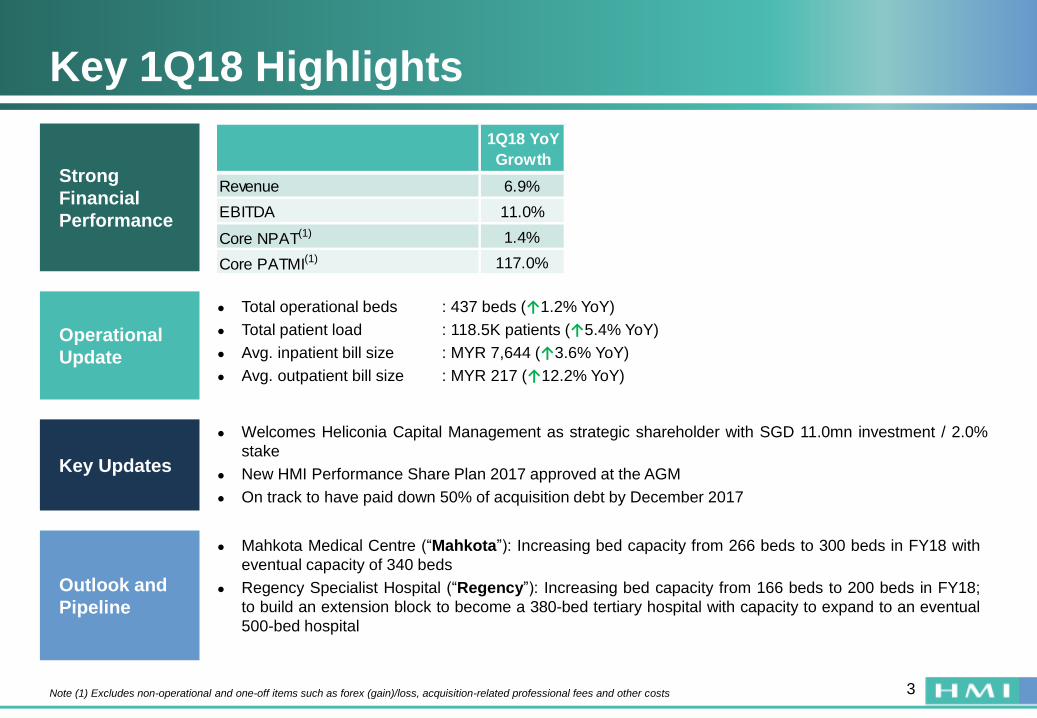
3Note (1) Excludes non-operational and one-off items such as forex (gain)/loss, acquisition-related professional fees and other costs
Strong
Financial
Performance
Operational
Update
● Total operational beds : 437 beds (↑1.2% YoY)
● Total patient load : 118.5K patients (↑5.4% YoY)
● Avg. inpatient bill size : MYR 7,644 (↑3.6% YoY)
● Avg. outpatient bill size : MYR 217 (↑12.2% YoY)
Outlook and
Pipeline
● Mahkota Medical Centre (“Mahkota”): Increasing bed capacity from 266 beds to 300 beds in FY18 with
eventual capacity of 340 beds
● Regency Specialist Hospital (“Regency”): Increasing bed capacity from 166 beds to 200 beds in FY18;
to build an extension block to become a 380-bed tertiary hospital with capacity to expand to an eventual
500-bed hospital
Key Updates
● Welcomes Heliconia Capital Management as strategic shareholder with SGD 11.0mn investment / 2.0%
stake
● New HMI Performance Share Plan 2017 approved at the AGM
● On track to have paid down 50% of acquisition debt by December 2017
1Q18 YoY
Growth
Revenue 6.9%
EBITDA 11.0%
Core NPAT(1) 1.4%
Core PATMI(1) 117.0%
Resilient Financial Performance
4
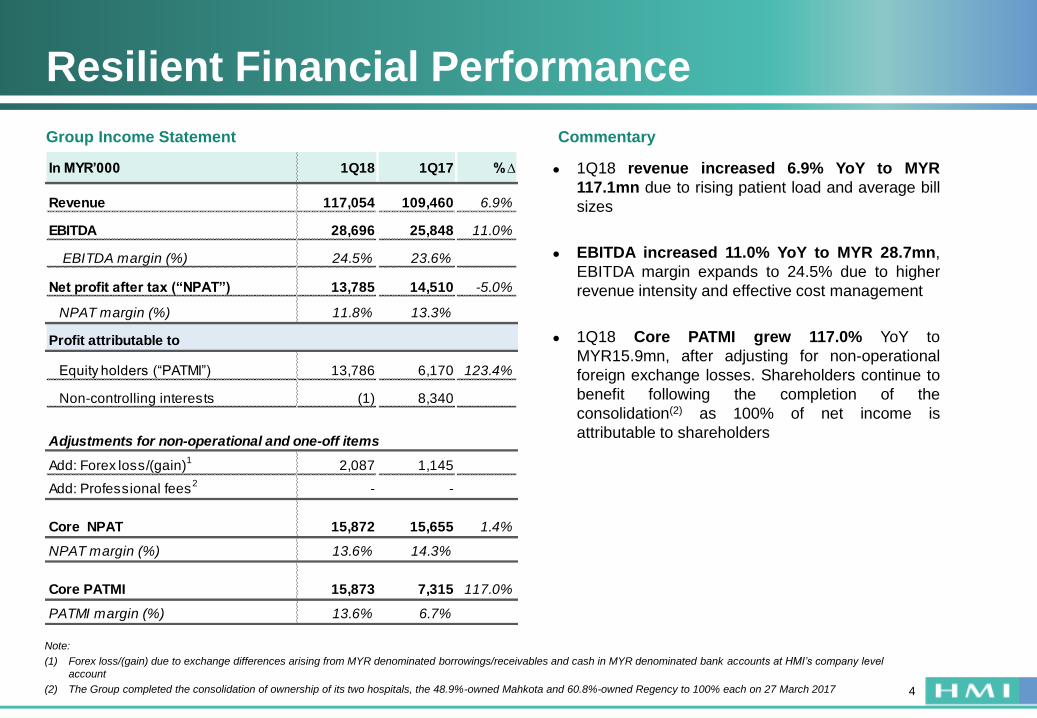
Group Income Statement
Note:
(1) Forex loss/(gain) due to exchange differences arising from MYR denominated borrowings/receivables and cash in MYR denominated bank accounts at HMI’s company level
account
(2) The Group completed the consolidation of ownership of its two hospitals, the 48.9%-owned Mahkota and 60.8%-owned Regency to 100% each on 27 March 2017
Commentary
● 1Q18 revenue increased 6.9% YoY to MYR
117.1mn due to rising patient load and average bill
sizes
● EBITDA increased 11.0% YoY to MYR 28.7mn,
EBITDA margin expands to 24.5% due to higher
revenue intensity and effective cost management
● 1Q18 Core PATMI grew 117.0% YoY to
MYR15.9mn, after adjusting for non-operational
foreign exchange losses. Shareholders continue to
benefit following the completion of the
consolidation(2) as 100% of net income is
attributable to shareholders
In MYR’000 1Q18 1Q17 % ∆
Revenue 117,054 109,460 6.9%
EBITDA 28,696 25,848 11.0%
EBITDA margin (%) 24.5% 23.6%
Net profit after tax (“NPAT”) 13,785 14,510 -5.0%
NPAT margin (%) 11.8% 13.3%
Profit attributable to
Equity holders (“PATMI”) 13,786 6,170 123.4%
Non-controlling interests (1) 8,340
Adjustments for non-operational and one-off items
Add: Forex loss/(gain)1
2,087 1,145
Add: Professional fees2
- -
Core NPAT 15,872 15,655 1.4%
NPAT margin (%) 13.6% 14.3%
Core PATMI 15,873 7,315 117.0%
PATMI margin (%) 13.6% 6.7%
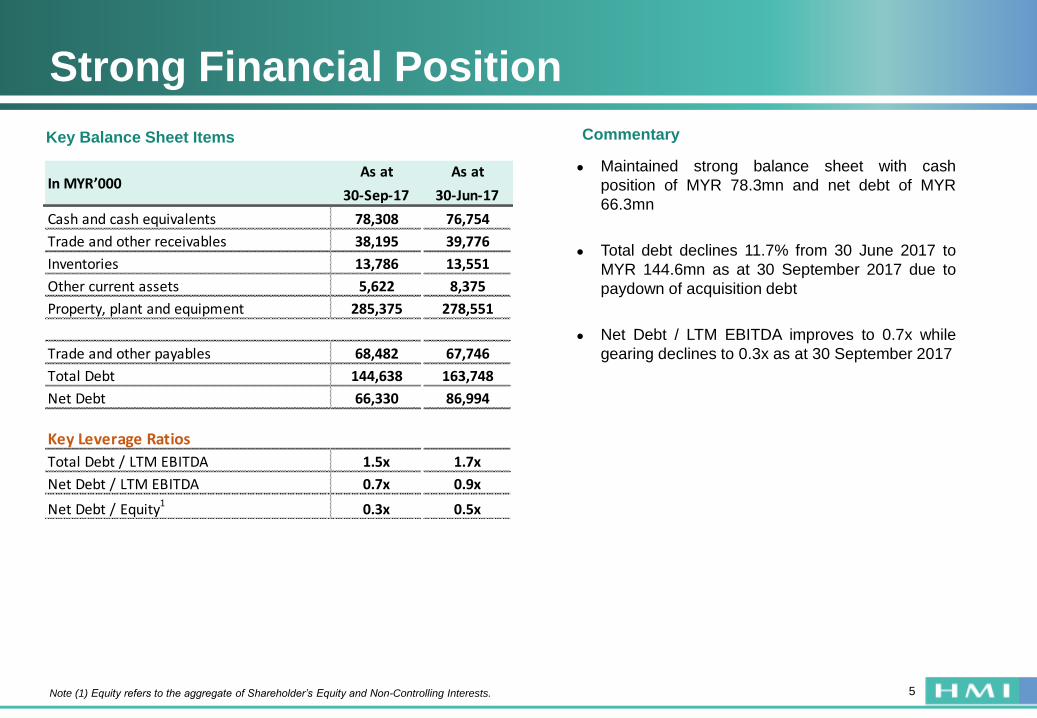
Key Balance Sheet Items
Strong Financial Position
5
Commentary
Note (1) Equity refers to the aggregate of Shareholder’s Equity and Non-Controlling Interests.
● Maintained strong balance sheet with cash
position of MYR 78.3mn and net debt of MYR
66.3mn
● Total debt declines 11.7% from 30 June 2017 to
MYR 144.6mn as at 30 September 2017 due to
paydown of acquisition debt
● Net Debt / LTM EBITDA improves to 0.7x while
gearing declines to 0.3x as at 30 September 2017
As at As at
30-Sep-17 30-Jun-17
Cash and cash equivalents 78,308 76,754
Trade and other receivables 38,195 39,776
Inventories 13,786 13,551
Other current assets 5,622 8,375
Property, plant and equipment 285,375 278,551
Trade and other payables 68,482 67,746
Total Debt 144,638 163,748
Net Debt 66,330 86,994
Key Leverage Ratios
Total Debt / LTM EBITDA 1.5x 1.7x
Net Debt / LTM EBITDA 0.7x 0.9x
Net Debt / Equity1
0.3x 0.5x
In MYR’000
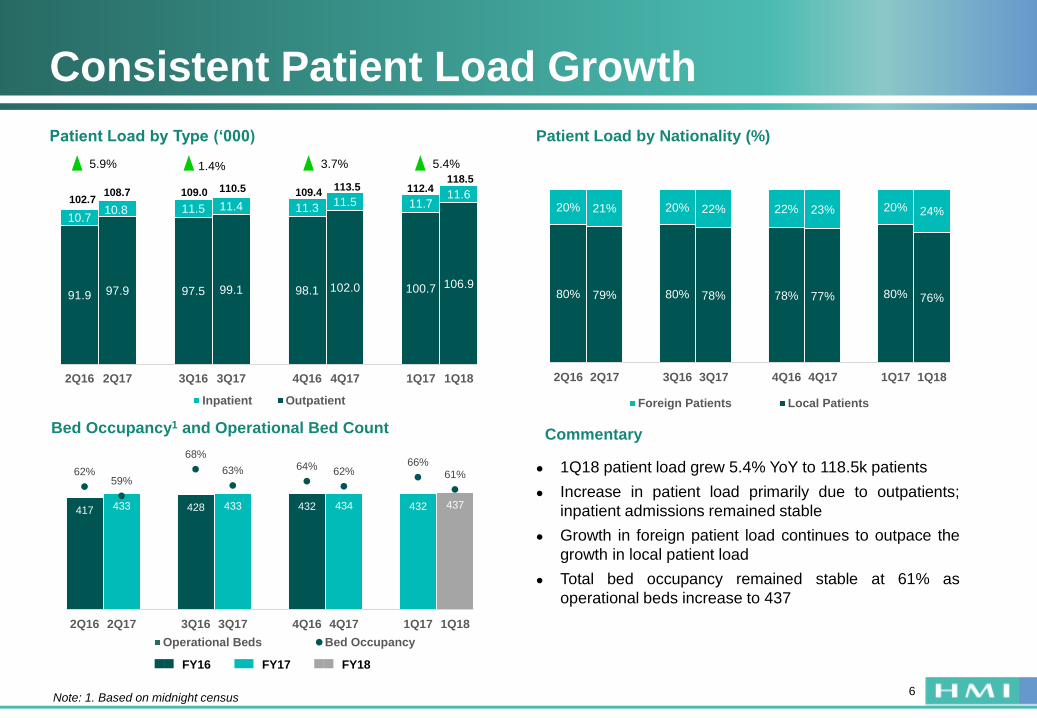
417 433 428 433 432 434 432 437
62%59%
68%
63% 64%62%
66%61%
2Q16 2Q17 3Q16 3Q17 4Q16 4Q17 1Q17 1Q18
Operational Beds Bed Occupancy
91.9 97.9 97.5 99.1 98.1 102.0 100.7 106.9
10.710.8 11.5 11.4 11.3
11.5 11.711.6
2Q16 2Q17 3Q16 3Q17 4Q16 4Q17 1Q17 1Q18
Inpatient Outpatient
Consistent Patient Load Growth
6Note: 1. Based on midnight census
Patient Load by Type (‘000) Patient Load by Nationality (%)
Commentary
● 1Q18 patient load grew 5.4% YoY to 118.5k patients
● Increase in patient load primarily due to outpatients;
inpatient admissions remained stable
● Growth in foreign patient load continues to outpace the
growth in local patient load
● Total bed occupancy remained stable at 61% as
operational beds increase to 437
3.7%5.9% 1.4%
Bed Occupancy1 and Operational Bed Count
5.4%
102.7108.7
118.5113.5 112.4109.4110.5109.0
80% 79% 80% 78% 78% 77% 80% 76%
20% 21% 20% 22% 22% 23% 20% 24%
2Q16 2Q17 3Q16 3Q17 4Q16 4Q17 1Q17 1Q18
Foreign Patients Local Patients
FY16 FY17 FY18
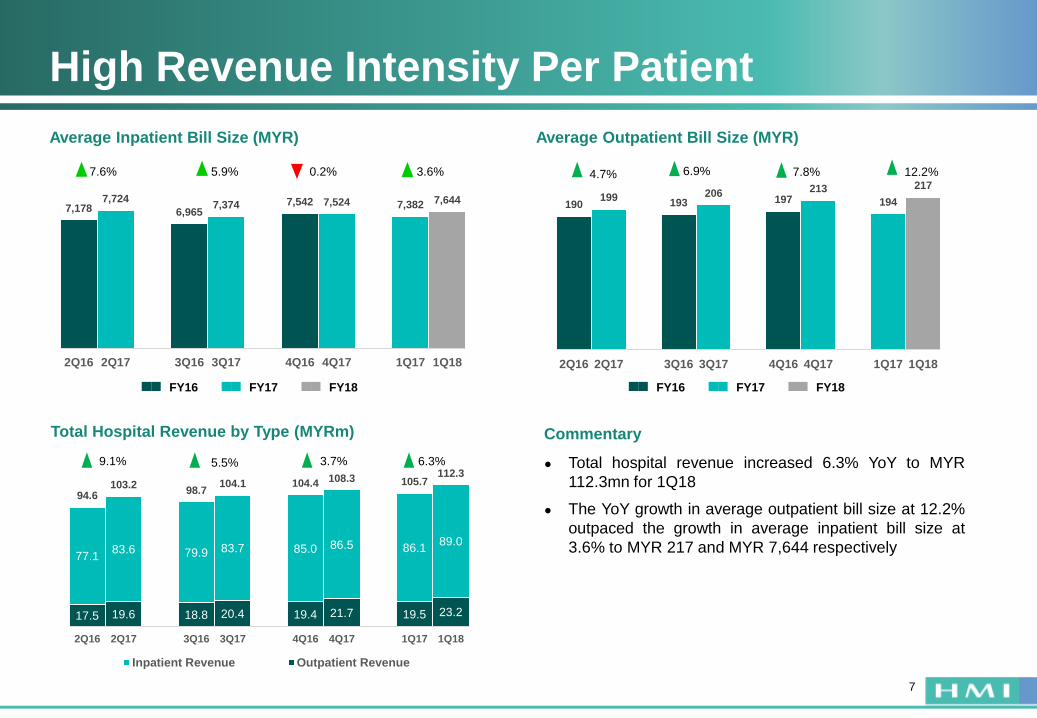
17.5 19.6 18.8 20.4 19.4 21.7 19.5 23.2
77.183.6 79.9 83.7 85.0 86.5 86.1
89.0
94.6103.2
98.7104.1 104.4 108.3 105.7
112.3
2Q16 2Q17 3Q16 3Q17 4Q16 4Q17 1Q17 1Q18
Inpatient Revenue Outpatient Revenue
190199
193206
197213
194
217
2Q16 2Q17 3Q16 3Q17 4Q16 4Q17 1Q17 1Q18
High Revenue Intensity Per Patient
7
Average Inpatient Bill Size (MYR) Average Outpatient Bill Size (MYR)
Total Hospital Revenue by Type (MYRm) Commentary
● Total hospital revenue increased 6.3% YoY to MYR
112.3mn for 1Q18
● The YoY growth in average outpatient bill size at 12.2%
outpaced the growth in average inpatient bill size at
3.6% to MYR 217 and MYR 7,644 respectively
6.3%9.1% 5.5% 3.7%
7.8%4.7% 6.9%3.6%7.6% 5.9% 0.2% 12.2%
7,1787,724
6,9657,374 7,542 7,524 7,382 7,644
2Q16 2Q17 3Q16 3Q17 4Q16 4Q17 1Q17 1Q18
FY16 FY17 FY18 FY16 FY17 FY18
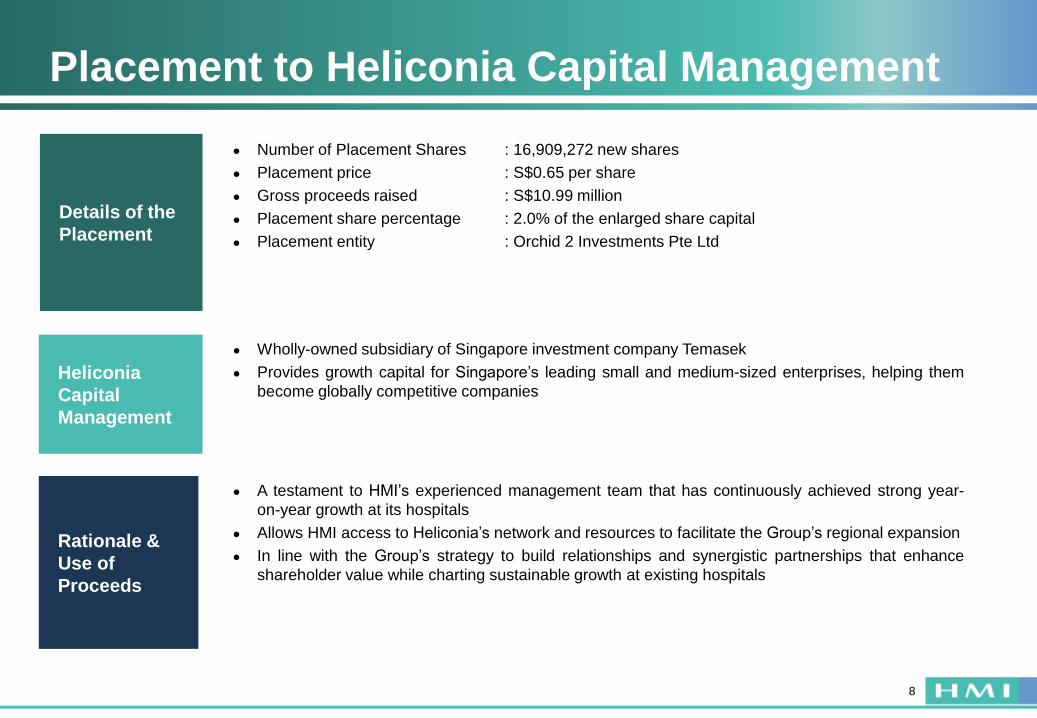
Placement to Heliconia Capital Management
8
● Number of Placement Shares
● Placement price
● Gross proceeds raised
● Placement share percentage
● Placement entity
● Wholly-owned subsidiary of Singapore investment company Temasek
● Provides growth capital for Singapore’s leading small and medium-sized enterprises, helping them
become globally competitive companies
● A testament to HMI’s experienced management team that has continuously achieved strong year-
on-year growth at its hospitals
● Allows HMI access to Heliconia’s network and resources to facilitate the Group’s regional expansion
● In line with the Group’s strategy to build relationships and synergistic partnerships that enhance
shareholder value while charting sustainable growth at existing hospitals
Details of the
Placement
Heliconia
Capital
Management
Rationale &
Use of
Proceeds
: 16,909,272 new shares
: S$0.65 per share
: S$10.99 million
: 2.0% of the enlarged share capital
: Orchid 2 Investments Pte Ltd
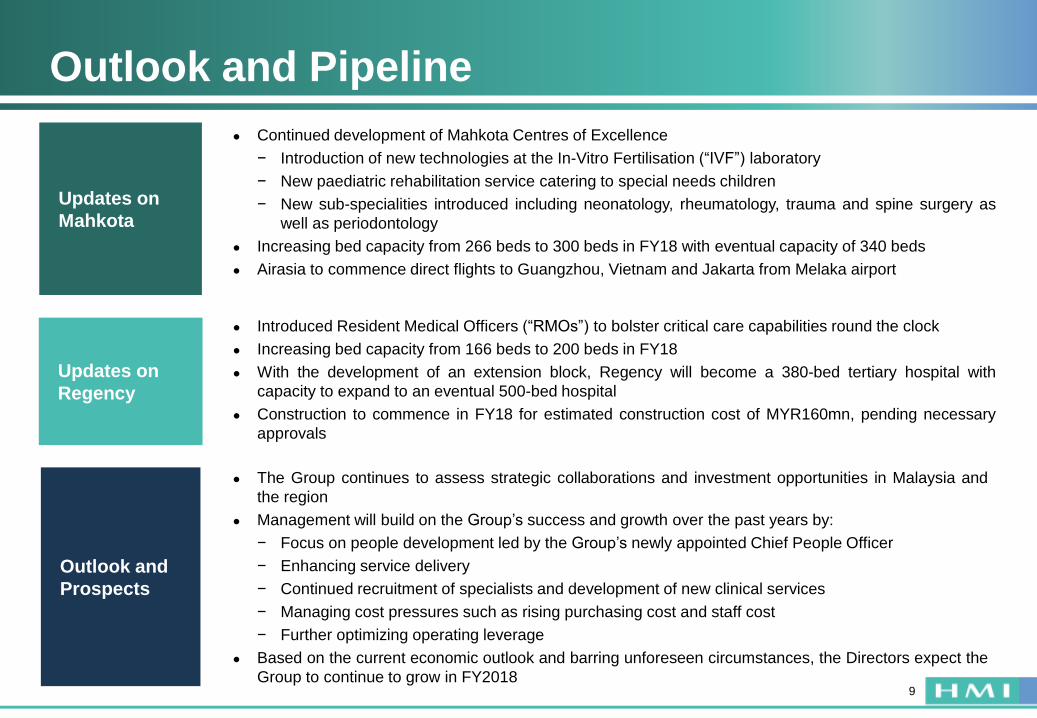
Outlook and Pipeline
9
● Continued development of Mahkota Centres of Excellence
− Introduction of new technologies at the In-Vitro Fertilisation (“IVF”) laboratory
− New paediatric rehabilitation service catering to special needs children
− New sub-specialities introduced including neonatology, rheumatology, trauma and spine surgery as
well as periodontology
● Increasing bed capacity from 266 beds to 300 beds in FY18 with eventual capacity of 340 beds
● Airasia to commence direct flights to Guangzhou, Vietnam and Jakarta from Melaka airport
● Introduced Resident Medical Officers (“RMOs”) to bolster critical care capabilities round the clock
● Increasing bed capacity from 166 beds to 200 beds in FY18
● With the development of an extension block, Regency will become a 380-bed tertiary hospital with
capacity to expand to an eventual 500-bed hospital
● Construction to commence in FY18 for estimated construction cost of MYR160mn, pending necessary
approvals
● The Group continues to assess strategic collaborations and investment opportunities in Malaysia and
the region
● Management will build on the Group’s success and growth over the past years by:
− Focus on people development led by the Group’s newly appointed Chief People Officer
− Enhancing service delivery
− Continued recruitment of specialists and development of new clinical services
− Managing cost pressures such as rising purchasing cost and staff cost
− Further optimizing operating leverage
● Based on the current economic outlook and barring unforeseen circumstances, the Directors expect the
Group to continue to grow in FY2018
Updates on
Mahkota
Updates on
Regency
Outlook and
Prospects
APPENDICES
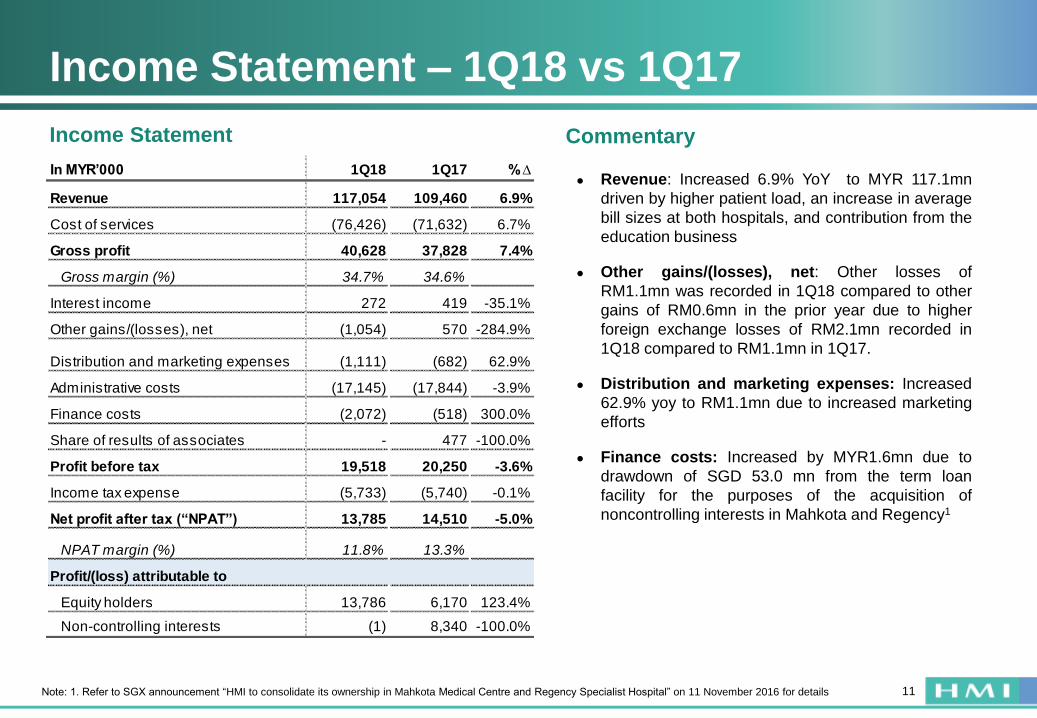
Income Statement – 1Q18 vs 1Q17
11
● Revenue: Increased 6.9% YoY to MYR 117.1mn
driven by higher patient load, an increase in average
bill sizes at both hospitals, and contribution from the
education business
● Other gains/(losses), net: Other losses of
RM1.1mn was recorded in 1Q18 compared to other
gains of RM0.6mn in the prior year due to higher
foreign exchange losses of RM2.1mn recorded in
1Q18 compared to RM1.1mn in 1Q17.
● Distribution and marketing expenses: Increased
62.9% yoy to RM1.1mn due to increased marketing
efforts
● Finance costs: Increased by MYR1.6mn due to
drawdown of SGD 53.0 mn from the term loan
facility for the purposes of the acquisition of
noncontrolling interests in Mahkota and Regency1
CommentaryIncome Statement
Note: 1. Refer to SGX announcement “HMI to consolidate its ownership in Mahkota Medical Centre and Regency Specialist Hospital” on 11 November 2016 for details
In MYR’000 1Q18 1Q17 % ∆
Revenue 117,054 109,460 6.9%
Cost of services (76,426) (71,632) 6.7%
Gross profit 40,628 37,828 7.4%
Gross margin (%) 34.7% 34.6%
Interest income 272 419 -35.1%
Other gains/(losses), net (1,054) 570 -284.9%
Distribution and marketing expenses (1,111) (682) 62.9%
Administrative costs (17,145) (17,844) -3.9%
Finance costs (2,072) (518) 300.0%
Share of results of associates - 477 -100.0%
Profit before tax 19,518 20,250 -3.6%
Income tax expense (5,733) (5,740) -0.1%
Net profit after tax (“NPAT”) 13,785 14,510 -5.0%
NPAT margin (%) 11.8% 13.3%
Profit/(loss) attributable to
Equity holders 13,786 6,170 123.4%
Non-controlling interests (1) 8,340 -100.0%
THANK YOU
Investor and media relations
Mr. Chong Yap, Tok
Mr. James Bywater
Tel: (65) 6438 2990