Embed Size (px)
Citation preview

1Q17 Financial Results
April 25, 2017
©2017 DISCOVER FINANCIAL SERVICES
Notice
The following slides are part of a presentation by Discover Financial Services (the "Company") in connection with
reporting quarterly financial results and are intended to be viewed as part of that presentation. No representation is made
that the information in these slides is complete. For additional financial, statistical, and business related information, as
well as information regarding business and segment trends, see the earnings release and financial supplement included
as exhibits to the Company’s Current Report on Form 8-K filed today and available on the Company’s website
(www.discover.com) and the SEC’s website (www.sec.gov).
The information provided herein includes certain non-GAAP financial measures. The reconciliations of such measures to
the comparable GAAP figures are included at the end of this presentation, which is available on the Company’s website
and the SEC’s website.
The presentation contains forward-looking statements. You are cautioned not to place undue reliance on forward-looking
statements, which speak only as of the date on which they are made, which reflect management’s estimates,
projections, expectations or beliefs at that time, and which are subject to risks and uncertainties that may cause actual
results to differ materially. For a discussion of certain risks and uncertainties that may affect the future results of the
Company, please see "Special Note Regarding Forward-Looking Statements," "Risk Factors," "Business – Competition,"
"Business – Supervision and Regulation" and "Management’s Discussion and Analysis of Financial Condition and
Results of Operations" in the Company’s Annual Report on Form 10-K for the year ended December 31, 2016, which is
filed with the SEC and available at the SEC's website (www.sec.gov). The Company does not undertake to update or
revise forward-looking statements as more information becomes available.
Notice
2
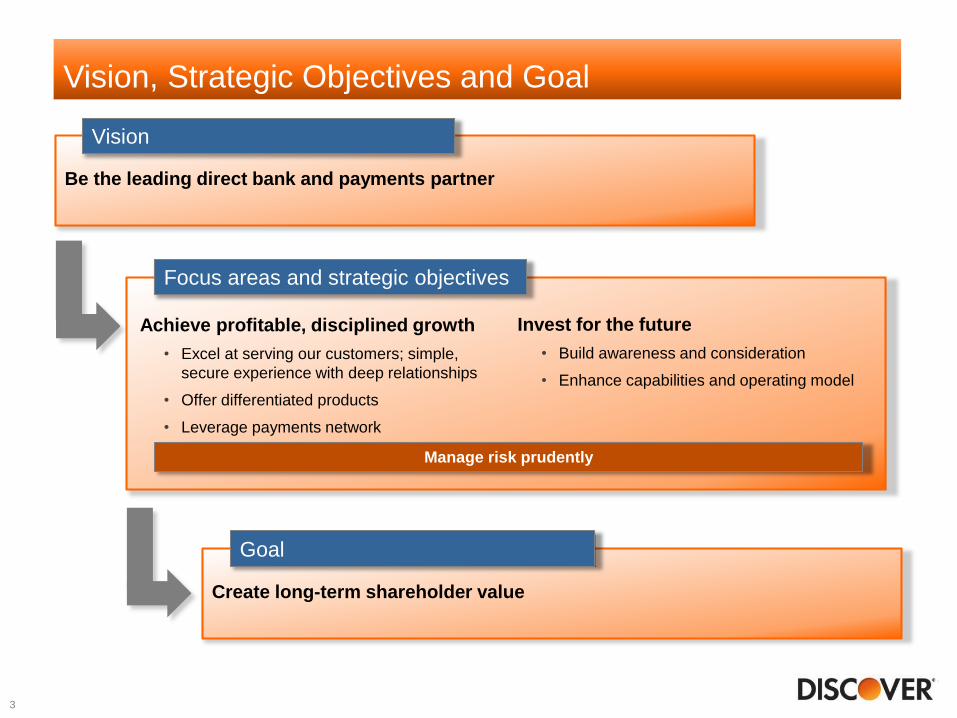
Be the leading direct bank and payments partner
Vision, Strategic Objectives and Goal
3
Vision
Create long-term shareholder value
Goal
Focus areas and strategic objectives
Invest for the future
• Build awareness and consideration
• Enhance capabilities and operating model
Achieve profitable, disciplined growth
• Excel at serving our customers; simple,
secure experience with deep relationships
• Offer differentiated products
• Leverage payments network
Manage risk prudently
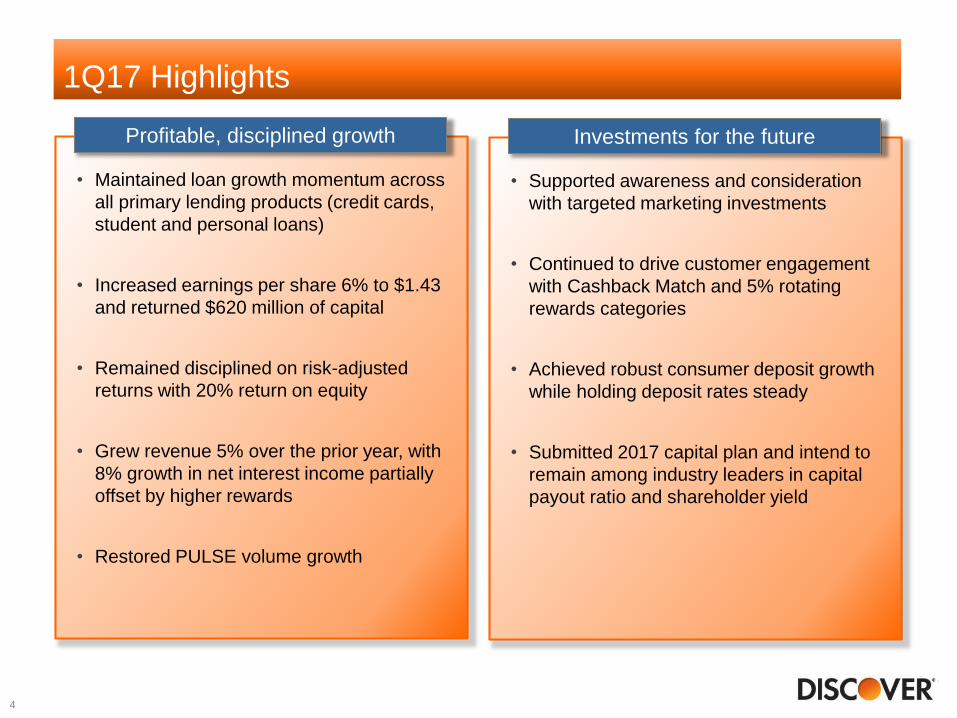
1Q17 Highlights
• Maintained loan growth momentum across
all primary lending products (credit cards,
student and personal loans)
• Increased earnings per share 6% to $1.43
and returned $620 million of capital
• Remained disciplined on risk-adjusted
returns with 20% return on equity
• Grew revenue 5% over the prior year, with
8% growth in net interest income partially
offset by higher rewards
• Restored PULSE volume growth
Profitable, disciplined growth
• Supported awareness and consideration
with targeted marketing investments
• Continued to drive customer engagement
with Cashback Match and 5% rotating
rewards categories
• Achieved robust consumer deposit growth
while holding deposit rates steady
• Submitted 2017 capital plan and intend to
remain among industry leaders in capital
payout ratio and shareholder yield
Investments for the future
4
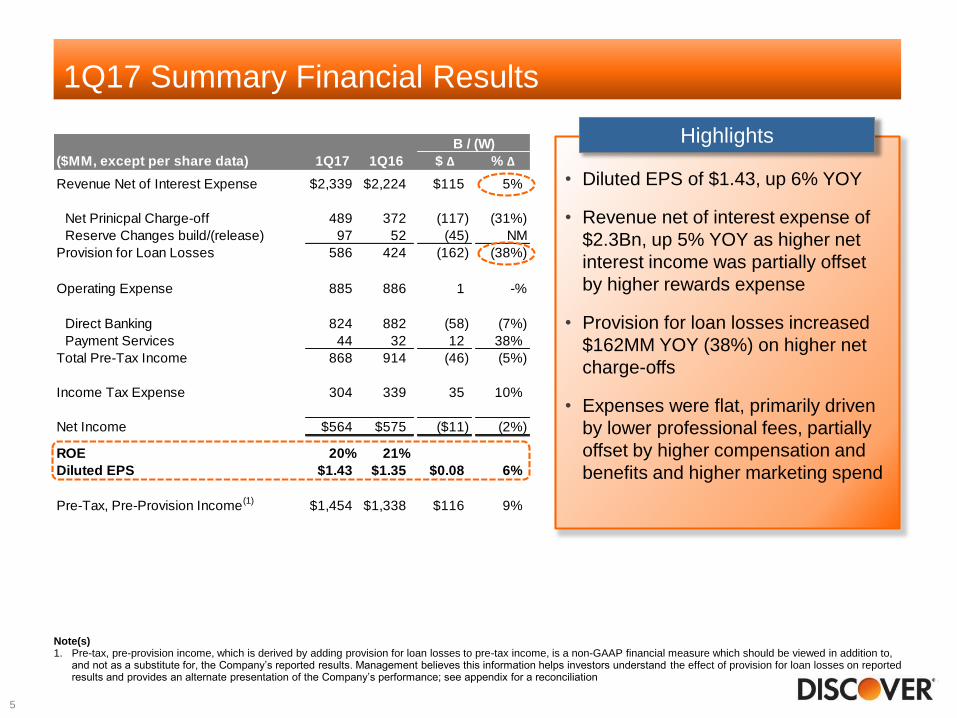
($MM, except per share data) 1Q17 1Q16 $ ∆ % ∆
Revenue Net of Interest Expense $2,339 $2,224 $115 5%
Net Prinicpal Charge-off 489 372 (117) (31%)
Reserve Changes build/(release) 97 52 (45) NM
Provision for Loan Losses 586 424 (162) (38%)
Operating Expense 885 886 1 -%
Direct Banking 824 882 (58) (7%)
Payment Services 44 32 12 38%
Total Pre-Tax Income 868 914 (46) (5%)
Income Tax Expense 304 339 35 10%
Net Income $564 $575 ($11) (2%)
ROE 20% 21%
Diluted EPS $1.43 $1.35 $0.08 6%
Pre-Tax, Pre-Provision Income(1)
$1,454 $1,338 $116 9%
B / (W)
1Q17 Summary Financial Results
5
Note(s)1. Pre-tax, pre-provision income, which is derived by adding provision for loan losses to pre-tax income, is a non-GAAP financial measure which should be viewed in addition to,
and not as a substitute for, the Company’s reported results. Management believes this information helps investors understand the effect of provision for loan losses on reported results and provides an alternate presentation of the Company’s performance; see appendix for a reconciliation
• Diluted EPS of $1.43, up 6% YOY
• Revenue net of interest expense of
$2.3Bn, up 5% YOY as higher net
interest income was partially offset
by higher rewards expense
• Provision for loan losses increased
$162MM YOY (38%) on higher net
charge-offs
• Expenses were flat, primarily driven
by lower professional fees, partially
offset by higher compensation and
benefits and higher marketing spend
Highlights
4Q16 Loan and Volume Growth
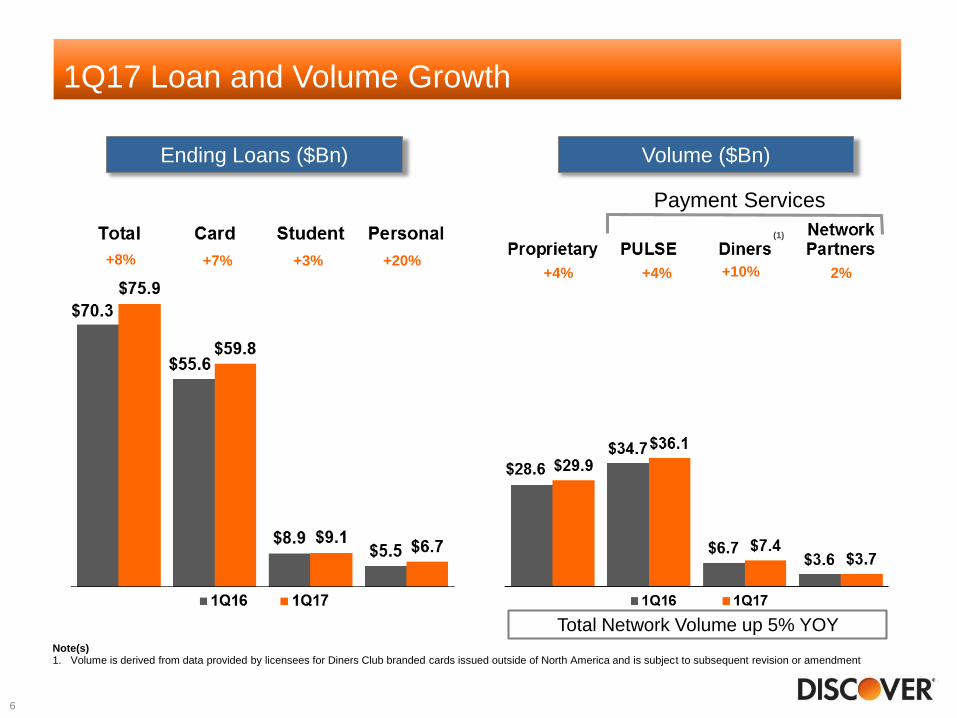
+8% +7% +3% +20%+4% +4% +10% 2%
Note(s)1. Volume is derived from data provided by licensees for Diners Club branded cards issued outside of North America and is subject to subsequent revision or amendment
(1)
Total Network Volume up 5% YOY
Payment Services
1Q17 Loan and Volume Growth
Ending Loans ($Bn) Volume ($Bn)
6
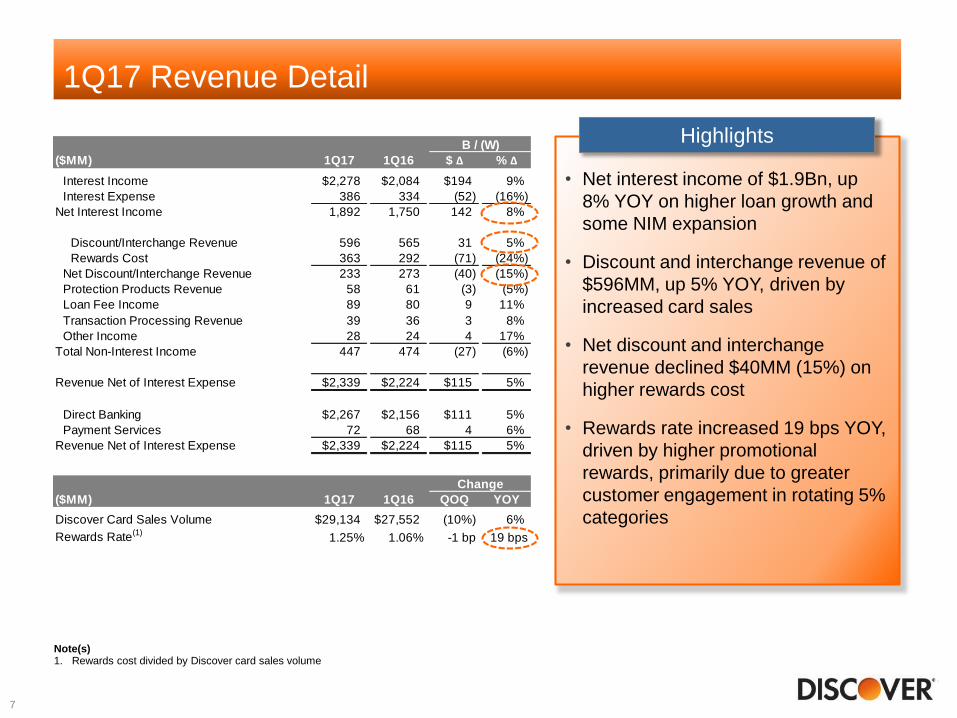
($MM) 1Q17 1Q16 $ ∆ % ∆
Interest Income $2,278 $2,084 $194 9%
Interest Expense 386 334 (52) (16%)
Net Interest Income 1,892 1,750 142 8%
Discount/Interchange Revenue 596 565 31 5%
Rewards Cost 363 292 (71) (24%)
Net Discount/Interchange Revenue 233 273 (40) (15%)
Protection Products Revenue 58 61 (3) (5%)
Loan Fee Income 89 80 9 11%
Transaction Processing Revenue 39 36 3 8%
Other Income 28 24 4 17%
Total Non-Interest Income 447 474 (27) (6%)
Revenue Net of Interest Expense $2,339 $2,224 $115 5%
Direct Banking $2,267 $2,156 $111 5%
Payment Services 72 68 4 6%
Revenue Net of Interest Expense $2,339 $2,224 $115 5%
($MM) 1Q17 1Q16 QOQ YOY
Discover Card Sales Volume $29,134 $27,552 (10%) 6%
Rewards Rate(1)
1.25% 1.06% -1 bp 19 bps
B / (W)
Change
1Q17 Revenue Detail
7
Note(s)1. Rewards cost divided by Discover card sales volume
• Net interest income of $1.9Bn, up
8% YOY on higher loan growth and
some NIM expansion
• Discount and interchange revenue of
$596MM, up 5% YOY, driven by
increased card sales
• Net discount and interchange
revenue declined $40MM (15%) on
higher rewards cost
• Rewards rate increased 19 bps YOY,
driven by higher promotional
rewards, primarily due to greater
customer engagement in rotating 5%
categories
Highlights
1Q17 Net Interest Margin
8
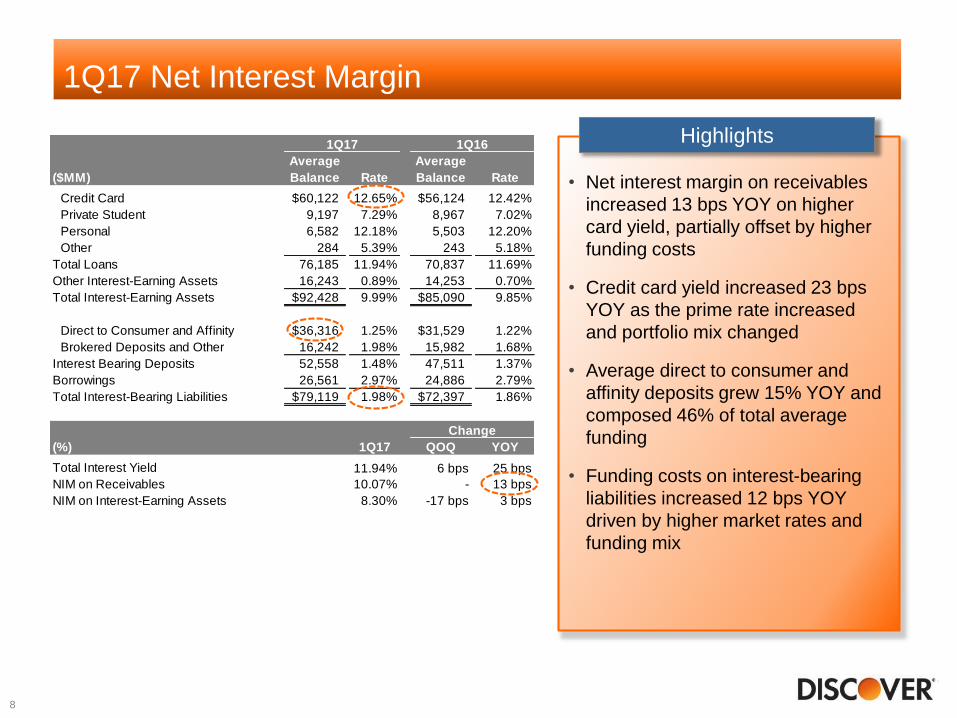
• Net interest margin on receivables
increased 13 bps YOY on higher
card yield, partially offset by higher
funding costs
• Credit card yield increased 23 bps
YOY as the prime rate increased
and portfolio mix changed
• Average direct to consumer and
affinity deposits grew 15% YOY and
composed 46% of total average
funding
• Funding costs on interest-bearing
liabilities increased 12 bps YOY
driven by higher market rates and
funding mix
HighlightsAverage Average
($MM) Balance Rate Balance Rate
Credit Card $60,122 12.65% $56,124 12.42%
Private Student 9,197 7.29% 8,967 7.02%
Personal 6,582 12.18% 5,503 12.20%
Other 284 5.39% 243 5.18%
Total Loans 76,185 11.94% 70,837 11.69%
Other Interest-Earning Assets 16,243 0.89% 14,253 0.70%
Total Interest-Earning Assets $92,428 9.99% $85,090 9.85%
Direct to Consumer and Affinity $36,316 1.25% $31,529 1.22%
Brokered Deposits and Other 16,242 1.98% 15,982 1.68%
Interest Bearing Deposits 52,558 1.48% 47,511 1.37%
Borrowings 26,561 2.97% 24,886 2.79%
Total Interest-Bearing Liabilities $79,119 1.98% $72,397 1.86%
(%) 1Q17 QOQ YOY
Total Interest Yield 11.94% 6 bps 25 bps
NIM on Receivables 10.07% - 13 bps
NIM on Interest-Earning Assets 8.30% -17 bps 3 bps
Change
1Q17 1Q16
1Q17 Operating Expense Detail
9
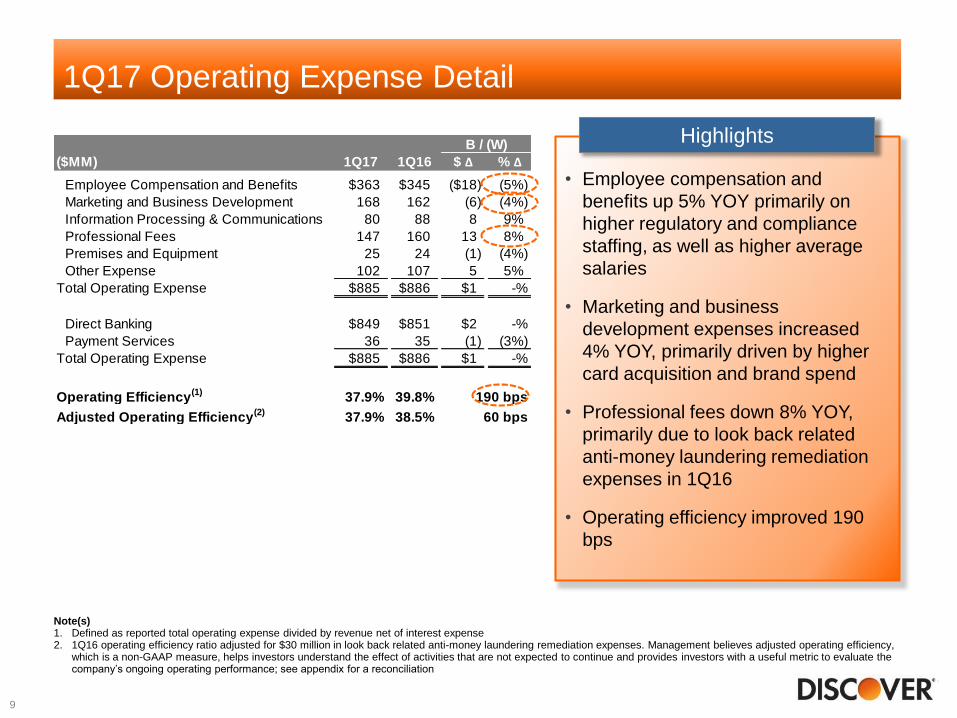
Note(s)1. Defined as reported total operating expense divided by revenue net of interest expense2. 1Q16 operating efficiency ratio adjusted for $30 million in look back related anti-money laundering remediation expenses. Management believes adjusted operating efficiency,
which is a non-GAAP measure, helps investors understand the effect of activities that are not expected to continue and provides investors with a useful metric to evaluate the company’s ongoing operating performance; see appendix for a reconciliation
• Employee compensation and
benefits up 5% YOY primarily on
higher regulatory and compliance
staffing, as well as higher average
salaries
• Marketing and business
development expenses increased
4% YOY, primarily driven by higher
card acquisition and brand spend
• Professional fees down 8% YOY,
primarily due to look back related
anti-money laundering remediation
expenses in 1Q16
• Operating efficiency improved 190
bps
Highlights($MM) 1Q17 1Q16 $ ∆ % ∆
Employee Compensation and Benefits $363 $345 ($18) (5%)
Marketing and Business Development 168 162 (6) (4%)
Information Processing & Communications 80 88 8 9%
Professional Fees 147 160 13 8%
Premises and Equipment 25 24 (1) (4%)
Other Expense 102 107 5 5%
Total Operating Expense $885 $886 $1 -%
Direct Banking $849 $851 $2 -%
Payment Services 36 35 (1) (3%)
Total Operating Expense $885 $886 $1 -%
Operating Efficiency(1)
37.9% 39.8% 190 bps
Adjusted Operating Efficiency(2)
37.9% 38.5% 60 bps
B / (W)
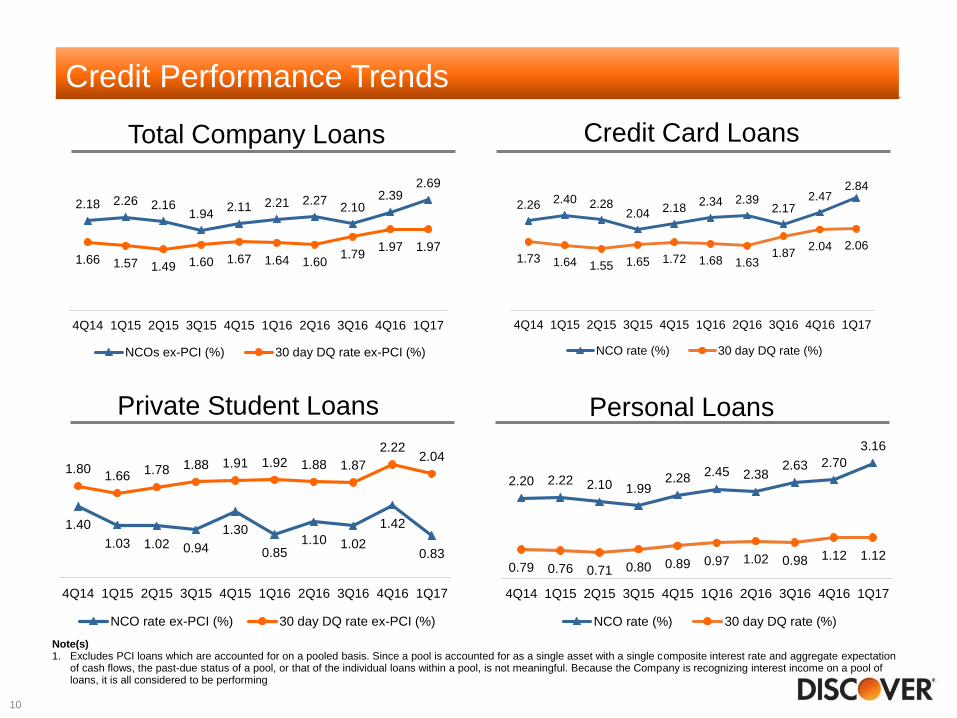
Credit Performance Trends
Total Company Loans Credit Card Loans
Private Student Loans Personal Loans
2.18 2.26 2.161.94
2.11 2.21 2.272.10
2.392.69
1.66 1.57 1.49 1.60 1.67 1.64 1.601.79
1.97 1.97
4Q14 1Q15 2Q15 3Q15 4Q15 1Q16 2Q16 3Q16 4Q16 1Q17
NCOs ex-PCI (%) 30 day DQ rate ex-PCI (%)
2.26 2.40 2.282.04 2.18
2.34 2.392.17
2.472.84
1.73 1.64 1.55 1.65 1.72 1.68 1.631.87
2.04 2.06
4Q14 1Q15 2Q15 3Q15 4Q15 1Q16 2Q16 3Q16 4Q16 1Q17
NCO rate (%) 30 day DQ rate (%)
1.40
1.03 1.02 0.94
1.30
0.851.10 1.02
1.42
0.83
1.801.66 1.78 1.88 1.91 1.92 1.88 1.87
2.222.04
4Q14 1Q15 2Q15 3Q15 4Q15 1Q16 2Q16 3Q16 4Q16 1Q17
NCO rate ex-PCI (%) 30 day DQ rate ex-PCI (%)
2.20 2.22 2.10 1.992.28
2.45 2.382.63 2.70
3.16
0.79 0.76 0.71 0.80 0.89 0.97 1.02 0.98 1.12 1.12
4Q14 1Q15 2Q15 3Q15 4Q15 1Q16 2Q16 3Q16 4Q16 1Q17
NCO rate (%) 30 day DQ rate (%)
10
Note(s)1. Excludes PCI loans which are accounted for on a pooled basis. Since a pool is accounted for as a single asset with a single composite interest rate and aggregate expectation
of cash flows, the past-due status of a pool, or that of the individual loans within a pool, is not meaningful. Because the Company is recognizing interest income on a pool of loans, it is all considered to be performing
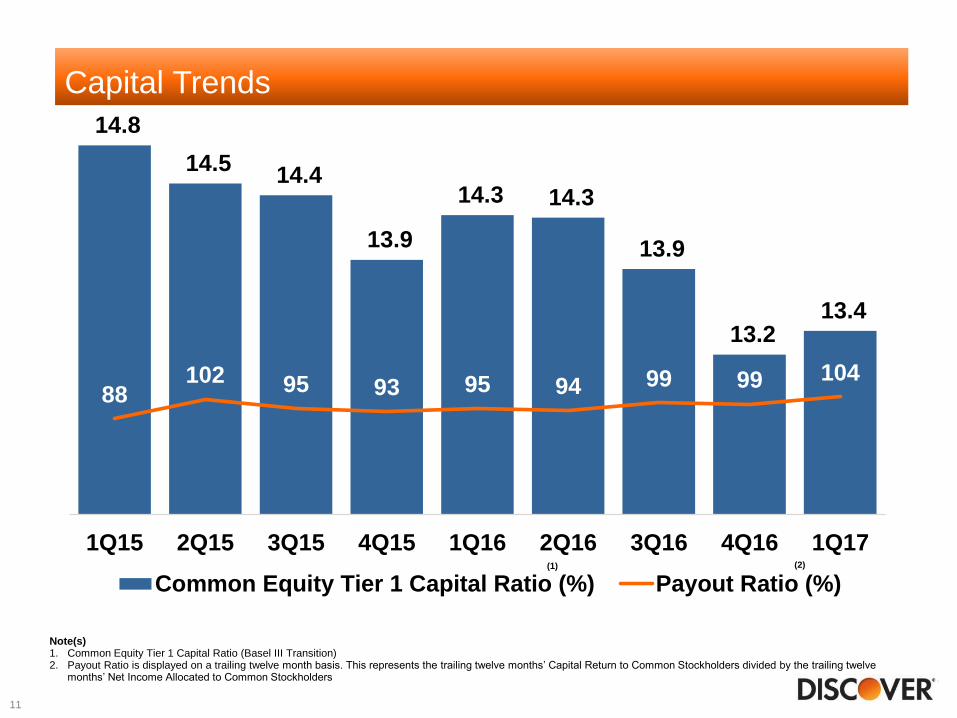
14.8
14.5 14.4
13.9
14.3 14.3
13.9
13.2 13.4
88102 95 93 95 94 99 99 104
1Q15 2Q15 3Q15 4Q15 1Q16 2Q16 3Q16 4Q16 1Q17
Common Equity Tier 1 Capital Ratio (%) Payout Ratio (%)
Key Capital Metrics
11
Note(s)1. Common Equity Tier 1 Capital Ratio (Basel III Transition) 2. Payout Ratio is displayed on a trailing twelve month basis. This represents the trailing twelve months’ Capital Return to Common Stockholders divided by the trailing twelve
months’ Net Income Allocated to Common Stockholders
(1) (2)
Capital Trends
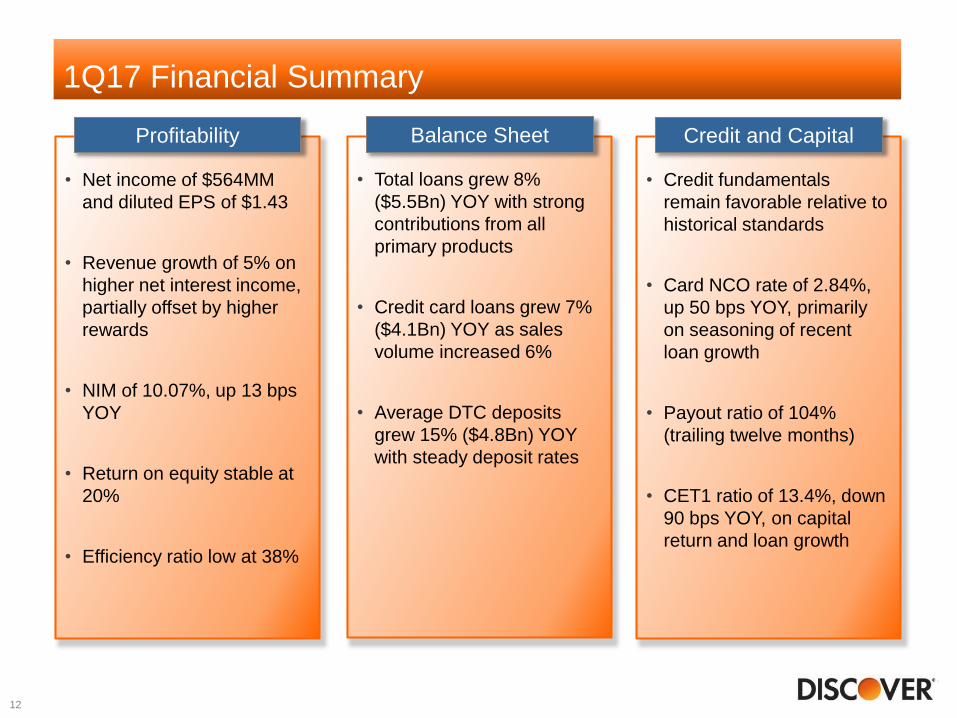
1Q17 Financial Summary
12
• Net income of $564MM
and diluted EPS of $1.43
• Revenue growth of 5% on
higher net interest income,
partially offset by higher
rewards
• NIM of 10.07%, up 13 bps
YOY
• Return on equity stable at
20%
• Efficiency ratio low at 38%
Profitability
• Total loans grew 8%
($5.5Bn) YOY with strong
contributions from all
primary products
• Credit card loans grew 7%
($4.1Bn) YOY as sales
volume increased 6%
• Average DTC deposits
grew 15% ($4.8Bn) YOY
with steady deposit rates
Balance Sheet
• Credit fundamentals
remain favorable relative to
historical standards
• Card NCO rate of 2.84%,
up 50 bps YOY, primarily
on seasoning of recent
loan growth
• Payout ratio of 104%
(trailing twelve months)
• CET1 ratio of 13.4%, down
90 bps YOY, on capital
return and loan growth
Credit and Capital

Appendix
13
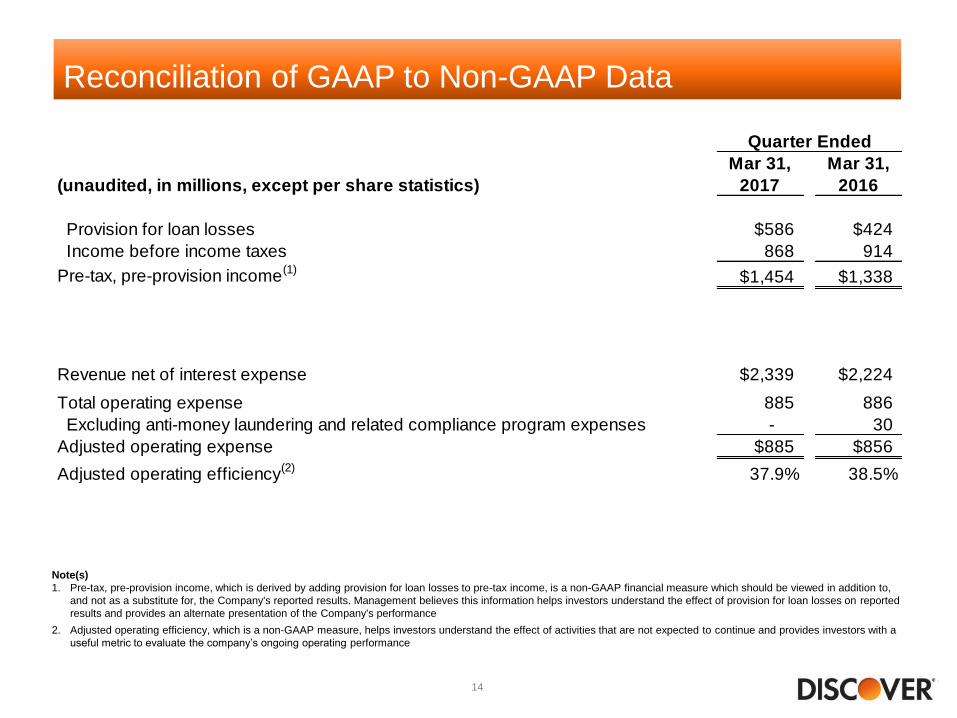
Reconciliation of GAAP to Non-GAAP Data
Note(s)
1. Pre-tax, pre-provision income, which is derived by adding provision for loan losses to pre-tax income, is a non-GAAP financial measure which should be viewed in addition to,
and not as a substitute for, the Company's reported results. Management believes this information helps investors understand the effect of provision for loan losses on reported
results and provides an alternate presentation of the Company's performance
2. Adjusted operating efficiency, which is a non-GAAP measure, helps investors understand the effect of activities that are not expected to continue and provides investors with a
useful metric to evaluate the company’s ongoing operating performance
Reconciliation of GAAP to Non-GAAP Data
14
(unaudited, in millions, except per share statistics)
Mar 31,
2017
Mar 31,
2016
Provision for loan losses $586 $424
Income before income taxes 868 914
Pre-tax, pre-provision income(1)
$1,454 $1,338
Revenue net of interest expense $2,339 $2,224
Total operating expense 885 886
Excluding anti-money laundering and related compliance program expenses - 30
Adjusted operating expense $885 $856
Adjusted operating efficiency(2)
37.9% 38.5%
Quarter Ended