Embed Size (px)
DESCRIPTION
FEDERAL WAY AUBURN 1Q’11 PUGET SOUND MARKET REPORT RENTON TUKWILA LEGEND NORTHEND TACOMA PORT OF TACOMA/ FIFE SEATTLE | BELLEVUE | TACOMA | PORTLAND (425) 974-4000 www.pacific-re.com Sound P uget Southend Industrial/Flex Submarket Pierce County Industrial/ Flex Submarket OTHER PIERCE COUNTY OTHER PIERCE COUNTY LAKEWOOD 5 GEORGETOWN/ DUWAMISH S PUYALLUP/ SUMNER KENT SEATAC/ BURIEN Vashon Island
Citation preview
(425) 974-4000 www.pacif ic-re.com SEATTLE | BELLEVUE | TACOMA | PORTLAND
1Q’11 PUGET SOUND MARKET REPORT
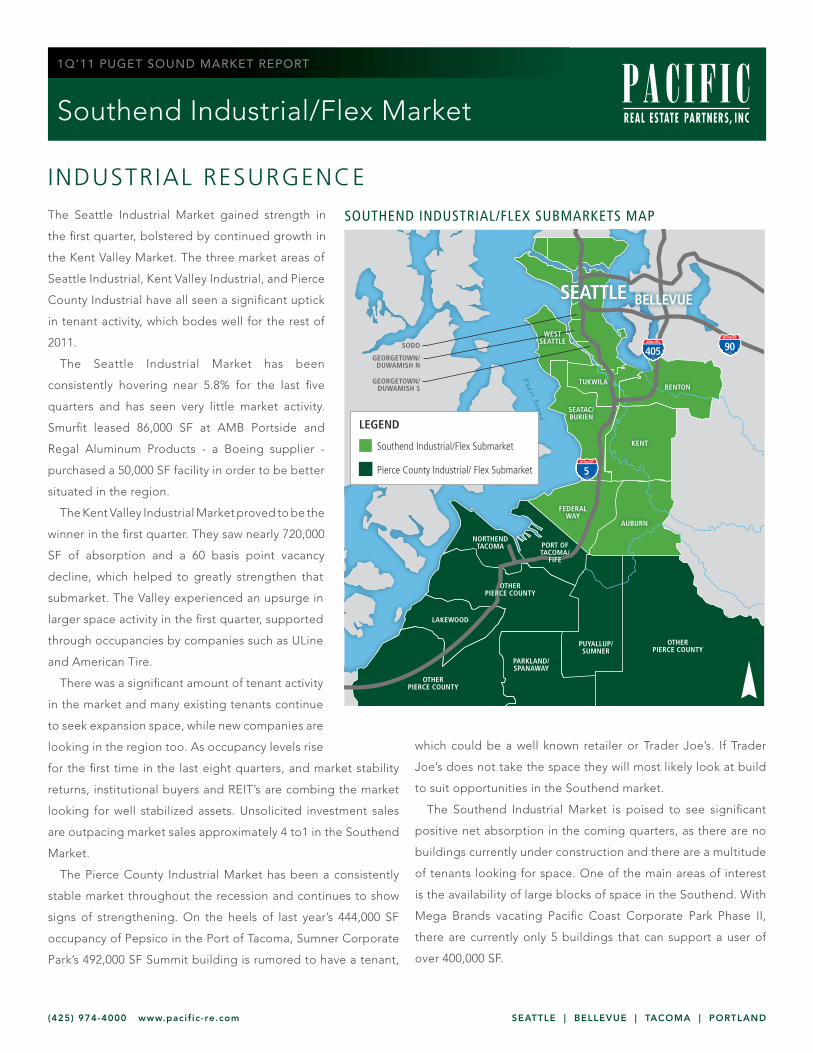
SOUTHEND INDUSTRIAL/FLEX SUBMARKETS MAP
SEATTLE BELLEVUE
Southend Industrial/Flex Market
The Seattle Industrial Market gained strength in
the first quarter, bolstered by continued growth in
the Kent Valley Market. The three market areas of
Seattle Industrial, Kent Valley Industrial, and Pierce
County Industrial have all seen a significant uptick
in tenant activity, which bodes well for the rest of
2011.
The Seattle Industrial Market has been
consistently hovering near 5.8% for the last five
quarters and has seen very little market activity.
Smurfit leased 86,000 SF at AMB Portside and
Regal Aluminum Products - a Boeing supplier -
purchased a 50,000 SF facility in order to be better
situated in the region.
The Kent Valley Industrial Market proved to be the
winner in the first quarter. They saw nearly 720,000
SF of absorption and a 60 basis point vacancy
decline, which helped to greatly strengthen that
submarket. The Valley experienced an upsurge in
larger space activity in the first quarter, supported
through occupancies by companies such as ULine
and American Tire.
There was a significant amount of tenant activity
in the market and many existing tenants continue
to seek expansion space, while new companies are
looking in the region too. As occupancy levels rise
for the first time in the last eight quarters, and market stability
returns, institutional buyers and REIT’s are combing the market
looking for well stabilized assets. Unsolicited investment sales
are outpacing market sales approximately 4 to1 in the Southend
Market.
The Pierce County Industrial Market has been a consistently
stable market throughout the recession and continues to show
signs of strengthening. On the heels of last year’s 444,000 SF
occupancy of Pepsico in the Port of Tacoma, Sumner Corporate
Park’s 492,000 SF Summit building is rumored to have a tenant,
which could be a well known retailer or Trader Joe’s. If Trader
Joe’s does not take the space they will most likely look at build
to suit opportunities in the Southend market.
The Southend Industrial Market is poised to see significant
positive net absorption in the coming quarters, as there are no
buildings currently under construction and there are a multitude
of tenants looking for space. One of the main areas of interest
is the availability of large blocks of space in the Southend. With
Mega Brands vacating Pacific Coast Corporate Park Phase II,
there are currently only 5 buildings that can support a user of
over 400,000 SF.
INDUSTRIAL RESURGENCE
90405
5
Puget Sound
OTHER PIERCE COUNTY
LAKEWOOD
PUYALLUP/SUMNER
OTHER PIERCE COUNTY
OTHER PIERCE COUNTY
PARKLAND/SPANAWAY
FEDERAL WAY
AUBURN
NORTHENDTACOMA PORT OF
TACOMA/FIFE
KENTVashonIsland
RENTONTUKWILA
SEATAC/BURIEN
WEST SEATTLESODO
GEORGETOWN/ DUWAMISH N
GEORGETOWN/ DUWAMISH S
LEGEND
Pierce County Industrial/ Flex Submarket
Southend Industrial/Flex Submarket
(425) 974-4000 www.pacif ic-re.com SEATTLE | BELLEVUE | TACOMA | PORTLAND
1Q’11 PUGET SOUND MARKET REPORT
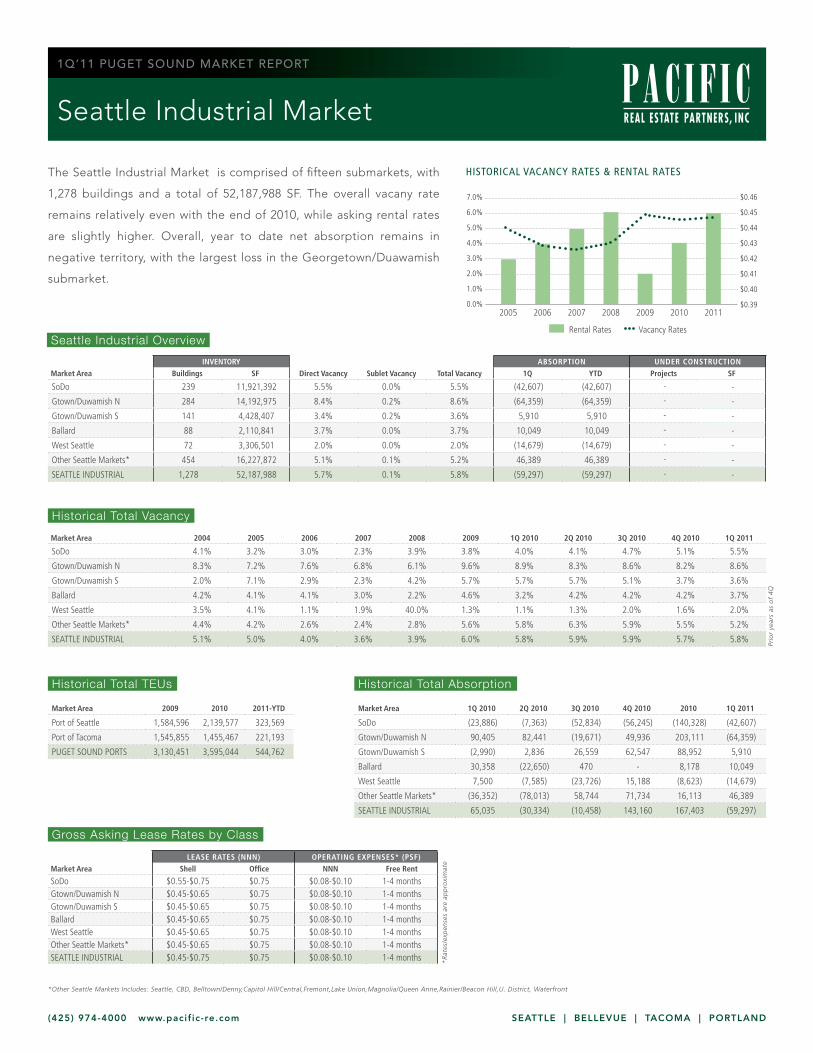
The Seattle Industrial Market is comprised of fifteen submarkets, with
1,278 buildings and a total of 52,187,988 SF. The overall vacany rate
remains relatively even with the end of 2010, while asking rental rates
are slightly higher. Overall, year to date net absorption remains in
negative territory, with the largest loss in the Georgetown/Duawamish
submarket.
*Other Seattle Markets Includes: Seattle, CBD, Belltown/Denny,Capitol Hill/Central,Fremont,Lake Union,Magnolia/Queen Anne,Rainier/Beacon Hill,U. District, Waterfront
HISTORICAL VACANCY RATES & RENTAL RATES
2005 2007 2009 20112006 2008 2010
7.0% $0.46
5.0%
$0.43
3.0%
2.0%
1.0%
6.0% $0.45
$0.44
0.0% $0.39
$0.40
4.0%
$0.42
$0.41
Rental Rates Vacancy Rates Seattle Industrial Overview
INVENTORY ABSORPTION UNDER CONSTRUCTIONMarket Area Buildings SF Direct Vacancy Sublet Vacancy Total Vacancy 1Q YTD Projects SF
SoDo 239 11,921,392 5.5% 0.0% 5.5% (42,607) (42,607) - -
Gtown/Duwamish N 284 14,192,975 8.4% 0.2% 8.6% (64,359) (64,359) - -
Gtown/Duwamish S 141 4,428,407 3.4% 0.2% 3.6% 5,910 5,910 - -
Ballard 88 2,110,841 3.7% 0.0% 3.7% 10,049 10,049 - -
West Seattle 72 3,306,501 2.0% 0.0% 2.0% (14,679) (14,679) - -
Other Seattle Markets* 454 16,227,872 5.1% 0.1% 5.2% 46,389 46,389 - -
SEATTLE INDUSTRIAL 1,278 52,187,988 5.7% 0.1% 5.8% (59,297) (59,297) - -
Market Area 1Q 2010 2Q 2010 3Q 2010 4Q 2010 2010 1Q 2011
SoDo (23,886) (7,363) (52,834) (56,245) (140,328) (42,607)
Gtown/Duwamish N 90,405 82,441 (19,671) 49,936 203,111 (64,359)
Gtown/Duwamish S (2,990) 2,836 26,559 62,547 88,952 5,910
Ballard 30,358 (22,650) 470 - 8,178 10,049
West Seattle 7,500 (7,585) (23,726) 15,188 (8,623) (14,679)
Other Seattle Markets* (36,352) (78,013) 58,744 71,734 16,113 46,389
SEATTLE INDUSTRIAL 65,035 (30,334) (10,458) 143,160 167,403 (59,297)
Historical Total TEUs Historical Total Absorption
Market Area 2009 2010 2011-YTD
Port of Seattle 1,584,596 2,139,577 323,569
Port of Tacoma 1,545,855 1,455,467 221,193
PUGET SOUND PORTS 3,130,451 3,595,044 544,762
Gross Asking Lease Rates by Class
LEASE RATES (NNN) OPERATING EXPENSES* (PSF)Market Area Shell Office NNN Free Rent
SoDo $0.55-$0.75 $0.75 $0.08-$0.10 1-4 monthsGtown/Duwamish N $0.45-$0.65 $0.75 $0.08-$0.10 1-4 monthsGtown/Duwamish S $0.45-$0.65 $0.75 $0.08-$0.10 1-4 monthsBallard $0.45-$0.65 $0.75 $0.08-$0.10 1-4 monthsWest Seattle $0.45-$0.65 $0.75 $0.08-$0.10 1-4 monthsOther Seattle Markets* $0.45-$0.65 $0.75 $0.08-$0.10 1-4 monthsSEATTLE INDUSTRIAL $0.45-$0.75 $0.75 $0.08-$0.10 1-4 months *
Rat
es/e
xpen
ses
are
app
roxi
mat
e
Historical Total Vacancy
Market Area 2004 2005 2006 2007 2008 2009 1Q 2010 2Q 2010 3Q 2010 4Q 2010 1Q 2011
SoDo 4.1% 3.2% 3.0% 2.3% 3.9% 3.8% 4.0% 4.1% 4.7% 5.1% 5.5%
Gtown/Duwamish N 8.3% 7.2% 7.6% 6.8% 6.1% 9.6% 8.9% 8.3% 8.6% 8.2% 8.6%
Gtown/Duwamish S 2.0% 7.1% 2.9% 2.3% 4.2% 5.7% 5.7% 5.7% 5.1% 3.7% 3.6%
Ballard 4.2% 4.1% 4.1% 3.0% 2.2% 4.6% 3.2% 4.2% 4.2% 4.2% 3.7%
West Seattle 3.5% 4.1% 1.1% 1.9% 40.0% 1.3% 1.1% 1.3% 2.0% 1.6% 2.0%
Other Seattle Markets* 4.4% 4.2% 2.6% 2.4% 2.8% 5.6% 5.8% 6.3% 5.9% 5.5% 5.2%
SEATTLE INDUSTRIAL 5.1% 5.0% 4.0% 3.6% 3.9% 6.0% 5.8% 5.9% 5.9% 5.7% 5.8%
Prio
r ye
ars
as o
f 4
Q
Seattle Industrial Market
(425) 974-4000 www.pacif ic-re.com SEATTLE | BELLEVUE | TACOMA | PORTLAND
1Q’11 PUGET SOUND MARKET REPORT
Kent Valley Industrial Market
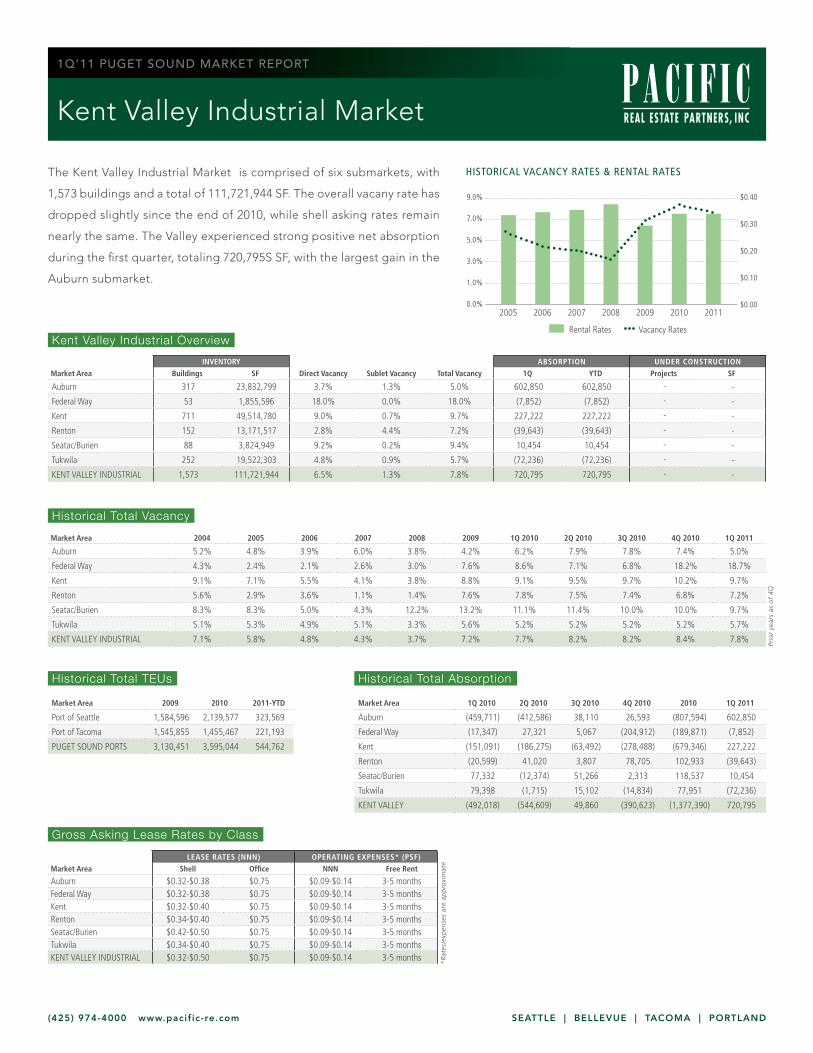
The Kent Valley Industrial Market is comprised of six submarkets, with
1,573 buildings and a total of 111,721,944 SF. The overall vacany rate has
dropped slightly since the end of 2010, while shell asking rates remain
nearly the same. The Valley experienced strong positive net absorption
during the first quarter, totaling 720,795S SF, with the largest gain in the
Auburn submarket.
HISTORICAL VACANCY RATES & RENTAL RATES
2005 2007 2009 20112006 2008 2010
9.0% $0.40
7.0%
3.0%
5.0%
1.0%
$0.30
0.0% $0.00
$0.10
$0.20
Rental Rates Vacancy Rates Kent Valley Industrial Overview
INVENTORY ABSORPTION UNDER CONSTRUCTIONMarket Area Buildings SF Direct Vacancy Sublet Vacancy Total Vacancy 1Q YTD Projects SF
Auburn 317 23,832,799 3.7% 1.3% 5.0% 602,850 602,850 - -
Federal Way 53 1,855,596 18.0% 0.0% 18.0% (7,852) (7,852) - -
Kent 711 49,514,780 9.0% 0.7% 9.7% 227,222 227,222 - -
Renton 152 13,171,517 2.8% 4.4% 7.2% (39,643) (39,643) - -
Seatac/Burien 88 3,824,949 9.2% 0.2% 9.4% 10,454 10,454 - -
Tukwila 252 19,522,303 4.8% 0.9% 5.7% (72,236) (72,236) - -
KENT VALLEY INDUSTRIAL 1,573 111,721,944 6.5% 1.3% 7.8% 720,795 720,795 - -
Market Area 1Q 2010 2Q 2010 3Q 2010 4Q 2010 2010 1Q 2011
Auburn (459,711) (412,586) 38,110 26,593 (807,594) 602,850
Federal Way (17,347) 27,321 5,067 (204,912) (189,871) (7,852)
Kent (151,091) (186,275) (63,492) (278,488) (679,346) 227,222
Renton (20,599) 41,020 3,807 78,705 102,933 (39,643)
Seatac/Burien 77,332 (12,374) 51,266 2,313 118,537 10,454
Tukwila 79,398 (1,715) 15,102 (14,834) 77,951 (72,236)
KENT VALLEY (492,018) (544,609) 49,860 (390,623) (1,377,390) 720,795
Historical Total TEUs Historical Total Absorption
Market Area 2009 2010 2011-YTD
Port of Seattle 1,584,596 2,139,577 323,569
Port of Tacoma 1,545,855 1,455,467 221,193
PUGET SOUND PORTS 3,130,451 3,595,044 544,762
Gross Asking Lease Rates by Class
LEASE RATES (NNN) OPERATING EXPENSES* (PSF)Market Area Shell Office NNN Free Rent
Auburn $0.32-$0.38 $0.75 $0.09-$0.14 3-5 monthsFederal Way $0.32-$0.38 $0.75 $0.09-$0.14 3-5 monthsKent $0.32-$0.40 $0.75 $0.09-$0.14 3-5 monthsRenton $0.34-$0.40 $0.75 $0.09-$0.14 3-5 monthsSeatac/Burien $0.42-$0.50 $0.75 $0.09-$0.14 3-5 monthsTukwila $0.34-$0.40 $0.75 $0.09-$0.14 3-5 monthsKENT VALLEY INDUSTRIAL $0.32-$0.50 $0.75 $0.09-$0.14 3-5 months *
Rat
es/e
xpen
ses
are
app
roxi
mat
e
Historical Total Vacancy
Market Area 2004 2005 2006 2007 2008 2009 1Q 2010 2Q 2010 3Q 2010 4Q 2010 1Q 2011
Auburn 5.2% 4.8% 3.9% 6.0% 3.8% 4.2% 6.2% 7.9% 7.8% 7.4% 5.0%
Federal Way 4.3% 2.4% 2.1% 2.6% 3.0% 7.6% 8.6% 7.1% 6.8% 18.2% 18.7%
Kent 9.1% 7.1% 5.5% 4.1% 3.8% 8.8% 9.1% 9.5% 9.7% 10.2% 9.7%
Renton 5.6% 2.9% 3.6% 1.1% 1.4% 7.6% 7.8% 7.5% 7.4% 6.8% 7.2%
Seatac/Burien 8.3% 8.3% 5.0% 4.3% 12.2% 13.2% 11.1% 11.4% 10.0% 10.0% 9.7%
Tukwila 5.1% 5.3% 4.9% 5.1% 3.3% 5.6% 5.2% 5.2% 5.2% 5.2% 5.7%
KENT VALLEY INDUSTRIAL 7.1% 5.8% 4.8% 4.3% 3.7% 7.2% 7.7% 8.2% 8.2% 8.4% 7.8%
Prio
r ye
ars
as o
f 4
Q
(425) 974-4000 www.pacif ic-re.com SEATTLE | BELLEVUE | TACOMA | PORTLAND
1Q’11 PUGET SOUND MARKET REPORT
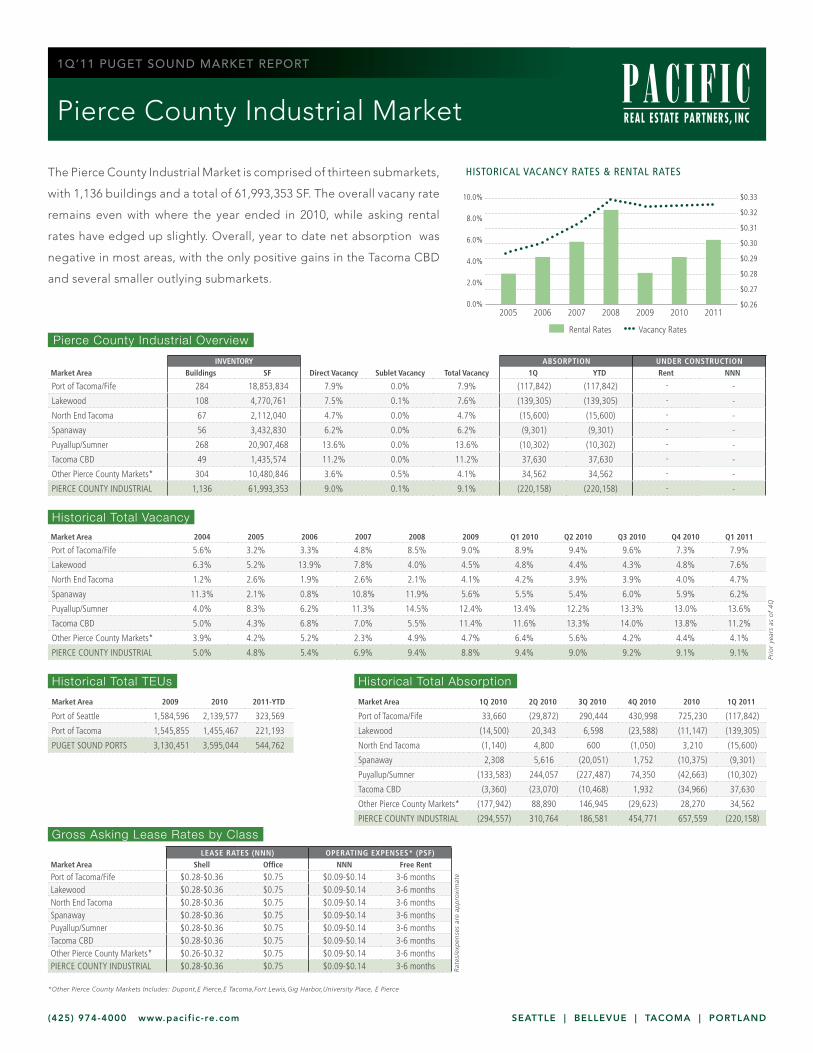
HISTORICAL VACANCY RATES & RENTAL RATES
2005 2007 2009 20112006 2008 2010
10.0% $0.33
8.0%
$0.30
4.0%
6.0%
2.0%
$0.32
$0.31
0.0% $0.26
$0.27
$0.29
$0.28
Rental Rates Vacancy RatesPierce County Industrial Overview
INVENTORY ABSORPTION UNDER CONSTRUCTIONMarket Area Buildings SF Direct Vacancy Sublet Vacancy Total Vacancy 1Q YTD Rent NNN
Port of Tacoma/Fife 284 18,853,834 7.9% 0.0% 7.9% (117,842) (117,842) - -
Lakewood 108 4,770,761 7.5% 0.1% 7.6% (139,305) (139,305) - -
North End Tacoma 67 2,112,040 4.7% 0.0% 4.7% (15,600) (15,600) - -
Spanaway 56 3,432,830 6.2% 0.0% 6.2% (9,301) (9,301) - -
Puyallup/Sumner 268 20,907,468 13.6% 0.0% 13.6% (10,302) (10,302) - -
Tacoma CBD 49 1,435,574 11.2% 0.0% 11.2% 37,630 37,630 - -
Other Pierce County Markets* 304 10,480,846 3.6% 0.5% 4.1% 34,562 34,562 - -
PIERCE COUNTY INDUSTRIAL 1,136 61,993,353 9.0% 0.1% 9.1% (220,158) (220,158) - -
Market Area 1Q 2010 2Q 2010 3Q 2010 4Q 2010 2010 1Q 2011
Port of Tacoma/Fife 33,660 (29,872) 290,444 430,998 725,230 (117,842)
Lakewood (14,500) 20,343 6,598 (23,588) (11,147) (139,305)
North End Tacoma (1,140) 4,800 600 (1,050) 3,210 (15,600)
Spanaway 2,308 5,616 (20,051) 1,752 (10,375) (9,301)
Puyallup/Sumner (133,583) 244,057 (227,487) 74,350 (42,663) (10,302)
Tacoma CBD (3,360) (23,070) (10,468) 1,932 (34,966) 37,630
Other Pierce County Markets* (177,942) 88,890 146,945 (29,623) 28,270 34,562
PIERCE COUNTY INDUSTRIAL (294,557) 310,764 186,581 454,771 657,559 (220,158)
Historical Total TEUs Historical Total Absorption
Market Area 2009 2010 2011-YTD
Port of Seattle 1,584,596 2,139,577 323,569
Port of Tacoma 1,545,855 1,455,467 221,193
PUGET SOUND PORTS 3,130,451 3,595,044 544,762
Gross Asking Lease Rates by ClassLEASE RATES (NNN) OPERATING EXPENSES* (PSF)
Market Area Shell Office NNN Free Rent
Port of Tacoma/Fife $0.28-$0.36 $0.75 $0.09-$0.14 3-6 monthsLakewood $0.28-$0.36 $0.75 $0.09-$0.14 3-6 monthsNorth End Tacoma $0.28-$0.36 $0.75 $0.09-$0.14 3-6 monthsSpanaway $0.28-$0.36 $0.75 $0.09-$0.14 3-6 monthsPuyallup/Sumner $0.28-$0.36 $0.75 $0.09-$0.14 3-6 monthsTacoma CBD $0.28-$0.36 $0.75 $0.09-$0.14 3-6 monthsOther Pierce County Markets* $0.26-$0.32 $0.75 $0.09-$0.14 3-6 monthsPIERCE COUNTY INDUSTRIAL $0.28-$0.36 $0.75 $0.09-$0.14 3-6 months R
ates
/exp
ense
s ar
e ap
pro
xim
ate
Historical Total Vacancy
Market Area 2004 2005 2006 2007 2008 2009 Q1 2010 Q2 2010 Q3 2010 Q4 2010 Q1 2011
Port of Tacoma/Fife 5.6% 3.2% 3.3% 4.8% 8.5% 9.0% 8.9% 9.4% 9.6% 7.3% 7.9%
Lakewood 6.3% 5.2% 13.9% 7.8% 4.0% 4.5% 4.8% 4.4% 4.3% 4.8% 7.6%
North End Tacoma 1.2% 2.6% 1.9% 2.6% 2.1% 4.1% 4.2% 3.9% 3.9% 4.0% 4.7%
Spanaway 11.3% 2.1% 0.8% 10.8% 11.9% 5.6% 5.5% 5.4% 6.0% 5.9% 6.2%
Puyallup/Sumner 4.0% 8.3% 6.2% 11.3% 14.5% 12.4% 13.4% 12.2% 13.3% 13.0% 13.6%
Tacoma CBD 5.0% 4.3% 6.8% 7.0% 5.5% 11.4% 11.6% 13.3% 14.0% 13.8% 11.2%
Other Pierce County Markets* 3.9% 4.2% 5.2% 2.3% 4.9% 4.7% 6.4% 5.6% 4.2% 4.4% 4.1%
PIERCE COUNTY INDUSTRIAL 5.0% 4.8% 5.4% 6.9% 9.4% 8.8% 9.4% 9.0% 9.2% 9.1% 9.1%
Prio
r ye
ars
as o
f 4
Q
The Pierce County Industrial Market is comprised of thirteen submarkets,
with 1,136 buildings and a total of 61,993,353 SF. The overall vacany rate
remains even with where the year ended in 2010, while asking rental
rates have edged up slightly. Overall, year to date net absorption was
negative in most areas, with the only positive gains in the Tacoma CBD
and several smaller outlying submarkets.
Pierce County Industrial Market
*Other Pierce County Markets Includes: Dupont,E Pierce,E Tacoma,Fort Lewis,Gig Harbor,University Place, E Pierce


