Embed Size (px)
Citation preview

Financial Results
1Q 21

1
This presentation contains forward-looking information and statements, within the meaning of applicable securities laws
(collectively, “forward-looking statements”), including, but not limited to, statements regarding Bausch Health's future
prospects and performance (including the Company’s 2021 full-year guidance and targeted three-year CAGR1 of revenue
growth and Adjusted EBITDA (non-GAAP) growth), expectations for adjusted cash generated from operations and the
anticipated uses of same, targeted debt paydown amounts, expectations regarding gross margin, the Company’s plan to spin
off or separate its eye-health business from the remainder of Bausch Health, including the timing of the internal organizational
design/structure and capitalization structure of such transaction, the anticipated dis-synergies resulting from such transaction
(including the allocation thereof between the separated entity and the remainder of Bausch Health) and the targeted leverage
of the separated entity and the remainder of Bausch Health, the anticipated impact of the COVID-19 pandemic on the
Company and its financial condition, results of operation, revenues, segments, liquidity, products and product pipeline,
operations, facilities, supply chain and employees, planned efforts to address the COVID-19 pandemic, the anticipated timing,
speed and magnitude of the Company’s recovery from the COVID-19 pandemic (including expectations by geography and
business unit), expected durability of certain of our products and brands, expectations respecting global revenue of our
Bausch + Lomb SiHy dailies, the anticipated submission, approval and launch dates for certain of our pipeline products and
R&D programs, the anticipated timing of commencement and resumption of studies or other development work of our pipeline
products and R&D programs, the anticipated timing of the loss of exclusivity of certain of our products and the expected
impact of such loss of exclusivity on our financial condition, the Company’s business growth drivers, the Company’s strategic
focus for 2021 and beyond, management’s commitments and expected targets and our ability to achieve the action plan and
expected targets in the periods anticipated, and the Company’s plans and expectations for 2021 and beyond. Forward-
looking statements may generally be identified by the use of the words "anticipates," "expects,“ “predicts,” “goals,” "intends,"
"plans," "should," "could," "would," "may," "will," "believes," "estimates," "potential," "target," “commit,” “forecast,” “tracking,” or
"continue" and variations or similar expressions, and phrases or statements that certain actions, events or results may, could,
should or will be achieved, received or taken or will occur or result, and similar such expressions also identify forward-looking
information. These forward-looking statements, including the Company’s 2021 full-year guidance and targeted three-year
CAGR of revenue growth and Adjusted EBITDA (non-GAAP) growth, are based upon the current expectations and beliefs of
management and are provided for the purpose of providing additional information about such expectations and beliefs and
readers are cautioned that these statements may not be appropriate for other purposes. These forward-looking statements
are subject to certain risks and uncertainties that could cause actual results and events to differ materially from those
described in these forward-looking statements. These risks and uncertainties include, but are not limited to, the risks and
uncertainties discussed in the Company's most recent annual and quarterly reports and detailed from time to time in the
Company's other filings with the U.S. Securities and Exchange Commission and the Canadian Securities Administrators,
which risks and uncertainties are incorporated herein by reference. They also include, but are not limited to, risks and
uncertainties caused by or relating to the evolving COVID-19 pandemic, the fear of that pandemic, the availability and
effectiveness of vaccines for COVID-19, and the potential effects of that pandemic, the severity, duration and future impact of
which are highly uncertain and cannot be predicted, and which may have a material adverse impact on the Company,
including but not limited to its supply chain, third-party suppliers, project development timelines, employee base, liquidity,
stock price, financial condition and costs (which may increase) and revenue and margins (both of which may decrease). They
also include, but are not limited to, risk and uncertainties caused by shareholder activism by our existing or future investors,
including the distraction of our management and employees caused by such shareholder activism, the time, resources and
costs expended in connection with such shareholder activism and the impact of such shareholder activism on our business
plans and strategies and our ability to effectively implement such plans and strategies. They also include, but are not limited
to, risks and uncertainties relating to the Company’s proposed plan to spin off or otherwise separate its eye-health business
from the remainder of Bausch Health, including the expected benefits and costs of such transaction, the expected timing of
completion of such transaction and its terms, the Company’s ability to complete such transaction considering the various
conditions to the completion of such transaction (some of which are outside the Company’s control, including conditions
related to regulatory matters and a possible shareholder vote, if applicable), that market or other conditions are no longer
favorable to completing the transaction, that any shareholder, stock exchange, regulatory or other approval (if required) is not
obtained on the terms or timelines anticipated or at all, business disruption during the pendency of or following such
transaction, diversion of management time on transaction-related issues, retention of existing management team members,
the reaction of customers and other parties to such transaction, the qualification of such transaction as a tax-free transaction
for Canadian and/or U.S. federal income tax purposes (including whether or not an advance ruling from either or both of the
Canada Revenue Agency and the Internal Revenue Service will be sought or obtained), potential dissynergy costs between
the spun off or separated entity and the remainder of Bausch Health, the impact of such transaction on relationships with
customers, suppliers, employees and other business counterparties, general economic conditions, conditions in the markets
Bausch Health is engaged in, behavior of customers, suppliers and competitors, technological developments and legal and
regulatory rules affecting Bausch Health’s business. In particular, the Company can offer no assurance that any spinoff or
other separation transaction will occur at all, or that any such transaction will occur on the terms and timelines anticipated by
the Company. In addition, certain material factors and assumptions have been applied in making these forward-looking
statements, including, without limitation, assumptions regarding our 2021 full-year guidance with respect to expectations
regarding base performance and management’s belief regarding the impact of the COVID-19 pandemic and associated
responses on such base performance and the operations and financial results of the Company generally, expected currency
impact, the expected timing and impact of loss of exclusivity for certain of our products, adjusted SG&A expense (non-GAAP)
and the Company’s ability to continue to manage such expense in the manner anticipated, the anticipated timing and extent of
the Company’s R&D expense, and expectations regarding gross margin; assumptions respecting our targeted three-year
CAGR of revenue growth and Adjusted EBITDA (non-GAAP) growth including, without limitation, management’s belief
regarding the impact of the COVID-19 pandemic and associated responses on the operations and financial results of the
Company, constant currency and from mid-point of Feb. 2019 guidance (adjusted for current exchange rates); and
assumptions that the risks and uncertainties outlined above will not cause actual results or events to differ materially from
those described in these forward-looking statements. Additional information regarding certain of these material factors and
assumptions may also be found in the Company’s filings described above. Management has also made certain assumptions
in assessing the anticipated impacts of the COVID-19 pandemic on the Company and its results of operations and financial
conditions, including: that there will be no material restrictions on access to health care products and services resulting from a
possible resurgence of the virus on a global basis in 2021; there will be increased availability and use of effective vaccines;
that strict social restrictions seen in the first half of 2020 will not be materially reenacted in the event of a material resurgence
of the virus and variant strains thereof; that there will be an ongoing gradual global recovery as the macroeconomic and
health care impacts of the COVID-19 pandemic run their course; that the largest impact to the Company’s businesses were
seen in the second quarter of 2020; that our revenues return to pre-pandemic levels during 2021, but that rates of recovery
will vary by geography and business unit, with some regions and business units expected to lag in recovery possibly beyond
2021 and no major interruptions in the Company’s supply chain and distribution channels. If any of these assumptions
regarding the impacts of the COVID-19 pandemic are incorrect, our actual results could differ materially from those described
in these forward-looking statements. The Company believes that the material factors and assumptions reflected in these
forward-looking statements are reasonable in the circumstances, but readers are cautioned not to place undue reliance on
any of these forward-looking statements. These forward-looking statements speak only as of the date hereof. Bausch Health
undertakes no obligation to update any of these forward-looking statements to reflect events or circumstances after the date
of this presentation or to reflect actual outcomes, unless required by law.
The guidance in this presentation is only effective as of the date given, May 4, 2021, and will not be updated
or affirmed unless and until the Company publicly announces updated or affirmed guidance.
Distribution or reference of this deck following May 4, 2021 does not constitute the Company re -affirming
guidance.
Forward-Looking Statements
1. Compound Annual Growth Rate.

2
To supplement the financial measures prepared in accordance with U.S. generally accepted accounting principles
(GAAP), the Company uses certain non-GAAP financial measures including (i) Adjusted EBITDA, (ii) Adjusted
EBITA, (iii) EBITA, (iv) EBITA Margin, (v) Adjusted Gross Profit/Adjusted Gross Margin (vi) Adjusted Selling, A&P,
(vii) Adjusted G&A, (viii) Adjusted SG&A, (ix) Total Adjusted Operating Expense, (x) Adjusted Net Income, (xi)
Adjusted Tax Rate, (xii) Organic Revenue, Organic Growth, Organic Change and Organic Revenue Decline, (xiii)
Constant Currency, (xiv) Adjusted Cash Flows from Operations/Adjusted Cash Generated from Operations and
(xv) Bausch Pharma Total Revenue. Management uses some of these non-GAAP measures as key metrics in the
evaluation of Company performance and the consolidated financial results and, in part, in the determination of
cash bonuses for its executive officers. The Company believes these non-GAAP measures are useful to investors
in their assessment of our operating performance and the valuation of the Company. In addition, these non-GAAP
measures address questions the Company routinely receives from analysts and investors and, in order to assure
that all investors have access to similar data, the Company has determined that it is appropriate to make this data
available to all investors.
However, these measures are not prepared in accordance with GAAP nor do they have any standardized
meaning under GAAP. In addition, other companies may use similarly titled non-GAAP financial measures that are
calculated differently from the way we calculate such measures. Accordingly, our non-GAAP financial measures
may not be comparable to such similarly titled non-GAAP measures. We caution investors not to place undue
reliance on such non-GAAP measures, but instead to consider them with the most directly comparable GAAP
measures. Non-GAAP financial measures have limitations as analytical tools and should not be considered in
isolation. They should be considered as a supplement to, not a substitute for, or superior to, the corresponding
measures calculated in accordance with GAAP.
The reconciliations of these historic non-GAAP financial measures to the most directly comparable financial
measures calculated and presented in accordance with GAAP are shown in the appendix hereto. However, for
guidance and expected CAGR1 purposes, the Company does not provide reconciliations of projected Adjusted
EBITDA (non-GAAP) to projected GAAP net income (loss) and projected Adjusted Cash Generated from
Operations (non-GAAP) to projected GAAP Cash Flows from Operating Activities, due to the inherent difficulty in
forecasting and quantifying certain amounts that are necessary for such reconciliations. In periods where
significant acquisitions or divestitures are not expected, the Company believes it might have a basis for
forecasting the GAAP equivalent for certain costs, such as amortization, that would otherwise be treated as a non-
GAAP adjustment to calculate projected GAAP net income (loss). However, because other deductions (e.g.,
restructuring, gain or loss on extinguishment of debt and litigation and other matters) used to calculate projected
net income (loss) may vary significantly based on actual events, the Company is not able to forecast on a GAAP
basis with reasonable certainty all deductions needed in order to provide a GAAP calculation of projected net
income (loss) at this time. The amounts of these deductions may be material and, therefore, could result in GAAP
net income (loss) being materially different from (including materially less than) projected Adjusted EBITDA (non-
GAAP).
Non-GAAP Information
1. Compound Annual Growth Rate.

3
1Q21 Highlights &
Financial Results
FY 2021 Guidance
Segment Results
& Recovery
2
3
4
5
Today’sTopics
Spinoff Update &
Management Announcement
1
Driving Growth in 2021
& Beyond

Executing Our
Business
Recovery from
COVID-19
2021 Strategic Focus: Execution, Growth & Accelerating
Strategic Alternatives
Unleashing
Growth Drivers
Accelerating
Strategic
Alternatives to
Drive
Shareholder
Value
4

5
1Q21 Highlights & Financial Results

6
Bausch Health 1Q21 Update
Bausch Health Revenue Breakdown
1Q21 Organic Revenue1,2: 0%
1Q21 Reported Revenue: +1%
1. See Slide 2 and Appendix for further non-GAAP information.
2. Organic growth/change, a non-GAAP metric, is defined as a change on a period-over-period basis in revenues on a constant currency basis (if applicable) excluding the impact of acquisitions,
divestitures and discontinuations.
3. Subject to certain adjustments. As part of the transaction, cash generated by Amoun during the period from the locked-box date of January 1, 2021 to closing will be for the benefit of the
Purchaser (subject to working capital during such period). The transaction is expected to close in the first half of 2021, subject to customary closing conditions.
4. The remainder of Bausch Health is referred to as “Bausch Pharma” and will assume a new name upon separation from the Company’s eye health business, Bausch + Lomb.
Bausch + Lomb44%
Salix23%
International Rx
15%
Diversified Products
11%
Executing Our Business Recovery from COVID-19
• Total company saw reported revenue growth of 1% vs. 1Q20, driven by a
rebound in Global Vision Care, Global Solta and International Rx
• Strong cash flow: $443M of cash generated from operations (GAAP)
during 1Q21
Unleashing Growth Drivers
Strong performance and recovery from leading brands:
• Thermage® reported 32% organic revenue growth1,2 vs. 1Q20
• TRULANCE® reported revenue growth of 11% vs. 1Q20
• Bausch + Lomb ULTRA® reported 5% organic revenue growth1,2 vs. 1Q20
• Ocuvite® + PreserVision® reported 4% organic revenue growth1,2 vs.
1Q20
• LUMIFY® reported $23M in revenue in 1Q21 or reported revenue growth
of 28% vs. 1Q20
Delivering on near-term R&D catalysts:
• Announced statistically significant topline results from first Phase 3 trial of
NOV03
• Announced statistically significant topline results from second pivotal
Phase 3 clinical trial of IDP-126
Accelerating Strategic Alternatives to Drive Shareholder Value
• Repaid $200M of debt in 1Q21 using cash generated from operations
• Entered into agreement to divest Amoun Pharmaceutical for ~$740M3
Bau
sch
Ph
arm
a4

1Q21 Revenue Results
7
1. See Slide 2 and Appendix for further non-GAAP information.
2. Organic growth/change, a non-GAAP metric, is defined as a change on a period-over-period basis in revenues on a constant currency basis (if applicable) excluding the impact of acquisitions, divestitures and discontinuations.
3. In connection with the planned separation of the Company's eye-health business into an independently traded entity from the remainder of Bausch Health Companies Inc, the Company has realigned and has begun operating in a
manner consistent with the organizational structure of the two separate entities as proposed by the separation. Commencing in 2021, the Company realigned its segment reporting structure and now operates in five reportable
segments. For more information about the current segment reporting structure, please see “New Segment Structure” and “New Segment Realignment” appendix slides in this Earnings presentation.
4. The remainder of Bausch Health is referred to as “Bausch Pharma” and will assume a new name upon the separation of the Company’s eye health business, Bausch + Lomb.
5. Bausch Pharma revenues, a non-GAAP metric, are determined by subtracting Bausch + Lomb segment revenues for the applicable period from total Bausch Health revenues for the applicable period.
Three Months Ended Favorable (Unfavorable)
3.31.21 3.31.20 ReportedOrganic
Change1,2
Bausch + Lomb3 Segment $881M $875M 1% (2%)
Global Vision Care Revenue $224M $193M 16% 13%
Global Surgical Revenue $162M $153M 6% 2%
Global Consumer Revenue3 $331M $330M 0% (2%)
Global Ophtho Rx Revenue3 $164M $199M (18%) (20%)
Bausch + Lomb Company $881M $875M 1% (2%)
New Segment Structure
Bausch + Lomb
• Global Consumer: Non-eyecare
products moved from Global
Consumer to International Rx
• Global Ophtho Rx: U.S. generic
ophthalmology products moved
from Generics to Global Ophtho Rx
Salix
• No reclassifications
International Rx
• Non-eyecare products moved from
Global Consumer to International
Rx partially offset by additional
moves to Global Ophtho Rx
Ortho Dermatologics
• Minor reclassification from Ortho
Dermatologics to Generics
Diversified Products
• Majority of the reclassification was
U.S. generic ophthalmology
products moved from Generics to
Global Ophtho Rx
Segment Recasting
Changes
Salix Segment $472M $477M (1%) (1%)
International Rx3 Segment $306M $291M 5% 4%
Ortho Dermatologics3 Segment $141M $131M 8% 5%
Ortho Dermatologics3 $69M $80M (14%) (14%)
Global Solta $72M $51M 41% 35%
Diversified Products3 Segment $227M $238M (5%) (2%)
Neuro & Other Revenue3 $154M $157M (2%) 3%
Generics Revenue3 $48M $60M (20%) (20%)
Dentistry Revenue $25M $21M 19% 19%
Bausch Pharma Company5 $1,146M $1,137M 1% 1%
Bau
sch
Ph
arm
a4
Total Bausch Health Companies $2,027M $2,012M 1% 0%

8
Three Months Ended Favorable (Unfavorable)
3.31.21 3.31.20 ReportedConstant
Currency1,2
Organic
Change1,3
Revenues $2,027M $2,012M 1% (1%) 0%
GAAP Net Loss (includes impairment) ($610M)Impairment of $469M7
($152M)
Adj. Net Income (non-GAAP)1
Diluted Shares Outstanding5
$370M
363.5M
$316M
358.6M17% 11%
GAAP EPS ($1.71) ($0.43)
GAAP CF from Operations
Adj. Cash Flows from Operations (non-GAAP)1
$443M
$587M6
$261M
$261M
70%
125%
Gross Profit4
(excluding amortization and impairments of
intangible assets)
$1,453M $1,493M (3%) (4%)
Gross Margin 71.7% 74.2% (250 bps)
Selling, A&P $418M $469M 11% 12%
Adj. G&A (non-GAAP)1 $146M $148M 1% 2%
R&D $112M $122M 8% 10%
Total Adj. Operating Expense (non-GAAP)1 $676M $739M 9% 10%
Adj. EBITA (non-GAAP)1 $777M $754M 3% 2%
Adj. EBITDA (non-GAAP)1 $852M $813M 5% 2%
1Q 21 Financial Results
1. See Slide 2 and Appendix for further non-GAAP information.
2. See Appendix for further information on the use and calculation of constant currency.
3. Organic growth/change, a non-GAAP metric, is defined as a change on a period-over-period basis in revenues on a constant currency basis (if applicable) excluding the impact of acquisitions, divestitures and discontinuations.
4. See Appendix for details on amortization and impairments of intangible assets.
5. This figure includes the dilutive impact of options and restricted stock units of approximately 6,657, 000 and 5,207,000 and common shares for the three months ended March 31, 2021 and 2020 which are excluded when calculating
GAAP diluted loss per share because the effect of including the impact in this calculation would have been anti -dilutive.
6. Excludes net legacy legal settlements ($118M), separation payments and separation-related payments ($26M).
7. Represents goodwill impairment.

9
1Q 21 Cash Flow Summary
Three Months
Ended 3.31.21
Three Months
Ended 3.31.20
Net loss1 ($607M) ($152M)
Net cash provided by operating
activities$443M $261M
Net cash used in investing activities ($56M) ($40M)
Net cash used in financing activities3($243M) ($1,521M)2
Net increase (decrease) in cash,
cash equivalents and restricted
cash3
$131M ($1,321M)2
Cash, cash equivalents and
restricted cash at end of period$1,893M4,9 $1,923M4
$443M of cash generated
from operations (GAAP)
during 1Q21; $587M5
adjusted cash flows from
operations (non-GAAP)6
Adj. cash generated from
operations (non-GAAP)7 for
2021 is expected to be
~$1.5B7,8
1. Net loss before net income attributable to noncontrolling interest.
2. Includes $1,240M redemption of 5.875% May 2023 Notes using proceeds from the December 2019 bond issuance.
3. Includes net impact of activity under our revolving credit facility (if any).
4. Includes remaining net proceeds from Dec. 2019 bond issuance intended to be used to finance the $1,210M pending settlement of the U.S. Securities litigation due in 2021.
5. Excludes net legacy legal settlements ($118M), separation payments and separation-related payments ($26M).
6. See Slide 2 and Appendix for further non-GAAP information.
7. The guidance in this presentation is only effective as of the date given, May 4, 2021, and will not be updated or affirmed un less and until the Company publicly announces updated or affirmed guidance. Distribution or reference of this
deck following May 4, 2021 does not constitute the Company re-affirming guidance. See Slide 1 for further information on forward-looking statements.
8. Excludes legacy legal settlements (net of any insurance recovery), separation payments and separation-related payments.
9. Excludes $54 million of cash and cash equivalents classified as held for sale associated with the Company's agreement to sell all of its equity interests in Amoun Pharmaceutical Company S.A.E.
10
1Q 21 Balance Sheet Summary
As of
3.31.21
As of
12.31.20
As of
9.30.20
As of
6.30.20
As of
3.31.20
Cash, cash equivalents and
restricted cash1,8$1,893M1,8 $1,816M1 $1,988M1 $1,907M1 $1,923M1
Revolving Credit Drawn $0M $0M $0M $0M $0M
Senior Secured Debt2 $8,473M $8,673M $8,948M $8,948M $10,541M
Senior Unsecured Debt2 $15,512M $15,512M $15,653M $15,681M $14,160M
Total Debt2 $23,985M $24,185M $24,601M $24,629M $24,701M
Net Debt2,3 $23,306M4 $23,580M4 $23,624M5 $23,733M5 $23,789M5
TTM6 Adj. EBITDA
(non-GAAP)7$3,333M $3,294M $3,281M $3,275M $3,533M
1. Includes remaining net proceeds from Dec. 2019 bond issuance intended to be used to finance the
$1,210M pending settlement of the U.S. Securities litigation expected to be due in 2021.
2. Debt balances shown at principal value. Senior secured debt figure is inclusive of revolving credit drawn
(if any).
3. Total Debt net of unrestricted cash and cash equivalents.
4. Restricted cash and cash equivalents as of 3/31/21 and 12/31/2020 includes $1,210M intended to be
used to finance the pending settlement of the U.S. Securities litigation in 2021. This $1,210M does not
reduce net debt as of 3/31/21 and 12/31/2020.
• Repaid $200M of debt in 1Q21 with cash generated from operations
• No debt maturities or mandatory amortization payments until 2024
5. Restricted cash and cash equivalents as of 9/30/2020, 6/30/20 and 3/31/20 includes $1,010M intended to be used to
finance the $1,210M pending settlement of the U.S. Securities litigation in 2021. This $1,010M does not reduce net debt
as of 9/30/2020, 6/30/20 and 3/31/20. Net Debt as of 9/30/2020, 6/30/20 and 3/31/20 is reduced by the remaining
$200M of the $1,210M which is not in restricted cash.
6. Trailing Twelve Months.
7. See Slide 2 and Appendix for further non-GAAP information.
8. Excludes $54 million of cash and cash equivalents classified as held for sale associated with the Company's agreement
to sell all of its equity interests in Amoun Pharmaceutical Company S.A.E.

Long-Term Debt Maturity Profile as of March 31, 20211
1. Debt values are shown at principal value.
11
• No debt maturities or mandatory amortization payments until 2024
• As of March 31, 2021, ~80% of debt is fixed rate debt; remaining ~20% is secured floating
• As of March 31, 2021, ~6.0% weighted average cost of debt
• For 1Q21, repaid $200M of debt using cash generated from operations
• Subsequent to 1Q21, announced redemption of $200M of 7.0% Senior Secured Notes due 2024 ($100M scheduled to be redeemed on May 7,
2021 and $100M on June 2, 2021) with cash generated from operations
No Debt Maturities or Mandatory Amortization Until 2024
2021 2022 2023 2024 2025 2026 2027 2028 2029 2030 2031 Total
Debt
Maturities
(Secured)$0 $0 $0 $1,800M $5,768M $0 $500M $0 $0 $0 $0 $8,068M
Debt
Maturities
(Unsecured)
$0 $0 $0 $0 $4,750M $1,500M $1,750M $2,012M $3,250M $1,250M $1,000M $15,512M
Mandatory
Amortization
(Secured)
$0 $0 $0 $291M $114M $0 $0 $0 $0 $0 $0 $405M
Total $0 $0 $0 $2,091M $10,632M $1,500M $2,250M $2,012M $3,250M $1,250M $1,000M $23,985M

12
FY 2021 Guidance
13
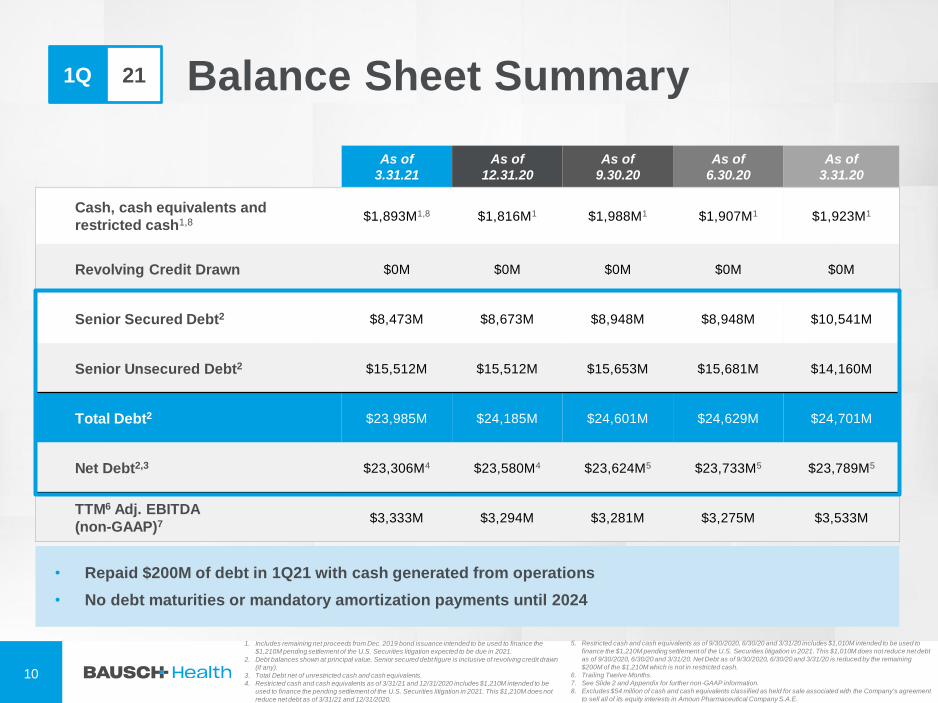
Key AssumptionsPrior Guidance
(February 2021)
Current Guidance
(May 2021)10
Adj. SG&A Expense (non-GAAP)1 ~$2.6B ~$2.5B
R&D Expense ~$525M ~$525M
Interest Expense2 ~$1.46B ~$1.46B
Adj. Tax Rate (non-GAAP)1 ~7% ~9%
Avg. Fully Diluted Share Count 363M 364M
Additional Non-Cash Assumptions
Depreciation ~$195M ~$195M
Stock-Based Compensation ~$115M ~$130M
Additional Cash Item Assumptions
Capital Expenditures9 ~$275M ~$275M
Contingent Consideration /
Milestones /
License Agreements
~$175M ~$175M
Restructuring and Other ~$75M ~$75M
Prior Guidance
(February 2021)
Current Guidance
(May 2021)10
Total Revenues $8.60B - $8.80B $8.60B - $8.80B
Adjusted EBITDA (non-GAAP)1 $3.40B - $3.55B $3.40B - $3.55B
1. See Slide 2 and Appendix for further non-GAAP information.
2. Interest expense includes amortization and write-down of deferred financing costs of ~$50M.
3. The guidance in this presentation is only effective as of the date given, May 4, 2021,
and will not be updated or affirmed unless and until the Company publicly announces
updated or affirmed guidance. Distribution or reference of this deck following May 4,
2021 does not constitute the Company re-affirming guidance.
4. See Slide 1 for further information on forward-looking statements.
Adj. cash generated from
operations (non-GAAP)1
for 2021 is expected to
be ~$1.5B5
Gross margin for 2021 is
expected to be ~71%
3-year CAGRs6,8
(constant currency and from the
mid-point of 2019 guidance7)
• Expect revenue to grow
at a 3%-5% CAGR6
• Expect adj. EBITDA
(non-GAAP)1 to grow at
a 4%-7% CAGR6
Excluding divestitures,
targeting ~$1B of debt
paydown in 2021
Full-Year 2021 Revenue and
Adjusted EBITDA (non-GAAP)1 Guidance3,4
5. Excludes legacy legal settlements (net of any insurance recovery), separation payments and separation-
related payments
6. Compound Annual Growth Rate.
7. Based on Guidance issued in Feb. 2019.
8. Excludes the impact of the previously announced separation of the eye health business, including one-
time costs, duplicative costs, and dis-synergies associated with such separation.
9. Does not include impact of spinoff.
10.No adjustment related to anticipated divestiture of Amoun Pharmaceutical.

Full-Year 2021 Revenue and Adjusted EBITDA (non-GAAP)1
Guidance Bridge2,3,4
14
1. See Slide 2 and Appendix for further non-GAAP information.
2. The guidance in this presentation is only effective as of the date given, May 4, 2021, and will not be updated or affirmed un less and until the Company publicly announces
updated or affirmed guidance. Distribution or reference of this deck following May 4, 2021 does not constitute the Company re-affirming guidance.
3. See Slide 1 for further information on forward-looking statements.
4. No adjustment related to anticipated divestiture of Amoun Pharmaceutical.
.
Feb.
Guidance
Currency
ImpactLOE
Base
PerformanceMay Guidance
$0M
Revenue Revenue
Adj. EBITDA (non-GAAP)1
Adj. EBITDA (non-GAAP)1
Approx.
-$5M$0M
Approx.
+$25M
Approx.
+$5M
Approx.
-$25M
Feb.
Guidance
Currency
ImpactLOE
Base
PerformanceMay Guidance
$8.80B
to
$8.60B
$3.55B
to
$3.40B
$8.80B
to
$8.60B
$3.55B
to
$3.40B

Global Vision Care
• Strong recovery as Global Vision Care saw 13% organic revenue growth1,2 vs.
1Q20, driven by ramp-up in U.S. and rebounds seen in International
• U.S.: +4% reported revenue growth vs. 1Q20, driven by ramp of
astigmatism line extensions for Biotrue® ONEday and Bausch + Lomb
ULTRA® and continued INFUSE® launch
• International: +19% organic revenue growth1,2 vs. 1Q20, driven by
rebound in Asia Pacific region
• Daily SiHy launched in U.S., Australia, Hong Kong and Canada; Global
revenue for Bausch + Lomb SiHy dailies is expected to exceed $250M in sales4
15
1. See Slide 2 and Appendix for further non-GAAP information.
2. Organic growth/change, a non-GAAP metric, is defined as a change on a period-over-period basis in revenues on a constant currency basis (if applicable) excluding the impact of acquisitions,
divestitures and discontinuations.
3. IQVIA NPA monthly.
4. See Slide 1 for further information on forward-looking statements.
5. See footnote 3 at slide 7 for further details regarding the realigned segment reporting structure and the conformed prior period presentation.
6. Consumer Data Science: Online Consumption Sales.
Bausch + Lomb5 1Q21 Highlights
Global Consumer
• Ocuvite® + PreserVision® saw organic revenue growth1,2 of 4% vs. 1Q20
• Market Share Gains: Bausch + Lomb U.S. eye vitamin share grew to
75.9% in 1Q21 compared to 75.1% in 1Q203
• LUMIFY® reported $23M in revenue in 1Q21 or reported revenue growth of
28% vs. 1Q20
• Continued strong e-commerce growth: Bausch + Lomb U.S. Consumer saw
35% growth in e-commerce vs. 1Q20; e-commerce now accounts for 12% of
the total Bausch + Lomb U.S. Consumer business, up from 2% in 20176
Global Surgical
• Performance driven by International which saw 3% organic revenue
growth1,2 vs. 1Q20, primarily due to rebound from COVID-19 impact
Global Ophtho Rx
• Performance negatively impacted by COVID-19 and LOEs
• VYZULTA® saw 18% TRx growth vs. 1Q20, compared to market decline of 7%3
• Statistically significant topline results from first Phase 3 trial of NOV03
• Organic revenue1,2 near pre-COVID-19 levels
in 1Q21 vs. 1Q20, with an organic revenue
decline1,2 of (2%)
Recovery in Progress
Global Vision Care25%
Global Surgical
18%Global
Consumer38%
Global Ophtho Rx
19%
Bausch + Lomb Revenue Breakdown

Jan-20 Jun-20 Nov-20 Apr-21
-30%
-10%
10%
30%
50%
Jan-20 Aug-20 Mar-21
22%
31%
3%
-47%
-40%
1%
10%4%
11%7% 9%
6%
-7%-7%
26%
-60%
-40%
-20%
0%
20%
40%
Jan-20 Aug-20 Mar-21
Jan - 20 Aug - 20 Mar - 21Apr-18 Nov-18 Jun-19 Jan-20 Aug-20 Mar-21
-
1,000
2,000
3,000
4,000
5,000
Jan-18 Dec-18 Nov-19 Oct-20
16
Bausch + Lomb Recovery in Progress
1. Internal field consumption sales data.2. IQVIA NPA weekly.
3. Bausch + Lomb Consumer Data Science: Omnichannel Data.4. % reflects rolling 4 week recovery to pre-COVID-19 average procedures.5. Internal data
VYZULTA® TRx Trend2Bausch + Lomb U.S. Vision Care Dollar %
Change Year-Over-Year (Field Consumption)1
Recovery in Progress
LUMIFY®: Weekly Sales Trend3
U.S. Bausch + Lomb Consumer Consumption
% Change Year-Over-Year3
COVID-19 Pantry Loading
Stellaris Elite™ Procedures in U.S. Performed Since
Beginning of 2020(data collected via eyeTelligence which accounts for ~40% of the Stellaris
Elite™ systems within the U.S. market)
Near Pre-COVID Levels in U.S.4
International Surgical Revenue5
>100% Pre-COVID Levels ex-U.S.
Mar-21
Lapping 2020 COVID-19 Pantry
Loading

5%
12%
18% 17%
4%
-21%
-10%
2%
-1%
-25%
-20%
-15%
-10%
-5%
0%
5%
10%
15%
20%
1Q19 2Q19 3Q19 4Q19 1Q20 2Q20 3Q20 4Q20 1Q21
17
1. See Slide 2 and Appendix for further non-GAAP information.
2. Organic growth/change, a non-GAAP metric, is defined as a change on a period-over-period basis in revenues on a constant currency basis (if applicable) excluding the impact of acquisitions,
divestitures and discontinuations.
3. IQVIA NPA monthly.
4. IQVIA Monthly xPonent PlanTrak Data.
Salix 1Q21 Highlights
XIFAXAN®
• XIFAXAN® saw reported revenue decline of (2%) vs. 1Q20
• Performance driven by lower prescriptions mostly in the Long
Term Care channel where COVID-19 continues to have a negative
impact
• Market share gains: NRx market share grew to 86.6% in 1Q21
compared to 85.2% in 4Q193
TRULANCE®
• TRULANCE® saw reported revenue growth of 11% vs. 1Q20
• TRx growth of 21% in 1Q21 vs. 1Q20, compared to market growth
of 3%3
• Increased NRx market share: Commercial NRx market share
moved from 5.7% at time of acquisition in March 2019 to 11% in
February 20214
RELISTOR®
• RELISTOR® saw reported revenue decline of (3%) vs. 1Q20
• TRx growth of 3% in 1Q21 vs. 1Q20, compared to market decline
of 4%3
• TRx growth driven by RELISTOR® oral which saw 7% TRx
growth in 1Q21 vs. 1Q203
Salix Organic Growth1,2 (Y/Y)
• Organic revenue1,2 recovered to near pre-
COVID-19 levels in 1Q21 vs. 1Q20, with an
organic revenue decline1,2 of (1%)
Recovery in Progress
Strong Growth Pre-COVID

-
1,000
2,000
3,000
4,000
5,000
6,000
7,000
8,000
Nov-17 Jul-18 Mar-19 Nov-19 Jul-20 Mar-211,200
1,300
1,400
1,500
1,600
1,700
Jan-20 Jun-20 Nov-20 Apr-21
14,500
15,500
16,500
17,500
18,500
19,500
Jan-20 Jun-20 Nov-20 Apr-21
18
Salix Recovery in Progress
1. IQVIA NPA weekly.
XIFAXAN® TRx Trend1
Thanksgiving
Christmas
TRULANCE® TRx Trend1 RELISTOR® TRx Trend1

191. See Slide 2 and Appendix for further non-GAAP information.
2. Organic growth/change, a non-GAAP metric, is defined as a change on a period-over-period basis in revenues on a constant currency basis (if applicable) excluding the impact of acquisitions,
divestitures and discontinuations.
3. See footnote 3 at slide 7 for further details regarding the realigned segment reporting structure and the conformed prior period presentation.
International Rx3 1Q21 Highlights
EMEA, Russia, CIS
57.9%
Latin America
24.8%
Canada
17.0%
Asia
Pacific
0.3%
Revenue Breakdown by Region
Canada
Top 3 Products
• Jublia®
• Tiazac®
• Glumetza®
EMEA, Russia,
CIS
Top 3 Products
• Bisocard®
• Xithrone®
• Hibiotic®
Latin America
Top 3 Products
• Ivexterm®
• Bedoyecta®
• Espaven®
International Rx
Saw 4% organic revenue growth1,2 vs. 1Q20; growth was driven by Latin America
5% 5%4%
-1%
7%
-8%
10% 10%
4%
-10%
-5%
0%
5%
10%
15%
1Q19 2Q19 3Q19 4Q19 1Q20 2Q20 3Q20 4Q20 1Q21
International Rx Organic Growth1,2 (Y/Y)
Driven by COVID-19 Impact

20
Ortho Dermatologics3 1Q21 Highlights
Global Solta
• Thermage® saw organic revenue growth1,2 of 32% vs. 1Q20
• Strong performance driven by China (171% organic
revenue growth1,2 vs. 1Q20) and U.S. (87% reported
revenue growth vs. 1Q20)
• Launched Clear + Brilliant® Touch laser in U.S.,
a next generation Clear + Brilliant® laser
• All Promoted Global Solta products saw reported revenue
growth vs. 1Q20 including:
• Clear & Brilliant®: +67% reported revenue growth
• Vaser®: +25% reported revenue growth
• Fraxel®: +33% reported revenue growth
• 2021 Growth Catalysts: Continued market penetration in China and
U.S. as well as geo-expansion, including Europe
1. See Slide 2 and Appendix for further non-GAAP information.
2. Organic growth/change, a non-GAAP metric, is defined as a change on a period-over-period basis in revenues on a constant currency basis (if applicable) excluding the impact of acquisitions,
divestitures and discontinuations.
3. See footnote 3 at slide 7 for further details regarding the realigned segment reporting structure and the conformed prior period presentation.
Global Solta Organic Growth1,2 (Y/Y)Recovery in Progress
• Organic revenue1,2 recovered to pre-COVID-19
levels and reported 5% organic revenue1,2
growth vs. 1Q20
• ~40% EBITA margin (non-GAAP)1 expansion
vs. 1Q20
• Performance driven by strong demand in Global
Solta which saw organic revenue1,2 growth of
35% vs. 1Q20
34%
44%
62%
42%37%
-7%
53%
31%35%
-20%
0%
20%
40%
60%
80%
1Q19 2Q19 3Q19 4Q19 1Q20 2Q20 3Q20 4Q20 1Q21
Continued Strong Growth
Driven by COVID-19 Impact
Ortho Dermatologics Segment EBITA Margin (non-GAAP)1
36%
50%
1Q20 1Q21

1. See Slide 1 for further information on forward-looking statements.
2. MarketScope Q3 manufacturers survey.
3. Internal data.
21
• SiHy daily: Ramp up and approvals globally
Global revenue for Bausch + Lomb SiHy dailies is expected to exceed $250M in sales1
• Cataract surgery tailwind:
In U.S., ~4M surgeries are performed each year2
In 2020, we estimate ~650K surgeries or ~16% in U.S. were delayed while outside the U.S. we estimate 20% of the
surgeries were delayed, creating a potential tailwind for 2021 and beyond3
• Continued global expansion of our International Rx portfolio
• Thermage® franchise: Expansion of sales force into Europe
• Strong performance and recovery of leading brands:
Business Growth Drivers1
Unleashing Growth Drivers

-41.2%
-29%
NOV03 Saline
p<0.001
N=289 N=279
-30%
-15%
NOV03 Saline
p<0.001
N=289 N=279
22
• Readout of topline results of first of two
Phase 3 trials for NOV03, an
investigational treatment for dry eye
disease associated with meibomian gland
dysfunction2 – Completed April 2021
• Second Phase 3 trial ongoing; if
positive, will allow for a filing to
the FDA in 2022
• Expect to complete enrollment for
Eyenovia Phase 3 trial for reduction of
pediatric myopia3 – 2H22
• Expect to start Phase 3 trial for
Risuteganib (Luminate®)4, an
investigational treatment expected to help
reverse vision loss due to dry AMD5,6
R&D: Upcoming Milestones
Near-term Catalysts: Bausch + Lomb1
1. See Slide 1 for further information on forward-looking statements.2. Exclusive licensing agreement with NovaliqGmbH.
3. Exclusive licensing agreement with Eyenovia, Inc.4. Provisional name. Luminate® is a registered trademark of Allegro Ophthalmics.5. Age-related Macular Degeneration.
6. Agreement to acquire all ophthalmology assets of Allegro.7. Sun M, Moreno IY, Dang M, Coulson-Thomas VJ. Meibomian Gland Dysfunction: What Have Animal Models Taught Us? Int J Mol Sci. 2020 Nov 21;21(22):8822. doi: 10.3390/ijms21228822. PMID:
33233466; PMCID: PMC7700490. Available at https://www.ncbi.nlm.nih.gov/pmc/articles/PMC7700490/ .8. P-value for the difference in Least Squared Means.9. Intent-to-treat.
NOV03: Phase 3 Topline Results
Statistically significant topline data from the first Phase 3 trial (GOBI trial)
All primary and secondary endpoints were achieved
Market Opportunity: >16M Adults in the U.S. have some form of dry eye disease,
with meibomian gland dysfunction as a known cause for a majority of these cases7
Total Corneal Staining8 (ITT9) Ocular Dryness8 (ITT9)
Decre
ase f
rom
Baselin
e (
%)
Phase 3 Co-Primary Efficacy Endpoints: Total Corneal Staining (sign) and
Ocular Dryness (symptom) at Day 57
22

23
• Readout of topline results of second of
two Phase 3 trials for IDP-126, a
combination retinoid, anti-bacterial and
antibiotic topical, to treat acne vulgaris in
patients nine years of age and older –
Completed April 2021
• Following the results of a
comparative bridging study,
expected to submit NDA to the
FDA in 2H22
• Initiate Amiselimod S1P2 Modulator Phase
2 trial3 – 1H21
• Initiate Phase 3 trial for rifaximin life cycle
program RED-C (prevention of cirrhosis
complications – HE4) – 2H21
• Initiate Phase 2 trial for rifaximin life cycle
program including sickle cell – 2H21
R&D: Upcoming Milestones
Near-term Catalysts: Bausch Pharma1,9
1. See Slide 1 for further information on forward-looking statements.2. Sphingosine 1-phosphate.
3. Exclusive licensing agreement with Mitsubishi Tanabe Pharma.4. Hepatic encephalopathy.5. Success defined as 2 grade reduction and clear or almost clear EGSS Inclusion
criteria: Minimum moderate severity (Grade 3) on EGSS.
IDP-126: Phase 3 Topline Results
Statistically Significant Topline Results from Second Pivotal Phase 3 Trial
All Three Co-Primary Endpoints Were Achieved
If approved, IDP-126 would be the first-in-class with this triple combination
Market Opportunity:
• Acne is the most common skin problem in the United States, affecting up to 50M
Americans6,7
• ~$600M topical acne market in the U.S. and Canada8
-80
-70
-60
-50
-40
-30
-20
-10
0
Week 0 Week 2 Week 4 Week 8 Week 12
IDP-126 Gel IDP-126 Vehicle Gel
79.3-80
-70
-60
-50
-40
-30
-20
-10
0
Week 0 Week 2 Week 4 Week 8 Week 12
IDP-126 Gel IDP-126 Vehicle Gel
% Change: Inflammatory Lesion Counts % Change: Non-Inflammatory Lesion Counts
72.4
Treatment success of 50.5% vs. 20.5% for vehicle5
Greater than 70% reduction in lesion counts
23
6. American Academy of Dermatology. (2020). Skin conditions by the numbers. Retrieved from https://www.aad.org/media/stats/conditions/skin-conditions-by-the-numbers.
7. Mayo Clinic. (2020). Acne. Retrieved from https://www.mayoclinic.org/diseases-conditions/acne/symptoms-causes/syc-20368047.
8. Evaluate and IQVIA MAT Feb 2021.
9. The remainder of Bausch Health is referred to as “Bausch Pharma” and will assume a new name upon
the separation of the Company’s eye health business, Bausch + Lomb.

2019 2020 2021 2022 2023 2024 2025 2026 2027
Rifaximin solid
soluble dispersion
(SSD) in a tablet1
RED-C
Combination of rifaximin
with a mucolytic agent1
Irritable Bowel
Syndrome - Diarrhea
Cedars-Sinai
Collaboration
Rifaximin liquid gel
capsules1
Small Intestinal
Bacterial
Overgrowth (SIBO)
Rifaximin timed
release coated
beads in capsules1
Sickle Cell
Anemia
Phase 3
Trial Start
Expected
NDA Approval
Expected
Phase 2
Trial Start
Expected
NDA Approval
ExpectedPhase 3
Trial Start
Expected
NDA Approval
Expected
Phase 3
Trial Start
Expected
Phase 1b/2a
Trial Start
Expected
Phase 2b/3
Trial Start
Expected
NDA Approval
Expected
Phase 2
Trial Start
Expected
1. See Slide 1 for further information on forward-looking statements.
4 Novel Rifaximin FormulationsUnique and novel rifaximin formulations are in development to address unmet medical needs
24

Executing Our
Business
Recovery from
COVID-19
2021 Strategic Focus: Execution, Growth & Accelerating
Strategic Alternatives
Unleashing
Growth Drivers
Accelerating
Strategic
Alternatives to
Drive
Shareholder
Value
25

26
Spinoff Update & Management Announcement

Accelerating Strategic Alternatives to Expedite Spin-off1
1. See Slide 1 for further information on forward-looking statements.
2. The remainder of Bausch Health is referred to as “Bausch Pharma” and will assume a new name upon the separation of the Company’s eye health business, Bausch + Lomb.
Achieve all internal
objectives needed
for the spinoff
expected by 3Q21
Complete financial
segmentation of
Bausch + Lomb
1Q21
Achieve leverage /
financial objectives
needed for the
spinoff TBD
Potential Paths Forward:
3Q21
Use cash generated through asset divestitures
Initial public offering with optionality
Organic deleveraging
• Grow EBITDA
• Improve
working
capital
efficiency
• Delever
Actively pursuing all opportunities to expedite leverage
improvement and deliver shareholder value
Bausch + Lomb Net Leverage
Targeting less than 2.5x at time of spin
Bausch Pharma2 Net Leverage
Targeting ~6.5x-6.7x at time of spin
27

Spin-off Timeline1
1. See Slide 1 for further information on forward-looking statements.2. The remainder of Bausch Health is referred to as “Bausch Pharma” and will assume a new name upon the separation of the Company’s eye health business, Bausch + Lomb.
Internal Organizational Design / Structure
Capital Structure
Spinoff
Announced
August
2020
May
2021
Financial Segmentation
of Bausch + Lomb
Leadership Announcement
Q3 2021
All internal objectives
necessary for spinoff
expected to be achieved
Announced sale of Amoun
Pharmaceutical for $740M
of gross proceeds –
Expected to be completed
in 2Q21, net proceeds to
repay debt
$100M Debt
Paydown
$275M Debt
Paydown
$100M Debt
Paydown
Spinoff Complete,
Unlocking Value for
Both Businesses
$150M Debt
Paydown
$100M Debt
Paydown(Announced
May 3)
$100M Debt
Paydown(Announced
April 7)
$100M Debt
Paydown
January
2021
28
Expected Tax Rate
• Bausch Pharma2: ~10-12%
• Bausch + Lomb: A few hundred
basis points higher than Bausch
Pharma
Both companies will be domiciled
in Canada; Corporate offices will
continue to be in Bridgewater, NJ
Intend to list both companies
on TSX & NYSE

29
Spin-off Leadership Team: Bausch + Lomb1
Joseph C. Papa
Chief Executive Officer
Mr. Papa has been serving on the Board of Directors for Bausch Health Companies Inc. since May 2016 as chairman and chief executive officer. He
has more than 35 years of experience in the pharmaceutical, health care and specialty pharmaceutical industries, including 20 years of branded
prescription drug experience. Prior to Bausch Health, he was the chief executive officer of the Perrigo Company from 2006 to April 2016. Before that,
Mr. Papa served as chairman and chief executive officer of Cardinal Health’s Pharmaceutical Technologies and Services business unit (2004 –
2006). He was president and chief operating officer for Watson Pharmaceuticals (2001 – 2004), president of Global Country Operations for
Pharmacia’s North American business (2000 – 2001) and president of Searle’s U.S. Operations (1997 – 2000). Prior to Searle/Pharmacia, Mr. Papa
served in a variety of general management, sales, marketing and R&D positions during his 15-year career at Novartis Pharmaceuticals Corporation
(1983 – 1997). During his career, he led teams that successfully launched several blockbuster pharmaceutical products, including Lotrel, Diovan and
Celebrex, and he is the patent holder for a cardiovascular combination treatment containing Amlodipine and Benazepril.
Mr. Papa holds a B.S. in pharmacy from the University of Connecticut and a Master of Business Administration (MBA) from Northwestern University’s
Kellogg Graduate School of Management. In 2012, he received an Honorary Doctor of Science degree from the University of Connecticut’s School of
Pharmacy. He is a past member of the UConn Foundation Board of Directors and the Smith & Nephew Board of Directors, where he served as
chairman of the Remuneration Committee.
Sam Eldessouky
Chief Financial Officer
Mr. Eldessouky joined Bausch Health in 2016 as senior vice president and corporate controller. In his current role, he is responsible for overseeing
the global controllership functions, including financial reporting, regional finance and global policies. Previously, he served as senior vice president,
controller and chief accounting officer for Tyco International plc. During his tenure at Tyco, Mr. Eldessouky led the efforts to redesign the controller’s
organization and the implementation of Enterprise Performance Management framework, and he played a significant role in the wholesale
turnaround of Tyco’s business. He also played a key role in executing the spinoffs of Covidien and Tyco Electronics in 2006 and ADT NA and Flow
Control in 2012. Prior to that, Mr. Eldessouky spent ten years at PricewaterhouseCoopers (PwC), where he held several roles of increasing
responsibility and served in PwC’s National Office providing technical accounting guidance on complex accounting matters.
Mr. Eldessouky holds a Bachelor of Science in Accountancy from Ain Shams University and a master’s degree in Accounting and F inance from the
University of Liverpool. He is a Certified Public Accountant and Chartered Global Management Accountant. He served as a member of the Board of
Trustees of Financial Executives Research Foundation and Financial Executives International. Additionally, Mr. Eldessouky served as a member of
the Global Preparers Forum, an external advisory body to the International Accounting Standards Board, from 2007 to 2013.
1. The Company Board has proposed that these individuals be appointed as CEO and CFO of Bausch + Lomb at the time of the separationof Bausch + Lomb. Such individuals will continue to serve in their current roles at the Company prior to the separation.

30
Appendix

New Segment Structure4Q20 Segment Structure vs. 1Q21 Segment Structure
31
1Q21 Segment Structure
Segment Business Lines
Bausch + Lomb4
• Global Vision Care
• Global Surgical
• Global Consumer
• Global Ophtho Rx1
4Q20 Segment Structure
Segment Business Lines
Bausch +
Lomb/International
• Global Vision Care
• Global Surgical
• Global Consumer
• Global Ophtho Rx
• International Rx
Salix • Salix
Ortho
Dermatologics
• Ortho Dermatologics
• Global Solta
Diversified Products
• Neuro & Other
• Generics
• Dentistry
1. Global Ophtho Rx includes U.S. generic ophthalmology products. 2. International Rx excludes international B+L consumer and international ophthalmology products.
3. Generics excludes U.S. generic ophthalmology products.4. See footnote 3 at slide 7 for further details regarding the realigned segment reporting structure and the conformed prior period presentation.
5. The remainder of Bausch Health is referred to as “Bausch Pharma” and will assume a new name upon the separation of the Company’s eye health business, Bausch + Lomb.
Approximately ~$44M of revenue in 1Q21 is transferred to
Bausch + Lomb from Bausch Pharma.
New Segment Structure
1Q21 Segment Structure
Segment Business Lines
Salix • Salix
International Rx4 • International Rx2
Ortho Dermatologics4 • Ortho Dermatologics
• Global Solta
Diversified Products4
• Neuro & Other
• Generics3
• Dentistry
Bau
sc
h P
ha
rma
5

32
New Segment Realignment 1Q 2020 Revenue Bridge
Reported
1Q20Reclassification
Restated
1Q20
Bausch + Lomb1 Segment $831M $44M $875M
Global Vision Care Revenue $193M $0M $193M
Global Surgical Revenue $153M $0M $153M
Global Consumer Revenue1 $353M ($23M) $330M
Global Ophtho Rx Revenue1 $132M $67M $199M
Bausch + Lomb Company $831M $44M $875
1. See footnote 3 at slide 7 for further details regarding the realigned segment reporting structure and the conformed prior period presentation.
2. The remainder of Bausch Health is referred to as “Bausch Pharma” and will assume a new name upon the separation of the Company’s eye health business, Bausch + Lomb.3. Bausch Pharma Company revenues, a non-GAAP metric, are determined by subtracting Bausch + Lomb segment revenues for the applicable period from total Bausch Health Company revenues for
the applicable period. See appendix for further non-GAAP information.
New Segment Structure
Bausch + Lomb
• Global Consumer: Non-eyecare
products moved from Global
Consumer to International Rx
• Global Ophtho Rx: U.S. generic
ophthalmology products moved
from Generics to Global Ophtho Rx
Salix
• No reclassifications
International Rx
• Non-eyecare products moved from
Global Consumer to International
Rx partially offset by additional
moves to Global Ophtho Rx
Ortho Dermatologics
• Minor reclassification from Ortho
Dermatologics to Generics
Diversified Products
• Majority of the reclassification was
U.S. generic ophthalmology
products moved from Generics to
Global Ophtho Rx
Segment Recasting
Changes
Salix Segment $477M $0M $477M
International Rx1 Segment $283M $8M $291M
Ortho Dermatologics1 Segment $133M ($2M) $131M
Diversified Products1 Segment $288M ($50M) $238M
Bausch Pharma Company3 $1,181M ($44M) $1,137M
Bau
sc
h P
ha
rma
2
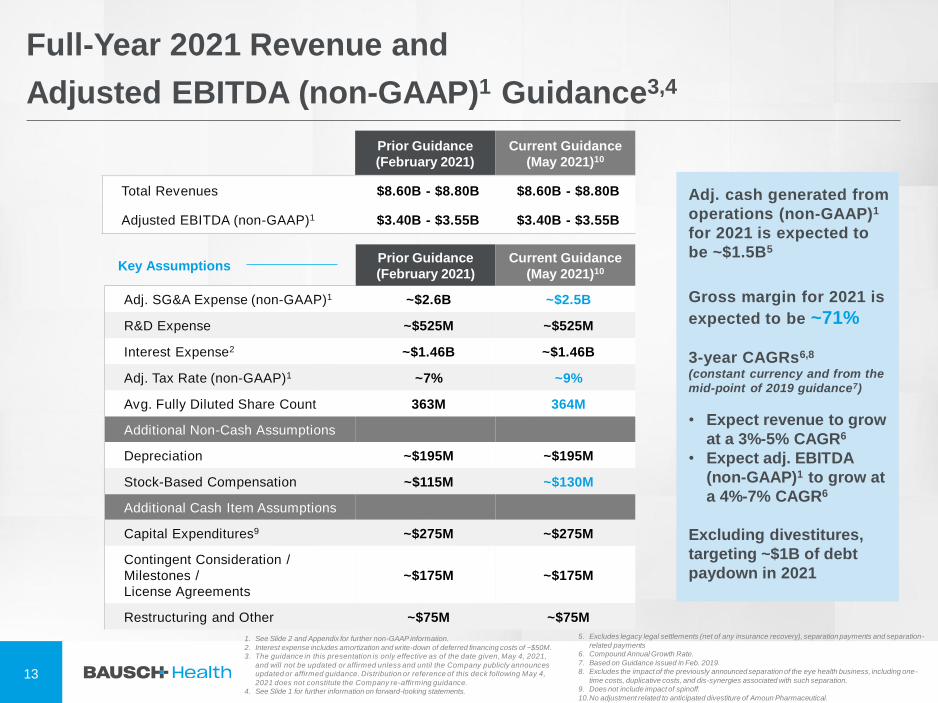
Bausch Health (Total Company)
3-year CAGR1,2 (2019-2022)5
Constant currency and from the original mid-point of 2019 guidance3
33
• Expect revenue to grow at a 3%-5% CAGR1,2 at midpoint of original 2019
guidance of $8,400M
1. Compound Annual Growth Rate.
2. Excludes the impact of the previously announced separation of the eye health business, including one-time costs, duplicative costs, and dissynergies associated with such separation.
3. Based on Guidance issued in Feb. 2019.
4. See Slide 2 and Appendix for further non-GAAP information.
5. See Slide 1 for further information on forward-looking statements.
• Expect adj. EBITDA (non-GAAP)4 to grow at a 4%-7% CAGR1,2 at
midpoint of original 2019 guidance of $3,425M

1. See slide 1 for further information on forward-looking statements.
2. Investigational device exemption.
3. Exclusive licensing agreement with Clearside Biomedical, Inc.
4. Exclusive licensing agreement with Novaliq GmbH.
5. Sphingosine 1-phosphate.
6. Exclusive licensing agreement with Mitsubishi Tanabe Pharma.
7. Overt hepatic encephalopathy.
34
8. Hepatic encephalopathy.
9. Exclusive licensing agreement with Eyenovia, Inc.
10. Exclusive licensing agreement with BHVI.
11.Agreement to acquire all ophthalmology assets of Allegro.
12.Provisional name. Luminate® is a registered trademark of Allegro Ophthalmics.
13.Small intestinal bacterial overgrowth.
Pipeline and Portfolio Expansion: Late Stage Development1
• SiHy Daily – Launched in Japan and U.S.; Launched in Australia, Hong
Kong and Canada in 4Q20
• LUMIFY® Line Extensions – Phase 3 clinical studies expected to start in
2021
• Extended depth of focus intraocular lens - Currently under
development; expect 1H22 launch
• enVista® Trifocal (Intraocular Lens) – Initiated IDE2 study in May 2018;
Initiated the last phase of this three phase study in 4Q20
• New Ophthalmic Viscosurgical Device – Expect results in 4Q21 from
clinical study; Received premarket approval in March 2021 for
dispersive OVD product
• XIPERE™3 (investigational treatment for macular edema associated with
uveitis) – Resubmitted NDA to FDA
• Alaway® Preservative-Free (EM-100) (OTC preservative-free eye drop for
the treatment of ocular itching associated with allergic conjunctivitis) –
Launched Feb. 2021
• NOV034 (dry eye disease associated with meibomian gland dysfunction) –
Announced statistically significant topline data from the first of two
Phase 3 studies; anticipate readout of topline results from second
Phase 3 study in 2H21 and anticipate filing an NDA in 2022
• Microdose formulation of atropine ophthalmic solution (reduction of
pediatric myopia progression in children ages 3-12)9 – Expect to complete
enrollment for a Phase 3 study during the 2H22
• Myopia control contact lens design10 licensed from BHVI
• Risuteganib (Luminate®)12 (investigational compound in retina, which is
believed to simultaneously act on the angiogenic, inflammatory and
mitochondrial metabolic pathways implicated in diseases such as
intermediate dry AMD) - Topline results of Phase 2a intermediate dry
AMD clinical trial, met its primary endpoint; Phase 3 testing is in the
planning stages11
• Amiselimod S1P5 Modulator6 – Completed the thorough QT study
which evaluated the cardiac safety profile; topline results were
positive and expect to initiate Phase 2 study in 1H21
• Rifaximin (OHE7) – Topline data from our Phase 2 study for the
treatment of OHE with a new formulation of rifaximin showed a
treatment benefit; The topline results of this study will help inform
further research on potential new indications for rifaximin using this
new formulation.
• Rifaximin (RED-C: prevention of cirrhosis complications – HE8) - Phase 3
trial expected to start 2H21
• Rifaximin (SIBO13) - Phase 2 awaiting results of new formulation
study that will be available in 1H21; Research on development of a
Patient Reported Outcomes tool for SIBO is to continue in 2021
• ENVIVE™ (Probiotic) – Launched with a targeted group of
gastroenterologists; Widely launched April 2021
• Clear + Brilliant® Touch laser (a next generation Clear + Brilliant® laser) -
U.S. launch 1H21
• IDP-120 (Acne) – Phase 3 completed and met primary endpoints;
currently evaluating next steps for this program
• ARAZLO® (formerly IDP-123 - Acne) – Launched June 2020
• IDP-126 (Acne Combination) – Second Phase 3 trial saw statistically
significant topline results; following the results of a comparative
bridging study, expect to submit NDA in the 2H22

1. Anticipated date of loss of exclusivity is based on the Company’s current best estimate and actual date of LOE, as the case m ay be, may occur earlier or later. Changes from prior
forecast are noted in red.
35
Key Product LOE Q1 2021 Impact
Business UnitProduct Line with Actual or
Anticipated LOE Date1
LOE Rev/Profit
Q1 2020 Actual
LOE Rev/Profit
Q1 2021 Actual
Change
Q1 2020 vs. Q1 2021
Revenue Profit Revenue Profit Revenue Profit
Bausch & Lomb
• Lotemax Suspension® 2Q19
• Lotemax Gel® 1Q21
• Timoptic Ocudose 4Q20
• Bepreve 2Q21
$16M $15M $9M $8M ($7M) ($7M)
Salix
• Zegerid® add’t US Gx 2017
• Uceris® 3Q18
• Apriso® 4Q19
• Moviprep® 3Q20
$15M $11M $23M $20M $8M $9M
International Rx
• Glumetza® 1Q17 - Canada
• Tiazac® XC 2H 2021 (not date certain) -
Canada
• Lodalis 1H 2021 (not date certain) - Canada
$13M $10M $11M $8M ($2M) ($2M)
Ortho
Dermatologics
• Solodyn® 1Q18/19
• Acanya® 3Q18
• Elidel® 4Q18
• Zovirax® (Cream) 1Q19
$5M $5M ($1M) ($1M) ($6M) ($6M)
Diversified
Products
• Xenazine® Gx and brand competition 2Q17
• Isuprel® 3Q17
• Syprine® 1Q18
• Mephyton® 2Q18
• Cuprimine® 2Q19
• Migranal Franchise 2Q20
• Demser 3Q20
$36M $33M $18M $16M ($18M) ($17M)
OVERALL COMPANY $85M $74M $60M $51M ($25M) ($23M)
1. Anticipated date of loss of exclusivity is based on the Company’s current best estimate and actual date of LOE, as the case m ay be, may occur earlier or later. Changes
from prior forecast are noted in red.
36
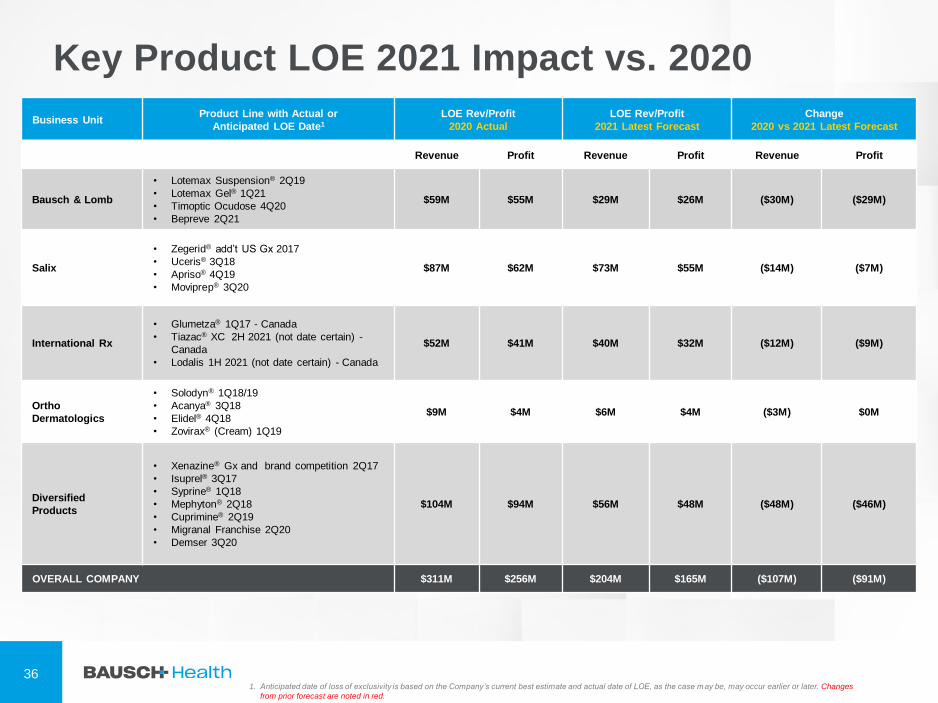
Key Product LOE 2021 Impact vs. 2020
Business UnitProduct Line with Actual or
Anticipated LOE Date1
LOE Rev/Profit
2020 Actual
LOE Rev/Profit
2021 Latest Forecast
Change
2020 vs 2021 Latest Forecast
Revenue Profit Revenue Profit Revenue Profit
Bausch & Lomb
• Lotemax Suspension® 2Q19
• Lotemax Gel® 1Q21
• Timoptic Ocudose 4Q20
• Bepreve 2Q21
$59M $55M $29M $26M ($30M) ($29M)
Salix
• Zegerid® add’t US Gx 2017
• Uceris® 3Q18
• Apriso® 4Q19
• Moviprep® 3Q20
$87M $62M $73M $55M ($14M) ($7M)
International Rx
• Glumetza® 1Q17 - Canada
• Tiazac® XC 2H 2021 (not date certain) -
Canada
• Lodalis 1H 2021 (not date certain) - Canada
$52M $41M $40M $32M ($12M) ($9M)
Ortho
Dermatologics
• Solodyn® 1Q18/19
• Acanya® 3Q18
• Elidel® 4Q18
• Zovirax® (Cream) 1Q19
$9M $4M $6M $4M ($3M) $0M
Diversified
Products
• Xenazine® Gx and brand competition 2Q17
• Isuprel® 3Q17
• Syprine® 1Q18
• Mephyton® 2Q18
• Cuprimine® 2Q19
• Migranal Franchise 2Q20
• Demser 3Q20
$104M $94M $56M $48M ($48M) ($46M)
OVERALL COMPANY $311M $256M $204M $165M ($107M) ($91M)

1. Anticipated date of loss of exclusivity is based on the Company’s current best estimate and actual date of LOE, as the case m ay be, may occur earlier or later. Changes
from prior forecast are noted in red.
37
Key Product LOE 2021 Impact
Business UnitProduct Line with Actual or
Anticipated LOE Date1
LOE Rev/Profit
2021 Prior Forecast
LOE Rev/Profit
2021 Latest Forecast
Change
2021 Prior vs Latest Forecast
Revenue Profit Revenue Profit Revenue Profit
Bausch & Lomb
• Lotemax Suspension® 2Q19
• Lotemax Gel® 1Q21
• Timoptic Ocudose 4Q20
• Bepreve 2Q21
$30M $27M $29M $26M ($1M) ($1M)
Salix
• Zegerid® add’t US Gx 2017
• Uceris® 3Q18
• Apriso® 4Q19
• Moviprep® 3Q20
$63M $44M $73M $55M $10M $11M
International Rx
• Glumetza® 1Q17 - Canada
• Tiazac® XC 2H 2021 (not date certain) -
Canada
• Lodalis 1H 2021 (not date certain) - Canada
$48M $39M $40M $32M ($8M) ($7M)
Ortho
Dermatologics
• Solodyn® 1Q18/19
• Acanya® 3Q18
• Elidel® 4Q18
• Zovirax® (Cream) 1Q19
$11M $9M $6M $4M ($5M) ($5M)
Diversified
Products
• Xenazine® Gx and brand competition 2Q17
• Isuprel® 3Q17
• Syprine® 1Q18
• Mephyton® 2Q18
• Cuprimine® 2Q19
• Migranal Franchise 2Q20
• Demser 3Q20
$53M $44M $56M $48M $3M $4M
OVERALL COMPANY $205M $163M $204M $165M ($1M) $2M

38
Selected U.S. Businesses Pipeline Inventory Trending
(1Q21)1
Months on Hand
Business
Units
As of
Dec 31,
2019
As of
Mar 31,
2020
Change
1Q20
As of
Dec 31,
2020
As of
Mar 31,
2021
Change
1Q21
Derm2 0.89 1.28 0.39 0.74 0.88 0.14
Neuro2 0.82 0.82 0.00 0.54 0.80 0.26
Ophtho2 0.90 1.03 0.13 1.14 1.10 (0.04)
GI 0.79 0.82 0.03 0.74 0.82 0.08
1. U.S. wholesale inventory.
2. See footnote 3 at slide 7 for further details regarding the realigned segment reporting structure and the conformed prior period presentation.

39
1. See Slide 2 and Appendix for further non-GAAP information.
2. See Appendix for further information on the use and calculation of constant currency.
3. Organic growth/change, a non-GAAP metric, is defined as a change on a period-over-period basis in revenues on a constant currency basis (if applicable) excluding the impact of
acquisitions, divestitures and discontinuations.
4. See the Appendix for details on amortization and impairments of intangible assets.
5. See footnote 3 at slide 7 for further details regarding the realigned segment reporting structure and the conformed prior period presentation.
1Q 21 Financial ResultsThree Months Ended Favorable (Unfavorable)
3.31.21 3.31.20 ReportedConstant
Currency1,2
Organic
Change1,3
Global Vision Care Revenue $224M $193M 16% 13% 13%
Global Surgical Revenue $162M $153M 6% 1% 2%
Global Consumer Revenue5 $331M $330M 0% (2%) (2%)
Global Ophtho Rx Revenue5 $164M $199M (18%) (20%) (20%)
Total Segment Revenue $881M $875M 1% (2%) (2%)
Gross Profit4
(excluding amortization and impairments
of intangible assets)
$548M $583M (6%) (9%)
Gross Margin 62.2% 66.6% (440 bps)
Selling, A&P $247M $263M 6% 8%
G&A $35M $31M (13%) (10%)
R&D $27M $26M (4%) (4%)
Total Operating Expense $309M $320M 3% 6%
EBITA (non-GAAP)1 $239M $263M (9%) (12%)
EBITA Margin (non-GAAP)1 27% 30%
Revenue % of total 44% 43%
(2%)Bausch + Lomb segment
organic revenue decline1,3
vs. 1Q20
Bausch + Lomb5
New Segment Structure
Does not reflect
corporate G&A and R&D
allocation

40
1. See Slide 2 and Appendix for further non-GAAP information.
2. See Appendix for further information on the use and calculation of constant currency.
3. Organic growth/change, a non-GAAP metric, is defined as a change on a period-over-period basis in revenues on a constant currency basis (if applicable) excluding the impact of
acquisitions, divestitures and discontinuations.
4. See the Appendix for details on amortization and impairments of intangible assets.
1Q 21 Financial ResultsThree Months Ended Favorable (Unfavorable)
3.31.21 3.31.20 ReportedConstant
Currency1,2
Organic
Change1,3
Salix Revenue $472M $477M (1%) (1%) (1%)
Total Segment Revenue $472M $477M (1%) (1%) (1%)
Gross Profit4
(excluding amortization and
impairments of intangible assets)
$420M $424M (1%) (1%)
Gross Margin 89.0% 88.9% 10 bps
Selling, A&P $71M $78M 9% 9%
G&A $12M $15M 20% 20%
R&D $10M $12M 17% 17%
Total Operating Expense $93M $105M 11% 11%
EBITA (non-GAAP)1 $327M $319M 3% 3%
EBITA Margin (non-GAAP)1 69% 67%
Revenue % of total 23% 24%
(1%)Salix segment organic
revenue decline1,3 vs. 1Q20
Salix

41
1. See Slide 2 and Appendix for further non-GAAP information.
2. See Appendix for further information on the use and calculation of constant currency.
3. Organic growth/change, a non-GAAP metric, is defined as a change on a period-over-period basis in revenues on a constant currency basis (if applicable) excluding the impact of
acquisitions, divestitures and discontinuations.
4. See the Appendix for details on amortization and impairments of intangible assets.
5. See footnote 3 at slide 7 for further details regarding the realigned segment reporting structure and the conformed prior period presentation.
1Q 21 Financial ResultsThree Months Ended Favorable (Unfavorable)
3.31.21 3.31.20 ReportedConstant
Currency1,2
Organic
Change1,3
International Rx Revenue5 $306M $291M 5% 4% 4%
Total Segment Revenue $306M $291M 5% 4% 4%
Gross Profit4
(excluding amortization and
impairments of intangible assets)
$171M $166M 3% 2%
Gross Margin 55.9% 57.0% (110 bps)
Selling, A&P $49M $53M 8% 9%
G&A $9M $11M 18% 18%
R&D $4M $4M 0% 0%
Total Operating Expense $62M $68M 9% 10%
EBITA (non-GAAP)1 $109M $98M 11% 10%
EBITA Margin (non-GAAP)1 36% 34%
Revenue % of total 15% 14%
+4%International Rx segment
organic revenue growth1,3 vs.
1Q20
International Rx5
New Segment Structure

42
1. See Slide 2 and Appendix for further non-GAAP information.
2. See Appendix for further information on the use and calculation of constant currency.
3. Organic growth/change, a non-GAAP metric, is defined as a change on a period-over-period basis in revenues on a constant currency basis (if applicable) excluding the impact of
acquisitions, divestitures and discontinuations.
4. See the Appendix for details on amortization and impairments of intangible assets.
5. See footnote 3 at slide 7 for further details regarding the realigned segment reporting structure and the conformed prior period presentation.
1Q 21 Financial ResultsThree Months Ended Favorable (Unfavorable)
3.31.21 3.31.20 ReportedConstant
Currency1,2
Organic
Change1,3
Ortho Dermatologics Revenue5 $69M $80M (14%) (14%) (14%)
Global Solta Revenue $72M $51M 41% 35% 35%
Total Segment Revenue $141M $131M 8% 5% 5%
Gross Profit4
(excluding amortization and impairments
of intangible assets)
$114M $111M 3% 1%
Gross Margin 80.9% 84.7% (380 bps)
Selling, A&P $31M $47M 34% 34%
G&A $8M $8M 0% 0%
R&D $5M $9M 44% 44%
Total Operating Expense $44M $64M 31% 31%
EBITA (non-GAAP)1 $70M $47M 49% 45%
EBITA Margin (non-GAAP)1 50% 36%
Revenue % of total 7% 7%
Ortho Dermatologics5
+35%Global Solta organic revenue
increase1,3 vs. 1Q20, driven
by continued strong demand
of Thermage® FLX
New Segment Structure

43
1. See Slide 2 and Appendix for further non-GAAP information.
2. See Appendix for further information on the use and calculation of constant currency.
3. Organic growth/change, a non-GAAP metric, is defined as a change on a period-over-period basis in revenues on a constant currency basis (if applicable) excluding the impact of
acquisitions, divestitures and discontinuations.
4. See the Appendix for details on amortization and impairments of intangible assets
5. U.S. sales only.
6. See footnote 3 at slide 7 for further details regarding the realigned segment reporting structure and the conformed prior period presentation.
1Q 21 Financial ResultsThree Months Ended Favorable (Unfavorable)
3.31.21 3.31.20 ReportedConstant
Currency1,2
Organic
Change1,3
Neuro & Other Revenue6 $154M $157M (2%) (2%) 3%
Generics Revenue6 $48M $60M (20%) (20%) (20%)
Dentistry Revenue $25M $21M 19% 19% 19%
Total Segment Revenue $227M $238M (5%) (5%) (2%)
Gross Profit4
(excluding amortization and
impairments of intangible assets)
$200M $209M (4%) (4%)
Gross Margin 88.1% 87.8% 30 bps
Selling, A&P $20M $28M 29% 29%
G&A $7M $12M 42% 42%
R&D $2M $2M 0% 0%
Total Operating Expense $29M $42M 31% 31%
EBITA (non-GAAP)1 $171M $167M 2% 2%
EBITA Margin (non-GAAP)1 75% 70%
Revenue % of total 11% 12%
Diversified Products5,6
(6%)WELLBUTRIN®5/APLENZIN®
combined reported revenue
decline vs. 1Q20
New Segment Structure

44
Three Months Ended Favorable (Unfavorable)
March 31, 2021 March 31, 2020 ReportedConstant
Currency1,2
Cash Interest Expense $355M $381M 7% 7%
Net Interest Expense $366M $389M 6% 6%
Non-cash adjustments
Depreciation $46M $45M (2%) 0%
Non-cash share-based Comp $31M $27M (15%) (15%)
Additional cash items
Contingent Consideration $6M $17M
Milestones/License Agreements and
Other Intangibles$3M $29M
Restructuring and Other $14M $27M
Capital Expenditures $66M $72M
Adj. Tax Rate1 9.5% 10.4%
Other Financial Information (Quarter-to-Date)
1. See Slide 2 and this Appendix for further non-GAAP information.
2. See this Appendix for further information on the use and calculation of constant currency.

45
1Q 21 Top 10 Products – Total BAUSCH Health1
Top 10 products/franchises revenues and trailing five quarters
Rank Product/Franchises 1Q21 4Q20 3Q20 2Q20 1Q20
1 XIFAXAN® $366M $411M $381M $315M $375M
2 Ocuvite® + PreserVision® $76M $100M $83M $78M $72M
3 SofLens® $64M $68M $63M $47M $58M
4 Thermage® $57M $70M $62M $37M $41M
5 WELLBUTRIN® $54M $70M $83M $66M $62M
6 Biotrue® ONEday $47M $41M $51M $25M $47M
7 renu® $43M $50M $45M $37M $42M
8 Bausch + Lomb ULTRA® $43M $38M $44M $21M $40M
9Biotrue® Multi-Purpose
Solution$32M $35M $34M $28M $34M
10 Relistor® $32M $30M $29M $27M $32M
1. Global sales.

46
1Q 21 Top 10 Products – Bausch + Lomb2
Top 10 products/franchises revenues and trailing five quarters
Rank Product/Franchises 1Q21 4Q20 3Q20 2Q20 1Q20
1 Ocuvite® + PreserVision® $76M $100M $83M $78M $72M
2 SofLens® $64M $68M $63M $47M $58M
3 Biotrue® ONEday $47M $41M $51M $25M $47M
4 renu® $43M $50M $45M $37M $42M
5 Bausch + Lomb ULTRA® $43M $38M $44M $21M $40M
6Biotrue® Multi-Purpose
Solution$32M $35M $34M $28M $34M
7 ARTELAC®1 $27M $29M $23M $24M $23M
8 Anterior Disposables® $25M $27M $21M $10M $23M
9 PureVision® $24M $25M $24M $18M $24M
10 Lumify® $23M $21M $20M $15M $18M
1. As of Q1 2021, we adjusted SKUs from Artleac. Prior period amounts have also been adjusted to provide an accurate historical comparison.
2. See footnote 3 at slide 7 for further details regarding the realigned segment reporting structure and the conformed prior period presentation.

47
1Q 21 Top 10 Products – Salix1
Top 10 products/franchises revenues and trailing five quarters
Rank Product/Franchises 1Q21 4Q20 3Q20 2Q20 1Q20
1 XIFAXAN® $366M $411M $381M $315M $375M
2 RELISTOR® $30M $29M $28M $26M $31M
3 TRULANCE® $21M $24M $22M $17M $19M
4 GLUMETZA® $16M $17M $20M $17M $21M
5 APRISO® $13M $14M $14M $11M $7M
6 UCERIS® $5M $10M $7M $4M $6M
7 ZEGERID® $4M $2M $5M $3M $4M
8 PLENVU® $3M $5M $4M $1M $3M
9 MOVIPREP® $3M $4M $1M $1M $2M
10 CYCLOSET® $3M $3M $4M $3M $3M
1. U.S. sales only

48
1Q 21 Top 10 Products – International Rx1,2
Top 10 products/franchises revenues and trailing five quarters
Rank Product/Franchises 1Q21 4Q20 3Q20 2Q20 1Q20
1 Ivexterm® $19M $5M $21M $12M $1M
2 Bedoyecta® $11M $15M $14M $9M $7M
3 Jublia® $9M $10M $12M $9M $11M
4 Bisocard® $8M $9M $7M $4M $9M
5 Xithrone® $7M $6M $3M $2M $2M
6 SILIQ®3 $6M $4M $4M $2M $7M
7 Hibiotic® $6M $9M $6M $7M $8M
8 Alphintern® $6M $5M $6M $6M $4M
9 Concor® $6M $7M $4M $7M $8M
10 Tiazac® $6M $6M $8M $5M $6M
1. International sales only.
2. See footnote 3 at slide 7 for further details regarding the realigned segment reporting structure and the conformed prior period presentation.
3. Inclusive of international supply agreement.

49
1Q 21 Top 10 Products – Ortho Dermatologics
Top 10 products/franchises revenues and trailing five quarters
Rank Product/Franchises 1Q21 4Q20 3Q20 2Q20 1Q20
1 THERMAGE® $57M $70M $62M $37M $41M
2 JUBLIA®1 $14M $13M $21M $16M $19M
3 TARGRETIN® $10M $9M $8M $7M $7M
4 SILIQ®1 $7M $9M $11M $12M $7M
5 RETIN-A®2 $6M $7M $2M $4M $11M
6 RETIN-A MICRO®.06 & .08 $6M $5M $3M $4M $8M
7 ONEXTON® $5M $6M $6M $4M $6M
8 CLEAR & BRILLIANT® $5M $5M $4M $1M $3M
9 VASER® $5M $6M $4M $2M $4M
10 FRAXEL® $4M $5M $3M $1M $3M
1. U.S. only sales
2. Excludes RETIN-A Micro® 0.06% and 0.08%.

50
1Q 21 Top 10 Products – Diversified Products1
Top 10 products/franchises revenues and trailing five quarters
Rank Product/Franchises 1Q21 4Q20 3Q20 2Q20 1Q20
1 WELLBUTRIN® $53M $67M $81M $65M $58M
2 APLENZIN® $26M $23M $26M $23M $26M
3 ARESTIN® $23M $21M $17M $6M $19M
4 ATIVAN® $18M $13M $22M $7M $8M
5 PEPCID® $12M $12M $11M $5M $3M
6 MYSOLINE® $11M $9M $8M $5M $5M
7 LIBRAX® $10M $14M $5M $5M $6M
8 DIASTAT® $6M $8M $8M $3M $11M
9 XENAZINE® $6M $6M $7M $8M $8M
10 CARDIZEM LA $4M $7M $5M $4M $5M
1. U.S. only sales.
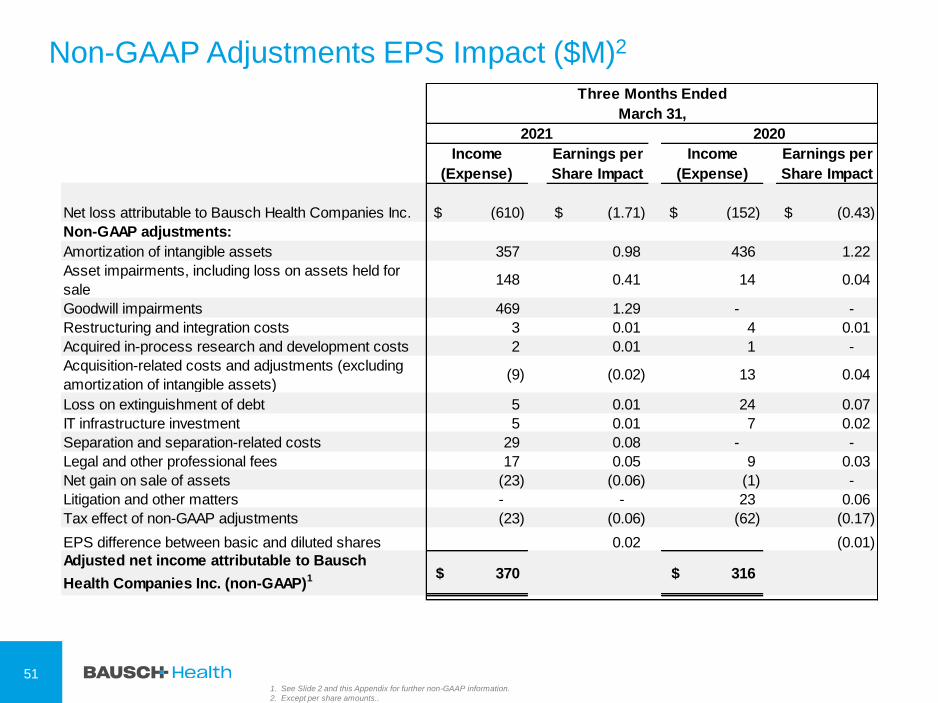
1. See Slide 2 and this Appendix for further non-GAAP information.
2. Except per share amounts..
Non-GAAP Adjustments EPS Impact ($M)2
51
Income
(Expense)
Earnings per
Share Impact
Income
(Expense)
Earnings per
Share Impact
Net loss attributable to Bausch Health Companies Inc. (610)$ (1.71)$ (152)$ (0.43)$
Non-GAAP adjustments:
Amortization of intangible assets 357 0.98 436 1.22
Asset impairments, including loss on assets held for
sale148 0.41 14 0.04
Goodwill impairments 469 1.29 - -
Restructuring and integration costs 3 0.01 4 0.01
Acquired in-process research and development costs 2 0.01 1 -
Acquisition-related costs and adjustments (excluding
amortization of intangible assets)(9) (0.02) 13 0.04
Loss on extinguishment of debt 5 0.01 24 0.07
IT infrastructure investment 5 0.01 7 0.02
Separation and separation-related costs 29 0.08 - -
Legal and other professional fees 17 0.05 9 0.03
Net gain on sale of assets (23) (0.06) (1) -
Litigation and other matters - - 23 0.06
Tax effect of non-GAAP adjustments (23) (0.06) (62) (0.17)
EPS difference between basic and diluted shares 0.02 (0.01)
Adjusted net income attributable to Bausch
Health Companies Inc. (non-GAAP)1 370$ 316$
Three Months Ended
March 31,
2021 2020

1. Products with sales outside the United States impacted by F/X changes.
2. See Slide 2 and this Appendix for further non-GAAP information.
3. See this Appendix for details on amortization and impairments of intangible assets.
4. See footnote 3 at slide 7 for further details regarding the realigned segment reporting structure and the conformed prior period presentation.
52
Bausch + Lomb4 Segment Trailing Five Quarters1
Bausch + Lomb 1Q21 4Q20 3Q20 2Q20 1Q20 FY20 FY19 FY18
Global Vision Care
Revenue$224M $213M $214M $135M $193M $755M $848M $814M
Global Surgical
Revenue$162M $182M $151M $90M $153M $576M $698M $698M
Global Consumer
Revenue4 $331M $367M $350M $303M $330M $1,350M $1,367M $1,324M
Global Ophtho Rx
Revenue4 $164M $184M $200M $147M $199M $730M $861M $825M
Segment Revenue $881M $946M $915M $675M $875M $3,411M $3,774M $3,661M
Segment Gross
Profit3
(excluding amortization and
impairments of intangible
assets)
$548M $575M $574M $395M $583M $2,127M $2,452M $2,347M
Segment Gross
Margin62.2% 60.8% 62.7% 58.5% 66.6% 62.4% 65.0% 64.1%
Segment R&D $27M $31M $24M $25M $26M $106M $111M $94M
Segment SG&A $282M $296M $278M $246M $294M $1,114M $1,226M $1,173M
Segment
Profit/EBITA (non-
GAAP)2
$239M $248M $272M $124M $263M $907M $1,115M $1,080M
New Segment Structure
Does not reflect
corporate G&A and R&D
allocation

1. See footnote 3 at slide 7 for further details regarding the realigned segment reporting structure and the conformed prior period presentation.
2. Estimates which are subject to change.
53
Bausch + Lomb1: Additional Financial Information2
Bausch + Lomb 1Q21 FY20 FY19 FY18
Corporate R&D Allocation $27M $108M $113M $102M
Corporate G&A Allocation $33M $120M $129M $140M
Depreciation $33M $124M $124M $121M
Capital Expenditures $50M $253M $186M $104M
Stock-Based Compensation $14M $50M $50M $43M

1. Products with sales outside the United States impacted by F/X changes.
2. See footnote 3 at slide 7 for further details regarding the realigned segment reporting structure and the conformed prior per iod presentation
3. For FY 2019 and Salix segment, see Slide 2 and this Appendix for further non-GAAP information for adjusted segment gross profit (non-GAAP), adjusted segment
gross margin (non-GAAP) and adjusted segment profit/EBITA (non-GAAP).
4. Amounts are on an as reported basis so no adjustments reflected for segment gross profit, segment gross margin and segment profit.
5. The remainder of Bausch Health is referred to as “Bausch Pharma” and will assume a new name upon the separation of the Company’s eye health business,
Bausch + Lomb.
6. Bausch Pharma Total Revenue, a non-GAAP metric, is determined by subtracting Bausch + Lomb segment revenue for the applicable period from total Bausch
Health revenue for that applicable period.
7. See Slide 2 and this Appendix for further non-GAAP information for segment profit.
54
Bausch Pharma5 Company Trailing Five Quarters1
Bausch Pharma 1Q21 4Q20 3Q20 2Q20 1Q20 FY20 FY19 FY18
Salix Revenue $472M $527M $496M $404M $477M $1,904M $2,022M $1,749M
International Rx
Revenue2 $306M $334M $309M $251M $291M $1,185M $1,158M $1,160M
Ortho Dermatologics
Revenue2 $141M $157M $143M $117M $131M $548M $560M $608M
Diversified Products
Revenue2 $227M $249M $275M $217M $238M $979M $1,087M $1,202M
Total Revenue6 $1,146M $1,267M $1,223M $989M $1,137M $4,616M $4,827M $4,719M
New Segment Structure
Does not reflect
corporate G&A and R&D
allocation
Bausch Pharma 1Q214 4Q204 3Q204 2Q204 1Q204 FY204 FY193 FY184
Adj. Salix Segment
Profit/EBITA (non-
GAAP)7
$327M $370M $360M $289M $319M $1,338M $1,354M $1,149M
International Rx
Segment Profit/EBITA
(non-GAAP)2,7
$109M $109M $105M $76M $98M $388M $354M $345M
Ortho Dermatologics
Segment Profit/EBITA
(non-GAAP)2,7
$70M $74M $69M $38M $47M $228M $216M $249M
Diversified Products
Segment Profit/EBITA
(non-GAAP)2,7
$171M $189M $207M $154M $167M $717M $801M $925M

1. The remainder of Bausch Health is referred to as “Bausch Pharma” and will assume a new name upon the separation of the Company’s eye health business, Bausch + Lomb.
2. Estimates which are subject to change.
55
Bausch Pharma1: Additional Financial Information2
Bausch Pharma 1Q21 FY20 FY19 FY18
Corporate R&D Allocation $37M $148M $146M $132M
Corporate G&A Allocation $42M $162M $164M $181M
Depreciation $13M $56M $54M $54M
Capital Expenditures $16M $49M $84M $53M
Stock-Based Compensation $15M $55M $52M $44M

56
Salix Segment Trailing Five Quarters
Salix 1Q213 4Q203 3Q203 2Q203 1Q203 FY203 FY191 FY183
Salix Revenue $472M $527M $496M $404M $477M $1,904M $2,022M $1,749M
Segment Revenue $472M $527M $496M $404M $477M $1,904M $2,022M $1,749M
Adj. Segment
Gross Profit (non-
GAAP)1,2
(excluding amortization and
impairments of intangible
assets)
$420M $470M $448M $364M $424M $1,706M $1,767M $1,494M
Adj. Segment
Gross Margin (non-
GAAP) 1
89.0% 89.2% 90.3% 90.1% 88.9% 89.6% 87.4% 85.4%
Segment R&D $10M $11M $6M $6M $12M $35M $36M $17M
Segment SG&A $83M $89M $82M $69M $93M $333M $377M $328M
Adj. Segment
Profit/EBITA (non-
GAAP)1
$327M $370M $360M $289M $319M $1,338M $1,354M $1,149M
1. For FY 2019, see Slide 2 and this Appendix for further non-GAAP information for adjusted segment gross profit (non-GAAP), adjusted segment gross margin (non-GAAP) and adjusted
segment profit/EBITA (non-GAAP).
2. See this Appendix for details on amortization and impairments of intangible assets.
3. Amounts are on an as reported basis so no adjustments reflected for segment gross profit, segment gross margin and segment profit. See Slide 2 and this Appendix for further non-GAAP
information for segment profit.

57
International Rx3 Segment Trailing Five Quarters4
International Rx 1Q21 4Q20 3Q20 2Q20 1Q20 FY20 FY19 FY18
International Rx
Revenue3 $306M $334M $309M $251M $291M $1,185M $1,158M $1,160M
Segment Revenue $306M $334M $309M $251M $291M $1,185M $1,158M $1,160M
Segment Gross
Profit2
(excluding amortization and
impairments of intangible
assets)
$171M $176M $170M $133M $166M $645M $621M $610M
Segment Gross
Margin55.9% 52.7% 55.0% 53.0% 57.0% 54.4% 53.6% 52.6%
Segment R&D $4M $5M $6M $4M $4M $19M $20M $14M
Segment SG&A $58M $62M $59M $53M $64M $238M $247M $251M
Segment
Profit/EBITA (non-
GAAP)1
$109M $109M $105M $76M $98M $388M $354M $345M
1. See Slide 2 and this Appendix for further non-GAAP information.
2. See this Appendix for details on amortization and impairments of intangible assets.
3. See footnote 3 at slide 7 for further details regarding the realigned segment reporting structure and the conformed prior period presentation.
4. Products with sales outside the United States impacted by F/X changes.
New Segment Structure

58
Ortho Dermatologics4 Segment Trailing Five
Quarters1
Ortho Dermatologics 1Q21 4Q20 3Q20 2Q20 1Q20 FY20 FY19 FY18
Ortho Dermatologics
Revenue4 $69M $70M $70M $75M $80M $295M $366M $473M
Global Solta Revenue1 $72M $87M $73M $42M $51M $253M $194M $135M
Segment Revenue $141M $157M $143M $117M $131M $548M $560M $608M
Segment Gross
Profit3
(excluding amortization and
impairments of intangible
assets)
$114M $128M $116M $92M $111M $447M $473M $525M
Segment Gross
Margin80.9% 81.5% 81.1% 78.6% 84.7% 81.6% 84.5% 86.3%
Segment R&D $5M $8M $5M $8M $9M $30M $38M $49M
Segment SG&A $39M $46M $42M $46M $55M $189M $219M $227M
Segment Profit/EBITA
(non-GAAP)2 $70M $74M $69M $38M $47M $228M $216M $249M
1. Products with sales outside the United States impacted by F/X changes.
2. See Slide 2 and this Appendix for further non-GAAP information.
3. See this Appendix for details on amortization and impairments of intangible assets.
4. See footnote 3 at slide 7 for further details regarding the realigned segment reporting structure and the conformed prior period presentation.
New Segment Structure

59
Diversified Products3 Segment Trailing Five Quarters
Diversified
Products1Q21 4Q20 3Q20 2Q20 1Q20 FY20 FY19 FY18
Neuro & Other
Revenue3 $154M $160M $200M $149M $157M $666M $677M $781M
Generics Revenue3 $48M $64M $56M $60M $60M $240M $309M $305M
Dentistry Revenue $25M $25M $19M $8M $21M $73M $101M $116M
Segment Revenue $227M $249M $275M $217M $238M $979M $1,087M $1,202M
Segment Gross
Profit2
(excluding amortization and
impairments of intangible
assets)
$200M $219M $240M $185M $209M $853M $943M $1,053M
Segment Gross
Margin88.1% 88.0% 87.3% 85.3% 87.8% 87.1% 86.8% 87.6%
Segment R&D $2M $1M $2M $1M $2M $6M $7M $5M
Segment SG&A $27M $29M $31M $30M $40M $130M $135M $123M
Segment
Profit/EBITA (non-
GAAP)1
$171M $189M $207M $154M $167M $717M $801M $925M
1. See Slide 2 and this Appendix for further non-GAAP information.
2. See this Appendix for details on amortization and impairments of intangible assets.
3. See footnote 3 at slide 7 for further details regarding the realigned segment reporting structure and the conformed prior period presentation.
New Segment Structure

Reconciliation of Reported Operating Income to Adjusted EBITA
(non-GAAP)1 ($M) (Year-to-Date)
601. See Slide 2 and this Appendix for further non-GAAP information.
2. Excluding amortization and impairments of intangible assets.
Gross
Profit2
Gross
Margin2
Selling &
Advertising
G&A and
Other
R&D
Expense
Operating
Expense
Operating
Income
Qtr 1 2021 GAAP $ 1,453 71.7% $ 418 $ 188 $ 112 $ 718 $ (221)
Amortization of intangible assets 0.0% - 357
Asset impairments, including loss on assets held for sale 0.0% - 148
Goodwill impairments 0.0% - 469
Restructuring and integration costs 0.0% - 3
Acquired in-process research and development costs 0.0% - 2
Acquisition-related costs and adjustments (excluding
amortization of intangible assets)0.0% - (9)
IT infrastructure investment 0.0% (5) (5) 5
Separation and separation-related costs 0.0% (20) (20) 29
Legal and other professional fees 0.0% (17) (17) 17
Net gain on sale of assets 0.0% - (23)
Qtr 1 2021 Non-GAAP1 1,453$ 71.7% 418$ 146$ 112$ 676$ 777$
Gross
Profit2
Gross
Margin2
Selling &
Advertising
G&A and
Other
R&D
Expense
Operating
Expense
Operating
Income
Qtr 1 2020 GAAP $ 1,493 74.2% $ 469 $ 164 $ 122 $ 755 $ 248
Amortization of intangible assets 0.0% - 436
Asset impairments, including loss on assets held for sale 0.0% - 14
Restructuring and integration costs 0.0% - 4
Acquired in-process research and development costs 0.0% - 1
Acquisition-related costs and adjustments (excluding
amortization of intangible assets)0.0% - 13
IT infrastructure investment 0.0% (7) (7) 7
Legal and other professional fees 0.0% (9) (9) 9
Net gain on sale of assets 0.0% - (1)
Litigation and other matters 0.0% - 23
Qtr 1 2020 Non-GAAP1 1,493$ 74.2% 469$ 148$ 122$ 739$ 754$
YTD 2021
YTD 2020

61
Amortization and Impairments of Intangible Assets ($M)2
1. Asset impairments includes loss on assets held for sale of $68M in Q121 and $96M in Q420 and YTD December 2020.
2. See footnote 3 at slide 7 for further details regarding the realigned segment reporting structure and the conformed prior period presentation.
3. The remainder of Bausch Health is referred to as “Bausch Pharma” and will assume a new name upon the separation of the Company’s eye health business,
Bausch + Lomb.
4. Each of the Bausch Pharma amortization of intangible assets and asset impairments presented in the tables above is equal to the sum of all segments for
the applicable item in the applicable period other than Bausch + Lomb segment.
Q1 2021 Q4 2020 Q3 2020 Q2 2020 Q1 2020
YTD December
2020
YTD December
2019
YTD December
2018
Bausch + Lomb2 75$ 76$ 83$ 83$ 81$ 323$ 348$ 376$
Bausch Pharma3,4
International Rx2 25 33 33 33 35 134 138 161
Salix 194 194 194 246 246 880 981 1,448
Ortho Dermatologics2 27 39 40 41 41 161 267 321
Diversified Products2 36 40 41 33 33 147 163 338
Total Bausch Pharma3,4 282 306 308 353 355 1,322 1,549 2,268
Total Company 357$ 382$ 391$ 436$ 436$ 1,645$ 1,897$ 2,644$
Q1 20211 Q4 20201 Q3 2020 Q2 2020 Q1 2020
YTD December
20201
YTD December
2019
YTD December
2018
Bausch + Lomb2 1$ -$ -$ -$ -$ -$ 21$ 53$
Bausch Pharma3,4
International Rx2 68 97 - 1 - 98 1 7
Salix - - - - - - - 267
Ortho Dermatologics2 79 - - - - - 13 55
Diversified Products2 - - 2 - 14 16 40 186
Total Bausch Pharma3,4 147 97 2 1 14 114 54 515
Total Company 148$ 97$ 2$ 1$ 14$ 114$ 75$ 568$
Asset impairments
Amortization of intangible assets Amortization of intangible assets
Asset impairments

62
Reconciliation of Reported Operating Income to Adjusted EBITA
(non-GAAP)1 ($M) (Quarter-to-Date)
1. See Slide 2 and this Appendix for further non-GAAP information.
2. Excluding amortization and impairments of intangible assets.
Gross
Profit2
Gross
Margin2
Selling &
Advertising
G&A and
Other
R&D
Expense
Operating
Expense
Operating
Income
YTD 2019 GAAP $ 1,762 87.1% $ 323 $ 54 $ 36 $ 413 $ 1,349
Acquisition-related costs and adjustments
excluding amortization and depreciation 5 0.3% - 5
YTD 2019 Non-GAAP11,767$ 87.4% 323$ 54$ 36$ 413$ 1,354$
YTD 2019
Salix

Reconciliation of Reported Net Loss to EBITDA (non-GAAP)1
and Adjusted EBITDA (non-GAAP)1 ($M)
63
1. See Slide 2 and this Appendix for further non-GAAP information.
2021 2020
Net loss attributable to Bausch Health Companies Inc. (610)$ (152)$
Interest expense, net 366 389
Provision for (benefit from) income taxes 16 (26)
Depreciation and amortization 403 481
EBITDA 175 692
Adjustments:
Asset impairments, including loss on assets held for
sale148 14
Goodwill impairments 469 -
Restructuring and integration costs 3 4
Acquisition-related costs and adjustments (excluding
amortization of intangible assets)(9) 13
Loss on extinguishment of debt 5 24
Share-based compensation 31 27
Separation and separation-related costs 29 -
Other adjustments:
Litigation and other matters - 23
IT infrastructure investment 5 7
Legal and other professional fees 17 9
Net gain on sale of assets (23) (1)
Acquired in-process research and development costs 2 1
Adjusted EBITDA (non-GAAP)1852$ 813$
March 31,
Three Months Ended

Reconciliation of Reported Revenue to Organic Revenue1,2 and
Organic Revenue Growth1,2 ($M) (Quarter-to-Date)4
64
1. See Slide 2 and this Appendix for further non-GAAP information
2. Organic growth/change, a non-GAAP metric, is defined as a change on a period-over-period basis in revenues on a constant currency basis (if applicable) excluding the impact of acquisitions, divestitures and
discontinuations.
3. The impact for changes in foreign currency exchange rates is determined as the difference in the current period reported revenues at their current period currency exchange rates and the current period reported revenues
revalued using the monthly average currency exchange rates during the comparable prior period.
4. See footnote 3 at slide 7 for further details regarding the realigned segment reporting structure and the conformed prior per iod presentation.
5. Bausch Pharma revenues, a non-GAAP metric, are determined by subtracting Bausch + Lomb segment revenues for the applicable period from total Bausch Health revenues for the applicable period.
Revenue
as
Reported
Changes
in
Exchange
Rates3
Organic
Revenue
(Non-
GAAP)1,2
Revenue
as
Reported
Divestitures and
Discontinuations
Organic
Revenue
(Non-
GAAP)1,2 Amount Pct.
Bauch +Lomb4
Global Vision Care 224 (6) 218 193 - 193 25 13%
Global Surgical 162 (8) 154 153 (2) 151 3 2%
Global Consumer Products4 331 (8) 323 330 - 330 (7) -2%
Global Ophtho Rx4 164 (4) 160 199 - 199 (39) -20%
Total Bausch + Lomb 881 (26) 855 875 (2) 873 (18) -2%
Bausch Pharma5
Salix
Salix 472 - 472 477 - 477 (5) -1%
International Rx4
International Rx4 306 (4) 302 291 (1) 290 12 4%
Ortho Dermatologics4
Ortho Dermatologics4 69 - 69 80 - 80 (11) -14%
Global Solta 72 (3) 69 51 - 51 18 35%
Total Ortho Dermatologics 141 (3) 138 131 - 131 7 5%
Diversified Products4
Neurology & Other4 154 - 154 157 (7) 150 4 3%
Generics4 48 - 48 60 - 60 (12) -20%
Dentistry 25 - 25 21 - 21 4 19%
Total Diversified Products 227 - 227 238 (7) 231 (4) -2%
Total Bausch Pharma revenues51,146 (7) 1,139 1,137 (8) 1,129 10 1%
Total Bausch Health Companies 2,027$ (33)$ 1,994$ 2,012$ (10)$ 2,002$ (8)$ 0%
March 31, 2021 March 31, 2020 Organic Revenue
Change in Calculation of Organic Revenue for the Three Months Ended

Reconciliation of Salix Reported Revenue to Organic
Revenue1,2 and Organic Revenue Growth1,2 ($M)
65
1. See Slide 2 and this Appendix for further non-GAAP information
2. Organic growth/change, a non-GAAP metric, is defined as a change on a period-over-period basis in revenues on a constant currency basis (if applicable) excluding the impact of
acquisitions, divestitures and discontinuations.
3. The impact for changes in foreign currency exchange rates is determined as the difference in the current period reported revenues at their current period currency exchange rates and
the current period reported revenues revalued using the monthly average currency exchange rates during the comparable prior period.
Revenue
as
Reported
Changes in
Exchange
Rates3 Acquisitions
Organic
Revenue (Non-
GAAP)1,2
Revenue
as
Reported
Divestitures and
Disconintuations
Organic
Revenue (Non-
GAAP)1,2 Amount Pct.
Three Months Ended Three Months Ended
December 31, 2020 527 - - 527 December 31, 2019 517 - 517 10 2%
September 30, 2020 496 - - 496 September 30, 2019 551 - 551 (55) -10%
June 30, 2020 404 - - 404 June 30, 2019 509 - 509 (105) -21%
March 31, 2020 477 - (13) 464 March 31, 2019 445 - 445 19 4%
December 31, 2019 517 - (18) 499 December 31, 2018 426 - 426 73 17%
September 30, 2019 551 - (14) 537 September 30, 2018 460 (3) 457 80 18%
June 30, 2019 509 - (17) 492 June 30, 2018 441 (3) 438 54 12%
March 31, 2019 445 - (6) 439 March 31, 2018 422 (3) 419 20 5%
Calculation of Salix Organic Revenue
Change in Organic
Revenue

Reconciliation of Global Solta Reported Revenue to Organic
Revenue1,2 and Organic Revenue Growth1,2 ($M)
1. See Slide 2 and this Appendix for further non-GAAP information
2. Organic growth/change, a non-GAAP metric, is defined as a change on a period-over-period basis in revenues on a constant currency basis (if applicable) excluding the impact of
acquisitions, divestitures and discontinuations.
3. The impact for changes in foreign currency exchange rates is determined as the difference in the current period reported revenues at their current period currency exchange rates and
the current period reported revenues revalued using the monthly average currency exchange rates during the comparable prior period.
66
Revenue
as
Reported
Changes in
Exchange
Rates3
Organic
Revenue (Non-
GAAP)1,2
Revenue
as
Reported
Divestitures and
Disconintuations
Organic
Revenue (Non-
GAAP)1,2 Amount Pct.
Three Months Ended Three Months Ended
December 31, 2020 87 (3) 84 December 31, 2019 64 - 64 20 31%
September 30, 2020 73 (1) 72 September 30, 2019 47 - 47 25 53%
June 30, 2020 42 - 42 June 30, 2019 45 - 45 (3) -7%
March 31, 2020 51 1 52 March 31, 2019 38 - 38 14 37%
December 31, 2019 64 - 64 December 31, 2018 45 - 45 19 42%
September 30, 2019 47 - 47 September 30, 2018 29 - 29 18 62%
June 30, 2019 45 1 46 June 30, 2018 32 - 32 14 44%
March 31, 2019 38 1 39 March 31, 2018 29 - 29 10 34%
Calculation of Global Solta Organic Revenue
Change in Organic
Revenue

Reconciliation of International Rx4 Reported Revenue to
Organic Revenue1,2 and Organic Revenue Growth1,2 ($M)
1. See Slide 2 and this Appendix for further non-GAAP information
2. Organic growth/change, a non-GAAP metric, is defined as a change on a period-over-period basis in revenues on a constant currency basis (if applicable) excluding the impact of
acquisitions, divestitures and discontinuations.
3. The impact for changes in foreign currency exchange rates is determined as the difference in the current period reported revenues at their current period currency exchange rates and
the current period reported revenues revalued using the monthly average currency exchange rates during the comparable prior period.
4. See footnote 3 at slide 7 for further details regarding the realigned segment reporting structure and the conformed prior period presentation.
Revenue
as
Reported
Changes in
Exchange
Rates3
Organic
Revenue (Non-
GAAP)1,2
Revenue
as
Reported
Divestitures and
Disconintuations
Organic
Revenue (Non-
GAAP)1,2 Amount Pct.
Three Months Ended Three Months Ended
December 31, 2020 334 2 336 December 31, 2019 306 (1) 305 31 10%
September 30, 2020 309 8 317 September 30, 2019 287 - 287 30 10%
June 30, 2020 251 14 265 June 30, 2019 290 (1) 289 (24) -8%
March 31, 2020 291 2 293 March 31, 2019 275 (2) 273 20 7%
December 31, 2019 306 (5) 301 December 31, 2018 306 (3) 303 (2) -1%
September 30, 2019 287 3 290 September 30, 2018 282 (4) 278 12 4%
June 30, 2019 290 6 296 June 30, 2018 287 (5) 282 14 5%
March 31, 2019 275 17 292 March 31, 2018 285 (7) 278 14 5%
Calculation of International Rx Organic Revenue
Change in Organic
Revenue
67

Reconciliation of Reported Revenue to Organic Revenue1,2 and
Organic Revenue Growth1,2 ($M)
1. See Slide 2 and this Appendix for further non-GAAP information
2. Organic growth/change, a non-GAAP metric, is defined as a change on a period-over-period basis in revenues on a constant currency basis (if applicable) excluding the impact of
acquisitions, divestitures and discontinuations.
3. The impact for changes in foreign currency exchange rates is determined as the difference in the current period reported revenues at their current period currency exchange rates and
the current period reported revenues revalued using the monthly average currency exchange rates during the comparable prior period.
68
Revenue
as
Reported
Changes in
Exchange
Rates3
Organic
Revenue (Non-
GAAP)1,2
Revenue
as
Reported
Divestitures and
Discontinuations
Organic
Revenue
(Non-
GAAP)1,2 Amount Pct.
Bausch + Lomb ULTRA® 43 (1) 42 40 - 40 2 5%
Ocuvite® + PreserVision® 76 (1) 75 72 - 72 3 4%
International Vision Care 144 (6) 138 116 - 116 22 19%
International Surgical 116 (8) 108 105 - 105 3 3%
Thermage® 57 (3) 54 41 - 41 13 32%
Thermage® - China region 20 (1) 19 7 - 7 12 171%
Change in
Organic RevenueMarch 31, 2021 March 31, 2020
Calculation of Organic Revenue for the Three Months Ended

Reconciliation of Reported Net Cash Provided by Operating
Activities to Adj. Cash Flows from Operations (non-GAAP)1
($M)
1. See Slide 2 and this Appendix for further non-GAAP information.
69
2021 2020
GAAP Net cash provided by operating activities 443$ 261$
Payments of legacy legal settlements, net 118 -
Payments of separation costs and separation-related costs 26 -
Adjusted Cash provided by operating activities (non-GAAP)1 587$ 261$
Three Months Ended
March 31,

TTM1 Adjusted EBITDA2 ($M)
1. Trailing twelve months.
2. See Slide 2 and this Appendix for further non-GAAP information..
70
Mar-21 Dec-20 Sep-20 Jun-20 Mar-20
Net loss attributable to Bausch Health Companies Inc. (1,018)$ (560)$ (1,923)$ (2,043)$ (1,888)$
Interest expense, net 1,498 1,521 1,532 1,564 1,587
Benefit from income taxes (333) (375) (86) (109) (6)
Depreciation and amortization 1,747 1,825 1,889 1,973 2,024
EBITDA 1,894 2,411 1,412 1,385 1,717
Adjustments:
Asset impairments, including loss on assets held for sale 248 114 43 74 86
Goodwill impairments 469 - - - -
Restructuring and integration costs 10 11 15 18 15
Acquisition-related costs and adjustments (excluding
amortization of intangible assets)26 48 36 37 50
Loss on extinguishment of debt 40 59 53 53 59
Share-based compensation 109 105 106 105 105
Separation and separation-related costs 61 32 5 - -
Other adjustments:
Litigation and other matters 399 422 1,516 1,521 1,422
IT infrastructure investment 19 21 25 26 27
Legal and other professional fees 47 39 41 38 36
Net gain on sale of assets (23) (1) (22) (23) (22)
Acquired in-process research and development costs 33 32 52 41 41
Other 1 1 (1) - (3)
Adjusted EBITDA (non-GAAP) 23,333$ 3,294$ 3,281$ 3,275$ 3,533$

Non-GAAP AppendixDescription of Non-GAAP Financial Measures
To supplement the financial measures prepared in accordance
with U.S. generally accepted accounting principles (GAAP), the
Company uses certain non-GAAP financial measures. These
measures do not have any standardized meaning under GAAP and
other companies may use similarly titled non-GAAP financial
measures that are calculated differently from the way we calculate
such measures. Accordingly, our non-GAAP financial measures
may not be comparable to similar non-GAAP measures. We
caution investors not to place undue reliance on such non-GAAP
measures, but instead to consider them with the most directly
comparable GAAP measures. Non-GAAP financial measures have
limitations as analytical tools and should not be considered in
isolation. They should be considered as a supplement to, not a
substitute for, or superior to, the corresponding measures
calculated in accordance with GAAP.
Adjusted EBITDA (non-GAAP)
Adjusted EBITDA (non-GAAP) is GAAP net income (loss)
attributable to Bausch Health Companies Inc. (its most directly
comparable GAAP financial measure) adjusted for interest
expense, net, income taxes, depreciation and amortization and
certain other items, as further described below. Management
believes that Adjusted EBITDA (non-GAAP), along with the GAAP
measures used by management, most appropriately reflect how
the Company measures the business internally and sets
operational goals and incentives. In particular, the Company
believes that Adjusted EBITDA (non-GAAP) focuses management
on the Company’s underlying operational results and business
performance. As a result, the Company uses Adjusted EBITDA
(non-GAAP) both to assess the actual financial performance of the
Company and to forecast future results as part of its guidance.
Management believes Adjusted EBITDA (non-GAAP) is a useful
measure to evaluate current performance. Adjusted EBITDA (non-
GAAP) is intended to show our unleveraged, pre-tax operating
results and therefore reflects our financial performance based on
operational factors. In addition, cash bonuses for the Company’s
executive officers and other key employees are based, in part, on
the achievement of certain Adjusted EBITDA (non-GAAP) targets.
Description of Non-GAAP Financial
Measures
Adjusted EBITDA (non-GAAP)
Adjusted EBITDA (non-GAAP)
Adjustments
Adjusted EBITA
EBITA/EBITA Margin
Adjusted Gross Profit/Adjusted
Gross Margin
Adjusted Selling, A&P/Adjusted
SG&A
Total Adjusted Operating Expense
Adjusted Net Income
(non-GAAP)
Adjusted Net Income (non-GAAP)
Adjustments
Organic Revenue / Organic Growth /
Organic Change
Constant Currency
Adjusted Cash Flows from
Operations (non-GAAP) and Bausch
Pharma Total Revenue
71

Non-GAAP AppendixAdjusted EBITDA (non-GAAP) is net income
(loss) attributable to the Company (its most
directly comparable GAAP financial measure)
adjusted for interest expense, net, (benefit from)
provision for income taxes, depreciation and
amortization and the following items:
Restructuring and integration costs: The Company has incurred
restructuring costs as it implemented certain strategies, which
involved, among other things, improvements to its infrastructure
and operations, internal reorganizations and impacts from the
divestiture of assets and businesses. In addition, in connection
with its acquisition of certain assets of Synergy Pharmaceuticals
Inc. (“Synergy”), the Company has incurred certain severance and
integration costs. With regard to infrastructure and operational
improvements which the Company has taken to improve
efficiencies in the businesses and facilities, these tend to be costs
intended to right size the business or organization that fluctuate
significantly between periods in amount, size and timing,
depending on the improvement project, reorganization or
transaction. With regard to the severance and integration costs
associated with the acquisition of certain assets of Synergy, these
costs are specific to the acquisition itself and provided no benefit
to the ongoing operations of the Company. As a result, the
Company does not believe that such costs (and their impact) are
truly representative of its underlying business. The Company
believes that the adjustments of these items provide supplemental
information with regard to the sustainability of the Company's
operating performance, allow for a comparison of the financial
results to historical operations and forward-looking guidance and,
as a result, provide useful supplemental information to investors.
Asset Impairments, including loss on assets held for sale:
The Company has excluded the impact of impairments of finite-
lived and indefinite-lived intangible assets, as well as impairments
of assets held for sale, as such amounts are inconsistent in
amount and frequency and are significantly impacted by the timing
and/or size of acquisitions and divestitures. The Company believes
that the adjustments of these items correlate with the sustainability
of the Company’s operating performance. Although the Company
excludes impairments, of intangible assets from measuring the
performance of the Company and the business, the Company
believes that it is important for investors to understand that
intangible assets contribute to revenue generation.
Goodwill Impairments: The Company excludes the impact of
goodwill impairments. When the Company has made acquisitions
where the consideration paid was in excess of the fair value of the
net assets acquired, the remaining purchase price is recorded as
goodwill. For assets that we developed ourselves, no goodwill is
recorded. Goodwill is not amortized but is tested for impairment.
The amount of goodwill impairment is measured as the excess of a
reporting unit’s carrying value over its fair value. Management
excludes these charges in measuring the performance of the
Company and the business.
Description of Non-GAAP Financial
Measures
Adjusted EBITDA (non-GAAP)
Adjusted EBITDA (non-GAAP)
Adjustments
Adjusted EBITA
EBITA/EBITA Margin
Adjusted Gross Profit/Adjusted
Gross Margin
Adjusted Selling, A&P/Adjusted
SG&A
Total Adjusted Operating Expense
Adjusted Net Income
(non-GAAP)
Adjusted Net Income (non-GAAP)
Adjustments
Organic Revenue / Organic Growth /
Organic Change
Constant Currency
Adjusted Cash Flows from
Operations (non-GAAP) and Bausch
Pharma Total Revenue
72

Non-GAAP AppendixShare-based Compensation: The Company has excluded
recorded costs relating to share-based compensation. The
Company believes that the exclusion of share-based
compensation expense assists investors in the comparisons of
operating results to peer companies. Share-based compensation
expense can vary significantly based on the timing, size and
nature of awards granted.
Acquisition-related costs and adjustments excluding
amortization of intangible assets: The Company has excluded
the impact of acquisition-related costs and fair value inventory
step-up resulting from acquisitions as the amounts and frequency
of such costs and adjustments are not consistent and are
impacted by the timing and size of its acquisitions. In addition, the
Company has excluded the impact of acquisition-related
contingent consideration non-cash adjustments due to the inherent
uncertainty and volatility associated with such amounts based on
changes in assumptions with respect to fair value estimates, and
the amount and frequency of such adjustments is not consistent
and is significantly impacted by the timing and size of the
Company's acquisitions, as well as the nature of the agreed-upon
consideration.
Loss on extinguishment of debt: The Company has excluded
loss on extinguishment of debt as this represents a cost of
refinancing our existing debt and is not a reflection of our
operations for the period. Further, the amount and frequency of
such charges are not consistent and are significantly impacted by
the timing and size of debt financing transactions and other factors
in the debt market out of management’s control.
Separation costs and separation-related costs: The Company
has excluded certain costs incurred in connection with activities
taken to: (i) separate the eye-health business from the remainder
of the Company and (ii) register the eye-health business as an
independent publicly traded entity. Separation costs are
incremental costs directly related to effectuating the separation of
the eye-health business and include, but are not limited to; legal,
audit and advisory fees, employee hiring, relocation and travel
costs and costs associated with establishing a new board of
directors and audit committee. Separation-related costs are
incremental costs indirectly related to the separation of the eye-
health business and include but are not limited to; IT infrastructure
and software licensing costs, rebranding costs and costs
associated with facility relocation and/or modification. As these
costs arise from events outside of the ordinary course of
continuing operations, the Company believes that the adjustments
of these items provide supplemental information with regard to the
sustainability of the Company's operating performance, allow for a
comparison of the financial results to historical operations and
forward-looking guidance and, as a result, provide useful
supplemental information to investors.
Description of Non-GAAP Financial
Measures
Adjusted EBITDA (non-GAAP)
Adjusted EBITDA (non-GAAP)
Adjustments
Adjusted EBITA
EBITA/EBITA Margin
Adjusted Gross Profit/Adjusted
Gross Margin
Adjusted Selling, A&P/Adjusted
SG&A
Total Adjusted Operating Expense
Adjusted Net Income
(non-GAAP)
Adjusted Net Income (non-GAAP)
Adjustments
Organic Revenue / Organic Growth /
Organic Change
Constant Currency
Adjusted Cash Flows from
Operations (non-GAAP) and Bausch
Pharma Total Revenue
73

Non-GAAP AppendixOther Non-GAAP Charges: The Company has excluded certain
other amounts, including legal and other professional fees incurred
in connection with recent legal and governmental proceedings,
investigations and information requests regarding certain of our
legacy distribution, marketing, pricing, disclosure and accounting
practices, litigation and other matters, and net gain on sales of
assets. The Company has also excluded expenses associated with
in-process research and development, as these amounts are
inconsistent in amount and frequency and are significantly
impacted by the timing, size and nature of acquisitions.
Furthermore, as these amounts are associated with research and
development acquired, the Company does not believe that they
are a representation of the Company's research and development
efforts during any given period. The Company has also excluded
IT infrastructure investment, that are the result of other, non-
comparable events to measure operating performance. These
events arise outside of the ordinary course of continuing
operations. Given the unique nature of the matters relating to
these costs, the Company believes these items are not normal
operating expenses. For example, legal settlements and
judgments vary significantly, in their nature, size and frequency,
and, due to this volatility, the Company believes the costs
associated with legal settlements and judgments are not normal
operating expenses. In addition, as opposed to more ordinary
course matters, the Company considers that each of the recent
proceedings, investigations and information requests, given their
nature and frequency, are outside of the ordinary course and
relate to unique circumstances. The Company believes that the
exclusion of such out-of-the-ordinary-course amounts provides
supplemental information to assist in the comparison of the
financial results of the Company from period to period and,
therefore, provides useful supplemental information to investors.
However, investors should understand that many of these costs
could recur and that companies in our industry often face litigation.
Please also see the reconciliation tables in this appendix for
further information as to how these non-GAAP measures are
calculated for the periods presented.
Description of Non-GAAP Financial
Measures
Adjusted EBITDA (non-GAAP)
Adjusted EBITDA (non-GAAP)
Adjustments
Adjusted EBITA
EBITA/EBITA Margin
Adjusted Gross Profit/Adjusted
Gross Margin
Adjusted Selling, A&P/Adjusted
SG&A
Total Adjusted Operating Expense
Adjusted Net Income
(non-GAAP)
Adjusted Net Income (non-GAAP)
Adjustments
Organic Revenue / Organic Growth /
Organic Change
Constant Currency
Adjusted Cash Flows from
Operations (non-GAAP) and Bausch
Pharma Total Revenue
74
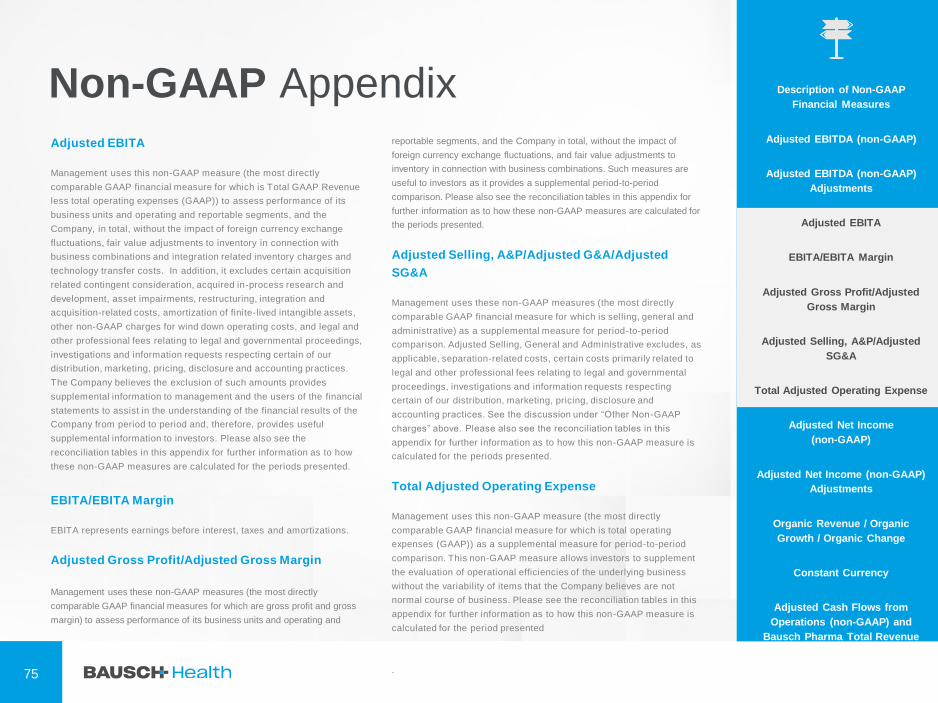
Non-GAAP AppendixAdjusted EBITA
Management uses this non-GAAP measure (the most directly
comparable GAAP financial measure for which is Total GAAP Revenue
less total operating expenses (GAAP)) to assess performance of its
business units and operating and reportable segments, and the
Company, in total, without the impact of foreign currency exchange
fluctuations, fair value adjustments to inventory in connection with
business combinations and integration related inventory charges and
technology transfer costs. In addition, it excludes certain acquisition
related contingent consideration, acquired in-process research and
development, asset impairments, restructuring, integration and
acquisition-related costs, amortization of finite-lived intangible assets,
other non-GAAP charges for wind down operating costs, and legal and
other professional fees relating to legal and governmental proceedings,
investigations and information requests respecting certain of our
distribution, marketing, pricing, disclosure and accounting practices.
The Company believes the exclusion of such amounts provides
supplemental information to management and the users of the financial
statements to assist in the understanding of the financial results of the
Company from period to period and, therefore, provides useful
supplemental information to investors. Please also see the
reconciliation tables in this appendix for further information as to how
these non-GAAP measures are calculated for the periods presented.
EBITA/EBITA Margin
EBITA represents earnings before interest, taxes and amortizations.
Adjusted Gross Profit/Adjusted Gross Margin
Management uses these non-GAAP measures (the most directly
comparable GAAP financial measures for which are gross profit and gross
margin) to assess performance of its business units and operating and
reportable segments, and the Company in total, without the impact of
foreign currency exchange fluctuations, and fair value adjustments to
inventory in connection with business combinations. Such measures are
useful to investors as it provides a supplemental period-to-period
comparison. Please also see the reconciliation tables in this appendix for
further information as to how these non-GAAP measures are calculated for
the periods presented.
Adjusted Selling, A&P/Adjusted G&A/Adjusted
SG&A
Management uses these non-GAAP measures (the most directly
comparable GAAP financial measure for which is selling, general and
administrative) as a supplemental measure for period-to-period
comparison. Adjusted Selling, General and Administrative excludes, as
applicable, separation-related costs, certain costs primarily related to
legal and other professional fees relating to legal and governmental
proceedings, investigations and information requests respecting
certain of our distribution, marketing, pricing, disclosure and
accounting practices. See the discussion under “Other Non-GAAP
charges” above. Please also see the reconciliation tables in this
appendix for further information as to how this non-GAAP measure is
calculated for the periods presented.
Total Adjusted Operating Expense
Management uses this non-GAAP measure (the most directly
comparable GAAP financial measure for which is total operating
expenses (GAAP)) as a supplemental measure for period-to-period
comparison. This non-GAAP measure allows investors to supplement
the evaluation of operational efficiencies of the underlying business
without the variability of items that the Company believes are not
normal course of business. Please see the reconciliation tables in this
appendix for further information as to how this non-GAAP measure is
calculated for the period presented
.
Description of Non-GAAP
Financial Measures
Adjusted EBITDA (non-GAAP)
Adjusted EBITDA (non-GAAP)
Adjustments
Adjusted EBITA
EBITA/EBITA Margin
Adjusted Gross Profit/Adjusted
Gross Margin
Adjusted Selling, A&P/Adjusted
SG&A
Total Adjusted Operating Expense
Adjusted Net Income
(non-GAAP)
Adjusted Net Income (non-GAAP)
Adjustments
Organic Revenue / Organic
Growth / Organic Change
Constant Currency
Adjusted Cash Flows from
Operations (non-GAAP) and
Bausch Pharma Total Revenue
75

Description of Non-GAAP Financial
Measures
Adjusted EBITDA (non-GAAP)
Adjusted EBITDA (non-GAAP)
Adjustments
Adjusted EBITA
EBITA/EBITA Margin
Adjusted Gross Profit/Adjusted Gross
Margin
Adjusted Selling, A&P/Adjusted SG&A
Total Adjusted Operating Expense
Adjusted Net Income
(non-GAAP)
Adjusted Net Income (non-GAAP)
Adjustments
Organic Revenue / Organic Growth /
Organic Change
Constant Currency
Adjusted Cash Flows from Operations
(non-GAAP) and Bausch Pharma Total
Revenue
Non-GAAP AppendixAdjusted Net Income (non-GAAP)
Historically, management has used Adjusted net income (non-GAAP)
(the most directly comparable GAAP financial measure for which is
GAAP Net Income (Loss)) for strategic decision making, forecasting
future results and evaluating current performance. This non-GAAP
measure excludes the impact of certain items (as described below)
that may obscure trends in the Company’s underlying performance. By
disclosing this non-GAAP measure, it is management’s intention to
provide investors with a meaningful, supplemental comparison of the
Company’s operating results and trends for the periods presented. It is
management’s belief that this measure is also useful to investors as
such measure allowed investors to evaluate the Company’s
performance using the same tools that management uses to evaluate
past performance and prospects for future performance. Accordingly, it
is the Company’s belief that Adjusted net income (non-GAAP) is useful
to investors in their assessment of the Company’s operating
performance and the valuation of the Company. It is also noted that, in
recent periods, our GAAP net income (loss) was significantly lower
than our Adjusted net income (non-GAAP). Commencing in 2017,
management of the Company identified and began using certain new
primary financial performance measures to assess the Company’s
financial performance. However, management still believes that
Adjusted net income (non-GAAP) may be useful to investors in their
assessment of the Company and its performance.
Adjusted Net Income (non-GAAP) Adjustments
Adjusted net income (non-GAAP) is net income (loss) attributable to
Bausch Health Companies Inc. (its most directly comparable GAAP
financial measure) adjusted for restructuring and integration costs,
acquired in-process research and development costs, loss on
extinguishment of debt, asset impairments, acquisition-related
adjustments, excluding amortization, separation and separation-related
costs and other non-GAAP charges), as these adjustments are
described above, and amortization of intangible assets as described
below:
Amortization of intangible assets: The Company has excluded the
impact of amortization of intangible assets, as such amounts are
inconsistent in amount and frequency and are significantly impacted by
the timing and/or size of acquisitions. The Company believes that the
adjustments of these items correlate with the sustainability of the
Company’s operating performance. Although the Company excludes
amortization of intangible assets from its non-GAAP expenses, the
Company believes that it is important for investors to understand that
such intangible assets contribute to revenue generation. Amortization
of intangible assets that relate to past acquisitions will recur in future
periods until such intangible assets have been fully amortized. Any
future acquisitions may result in the amortization of additional
intangible assets.
Please see the reconciliation tables in this appendix for further
information as to how this non-GAAP measure is calculated for the
periods presented.
Adjusted Tax Rate
Adjusted Tax Rate includes the tax impact of the various non-GAAP
adjustments used in calculating our non-GAAP measures. Due to the
differences in the tax treatment of items excluded from non-GAAP
earnings, our adjusted tax rate may differ from our GAAP tax rate and
from our actual tax liabilities.
76

Non-GAAP AppendixOrganic Revenue, Organic Growth, Organic Revenue
Decline and Organic Change
Organic growth/change, a non-GAAP metric, is defined as a change on a
period-over-period basis in revenues on a constant currency basis (if
applicable) excluding the impact of recent acquisitions, divestitures and
discontinuations (if applicable). Organic growth/change is change in
GAAP Revenue (its most directly comparable GAAP financial measure)
adjusted for certain items, as further described below, of businesses that
have been owned for one or more years. Organic revenue is impacted by
changes in product volumes and price. The price component is made up
of two key drivers: (i) changes in product gross selling price and (ii)
changes in sales deductions. The Company uses organic revenue and
organic growth/change to assess performance of its business units and
operating and reportable segments, and the Company in total, without
the impact of foreign currency exchange fluctuations and recent
acquisitions, divestitures and product discontinuations. The Company
believes that such measures are useful to investors as they provide a
supplemental period-to-period comparison.
Organic growth/organic change reflects adjustments for: ( i) the impact of
period-over-period changes in foreign currency exchange rates on
revenues and (ii) the revenues associated with acquisitions, divestitures
and discontinuations of businesses divested and/ or discontinued. These
adjustments are determined as follows:
• Foreign currency exchange rates: Although changes in foreign
currency exchange rates are part of our business, they are not within
management’s control. Changes in foreign currency exchange rates,
however, can mask positive or negative trends in the business. The
impact for changes in foreign currency exchange rates is determined
as the difference in the current period reported revenues at their
current period currency exchange rates and the current period
reported revenues revalued using the monthly average currency
exchange rates during the comparable prior period.
• Acquisitions, divestitures and discontinuations: In order to present
period-over-period organic revenues (non-GAAP) on a comparable
basis, revenues associated with acquisitions, divestitures and
discontinuations are adjusted to include only revenues from those
businesses and assets owned during both periods. Accordingly,
organic revenue (non-GAAP) growth/change excludes from the
current period, revenues attributable to each acquisition for twelve
months subsequent to the day of acquisition, as there are no
revenues from those businesses and assets included in the
comparable prior period. Organic revenue (non-GAAP)
growth/change excludes from the prior period, all revenues
attributable to each divestiture and discontinuance during the twelve
months prior to the day of divestiture or discontinuance, as there are
no revenues from those businesses and assets included in the
comparable current period.
Please also see the reconciliation in this Appendix for further information
as to how this non-GAAP measure is calculated for the periods
presented.
Constant Currency
Changes in the relative values of non-U.S. currencies to the U.S. dollar
may affect the Company’s financial results and financial position. To
assist investors in evaluating the Company’s performance, we have
adjusted for foreign currency effects.
Constant currency impact is determined by comparing 2021 reported
amounts adjusted to exclude currency impact, calculated using 2020
monthly average exchange rates, to the actual 2020 reported amounts.
Description of Non-GAAP Financial
Measures
Adjusted EBITDA (non-GAAP)
Adjusted EBITDA (non-GAAP)
Adjustments
Adjusted EBITA
EBITA/EBITA Margin
Adjusted Gross Profit/Adjusted Gross
Margin
Adjusted Selling, A&P/Adjusted SG&A
Total Adjusted Operating Expense
Adjusted Net Income
(non-GAAP)
Adjusted Net Income (non-GAAP)
Adjustments
Organic Revenue / Organic Growth /
Organic Change
Constant Currency
Adjusted Cash Flows from Operations
(non-GAAP) and Bausch Pharma Total
Revenue
77

Description of Non-GAAP Financial
Measures
Adjusted EBITDA (non-GAAP)
Adjusted EBITDA (non-GAAP)
Adjustments
Adjusted EBITA
EBITA/EBITA Margin
Adjusted Gross Profit/Adjusted Gross
Margin
Adjusted Selling, A&P/Adjusted SG&A
Total Adjusted Operating Expense
Adjusted Net Income
(non-GAAP)
Adjusted Net Income (non-GAAP)
Adjustments
Organic Revenue / Organic Growth /
Organic Change
Constant Currency
Adjusted Cash Flows from Operations
(non-GAAP) and Bausch Pharma Total
Revenue
Non-GAAP AppendixAdjusted Cash Flows from Operations (non-GAAP)
Adjusted cash flows from operations (non-GAAP) (or Adjusted cash
generated from operations (non-GAAP)) is Cash provided by operating
activities (its most directly comparable GAAP financial measure) adjusted
for: (i) payments of legacy legal settlements, net of insurance proceeds
and (ii) payments for separation costs and separation-related costs. As
these payments arise from events outside of the ordinary course of
continuing operations as discussed above, the Company believes that the
adjustments of these items provide supplemental information with regard
to the sustainability of the Company’s cash from operations, allow for a
comparison of the financial results to historical operations and forward-
looking guidance and, as a result, provide useful supplemental
information to investors.
Management believes that Adjusted cash flows from operations (non-
GAAP), along with the GAAP and non-GAAP measures used by
management, most appropriately reflect how the Company measures the
business internally. The Company uses Adjusted net cash provided by
operating activities (non-GAAP) both to assess the actual financial
performance of the Company and to forecast future results as part of its
guidance. Management believes Adjusted net cash provided by operating
activities (non-GAAP) is a useful measure to evaluate current
performance amounts.
Bausch Pharma Total Revenue
Bausch Pharma Total Revenue, non-GAAP metrics, are determined by
subtracting Bausch + Lomb segment revenues for the applicable period from
total Bausch Health Company revenues for the applicable period.
78