Embed Size (px)
Citation preview


Published in the United States of America by Medical Information Science Reference (an imprint of IGI Global)701 E. Chocolate AvenueHershey PA 17033Tel: 717-533-8845Fax: 717-533-8661 E-mail: [email protected] site: http://www.igi-global.com
Copyright © 2016 by IGI Global. All rights reserved. No part of this publication may be reproduced, stored or distributed in any form or by any means, electronic or mechanical, including photocopying, without written permission from the publisher.Product or company names used in this set are for identification purposes only. Inclusion of the names of the products or companies does not indicate a claim of ownership by IGI Global of the trademark or registered trademark. Library of Congress Cataloging-in-Publication Data
British Cataloguing in Publication DataA Cataloguing in Publication record for this book is available from the British Library.
All work contributed to this book is new, previously-unpublished material. The views expressed in this book are those of the authors, but not necessarily of the publisher.
Names: Ivanov, Ivan V., 1962- | Qian, Xiaoning, 1975- | Pal, Ranadip, 1980-Title: Emerging research in the analysis and modeling of gene regulatory networks / Ivan V. Ivanov, Xiaoning Qian, and Ranadip Pal, editors. Description: Hershey, PA : Medical Information Science Reference, [2016] | Includes bibliographical references and index. Identifiers: LCCN 2016005966| ISBN 9781522503538 (hardcover) | ISBN 9781522503545 (ebook) Subjects: LCSH: Genetic regulation--Computer simulation. | Gene regulatory networks. Classification: LCC QH450 .E44 2016 | DDC 572.8/65--dc23 LC record available at https://lccn.loc.gov/2016005966
This book is published in the IGI Global book series Advances in Medical Technologies and Clinical Practice (AMTCP) (ISSN: 2327-9354; eISSN: 2327-9370)

Copyright ©2016, IGI Global. Copying or distributing in print or electronic forms without written permission of IGI Global is prohibited.
DOI: 10.4018/978-1-5225-0353-8.ch001
The inference of Gene Regulatory Networks (GRNs) is a very challenging problem which has attracted increasing attention since the development of high-throughput sequencing and gene expression measurement technologies. Many models and algo-rithms have been developed to identify GRNs using mainly gene expression profile as data source. As the gene expression data usually has limited number of samples and inherent noise, the integration of gene expression with several other sources of information can be vital for accurately inferring GRNs. For instance, some prior information about the overall topological structure of the GRN can guide inference
David Correa Martins Jr.Federal University of ABC (UFABC), Brazil
Fabricio Martins LopesFederal University of Technology – Paraná (UTFPR), Brazil
Shubhra Sankar RayIndian Statistical Institute, India
Systems Biology is an interdisciplinary research field that aims at the study of complex interactions occurring in living organisms (Snoep & Westerhoff, 2005). Research in this field focuses on the study of biological processes such as cell cycles and the conditions for the origin of certain diseases. The ultimate goal of these stud-ies is to help the development of new treatments and drugs against diseases, biofuel production techniques, among many other applications.
The genome of an organism has a central role in the control of cell processes such as cell response to environmental stimuli, cell differentiation in its respective functional groups, DNA replication for cell division, and many others. An organism can be seen as a network of molecules connected by biochemical reactions (Voet, Voet & Pratt, 2005). Proteins synthesized from genes may work as transcription fac-tors which bind to regulatory sites of other genes, such as enzymes which catalyze metabolic reactions or components of signal transduction pathways. Such regulatory mechanism forms a complex system of sending and receiving signals (RNAs) which can be investigated to identify the control mechanisms of the cell and the relationships among various biological entities like genes, RNAs and proteins. However, there is still much to be discovered about the functional relationships of control mechanisms, e.g., transcription levels and proteins, in the regulatory system (Barabasi,2002; Fall, Marland, Wagner & Tyson, 2002; Shmulevich & Dougherty, 2007).
With few exceptions, all cells of an organism contain the same genetic mate-rial, although cells of different tissues are functionally different. The cell function is partially determined and controlled by gene expression profiles. With the aim of understanding how genes are involved in control of intra and inter cell processes, the scope of the molecular biology studies needs to be enlarged to include not only the discovery of nucleotide sequences that codes for proteins, but also the unravel-ing of the regulatory systems which determine what genes are expressed, when, where, and to how much extent (Snoep & Westerhoff, 2005). The explanation of these regulatory networks functioning, by means of sending and receiving signals, is currently one of the main objectives of the systems biology studies.
techniques toward better results. In addition to gene expression data, recently bio-logical information from heterogeneous data sources have been integrated by GRN inference methods as well. The objective of this chapter is to present an overview of GRN inference models and techniques with focus on incorporation of prior in-formation such as, global and local topological features and integration of several heterogeneous data sources.

One of the most challenging research problems of Systems Biology is the infer-ence (or reverse-engineering) of gene regulatory networks (GRNs) from expression profiles (Werhli, Grzegorczyk & Husmeier, 2006; Marbach et al, 2012). This research issue became important after the development of high-throughput technologies for extraction of gene expressions such as DNA microarrays (Schena, Shalon, Davis & Brown, 1995) or SAGE (Velculescu, Zhang, Vogelstein, & Kinzler, 1995), and more recently RNA-Seq (Wang, Gerstein, & Snyder, 2009). The importance of GRN reconstruction can be seen through initiatives taken for this purpose such as DREAM (Dialogue for Reverse Engineering Assessments and Methods) (Marbach et al, 2012). The inference problem involves discovery of complex regulatory relationships among biological molecules which can describe not only diverse biological functions, but also the dynamics of molecular activities. Once the network is recovered, intervention studies can be conducted to control the dynamics of the biological systems aiming to prevent or treat diseases (Shmulevich & Dougherty, 2007).
In general, it is not possible to recover GRNs very accurately based only on gene expression profiles for several reasons, including the presence of significant noise in the data, limited number of samples and large dimensionality. Also, GRN infer-ence is considered an ill-posed problem, meaning that many networks may be able to explain the data in hand. Besides, the lack of information about the biological organism and the high complexity of the networks are additional challenges involved in GRN inference. From the computational point of view, this problem is NP-hard, requiring the development of approximation algorithms and high performance computing (including parallelization) techniques.
To infer, analyze and compare the interrelationship between genes with adequate precision is an open research problem. In this regard, the integration of mathemati-cal models with several types of molecular information can be crucial for GRN inference and discovery of biological knowledge as well as their characterization (synthesis) (Ray, Bandyopadhyay, & Pal, 2009; Hecker, Lambeck, Toepfer, van Someren, & Guthke, 2009; Ristevski, 2013; Lopes, Ray, Hashimoto, & Cesar Jr., 2014b). Some widely studied available sources of biological data are Gene Ontol-ogy (GO) (Ashburner et al, 2000), GenBank (Benson, Karsch Mizrachi, Lipman, Ostell, & Wheeler, 2008), KEGG (Kyoto Encyclopedia of Genes and Genomes) (Kanehisa, Goto, Furumichi, Tanabe, & Hirakawa, 2010), The Arabidopsis Informa-tion Resource (TAIR) (D’Angelo, Kilian, Kudla, Batistic, & Weinl, 2009), Munich Information Center for Protein Sequences (MIPS) (Mewes, et al, 2011), Protein-Protein Interaction databases (Prasad et al, 2009; Licata et al, 2012; Orchard et al, 2014), to cite but a few. Another important trend is the inclusion of global and local topological information to improve GRN inference methods (Hecker et al, 2009; Lopes, Martins Jr, Barrera, Cesar Jr, 2014a).
The objective of this chapter is to present an overview of GRN inference tech-niques with focus on incorporation of prior information such as global and local topological features and integration of several heterogeneous data sources. The chapter will cover modeling, inference, validation and computational efficiency of these techniques, specially giving emphasis into the models and approaches proposed by the authors of this chapter such as Probabilistic Gene Networks (Section 2.2.4.3), SFFS-MCE (Secion 2.3.4.2), SFFS-BA (Section 3.3), Biological Score and Entropic Biological Score (Section 5). Section 2 presents the fundamentals of modeling and inference of gene regulatory networks from gene expression data, discusses the main models and inference methods proposed in the literature, including Probabilistic Gene Networks model and SFFS-MCE method. Section 3 presents some basic principles for including global topological information to help the gene regulatory networks inference process, including the discussion of SFFS-BA method. Section 4 provides principles behind integration of several biological sources to reconstruct gene networks. Finally, Section 5 briefly discusses the methods Biological Score and Entropic Biological Score, which infer gene regulatory networks by integrating several biological data sources.
Cells define their specific behaviors according to the genes expressed by them. The transcription is the first step to convert the stored information in DNA to proteins. The transcription process is regulated by a control network which coordinates the cell activity (Shmulevich & Dougherty, 2007). Genes express a certain mRNA concentration from which the proteins will be synthesized in ribosomes. Some of these proteins are enzymes that catalyze metabolic reactions vital for the cell maintenance and signalling. Other proteins interact with the DNA to regulate the RNA synthesis of genes.
The microarray technology (Schena, 1995) was developed twenty years ago, but it is still the most popular technique for extraction of gene transcription signals. Such method uses biochemical process that measures the expression of thousands of genes simultaneously. More recently, next generation sequencing techniques have allowed the development of more advanced methods to measure gene expression, such as RNA-Seq (Wang et al, 2009). These technologies allow, for the first time, the study of genes in an integrated and systematic way, since it is known that genes do not act alone, but rather jointly with other genes, proteins and other molecules.
Gene regulatory networks (GRN) inference is fundamentally involved in discov-ering which genes indirectly interact with each other (and how are these interac-tions) by means of their mRNA expressions and, ultimately, by their proteins. The
study of the dynamics of biological processes requires computational approaches to model the fast state transitions of molecules. The information about the dynamics, combined with computational analysis, can lead to a new stage of discovery about the understanding of the gene regulatory process. In particular, the gene expres-sion analysis allows to identify the activation and inhibition of genes while the cell responds rapidly to these events in the cellular microenvironment (Shav Tal, Singer, & Darzacq, 2004). In this context, mathematical and computational modeling of biological processes may provide a possibility to improve the understanding of molecular organization, inter-dependence between molecules (or genes) and their regulatory interrelationships.
The GRN inference is considered an ill-posed problem in the sense that, for a given dataset of gene expression profiles, there are many (if not infinity) networks capable to generate such dataset. Such problem is hardened by a typically limited number of samples, a huge dimensionality (number of variables, i.e., genes) and presence of noise (Shmulevich & Dougherty, 2007). The performance of the GRNs inference methods depends on the interrelationship between sample sizes, number of features and the complexity of the inference method. For example, a naive GRNs inference method requires the number of observations (e.g., microarrays) to be an exponential function of the number of genes (Jain, Duin & Mao, 2000). This phenomenon is known as the ``curse of dimensionality’’ in the field of pattern recognition. In this regard, novel computational and statistical techniques are required to infer relation-ships among the variables and to alleviate the intrinsic errors, committed in the presence of small number of samples with huge dimensionality.
In general, it is not possible to recover the GRNs very accurately due to aforemen-tioned reasons combined with the lack of information about the biological organism and the high complexity of the networks. Part of this complexity is due to the intrin-sically multivariate prediction phenomenon (Martins Jr, Braga Neto, Hashimoto, Dougherty, & Bittner, 2008; Martins Jr, Oliveira, Braga Neto, Hashimoto, & Cesar Jr, 2013), also known as synergy (Anastassiou, 2007) or combinatorial regulation (Marbach et al, 2010) in the context of GRNs. A set of genes X is considered as intrinsically multivariate predictive with regard to a given target gene Y if Y has its behavior (expression signal) strongly predicted by the expression signals of X and, at the same time, weakly predicted by any proper subset of X (Martins Jr et al, 2008; Martins Jr et al, 2013). The multivariate nature of the relationship of some predictor variables with the target variable is one of the main causes of the occurrence of the well known nesting effect (Martins Jr et al, 2008; Martins Jr et al, 2013). The nesting effect occurs when an inserted feature in the solution subset may never be removed
from it by a suboptimal feature selection, even if such feature does not belong to the optimal solution. Analogously, a feature removed from the solution subset may never be inserted into it, even if such feature belongs to the optimal solution (Pudil, Novovicová, & Kittler, 1994).
Thus, to infer, analyze and compare the interrelationship between genes with adequate precision is an open research problem. Although the integration of biologi-cal information with mathematical models is critically important in discovering and characterizing novel biological knowledge, it is restricted by the prior biological information of each gene/biological entity involved in the process. Moreover, the integration of multiple data types, associated with the local and global properties of the biological organisms, is also important for analysis of topological features of connectivity between genes, effective prediction of GRNs, and their functions (Troy-anskaya, 2005; Vidal, 2005; Aittokallio & Schwikowski, 2006; Lopes et al, 2014a).
Another issue is the validation of the inferred networks which requires prior knowledge about the real gene connections and their functional relations. In the validation process, it is possible to use computational gene network models (Mendes, Sha, & Ye, 2003; Marbach, Schaffter, Mattiussi, & Floreano, 2009; Lopes, Cesar Jr, & Costa, 2011a), for which the mechanisms are known, or to choose a biological model as a gold standard network.
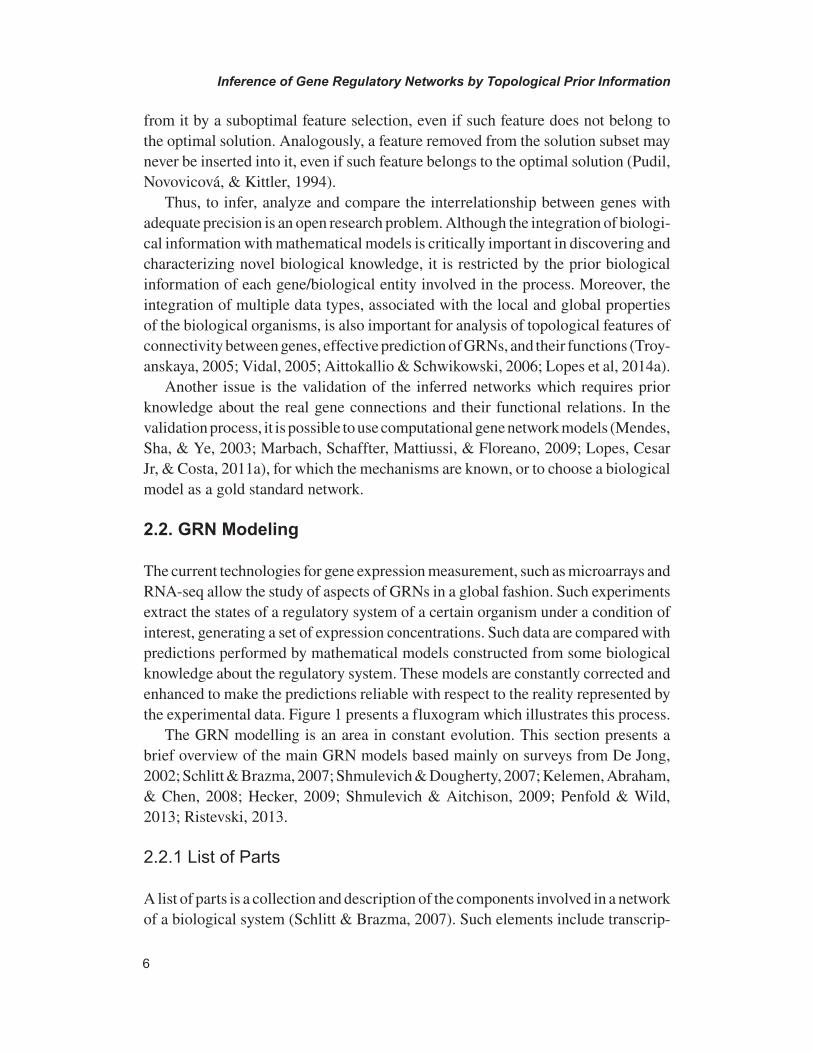
The current technologies for gene expression measurement, such as microarrays and RNA-seq allow the study of aspects of GRNs in a global fashion. Such experiments extract the states of a regulatory system of a certain organism under a condition of interest, generating a set of expression concentrations. Such data are compared with predictions performed by mathematical models constructed from some biological knowledge about the regulatory system. These models are constantly corrected and enhanced to make the predictions reliable with respect to the reality represented by the experimental data. Figure 1 presents a fluxogram which illustrates this process.
The GRN modelling is an area in constant evolution. This section presents a brief overview of the main GRN models based mainly on surveys from De Jong, 2002; Schlitt & Brazma, 2007; Shmulevich & Dougherty, 2007; Kelemen, Abraham, & Chen, 2008; Hecker, 2009; Shmulevich & Aitchison, 2009; Penfold & Wild, 2013; Ristevski, 2013.
A list of parts is a collection and description of the components involved in a network of a biological system (Schlitt & Brazma, 2007). Such elements include transcrip-
tion factors, promoters and binding sites for transcription factors. The building of a list of parts is the first step in the development of a complex model. Such lists are resulting from a genomic sequencing and annotation project in which the DNA of an organism is determined and a large part of genes and proteins are identified. These lists can be represented as a database of regulatory elements or functions performed by genes. Once the transcription factors and their respective binding sites are known, the topology of a regulatory network can be derived.
Topological models describe the connection between the elements composing the list of parts. They can be represented by graphs whose nodes correspond to genes and edges (or arcs) representing the regulatory interactions. Graph representations have been used for a myriad of biological datasets, including gene expression net-works and protein-protein interaction networks (Albert & Barabási, 2002; da-Silva & Stumpf, 2005).
The representation of regulatory networks by means of graphs can be generalized in several ways (De Jong, 2002). Nodes and arcs can be labeled to provide informa-tion about the functionality of each gene and the type of interactions existing among the genes. A simple example of gene regulatory network can be viewed in Figure 2 which illustrates 3 nodes (genes) and arcs indicating activation (→) or inhibition (-|).
There are many graph operations that can be performed to obtain biologically relevant predictions about regulatory systems (De Jong, 2002). For instance, a search for paths between two genes can provide clues about network redundancy. Charac-teristics of global connectivity of a network, such as the average and the distribution
Figure 1. Fluxogram illustrating the GRN analysis process. Rectangles represent procedures, triangles represent information sources and arrows represent informa-tion flux. Figure adapted from (De Jong, 2002).

of the number of regulator per gene, may indicate the network complexity. A strongly connected subgraph that is loosely connected with other subgraphs may be a functional module of the regulatory system which can be separately analysed. Largely connected genes (hubs) normally provide tolerance to random faults occur-ring in elements of the network (Albert, Jeong, & Barabási, 2001). Repetition of local structures (motifs), frequently occurring in real data but almost absent in random networks, can be examined. For example, cycles may indicate feedback relationships important to the homeostasis and differentiation (Thomas, 1998; Milo, 2002). Finally, comparison of regulatory networks from distinct organisms can be conducted to search for evolutionary features preserved in both species (De Jong, 2002).
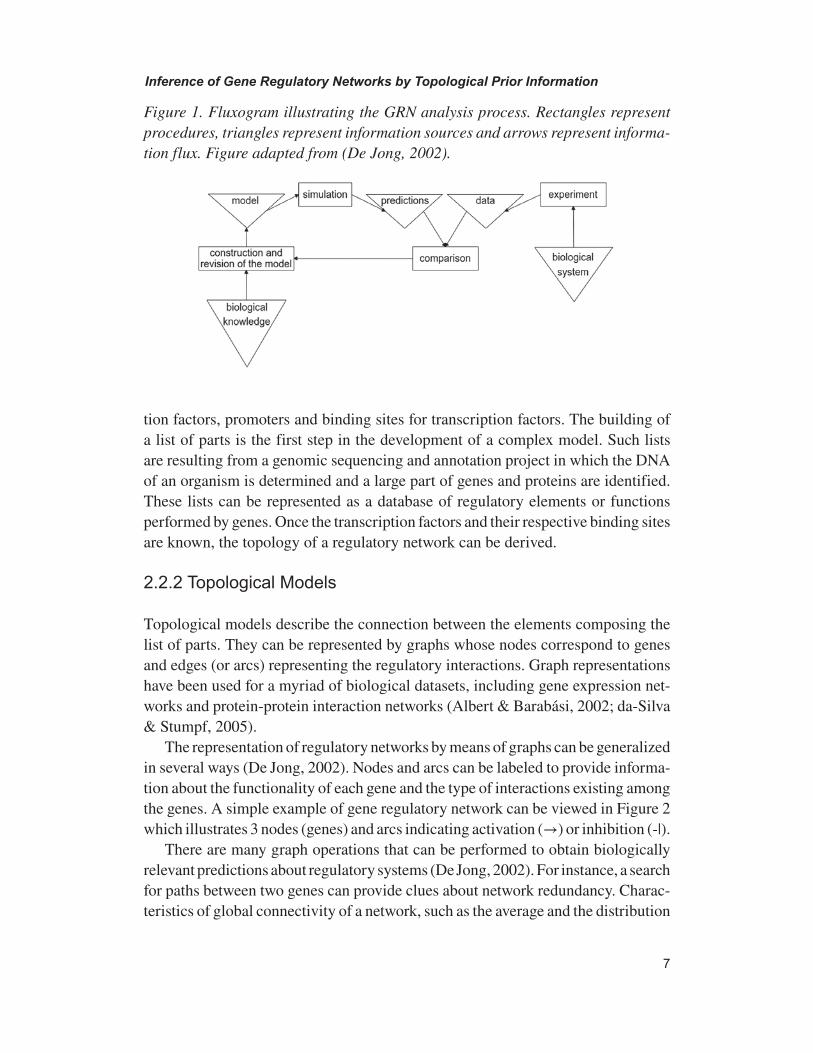
Once the network topology is known, the next step is the study of the interaction rules among the network elements. For instance, considering a promoter consisting of only one binding site to a transcription factor, it is important to know whether such factor is either an activator or inhibitor. If several transcription factors bind to a promoter, the knowledge of the functioning of each factor and the way they interact is important. Figure 3 illustrates a Boolean logic circuit among three input genes which provides as a output the result of the fourth gene. Some studies show that some promoters present multivariate behaviors approximated by Boolean functions (AND, OR, NOT and combinations of these logics) (Kauffman, 1993; Shmulev-ich, Dougherty, Kim, & Zhang, 2002; Martins-Jr et al, 2008). In certain cases the interactions are even more complex (Louis & Becskei 2002).
Boolean functions, decision trees, relevance networks, Bayesian networks and linear functions are often used to describe the network logics. These models can be
Figure 2. Directed graph representing a gene regulatory network. The arcs indicated by → and -| represent activation and inhibition interactions, respectively
classified in two major categories: discrete or continuous (D’haeseleer, Liang, & Somogyi, 2000). Discrete functions are based on the hypothesis that a gene can be in a finite number of states. In the simplest case, only two states describe the state of a gene: expressed and not expressed. In this way, Boolean functions can describe the interactions among genes. Such functions are simplifications of gene networks, since gene expression data are in continuous domain (concentration of molecules change in a smooth fashion). Nevertheless, Boolean networks can be a good starting point to model gene networks since they are suitable to capture the global behavior of the biological system, require less data to be estimated, and the implementation, simulation and analysis are straightforward (Kauffman,1969; Hecker, 2009).
Continuous functions use real values to represent the gene activity. One of the widely used approaches in this category is the linear function which considers the target gene as a linear combination of its predictors, each one with a different weight and a signal that can be positive or negative. The network topology determines which predictors possess weight equal to zero for a given target (those genes without arcs going to the target). Unlike Boolean functions, linear functions cannot model a situation in which a gene can exert both activation and inhibition to another gene depending on the state of other genes (non-linear relationships). Non-linear relations are better modeled by Boolean functions.
Decision trees are models that allow to predict the behavior of a particular gene (tree leaf) based on the expression of other genes (internal nodes of the tree) (Soinov, Krestyaninova, & Brazma, 2003). This approach works with both discrete and continuous variables.
Figure 3. Logic Boolean circuit with three input genes producing the value of the fourth gene as a result (adapted from (Schlitt & Brazma, 2007). The fourth gene is activated only when genes 1 and 2 are activated and gene 3 is inhibited.
Relevance networks approaches consider the similarity between gene pairs in the continuous domain (Butte & Kohane, 2000; Kelemen et al, 2008). To define the network topology, all gene pairs are compared using similarity metrics such as correlation coefficients or mutual information. An approach in this direction is available in ARACNe (Algorithm for the Reconstruction of Accurate Cellular Networks) (Margolin et al, 2006). Such approaches cannot capture multivariate (N-to-1) relationships, since they capture only pairs (1-to-1).
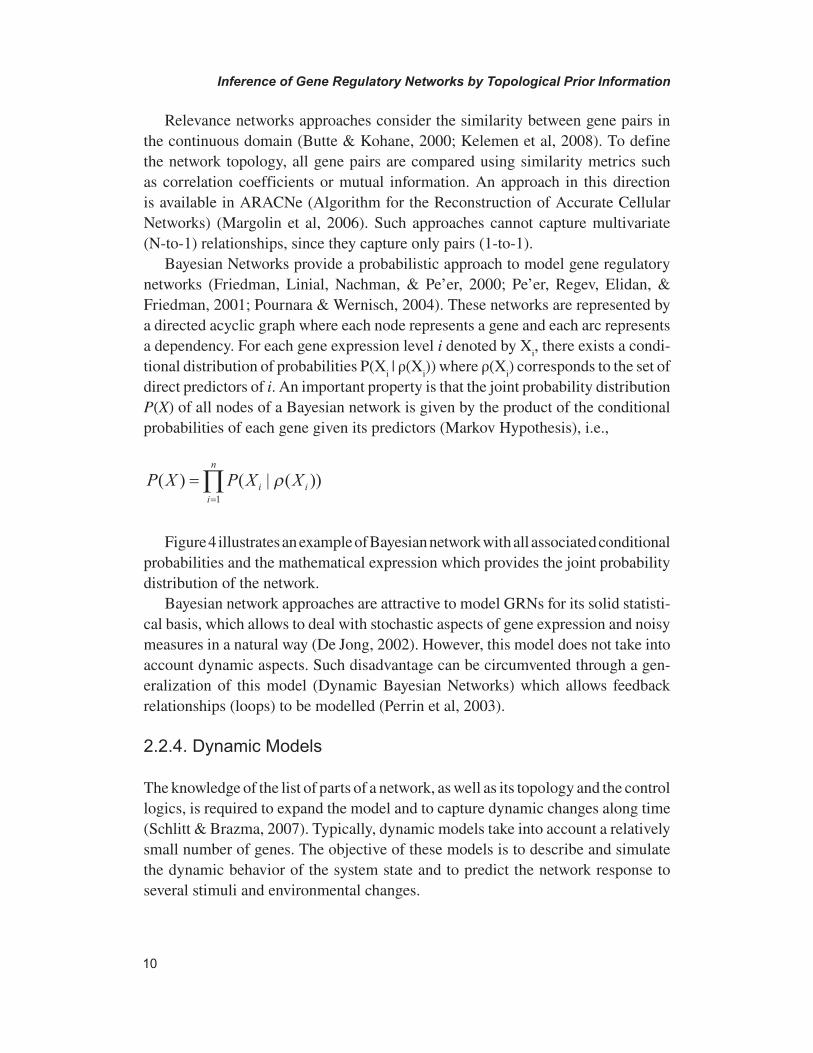
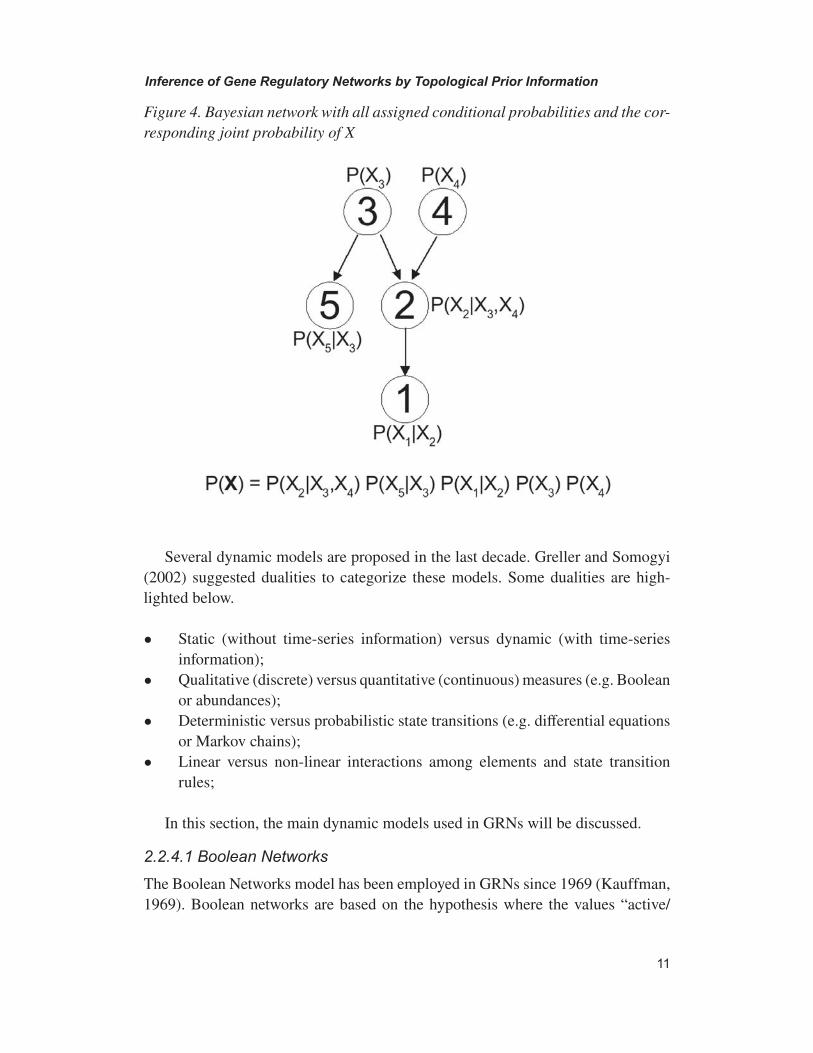
Bayesian Networks provide a probabilistic approach to model gene regulatory networks (Friedman, Linial, Nachman, & Pe’er, 2000; Pe’er, Regev, Elidan, & Friedman, 2001; Pournara & Wernisch, 2004). These networks are represented by a directed acyclic graph where each node represents a gene and each arc represents a dependency. For each gene expression level i denoted by Xi, there exists a condi-tional distribution of probabilities P(Xi | ρ(Xi)) where ρ(Xi) corresponds to the set of direct predictors of i. An important property is that the joint probability distribution P(X) of all nodes of a Bayesian network is given by the product of the conditional probabilities of each gene given its predictors (Markov Hypothesis), i.e.,
P X P X Xi ii
n
( ) ( | ( ))==∏ ρ1
Figure 4 illustrates an example of Bayesian network with all associated conditional probabilities and the mathematical expression which provides the joint probability distribution of the network.
Bayesian network approaches are attractive to model GRNs for its solid statisti-cal basis, which allows to deal with stochastic aspects of gene expression and noisy measures in a natural way (De Jong, 2002). However, this model does not take into account dynamic aspects. Such disadvantage can be circumvented through a gen-eralization of this model (Dynamic Bayesian Networks) which allows feedback relationships (loops) to be modelled (Perrin et al, 2003).
The knowledge of the list of parts of a network, as well as its topology and the control logics, is required to expand the model and to capture dynamic changes along time (Schlitt & Brazma, 2007). Typically, dynamic models take into account a relatively small number of genes. The objective of these models is to describe and simulate the dynamic behavior of the system state and to predict the network response to several stimuli and environmental changes.
Several dynamic models are proposed in the last decade. Greller and Somogyi (2002) suggested dualities to categorize these models. Some dualities are high-lighted below.
• Static (without time-series information) versus dynamic (with time-series information);
• Qualitative (discrete) versus quantitative (continuous) measures (e.g. Boolean or abundances);
• Deterministic versus probabilistic state transitions (e.g. differential equations or Markov chains);
• Linear versus non-linear interactions among elements and state transition rules;
In this section, the main dynamic models used in GRNs will be discussed.
The Boolean Networks model has been employed in GRNs since 1969 (Kauffman, 1969). Boolean networks are based on the hypothesis where the values “active/
Figure 4. Bayesian network with all assigned conditional probabilities and the cor-responding joint probability of X
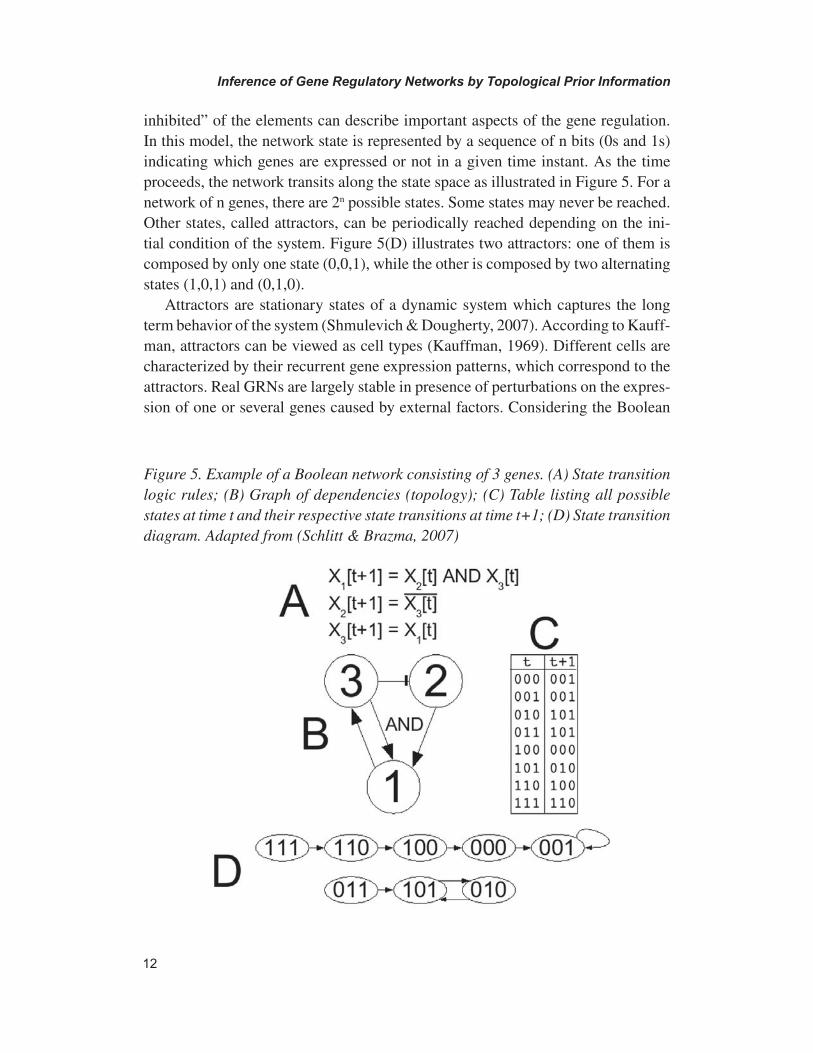
inhibited” of the elements can describe important aspects of the gene regulation. In this model, the network state is represented by a sequence of n bits (0s and 1s) indicating which genes are expressed or not in a given time instant. As the time proceeds, the network transits along the state space as illustrated in Figure 5. For a network of n genes, there are 2n possible states. Some states may never be reached. Other states, called attractors, can be periodically reached depending on the ini-tial condition of the system. Figure 5(D) illustrates two attractors: one of them is composed by only one state (0,0,1), while the other is composed by two alternating states (1,0,1) and (0,1,0).
Attractors are stationary states of a dynamic system which captures the long term behavior of the system (Shmulevich & Dougherty, 2007). According to Kauff-man, attractors can be viewed as cell types (Kauffman, 1969). Different cells are characterized by their recurrent gene expression patterns, which correspond to the attractors. Real GRNs are largely stable in presence of perturbations on the expres-sion of one or several genes caused by external factors. Considering the Boolean
Figure 5. Example of a Boolean network consisting of 3 genes. (A) State transition logic rules; (B) Graph of dependencies (topology); (C) Table listing all possible states at time t and their respective state transitions at time t+1; (D) State transition diagram. Adapted from (Schlitt & Brazma, 2007)

networks formalism, this means that when a small number of genes are perturbed, their values (states) may change, but the network states usually remain in the same attractor basin, which leads to the same attractor (Shmulevich & Dougherty, 2007). In this sense, attractors of large attractor basins lead to strong stability of the system (Li, Long, Lu, Ouyang, & Tang, 2004; Zhang et al, 2006). Such stability of regula-tory networks in live organisms allows cells to maintain its normal functional state in the organism even when exposed to some degree of external perturbations.
Generalized Logical Networks are a generalization of the Boolean network model in which the elements can have an arbitrary number of values and the state transitions occur asynchronously (Thomas, Thieffry, & Kaufman, 1995).
Probabilistic Boolean Networks is a stochastic model of Boolean Networks where the binary expression value of each gene at a certain timepoint is determined by a set of Boolean functions of some genes at the previous timepoint. Here, each function is applied probabilistically (Shmulevich et al, 2002). Normally, the quasi-determinism, inherent to GRNs, is modelled by assigning probability close to 1 to one of the functions, while the functions with small probability play the role of perturbations or changes of biological context (Dougherty, Brun, Trent, & Bittner, 2007). As a consequence, Boolean networks represent a particular type of probabilistic Boolean networks in which each gene has only one predictor function.
Probabilistic gene networks (PGN) follows the feature selection principle. For each target gene, a search for the subset is performed which best describes the target behavior according to the expression signals. Barrera et al (2007) discussed this approach in analyzing the dynamical expression signals of the Plasmodium falci-parum (one of the malaria agents) and provided interesting biological results. Such approach assumes that the temporal samples follow a first order Markov Chain in which each target gene in a given timepoint depends only on its predictor values in the previous time instant. The transition function is homogeneous (it does not change along time), almost deterministic (from any state, the system has a preferential state to go) and conditionally independent (i.e., the value of a given gene is dependent only on its predictors, following the Markov hypothesis). These assumptions are important simplifications to deal with the limited number of samples typically available in real data.
Conceptually, PGN is a restricted type of PBN when the variables are binary. PGN assumes that a target gene presents several different predictor functions like PBN, although the difference is that all these functions necessarily present the same set of predictor genes as inputs in PGN. Another important restriction is the quasi-
determinism assumed by PGN. Finally, PGN model assumes that genes can have a variable number of discrete values. For example, Barrera et al (2007) considered three possible states for each gene: -1 (underexpressed), 0 (normally expressed), +1 (overexpressed).
Bayesian networks are inherent static, as they do not model cycles in the network topology. In contrast, Dynamic Bayesian Networks (DBN) is a model that consid-ers time-dependency, thus allowing cycles (Perrin et al, 2003). Shmulevich et al. (2002) showed that PBN is a type of DBN which considers only binary values. Similar to Bayesian networks, DBN can consider a variable number of discrete states for each gene.
Boolean networks model and its derivatives can reveal important global properties of the network, but they are insufficient to capture certain aspects of the dynamics (Schlitt & Brazma, 2007). On the other hand, differential equations models allow more detailed descriptions of the network dynamics by modelling concentration alterations along time (Chen, He, & Church, 1999; Maki, Tominaga, Okamoto, Watanabe, & Eguchi, 2001). Basically, the regulatory network is modelled by equations of the form:
dxdt
F x x x i n F R Rii n i
n= ∈ →( , ,..., ), { , ,..., }, :1 2 1 2
where Fi is a logic control function that can be linear or non-linear (generally non-linear (Shmulevich & Dougherty, 2007; De Jong, 2002)).
A disadvantage in using differential equations in the context of GRN inference is the requirement of a large number of parameters to be estimated. Additionally, a high temporal resolution dataset (many timepoints) is required. However, datasets with large number of temporal gene expression samples is normally very difficult to obtain. This is the main reason by which differential equation models are applied only to very small networks with few components. Another difficulty is that the experimental data in question are very susceptible to noises, which may deny the appropriate quantitative modelling. Prior biological knowledge and simplifications can help this type of modelling (Kelemen et al, 2008).
Similar to differential equations, stochastic differential equations try to capture quantitative molecular details. However, this model tries to incorporate stochasticity

to also capture fluctuations on the molecular level, which are important for many biological processes (Raser & O’Shea, 2005; Shmulevich & Aitchson, 2009). Besides, the inclusion of stochasticity is general and does not require specific knowledge about the stochasticity nature. There are simulation methods that accurately simulate the system dynamics of reactions of biochemical molecules, although their compu-tational costs strongly increases with the number of chemical variables considered (Cao & Samuels, 2009; Shmulevich & Aitchson, 2009). On the other hand, there are methods which incorporate stochasticity on the deterministic differential equations, which perform much better in terms of computational complexity than simulation methods, specially for a large number of chemical molecules (Manninen, Linne, & Ruohonen, 2006). Such methods can introduce stochasticity into reaction rates, rate constants and concentrations. The main disadvantage of this model is the require-ment of prior knowledge of concentrations and kinetic parameters, as happens for quantitative models in general.
In this model, chemical reactions are modeled as a Markov chain process where the set of states is discrete and the time is continuous (Hegland, Burden, Santoso, MacNamara, & Boooth, 2007; Smadbeck & Kaznessis, 2014). Each element of the state corresponds to the number of molecules of a given type. When a chemical reaction occurs, a transition happens from a given state to another one. There are several types of reactions including covalent reactions, bindings, conformational changes, transcriptional elongation events, among others. This model presents an important disadvantage due to the involvement of a large number of interacting substances, suffering from the curse of dimensionality. To address such problem, stochastic approximations have been proposed. Even so, this model is very compu-tationally intensive, where even a moderate number of substances (~ 100) cannot be feasibly modelled.
Petri nets are an extension of graph models which allows simple quantitative repre-sentation of dynamic processes (Pinney, Westhead, & McConkey, 2003; Hardy & Robillard, 2004). Usually Petri Nets are directed graphs consisting of arcs and two different types of nodes: position and transition nodes. The arcs connect only posi-tion nodes to transition nodes and vice-versa. The dynamic aspect is introduced by tokens, which can be contained by position nodes. Each arc has a value indicating the number of tokens required to perform the transition through it. The transition nodes determine the change rate along the way. Petri nets are particularly useful to model metabolic reactions, since a detailed information about the reaction rates is not needed. This is an advantage because such rates are usually unknown, although
such information is important to completely describe certain metabolic networks (Schlitt & Brazma, 2007).
Biological systems present continuous and discrete aspects (Schlitt & Brazma, 2007). In general, concentrations are continuous values whereas binding of a tran-scription factor to DNA is expressed as a discrete event (on or off). However, the boundary between the continuous and discrete aspects depends on the detail level of the adopted model. Hybrid models are developed to describe both aspects (Akutsu, Miyano, & Kuhara, 2000).
There exist extensions of the Petri nets model which allow to include knowledge about the reactions dynamics. One of these extensions include stochastic time de-lays of the transitions (Goss & Peccoud, 1998) . In these networks, the trigger of transition nodes depends not only on the number of tokens, but also on a stochastic component. Another type of extension is the Hybrid Functional Petri Nets (HFPN) model where the position and transition nodes are continuous (Matsuno, Inouye, Okitsu, Fujii, & Miyano, 2006). The problem with using HPFN is that it cannot utilize (lost) the main advantage of conventional Petri nets over differential equations (independence on reaction rates information). On the other hand, HFPN allows a mixture of continuous and discrete nodes, which enables the inclusion of informa-tion about known reaction rates only (Schlitt & Brazma, 2007).
Finite State Linear Model (FSLM) combines the simplicity and the small compu-tational cost of Boolean networks with a continuous representation of the element values (Ruklisa, Brazma, & Viksna, 2005). In this model, the gene activity is repre-sented by two states (overexpressed and underexpressed) but the expression levels are represented by real values. The time is continuous and the concentration rate change is determined by the network state. This model can represent a good degree of complexity of the networks, although it is not appropriate to model relatively large regulatory networks due to lack of detailed biological information (Schlitt & Brazma, 2007).
The GRN inference from gene expression data, also known as reverse engineer-ing, is not an easy task due to the huge volume of variables (genes) and the small number of available samples (experiments). It also involves the large complexity of
the biological networks, representing an important challenge in bioinformatics and computational biology (Hovatta et al, 2005). The literature related to GRN identifica-tion is vast and growing rapidly which reflects the importance of this research field. Some reviews about this topic can be found in D’haeseleer et al, 2000; De Jong, 2002; Styczynski & Stephanopoulos, 2005; Schllit & Brazma, 2007; Markowetz & Spang, 2007; Karlebach & Shamir, 2008; Hecker et al, 2009; Xiao, 2009; de Smet & Marchal, 2010; Marbach et al., 2010; Lu & Zhou, 2011 and Penfold & Wild, 2013. The objective of this section is to present a brief overview of some GRN inference methods based on the aforementioned surveys.
The strategy adopted by REVEAL (REVerse Engineering ALgorithm) (Liang, Fuhrman, & Somogyi, 1998; Kelemen et al, 2008) is to infer regulatory interactions between genes through mutual information of the joint probability distribution of a target, at a given time instant, and its predictors at the previous instant of time. In this way, REVEAL estimates the relationship between genes based on mutual informa-tion of the temporal measurements of gene expression (e.g. temporal microarrays).
Given a set of temporal expressions and a target gene Y, REVEAL applies an exhaustive search for a given subset of genes X, such that I(X,Y) = H(X), where H is the Shannon’s entropy of X. This equality means that the behavior of Y is fully predicted by X. A parameter k indicating The maximum size of the subsets to be searched is required. The value of this parameter needs to be small (at most 3), otherwise the exhaustive search for subsets of size k becomes computationally unfeasible. In addition, another importance to constrain the k values to be small is due to the curse of dimensionality (Theodoridis & Koutroumbas, 2008), where larger k lead to poorer statistical estimation of the joint probability distributions.
The methods Predictors and Chooser, developed by Ideker et al., identify GRNs models as Boolean Networks by applying successive perturbations to genes with the most uncertain connections and analyzing the alterations in the system behavior (Ideker, Thorsson, & Karp, 2000). One of the steps of these methods is the Hitting Set Problem (HSP) solving, which is NP-hard (Garey & Johnson, 1999). Recently, Graphical Processing Unit (GPU) implementations of HSP is developed to make HSP feasible for larger number of Boolean clauses and higher dimensionalities (Steinbach & Posthoff, 2012; Santos et al, 2015), which are intrinsic characteristics of GRNs.
Approaches based on relevance networks (Butte, & Kohane, 2000) look for similarity or dissimilarity between gene pairs. Two steps are required for network inference: (i) all gene pairs are compared using some similarity or dissimilarity metric (in general, correlation coefficient and mutual information are used (Kelemen et al, 2008)); (ii) the full set of comparisons between pairs is filtered to determine relevant connec-tions, typically done by using a threshold. The selection of these relevant connec-tions represents the discovery of the edges between genes in the inferred network.
ARACNE (Algorithm for the Reconstruction of Accurate Cellular NEtworks) (Mar-golin et al, 2006) is an algorithm based on relevance networks which uses mutual information to identify the regulatory relationships between genes. Once such re-lationships are identified, ARACNE applies a filter to eliminate edges representing indirect relationships between genes. This is performed by using the data processing inequality, which states that if tree random variables X, Y, and Z depend on each other in a linear fashion X→Y→Z, then the mutual information between X and Z is less than or equal to the minimum of the mutual informations between X and Y, and between Y and Z (Kelemen et al, 2008). In this way, each triplet of genes is analysed with the aim to eliminate indirect relationships.
CLR (Context Likelihood of Relatedness) algorithm (Faith et al, 2007) assigns an edge between two genes if some similarity metric is larger than a given threshold. Instead of considering the mutual information between two genes directly, as AR-ACNE does, CLR calculates a measure based on the distribution of mutual informa-
tion values. This metric is given by z z zij i j= + , where
zI X X
i i
i j i
i
=−
max( ,( , )
)0μ
σ.
Here, I is the mutual information, μi is the mean and σi is the standard deviation of the empirical distribution of the mutual information values between genes Xi and Xj.
Feature selection based approaches searches for the subset of genes which best predicts the behavior of a considered target gene according to the expression data,
a search algorithm and a relevance criterion (criterion function). This process is ap-plied to all genes considered as target (all genes or a reduced list of genes of interest).
MRNET method applies feature selection guided by maximum relevance / mini-mum redundancy criterion to infer GRNs (Peng, Long, & Ding, 2005). For each target gene Y, a search is performed to determine the variable Xi which presents the largest mutual information with respect to the chosen target gene I(Xi,Y). The second chosen gene Xj is the one with the largest mutual information with respect to the target gene I(Xj,Y) and at the same time it has the least mutual information with the gene already chosen as predictor I(Xi,Xj), generating a predictor set Z. In the next steps, this set is updated by inclusion of new genes Xk which maximize the difference uk-rk, where uk represents the relevance given by the mutual information I(Xk,Y), and rk represents the redundancy given by:
rZ
I X Xk k jX Zj
=∈∑1
| |( , )
The method SFFS-MCE (Sequential Floating Forward Search - Mean Conditional Entropy) considers the regulatory interactions represented by the PGN model (see Section 2.2.4.3) to infer GRNs (Barrera et al, 2007; Lopes, Martins Jr, & Cesar Jr, 2008). The inference process is initiated by choosing one gene of interest (target). As the search space is usually very large, an exhaustive search for predictors of a target gene is unfeasible, unless the number of predictors that each target can possess is limited. This is similar to what is done by REVEAL (Section 2.3.1). To circum-vent this problem, SFFS-MCE applies SFFS, a sub-optimal feature selection with good cost-benefit in terms of computational complexity and quality of the solution returned (Pudil et al, 1994). The objective is to find a good subset of predictors for the chosen target within a small computation time. The criterion function is based on penalized mean conditional entropy, which needs to be minimized to achieve the best subsets. This criterion is, in essence, based on mutual information with a factor that penalizes joint probability distributions in which the number of poorly observed predictor states is large (Martins Jr, Cesar Jr, & Barrera, 2006; Barrera et al, 2007; Lopes et al., 2008).
Feature selection algorithms like SFFS are suboptimal in the sense that the optimum solution (i.e., the best predictor set according to the criterion function adopted) is not guaranteed. This is due to the presence of intrinsically multivari-ate predictive relationships in GRNs (Martins-Jr et al, 2008), resulting from the

nesting effect (Pudil et al, 1994) (see Section 2.1). Although SFFS was designed to alleviate the nesting effect problem, it is not completely removed. In this regard, several improvements on the search algorithm and/or the criterion function of the SFFS-MCE are developed (Lopes, Martins Jr, Barrera, & Cesar Jr, 2010; Lopes, de Oliveira, & Cesar Jr, 2011b; Borelli, Camargo, Martins Jr, & Rozante, 2013; Montoya Cubas, Martins Jr, Santos, & Barrera, 2014; Lopes et al, 2014a; Lopes et al, 2014b; Vicente & Lopes, 2014). In particular, the method SFFS-BA (Lopes et al, 2014a), which will be described and discussed in Section 3.3, utilizes the SFFS algorithm to obtain networks with scale-free properties. Finally, a method, called Entropic Biological Score (Lopes et al, 2014b), is discussed in Section 4 which cre-ates a criterion function based on mean conditional entropy computed from gene expression data and also incorporates several other sources of biological information.
Evolutionary algorithms is a branch of the artificial intelligence where computational models, mimicking the natural process of evolution, are proposed to solve combi-natorial optimization problems. In this context, the genetic algorithms (GA) utilize concepts of the natural selection theory such as inheritance, selection, crossover and mutation to solve combinatorial optimazation problems until local optimal or global optimal solutions are achieved (Holland, 1992; Mitchell, 1996).
The genetic algorithms framework has been employed to infer gene regulatory networks (GRNs) in several investigations (Larrañaga, Poza, Yurramendi, Murga, & Kuijpers, 1996; Shin & Iba, 2003; Mamakou, Sirakoulis, Andreadis, & Karafyllidis, 2005; Swain, Hunniford, Dubitsky, Mandel, & Palfreyman, 2005; Knabe, Wegner, Nehaniv, & Schilstra, 2010; Davidson, 2010; Mendoza, Lopes & Bazzan, 2012; Jimenez, Martins Jr, & Santos, 2014). In particular, Davidson (2010) presented a discussion about genetic algorithms for Bayesian networks inference through topo-logical sort of genes (nodes) and developed a hybrid genetic algorithm, personalized for this purpose. Mendoza et al (2012) proposed a genetic algorithm for inference of GRN, modeled by Boolean networks from simulated and real data. In this work, the topologies are computed by integer numbers representing the predictor indices for each gene. Here, it is necessary to determine a priori the maximum number of predictors per gene as the random initial population is restricted to one predictor per gene. The fitness function is based on Tsallis entropy (Lopes et al, 2011b) with a penalty factor that needs to be appropriately defined to obtain networks with a good balance between complexity (number of edges in the network) and consistency with the temporal expression data.
In general, the GA methods developed for GRN inference codify the structure of the network as a whole, i.e., each chromosome represents a network, and the initial
population consists of random networks generation. On the other hand, a recent work proposed by Jimenez et al. (2014) presents the application of one genetic algorithm per gene to seek for the best subset of predictors for each gene. In this way, a chro-mosome codifies a subset of predictor genes, specific for a given gene. Besides, this work suggests the generation of initial populations based on an inference method (for instance, exhaustive search by mutual information with a predefined small number of predictors per gene as proposed by Barrera et al. (2007).
The DREAM (Dialogue for Reverse Engineering Assessments and Methods) project is an initiative which is conducted by a community of researchers to provide impor-tant systems biology and translational medical challenges and to invite participants to propose solutions (Marbach et al, 2010; Marbach et al, 2012). The main idea behind this project is to combine methods proposed by the community to generate a “wisdom of the crowd” to solve intricate challenges. Marbach et al. observed that GRN inference methods usually fail to accurately infer multiple regulatory inputs (combinatorial or intrinsically multivariate regulation) of genes (Marbach et al, 2010) by assessing several methods that try to solve this problem. Based on this observation, Marbach and colleagues compared 35 methods, submitted to DREAM5 (fifth edition) challenge, with community-based consensus networks obtained by ensembling those 35 methods. The results revealed that only the consensus networks are robust across species and datasets, achieving best overall performances (Marbach et al, 2012). Those 35 methods are classified in five broad categories (regression, mutual information, correlation, Bayesian and other) and strengths and weaknesses of each category are highlighted.
Although the authors conclude that the ensemble of networks is the best approach in general, it still does not accurately infer GRNs in all situations. This is due to the very known inherent limitations of gene expression data involved with the fact that mRNA levels of transcription factors and their targets not always tend to be correlated. The authors suggest that the accurate inference of eukaryotic regulatory networks can be achieved only by integrating other sources of biological information. This is precisely the key point of the present chapter. In Section 3, a method that integrates prior global topological information (scale free topology) to the SFFS-MCE (Lopes et al, 2008), called SFFS-BA (Lopes et al, 2014a), is discussed. Finally, Section 4 discusses about a method, called Entropic Biological Score (Lopes et al, 2014b), that integrates several sources of biological information to the MCE (mean conditional entropy) criterion function.
The biological data integration and mathematical models can be crucial for the discovery of biological knowledge, as well as their characterization (synthesis). Among the mathematical models, the FunNet (Prifti, Zucker, Clement, & Henegar, 2008) is an integrative tool for exploring interactions in gene expression data sets. Another class of biological data can be obtained in the form of images, which try to represent in a pictorial way the cells and molecules in various biological phe-nomena of interest. Currently there are some biological imaging databases such as Allen Brain Atlas (Lein et al, 2007), Cell Centered Database (Martone et al, 2002) and FlyEx Database (Poustelnikova, Pisarev, Blagov, Samsonova, & Reinitz, 2004).
There are several recent initiatives where biological information is incorporated in the inference/prediction methods. One kind of initiative is the use of known informa-tion of biological entities, available in public databases, into the clustering process (exploratory analysis / unsupervised classification), resulting in more biologically meaningful clusters (Cui, Wang, Chen, Busov, & Wei, 2010; De-haan et al, 2010; Macintyre, Bailey, Gustafsson, Haviv, & Kowalczyk, 2010).
Another initiative is also to use biological information for the discovery of transcriptional regulation relationships, i.e., to infer GRNs (Ernst et al, 2008; Seok, Kaushal, Davis, & Xiao, 2010; Werhli & Husmeier, 2008). A variety of biological data integration techniques for GRNs inference are described in (Troyanskaya, 2005; Karlebach & Shamir, 2008; Baumbach, Tauch, A., & Rahmann, 2009; Hecker et al, 2009). Although the integration of biological information with mathematical models is critically important in discovering and characterizing novel biological knowledge, it is restricted by the prior biological information of each gene/biologi-cal entity involved in the process.
Another important aspect is the integration of multiple data types associated with the local and global properties of the biological organisms such as the analysis of topological features of connectivity between genes. This can be decisive for the effective prediction of GRNs and their functions in face of the known limitations (Troyanskaya, 2005; Vidal, 2005; Aittokallio & Schwikowski, 2006).
The analysis of the local and global biological network properties and its application on the inference process is very recent and has been very promising (Karlebach & Shamir, 2008; Klamt, Saez Rodriguez, J., & Gilles, 2007; Lacroix, Cottret, Thébault,

& Sagot, 2008; Lenas, Moos, & Luyten, 2009; Przytycka & Kim, 2010; Lopes et al, 2014a; Vicente & Lopes, 2014). For example, the application of local and global structures of biological organisms on the inference methods may occur in the form of similarities of connected network modules (Ulitsky & Shamir, 2007), structural and graph-theoretic interpretation of the network components (Kuchaiev, Milenkovic, Memisevic, Hayes, & Przulj, 2010; Narasimhan, Rengaswamy, & Vadigepalli, 2009), sparseness of the network (Andrecut, Huang, & Kauffman, 2008; Andrecut & Kauff-man, 2008; Christley, Nie, & Xie, 2009), gene network motifs (Ott, Hansen, Kim, & Miyano, 2005) and search for cliques in network graphs (Yu, Paccanaro, Trifonov, & Gerstein, 2006). More importantly, biological networks and particularly GRNs are known not only to be sparse, but also organized, as nodes belong to different classes of connectivity (Charbonnier, Chiquet, & Ambroise, 2010).
The information about network topology can help the investigation of biological process by adopting the complex network theory and its properties (Albert & Bara-basi, 2002; Costa, Rodrigues, & Cristino, 2008; Newman, 2003; Strogatz, 2001). It is known that many kinds of relationships can be successfully described by complex networks. In particular, the complex networks theory describes various types of network topologies, each one with well defined properties. It has been broadly ap-plied to characterize biological processes and gene relationships. Some biological networks present the scale-free property in which many nodes have a low degree and a few of them have a high degree (hubs). Here, the degree distribution of scale-free networks is approximated by a power-law distribution (Albert, 2005; Barabasi, 2009; Barabasi & Oltvai, 2004; Costa et al, 2008; Farkas et al, 2003; Guelzim, Bottani, Bourgine, & Képès, 2002; Jeong, Tombor, Albert, Oltvai, & Barabási, 2000). In general, topological patterns and its structural analysis is one of the most promis-ing topics in the analysis of complex networks (Alon, 2007; Goemann, Wingender, & Potapov, 2009), and particularly the application of structural properties of the network can be a very valuable prior information for GRNs inference methods.
Recently, an approach by using the scale-free topological information for GRNs inference, called Sequential Forward Floating Selection - Barabási-Albert (SFFS-BA), is proposed by Lopes et al., 2014a. This new feature selection algorithm is guided by a criterion function applied to the GRNs inference from expression data, which assumes that the structure of GRNs follows a scale-free topology. Therefore, the scale-free topology is used as a prior information by the search algorithm for the GRNs inference.
Considering the limitations of data, knowledge about biological organisms, presence of noise in the expression measures and the complexity of biological

networks, the main objective of the SFFS-BA method is to show the importance of considering a priori information in order to improve the inference process and make it more suitable for a class of problems, like the scale-free networks in this work.
The SFFS-BA approach is based on the Probabilistic Gene Networks (PGNs) (Barrera et al, 2007), which are established on some axioms. In the SFFS-BA search algorithm, it is assumed that the axioms for PGNs are already defined and two new assumptions are made:
• For each target gene, adding a new predictor in the subset of predictors, which has a cardinality greater than 1, there must be a gain of information in predicting the target gene if the chosen predictor is a part of true subset of predictors for the target gene. If the information gain with the inclusion of a new predictor in its subset of predictors is very poor then the predictor can-not be part of the subset of the true predictors or there is not enough data to perform the prediction. In both the cases, the inclusion of the predictor in the subset of predictors should be avoided.
• The network topology follows a power law of connections distribution, which means it is a scale-free network.
By considering PGN model and these two new assumptions, the main contri-bution of this method is to include structural information as a priori knowledge, and therefore it can perform a search in a reduced search space and achieve better results. The heuristic is based on the idea that genes without predictive genes tend to show a random behavior, while genes with real predictors tend to show a more ordered behavior. Thus, it is possible to expect that a gene with no real predictors in a GRN presents small variation in the criterion function, when trying to identify a possible predictor for it. On the other hand, when a target gene has a real predic-tor, it is expected a different behavior, especially when including a real predictor in its subset of predictors. In other words, given a target gene with no real predictor, small changes are expected in the criterion function value when new predictors are included in its subset of inferred predictors, as shown in Figure 6.
On the other hand, when a target gene has a real predictor it is expected to show a different behavior, especially when a real predictor is included in its subset of inferred predictors (true positives) as shown in Figure 6 (Normal and IMP - intrin-sically multivariate prediction (Martins Jr et al, 2008)).
Given the first new assumption, the SFFS-BA algorithm performs a search for all individual predictors (best and worst) based on the SFFS-MR1 algorithm (Lopes et al, 2010), considering all the genes of the network. In the second stage, the search is performed again for all the genes, but the algorithm chooses target genes that provides
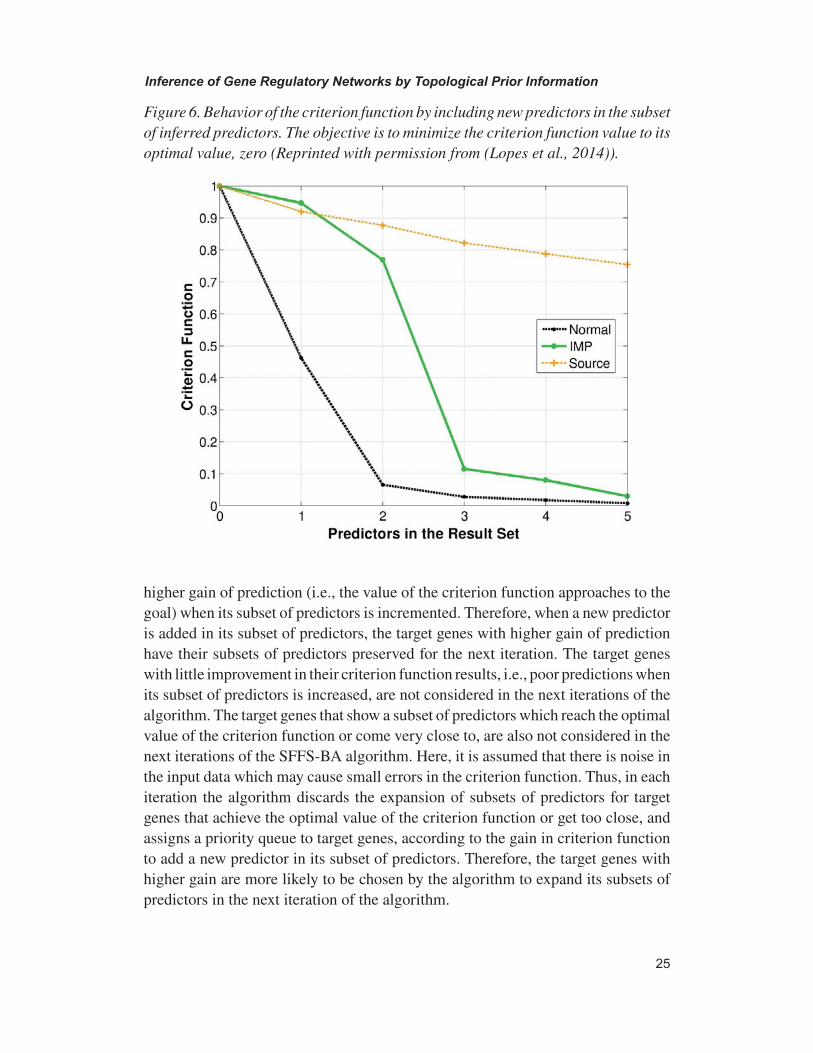
higher gain of prediction (i.e., the value of the criterion function approaches to the goal) when its subset of predictors is incremented. Therefore, when a new predictor is added in its subset of predictors, the target genes with higher gain of prediction have their subsets of predictors preserved for the next iteration. The target genes with little improvement in their criterion function results, i.e., poor predictions when its subset of predictors is increased, are not considered in the next iterations of the algorithm. The target genes that show a subset of predictors which reach the optimal value of the criterion function or come very close to, are also not considered in the next iterations of the SFFS-BA algorithm. Here, it is assumed that there is noise in the input data which may cause small errors in the criterion function. Thus, in each iteration the algorithm discards the expansion of subsets of predictors for target genes that achieve the optimal value of the criterion function or get too close, and assigns a priority queue to target genes, according to the gain in criterion function to add a new predictor in its subset of predictors. Therefore, the target genes with higher gain are more likely to be chosen by the algorithm to expand its subsets of predictors in the next iteration of the algorithm.
Figure 6. Behavior of the criterion function by including new predictors in the subset of inferred predictors. The objective is to minimize the criterion function value to its optimal value, zero (Reprinted with permission from (Lopes et al., 2014)).

In this context, the topology of scale-free networks and the assumption of the gain in function criteria while adding new predictors are considered in the SFFS-BA algorithm. This helps to integrate knowledge as a priori information and guide the search process in the inference of GRNs from expression profiles.
The scale-free topology, defined in the second new assumption and characterized by a power law P(k)≈k–γ in its connections distribution, is used by the algorithm as a limiter or “pruning” of the number of target genes that are chosen for the expan-sion of its subsets of inferred predictors at each iteration. Therefore, the number of target genes, considered for expansion at each iteration of the algorithm, is also governed by a power law.
Algorithms 1 and 2 together (Figures 7 and 8, respectively), present the formal-ization of the SFFS-BA approach. Algorithm 1 (Figure 7) starts by considering all the available samples of the target gene and its expression values. The initial itera-tion, i.e., k = 1, is aimed to select the individual predictors for all target genes. In this regard, the SFFS-BA (Algorithm 2 in Figure 8) is applied to identify the best individual inferred predictors for each of the target genes, which are classified ac-cording to the adopted criterion function.
An important aspect in the SFFS-BA feature selection method is that the algo-rithm will explore the search space in steps, i.e., the predictors are chosen itera-
Figure 7. Algorithm 1 - Network InferenceReprinted with permission from Lopes, Martins Jr and Barrera, Cesar Jr, (2014a)

tively by considering the cardinality parameter k. Another feature is that for k = 1, the SFFS-BA algorithm returns all subsets of predictors and their criterion function values to explore all individual predictors in the next iteration and to recover the predictors of IMP genes more precisely.
Considering the subsets of inferred predictors with cardinality k > 1, the SFFS-BA algorithm runs by considering only the best subset of inferred predictors for each target gene, assuming that some of the true predictors may already be in the subset of selected predictors. At the end of each iteration of Algorithm 3.1, the target genes are sorted by its prediction gain variation by including a new predictor in its subset of inferred predictors. The number of target genes to be considered in the next iteration of the algorithm is updated according to a power law given by n←n×k–γ and the cardinality of the subset of predictors is incremented (k+1). Therefore, in the next iterations (i.e., k > 1) the algorithm will consider only the n target genes with higher prediction gains, and will increment the cardinality k of its
Figure 8. Algorithm 2 – SFFS-BAReprinted with permission from Lopes, Martins Jr and Barrera, Cesar Jr, (2014a)

subset of predictors. It is important to note that if a target gene reaches the optimal value of the criterion function, or is close enough, it is not considered to increase the cardinality of its subset of predictors. The search is performed until the stop condition, n < 1, is reached.
In summary, the SFFS-BA algorithm differs from SFFS algorithm (Pudil et al, 1994) in operating the combinations of subsets of cardinality k < 3 and in the inclusion of a factor that reduces the search space based on the assumption that the expression data (input data) are generated from the genetic interrelationships that originate from a scale-free network. The parameter, exps, corresponds to a set of gene expression profiles where the genes are typically arranged in rows and the experiments in columns to form a matrix. The parameter γ is a constant which determines the exponential decay of the number of target genes in the next iteration of the algorithm.
In Lopes et al., 2014, the constants γ and Δ are chosen as 2.5 and 0.05, repectively. The value of the constant γ is chosen as the average value found in the literature for this constant. The work presented in Jeong et al., 2000, pointed out that the scale-free topology is suitable to represent the metabolic network of the Escherichia coli, which has a probability distribution on its connections well approximated by a power law with constant γ = 2.2. In some investigations (Jeong et al, 2001; Boccaletti, Latora, Moreno, Chavez, & Hwang, 2006) the probability distribution of the interactions, for a given yeast protein with k other proteins, follows a power law with γ = 2.4. In general, it can be seen that the distributions available in the literature for the con-nections in the various networks such as the Internet, human collaboration networks and metabolic networks follow a power law decay of the number of elements while increasing the number of connections, usually in finding the value of the constant (decay exponent) in the range 2 < γ < 3 (Albert & Barabasi, 2002; Albert, 2005).
The work described in Lopes et al., 2014, presents some application and results of the SFFS-BA approach. Finally, it is possible to find a new approach for GRNs inference by considering the small-world network topology in Vicente & Lopes, 2014.
An important trend to overcome the GRN inference issues like accuracy of predic-tion is to integrate several types of molecular biology data sources (omics) such as genomic (SNPs, CNVs, etc), transcriptomic (gene expression), proteomic (PPI networks and protein similarity relations), metabolomic and epigenomic (Ray et al, 2009, Lopes et al., 2014b). Several researchers (Cui et al, 2010; De Haan et al, 2010; Macintyre et al, 2010) pointed out that true gene relations can be predicted more accurately if a higher number of biological data sources are used in gene in-
ference methods. While biological information is incorporated in gene regulatory networks in (Ernst et al, 2008; Seok et al, 2010) to discover transcriptional regulation relationships, others (Troyanskaya, 2005; Karlebach & Shamir, 2008; Baumbach et al, 2009, Hecker et al, 2009, Ray et al, 2009, Ray, Bandyopadhyay, & Pal; Vicente & Lopes, 2012) integrate different biological data for predicting gene relations. In our recent investigations the following data sources are mainly used for integration and discovering new knowledge in GRN frameworks:
Gene Expression: It is a measure which represents the degree of activity of a gene in a cell during various biological processes like cell division, DNA metabolism etc. The technology that enables to measure this activity of thousands of genes simul-taneously is the microarray which contains thousands of spots representing those genes. During microarray preparation mRNAs, representing genes, are extracted from cells and are converted into cDNAs using reverse transcription and colored with a fluorescent dye to measure the intensity level. The intensity level gives the amount of expressed genes as compared to unexpressed ones which are colored with another dye. Similar experiments are performed at various time points with all the genes and the time series data is prepared. For example, the All Yeast data (Eisen, Spellman, Brown, & Botstein, 1998) (http://rana.lbl.gov./EisenData.htm), has 6221 genes and 80 time points and can be used for yeast functional analysis. The similar-ity between two genes can be extracted by computing Pearson correlation between their gene expression profiles. The value lies within -1 to 1.
Phenotypic Profile: The phenotypic profiles method is first demonstrated by Brown et al (2006) by using genes of budding yeast. The method proceeds by ho-mozygous deletion of nonessential genes which respond to agents like cytotoxic or cytostatic. The function analysis of genes is performed by hierarchical clustering of the quantitative sensitivity profiles of the 4756 strains. From the analysis they observed that 860 un-annotated genes are grouped with known genes in various clustering solutions. This in turn helped to predict the function of unknown genes from the functional enrichment (using p-value) of known genes in a given cluster. This phenotypic profile data can be used in a very similar way as gene expression data to extract similarity between any two genes using Pearson correlation.
KEGG pathway: The Kyoto Encyclopedia of Genes and Genomes (KEGG) data-base (Kanehisa et al, 2010) is a collection of all pathway profiles of genes for many species. There are more than 200 subprofiles under the main profiles metabolism, genetic information processing, environmental information processing and cellular processes. This pathway information can be converted to numerical information by constructing profile vectors for each gene/protein where each component will be marked with 0 or 1 depending on whether that gene/protein participates in a particular sub pathway profile or not. For a particular species, the participation of a protein in a pathway can be predicted by downloading all the protein sequences,
except for that species, corresponding to that pathway from Protein Information Resource (PIR) database and comparing them with the target protein using BLAST (Altschul, Gish, Miller, Myers, & Lipman, 1990). The degree of similarity between two proteins can be predicted by computing the ratio of dot product value and OR value between their pathway profiles.
Protein Similarity through Transitive Homology: At the present scenario, the relations discovered by direct similarity search are already known to the research community and one should not expect anything new from this relations. On the other hand, protein transitive homologues (Ma, Chim, Cai, Szustakowski, & Nirmala, 2005; Park et al, 1998) can reveal the relationship between two proteins which can-not be realized by searching direct sequence similarity/homology. This technique works as follows: first, for a given sequence, its homologues are searched within a database and then within the same database homologues of these homologues are pointed out which serve as transitive homologues of the given sequence. As a typi-cal database one can use the sequences available from the UniProt (Bairoch et al, 2005). Further precautions should be taken in the search process such as a threshold of 200 residues on total length of the protein alignment to avoid homology arising from conserved domains. Further, the similarities arising from the raw BLAST score should be normalized within 0 to 1 to make them usable for computing transitive homology scores. For example, consider that an intermediate sequence Y identifies a transitive homology relation between sequence X and Z. Let us consider that the direct normalized BLAST score similarities B(X,Y), B(Y,Z) and B(X,Z) are 0.7, 0.8 and 0.1, respectively. The direct homology between sequence X and Z is very low and cannot be used for further similarity analysis. But interestingly the transitive homology between X and Z can be computed as 0.7 x 0.8 = 0.56 which indicates a strong transitive relation between X and Z. The basic idea behind this relation is that, these two sequences (X and Z) are thought to be a part of the larger sequence Y and they separated with the evolutionary process of the original sequence Y. In many cases the transitive homologues are seen to identify new relations better than the direct homology search (Park et al, 1998).
Protein-Protein Interaction: Protein interactions assemble the molecular machines of the cell and represent the dynamics of virtually all cellular responses (Pawson & Nash, 2003). It takes place by physical contacts between two or more proteins as a result of some biochemical or electrostatic process. The results of such interac-tion can be observed in the formation of homo-oligomeric or hetero-oligomeric or enzyme-inhibitor or antibody-antigen complexes which can be stable or transient. Interactions can occur between domain-peptide and domain-domain. In the manual curation process the interactions can be of many type such as growth defect, co-crystal structure, co-purification, co-fractionation, phenotypic enhancement and suppression, affinity capture, two-hybrid, synthetic lethality and protein-peptide experiments.
These interactions can be useful in constructing GRNs and protein-protein maps in the cell and are represented by binary values 1 or 0, depending on the availability of interaction. There are several databases like BioGRID (Stark et al, 2006) where known protein-protein interactions are manually curated and preserved. For example, there are more than 0.3 million yeast protein-protein interactions are available in the BioGRID database which are collected from aforementioned interactions.
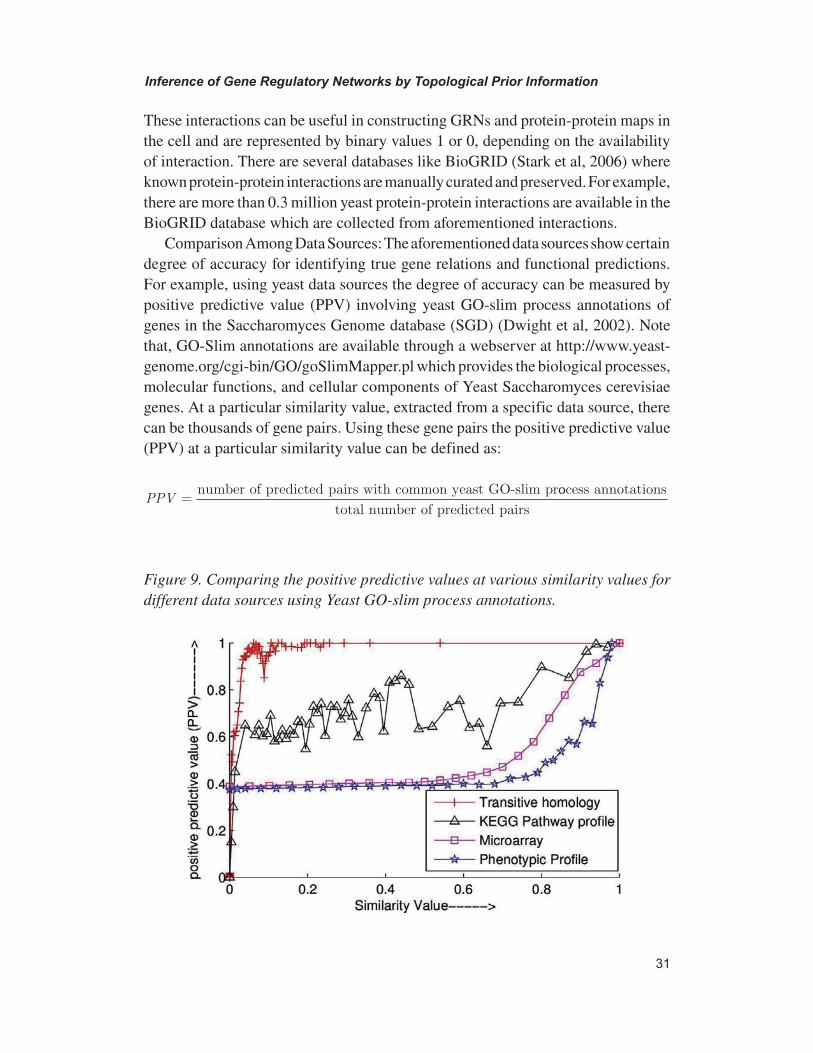
Comparison Among Data Sources: The aforementioned data sources show certain degree of accuracy for identifying true gene relations and functional predictions. For example, using yeast data sources the degree of accuracy can be measured by positive predictive value (PPV) involving yeast GO-slim process annotations of genes in the Saccharomyces Genome database (SGD) (Dwight et al, 2002). Note that, GO-Slim annotations are available through a webserver at http://www.yeast-genome.org/cgi-bin/GO/goSlimMapper.pl which provides the biological processes, molecular functions, and cellular components of Yeast Saccharomyces cerevisiae genes. At a particular similarity value, extracted from a specific data source, there can be thousands of gene pairs. Using these gene pairs the positive predictive value (PPV) at a particular similarity value can be defined as:
PPV =number of predicted pairs with common yeast GO-slim proocess annotations
total number of predicted pairs
Figure 9. Comparing the positive predictive values at various similarity values for different data sources using Yeast GO-slim process annotations.

Computational methods have begun to forge connections between cellular events and to foster numerous hypotheses on gene functions. While gene expressions and phenotypic profiles can be used for hypothesis generation, a higher degree of specificity is needed for tasks like gene function prediction and gene regulatory network inference. This can be achieved by the integration of several data sources. However a key requirement to integrate heterogeneous data sources is that different data sources should have a unified observational scale such as PPV’s as mentioned in the previous section. This allows us to directly compare and integrate the differ-ent types of datasets. The PPV reflects the accuracy of data sets, but do not provide any information about relative importance of one data source in presence of the other data sources. Here we describe the method in Ray, Bandyopadhyay, & Pal, 2009 which is focused on integrating information from data sources in a weighted arithmetic mean framework. A `Biological Score’ score, called BS is developed, where, PPVs computed from phenotypic similarity (P), gene expression similarity (G), KEGG pathway profile similarity (K), protein similarity through transitive homologue (B), and protein-protein interaction information (I) between two genes X and Y are integrated through weights a, b, c, d, and e in a linear combination style. This score is referred to as Biological Score (BS) and is defined as
BS a P b G c K d B e Ia b c d e
=× + × + × + × + ×
+ + + +
where a, b, c, d, and e are varied within range 0 to 100 in steps of 0.1 to find a combination that maximizes the PPV of BS for a user defined number of top gene pairs. Note that, the weights a, b, c, d, and e are assigned to the complete PPV matrices calculated from individual data sources. Intuitively, more important data sources should be assigned larger weights than less important ones, while irrelevant ones should be assigned zero weight. The following steps are used to estimate the weight factors in the BS:
Step 1: All the factors are assigned an initial value of 1.Step 2: BS values are calculated for all the gene pairs and sorted in descending order
to identify the gold standard cut-off value above which the top 26432 gene pairs are available. The gold standard cut-off value and gold standard of top gene pairs are determined from KEGG pathway profiles, which provides 26432 gene pairs with similarity value 1 and constant PPV of 0.81. These gene pairs

are the most predictive of all, whereas the PPV of other data sources, as well as gene pairs below top 26432 for KEGG pathway profiles, vary considerably.
Step 3: PPV is calculated for the top 26432 gene pairs.Step 4: The weight factors are now varied in steps of 0.1 and the steps from 2 to 3
are repeated to find a combination of weights for which the PPV is maximized.
Some typical instances in the exhaustive search process, showing the variation of PPV of BS for different sets of weight coefficients, ranging from 0 to 100, in steps of 1, are shown in Figure 10. Yeast GO-Slim process annotations are used in determining the PPVs.
Once the weights are finalized (optimized) BS can be used for GRN inference. To infer GRN here we discuss the methodology developed in Lopes, Ray, Hashi-
Figure 10. Comparing the values of PPV using BS, by varying weight coefficients of PPV of different data sources for top 24632 gene pairs. When a particular coef-ficient is varied the others are kept constant at the values shown in the figure.

moto, & Cesar Jr., 2014b, called Entropic Biological Score (EBS). It linearly com-bines the mean conditional entropy (MCE) (Section 2.3.4.2) from expression levels and the aforementioned Biological Score (BS). The process of combining is similar to that of combining multiple data sources in BS. The best results for EBS are ob-tained by considering the weights as 0.2 and 0.8 for MCE and BS, respectively, where approximately 40% of the inferred connections are found to be correct and significantly better than related methods like MRNET, ARACNE and CLR. The EBS is validated with the Cell Cycle related functional annotation information, available from Munich Information Center for Protein Sequences (MIPS). Some typical results, are shown in Figures 11 and 12 which indicate that expression pro-file is able to recover some true connections that are not present in biological an-notations, thus leading to the possibility of discovering new relations between its genes.
Figure 11. Applying similarity measure,Similarity A B PPV A B Sensitivity A B( , ) ( , ) ( , )= × , obtained by SFS, SFFS, and SFFS-BA (Lopes et al, 2014a), to infer network edges from expression profiles with different numbers of time points (signal size).
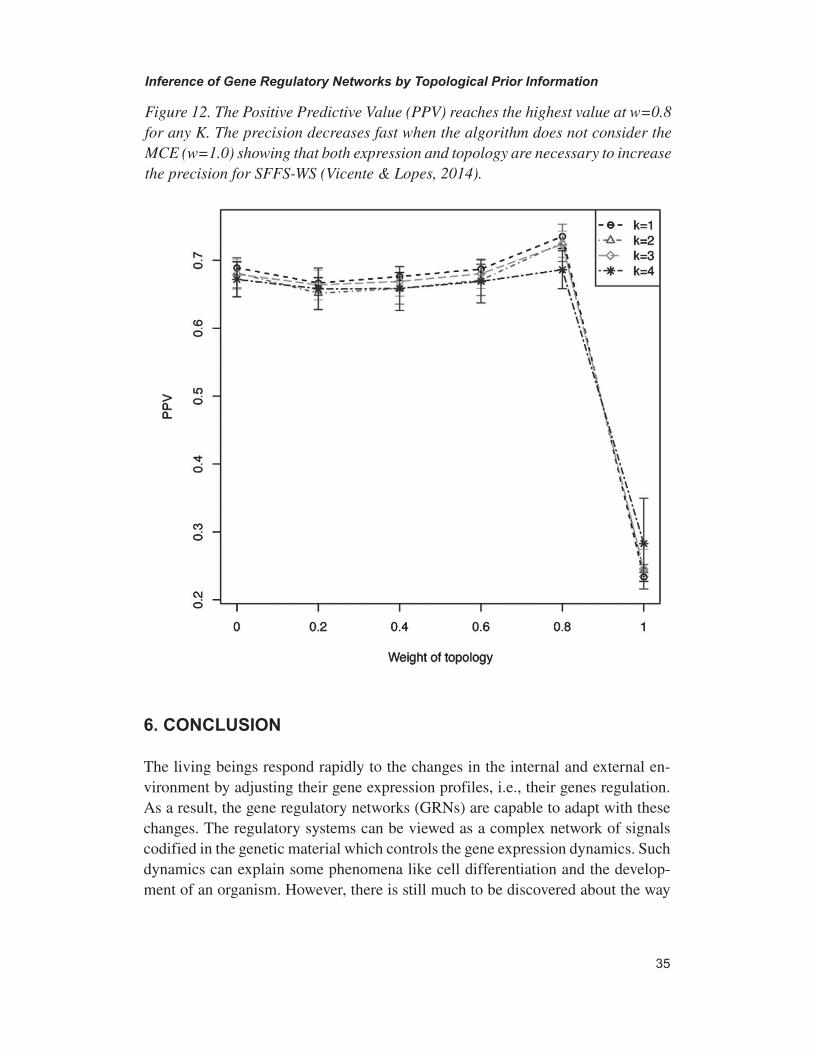
The living beings respond rapidly to the changes in the internal and external en-vironment by adjusting their gene expression profiles, i.e., their genes regulation. As a result, the gene regulatory networks (GRNs) are capable to adapt with these changes. The regulatory systems can be viewed as a complex network of signals codified in the genetic material which controls the gene expression dynamics. Such dynamics can explain some phenomena like cell differentiation and the develop-ment of an organism. However, there is still much to be discovered about the way
Figure 12. The Positive Predictive Value (PPV) reaches the highest value at w=0.8 for any K. The precision decreases fast when the algorithm does not consider the MCE (w=1.0) showing that both expression and topology are necessary to increase the precision for SFFS-WS (Vicente & Lopes, 2014).
by which these alterations in the transcripts and proteins production are related and regulated along time. To comprehend this regulatory system is crucial and it is one of the main concerns of the Systems Biology studies.
Although a myriad of models and methods for identification of GRNs based on gene expression profiles has been proposed in the literature, generally the in-formation required to validate the inferred network is incomplete or unknown. To circumvent this problem, a recent trend in the literature is to incorporate other types of information such as global and local topological properties found in biological networks, and to integrate other omics data with the traditional transcriptomic data.
Regarding the inclusion of topological properties to improve the GRN inference methods, an interactive and floating search strategy, which includes the hypothesis that GRNs possess scale free topology as prior information in the inference process (Lopes et al, 2014a), is discussed in this chapter in some details. This method is adequate and efficient to infer GRNs from temporal gene expression signals hav-ing small number of samples and a huge number of genes. Such method, called SFFS-BA, explores the scale free property by pruning the search space based on the power law function where the number of gene targets, chosen to grow their sets of predictors, decreases at each step according to this function. SFFS-BA provides better results in terms of similarity than SFFS-MCE, which does not include any prior topological information. Besides, a method which includes small world features as prior information, called SFFS-WS (Vicente & Lopes, 2014), is recently developed, showing encouraging results as showed in Figures 11 and 12.
In predicting GRNs, the accuracy of biological data sources as well as the integration of several data sources are also very important (Lopes et al, 2014b). Protein similarity through transitive homology and KEGG pathway profiles should be given more importance than gene expression and phenotypic profiles. In other words, one should design a supervised GRN inference method using multiple heterogeneous data sources in such a way that the system itself should give more importance to data sources with higher positive predictive values (PPVs) by using this information. Further, from the analysis discussed in this chapter, it is clear that the performance of a GRN inference method using single data sources will be in decreasing order for data sources like protein similarity through transitive homology, KEGG pathway profiles, gene expression and phenotypic profiles. Its performance will be much improved if all the data sources are used together where each data source will cover the limitation and low PPV gene relations of other data sources. The challenge to the researchers will be in designing a better system to take care of the aforementioned PPV related factors. Note that, protein-protein interaction in general cannot be used alone to design a GRN as the database does not cover the relations for all possible gene pairs.

Aittokallio, T., & Schwikowski, B. (2006). Graph-based methods for analysing networks in cell biology. Briefings in Bioinformatics, 73(3), 243–255. doi:10.1093/bib/bbl022 PMID:16880171
Akutsu, T., Miyano, S., & Kuhara, S. (2000). Inferring qualitative relations in ge-netic networks and metabolic pathways. Bioinformatics (Oxford, England), 16(8), 727–734. doi:10.1093/bioinformatics/16.8.727 PMID:11099258
Albert, R. (2005). Scale-free networks in cell biology. Journal of Cell Science, 118(21), 4947–4957. doi:10.1242/jcs.02714 PMID:16254242
Albert, R., & Barabasi, A. L. (2002). Statistical mechanics of complex networks. Reviews of Modern Physics, 74(1), 47–97. doi:10.1103/RevModPhys.74.47
Albert, R., Jeong, H., & Barabási, A. L. (2001). Error and attack tolerance of com-plex networks. Nature, 409(6819), 542. doi:10.1038/35054111 PMID:10935628
Alon, U. (2007). Network motifs: Theory and experimental approaches. Nature Reviews. Genetics, 8(6), 450–461. doi:10.1038/nrg2102 PMID:17510665
Altschul, S. F., Gish, W., Miller, W., Myers, E. W., & Lipman, D. J. (1990). Ba-sic local alignment search tool. Journal of Molecular Biology, 215(3), 403–410. doi:10.1016/S0022-2836(05)80360-2 PMID:2231712
Anastassiou, D. (2007). Computational analysis of the synergy among multiple interacting genes. Molecular Systems Biology, 3, 83. doi:10.1038/msb4100124 PMID:17299419
Andrecut, M., Huang, S., & Kauffman, S. (2008). Heuristic approach to sparse ap-proximation of gene regulatory networks. Journal of Computational Biology, 15(9), 1173–1186. doi:10.1089/cmb.2008.0087 PMID:18844584
Andrecut, M., & Kauffman, S. (2008). On the sparse reconstruction of gene net-works. Journal of Computational Biology, 15(1), 21–30. doi:10.1089/cmb.2007.0185 PMID:18257675
Ashburner, M., Ball, C. A., Blake, J. A., Botstein, D., Butler, H., Cherry, J. M., & Sherlock, G. (2000). Gene Ontology: Tool for the unification of biology. Nature Genetics, 25(1), 25–29. doi:10.1038/75556 PMID:10802651
Bairoch, A., Apweiler, R., Wu, C. H., Barker, W. C., Boeckmann, B., Ferro, S., & Yeh, L. S. et al. (2005). The universal protein resource (UniProt). Nucleic Acids Research, 33(Database issue), 154–159. doi:10.1093/nar/gki070 PMID:15608167

Barabasi, A. L. (2002). Linked: How Everything Is Connected to Everything Else and What It Means. Perseus.
Barabasi, A. L. (2009). Scale-Free Networks: A Decade and Beyond. Science, 325(5939), 412–413. doi:10.1126/science.1173299 PMID:19628854
Barabasi, A. L., & Oltvai, Z. (2004). Network biology: Understanding the cell’s functional organization. Nature Reviews. Genetics, 5(2), 101–113. doi:10.1038/nrg1272 PMID:14735121
Barrera, J., Cesar-Jr, R. M., Martins-Jr, D. C., Vencio, R. Z. N., Merino, E. F., Yamamoto, … Portillo, H. A. (2007). Constructing probabilistic genetic networks of Plasmodium falciparum, from dynamical expression signals of the intraerythrocytic development cycle. In P. McConnell, S. M. Lin, & P. Hurban (Eds.), Methods of Microarray Data Analysis V (pp. 11-26). Springer.
Baumbach, J., Tauch, A., & Rahmann, S. (2009). Towards the integrated analysis, visualization and reconstruction of microbial gene regulatory networks. Briefings in Bioinformatics, 10(1), 75–83. doi:10.1093/bib/bbn055 PMID:19074493
Benson, D. A., Karsch Mizrachi, I., Lipman, D. J., Ostell, J., & Wheeler, L. (2008). GenBank. Nucleic Acids Research, 36(suppl 1), D25–D30. doi:10.1093/nar/gkm929 PMID:18073190
Boccaletti, S., Latora, V., Moreno, Y., Chavez, M., & Hwang, D. U. (2006). Com-plex networks: Structure and dynamics. Physics Reports, 424(4-5), 4–5, 175–308. doi:10.1016/j.physrep.2005.10.009
Borelli, F. F., Camargo, R. Y., Martins, D. C. Jr, & Rozante, L. C. S. (2013). Gene regulatory networks inference using a multi-GPU exhaustive search algorithm. BMC Bioinformatics, 14(Suppl 18), S5. doi:10.1186/1471-2105-14-S18-S5 PMID:24564268
Brown, J. A., Sherlock, G., Myers, C. L., Burrows, N. M., Deng, C., Wu, H. I., & Brown, J. M. et al. (2006). Global analysis of gene function in yeast by quantitative phenotypic proling. Molecular Systems Biology, 2, 1–9. doi:10.1038/msb4100043 PMID:16738548
Butte, A., & Kohane, I. (2000). Mutual information relevance networks: functional genomic clustering using pairwise entropy measurements. In Pacific Symposium on Biocomputing, (pp. 418-429).
Cao, Y., & Samuels, D. C. (2009). Discrete stochastic simulation methods for chemically reacting systems. Methods in Enzymology, 454, 115–140. doi:10.1016/S0076-6879(08)03805-6 PMID:19216925
Charbonnier, C., Chiquet, J., & Ambroise, C. (2010). Weighted-lasso for structured network inference from time course data. Statistical Applications in Genetics and Molecular Biology, 9(1), 15.
Chen, T., He, H. L., & Church, G. M. (1999). Modeling gene expression with dif-ferential equations.Pacific Symposium on Biocomputing, (pp. 29-40).
Christley, S., Nie, Q., & Xie, X. (2009). Incorporating existing network information into gene network inference. PLoS ONE, 4(8), e6799.
Costa, L. F., Rodrigues, F. A., & Cristino, A. S. (2008). Complex networks: The key to systems biology. Genetics and Molecular Biology, 31(3), 591–601. doi:10.1590/S1415-47572008000400001
Cui, X., Wang, T., Chen, H. S., Busov, V., & Wei, H. (2010). Tf-finder: A software package for identifying transcription factors involved in biological processes using microarray data and existing knowledge base. BMC Bioinformatics, 11(1), 425. doi:10.1186/1471-2105-11-425 PMID:20704747
D’Angelo, C., Kilian, J., Kudla, J., Batistic, O., & Weinl, S. (2009). The Arabidopsis Information Resource. TAIR.
D’haeseleer, P., Liang, S., & Somogyi, R. (2000). Genetic network inference: From co-expression clustering to reverse engineering. Bioinformatics (Oxford, England), 16(8), 707–726. doi:10.1093/bioinformatics/16.8.707 PMID:11099257
Da Silva, E., & Stumpf, P. (2005). Complex networks and simple models in biology. Journal of the Royal Society, 2(5), 419-430.
Davidson, C. (2010). Identifying gene regulatory networks using evolutionary al-gorithms. Journal of Computing Sciences in Colleges, 25(5), 231–237.
De Haan, J., Piek, E., van Schaik, R., de Vlieg, J., Bauerschmidt, S., Buydens, L., & Wehrens, R. (2010). Integrating gene expression and GO classification for PCA by preclustering. BMC Bioinformatics, 11(1), 158. doi:10.1186/1471-2105-11-158 PMID:20346140
De Jong, H. (2002). Modeling and Simulation of Genetic Regulatory Sys-tems: A Literature Review. Journal of Computational Biology, 9(1), 67–103. doi:10.1089/10665270252833208 PMID:11911796

de Smet, R., & Marchal, K. (2010). Advantages and limitations of current network inference methods. Nature Reviews. Microbiology, 8(10), 717–729. PMID:20805835
Dougherty, E. R., Brun, M., Trent, J., & Bittner, M. L. (2009). A Conditioning-Based Model of Contextual Regulation. IEEE/ACM Transactions on Computational Biology and Bioinformatics, 6(2), 310–320. doi:10.1109/TCBB.2007.70247 PMID:19407354
Dwight, S. S., Harris, M. A., Dolinski, K., Ball, C. A., Binkley, G., Christie, K. R., & Cherry, J. M. et al. (2002). Saccharomyces genome database (SGD) provides secondary gene annotation using the gene ontology (GO). Nucleic Acids Research, 30(1), 69–72. doi:10.1093/nar/30.1.69 PMID:11752257
Eisen, M. B., Spellman, P. T., Brown, P. O., & Botstein, D. (1998). Cluster analysis and display of genome-wide expression patterns. Proceedings of the National Acad-emy of Sciences of the United States of America, 95(25), 14863–14868. doi:10.1073/pnas.95.25.14863 PMID:9843981
Ernst, J., Beg, Q. K., Kay, K. A., Balazsi, G., Oltvai, Z. N., & Bar-Joseph, Z. (2008). A semi-supervised method for predicting transcription factor-gene interactions in Escherichia coli. PLoS Comput Biol, 4(3), e1000044.
Faith, J., Hayete, B., Thaden, J., Mogno, I., Wierzbowski, J., Cottarel, G., & Gard-ner, T. S. et al. (2007). Large-scale mapping and validation of escherichia coli transcriptional regulation from a compendium of expression proles. PLoS Biology, 5(1), 259–265. doi:10.1371/journal.pbio.0050008 PMID:17214507
Fall, C., Marland, E., Wagner, J., & Tyson, J. (Eds.). (2002). Computational Cell Biology. New York: Springer.
Farkas, I. J., Jeong, H., Vicsek, T., Barabási, A.-L., & Oltvai, Z. N. (2003). The topology of the transcription regulatory network in the yeast, saccharomyces cere-visiae. Physica A: Statistical Mechanics and its Applications, 318(3-4), 601–612.
Friedman, N., Linial, M., Nachman, I., & Pe’er, D. (2000). Using Bayesian networks to analyze expression data. Journal of Computational Biology, 7(3-4), 601–620. doi:10.1089/106652700750050961 PMID:11108481
Garey, M. R., & Johnson, D. S. (1979). Computers and intractability: a guide to the theory of NP-completeness. San Francisco: WH Freeman & Co.
Goemann, B., Wingender, E., & Potapov, A. (2009). An approach to evaluate the topological significance of motifs and other patterns in regulatory networks. BMC Systems Biology, 3(1), 53. doi:10.1186/1752-0509-3-53 PMID:19454001
Goss, P. J., & Peccoud, J. (1998). Quantitative modeling of stochastic systems in molecular biology by using stochastic Petri nets. Proceedings of the National Acad-emy of Sciences of the United States of America, 95(12), 6750–6755. doi:10.1073/pnas.95.12.6750 PMID:9618484
Greller, L. D., & Somogyi, R. (2002). Reverse engineers map the molecular switching yards. Trends in Biotechnology, 20(11), 445–447. doi:10.1016/S0167-7799(02)02051-6 PMID:12413811
Guelzim, N., Bottani, S., Bourgine, P., & Képès, F. (2002). Topological and causal structure of the yeast transcriptional regulatory network. Nature Genetics, 31(1), 60–63. doi:10.1038/ng873 PMID:11967534
Hardy, S., & Robillard, P. N. (2004). Modeling and simulation of molecular biology systems using petri nets: Modeling goals of various approaches. Journal of Bioinfor-matics and Computational Biology, 2(4), 595–613. doi:10.1142/S0219720004000764 PMID:15617157
Hecker, M., Lambeck, S., Toepfer, S., van Someren, E., & Guthke, R. (2009). Gene regulatory network inference: Data integration in dynamic models-a review. Bio Systems, 96(1), 86–103. doi:10.1016/j.biosystems.2008.12.004 PMID:19150482
Hegland, M., Burden, C., Santoso, L., MacNamara, S., & Booth, H. (2007). A solver for the stochastic master equation applied to gene regulatory networks. Jour-nal of Computational and Applied Mathematics, 205(2), 708–724. doi:10.1016/j.cam.2006.02.053
Holland, J. H. (1992). Adaptation in Natural and Artificial Systems. MIT Press.
Hovatta, I., Kimppa, K., Lehmussola, A., Pasanen, T., Saarela, J., Saarikko, I., … Laine, M. (2005). DNA microarray data analysis (2nd ed.). CSC - Scientific Computing Ltd.
Ideker, T. E., Thorsson, V., & Karp, R. M. (2000). Discovery of regulatory interac-tions through perturbation: inference and experimental design.Pacific Symposium on Biocomputing, (vol. 5, pp. 302-313).
Jain, A. K., Duin, R. P. W., & Mao, J. (2000). Statistical Pattern Recognition: A Review. IEEE Transactions on Pattern Analysis and Machine Intelligence, 22(1), 4–37. doi:10.1109/34.824819
Jeong, H., Mason, S. P., Barabási, A. L., & Oltvai, Z. N. (2001). Lethality and centrality in protein networks. Nature, 411(6833), 41–42. doi:10.1038/35075138 PMID:11333967

Jeong, H., Tombor, B., Albert, R., Oltvai, Z. N., & Barabási, A.-L. (2000). The large-scale organization of metabolic networks. Nature, 407(6804), 651–654. doi:10.1038/35036627 PMID:11034217
Jimenez, R. D., Martins, D. C. Jr, & Santos, C. S. (2014). Gene networks inference through one genetic algorithm per gene. In 14th IEEE International Conference on Bioinformatics and Bioengineering Conference (BIBE). Boca Raton, FL: IEEE. doi:10.1109/BIBE.2014.9
Kanehisa, M., Goto, S., Furumichi, M., Tanabe, M., & Hirakawa, M. (2010). KEGG for representation and analysis of molecular networks involving diseases and drugs. Nucleic Acids Research, 38(suppl 1), D355–D360. doi:10.1093/nar/gkp896 PMID:19880382
Karlebach, G., & Shamir, R. (2008). Modelling and analysis of gene regulatory networks. Nature Reviews. Molecular Cell Biology, 9(10), 770–780. doi:10.1038/nrm2503 PMID:18797474
Kauffman, S. A. (1969). Homeostasis and differentiation in random genetic control networks. Nature, 224(215), 177–178. doi:10.1038/224177a0 PMID:5343519
Kauffman, S. A. (1993). The Origins of Order. Oxford University Press.
Kelemen, A., Abraham, A., & Chen, Y. (2008). Computational Intelligence in Bio-informatics. Springer. doi:10.1007/978-3-540-76803-6
Klamt, S., Saez Rodriguez, J., & Gilles, E. (2007). Structural and functional analysis of cellular networks with cellnetanalyzer. BMC Systems Biology, 1(1), 2.
Knabe, J. F., Wegner, K., Nehaniv, C. L., & Schilstra, M. J. (2010). Genetic algo-rithms and their application to in silico evolution of genetic regulatory networks. Methods in Molecular Biology (Clifton, N.J.), 673, 297–321. doi:10.1007/978-1-60761-842-3_19 PMID:20835807
Kuchaiev, O., Milenkovic, T., Memisevic, V., Hayes, W., & Przulj, N. (2010). To-pological network alignment uncovers biological function and phylogeny. Journal of the Royal Society, Interface, 7(50), 1341–1354. doi:10.1098/rsif.2010.0063 PMID:20236959
Lacroix, V., Cottret, L., Thébault, P., & Sagot, M.-F. (2008). An introduction to metabolic networks and their structural analysis. IEEE/ACM Transactions on Com-putational Biology and Bioinformatics, 5(4), 594–617. doi:10.1109/TCBB.2008.79 PMID:18989046

Larrañaga, P., Poza, M., Yurramendi, Y., Murga, R. H., & Kuijpers, C. M. H. (1996). Structure learning of bayesian networks by genetic algorithms: A performance analysis of control parameters. IEEE Transactions on Pattern Analysis and Machine Intelligence, 18(9), 912–926. doi:10.1109/34.537345
Lein, E. S., Hawrylycz, M. J., Ao, N., Ayres, M., Bensinger, A., Bernard, A., & Jones, A. R. et al. (2007). Genome-wide atlas of gene expression in the adult mouse brain. Nature, 445(7124), 168–176. doi:10.1038/nature05453 PMID:17151600
Lenas, P., Moos, M. Jr, & Luyten, F. P. (2009). Developmental engineering: A new paradigm for the design and manufacturing of cell-based products. part ii. from genes to networks: Tissue engineering from the viewpoint of systems biology and network science. Tissue Engineering. Part B, Reviews, 15(4), 395–422. doi:10.1089/ten.teb.2009.0461 PMID:19589040
Li, F., Long, T., Lu, Y., Ouyang, Q., & Tang, C. (2004). The yeast cell-cycle net-work is robustly designed. Proceedings of the National Academy of Sciences of the United States of America, 101(14), 4781–4786. doi:10.1073/pnas.0305937101 PMID:15037758
Liang, S., Fuhrman, S., & Somogyi, R. (1998). Reveal: a general reverse engineering algorithm for inference of genetic network architectures. In Proceedings of Pacific Symposium on Biocomputing, (pp. 18-29).
Licata, L., Briganti, L., Peluso, D., Perfetto, L., Iannuccelli, M., Galeota, E., & Cesar-eni, G. et al. (2012). MINT, the molecular interaction database: 2012 update. Nucleic Acids Research, 40(D1), D857–D861. doi:10.1093/nar/gkr930 PMID:22096227
Lopes, F. M., Cesar, R. M. Jr, & Costa, L. F. (2011a). Gene expression complex networks: Synthesis, identification and analysis. Journal of Computational Biology, 18(10), 1353–1367. doi:10.1089/cmb.2010.0118 PMID:21548810
Lopes, F. M., de Oliveira, E. A., & Cesar, R. M. Jr. (2011b). Inference of gene regulatory networks from time series by Tsallis entropy. BMC Systems Biology, 5(1), 61. doi:10.1186/1752-0509-5-61 PMID:21545720
Lopes, F. M., Martins, D. C. Jr, & Barrera, J. (2008). Feature selection environment for genomic applications. BMC Bioinformatics, 9(1), 451. doi:10.1186/1471-2105-9-451 PMID:18945362
Lopes, F. M., Martins, D. C., Jr., Barrera, J., & Cesar, R. M., Jr. (2010). SFFS-MR: a floating search strategy for grns inference. In Pattern Recognition in Bioinformat-ics, Proceedings, (LNCS), (vol. 6282, pp. 407-418). Springer. doi:10.1007/978-3-642-16001-1_35
Lopes, F. M., Martins, D. C. Jr, Barrera, J., & Cesar, R. M. Jr. (2014a). A feature selection technique for inference of graphs from their known topological properties: Revealing scale-free gene regulatory networks. Information Sciences, 272, 1–15. doi:10.1016/j.ins.2014.02.096
Lopes, F. M., Ray, S. S., Hashimoto, R. F., & Cesar, R. M. Jr. (2014b). Entropic biological score: A cell cycle investigation for GRNs inference. Gene, 541(2), 129–137. doi:10.1016/j.gene.2014.03.010 PMID:24631265
Louis, M. & Becskei, A. (2002). Binary and graded responses in gene networks. Science’s Signal Transduction Knowledge Environment, 2002(143), PE33.
Lu, L. and Zhou, T. (2011). Link prediction in complex networks: a survey. Physica A: Statistical Mechanics and its Applications, 390(6), 1150-1170.
Ma, Q., Chirn, G. W., Cai, R., Szustakowski, J. D., & Nirmala, N. (2005). Cluster-ing protein sequences with a novel metric transformed from sequence similarity scores and sequence alignments with neural networks. BMC Bioinformatics, 6. PMID:16202129
Macintyre, G., Bailey, J., Gustafsson, D., Haviv, I., & Kowalczyk, A. (2010). Us-ing gene ontology annotations in exploratory microarray clustering to understand cancer etiology. Pattern Recognition Letters, 31(14), 2138–2146. doi:10.1016/j.patrec.2010.01.006
Maki, Y., Tominaga, D., Okamoto, M., Watanabe, S., & Eguchi, Y. (2001). Develop-ment of a system for the inference of large scale genetic networks.Pacific Symposium on Biocomputing, (pp. 446-458).
Mamakou, M. E., Sirakoulis, G. C., Andreadis, I., & Karafyllidis, I. (2005). Adap-tive reverse engineering of gene regulatory networks using genetic algorithms. In IEEE International Conference on EUROCON.Belgrade: IEEE. doi:10.1109/EURCON.2005.1629947
Manninen, T., Linne, M. L., & Ruohonen, K. (2006). Developing Itô stochastic dif-ferential equation models for neuronal signal transduction pathways. Computational Biology and Chemistry, 30(4), 280–291. doi:10.1016/j.compbiolchem.2006.04.002 PMID:16880117
Marbach, D., Costello, J. C., Küffner, R., Vega, N. M., Prill, R. J., Camacho, D. M., & Zimmer, R. et al. (2012). Wisdom of crowds for robust gene network inference. Nature Methods, 9(8), 796–804. doi:10.1038/nmeth.2016 PMID:22796662

Marbach, D., Prill, R. J., Schaffter, T., Mattiussi, C., Floreano, D., & Stolovitzky, G. (2010). Revealing strengths and weaknesses of methods for gene network inference. Proceedings of the National Academy of Sciences of the United States of America, 107(14), 6286–6291. doi:10.1073/pnas.0913357107 PMID:20308593
Marbach, D., Schaffter, T., Mattiussi, C., & Floreano, D. (2009). Generating realistic in silico gene networks for performance assessment of reverse engineering methods. Journal of Computational Biology, 16(2), 229–239. doi:10.1089/cmb.2008.09TT PMID:19183003
Margolin, A. A., Nemenman, I., Basso, K., Wiggins, C., Stolovitzky, G., Dalla Favera, R., & Calífano, A. (2006). Aracne: An algorithm for the reconstruction of gene regulatory networks in a mammalian cellular context. BMC Bioinformatics, 7(Suppl 1).
Markowetz, F., & Spang, R. (2007). Inferring cellular networks - a review. BMC Bioinformatics, 8(Suppl 6), S5. doi:10.1186/1471-2105-8-S6-S5 PMID:17903286
Martins, D. C. Jr, Braga Neto, U. M., Hashimoto, R. F., Dougherty, E. R., & Bittner, M. L. (2008). Intrinsically Multivariate Predictive Genes. IEEE Journal of Selected Topics in Signal Processing, 2(3), 424–439. doi:10.1109/JSTSP.2008.923841
Martins, D. C. Jr, Cesar, R. M. Jr, & Barrera, J. (2006). W-operator window design by minimization of mean conditional entropy. Pattern Analysis & Applications, 9(2-3), 139–153. doi:10.1007/s10044-006-0031-0
Martins, D. C. Jr, Oliveira, E. A., Braga Neto, U. M., Hashimoto, R. F., & Cesar, R. M. Jr. (2013). Signal propagation in Bayesian networks and its relationship with intrinsically multivariate predictive variables. Information Sciences, 225, 18–34. doi:10.1016/j.ins.2012.10.027
Martone, M. E., Gupta, A., Wong, M., Qian, X., Sosinsky, G., Ludascher, B., & Ellis-man, M. H. (2002). A cell-centered database for electron tomographic data. Journal of Structural Biology, 138(1-2), 1–2, 145–155. doi:10.1016/S1047-8477(02)00006-0 PMID:12160711
Matsuno, H., Inouye, S. T., Okitsu, Y., Fujii, Y., & Miyano, S. (2006). A new regula-tory interaction suggested by simulations for circadian genetic control mechanism in mammals. Journal of Bioinformatics and Computational Biology, 4(1), 139–153. doi:10.1142/S021972000600176X PMID:16568547
Mendes, P., Sha, W., & Ye, K. (2003). Artificial gene networks for objective com-parison of analysis algorithms. Bioinformatics (Oxford, England), 19(Suppl 2), 122–129. doi:10.1093/bioinformatics/btg1069 PMID:14534181
Mendoza, M. R., Lopes, F. M., & Bazzan, A. L. C. (2012). Reverse engineering of grns: An evolutionary approach based on the tsallis entropy. In Proceedings of the 14th international conference on Genetic and evolutionary computation (GECCO). doi:10.1145/2330163.2330190
Mewes, H. W., Ruepp, A., Theis, F., Rattei, T., Walter, M., Frishman, D., & An-tonov, A. et al. (2011). MIPS: Curated databases and comprehensive secondary data resources in 2010. Nucleic Acids Research, 39, D220–D224. doi:10.1093/nar/gkq1157 PMID:21109531
Milo, R., Shann-Orr, S., Itzkovitz, S., Kashtan, N., Chklovskii, D., & Alon, U. (2002). Network motifs: Simple building blocks of complex networks. Science, 298(5594), 824–827. doi:10.1126/science.298.5594.824 PMID:12399590
Mitchell, M. (1996). An introduction to Genetic Algorithms. Cambridge, MA: MIT Press.
Montoya Cubas, C. F., Martins, D. C. Jr, Santos, C. S., & Barrera, J. (2014). Gene networks inference through linear grouping of variables. In 14th IEEE International Conference on Bioinformatics and Bioengineering Conference (BIBE). Boca Raton, FL: IEEE. doi:10.1109/BIBE.2014.10
Narasimhan, S., Rengaswamy, R., & Vadigepalli, R. (2009). Structural properties of gene regulatory networks: Definitions and connections. IEEE/ACM Transac-tions on Computational Biology and Bioinformatics, 6(1), 158–170. doi:10.1109/TCBB.2007.70231 PMID:19179709
Newman, M. E. J. (2003). The structure and function of complex networks. SIAM Review, 45(2), 167–256. doi:10.1137/S003614450342480
Orchard, S., Ammari, M., Aranda, B., Breuza, L., Briganti, L., Broackes Carter, F., & Hermjakob, H. et al. (2014). The MIntAct project - IntAct as a common curation platform for 11 molecular interaction databases. Nucleic Acids Research, 42(D1), D358–D363. doi:10.1093/nar/gkt1115 PMID:24234451
Ott, S., Hansen, A., Kim, S.-Y., & Miyano, S. (2005). Superiority of network motifs over optimal networks and an application to the revelation of gene network evolu-tion. Bioinformatics (Oxford, England), 21(2), 227–238. doi:10.1093/bioinformatics/bth484 PMID:15377501
Park, J., Karplus, K., Barrett, C., Hughey, R., Haussler, D., Hubbard, T., & Cho-thia, C. (1998). Sequence comparisons using multiple sequences detect three times as many remote homologues as pairwise methods. Journal of Molecular Biology, 284(4), 1201–1210. doi:10.1006/jmbi.1998.2221 PMID:9837738
Pawson, T., & Nash, P. (2003). Assembly of cell regulatory systems through protein interaction domains. Science, 300(5618), 445–452. doi:10.1126/science.1083653 PMID:12702867
Pe’er, D., Regev, A., Elidan, G., & Friedman, N. (2001). Inferring subnetworks from perturbed expression profiles. Bioinformatics (Oxford, England), 17(Suppl 1), S215–S224. doi:10.1093/bioinformatics/17.suppl_1.S215 PMID:11473012
Penfold, C. A., Wild, D. L. (2011). How to infer gene networks from expression profiles, revisited. Interface Focus, 1.
Peng, H., Long, F., & Ding, C. (2005). Feature selection based on mutual infor-mation: Criteria of max-dependency, max-relevance, and min-redundancy. IEEE Transactions on Pattern Analysis and Machine Intelligence, 27(8), 1226–1238. doi:10.1109/TPAMI.2005.159 PMID:16119262
Perrin, B. E., Ralaivola, L., Mazurie, A., Bottani, S., Mallet, J., & d’Alché Buc, F. (2003). Gene networks inference using dynamic Bayesian networks. Bioinformat-ics (Oxford, England), 19(Suppl 2), 138–148. doi:10.1093/bioinformatics/btg1071
Pinney, J. W., Westhead, D. R., & McConkey, G. A. (2003). Petri Net representa-tions in systems biology. Biochemical Society Transactions, 31(6), 1513–1515. doi:10.1042/bst0311513 PMID:14641101
Pournara, I., & Wernisch, L. (2004). Reconstruction of gene networks using Bayesian learning and manipulation experiments. Bioinformatics (Oxford, England), 20(17), 2934–2942. doi:10.1093/bioinformatics/bth337 PMID:15180938
Poustelnikova, E., Pisarev, A., Blagov, M., Samsonova, M., & Reinitz, J. (2004). A database for management of gene expression data in situ. Bioinformatics (Oxford, England), 20(14), 2212–2221. doi:10.1093/bioinformatics/bth222 PMID:15059825
Prasad, T. S. K., Goel, R., Kandasamy, K., Keerthikumar, S., Kumar, S., Mathiva-nan, S., & Pandey, A. (2009). Human Protein Reference Database - 2009 update. Nucleic Acids Research, 37(Database), D767–D772. doi:10.1093/nar/gkn892 PMID:18988627
Prifti, E., Zucker, J., Clement, K., & Henegar, C. (2008). Funnet: An integrative tool for exploring transcriptional interactions. Bioinformatics (Oxford, England), 24(22), 2636–2638. doi:10.1093/bioinformatics/btn492 PMID:18799481
Przytycka, T., & Kim, Y. A. (2010). Network integration meets network dynamics. BMC Biology, 8(1), 48. doi:10.1186/1741-7007-8-48 PMID:20513250
Pudil, P., Novovicová, J., & Kittler, J. (1994). Floating search methods in feature-selection. Pattern Recognition Letters, 15(11), 1119–1125. doi:10.1016/0167-8655(94)90127-9
Raser, J. M., & O’Shea, E. K. (2005). Noise in gene expression: Origins, conse-quences, control. Science, 309(5743), 2010–2013. doi:10.1126/science.1105891 PMID:16179466
Ray, S. S., Bandyopadhyay, S., & Pal, S. (2009). Combining multisource information through functional-annotation-based weighting: Gene function prediction in yeast. Biomedical Engineering. IEEE Transactions on, 56(2), 229–236.
Ray, S. S., Bandyopadhyay, S., & Pal, S. (2012). A Weighted power framework for integrating multi-source information: Gene function prediction in yeast. IEEE Transactions on Bio-Medical Engineering, 59(4), 1162–1168. doi:10.1109/TBME.2012.2186689 PMID:22318478
Ristevski, B. (2013). A survey of models for inference of gene regulatory networks. Nonlinear Analysis: Modelling and Control, 18(4), 444–465.
Ruklisa, D., Brazma, A., & Viksna, J. (2005). Reconstruction of gene regulatory networks under the Finite State Linear Model. Genome Informatics, 16(1), 225–236. PMID:16901105
Santos, D. C., Camargo, R. Y., Martins, D. C., Jr., Song, S. W., Rozante, L. C. S., & Borelli, F. F. (2015). A multi-GPU hitting set algorithm for GRNs inference. 15th IEEE/ACM International Symposium on Cluster, Cloud and Grid Computing (CCGrid). Shenzhen, China: IEEE/ACM.
Schena, M., Shalon, D., Davis, R. W., & Brown, P. O. (1995). Quantitative monitor-ing of gene expression patterns with a complementary DNA microarray. Science, 270(5235), 467–470. doi:10.1126/science.270.5235.467 PMID:7569999
Schlitt, T., & Brazma, A. (2007). Current approaches to gene regulatory network modelling. BMC Bioinformatics, 59(Suppl 6). PMID:17903290
Seok, J., Kaushal, A., Davis, R., & Xiao, W. (2010). Knowledge-based analysis of microarrays for the discovery of transcriptional regulation relationships. BMC Bioinformatics, 11(Suppl 1), S8. doi:10.1186/1471-2105-11-S1-S8 PMID:20122245
Shav Tal, Y., Singer, R. H., & Darzacq, X. (2004). Imaging gene expression in single living cells. Nature Reviews. Molecular Cell Biology, 5(10), 855–862. doi:10.1038/nrm1494 PMID:15459666

Shin, A., & Iba, H. (2003). Construction of genetic network using evolution-ary algorithm and combined fitness function. Genome Informatics, 14, 94–103. PMID:15706524
Shmulevich, I., & Aitchison, J. D. (2009). Deterministic and stochastic models of gene regulatory networks. Methods in Enzymology, 467, 335–356. doi:10.1016/S0076-6879(09)67013-0 PMID:19897099
Shmulevich, I., & Dougherty, E. R. (2007). Genomic Signal Processing. Princeton University Press. doi:10.1515/9781400865260
Shmulevich, I., Dougherty, E. R., Kim, S., & Zhang, W. (2002). Probabilistic Boolean networks: A rule-based uncertainty model for gene regulatory networks. Bioinfor-matics (Oxford, England), 18(2), 261–274. doi:10.1093/bioinformatics/18.2.261 PMID:11847074
Smadbeck, P., & Kaznessis, Y. N. (2014). Solution of Chemical Master Equations for Nonlinear Stochastic Reaction Networks. Curr Opin Chem Eng, 5, 90–95. doi:10.1016/j.coche.2014.07.001 PMID:25215268
Snoep, J. L., & Westerhoff, H. V. (2005). From isolation to integration, a systems biology approach for building the Silicon Cell. Topics in Current Genetics, 13, 13–30. doi:10.1007/b106456
Soinov, L. A., Krestyaninova, M. A., & Brazma, A. (2003). Towards reconstruction of gene networks from expression data by supervised learning. Genome Biology, 4(1), R6. doi:10.1186/gb-2003-4-1-r6 PMID:12540298
Stark, C., Breitkreutz, B., Reguly, T., Boucher, L., Breitkreutz, A., & Tyers, M. (2006). BioGRID: A general repository for interaction datasets. Nucleic Acids Research, 34(90001), D535–D539. doi:10.1093/nar/gkj109 PMID:16381927
Steinbach, B., & Posthoff, C. (2012). Sources and Obstacles for Parallelization-a Comprehensive Exploration of the Unate Covering Problem Using Both CPU and GPU. In J. Astola, M. Kameiama, M. Lukac, & M. Stankovic (Eds.), GPU Com-puting with Applications in Digital Logic. Tampere International Center for Signal Processing.
Strogatz, S. H. (2001). Exploring complex networks. Nature, 410(6825), 268–276. doi:10.1038/35065725 PMID:11258382
Styczynski, M. P., & Stephanopoulos, G. (2005). Overview of computational meth-ods for the inference of gene regulatory networks. Engineering, 29(3), 519–534.

Swain, M., Hunniford, T., Dubitsky, W., Mandel, J., & Palfreyman, N. (2005). Reverse-engineering gene-regulatory networks using evolutionary algorithms and grid computing. Journal of Clinical Monitoring and Computing, 19(4-5), 329–337. doi:10.1007/s10877-005-0678-x PMID:16328947
Theodoridis, S., & Koutroumbas, K. (2008). Pattern Recognition (4th ed.). Aca-demic Press.
Thomas, R. (1998). Laws for the dynamics of regulatory networks. The International Journal of Developmental Biology, 42(3), 479–485. PMID:9654035
Thomas, R., Thieffry, D., & Kaufman, M. (1995). Dynamical behaviour of biologi-cal regulatory networks-I. Biological role of feedback loops and practical use of the concept of the loop-characteristic states. Bulletin of Mathematical Biology, 57(2), 247–276. doi:10.1007/BF02460618 PMID:7703920
Troyanskaya, O. G. (2005). Putting microarrays in a context: Integrated analysis of diverse biological data. Briefings in Bioinformatics, 6(1), 34–43. doi:10.1093/bib/6.1.34 PMID:15826355
Ulitsky, I., & Shamir, R. (2007). Identification of functional modules using network topology and high-throughput data. BMC Systems Biology, 1(1), 8. doi:10.1186/1752-0509-1-8 PMID:17408515
Velculescu, V. E., Zhang, L., Vogelstein, B., & Kinzler, K. W. (1995). Serial Analysis of Gene Expression. Science, 270(5235), 484–487. doi:10.1126/science.270.5235.484 PMID:7570003
Vicente, F. F. R., & Lopes, F. M. (2014). SFFS-WS: A feature selection algorithm exploring the smallworld properties of GNs. In Pattern Recognition in Bioinformat-ics, Proceedings, (LNCS), (vol. 8626, pp. 60-71). Berlin: Springer.
Vidal, M. (2005). Interactome modeling. FEBS Letters, 579(8), 1834–1838. doi:10.1016/j.febslet.2005.02.030 PMID:15763560
Voet, D., Voet, J., & Pratt, C. W. (2005). Fundamentals of Biochemistry: Life at the Molecular Level (2nd ed.). John Wiley & Sons.
Wang, Z., Gerstein, M., & Snyder, M. (2009). RNA-Seq: A revolutionary tool for transcriptomics. Nature Reviews. Genetics, 10(1), 57–63. doi:10.1038/nrg2484 PMID:19015660
Werhli, A. V., Grzegorczyk, M., & Husmeier, D. (2006). Comparative evaluation of reverse engineering gene regulatory networks with relevance networks, graphical gaussian models and bayesian networks. Bioinformatics (Oxford, England), 22(20), 2523–2531. doi:10.1093/bioinformatics/btl391 PMID:16844710
Werhli, A. V., & Husmeier, D. (2008). Gene regulatory network reconstruction by bayesian integration of prior knowledge and/or different experimental conditions. Journal of Bioinformatics and Computational Biology, 6(3), 543–572. doi:10.1142/S0219720008003539 PMID:18574862
Xiao, Y. (2009). A tutorial on analysis and simulation of boolean gene regulatory net-work models. Current Genomics, 10(7), 511–525. doi:10.2174/138920209789208237 PMID:20436877
Yu, H., Paccanaro, A., Trifonov, V., & Gerstein, M. (2006). Predicting interactions in protein networks by completing defective cliques. Bioinformatics (Oxford, England), 22(7), 823–829. doi:10.1093/bioinformatics/btl014 PMID:16455753
Zhang, Y., Quian, M., Ouyang, Q., Deng, M., Li, F., & Tang, C. (2006, July). Sto-chastic Model of Yeast Cell-Cycle Network. Physica D. Nonlinear Phenomena, 219(1), 35–39. doi:10.1016/j.physd.2006.05.009
1 SFFS-MR is an algorithm which works similarly to the SFFS algorithm, except that the SFFS-MR search starts by considering multiple roots (the best feature and some worst individual features, relying on the intrinsically multivariate prediction phenomenon which may occur), instead of starting only with the best feature as SFFS does.


![98-366 Slides Lesson 1.ppt · 1hwzrunv duh xvhg wr h[fkdqjh gdwd 5hdo uhdvrqv iru qhwzrunv lqfoxgh ±6kdulqj ±&rppxqlfdwlrq ±2ujdql]dwlrq ±0rqh\ 1hwzrun 'rfxphqwdwlrq ,q rughu](https://img.pdfslide.us/doc/110x75/5b35d86f7f8b9a436d8d90cb/98-366-slides-lesson-1ppt-1hwzrunv-duh-xvhg-wr-hfkdqjh-gdwd-5hdo-uhdvrqv-iru.jpg)


![Public Health and Epidemiology - download.e-bookshelf.de...Epidemiologic Methods. 2. Public Health. 3. Needs Assessment. WA 105] classification not assignedLC 614.4–dc23 2011028910](https://img.pdfslide.us/doc/110x75/5f055a037e708231d4128964/public-health-and-epidemiology-downloade-epidemiologic-methods-2-public.jpg)