Embed Size (px)
Citation preview
1H17 financial results
Driving growth by expanding product and distribution 14 February 2017
For
per
sona
l use
onl
y
2
Operating performance Brian Benari – Managing Director and Chief Executive Officer
Financial results Andrew Tobin – Chief Financial Officer
Strategy and outlook Brian Benari – Managing Director and Chief Executive Officer
1H17 – Half year 31 December 2016
Overview
Driving growth by expanding product and distribution
For
per
sona
l use
onl
y
3
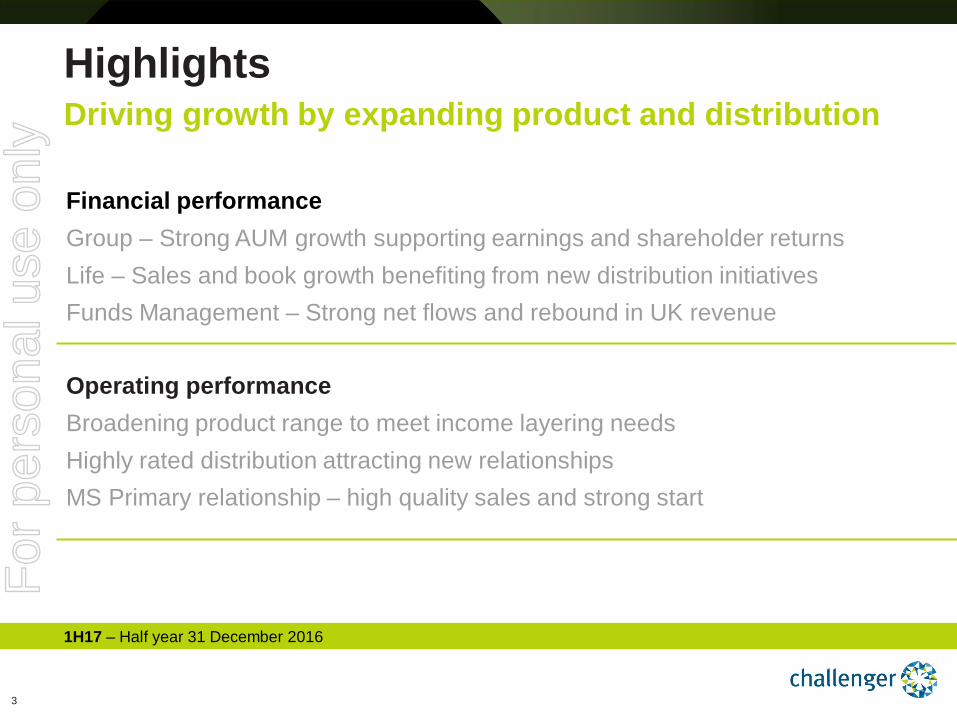
Financial performance Group – Strong AUM growth supporting earnings and shareholder returns Life – Sales and book growth benefiting from new distribution initiatives Funds Management – Strong net flows and rebound in UK revenue
Operating performance Broadening product range to meet income layering needs Highly rated distribution attracting new relationships MS Primary relationship – high quality sales and strong start
1H17 – Half year 31 December 2016
Highlights
Driving growth by expanding product and distribution
For
per
sona
l use
onl
y
4
155 182
197
0
10 0
20 0
30 0
1H15 1H16 1H170
10
20
30
40
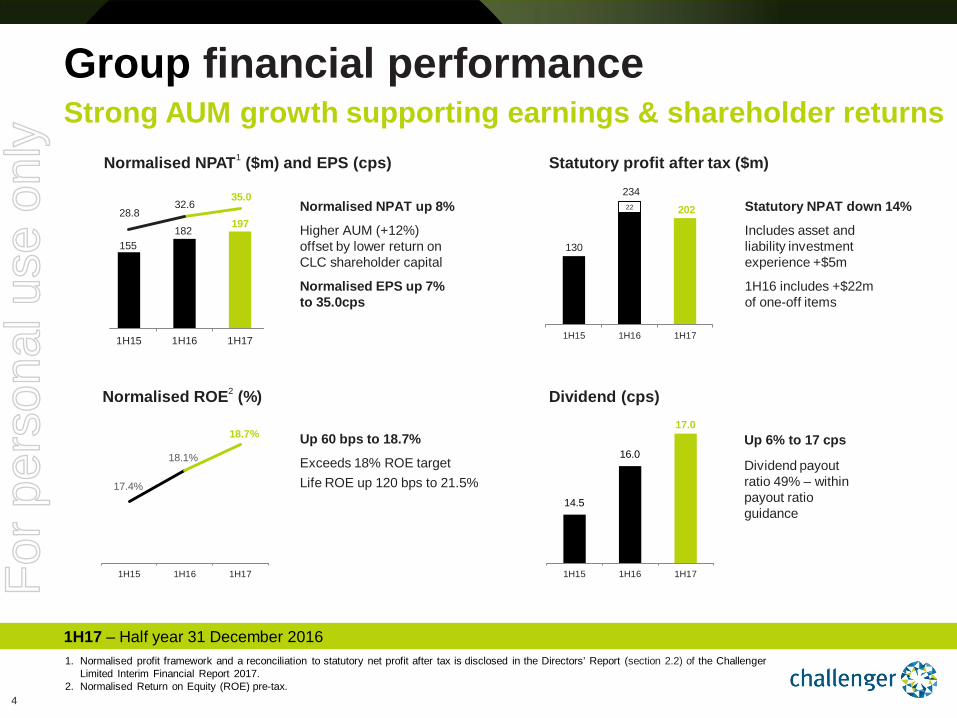
Group financial performance Strong AUM growth supporting earnings & shareholder returns
1. Normalised profit framework and a reconciliation to statutory net profit after tax is disclosed in the Directors’ Report (section 2.2) of the Challenger Limited Interim Financial Report 2017.
2. Normalised Return on Equity (ROE) pre-tax.
1H17 – Half year 31 December 2016
Normalised NPAT1 ($m) and EPS (cps)
Normalised NPAT up 8%
Higher AUM (+12%) offset by lower return on CLC shareholder capital
Normalised EPS up 7% to 35.0cps
Statutory profit after tax ($m)
130
234
202 22
1H15 1H16 1H17
Normalised ROE2 (%) Dividend (cps)
17.4%
18.1%
18.7%
1H15 1H16 1H17
14.5
16.0
17.0
1H15 1H16 1H17
Statutory NPAT down 14%
Includes asset and liability investment experience +$5m
1H16 includes +$22m of one-off items
Up 60 bps to 18.7%
Exceeds 18% ROE target Life ROE up 120 bps to 21.5%
Up 6% to 17 cps
Dividend payout ratio 49% – within payout ratio guidance
28.8 32.6
35.0
For
per
sona
l use
onl
y
5
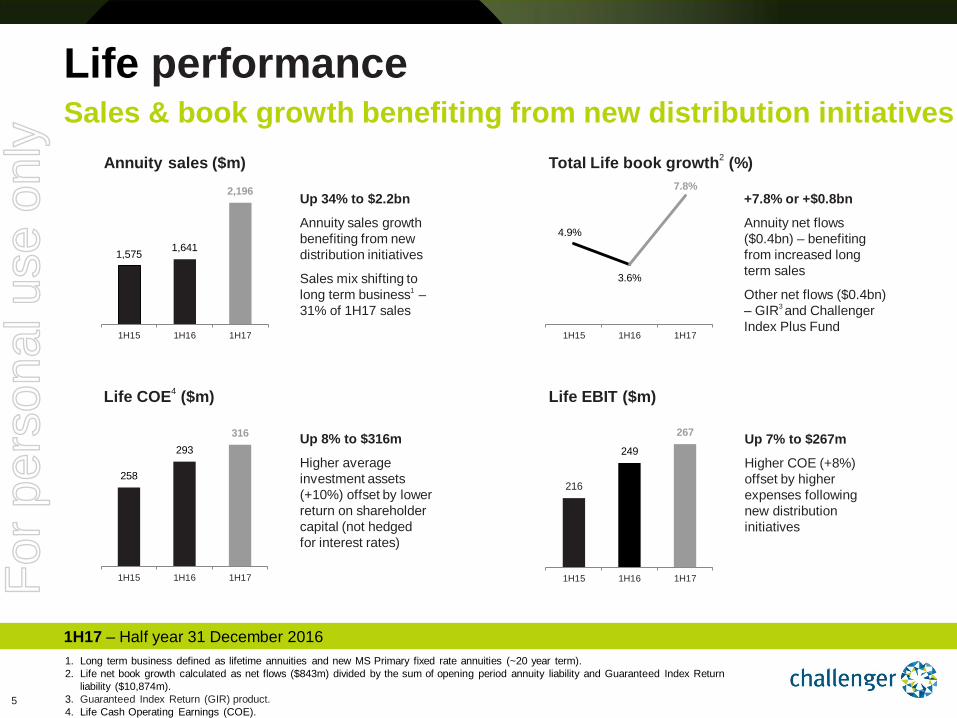
Life performance Sales & book growth benefiting from new distribution initiatives
1. Long term business defined as lifetime annuities and new MS Primary fixed rate annuities (~20 year term). 2. Life net book growth calculated as net flows ($843m) divided by the sum of opening period annuity liability and Guaranteed Index Return
liability ($10,874m). 3. Guaranteed Index Return (GIR) product. 4. Life Cash Operating Earnings (COE).
1H17 – Half year 31 December 2016
258
293 316
1H15 1H16 1H17
Life COE4 ($m)
Up 8% to $316m
Higher average investment assets (+10%) offset by lower return on shareholder capital (not hedged for interest rates)
Life EBIT ($m)
216
249
267
1H15 1H16 1H17
Annuity sales ($m) Total Life book growth2 (%)
4.9%
3.6%
7.8%
1H15 1H16 1H17
1,575 1,641
2,196
1H15 1H16 1H17
Up 7% to $267m
Higher COE (+8%) offset by higher expenses following new distribution initiatives
Up 34% to $2.2bn
Annuity sales growth benefiting from new distribution initiatives
Sales mix shifting to long term business1 – 31% of 1H17 sales
+7.8% or +$0.8bn
Annuity net flows ($0.4bn) – benefiting from increased long term sales
Other net flows ($0.4bn) – GIR3 and Challenger Index Plus Fund
For
per
sona
l use
onl
y
6
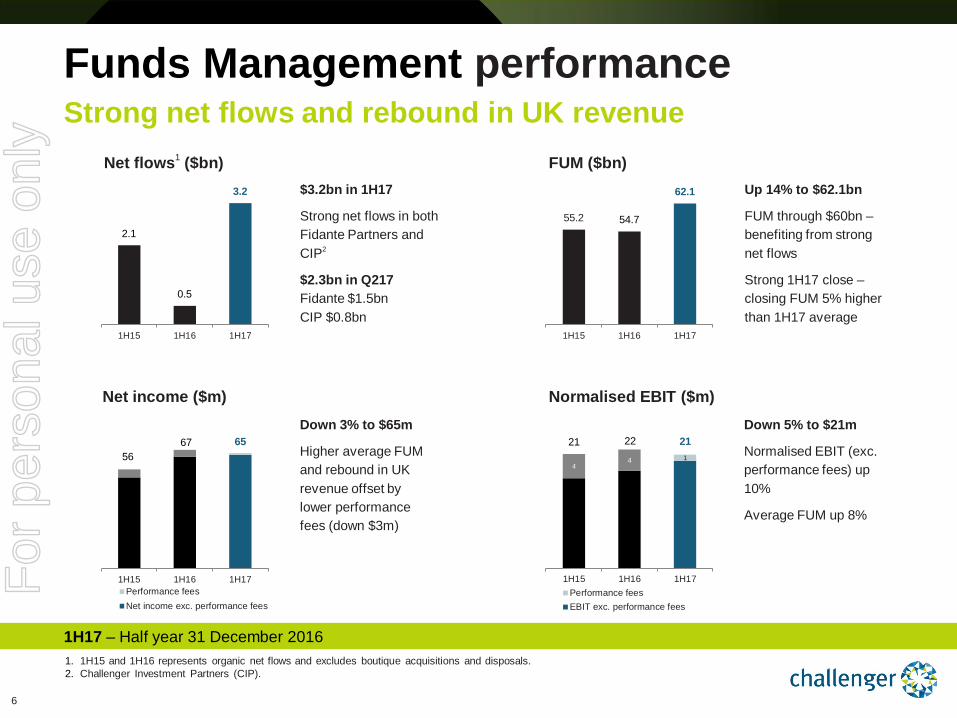
Down 3% to $65m
Higher average FUM and rebound in UK revenue offset by lower performance fees (down $3m)
Funds Management performance Strong net flows and rebound in UK revenue
1. 1H15 and 1H16 represents organic net flows and excludes boutique acquisitions and disposals. 2. Challenger Investment Partners (CIP).
1H17 – Half year 31 December 2016
2.1
0.5
3.2
1H15 1H16 1H17
Net flows1 ($bn) $3.2bn in 1H17
Strong net flows in both Fidante Partners and CIP2
$2.3bn in Q217 Fidante $1.5bn CIP $0.8bn
FUM ($bn)
55.2 54.7
62.1
1H15 1H16 1H17
Net income ($m) Normalised EBIT ($m)
21 22 21
4 4 1
1H15 1H16 1H17Performance feesEBIT exc. performance fees
56 67 65
1H15 1H16 1H17Performance feesNet income exc. performance fees
Up 14% to $62.1bn
FUM through $60bn – benefiting from strong net flows
Strong 1H17 close – closing FUM 5% higher than 1H17 average
Down 5% to $21m
Normalised EBIT (exc. performance fees) up 10%
Average FUM up 8%
For
per
sona
l use
onl
y
7
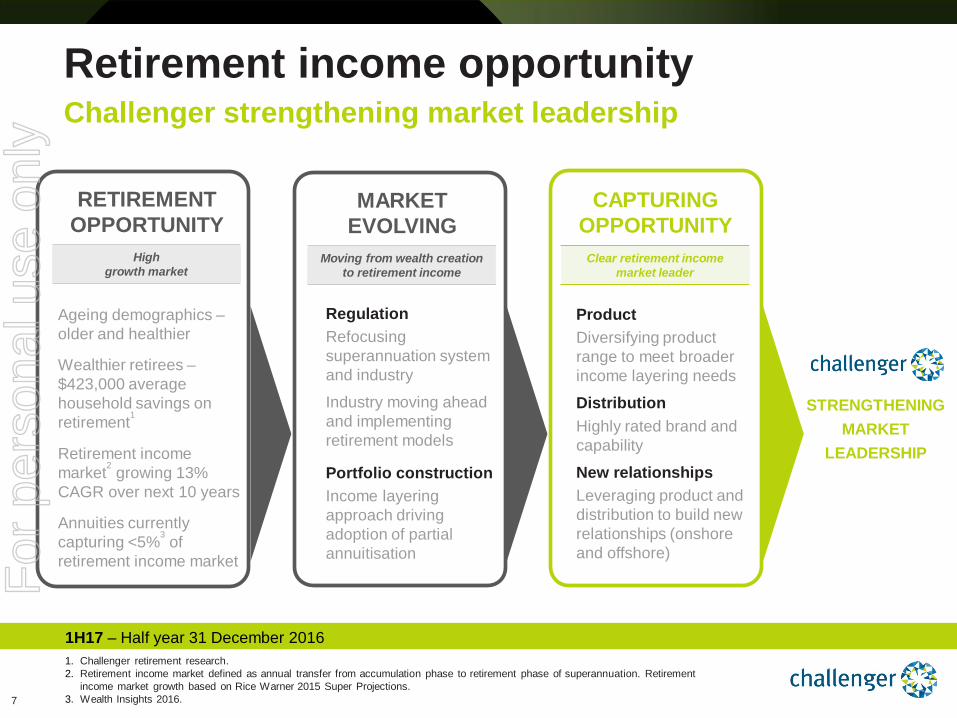
Retirement income opportunity Challenger strengthening market leadership
1. Challenger retirement research. 2. Retirement income market defined as annual transfer from accumulation phase to retirement phase of superannuation. Retirement
income market growth based on Rice Warner 2015 Super Projections. 3. Wealth Insights 2016.
1H17 – Half year 31 December 2016
STRENGTHENING MARKET
LEADERSHIP
Ageing demographics – older and healthier
Wealthier retirees – $423,000 average household savings on retirement1
Retirement income market2 growing 13% CAGR over next 10 years
Annuities currently capturing <5%3 of retirement income market
MARKET EVOLVING
Moving from wealth creation to retirement income
Regulation Refocusing superannuation system and industry
Industry moving ahead and implementing retirement models
Portfolio construction Income layering approach driving adoption of partial annuitisation
RETIREMENT OPPORTUNITY
High growth market
CAPTURING OPPORTUNITY
Clear retirement income market leader
Product Diversifying product range to meet broader income layering needs
Distribution Highly rated brand and capability
New relationships Leveraging product and distribution to build new relationships (onshore and offshore) F
or p
erso
nal u
se o
nly
8
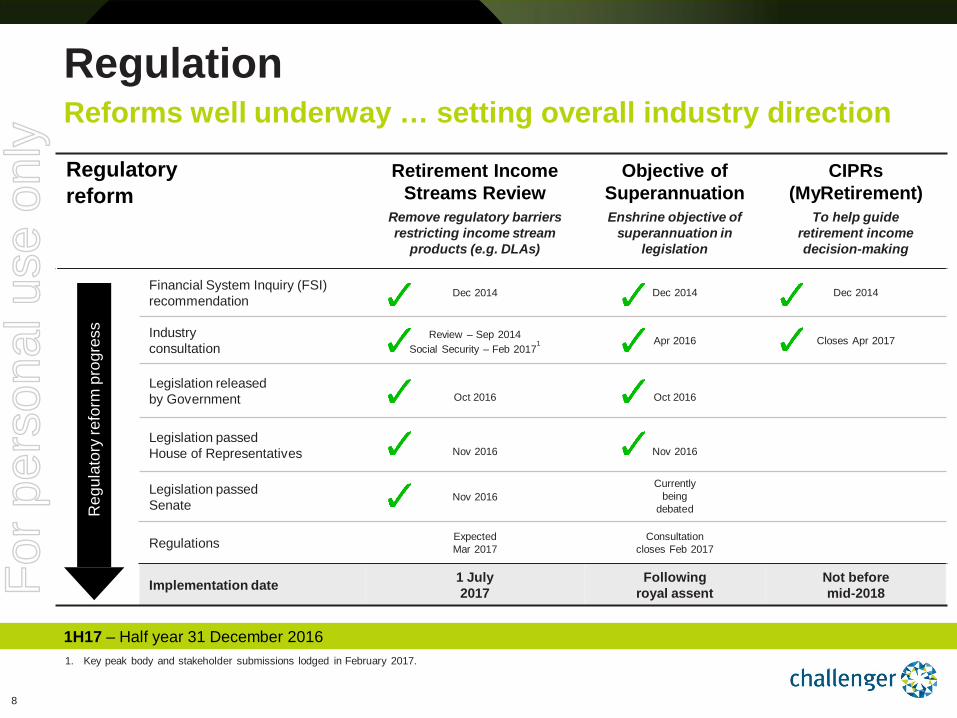
Reforms well underway … setting overall industry direction Regulation
1H17 – Half year 31 December 2016
Regulatory reform
Retirement Income Streams Review
Remove regulatory barriers restricting income stream
products (e.g. DLAs)
Objective of Superannuation Enshrine objective of
superannuation in legislation
CIPRs (MyRetirement)
To help guide retirement income decision-making
Financial System Inquiry (FSI) recommendation
Dec 2014
Dec 2014
Dec 2014
Industry consultation
Review – Sep 2014 Social Security – Feb 2017
1
Apr 2016
Closes Apr 2017
Legislation released by Government
Oct 2016
Oct 2016
Legislation passed House of Representatives
Nov 2016
Nov 2016
Legislation passed Senate
Nov 2016 Currently
being debated
Regulations Expected Mar 2017
Consultation closes Feb 2017
Implementation date 1 July 2017
Following royal assent
Not before mid-2018
Reg
ulat
ory
refo
rm p
rogr
ess
Reg
ulat
ory
refo
rm p
rogr
ess
1. Key peak body and stakeholder submissions lodged in February 2017.
For
per
sona
l use
onl
y
9
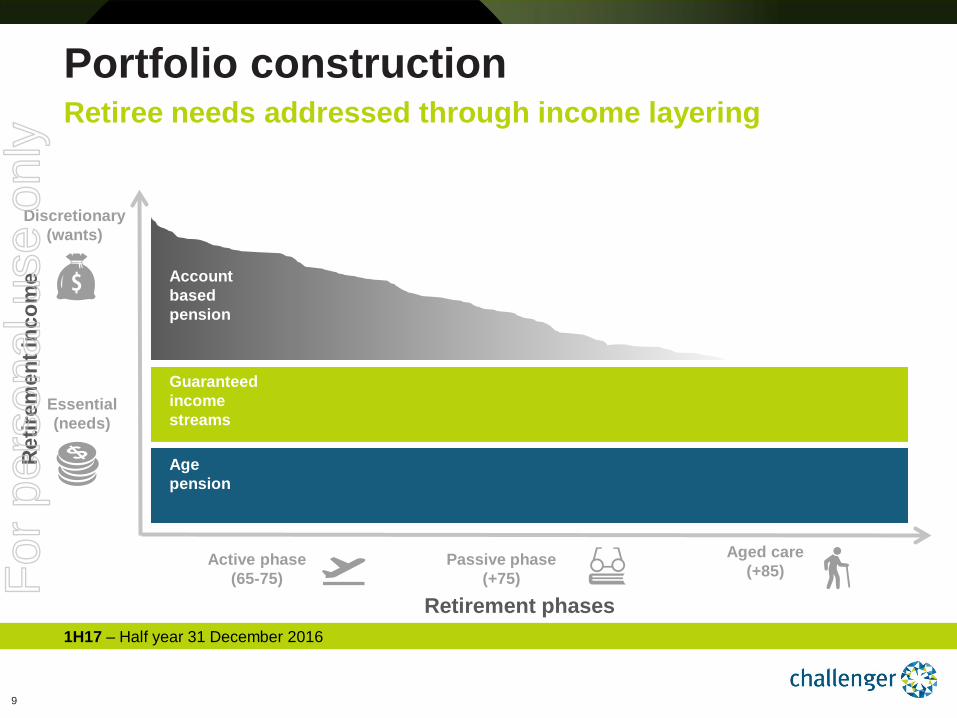
Portfolio construction Retiree needs addressed through income layering
1H17 – Half year 31 December 2016
Discretionary (wants)
Essential (needs)
Age pension
Guaranteed income streams
Account based pension
Active phase (65-75)
Passive phase (+75)
Aged care (+85)
Retirement phases
Ret
irem
ent i
ncom
e F
or p
erso
nal u
se o
nly
10
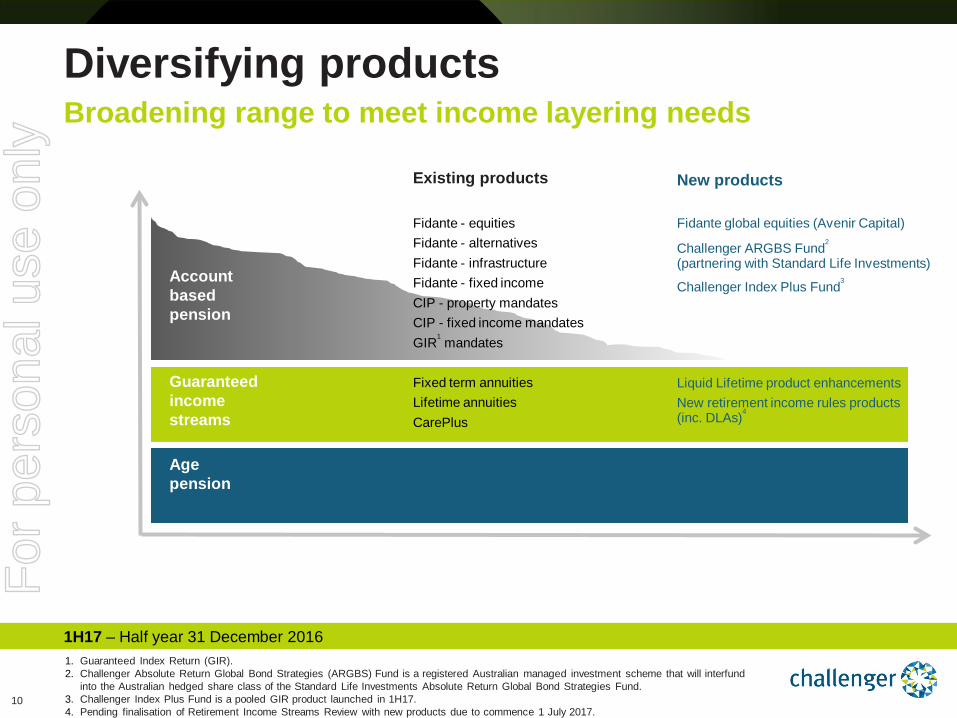
Diversifying products Broadening range to meet income layering needs
1. Guaranteed Index Return (GIR). 2. Challenger Absolute Return Global Bond Strategies (ARGBS) Fund is a registered Australian managed investment scheme that will interfund
into the Australian hedged share class of the Standard Life Investments Absolute Return Global Bond Strategies Fund. 3. Challenger Index Plus Fund is a pooled GIR product launched in 1H17. 4. Pending finalisation of Retirement Income Streams Review with new products due to commence 1 July 2017.
1H17 – Half year 31 December 2016
Age pension
Guaranteed income streams
Account based pension
Existing products
Fixed term annuities Lifetime annuities CarePlus
Liquid Lifetime product enhancements New retirement income rules products (inc. DLAs)4
Fidante - equities Fidante - alternatives Fidante - infrastructure Fidante - fixed income CIP - property mandates CIP - fixed income mandates GIR1 mandates
Fidante global equities (Avenir Capital)
Challenger ARGBS Fund2
(partnering with Standard Life Investments)
Challenger Index Plus Fund3
New products
For
per
sona
l use
onl
y
11
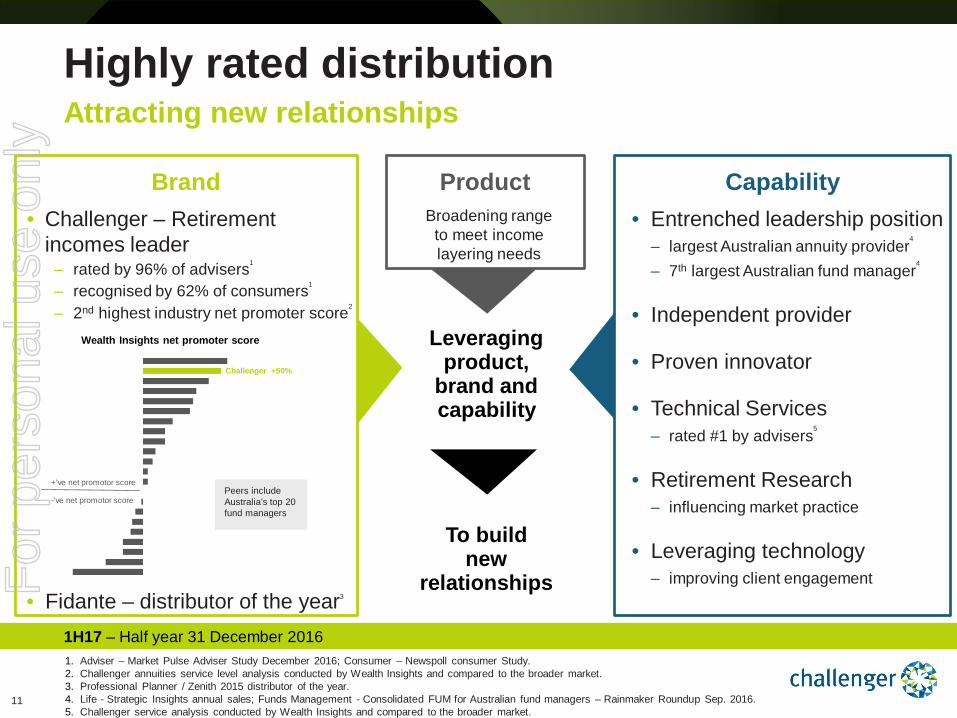
• Challenger – Retirement incomes leader ‒ rated by 96% of advisers1
‒ recognised by 62% of consumers1
‒ 2nd highest industry net promoter score2
• Fidante – distributor of the year3
Challenger +50%
Wealth Insights net promoter score
Highly rated distribution Attracting new relationships
1. Adviser – Market Pulse Adviser Study December 2016; Consumer – Newspoll consumer Study. 2. Challenger annuities service level analysis conducted by Wealth Insights and compared to the broader market. 3. Professional Planner / Zenith 2015 distributor of the year. 4. Life - Strategic Insights annual sales; Funds Management - Consolidated FUM for Australian fund managers – Rainmaker Roundup Sep. 2016. 5. Challenger service analysis conducted by Wealth Insights and compared to the broader market.
1H17 – Half year 31 December 2016
• Entrenched leadership position ‒ largest Australian annuity provider4
‒ 7th largest Australian fund manager4
• Independent provider
• Proven innovator
• Technical Services ‒ rated #1 by advisers5
• Retirement Research ‒ influencing market practice
• Leveraging technology ‒ improving client engagement
Capability
Leveraging product,
brand and capability
To build new
relationships
Brand
+’ve net promotor score
-’ve net promotor score
Product Broadening range
to meet income layering needs
Peers include Australia’s top 20 fund managers
For
per
sona
l use
onl
y
12
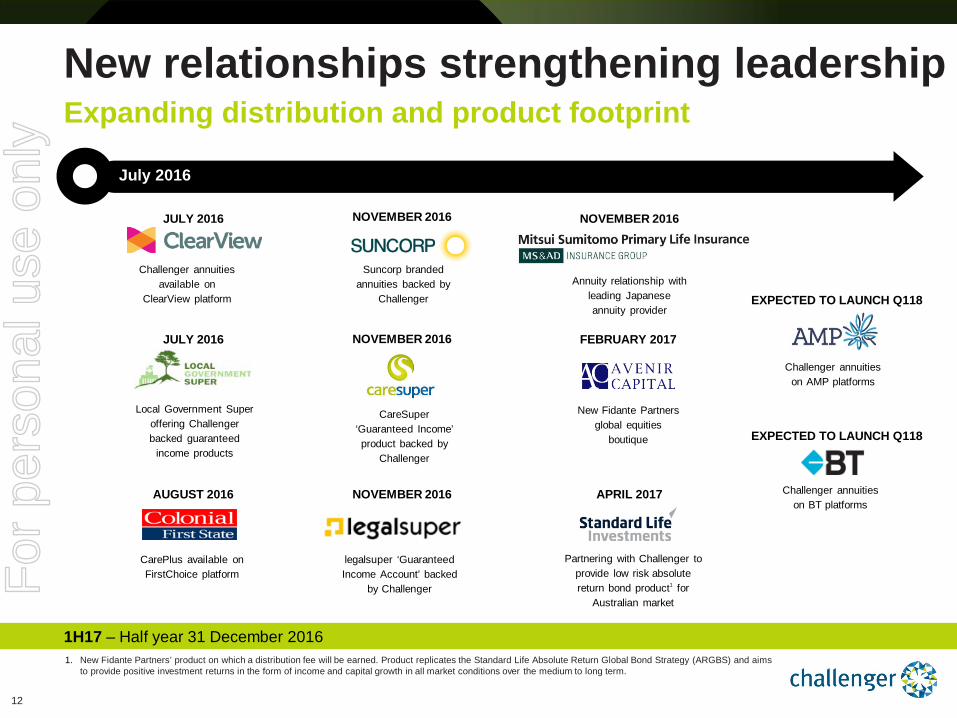
Expanding distribution and product footprint New relationships strengthening leadership
2016 financial year July 2016
CarePlus available on FirstChoice platform
June 2016
Challenger annuities available on
ClearView platform
Annuity relationship with leading Japanese annuity provider
Challenger annuities on AMP platforms
1. New Fidante Partners’ product on which a distribution fee will be earned. Product replicates the Standard Life Absolute Return Global Bond Strategy (ARGBS) and aims to provide positive investment returns in the form of income and capital growth in all market conditions over the medium to long term.
1H17 – Half year 31 December 2016
Suncorp branded annuities backed by
Challenger
Challenger annuities on BT platforms
New Fidante Partners global equities
boutique
Partnering with Challenger to provide low risk absolute return bond product1 for
Australian market
JULY 2016
AUGUST 2016
JULY 2016
EXPECTED TO LAUNCH Q118
EXPECTED TO LAUNCH Q118
Local Government Super offering Challenger backed guaranteed
income products
NOVEMBER 2016
NOVEMBER 2016
CareSuper ‘Guaranteed Income’ product backed by
Challenger
NOVEMBER 2016
legalsuper ‘Guaranteed Income Account’ backed
by Challenger
NOVEMBER 2016
FEBRUARY 2017
APRIL 2017
For
per
sona
l use
onl
y
13
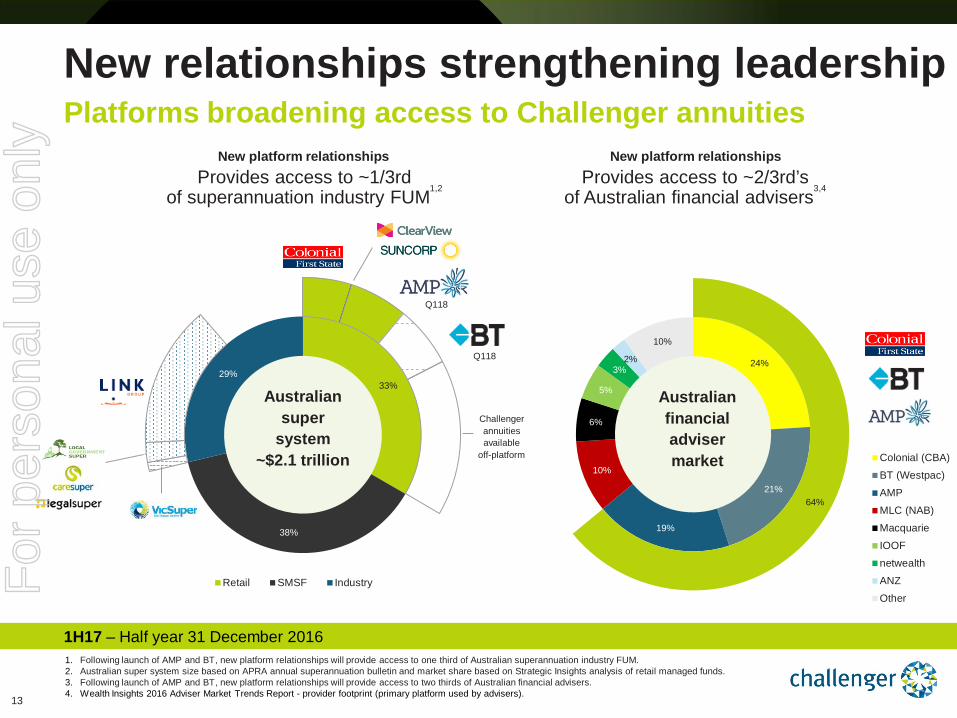
24%
21%
19%
10%
6%
5%
3% 2%
10%
64%
Colonial (CBA)
BT (Westpac)
AMP
MLC (NAB)
Macquarie
IOOF
netwealth
ANZ
Other
33%
38%
29%
Retail SMSF Industry
New relationships strengthening leadership
1. Following launch of AMP and BT, new platform relationships will provide access to one third of Australian superannuation industry FUM. 2. Australian super system size based on APRA annual superannuation bulletin and market share based on Strategic Insights analysis of retail managed funds. 3. Following launch of AMP and BT, new platform relationships will provide access to two thirds of Australian financial advisers. 4. Wealth Insights 2016 Adviser Market Trends Report - provider footprint (primary platform used by advisers).
New platform relationships
Platforms broadening access to Challenger annuities
Australian super
system ~$2.1 trillion
1H17 – Half year 31 December 2016
Q118
Q118
Challenger annuities available
off-platform
New platform relationships
Australian financial adviser market
Provides access to ~1/3rd of superannuation industry FUM1,2
Provides access to ~2/3rd’s of Australian financial advisers3,4
For
per
sona
l use
onl
y
14
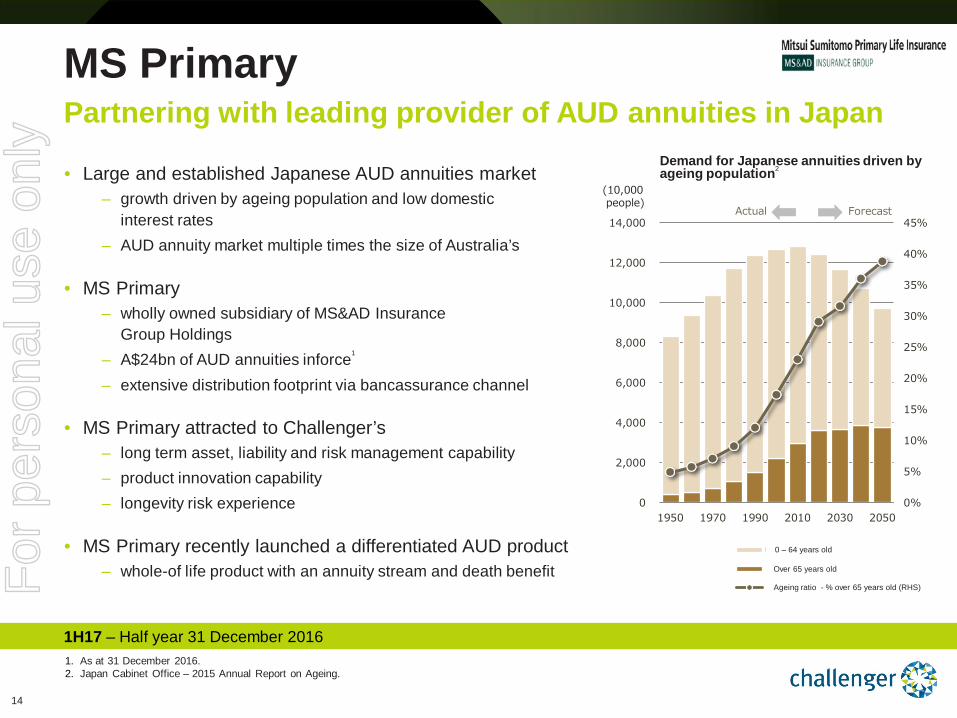
MS Primary
• Large and established Japanese AUD annuities market – growth driven by ageing population and low domestic
interest rates – AUD annuity market multiple times the size of Australia’s
• MS Primary – wholly owned subsidiary of MS&AD Insurance
Group Holdings – A$24bn of AUD annuities inforce1
– extensive distribution footprint via bancassurance channel
• MS Primary attracted to Challenger’s – long term asset, liability and risk management capability – product innovation capability – longevity risk experience
• MS Primary recently launched a differentiated AUD product – whole-of life product with an annuity stream and death benefit
Partnering with leading provider of AUD annuities in Japan
1H17 – Half year 31 December 2016
0%
5%
10%
15%
20%
25%
30%
35%
40%
45%
0
2,000
4,000
6,000
8,000
10,000
12,000
14,000
1950 1970 1990 2010 2030 2050
0歳~64歳
65歳以上
高齢化率(65歳以上)
Demand for Japanese annuities driven by ageing population2
0 – 64 years old
Forecast Actual
1. As at 31 December 2016. 2. Japan Cabinet Office – 2015 Annual Report on Ageing.
Over 65 years old
Ageing ratio - % over 65 years old (RHS)
(10,000 people)
For
per
sona
l use
onl
y
15
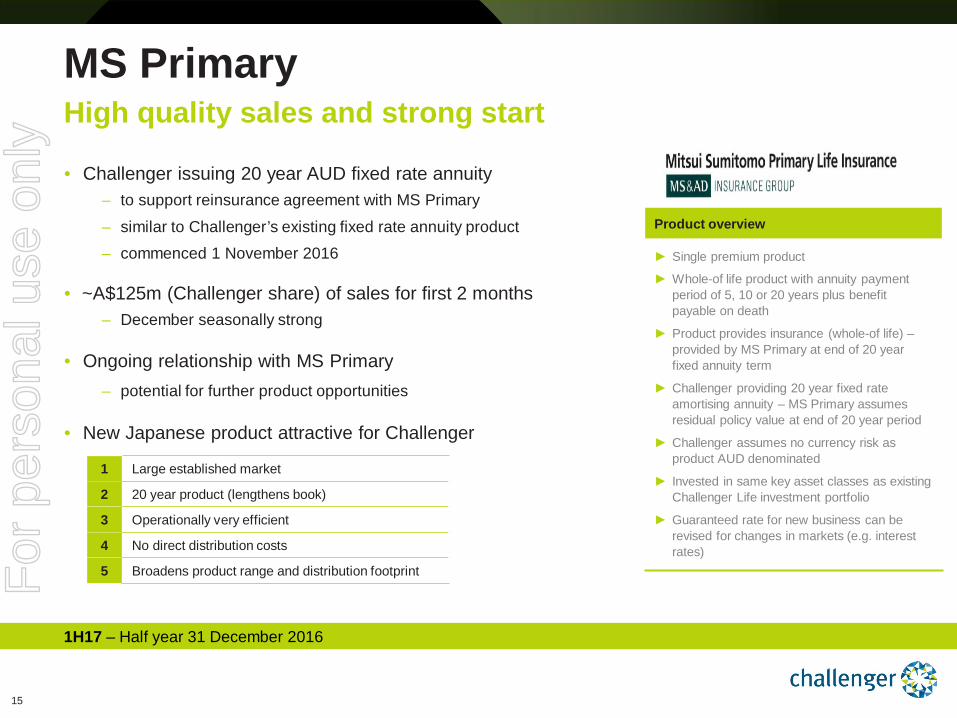
• Challenger issuing 20 year AUD fixed rate annuity – to support reinsurance agreement with MS Primary
– similar to Challenger’s existing fixed rate annuity product – commenced 1 November 2016
• ~A$125m (Challenger share) of sales for first 2 months – December seasonally strong
• Ongoing relationship with MS Primary – potential for further product opportunities
• New Japanese product attractive for Challenger
MS Primary High quality sales and strong start
1H17 – Half year 31 December 2016
Product overview
► Single premium product
► Whole-of life product with annuity payment period of 5, 10 or 20 years plus benefit payable on death
► Product provides insurance (whole-of life) – provided by MS Primary at end of 20 year fixed annuity term
► Challenger providing 20 year fixed rate amortising annuity – MS Primary assumes residual policy value at end of 20 year period
► Challenger assumes no currency risk as product AUD denominated
► Invested in same key asset classes as existing Challenger Life investment portfolio
► Guaranteed rate for new business can be revised for changes in markets (e.g. interest rates)
1 Large established market
2 20 year product (lengthens book)
3 Operationally very efficient
4 No direct distribution costs
5 Broadens product range and distribution footprint
For
per
sona
l use
onl
y
16
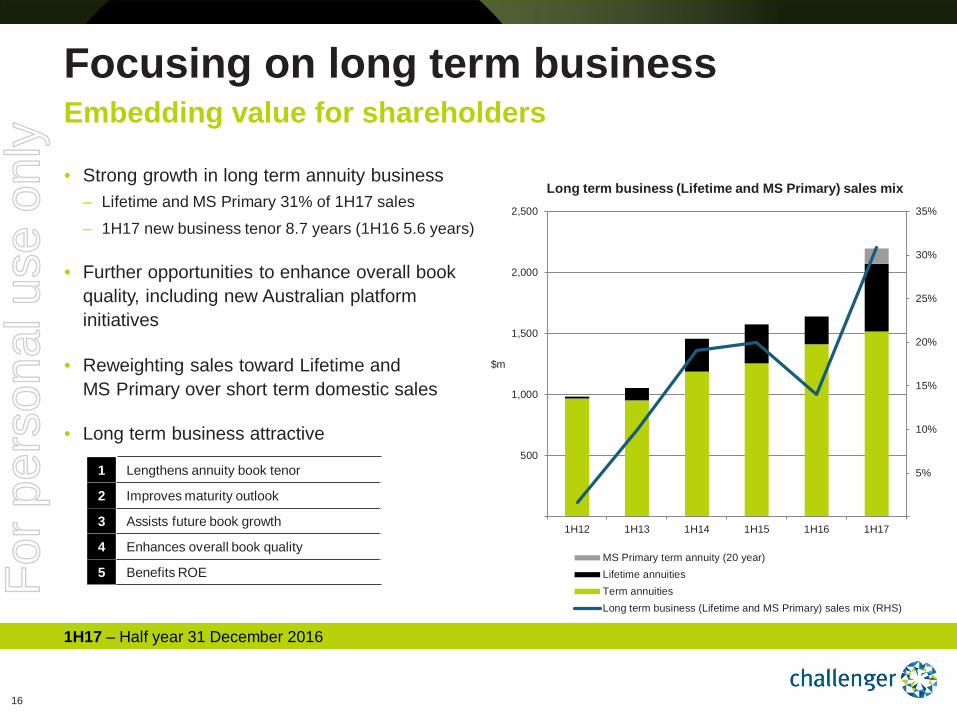
Focusing on long term business Embedding value for shareholders
1H17 – Half year 31 December 2016
• Strong growth in long term annuity business – Lifetime and MS Primary 31% of 1H17 sales
– 1H17 new business tenor 8.7 years (1H16 5.6 years)
• Further opportunities to enhance overall book quality, including new Australian platform initiatives
• Reweighting sales toward Lifetime and MS Primary over short term domestic sales
• Long term business attractive
1 Lengthens annuity book tenor
2 Improves maturity outlook
3 Assists future book growth
4 Enhances overall book quality
5 Benefits ROE
5%
10%
15%
20%
25%
30%
35%
500
1,000
1,500
2,000
2,500
1H12 1H13 1H14 1H15 1H16 1H17
$m
MS Primary term annuity (20 year)Lifetime annuitiesTerm annuitiesLong term business (Lifetime and MS Primary) sales mix (RHS)
Long term business (Lifetime and MS Primary) sales mix
For
per
sona
l use
onl
y

17
Financial performance Group – Strong AUM growth supporting earnings and shareholder returns Life – Sales and book growth benefiting from new distribution initiatives Funds Management – Strong net flows and rebound in UK revenue
Operating performance Broadening product range to meet income layering needs Highly rated distribution attracting new relationships MS Primary relationship – high quality sales and strong start
1H17 – Half year 31 December 2016
Highlights
Driving growth by expanding product and distribution
For
per
sona
l use
onl
y
1H17 Financial results
Andrew Tobin Chief Financial Officer 14 February 2017
1H17 – Half year 31 December 2016
For
per
sona
l use
onl
y
19
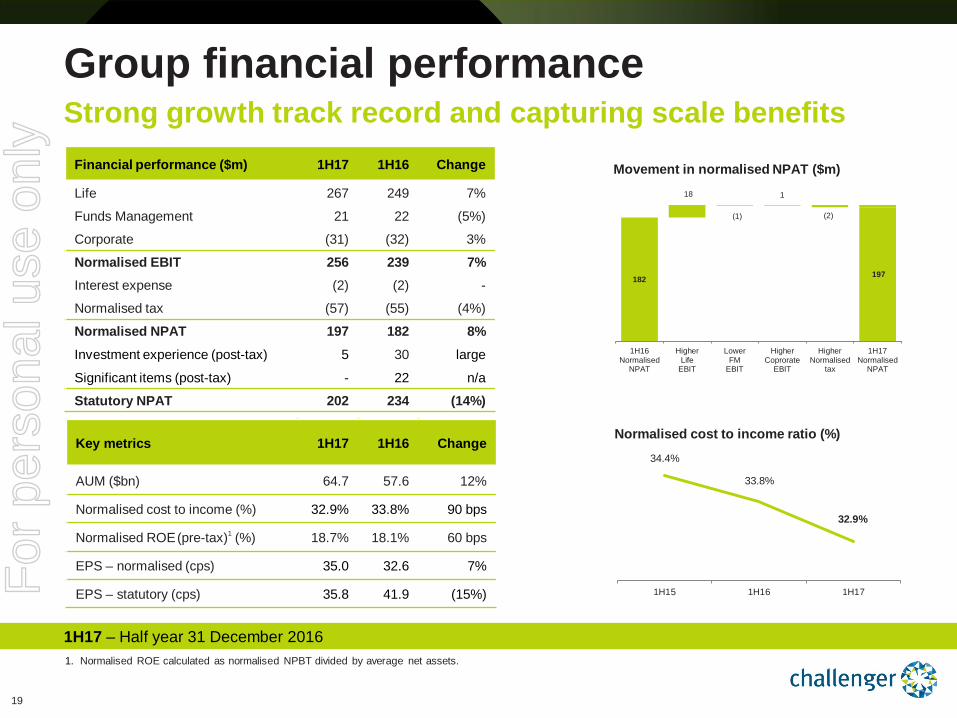
34.4%
33.8%
32.9%
1H15 1H16 1H17
197 182
18
(1)
1
(2)
1H16Normalised
NPAT
HigherLife
EBIT
LowerFM
EBIT
HigherCoprorate
EBIT
HigherNormalised
tax
1H17Normalised
NPAT
Movement in normalised NPAT ($m)
Group financial performance Strong growth track record and capturing scale benefits
Normalised cost to income ratio (%)
1. Normalised ROE calculated as normalised NPBT divided by average net assets.
Financial performance ($m) 1H17 1H16 Change
Life 267 249 7%
Funds Management 21 22 (5%)
Corporate (31) (32) 3%
Normalised EBIT 256 239 7% Interest expense (2) (2) -
Normalised tax (57) (55) (4%)
Normalised NPAT 197 182 8% Investment experience (post-tax) 5 30 large
Significant items (post-tax) - 22 n/a
Statutory NPAT 202 234 (14%)
Key metrics 1H17 1H16 Change
AUM ($bn) 64.7 57.6 12%
Normalised cost to income (%) 32.9% 33.8% 90 bps
Normalised ROE (pre-tax)1 (%) 18.7% 18.1% 60 bps
EPS – normalised (cps) 35.0 32.6 7%
EPS – statutory (cps) 35.8 41.9 (15%)
1H17 – Half year 31 December 2016
For
per
sona
l use
onl
y
20
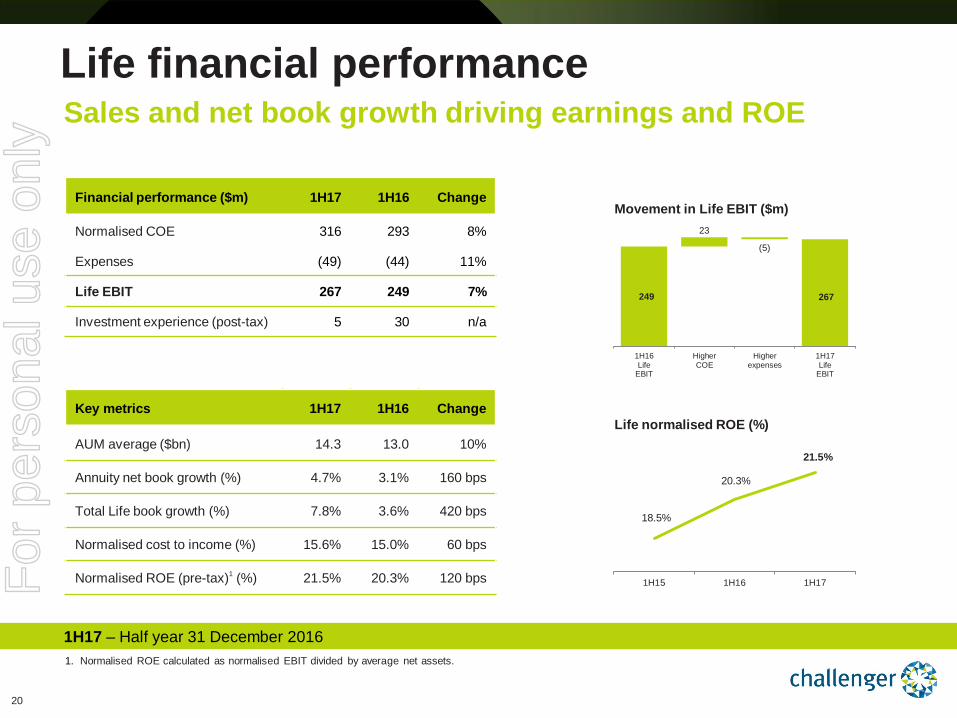
18.5%
20.3%
21.5%
1H15 1H16 1H17
267 249
23
(5)
1H16Life
EBIT
HigherCOE
Higherexpenses
1H17Life
EBIT
Movement in Life EBIT ($m)
Life financial performance Sales and net book growth driving earnings and ROE
1. Normalised ROE calculated as normalised EBIT divided by average net assets.
Financial performance ($m) 1H17 1H16 Change
Normalised COE 316 293 8%
Expenses (49) (44) 11%
Life EBIT 267 249 7%
Investment experience (post-tax) 5 30 n/a
Key metrics 1H17 1H16 Change
AUM average ($bn) 14.3 13.0 10%
Annuity net book growth (%) 4.7% 3.1% 160 bps
Total Life book growth (%) 7.8% 3.6% 420 bps
Normalised cost to income (%) 15.6% 15.0% 60 bps
Normalised ROE (pre-tax)1 (%) 21.5% 20.3% 120 bps
1H17 – Half year 31 December 2016
Life normalised ROE (%)
For
per
sona
l use
onl
y
21
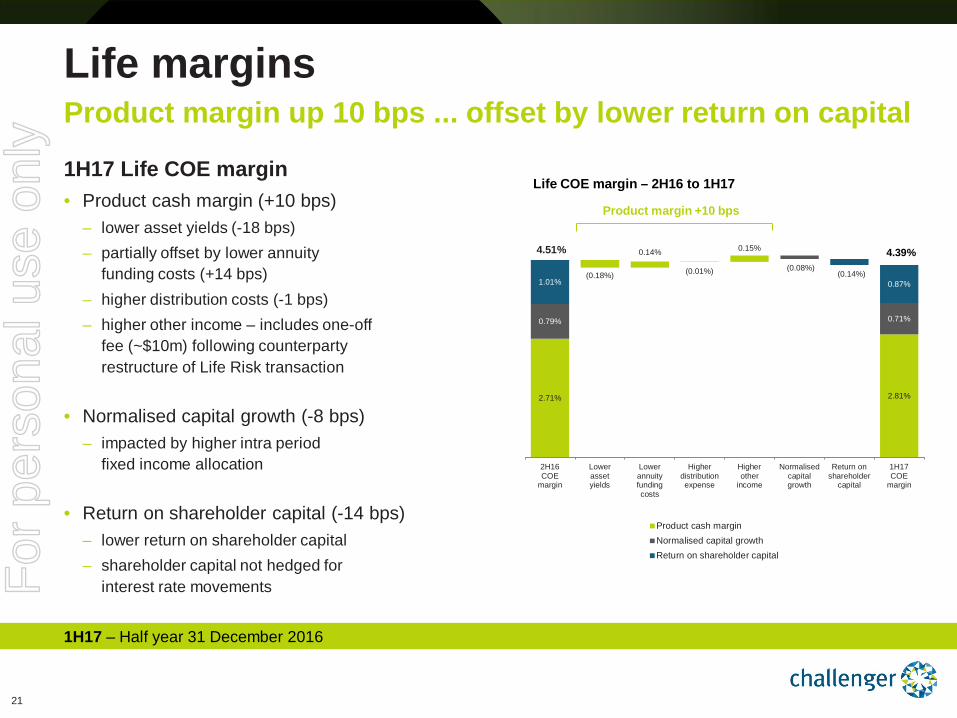
2.71%
(0.18%)
0.14%
(0.01%)
0.15%
2.81%
0.79%
(0.08%)
0.71%
1.01% (0.14%)
0.87%
2H16COE
margin
Lowerassetyields
Lowerannuityfundingcosts
Higherdistributionexpense
Higherother
income
Normalisedcapitalgrowth
Return onshareholder
capital
1H17COE
margin
Product cash marginNormalised capital growthReturn on shareholder capital
Life margins Product margin up 10 bps ... offset by lower return on capital
1H17 Life COE margin • Product cash margin (+10 bps)
– lower asset yields (-18 bps) – partially offset by lower annuity
funding costs (+14 bps) – higher distribution costs (-1 bps) – higher other income – includes one-off
fee (~$10m) following counterparty restructure of Life Risk transaction
• Normalised capital growth (-8 bps) – impacted by higher intra period
fixed income allocation
• Return on shareholder capital (-14 bps) – lower return on shareholder capital – shareholder capital not hedged for
interest rate movements
Life COE margin – 2H16 to 1H17
4.51% 4.39%
1H17 – Half year 31 December 2016
Product margin +10 bps
For
per
sona
l use
onl
y
22
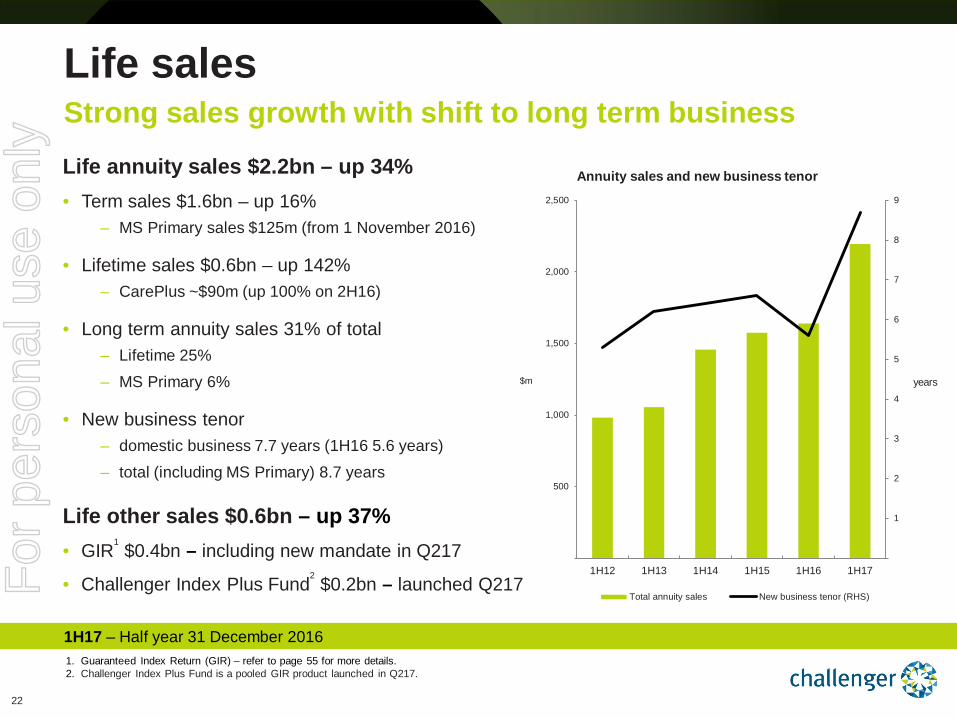
Life sales Strong sales growth with shift to long term business
1H17 – Half year 31 December 2016 1. Guaranteed Index Return (GIR) – refer to page 55 for more details. 2. Challenger Index Plus Fund is a pooled GIR product launched in Q217.
Life annuity sales $2.2bn – up 34% • Term sales $1.6bn – up 16%
– MS Primary sales $125m (from 1 November 2016)
• Lifetime sales $0.6bn – up 142% – CarePlus ~$90m (up 100% on 2H16)
• Long term annuity sales 31% of total – Lifetime 25% – MS Primary 6%
• New business tenor – domestic business 7.7 years (1H16 5.6 years) – total (including MS Primary) 8.7 years
Life other sales $0.6bn – up 37% • GIR1 $0.4bn – including new mandate in Q217
• Challenger Index Plus Fund2 $0.2bn – launched Q217
Annuity sales and new business tenor
1
2
3
4
5
6
7
8
9
500
1,000
1,500
2,000
2,500
1H12 1H13 1H14 1H15 1H16 1H17
years $m
Total annuity sales New business tenor (RHS)For
per
sona
l use
onl
y
23
10.0%
12.5%
15.0%
17.5%
20.0%
1H14 2H14 1H15 2H15 1H16 2H16 1H17 2H17 F
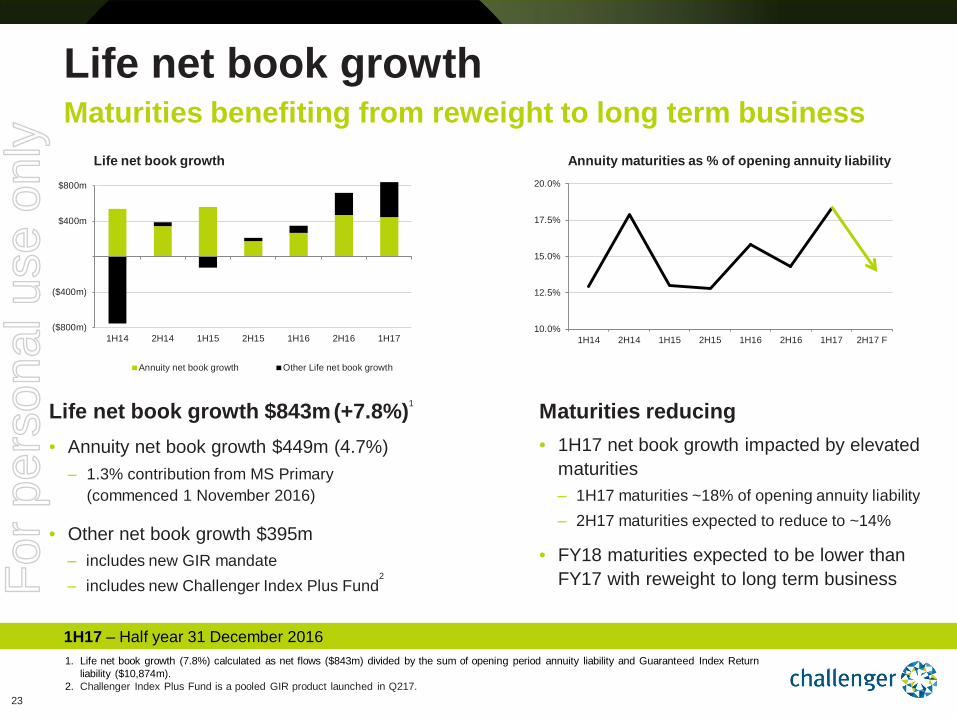
Life net book growth Maturities benefiting from reweight to long term business
Life net book growth $843m (+7.8%)1
• Annuity net book growth $449m (4.7%) – 1.3% contribution from MS Primary
(commenced 1 November 2016)
• Other net book growth $395m ‒ includes new GIR mandate ‒ includes new Challenger Index Plus Fund
2
1H17 – Half year 31 December 2016
Annuity maturities as % of opening annuity liability
1. Life net book growth (7.8%) calculated as net flows ($843m) divided by the sum of opening period annuity liability and Guaranteed Index Return liability ($10,874m).
2. Challenger Index Plus Fund is a pooled GIR product launched in Q217.
Life net book growth
($800m)
($400m)
$400m
$800m
1H14 2H14 1H15 2H15 1H16 2H16 1H17
Annuity net book growth Other Life net book growth
Maturities reducing • 1H17 net book growth impacted by elevated
maturities ‒ 1H17 maturities ~18% of opening annuity liability ‒ 2H17 maturities expected to reduce to ~14%
• FY18 maturities expected to be lower than FY17 with reweight to long term business
For
per
sona
l use
onl
y
24
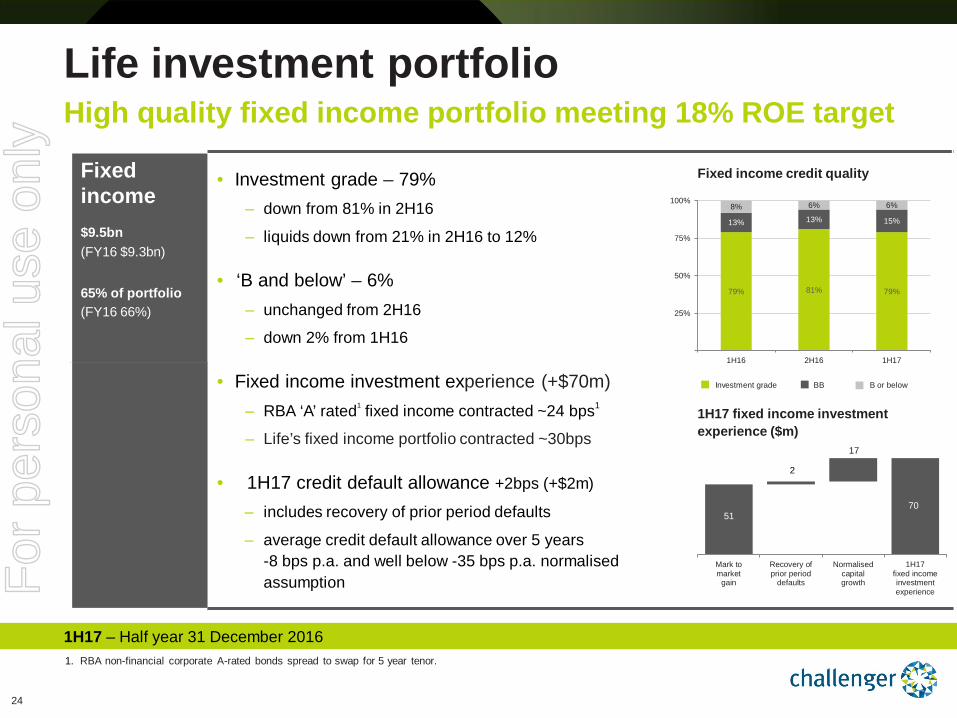
Fixed income $9.5bn (FY16 $9.3bn) 65% of portfolio (FY16 66%)
• Investment grade – 79% ‒ down from 81% in 2H16
‒ liquids down from 21% in 2H16 to 12%
• ‘B and below’ – 6% ‒ unchanged from 2H16
‒ down 2% from 1H16
• Fixed income investment experience (+$70m) ‒ RBA ‘A’ rated1 fixed income contracted ~24 bps1
‒ Life’s fixed income portfolio contracted ~30bps
• 1H17 credit default allowance +2bps (+$2m)
‒ includes recovery of prior period defaults
‒ average credit default allowance over 5 years -8 bps p.a. and well below -35 bps p.a. normalised assumption
Life investment portfolio High quality fixed income portfolio meeting 18% ROE target
1H17 – Half year 31 December 2016
Fixed income credit quality
1. RBA non-financial corporate A-rated bonds spread to swap for 5 year tenor.
51
2
17
70
Mark tomarket
gain
Recovery ofprior period
defaults
Normalisedcapitalgrowth
1H17fixed incomeinvestmentexperience
1H17 fixed income investment experience ($m)
79% 81% 79%
13% 13% 15%
8% 6% 6%
25%
50%
75%
100%
1H16 2H16 1H17
Investment grade BB B or below
For
per
sona
l use
onl
y
25
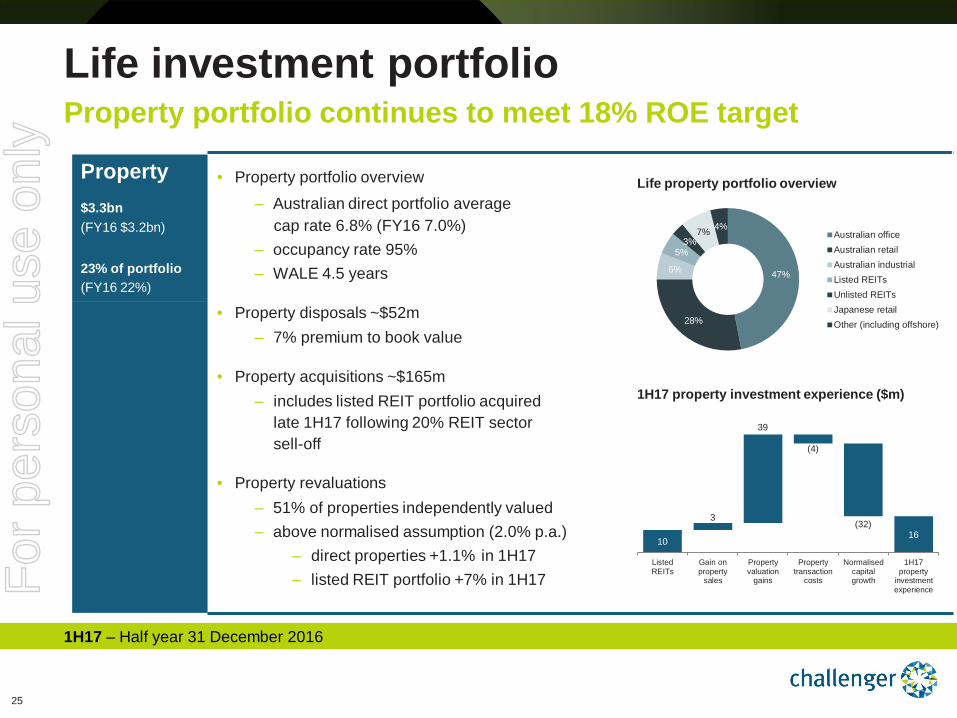
Property $3.3bn (FY16 $3.2bn) 23% of portfolio (FY16 22%)
• Property portfolio overview ‒ Australian direct portfolio average
cap rate 6.8% (FY16 7.0%) ‒ occupancy rate 95% ‒ WALE 4.5 years
• Property disposals ~$52m ‒ 7% premium to book value
• Property acquisitions ~$165m ‒ includes listed REIT portfolio acquired
late 1H17 following 20% REIT sector sell-off
• Property revaluations ‒ 51% of properties independently valued
‒ above normalised assumption (2.0% p.a.) ‒ direct properties +1.1%
in 1H17
‒ listed REIT portfolio +7% in 1H17
16 10
3
39
(4)
(32)
ListedREITs
Gain onproperty
sales
Propertyvaluation
gains
Propertytransaction
costs
Normalisedcapitalgrowth
1H17property
investmentexperience
47%
28%
6%
5% 3%
7% 4% Australian officeAustralian retailAustralian industrialListed REITsUnlisted REITsJapanese retailOther (including offshore)
Life investment portfolio Property portfolio continues to meet 18% ROE target
1H17 – Half year 31 December 2016
Life property portfolio overview
1H17 property investment experience ($m)
For
per
sona
l use
onl
y
26
50
100
150
200
250
10
20
30
40
50
60
70
80
Jun 13 Dec 13 Jun 14 Dec 14 Jun 15 Dec 15 Jun 16 Dec 16
APRA illiquidity premium (LHS) RBA credit spreads (RHS)
($60m)
($40m)
($20m)
$20m
$40m
$60m
$80m
Fixedincome
Property Infrastructure Equitiesand other
Annuityvaluation
experience
Actual capital growth Normalised capital growth Investment experience
Asset +$36m Liability -$28m
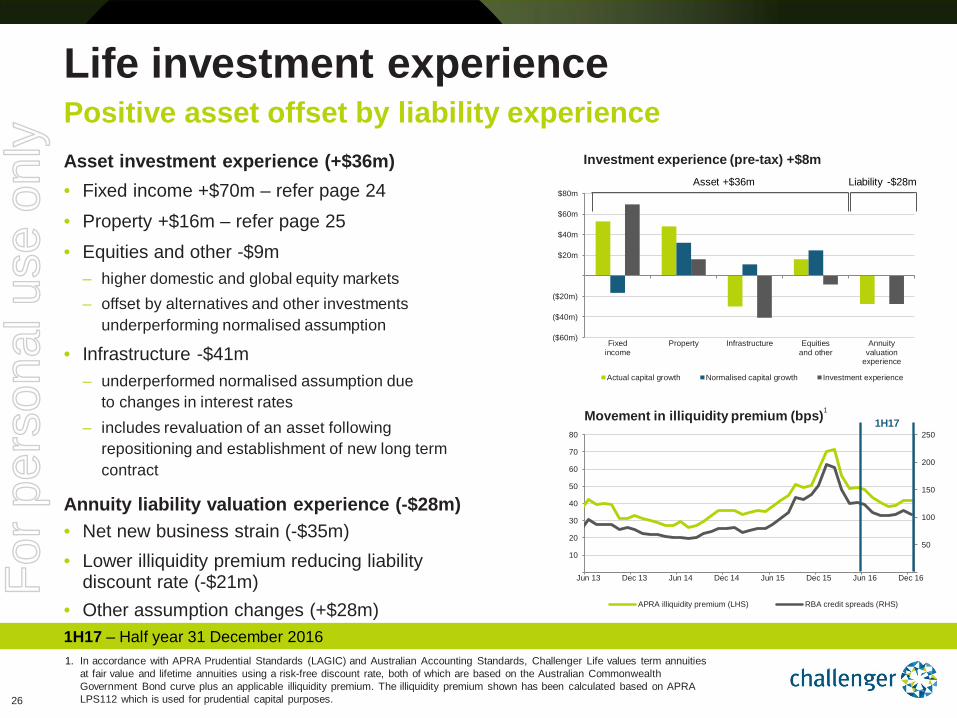
Life investment experience Positive asset offset by liability experience Asset investment experience (+$36m) • Fixed income +$70m – refer page 24 • Property +$16m – refer page 25 • Equities and other -$9m
– higher domestic and global equity markets – offset by alternatives and other investments
underperforming normalised assumption
• Infrastructure -$41m – underperformed normalised assumption due
to changes in interest rates – includes revaluation of an asset following
repositioning and establishment of new long term contract
Annuity liability valuation experience (-$28m) • Net new business strain (-$35m) • Lower illiquidity premium reducing liability
discount rate (-$21m) • Other assumption changes (+$28m)
Investment experience (pre-tax) +$8m
1H17 – Half year 31 December 2016 1. In accordance with APRA Prudential Standards (LAGIC) and Australian Accounting Standards, Challenger Life values term annuities
at fair value and lifetime annuities using a risk-free discount rate, both of which are based on the Australian Commonwealth Government Bond curve plus an applicable illiquidity premium. The illiquidity premium shown has been calculated based on APRA LPS112 which is used for prudential capital purposes.
Movement in illiquidity premium (bps)1
1H17
For
per
sona
l use
onl
y
27
-
772
-
1,010
222
(170)
(107) (57)
(58) (68)
81
853
30 June 2016CLC excessregulatory
capital
1H17 CLCoperatingearnings(after-tax)
1H17CLC
dividend
Growthin
AUM
Change incapital
intensity
Capital onunsettledproperties
Subdebt
repayment
31 December2016
CLC excessregulatory
capital
Groupcash
31 December2016
CLC excessregulatorycapital andGroup cash
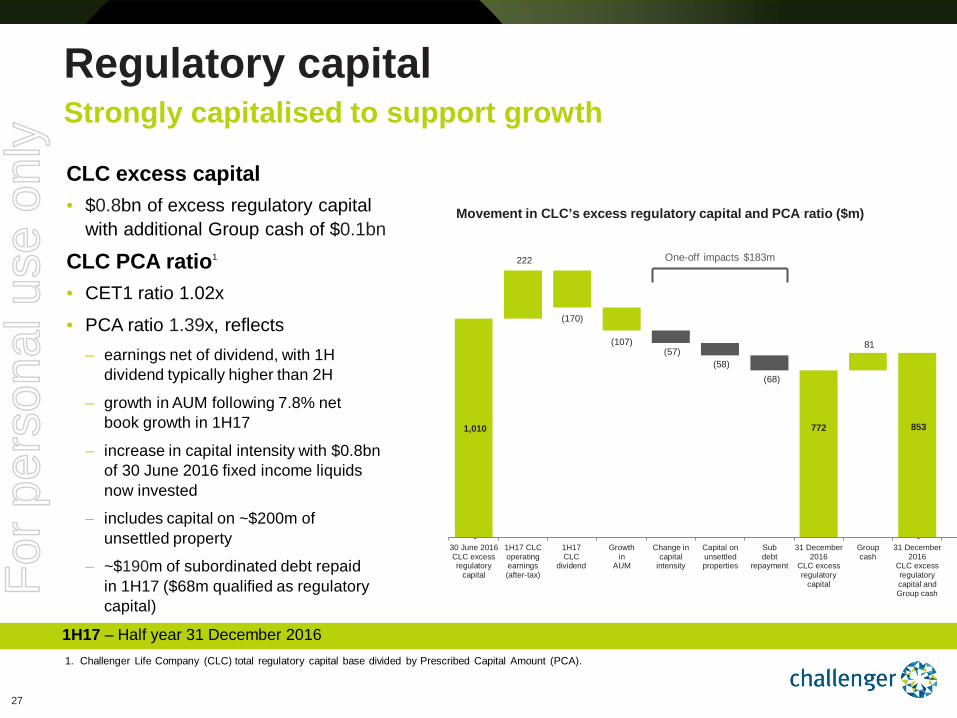
Regulatory capital Strongly capitalised to support growth
CLC excess capital • $0.8bn of excess regulatory capital
with additional Group cash of $0.1bn
CLC PCA ratio1 • CET1 ratio 1.02x
• PCA ratio 1.39x, reflects – earnings net of dividend, with 1H
dividend typically higher than 2H
– growth in AUM following 7.8% net book growth in 1H17
– increase in capital intensity with $0.8bn of 30 June 2016 fixed income liquids now invested
– includes capital on ~$200m of unsettled property
– ~$190m of subordinated debt repaid in 1H17 ($68m qualified as regulatory capital)
1. Challenger Life Company (CLC) total regulatory capital base divided by Prescribed Capital Amount (PCA).
1H17 – Half year 31 December 2016
Movement in CLC’s excess regulatory capital and PCA ratio ($m)
One-off impacts $183m
For
per
sona
l use
onl
y
28
1.0x 1.0x 0.5
1.0
1.5
2.0
Challenger Life31 December 2016
Challenger Life31 December 2016
pro forma
CET1 to PCA Additional Tier 1 capital to PCATier 2 capital to PCA CLC target surplus range
1.52x 1.39x
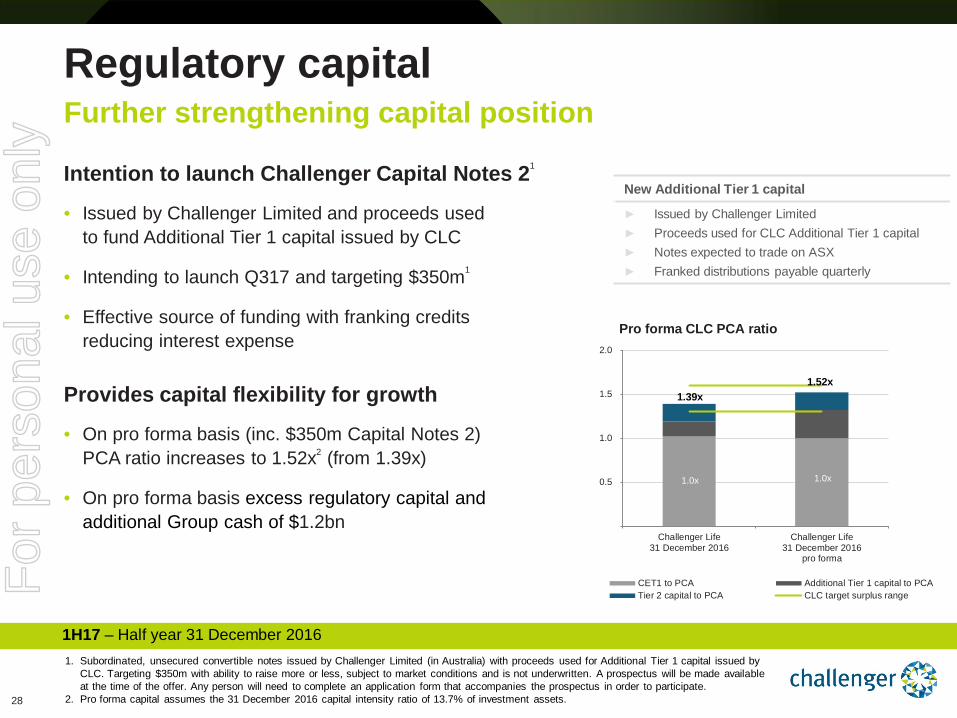
Regulatory capital Further strengthening capital position
Intention to launch Challenger Capital Notes 21
• Issued by Challenger Limited and proceeds used to fund Additional Tier 1 capital issued by CLC
• Intending to launch Q317 and targeting $350m1
• Effective source of funding with franking credits reducing interest expense
Provides capital flexibility for growth
• On pro forma basis (inc. $350m Capital Notes 2) PCA ratio increases to 1.52x2 (from 1.39x)
• On pro forma basis excess regulatory capital and additional Group cash of $1.2bn
Pro forma CLC PCA ratio
1. Subordinated, unsecured convertible notes issued by Challenger Limited (in Australia) with proceeds used for Additional Tier 1 capital issued by CLC. Targeting $350m with ability to raise more or less, subject to market conditions and is not underwritten. A prospectus will be made available at the time of the offer. Any person will need to complete an application form that accompanies the prospectus in order to participate.
2. Pro forma capital assumes the 31 December 2016 capital intensity ratio of 13.7% of investment assets.
1H17 – Half year 31 December 2016
New Additional Tier 1 capital
► Issued by Challenger Limited ► Proceeds used for CLC Additional Tier 1 capital ► Notes expected to trade on ASX ► Franked distributions payable quarterly
For
per
sona
l use
onl
y
29
65 67
3
(3)
2
(3)
1H16net
income
HigherFidante
feeincome
(excl. perffees)
LowerFidante
perf.fees
HigherCIPFUM
basedfees
LowerCIP
otherincome
1H17net
income
Movement in Funds Management net income ($m)
22
16
21
28.4%
19.2%
23.2%
10%
15%
20%
25%
30%
35%
$5m
$10m
$15m
$20m
$25m
1H16 2H16 1H17
FM EBIT FM ROE (pre-tax)
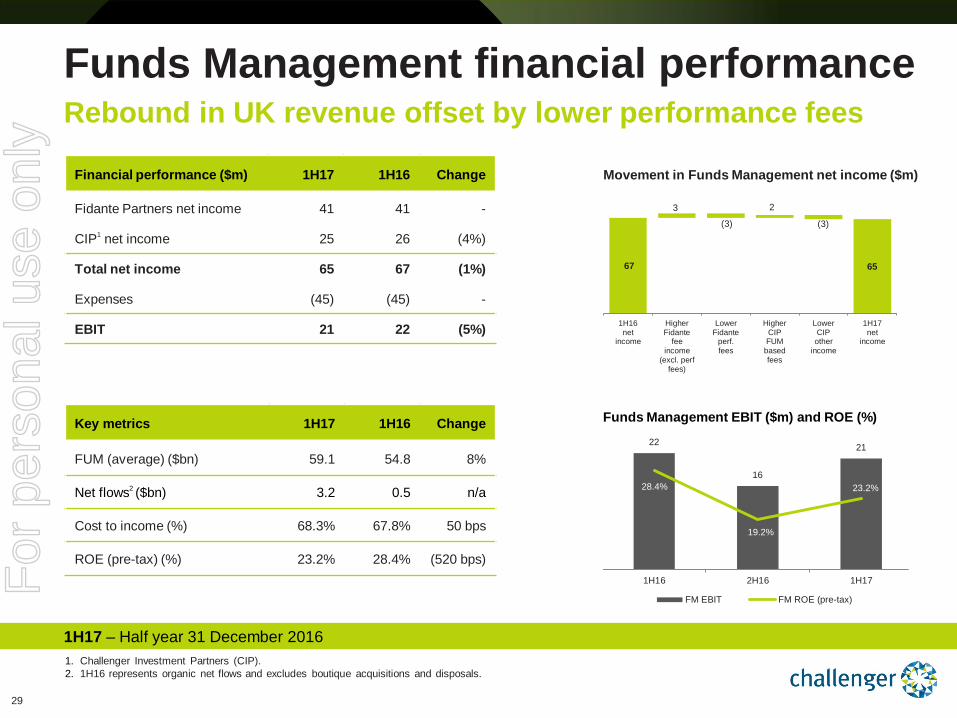
Funds Management financial performance Rebound in UK revenue offset by lower performance fees
Funds Management EBIT ($m) and ROE (%)
1. Challenger Investment Partners (CIP). 2. 1H16 represents organic net flows and excludes boutique acquisitions and disposals.
Financial performance ($m) 1H17 1H16 Change
Fidante Partners net income 41 41 -
CIP1 net income 25 26 (4%)
Total net income 65 67 (1%)
Expenses (45) (45) -
EBIT 21 22 (5%)
Key metrics 1H17 1H16 Change
FUM (average) ($bn) 59.1 54.8 8%
Net flows2 ($bn) 3.2 0.5 n/a
Cost to income (%) 68.3% 67.8% 50 bps
ROE (pre-tax) (%) 23.2% 28.4% (520 bps)
1H17 – Half year 31 December 2016
For
per
sona
l use
onl
y
30
39%
0.9 0.9 (0.1)
44%
52% 42%
9% 14%
2.3
10
20
30
40
50
FY16FUM
Net equityflows
Net fixedincomeflows
Netalternatives
flows
Marketmovements
lessdistributions
1H17FUM
Equities Fixed income Alternatives
43.0 47.0
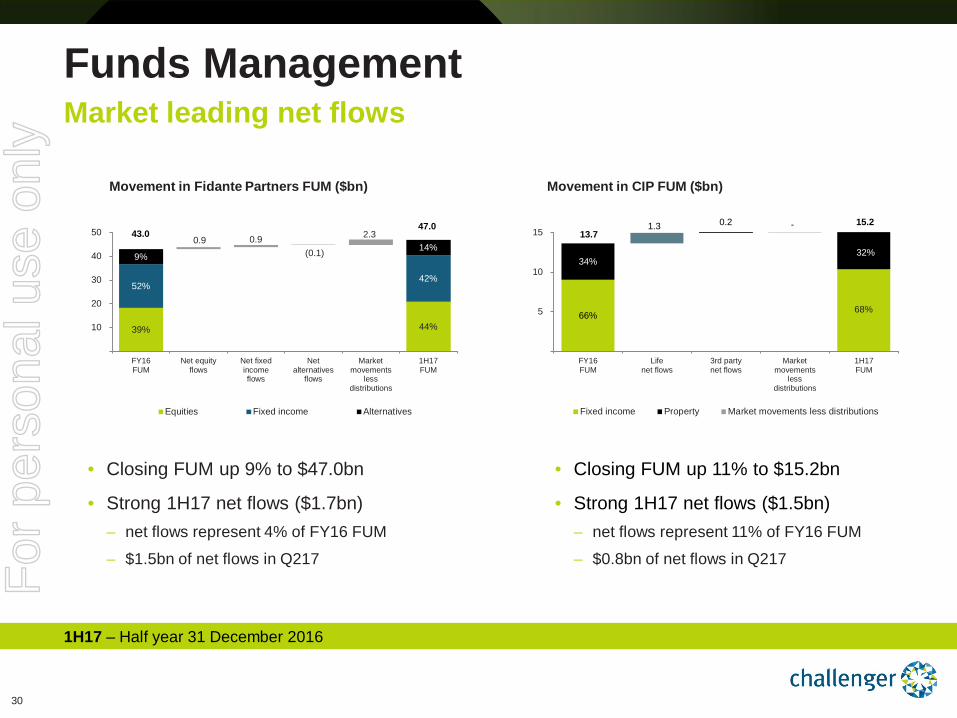
Funds Management Market leading net flows
10%
42%
1H17 – Half year 31 December 2016
13%
• Closing FUM up 9% to $47.0bn
• Strong 1H17 net flows ($1.7bn) – net flows represent 4% of FY16 FUM
– $1.5bn of net flows in Q217
Movement in Fidante Partners FUM ($bn) Movement in CIP FUM ($bn)
• Closing FUM up 11% to $15.2bn
• Strong 1H17 net flows ($1.5bn) – net flows represent 11% of FY16 FUM
– $0.8bn of net flows in Q217
66%
1.3
68%
34%
5
10
15
FY16FUM
Lifenet flows
3rd partynet flows
Marketmovements
lessdistributions
1H17FUM
Fixed income Property Market movements less distributions
15.2 0.2 13.7
32%
-
For
per
sona
l use
onl
y
31
9.5
12.5
4.3
0 0
10.2
16.0 17.0
1H13 1H14 1H15 1H16 1H17
Franked dividend
Unfranked dividend
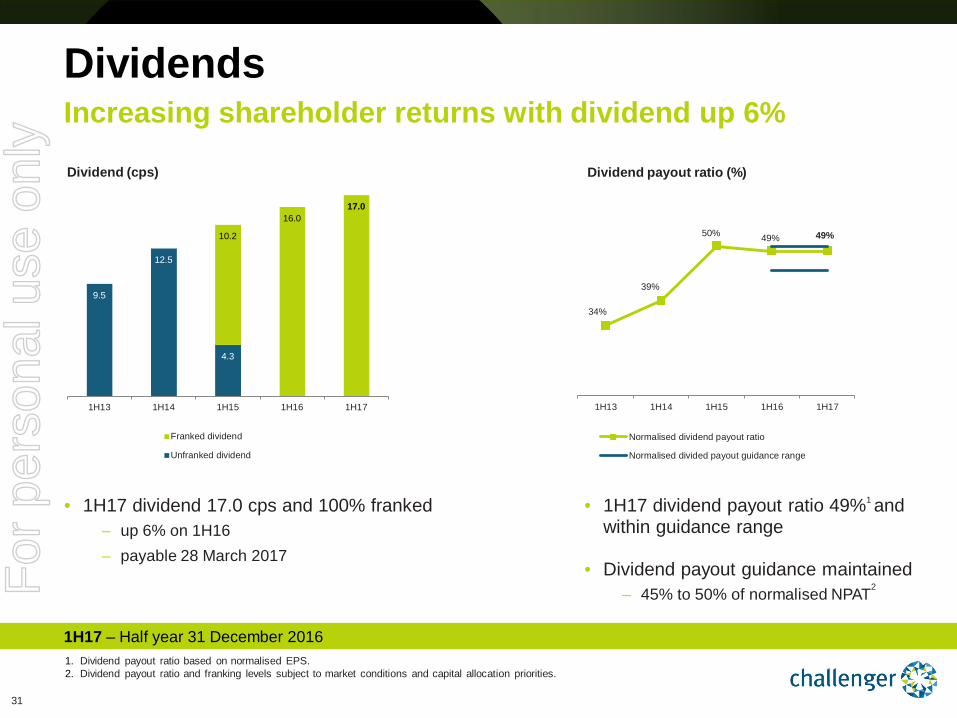
Dividends Increasing shareholder returns with dividend up 6%
• 1H17 dividend 17.0 cps and 100% franked
– up 6% on 1H16 – payable 28 March 2017
Dividend (cps)
1. Dividend payout ratio based on normalised EPS. 2. Dividend payout ratio and franking levels subject to market conditions and capital allocation priorities.
1H17 – Half year 31 December 2016
• 1H17 dividend payout ratio 49%1 and within guidance range
• Dividend payout guidance maintained – 45% to 50% of normalised NPAT2
Dividend payout ratio (%)
34%
39%
50% 49% 49%
1H13 1H14 1H15 1H16 1H17
Normalised dividend payout ratio
Normalised divided payout guidance range
For
per
sona
l use
onl
y
Brian Benari Chief Executive Officer 14 February 2017
Strategy and outlook
1H17 – Half year 31 December 2016
For
per
sona
l use
onl
y
33
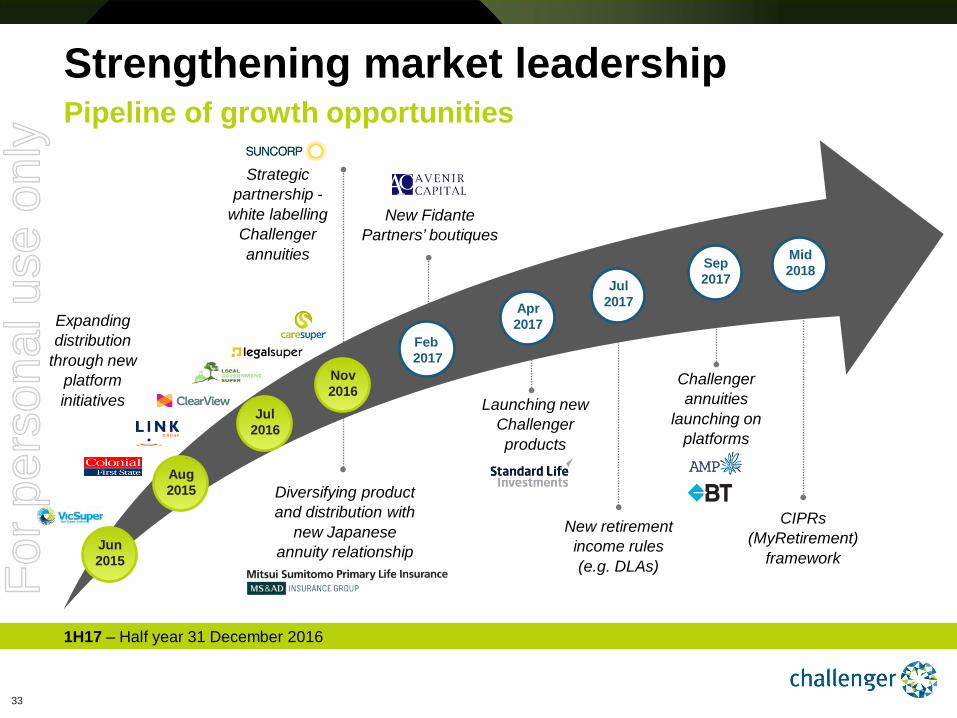
Strengthening market leadership Pipeline of growth opportunities
1H17 – Half year 31 December 2016
Jun 2015
Aug 2015
Jul 2016
Feb 2017
Nov 2016
Expanding distribution
through new platform initiatives
Diversifying product and distribution with
new Japanese annuity relationship
Apr 2017
Launching new Challenger products
Jul 2017
New retirement income rules (e.g. DLAs)
Sep 2017
Challenger annuities
launching on platforms
Mid 2018
CIPRs (MyRetirement)
framework
Strategic partnership -
white labelling Challenger annuities
New Fidante Partners’ boutiques
For
per
sona
l use
onl
y
34
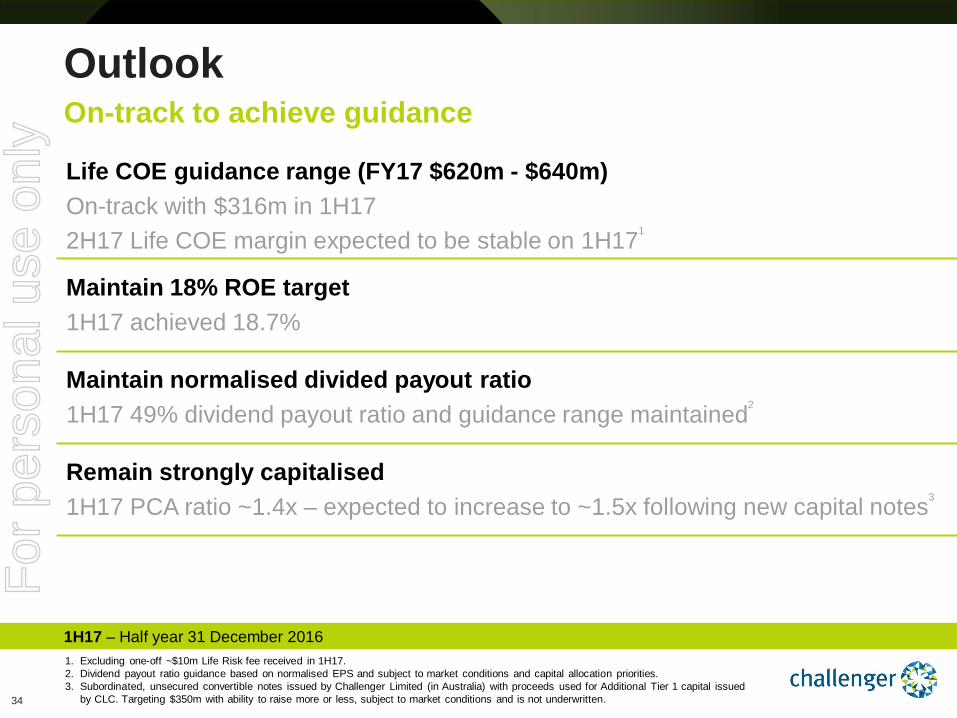
Life COE guidance range (FY17 $620m - $640m) On-track with $316m in 1H17 2H17 Life COE margin expected to be stable on 1H171
Maintain 18% ROE target 1H17 achieved 18.7%
Maintain normalised divided payout ratio 1H17 49% dividend payout ratio and guidance range maintained2
Remain strongly capitalised 1H17 PCA ratio ~1.4x – expected to increase to ~1.5x following new capital notes3
1H17 – Half year 31 December 2016
Outlook
1. Excluding one-off ~$10m Life Risk fee received in 1H17. 2. Dividend payout ratio guidance based on normalised EPS and subject to market conditions and capital allocation priorities. 3. Subordinated, unsecured convertible notes issued by Challenger Limited (in Australia) with proceeds used for Additional Tier 1 capital issued
by CLC. Targeting $350m with ability to raise more or less, subject to market conditions and is not underwritten.
On-track to achieve guidance
For
per
sona
l use
onl
y
35
Financial performance Group – Strong AUM growth supporting earnings and shareholder returns Life – Sales and book growth benefiting from new distribution initiatives Funds Management – Strong net flows and rebound in UK revenue
Operating performance
Broadening product range to meet income layering needs Highly rated distribution attracting new relationships MS Primary relationship – high quality sales and strong start
Outlook
Pipeline of growth opportunities
1H17 – Half year 31 December 2016
Highlights
Driving growth by expanding product and distribution
For
per
sona
l use
onl
y
Appendix additional background information
1H17 – Half year 31 December 2016
For
per
sona
l use
onl
y
37
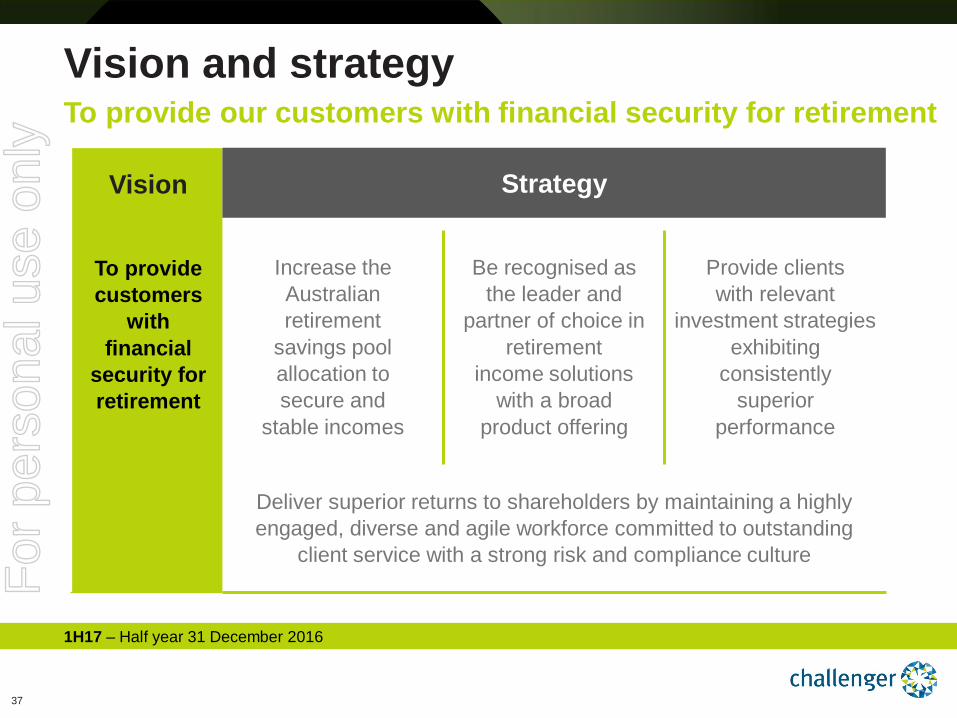
Vision and strategy To provide our customers with financial security for retirement
1H17 – Half year 31 December 2016
PRODUCT PLANNING
Strategy
Increase the Australian retirement
savings pool allocation to secure and
stable incomes
Be recognised as the leader and
partner of choice in retirement
income solutions with a broad
product offering
Provide clients with relevant
investment strategies exhibiting
consistently superior
performance
Deliver superior returns to shareholders by maintaining a highly engaged, diverse and agile workforce committed to outstanding
client service with a strong risk and compliance culture
Vision
To provide customers
with financial
security for retirement
For
per
sona
l use
onl
y
38
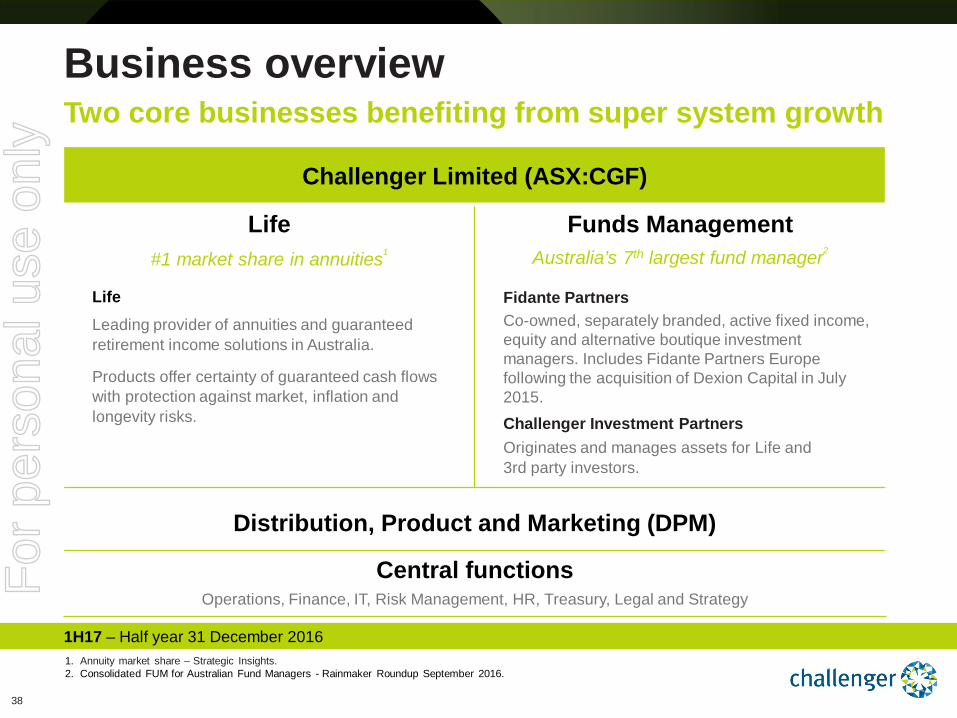
Business overview Two core businesses benefiting from super system growth
1. Annuity market share – Strategic Insights. 2. Consolidated FUM for Australian Fund Managers - Rainmaker Roundup September 2016.
1H17 – Half year 31 December 2016
Challenger Limited (ASX:CGF)
Life #1 market share in annuities1
Funds Management Australia’s 7th largest fund manager2
Life Leading provider of annuities and guaranteed retirement income solutions in Australia.
Products offer certainty of guaranteed cash flows with protection against market, inflation and longevity risks.
Fidante Partners Co-owned, separately branded, active fixed income, equity and alternative boutique investment managers. Includes Fidante Partners Europe following the acquisition of Dexion Capital in July 2015. Challenger Investment Partners Originates and manages assets for Life and 3rd party investors.
Distribution, Product and Marketing (DPM)
Central functions Operations, Finance, IT, Risk Management, HR, Treasury, Legal and Strategy F
or p
erso
nal u
se o
nly
39
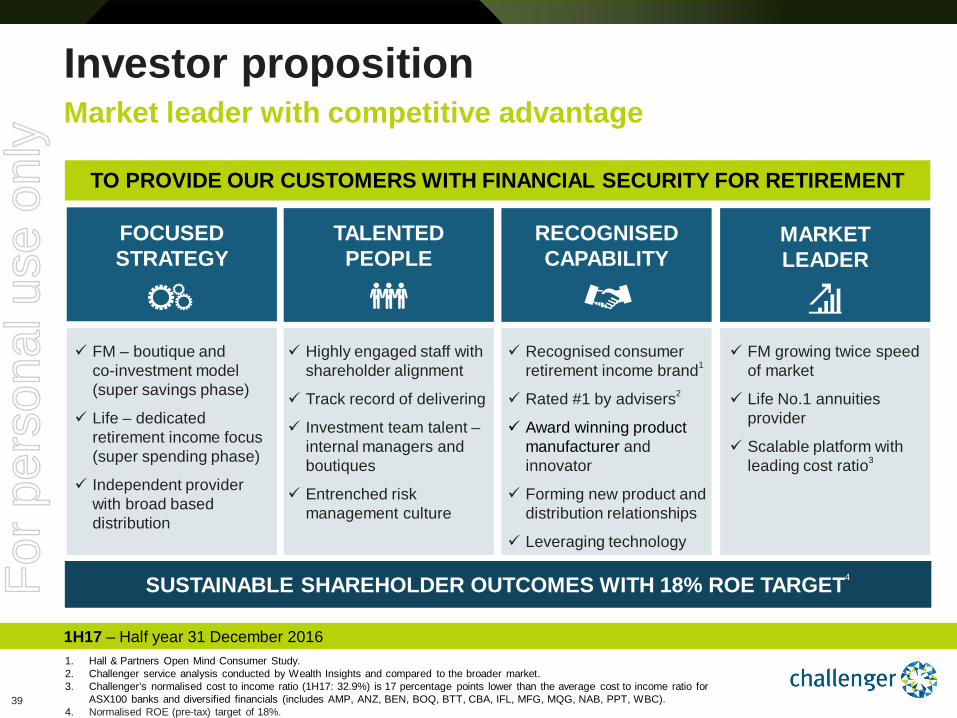
Investor proposition Market leader with competitive advantage
1H17 – Half year 31 December 2016 1. Hall & Partners Open Mind Consumer Study. 2. Challenger service analysis conducted by Wealth Insights and compared to the broader market. 3. Challenger’s normalised cost to income ratio (1H17: 32.9%) is 17 percentage points lower than the average cost to income ratio for
ASX100 banks and diversified financials (includes AMP, ANZ, BEN, BOQ, BTT, CBA, IFL, MFG, MQG, NAB, PPT, WBC). 4. Normalised ROE (pre-tax) target of 18%.
FOCUSED STRATEGY
FM – boutique and co-investment model (super savings phase)
Life – dedicated retirement income focus (super spending phase)
Independent provider with broad based distribution
MARKET LEADER
TALENTED PEOPLE
RECOGNISED CAPABILITY
SUSTAINABLE SHAREHOLDER OUTCOMES WITH 18% ROE TARGET4
Highly engaged staff with shareholder alignment
Track record of delivering
Investment team talent – internal managers and boutiques
Entrenched risk management culture
Recognised consumer retirement income brand1
Rated #1 by advisers2
Award winning product manufacturer and innovator
Forming new product and distribution relationships
Leveraging technology
FM growing twice speed of market
Life No.1 annuities provider
Scalable platform with leading cost ratio3
TO PROVIDE OUR CUSTOMERS WITH FINANCIAL SECURITY FOR RETIREMENT
For
per
sona
l use
onl
y
1H17 – Half year 31 December 2016
Australian superannuation system overview
For
per
sona
l use
onl
y
41
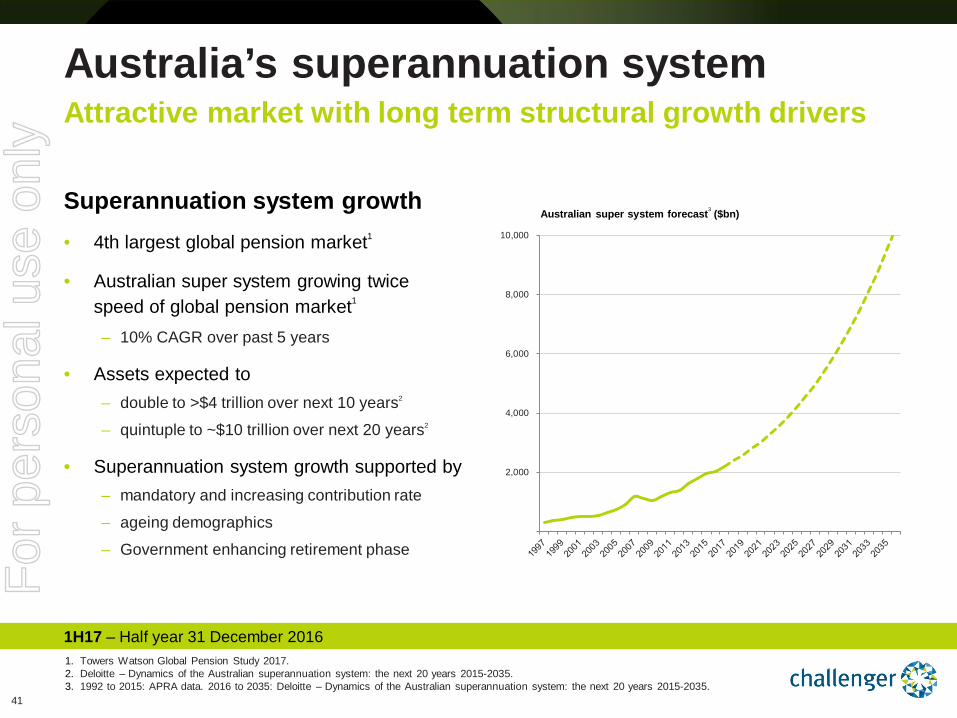
Superannuation system growth • 4th largest global pension market1
• Australian super system growing twice speed of global pension market1
– 10% CAGR over past 5 years
• Assets expected to – double to >$4 trillion over next 10 years2
– quintuple to ~$10 trillion over next 20 years2
• Superannuation system growth supported by – mandatory and increasing contribution rate
– ageing demographics
– Government enhancing retirement phase
1H17 – Half year 31 December 2016
Australia’s superannuation system Attractive market with long term structural growth drivers
1. Towers Watson Global Pension Study 2017. 2. Deloitte – Dynamics of the Australian superannuation system: the next 20 years 2015-2035. 3. 1992 to 2015: APRA data. 2016 to 2035: Deloitte – Dynamics of the Australian superannuation system: the next 20 years 2015-2035.
Quintuple
~$10 trillion over 20 years3
2,000
4,000
6,000
8,000
10,000
Australian super system forecast3 ($bn)
For
per
sona
l use
onl
y
42
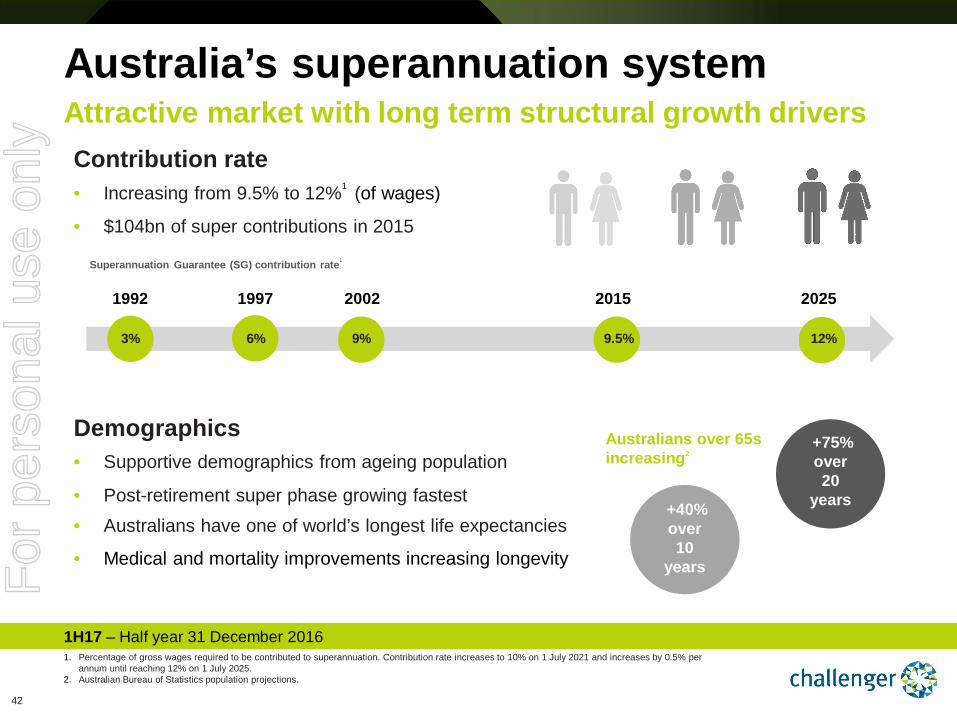
Contribution rate • Increasing from 9.5% to 12%1 (of wages)
• $104bn of super contributions in 2015
Demographics • Supportive demographics from ageing population
• Post-retirement super phase growing fastest • Australians have one of world’s longest life expectancies
• Medical and mortality improvements increasing longevity
Australia’s superannuation system Attractive market with long term structural growth drivers
1H17 – Half year 31 December 2016
1992 1997 2002 2015 2025
12%
1. Percentage of gross wages required to be contributed to superannuation. Contribution rate increases to 10% on 1 July 2021 and increases by 0.5% per annum until reaching 12% on 1 July 2025.
2. Australian Bureau of Statistics population projections.
Superannuation Guarantee (SG) contribution rate1
9.5% 9% 6% 3%
+40% over 10
years
+75% over 20
years
Australians over 65s increasing2
For
per
sona
l use
onl
y
43
2,000
4,000
6,000
8,000
10,000
Pre-retirement assetsSuper savings phase
Post-retirement assetsSuper spending phase
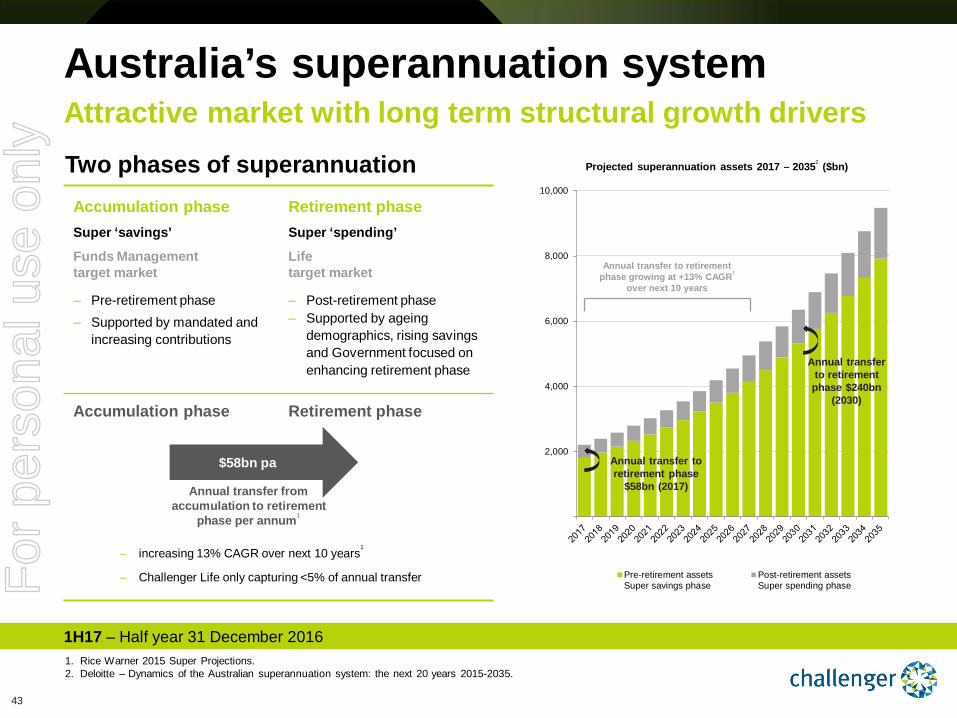
Two phases of superannuation
Australia’s superannuation system Attractive market with long term structural growth drivers
1. Rice Warner 2015 Super Projections. 2. Deloitte – Dynamics of the Australian superannuation system: the next 20 years 2015-2035.
1H17 – Half year 31 December 2016
Projected superannuation assets 2017 – 20352 ($bn)
Annual transfer to retirement phase
$58bn (2017)
Annual transfer to retirement phase $240bn
(2030)
Annual transfer to retirement phase growing at +13% CAGR1
over next 10 years
Accumulation phase Super ‘savings’
Funds Management target market
Retirement phase Super ‘spending’
Life target market
‒ Pre-retirement phase ‒ Supported by mandated and
increasing contributions
‒ Post-retirement phase ‒ Supported by ageing
demographics, rising savings and Government focused on enhancing retirement phase
Accumulation phase Retirement phase
‒ increasing 13% CAGR over next 10 years1
‒ Challenger Life only capturing <5% of annual transfer
$58bn pa
Annual transfer from accumulation to retirement
phase per annum1
For
per
sona
l use
onl
y
44
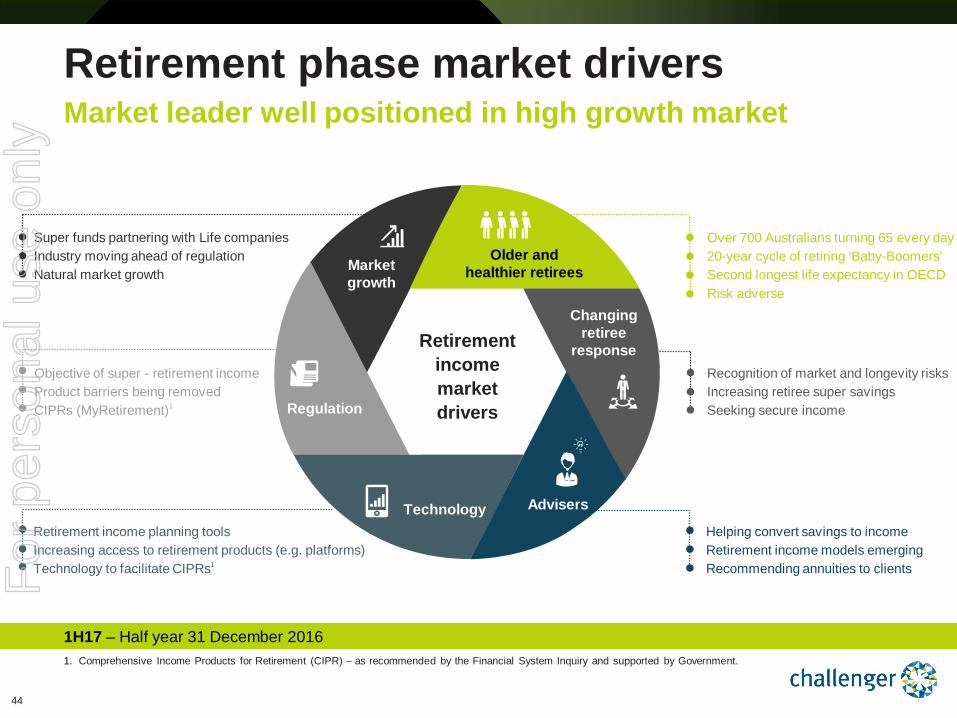
Retirement phase market drivers Market leader well positioned in high growth market
1. Comprehensive Income Products for Retirement (CIPR) – as recommended by the Financial System Inquiry and supported by Government.
1H17 – Half year 31 December 2016
Objective of super - retirement income Product barriers being removed CIPRs (MyRetirement)1
Retirement income market drivers
Market growth
Technology
Older and healthier retirees
Regulation
Changing retiree
response
Advisers
Retirement income planning tools Increasing access to retirement products (e.g. platforms) Technology to facilitate CIPRs1
Super funds partnering with Life companies Industry moving ahead of regulation Natural market growth
Helping convert savings to income Retirement income models emerging Recommending annuities to clients
Recognition of market and longevity risks Increasing retiree super savings Seeking secure income
Over 700 Australians turning 65 every day 20-year cycle of retiring ‘Baby-Boomers’ Second longest life expectancy in OECD Risk adverse
For
per
sona
l use
onl
y
45
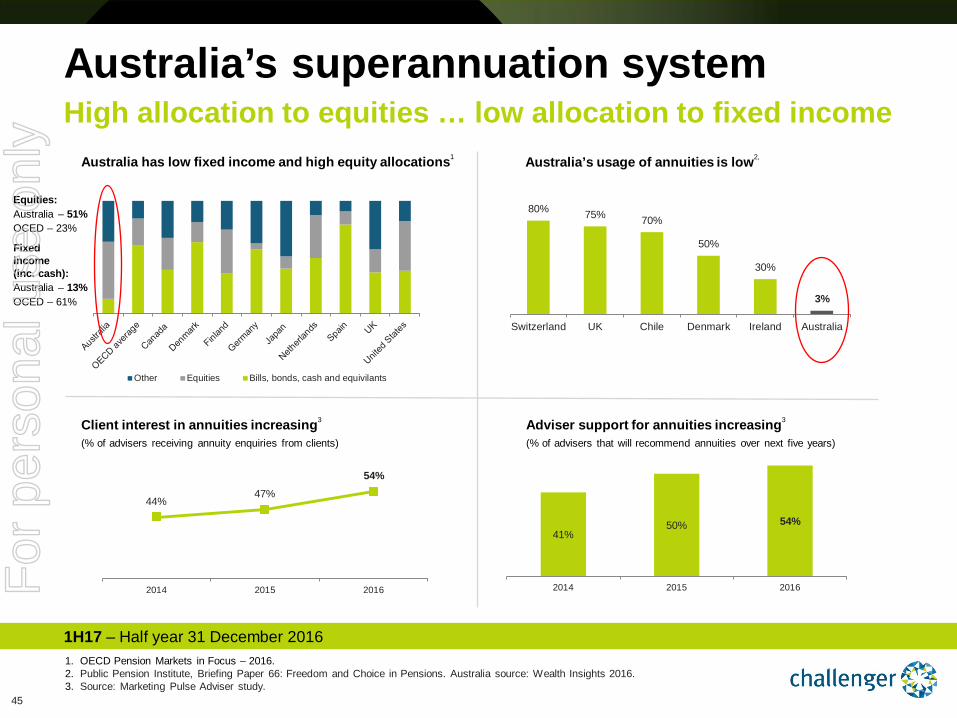
Other Equities Bills, bonds, cash and equivilants
41% 50% 54%
2014 2015 2016
44% 47%
54%
2014 2015 2016
80% 75% 70%
50%
30%
3%
Switzerland UK Chile Denmark Ireland Australia
Australia’s superannuation system
1H17 – Half year 31 December 2016
High allocation to equities … low allocation to fixed income
1. OECD Pension Markets in Focus – 2016. 2. Public Pension Institute, Briefing Paper 66: Freedom and Choice in Pensions. Australia source: Wealth Insights 2016. 3. Source: Marketing Pulse Adviser study.
Australia has low fixed income and high equity allocations1 Australia’s usage of annuities is low2,
Equities: Australia – 51% OCED – 23%
Fixed income (inc. cash): Australia – 13% OCED – 61%
Client interest in annuities increasing3
(% of advisers receiving annuity enquiries from clients)
Adviser support for annuities increasing3
(% of advisers that will recommend annuities over next five years)
For
per
sona
l use
onl
y
46
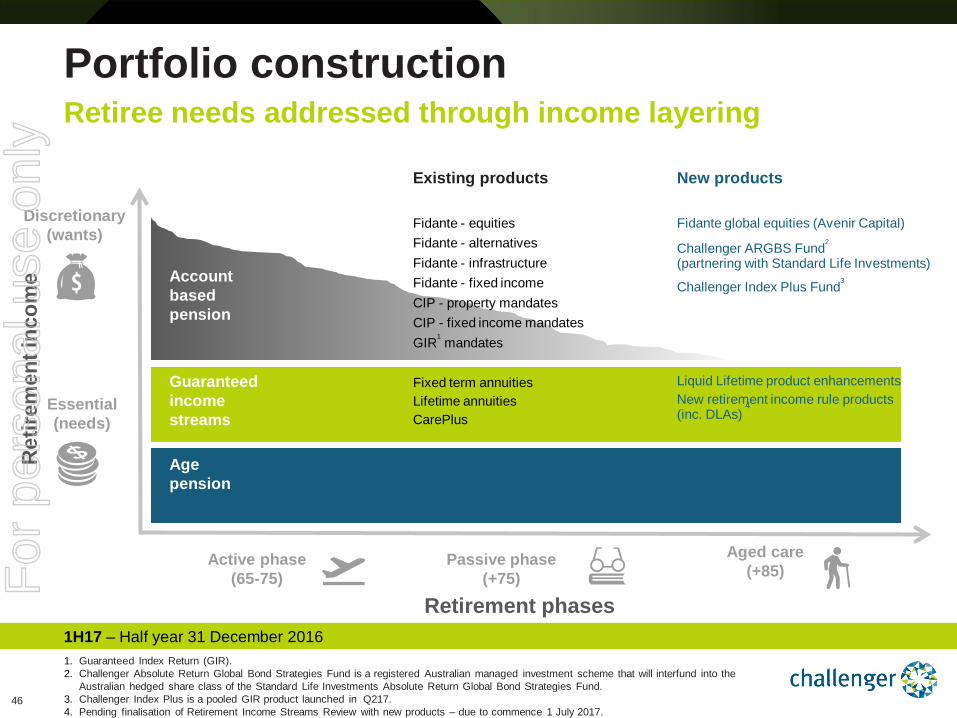
Portfolio construction Retiree needs addressed through income layering
1H17 – Half year 31 December 2016
Age pension
Guaranteed income streams
Account based pension
Active phase (65-75)
Passive phase (+75)
Aged care (+85)
Retirement phases
1. Guaranteed Index Return (GIR). 2. Challenger Absolute Return Global Bond Strategies Fund is a registered Australian managed investment scheme that will interfund into the
Australian hedged share class of the Standard Life Investments Absolute Return Global Bond Strategies Fund. 3. Challenger Index Plus is a pooled GIR product launched in Q217. 4. Pending finalisation of Retirement Income Streams Review with new products – due to commence 1 July 2017.
Existing products New products
Fixed term annuities Lifetime annuities CarePlus
Liquid Lifetime product enhancements New retirement income rule products (inc. DLAs)
4
Ret
irem
ent i
ncom
e
Discretionary (wants)
Essential (needs)
Fidante - equities Fidante - alternatives Fidante - infrastructure Fidante - fixed income CIP - property mandates CIP - fixed income mandates GIR1 mandates
Fidante global equities (Avenir Capital)
Challenger ARGBS Fund2
(partnering with Standard Life Investments)
Challenger Index Plus Fund3
For
per
sona
l use
onl
y
47
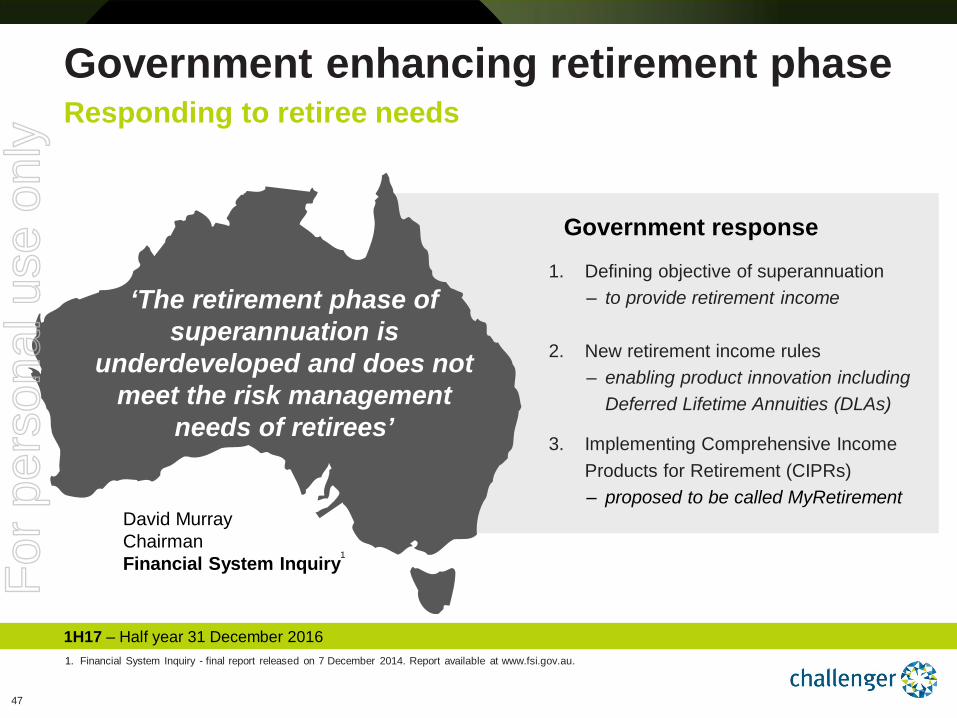
Government enhancing retirement phase Responding to retiree needs
1. Financial System Inquiry - final report released on 7 December 2014. Report available at www.fsi.gov.au.
‘The retirement phase of superannuation is
underdeveloped and does not meet the risk management
needs of retirees’
David Murray Chairman Financial System Inquiry1
Government response
1. Defining objective of superannuation ‒ to provide retirement income
2. New retirement income rules
‒ enabling product innovation including Deferred Lifetime Annuities (DLAs)
3. Implementing Comprehensive Income Products for Retirement (CIPRs) ‒ proposed to be called MyRetirement
1H17 – Half year 31 December 2016
For
per
sona
l use
onl
y
48
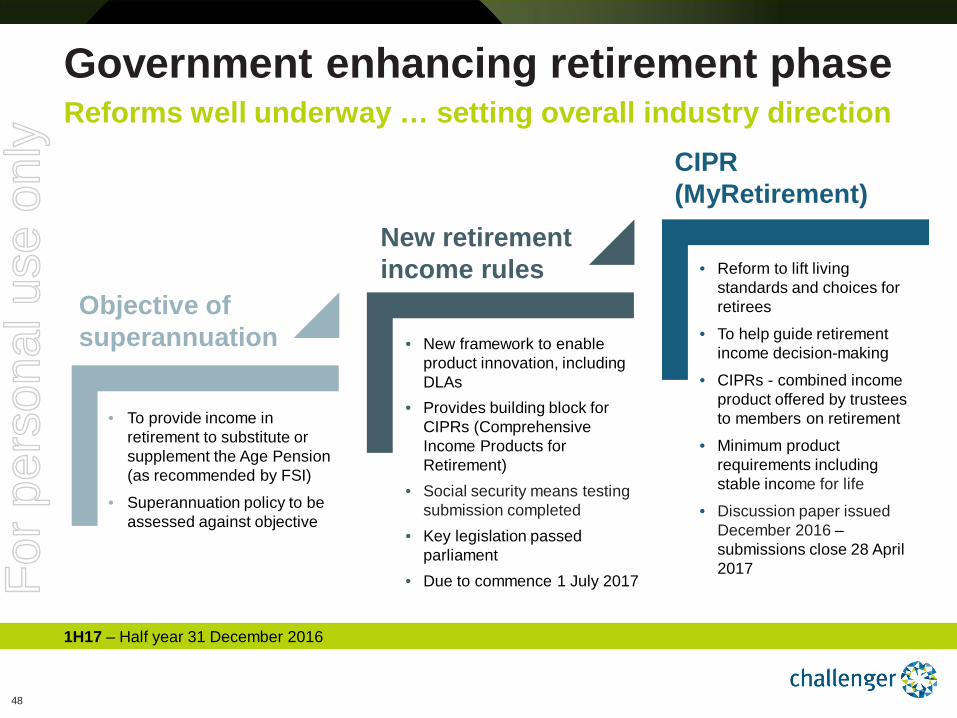
Reforms well underway … setting overall industry direction Government enhancing retirement phase
1H17 – Half year 31 December 2016
z z
z Objective of superannuation
New retirement income rules
CIPR (MyRetirement)
• To provide income in retirement to substitute or supplement the Age Pension (as recommended by FSI)
• Superannuation policy to be assessed against objective
• New framework to enable product innovation, including DLAs
• Provides building block for CIPRs (Comprehensive Income Products for Retirement)
• Social security means testing submission completed
• Key legislation passed parliament
• Due to commence 1 July 2017
• Reform to lift living standards and choices for retirees
• To help guide retirement income decision-making
• CIPRs - combined income product offered by trustees to members on retirement
• Minimum product requirements including stable income for life
• Discussion paper issued December 2016 – submissions close 28 April 2017 F
or p
erso
nal u
se o
nly
49
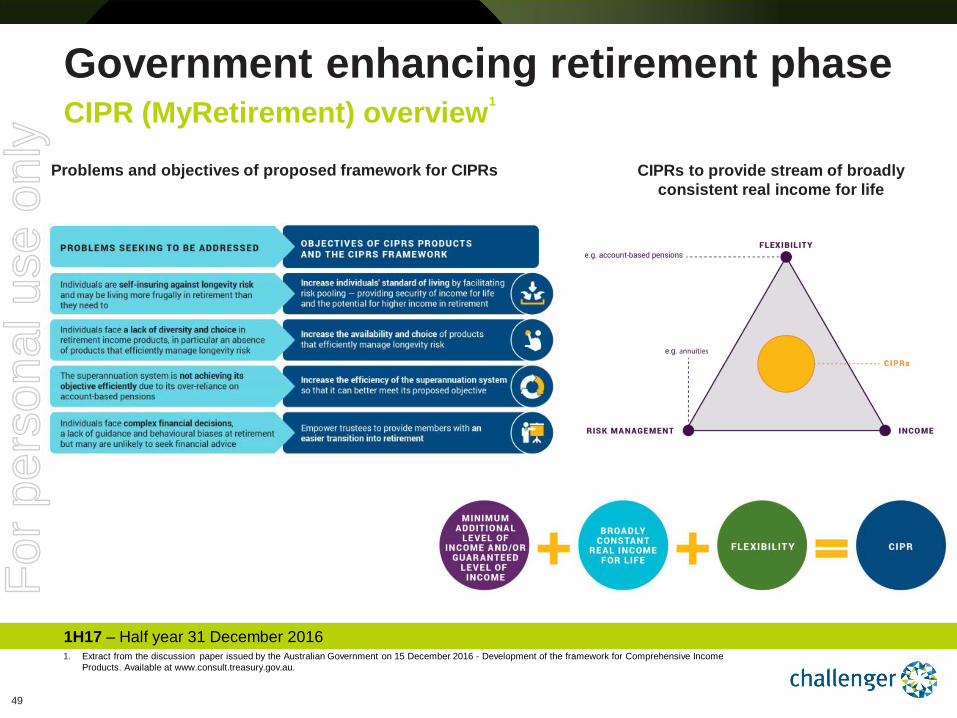
CIPR (MyRetirement) overview1
Government enhancing retirement phase
1H17 – Half year 31 December 2016
Problems and objectives of proposed framework for CIPRs CIPRs to provide stream of broadly consistent real income for life
1. Extract from the discussion paper issued by the Australian Government on 15 December 2016 - Development of the framework for Comprehensive Income Products. Available at www.consult.treasury.gov.au.
For
per
sona
l use
onl
y
1H17 – Half year 31 December 2016
Life – Distribution, Product and Marketing (DPM)
For
per
sona
l use
onl
y
51
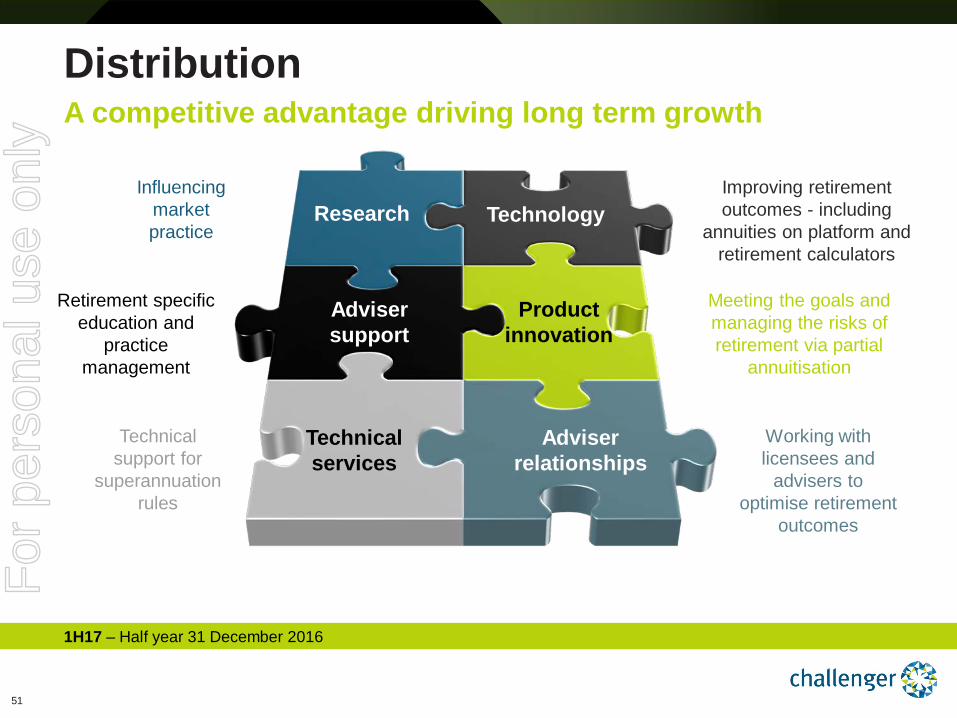
Distribution A competitive advantage driving long term growth
1H17 – Half year 31 December 2016
Influencing market practice
Improving retirement outcomes - including
annuities on platform and retirement calculators
Working with licensees and
advisers to optimise retirement
outcomes
Meeting the goals and managing the risks of retirement via partial
annuitisation
Technical support for
superannuation rules
Retirement specific education and
practice management
Technology Research
Adviser support
Adviser relationships
Technical services
Product innovation
For
per
sona
l use
onl
y
52
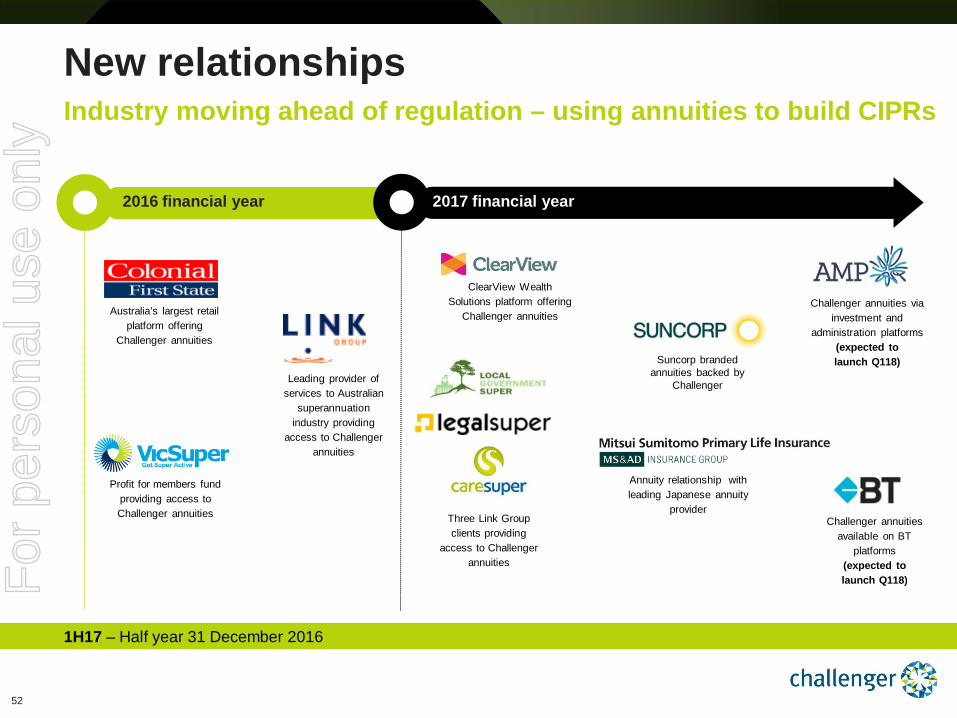
Industry moving ahead of regulation – using annuities to build CIPRs New relationships
2016 financial year 2016 financial year 2017 financial year
Profit for members fund providing access to Challenger annuities
Australia’s largest retail platform offering
Challenger annuities
June 2016
Leading provider of services to Australian
superannuation industry providing
access to Challenger annuities
ClearView Wealth Solutions platform offering
Challenger annuities
Annuity relationship with leading Japanese annuity
provider Three Link Group clients providing
access to Challenger annuities
1H17 – Half year 31 December 2016
Challenger annuities via investment and
administration platforms (expected to launch Q118)
Challenger annuities available on BT
platforms (expected to launch Q118)
Suncorp branded annuities backed by
Challenger
For
per
sona
l use
onl
y

53
24%
21%
19%
10%
6%
5%
3% 2%
10%
64%
Colonial (CBA)
BT (Westpac)
AMP
MLC (NAB)
Macquarie
IOOF
netwealth
ANZ
Other
33%
38%
29%
Retail SMSF Industry
New relationships strengthening leadership
1. Following launch of AMP and BT, new platform relationships will provide access to one third of Australian superannuation industry FUM. 2. Australian super system size based on APRA annual superannuation bulletin and market share based on Strategic Insights analysis of retail managed funds. 3. Following launch of AMP and BT, new platform relationships will provide access to two thirds of Australian financial advisers. 4. Wealth Insights 2016 Adviser Market Trends Report - provider footprint (primary platform used by advisers).
New platform relationships
Platforms broadening access to Challenger annuities
Australian super
system ~$2.1 trillion
1H17 – Half year 31 December 2016
Q118
Q118
Challenger annuities available
off-platform
New platform relationships
Australian financial adviser market
Provides access to ~1/3rd of super industry FUM1,2
Provides access to ~2/3rd’s of financial advisers3,4
For
per
sona
l use
onl
y
54
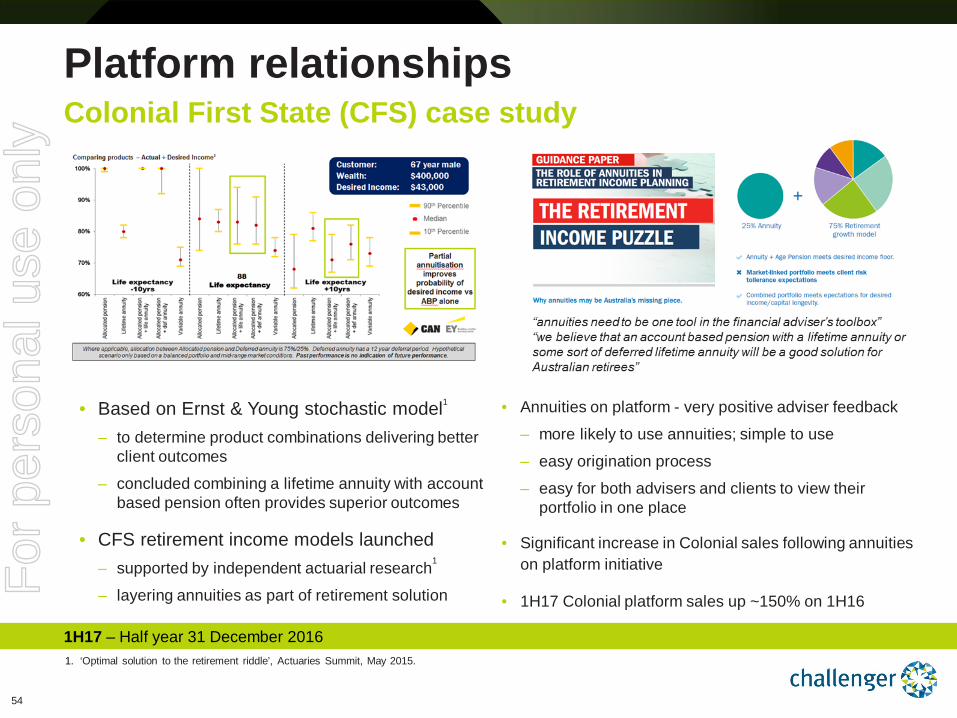
Platform relationships Colonial First State (CFS) case study
1. ‘Optimal solution to the retirement riddle’, Actuaries Summit, May 2015.
1H17 – Half year 31 December 2016
• Annuities on platform - very positive adviser feedback
– more likely to use annuities; simple to use
– easy origination process
– easy for both advisers and clients to view their portfolio in one place
• Significant increase in Colonial sales following annuities on platform initiative
• 1H17 Colonial platform sales up ~150% on 1H16
• Based on Ernst & Young stochastic model1
– to determine product combinations delivering better client outcomes
– concluded combining a lifetime annuity with account based pension often provides superior outcomes
• CFS retirement income models launched – supported by independent actuarial research1
– layering annuities as part of retirement solution For
per
sona
l use
onl
y
55
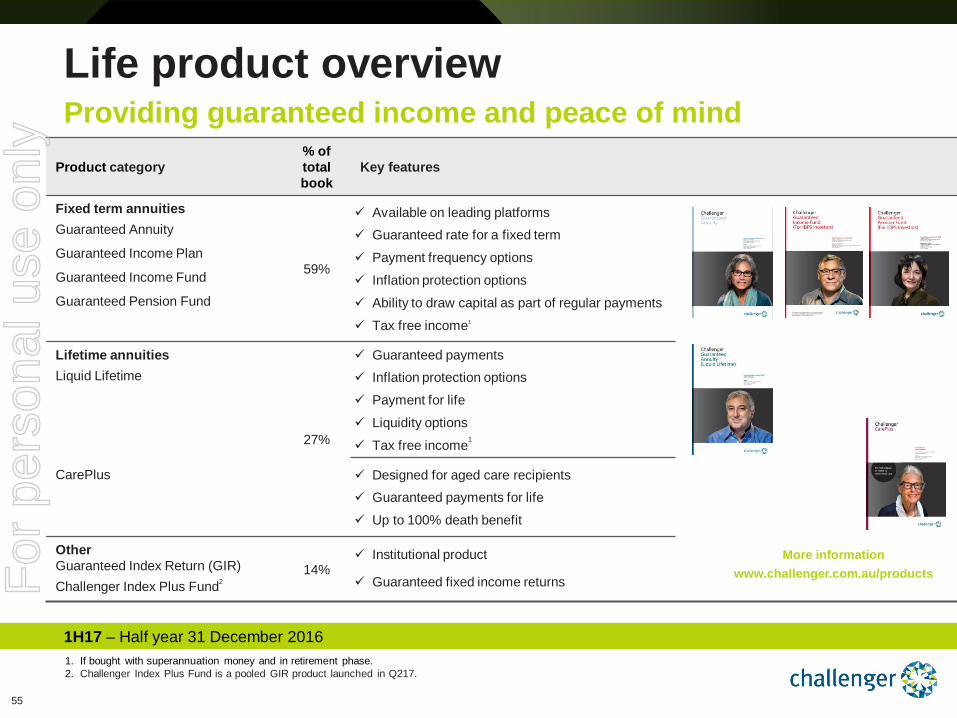
Product category % of total book
Key features
Fixed term annuities Guaranteed Annuity
Guaranteed Income Plan
Guaranteed Income Fund
Guaranteed Pension Fund
59%
Available on leading platforms
Guaranteed rate for a fixed term
Payment frequency options
Inflation protection options
Ability to draw capital as part of regular payments
Tax free income1
More information
www.challenger.com.au/products
Lifetime annuities Liquid Lifetime CarePlus
27%
Guaranteed payments
Inflation protection options
Payment for life
Liquidity options
Tax free income1
Designed for aged care recipients
Guaranteed payments for life
Up to 100% death benefit
Other Guaranteed Index Return (GIR) Challenger Index Plus Fund2
14% Institutional product
Guaranteed fixed income returns
Life product overview Providing guaranteed income and peace of mind
1. If bought with superannuation money and in retirement phase. 2. Challenger Index Plus Fund is a pooled GIR product launched in Q217.
1H17 – Half year 31 December 2016
For
per
sona
l use
onl
y
56
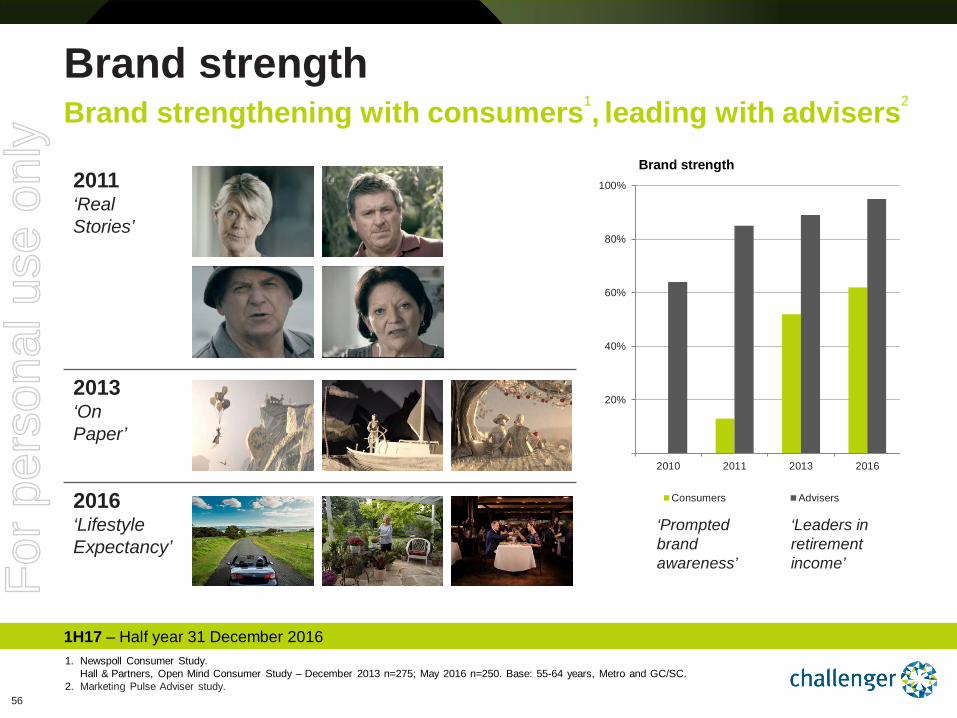
Brand strength
2011 ‘Real Stories’
2013 ‘On Paper’
2016 ‘Lifestyle Expectancy’
Brand strengthening with consumers1, leading with advisers2
1. Newspoll Consumer Study. Hall & Partners, Open Mind Consumer Study – December 2013 n=275; May 2016 n=250. Base: 55-64 years, Metro and GC/SC.
2. Marketing Pulse Adviser study.
1H17 – Half year 31 December 2016
20%
40%
60%
80%
100%
2010 2011 2013 2016
Consumers Advisers
‘Prompted brand awareness’
‘Leaders in retirement income’
Brand strength
For
per
sona
l use
onl
y
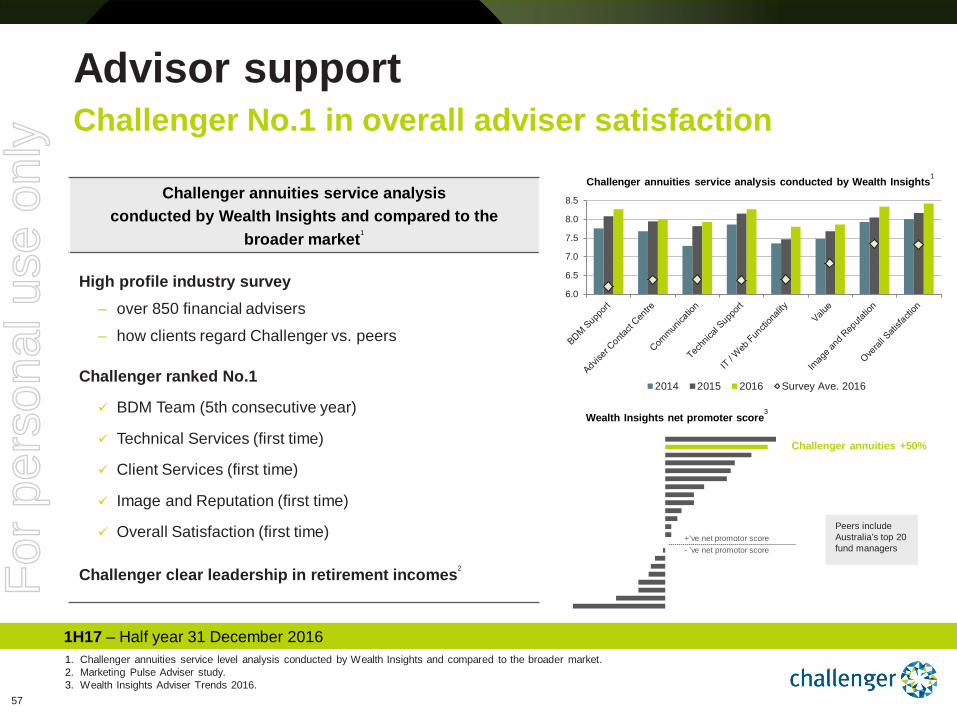
57
Challenger annuities +50%
Peers include Australia’s top 20 fund managers
6.0
6.5
7.0
7.5
8.0
8.5
2014 2015 2016 Survey Ave. 2016
1. Challenger annuities service level analysis conducted by Wealth Insights and compared to the broader market. 2. Marketing Pulse Adviser study. 3. Wealth Insights Adviser Trends 2016.
Advisor support Challenger No.1 in overall adviser satisfaction
1H17 – Half year 31 December 2016
Wealth Insights net promoter score3
Challenger annuities service analysis conducted by Wealth Insights and compared to the
broader market1
High profile industry survey – over 850 financial advisers
– how clients regard Challenger vs. peers
Challenger ranked No.1
BDM Team (5th consecutive year)
Technical Services (first time)
Client Services (first time)
Image and Reputation (first time)
Overall Satisfaction (first time)
Challenger clear leadership in retirement incomes2
Challenger annuities service analysis conducted by Wealth Insights1
+’ve net promotor score - ’ve net promotor score
For
per
sona
l use
onl
y
1H17 – Half year 31 December 2016
Life - financials
For
per
sona
l use
onl
y
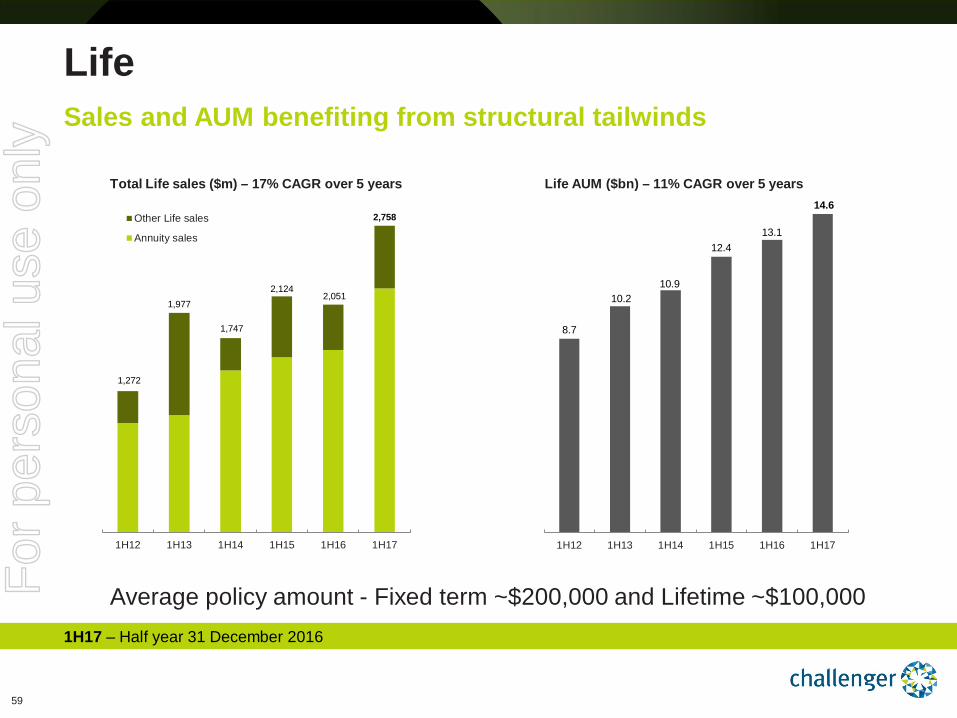
59
1,272
1,977
1,747
2,124 2,051
2,758
1H12 1H13 1H14 1H15 1H16 1H17
Other Life sales
Annuity sales
Life Sales and AUM benefiting from structural tailwinds
Total Life sales ($m) – 17% CAGR over 5 years
8.7
10.2 10.9
12.4 13.1
14.6
1H12 1H13 1H14 1H15 1H16 1H17
Life AUM ($bn) – 11% CAGR over 5 years
1H17 – Half year 31 December 2016
Average policy amount - Fixed term ~$200,000 and Lifetime ~$100,000 For
per
sona
l use
onl
y
60
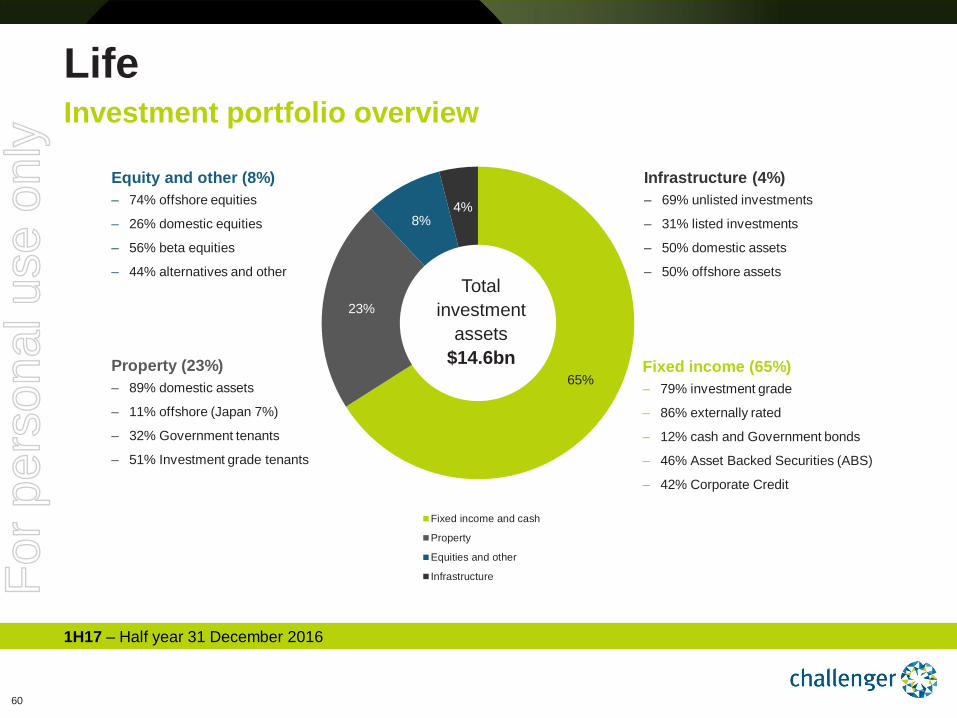
65%
23%
8% 4%
Fixed income and cash
Property
Equities and other
Infrastructure
Total investment
assets $14.6bn
Equity and other (8%) ‒ 74% offshore equities
‒ 26% domestic equities
‒ 56% beta equities
‒ 44% alternatives and other
Life Investment portfolio overview
1H17 – Half year 31 December 2016
Fixed income (65%) ‒ 79% investment grade
‒ 86% externally rated
‒ 12% cash and Government bonds
‒ 46% Asset Backed Securities (ABS)
‒ 42% Corporate Credit
Infrastructure (4%) ‒ 69% unlisted investments
‒ 31% listed investments
‒ 50% domestic assets
‒ 50% offshore assets
Property (23%) ‒ 89% domestic assets
‒ 11% offshore (Japan 7%)
‒ 32% Government tenants
‒ 51% Investment grade tenants
For
per
sona
l use
onl
y
61
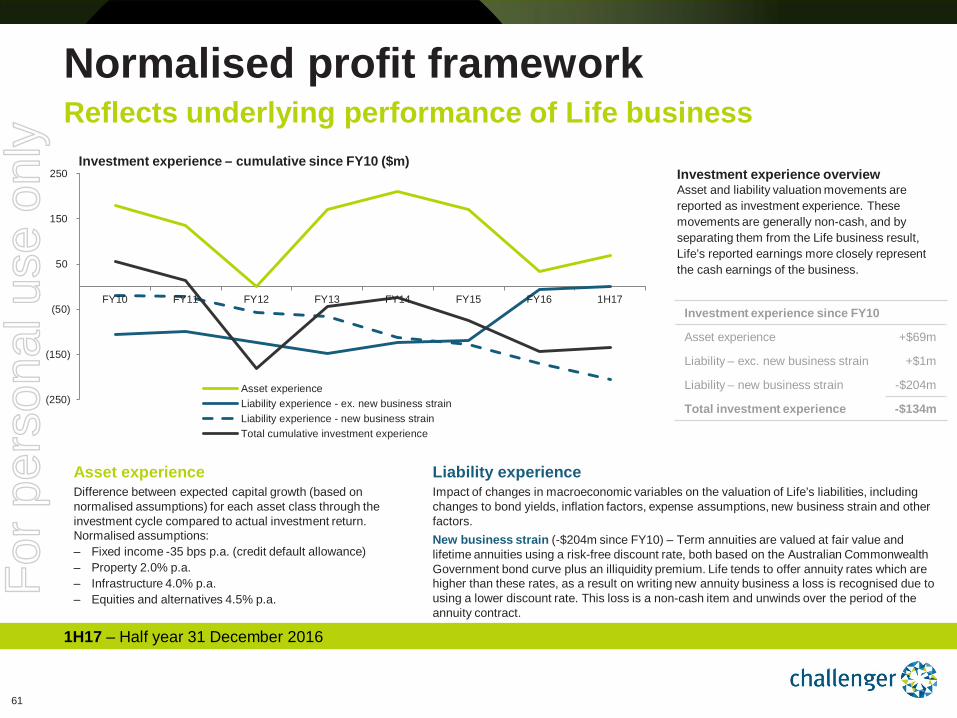
(250)
(150)
(50)
50
150
250
FY10 FY11 FY12 FY13 FY14 FY15 FY16 1H17
Asset experienceLiability experience - ex. new business strainLiability experience - new business strainTotal cumulative investment experience
1H17 – Half year 31 December 2016
Normalised profit framework Reflects underlying performance of Life business
Asset experience Difference between expected capital growth (based on normalised assumptions) for each asset class through the investment cycle compared to actual investment return. Normalised assumptions: ‒ Fixed income -35 bps p.a. (credit default allowance) ‒ Property 2.0% p.a. ‒ Infrastructure 4.0% p.a. ‒ Equities and alternatives 4.5% p.a.
Investment experience – cumulative since FY10 ($m)
Investment experience overview Asset and liability valuation movements are reported as investment experience. These movements are generally non-cash, and by separating them from the Life business result, Life’s reported earnings more closely represent the cash earnings of the business.
Investment experience since FY10
Asset experience +$69m
Liability – exc. new business strain +$1m
Liability – new business strain -$204m
Total investment experience -$134m
Liability experience Impact of changes in macroeconomic variables on the valuation of Life’s liabilities, including changes to bond yields, inflation factors, expense assumptions, new business strain and other factors. New business strain (-$204m since FY10) – Term annuities are valued at fair value and lifetime annuities using a risk-free discount rate, both based on the Australian Commonwealth Government bond curve plus an illiquidity premium. Life tends to offer annuity rates which are higher than these rates, as a result on writing new annuity business a loss is recognised due to using a lower discount rate. This loss is a non-cash item and unwinds over the period of the annuity contract.
For
per
sona
l use
onl
y
62
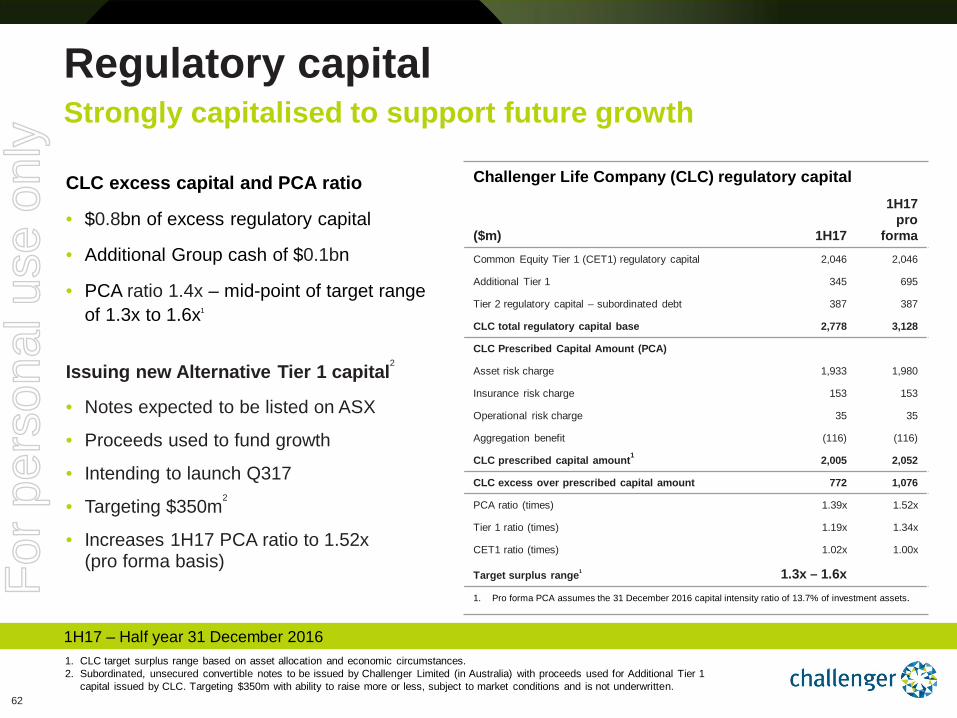
Challenger Life Company (CLC) regulatory capital
($m) 1H17
1H17 pro
forma Common Equity Tier 1 (CET1) regulatory capital 2,046 2,046
Additional Tier 1 345 695
Tier 2 regulatory capital – subordinated debt
387 387
CLC total regulatory capital base 2,778 3,128
CLC Prescribed Capital Amount (PCA)
Asset risk charge 1,933 1,980
Insurance risk charge 153 153
Operational risk charge 35 35
Aggregation benefit (116) (116)
CLC prescribed capital amount1 2,005 2,052
CLC excess over prescribed capital amount 772 1,076
PCA ratio (times) 1.39x 1.52x
Tier 1 ratio (times) 1.19x 1.34x
CET1 ratio (times) 1.02x 1.00x
Target surplus range1 1.3x – 1.6x 1. Pro forma PCA assumes the 31 December 2016 capital intensity ratio of 13.7% of investment assets.
Regulatory capital
1H17 – Half year 31 December 2016
Strongly capitalised to support future growth
1. CLC target surplus range based on asset allocation and economic circumstances. 2. Subordinated, unsecured convertible notes to be issued by Challenger Limited (in Australia) with proceeds used for Additional Tier 1
capital issued by CLC. Targeting $350m with ability to raise more or less, subject to market conditions and is not underwritten.
CLC excess capital and PCA ratio
• $0.8bn of excess regulatory capital
• Additional Group cash of $0.1bn
• PCA ratio 1.4x – mid-point of target range of 1.3x to 1.6x1
Issuing new Alternative Tier 1 capital2
• Notes expected to be listed on ASX
• Proceeds used to fund growth
• Intending to launch Q317
• Targeting $350m2
• Increases 1H17 PCA ratio to 1.52x (pro forma basis) F
or p
erso
nal u
se o
nly
1H17 – Half year 31 December 2016
Funds Management
For
per
sona
l use
onl
y
64
28
35
45
55 55
62
1H12 1H13 1H14 1H15 1H16 1H17
Challenger Investment Partners Fidante Partners
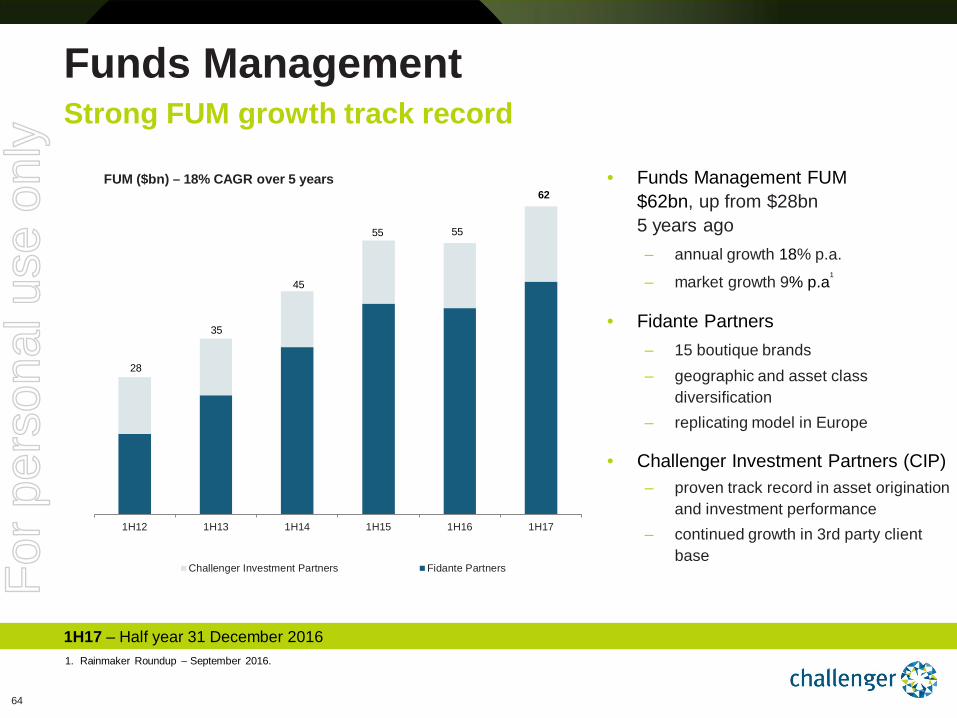
FUM ($bn) – 18% CAGR over 5 years • Funds Management FUM $62bn, up from $28bn 5 years ago
‒ annual growth 18% p.a.
‒ market growth 9% p.a1
• Fidante Partners ‒ 15 boutique brands ‒ geographic and asset class
diversification ‒ replicating model in Europe
• Challenger Investment Partners (CIP) – proven track record in asset origination
and investment performance – continued growth in 3rd party client
base
1H17 – Half year 31 December 2016
Funds Management Strong FUM growth track record
1. Rainmaker Roundup – September 2016.
For
per
sona
l use
onl
y
65
(0.5)
0.0
0.5
1.0
1.5
2.0
2.5
Jun-13 Sep-13 Dec-13 Mar-14 Sep-14 Dec-14 Mar-15 Jun-15 Sep-15 Dec-15 Mar-16 Jun-16 Sep-16 Dec-16
Challenger Funds Management Peer average
Funds Management
1H17 – Half year 31 December 2016
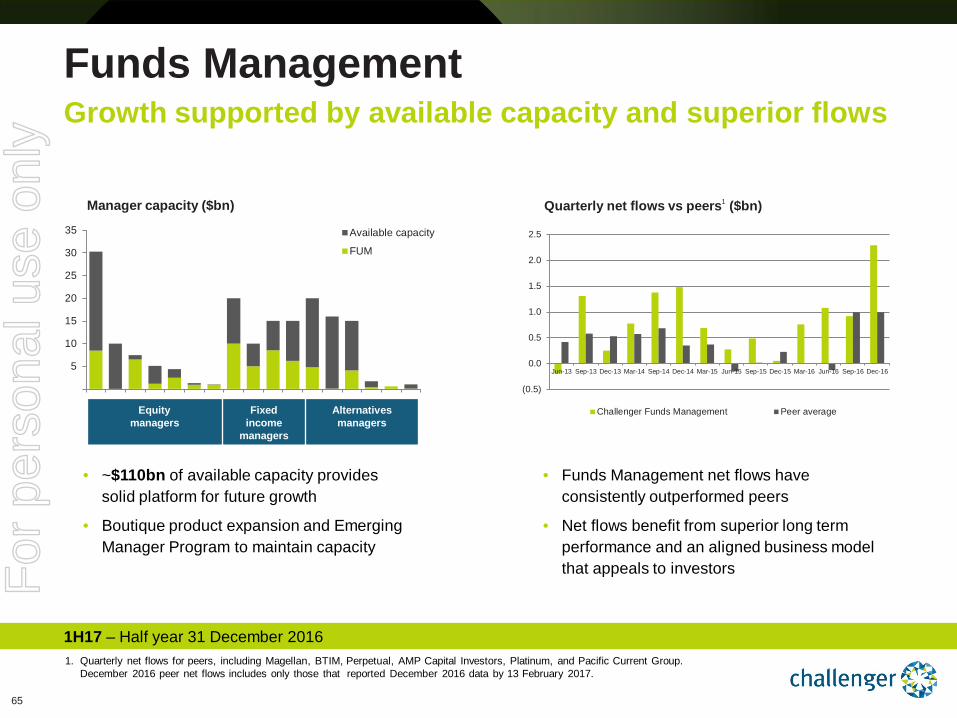
Growth supported by available capacity and superior flows
Quarterly net flows vs peers1 ($bn)
1. Quarterly net flows for peers, including Magellan, BTIM, Perpetual, AMP Capital Investors, Platinum, and Pacific Current Group. December 2016 peer net flows includes only those that reported December 2016 data by 13 February 2017.
Manager capacity ($bn)
• ~$110bn of available capacity provides solid platform for future growth
• Boutique product expansion and Emerging Manager Program to maintain capacity
• Funds Management net flows have consistently outperformed peers
• Net flows benefit from superior long term performance and an aligned business model that appeals to investors
5
10
15
20
25
30
35 Available capacity
FUM
Equity managers
Fixed income
managers
Alternatives managers
For
per
sona
l use
onl
y
66
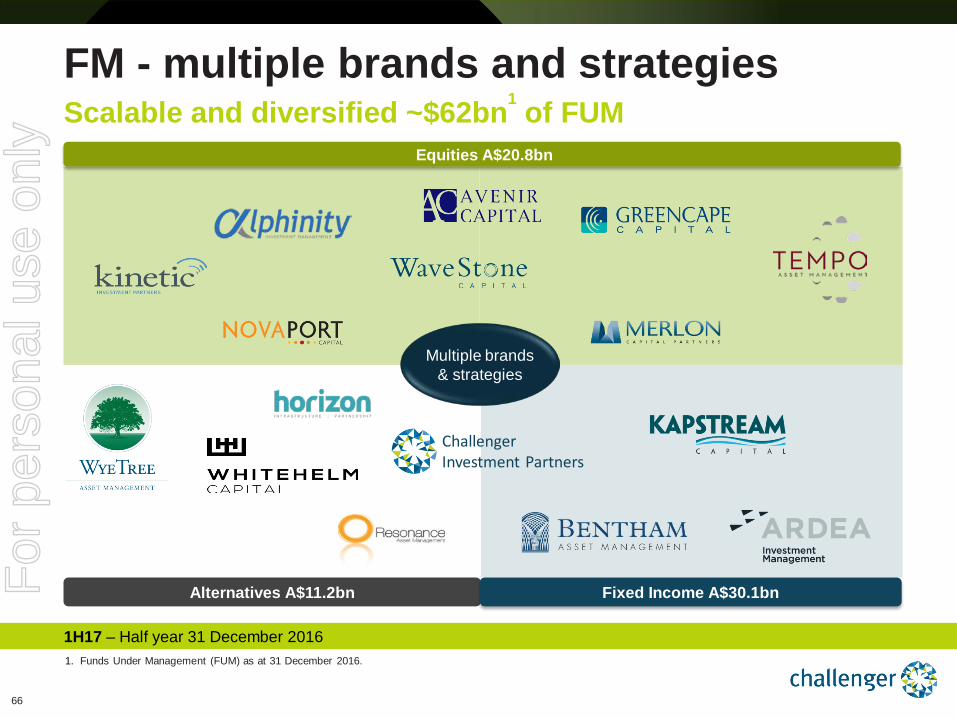
FM - multiple brands and strategies Scalable and diversified ~$62bn1 of FUM
Alternatives A$11.2bn Fixed Income A$30.1bn
Equities A$20.8bn
Multiple brands & strategies
Challenger Investment Partners
1H17 – Half year 31 December 2016 1. Funds Under Management (FUM) as at 31 December 2016.
For
per
sona
l use
onl
y
67
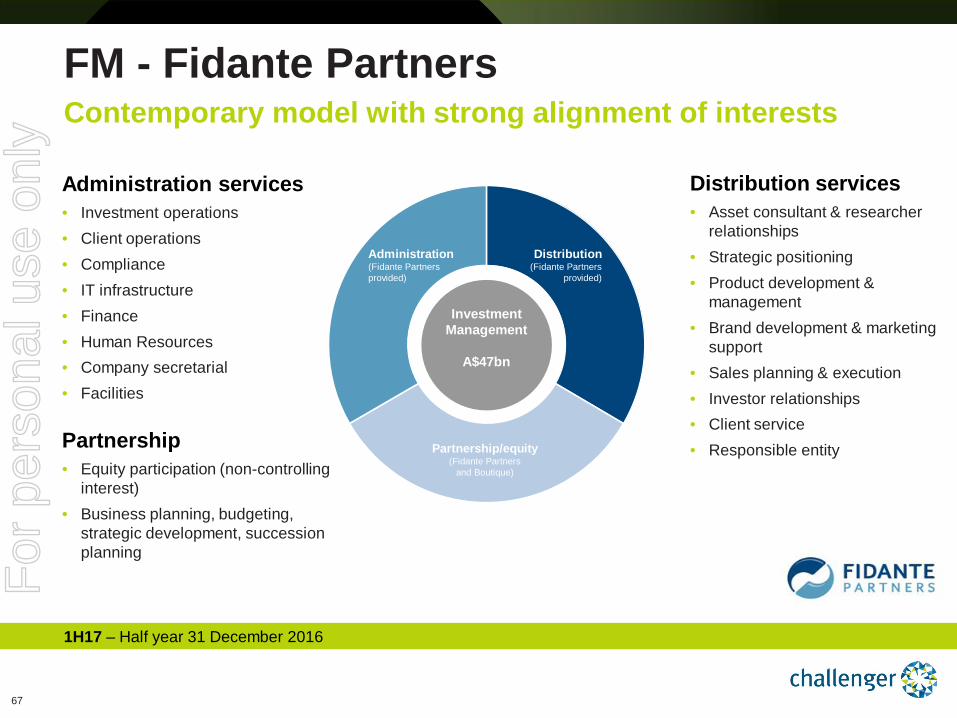
FM - Fidante Partners Contemporary model with strong alignment of interests
Co –investment
with Life
Administration services • Investment operations • Client operations • Compliance • IT infrastructure • Finance • Human Resources • Company secretarial • Facilities
Distribution services • Asset consultant & researcher
relationships • Strategic positioning • Product development &
management • Brand development & marketing
support • Sales planning & execution • Investor relationships • Client service • Responsible entity Partnership
• Equity participation (non-controlling interest)
• Business planning, budgeting, strategic development, succession planning
Investment Management
A$47bn
Administration (Fidante Partners provided)
Distribution (Fidante Partners
provided)
Partnership/equity (Fidante Partners
and Boutique)
1H17 – Half year 31 December 2016
For
per
sona
l use
onl
y
68
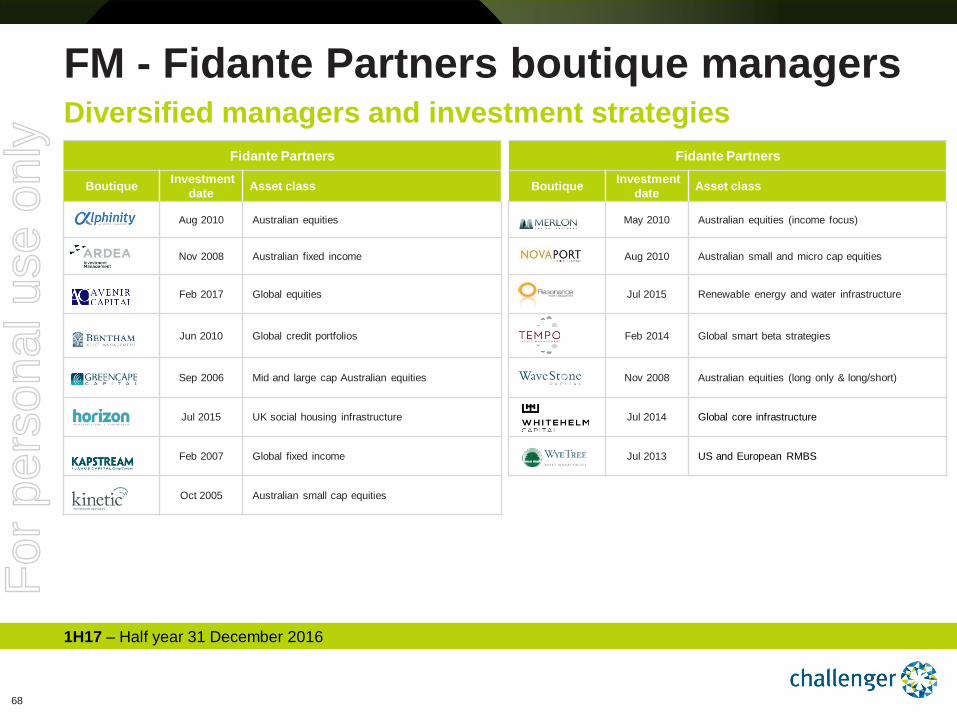
Fidante Partners
Boutique Investment date Asset class
May 2010 Australian equities (income focus)
Aug 2010 Australian small and micro cap equities
Jul 2015 Renewable energy and water infrastructure
Feb 2014 Global smart beta strategies
Nov 2008 Australian equities (long only & long/short)
Jul 2014 Global core infrastructure
Jul 2013 US and European RMBS
Fidante Partners
Boutique Investment date Asset class
Aug 2010 Australian equities
Nov 2008 Australian fixed income
Feb 2017 Global equities
Jun 2010 Global credit portfolios
Sep 2006 Mid and large cap Australian equities
Jul 2015 UK social housing infrastructure
Feb 2007 Global fixed income
Oct 2005 Australian small cap equities
Diversified managers and investment strategies FM - Fidante Partners boutique managers
1H17 – Half year 31 December 2016
For
per
sona
l use
onl
y
69
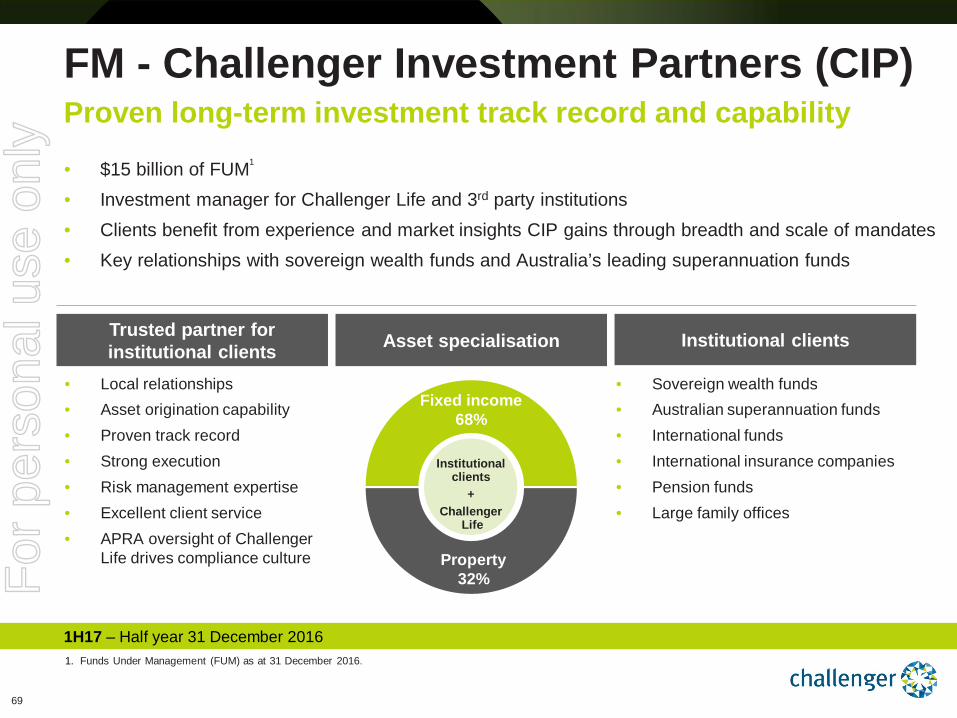
• Local relationships • Asset origination capability • Proven track record • Strong execution • Risk management expertise • Excellent client service • APRA oversight of Challenger
Life drives compliance culture
Asset specialisation Trusted partner for institutional clients Institutional clients
• Sovereign wealth funds • Australian superannuation funds • International funds • International insurance companies • Pension funds • Large family offices
• $15 billion of FUM1
• Investment manager for Challenger Life and 3rd party institutions • Clients benefit from experience and market insights CIP gains through breadth and scale of mandates • Key relationships with sovereign wealth funds and Australia’s leading superannuation funds
Fixed income 68%
Property 32%
Institutional clients
+ Challenger
Life
FM - Challenger Investment Partners (CIP) Proven long-term investment track record and capability
1. Funds Under Management (FUM) as at 31 December 2016.
1H17 – Half year 31 December 2016
For
per
sona
l use
onl
y
70
The material in this presentation is general background information about Challenger Limited activities and is current at the date of this presentation. It is information given in summary form and does not purport to be complete. It is not intended to be relied upon as advice to investors or potential investors and does not take into account the investment objectives, financial situation or needs of any particular investor. These should be considered with professional advice when deciding if an investment is appropriate. Challenger also provides statutory reporting as prescribed under the Corporations Act 2001. The annual report is available from Challenger’s website at www.challenger.com.au. This presentation is not audited. The statutory net profit after tax has been prepared in accordance with Australian Accounting Standards and the Corporations Act 2001. Challenger’s external auditors, Ernst & Young, have reviewed the statutory net profit after tax. Normalised net profit after tax has been prepared in accordance with a normalised profit framework. The normalised profit framework has been disclosed in Section 2.2 of the Directors’ Report in the Challenger Limited Interim 2017 Financial Report. The normalised profit after tax has been subject to a review performed by Ernst & Young. Any additional financial information in this presentation which is not included in Challenger Limited Interim 2017 Financial Report was not subject to independent audit or review by Ernst & Young. This document may contain certain ‘forward-looking statements’. The words ‘forecast’, ‘expect’, ‘guidance’, ‘intend’, ‘will’ and other similar expressions are intended to identify forward-looking statements. Forecasts or indications of, and guidance on, future earnings and financial position and performance are also forward-looking statements. You are cautioned not to place undue reliance on forward looking statements. While due care and attention has been used in the preparation of forward-looking statements, forward-looking statements, opinions and estimates provided in this announcement are based on assumptions and contingencies which are subject to change without notice, as are statements about market and industry trends, which are based on interpretations of current market conditions. Forward-looking statements including projections, guidance on future earnings and estimates are provided as a general guide only and should not be relied upon as an indication or guarantee of future performance and may involve known and unknown risks, uncertainties and other factors, many of which are outside the control of Challenger. Actual results, performance or achievements may vary materially from any forward-looking statements and the assumptions on which statements are based. Challenger disclaims any intent or obligation to update publicly any forward-looking statements, whether as a result of new information, future events or results or otherwise. Past performance is not an indication of future performance. While Challenger has sought to ensure that information is accurate by undertaking a review process, it makes no representation or warranty as to the accuracy or completeness of any information or statement in this document. Unless otherwise indicated, all numerical comparisons are to the prior corresponding period.
Important note
1H17 – Half year 31 December 2016
For
per
sona
l use
onl
y