Embed Size (px)
Citation preview

Banca Popolare di Bari Group1H 2017 and Group Presentation
October 2017

The information contained in this investor presentation (respectively, the “Information” and the “Investor Presentation”) has been prepared by and is the sole responsibility of Banca Popolare di Bari S.C.p.A. (“BPB”). This Information is made available by BPB to Permitted Recipients (as defined below), on a confidential basis and for information purposes only. You are prohibited from using the Information for any other purpose. The Information may not be forwarded or distributed to any other person and may not be reproduced in any manner whatsoever. Any forwarding, distribution or reproduction of the Information in whole or in part is unauthorized. This Investor Presentation may contain forward looking statements concerning future events. Those forward-looking statements are based on the current information and assumptions of the BPB’s management concerning known and unknown risks and uncertainties.
Forward-looking statements do not relate to definite facts and are subject to risks and uncertainty. The actual results may differ considerably as a result of risks and uncertainties relating to the BPB’s expectations regarding such matters as the assessment of market risk and revenue growth or, more generally, the economic climate and changes in the law and taxation. BPB caution that expectations are only valid on the specific dates, and accept no responsibility for the revision or updating of any information following changes in policy, developments, expectations or the like.
The financial data regarding forward-looking statements concerning future events included in this Investor Presentation have not been audited. This Investor Presentation is not intended to offer securities, investment advisory services, investment management services, fiduciary services, or any other financial services to any US person as such term is defined in regulations under the US Securities Act of 1933, as amended, nor to any persons who are not allowed by the laws of their jurisdiction to invest offshore. The investments and services herein are not available to such persons.
The Information is intended to be made available only to, and is directed only at, persons (Permitted Recipients) who are (a) not a U.S. person (within the meaning of Regulation S under the Securities Act 1933 (as amended)) or acting for the account or benefit of a U.S. person and the electronic mail address that you have given to us and to which this e-mail has been delivered is not located in the United States, its territories and possessions (including Puerto Rico, the U.S. Virgin Islands, Guam, American Samoa, Wake Island and the Northern Mariana Islands) or the District of Columbia, (b) "qualified investors", as such term is defined in Directive 2003/71/EC (as amended) and (c) in respect of any persons in the United Kingdom, who (i) have professional experience in matters relating to investments or (ii) are a high net worth entity falling within Article 49(2)(a) to (d) of the Financial Services and Markets Act (Financial Promotion) Order 2005 or a certified high net worth individual within Article 48 of the Financial Services and Markets Act (Financial Promotion) Order 2005. It must not be acted on or relied on by, nor are the securities described herein available, to any other persons.
BPB is not registered as a broker-dealer or investment advisor by the US Securities and Exchange Commission. It cannot transact business as a broker-dealer or investment advisor in jurisdictions in which BPB is not exempt or excluded from such requirements.
2
Disclaimer (1/2)

The information provided is not intended to effect any transaction in securities nor is it an offer to buy or sell securities. BPB is supplying the entire content of this communication solely for general informational purposes. This Investor Presentation does not constitute an offer or solicitation to anyone in any jurisdiction in which such an offer or solicitation is not authorized, or to any person to whom it is unlawful to make such an offer or solicitation.
The information given in this Investor Presentation does not constitute legal, tax, accounting, regulatory or investment advice or opinion, and should not be relied upon for any planning purposes. It is provided solely and exclusively for general, non-specific informational purposes, and to advise the reader of the nature of the services and products offered by BPB. You should neither construe any of the material contained herein as business, financial, investment, hedging, trading, legal, regulatory, tax, or accounting advice nor make this service the primary basis for any investment decisions made by you and you may want to consult your business advisor, attorney, and tax and accounting advisors concerning any contemplated transactions.
BPB expressly disclaim any and all liability for any representations (whether express or implied) contained in, or any omissions from, this Investor Presentation or any other written or oral communications transmitted to the recipient in the course of the recipient's evaluation of the services offered hereby. BPB expressly disclaim any and all liability which may be based on such information, errors therein or omissions therefrom. The information in this Investor Presentation may become unreliable because of subsequent market conditions, economic circumstances, new legal developments or for other reasons. BPB disclaim any intent or obligation to update these statements. Moreover, there is no assurance that any projections, predictions, forward-looking statements or forecasts will be realized.
The information contained herein must not be distributed by the viewer and is not intended for use in any jurisdiction where its use would be unlawful. This document contains links to third party web sites. These links are provided only as a convenience. The inclusion of any link is not and does not imply an affiliation, sponsorship, endorsement, approval, investigation, verification or monitoring by BPB of any information contained in any third party web site. In no event shall BPB be responsible for the information contained on that site or your use of or inability to use such site. No warranty, express or implied, is given by BPB as to the accuracy or completeness of the information that may be accessed by the website links.
The figures included in this Investor Presentantion may be rounded up or down. Any inconsistencies and/or differences between the data included in the various tables herein are the result of such rounding.
3
Disclaimer (2/2)

�Banca Popolare di Bari in a nutshell
�Credit policies and asset quality
�Funding, liquidity and securities portfolio
�Capital ratio
�Revenues development
�Cost management and Net profit development
�Annexes
4
AGENDA

Banca Popolare di Bari in a nutshellOverview
History
�Banca Popolare di Bari is a cooperative Bank founded in 1960 by a group of 76 shareholders
�Historically the Bank is focused on traditional Retail banking, in particular on Mass/Affluent clients and SME
�Over the last decade, the Bank has experienced a strong growth, also driven by an intense M&A activity
�As of today, the Bank has about 70k shareholders (mainly Retail and SME) and it represents the largest banking group in Southern Italy
Key Highlights
� 357 branches (1)
� Approx. 3,100 employees (1)
� Geographical focus in Southern Italy (Puglia, Abruzzo, Basilicata and Campania) and areas of Central Italy (Umbria through CR Orvieto)
� Approx €10.4 bn (1) of Direct Funding (mainly deposits) and more than €4,1 bn of Indirect Funding, of which €2,4 bn of AuM
� Approx €10.2 bn (1) of loans to customers, both Retail and SME
� Historically a good asset quality and adequate coverage ratios
� 1H 2017 reported operating income equal to €202 mn (1), with a good contribution of commission stream
� Cost/Income ratio approx. 80%. After full benefit of cost reduction measures up to 70%
Distribution Network
Funding
Loans
Profitability
Note: (1) As of 30 June 2017
5

Banca Popolare di Bari in a nutshellMilestones
1960 1998 1999 2002 2008 2009 2011Foundation of
Banca Popolare di
Bari
Acquisition of “BP Penisola
Sorrentina” and foundation of BPB Group
Acquisition of “BP Calabria”
Acquisition of “Nuova Banca Mediterranea”
Transfer of #11 branches from BP Bari to CR Orvieto
53
67
136
207
254
254
1H 2017
388357
1
2014
1,709
1,926
3,846
5,610
7,010
7,563
14,13514,207
244
“Mimosa Project”:
Acquisition of #43 branches
from ISP
“Duomo Project”:Acquisition of 73.57% of CR
Orvieto and of #4 branches from
ISP
Branches
Total Assets€/mn
Banca Popolare di Bari opened its first branch in 1960 on theinitiative of Luigi Jacobini and other #76 shareholders; 56 yearslater, thanks to several acquisitions and targeted strategies,Banca Popolare di Bari gradually reinforced its market positionand extended its presence in different Italian regions, includingregions in Northern and Central Italy.
Efficiency program started
6
Banca Tercasand Banca
Caripeacquisition (merged in
2016)

Banca Popolare di Bari in a nutshellCurrent structure
100%73.57%(1)
In July 2016, Banca Tercas and Banca Caripe were merged by incorporation inside the parent company BancaPopolare di Bari. At the same time, the IT systems of the two entities were integrated. As a result of the merger, itwas implemented one of the most important strategic projects included in the Group's industrial plan 2016 – 2020("Banca Unica"). "Banca Unica" project envisages important synergies both in terms of revenues and costs.
Note: (1) 26.43% owned by Fondazione Cassa Risparmio di Orvieto
7

BPB Group # branches % by region Market share
Lombardia 6 1.7% 0.11%Veneto 2 0.6% 0.07%Emilia Romagna 4 1.1% 0.14%Marche 19 5.3% 1.93%Toscana 4 1.1% 0.19%Umbria 32 9.0% 6.50%Lazio 24 6.7% 1.00%Campania 44 12.3% 3.12%Abruzzo 100 28.0% 16.72%Molise 3 0.8% 2.38%Puglia 79 22.1% 6.39%Basilicata 33 9.2% 14.54%Calabria 7 2.0% 1.60%
ITALY 357 100.0% 1.27%
Banca Popolare di Bari in a nutshellDistribution network
● ≥ 10%
5 ≤ ● ≤ 10%
2 ≤ ● ≤ 5%
● < 2%
Mkt share
Core areas
As of June 30 2017, Banca Popolare di Bari Group counts #357 branches (#303 BP Bari, #54 CR Orvieto), mainly concentrated in Central-Southern Italy.
Source: Bank of Italy, Update June 2017
8

Banca Popolare di Bari in a nutshellMarket shares
Source: Bank of Italy, Update June 2017
9
�As of December 2016, national market shares were:� 0.74% for due to
customers� 0.66% for loans� 1.24% for branches
�The highest market shares are in Southern Italy, in particular, in Abruzzo, Basilicata and Puglia.
Dec-2016 Jun-2016 Dec-2015∆
FY16/1H16∆
FY16/FY15
ITALY 0.74% 0.81% 0.83% -0.06% -0.09%
NORTH - WEST 0.03% 0.03% 0.05% 0.00% -0.02%NORTH - EAST 0.02% 0.02% 0.02% 0.00% 0.00%CENTRAL ITALY 0.55% 0.58% 0.60% -0.02% -0.05%SOUTHERN ITALY 5.80% 6.19% 6.30% -0.39% -0.50%
ABRUZZO 15.96% 16.74% 16.98% -0.78% -1.02%
CAMPANIA 2.11% 2.11% 2.20% 0.00% -0.09%MOLISE 3.79% 3.92% 3.82% -0.13% -0.02%
PUGLIA 6.68% 7.56% 7.54% -0.88% -0.86%
BASILICATA 16.58% 16.30% 16.69% 0.28% -0.11%CALABRIA 1.41% 1.40% 1.42% 0.01% -0.01%
Due to customers market share
Dec-2016 Jun-2016 Dec-2015∆
FY16/1H16∆
FY16/FY15
ITALY 0.66% 0.70% 0.69% -0.04% -0.03%
NORTH - WEST 0.06% 0.07% 0.07% -0.01% -0.01%NORTH - EAST 0.07% 0.09% 0.09% -0.02% -0.02%CENTRAL ITALY 0.62% 0.63% 0.60% -0.02% 0.01%SOUTHERN ITALY 5.92% 6.27% 6.17% -0.35% -0.25%
ABRUZZO 11.70% 14.06% 13.60% -2.36% -1.89%
CAMPANIA 2.06% 2.05% 2.02% 0.00% 0.04%MOLISE 2.38% 2.57% 2.60% -0.19% -0.22%
PUGLIA 8.16% 8.22% 8.00% -0.06% 0.15%
BASILICATA 16.50% 15.20% 15.34% 1.30% 1.16%CALABRIA 2.07% 1.93% 1.95% 0.14% 0.12%
Loans market share

67
163
247
388 362 357
2001 2007 2013 2014 2016 1H2017
Banca Popolare di Bari in a nutshellGroup economic-financial growth
1.0
3.3
6.3
10.3 10.1 10.2
2001 2007 2013 2014 2016 1H2017
1.63.2
6.7
10.69.4
10.4
2001 2007 2013 2014 2016 1H2017
Branches
Direct funding
#
€ bn
Personnel
#
€ bn
Loans to customers
+290
+8.8 +9.2
+2,346775
1,654
2,206
3,262 3,188 3,121
2001 2007 2013 2014 2016 1H2017
10

Banca Popolare di Bari in a nutshellFocus on last 2 years and….what’s next
Milestones
January 2016
New 2016-2020 Business Plan:
1. NPLs disposal plan
2. Cost reduction
3. Efficient distribution model
4. Bancassurance
5. Focus on high potentialclient segments
March 2016
Partnership with Aviva on Bancassurance business with € 50 mn capital injection
July 2016
Banca Tercas and Banca Caripe merge in BPB
August 2016
480 Mn€ NPLs disposalwith Gacs (price 30% of gross book value), First Gacs transaction in Italy
September 2017
Deal with Cerved for bad loans and unlikely to pay loans’ management
€ 18 mn cash price
October 2017
€ 597 mn ABS bond placement in the market (first public placement of BPB)
1H 2018
BPB transformationin joint stock company
4Q 2017
Approx. € 330 mnNPLs disposal with Gacs
11
2016 2017 2018

�Banca Popolare di Bari in a nutshell
�Credit policies and asset quality
�Funding, liquidity and securities portfolio
�Capital ratio
�Revenues development
�Cost management and Net profit development
�Annexes
12
AGENDA

10,47210,56911,04510,89110,906
Jun-17Dec-16Jun-16Dec-15Dec-14
Notes: (1) Total gross loans to customers net of exposures with CCG (Cassa Compensazione e Garanzia); (2) Internal data
Evolution of Gross Loans (1)
€ mn
Credit policies and asset qualityLoans to customers analysis
Performing Loans by sector (2) Total Gross Loans by asset class (2)
13
June 2017 June 2017
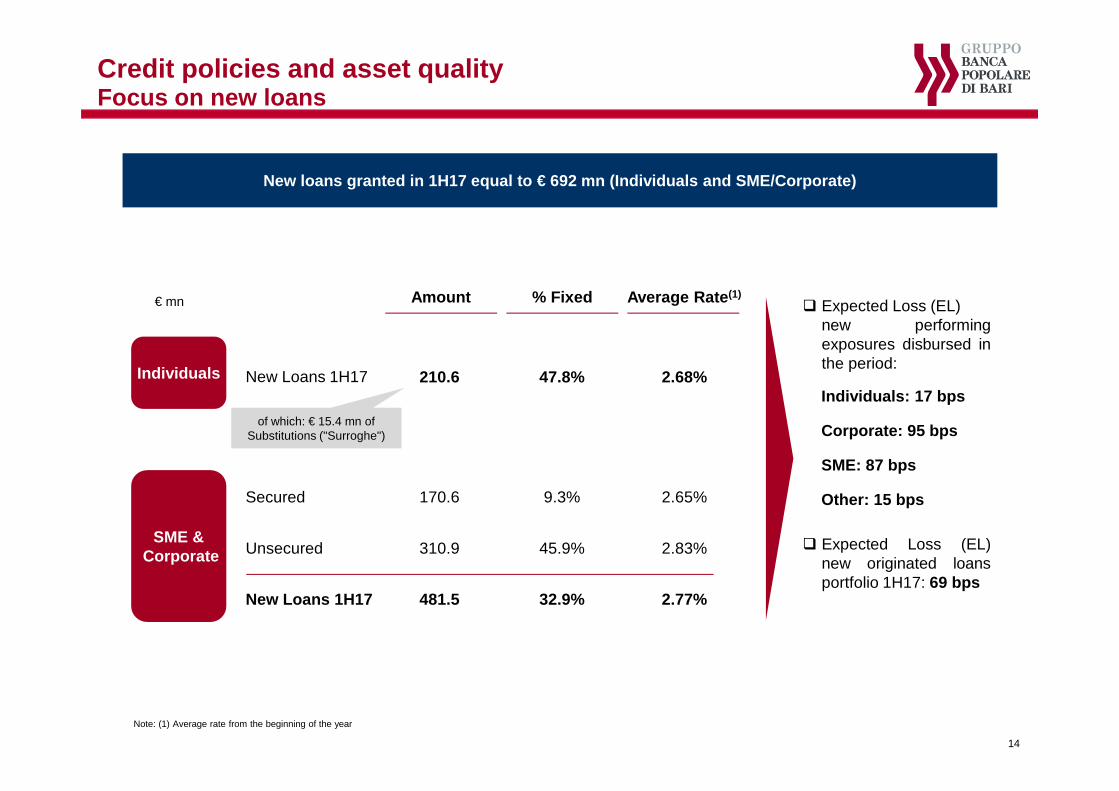
Note: (1) Average rate from the beginning of the year
New loans granted in 1H17 equal to € 692 mn (Individuals and SME/Corporate)
Individuals
SME &Corporate
€ mn � Expected Loss (EL)new performingexposures disbursed inthe period:
Individuals: 17 bps
Corporate: 95 bps
SME: 87 bps
Other: 15 bps
New Loans 1H17
% FixedAmount Average Rate (1)
47.8%210.6 2.68%
Secured 9.3%170.6 2.65%
Unsecured 45.9%310.9 2.83%
New Loans 1H17 32.9%481.5 2.77%
of which: € 15.4 mn of Substitutions ("Surroghe")
� Expected Loss (EL)new originated loansportfolio 1H17: 69 bps
Credit policies and asset qualityFocus on new loans
14

2,8902,832
3,157
3,046
2,679
Jun-17Dec-16Jun-16Dec-15Dec-14
Credit policies and asset qualityNon performing exposures (Gross amount)
15
NPE
Bad loans Unlikely to pay€ mn € mn
€ mn
1,1501,119995967895
Jun-17Dec-16Jun-16Dec-15Dec-14
+2.8%
1,4761,484
1,8921,8061,567
Jun-17Dec-16Jun-16Dec-15Dec-14
-0.6%
Further reductionexpected after €330 mn NPLs
Gacs disposal to be completed in
4Q ‘17
+2.1%

In 2016 BPB started a strategic project in order to reach in a short timeframe the target to keep a pr oactive approach on NPLs management as a value creation lever (in line with one of the 2016-2020 Business Plan’ pillars)
Credit policies and asset qualityNPEs strategic approach
16
Loan Loss Provisions increase
Provisioning
� Increase of LLP in order to reach adequate coverage levels and, eventualy, minimizing losses deriving from NPLs disposal
� New policies on classification and provisioning of credits in line with the best AQR standards
Enhancement of recovery activities
Internal ManagementReorganization and
enforcement
� Direct NPLs’ management through a specific business unit
� Start up of specialized teams responsible for NPLs ’ recovery plans
NPLs’ disposals
Market-disposals transactions
� NPLs’ disposal process with GACS. € 800 mn disposal program, first tranche of approx. €480 mn completed in 2016, second tranche of approx. €330 mn to be completed in 4Q 2017
External ManagementClose monitoring of an
external servicer
� Ordinary and extraordinary management of NPLs under 1,5 mn GBV managed by external servicer
� Full responsibility of the servicers in daily management of the assets
1 2 3
FY 2015: cost of risk approx. 250 bps
Internal management on (i) Past due and (ii) Bad Loans and UTP > 1,5 mn GBV (approx. 1.000
borrowers)External management on Bad Loans and Utp < 1,5
mn GBV (approx. 25.000 borrowers)
Total NPLs disposals (1,2 bn):
• 2014: € 400 mn• 2016: € 480 mn• 2017: € 330 mn
Cerved agreement

11.1%12.0%
14.2%
16.5%
23.1%
26.1%24.7% 25.1%
~ <23%
8.9%
10.8%
13.3%
16.7% 17.1% 17.0%16.2%
2010 2011 2012 2013 2014 2015 2016 Jun-17 2017E
Credit policies and asset qualityGross NPE ratio
NPE Ratio evolution 2015-2016 (-1.4 p.p.) aligned with Italian Banking system trend, with a reduction of the gap vs average NPE Ratio
%
Gross NPE ratio evolution: Banca Popolare di Bari vs Italian Banking System Average
Source: Bollettino Statistico, Bank of Italy
17
Post approx. € 330 mnNPLs GACS disposal to be completed in 4Q ‘17
18% before Tercas acquisition. Tercas broughtadditional 1.67 B NPEs to BPB Group’ loans. First
NPEs disposal of approx. € 400 mn in Dec 14
Banca Popolare di Bari
Italian Banking System Average
Legend:

566557682632620
839792690
677620
242207
244247
202
1,6461,556
1,6161,556
1,442
Jun-17Dec-16Jun-16Dec-15Dec-14
Net Bad loans Net UTP Net Past due
Credit policies and asset qualityNet NPE evolution
€ mn
18
Breakdown by class of risk

0.78%0.75%0.84%0.90%
Jun-17Dec-16Jun-16Dec-15
Non performing exposure coverage evolution Performing coverage evolution
43.0%
45.1%
48.8%48.9%
Jun-17Dec-16Jun-16Dec-15
Bad loans Unlikely to pay Past due
Credit policies and asset qualityCoverage ratio analysis
61.7%62.5%63.9%65.0%
Jun-17Dec-16Jun-16Dec-15
27.0%29.2%30.7%30.0%
Jun-17Dec-16Jun-16Dec-15
8.5%9.5%9.7%9.2%
Jun-17Dec-16Jun-16Dec-15
% %
% % %
19

Note: (1) Internal data
Credit policies and asset qualityNPE by sector (1)
Breakdown NPE by sector
Breakdown Bad loans by sector Breakdown UTP by sector
38.5% of grossNPE real estate
related
20
June 2017 June 2017
June 2017

0.85%0.73%
1.58%
1.08%0.98%
2.43%
0.81%
0.47%
2010 2011 2012 2013 2014 2015 2016 Jun-17
Credit policies and asset qualityCost of risk evolution
%
Cost of risk evolution (1)
Note: (1) Calculated as Loan Loss Provisions / Net Loans to Customers (including Cassa Compensazione e Garanzia)
21

�Banca Popolare di Bari in a nutshell
�Credit policies and asset quality
�Funding, liquidity and securities portfolio
�Capital ratio
�Revenues development
�Cost management and Net profit development
�Annexes
22
AGENDA

10,350
9,439
9,80010,069
10,586
Jun-17Dec-16Jun-16Dec-15Dec-14
90.0%93.6%
8.3%4.6%1.8%1.8%
Jun-17Dec-16Due to customers Securities Issued Other funding
Evolution of Direct funding (1)
Breakdown of Direct funding Breakdown of Direct funding by product
€ mn
Funding, liquidity and securities portfolioDirect funding analysis
Note: (1) Direct funding net of Repos in place with Cassa di Compensazione & Garanzia
+5.4%
+97.0%
+8.6%
∆Dec16-Jun17
23
€ mn Dec-16 Jun-17 ∆%
Saving deposits 486 462 (4.9%)Time deposits 217 168 (22.6%)Euro current accounts 8,025 8,574 6.8%Foreign currency current accounts
19 20 5.8%
Bank loans 88 86 (2.5%)Traditional Funding 8,835 9,310 5.4%Non subordinated bonds 129 551 n.m.Subordinated bonds 306 306 -Securities Issued 435 857 97.0%Bank cheques 45 60 32.9%Repos 120 120 -Third-party funds under administration
- - -
Other direct funding 4 4 (7.1%)Other Funding 169 183 8.6%Direct Funding 9,439 10,350 9.7%

356
53 56
213
20
2018 2019 2020 2021 Beyond2021
Funding, liquidity and securities portfolioBonds by maturities and ECB funding
Bonds senior + subordinated Wholesale bonds
Maturities (1) ECB funding Banca Popolare di Bari
€ mn € mn
€ mn € mn
37
Maturities 2017
1,097
Issues 2017
1,910
June 2017
Note: (1) Includes Bonds senior, subordinated bonds and wholesale bonds (equal to € 300 mn)
24
Exposurerelating to the
TLTRO2 measure
O/w 597 Class A note relating to «2017 Popolare
Bari RMBS» transaction

3,955
1,036
3,613
1,125
3,008
907
104 83 1,064
Funding, liquidity and securities portfolioEligible assets and counterbalancing capacity
25
Total eligible Assets evolution (1) Eligible Assets Pool Composition (%)€ mn
Total eligible assets Unencumbered eligibleassets
Deposits with ECB
Note: (1) Net of ECB haircuts
� Counterbalancing capacity (“CBC”) at €3.0 bn in Jun-17 of which €0.9 bn unencumbered and €1.1 bn deposits with ECB
Jun-16 Dec-16 Jun-17
June 2017

88.6%
97.8%96.3%92.7%90.7%
Jun-17Dec-16Jun-16Dec-15Dec-14
Short-term liquidity position
LCR: 181.5%(2)
NSFR: 121.1%(2)
€ mn
Net loans (1) / Direct funding
Notes: (1) Total net loans to customers net of exposures with CCG (Cassa Compensazione e Garanzia); (2) As of June 30th , 2017
Funding, liquidity and securities portfolioLiquidity position
Net liquidity balance approx. 13.9% of Total assets (2)
Data as of 30th June 2017 1d 2d 3d 4d 5d 2w 3w 1m 3m
Net balance of cumulative expiring positions
- - 399 622 633 540 540 540 541
Counterbalancing Capacity 1,968 1,968 1,508 1,258 1,243 1,243 1,243 1,162 1,492
Net balance of overall liquidity
1,968 1,968 1,907 1,880 1,876 1,784 1,784 1,702 2,033
26

€ mn Dec-16 Jun-17
HTM - 959.7
AFS 1,728.5 471.9
L&R 136.2 130.0
HFT 9.0 3.5
Total portfolio 1,873.7 1,565.030.2%
92.3%61.3%
8.3%7.3%0.2%0.5%
Jun-17Dec-16AFS HTM L&R HFT
Breakdown by accounting portfolio
Funding, liquidity and securities portfolioSecurities portfolio diversification
Breakdown AFS portfolio Breakdown HFT portfolio Govies portfolio by maturity
62.4%12.4%
25.3%
Debt instruments
Equity instruments
Derivatives
54.4%
9.7%
35.9%
Debt instruments
Equity instruments
OICR units
1
383
679
154
2019 2020 2021 Beyond2021
€ 471.9 mn € 3.5 mn
� AFS reserve as 30 June equal to € (48.6)mn
� AFS reserve on Govies as 30 June equal to € (19.6)mn
€ mn Goviesportfolio duration: 9.85 yrs
27
o/w approx.
8% stakein Cedacri

€ mn Dec-16 Jun-17 ∆%
Insurance policy portfolio 1,267 1,300 2.5%
Porfolio management 52 42 (18.3%)
Funds 1,032 1,075 4.2%
AuM 2,351 2,417 2.8%
AuA 1,697 1,707 0.6%
Indirect Funding 4,048 4,125 1.9%
4,125
4,048
3,862
4,148
3,920
Jun-17Dec-16Jun-16Dec-15Dec-14
Evolution of Indirect funding
Breakdown of Indirect funding Breakdown of Indirect funding by product
€ mn
Funding, liquidity and securities portfolioIndirect funding analysis
+2.8%
+0.6%
∆Dec16-Jun17
58.6%58.1%
41.4%41.9%
Jun-17Dec-16
Asset under Management Asset under Administration
28

�Banca Popolare di Bari in a nutshell
�Credit policies and asset quality
�Funding, liquidity and securities portfolio
�Capital ratio
�Revenues development
�Cost management and Net profit development
�Annexes
29
AGENDA

% Jun-16 Dec-16 Jun-17
Credit 90.3% 90.1% 90.0%CVA 0.3% 0.3% 0.3%Market 0.3% 0.5% 0.5%Operational 9.1% 9.1% 9.2%
€ mn Jun-16 Dec-16 Jun-17
Common equity 837 841 779Tier 1 837 841 779Tier 2 273 264 234Total Capital 1,110 1,104 1,013RWA 8,694 8,478 8,418TIER 1 ratio 9.62% 9.92% 9.25%
Indicators
RWA/Assets 60.7% 62.5% 59.3%Leverage ratio 5.5% 5.2% 4.8%
12.0%13.0%12.8%
9.3%9.9%9.6% 9.3%
9.9%9.6%
Jun-17Dec-16Jun-16
Capital RatioCapital ratios evolution
Capital ratios, phased-in calculation
Capital ratio Requirements
30
SREP RequirementCET 1 ratio 6.70%Tier 1 ratio 8.55%
Total capital ratio 11.00%
� In November 2016, in connection with the transformation in SpA, the BoD approved a common equity capital strengthening of €300 mn .
� The capital strengthening is strictly related to the transformation in SpA that will be completed by the end of the first half of 2018 (see slide 45)
CET 1 ratio Tier 1 ratio Total capital ratio

305279 265
235
Dec-15 Jun-16 Dec-16 Jun-17
3756
213
2019 2020 2021
Capital RatioTier 2 Securities Evolution
31
Subordinated debt Tier 2 securities
Maturities
€ mn € mn
€ mn
395 389
306 306
Dec-15 Jun-16 Dec-16 Jun-17
� Subordinated debt equal to €306 mn in Jun-17, of which €235
mn of Tier 2
� Current Business Plan 2016-2020 envisages a full replacement
of the Tier 2 securities (and the relating contribution of the Tier
2 Capital) trough new issues

�Banca Popolare di Bari in a nutshell
�Credit policies and asset quality
�Funding, liquidity and securities portfolio
�Capital ratio
�Revenues development
�Cost management and Net profit development
�Annexes
32
AGENDA

107.6
202.0
91.2
3.5 1.4 (1.6)
NII Net fees andcommissions
Dividends and otherincome
Trading income Other income Operating income
Revenues developmentOperating income development
∆% vs Jun. 2016
(11.3%) (7.9%)n.m.+8.2%(12.1%)+ 9.9%
1H 2017 operating income result
€ mn
98.4% of revenues from core business
(NII + Fees)
33

3.67% 3.57%3.40%
3.10%
Dec-15 Jun-16 Dec-16 Jun-17
-0.13%-0.27%
-0.32% -0.33%
Dec-15 Jun-16 Dec-16 Jun-17
158175
334
372
325
Jun-17Jun-16Dec-16Dec-15Dec-14
Revenues developmentFocus on net interest income
Interest income evolution
Euribor evolution
Net interest margin (1)
94.2% of NII related to commercial interest
margin
€ mn
1H2017 vs 1H2016
Note: (1) Net interest margin equal to interest income/loans to customers
34

9183
155171
128
Jun-17Jun-16Dec-16Dec-15Dec-14
Revenues developmentFocus on net fees
Net fees evolution
48% of Net fees related to Asset Mgmt, trading and
advisory services
€ mn
Net fees breakdown
1H2017 vs 1H2016
Contribution by type of fees – 1H 2017
Asset management, tradingand advisory services
Payment and collection services
Current account Loans and other
48.0%
6.7%
31.4%
14.0%
44 28 58 65
6 8
13 17 29 29
56 62
13 18
27 28
91 83
155 171
Jun-17Jun-16Dec-16Dec-15
€ mn
35

�Banca Popolare di Bari in a nutshell
�Credit policies and asset quality
�Funding, liquidity and securities portfolio
�Capital ratio
�Revenues development
�Cost management and Net profit development
�Annexes
36
AGENDA

189 176
1H16 1H17
2.49% 2.42%
1H16 1H17
82.6%83.3%
1H16 1H17
202.0
101.7
33.8 26.2 26.2
(100.3)
(68.0)
(7.6)
Operating Income Personnel expenses Other admin. Expenses Amortization Net Operating Margin
Cost management and Net profit developmentOperating result and cost income
37
Operating result development
€ mn
Cost income ratio (1)
%
Cost to asset ratio (2)
%
Operating expenses (3)
€ mn
∆% vs Jun. 2016
(7.9%) (14.8%)+2.0%(7.0%)(7.2%)
Notes: (1) Calculated as Administrative expenses / Operating Income; (2) Annualized; (3) Include Administrative expenses and Amortization
Labor parties agreement on 5th August 2017 (P/L benefits from 2018):
• -30% top management compensation• employees solidarity contribution
• other cost reduction
June 2017

Cost management and Net profit developmentNet profit development
€mn Jun-16 Jun-17 ∆% YoY
Net operating margin 30.7 26.2 (14.8%)
Value adjustments (47.3) (48.0) 1.5%
Net accruals to provisions for risks and charges 7.4 1.6 (78.9%)
Other income 15.8 16.1 1.9%
Income before taxes 6.5 (4.3) n.m.
Tax for the period (1.9) 2.0 n.m.
Minorities (0.4) (0.3) (25.1%)
Net result 4.3 (2.6) n.m.
38
o/w 23.6 mnAtlante fund
write off

�Banca Popolare di Bari in a nutshell
�Credit policies and asset quality
�Funding, liquidity and securities portfolio
�Capital ratio
�Revenues development
�Cost management and Net profit development
�Annexes
39
AGENDA

Dec-16 Jun-17
14,475
4,125
10,350 10,224
13,487
4,048
9,43910,126
Total fundingIndirect fundingDirect fundingLoans to customers
AnnexesConsolidated Balance Sheet data
June 2017 vs December 2016
Dec-16 Jun-17
Indirect funding/ Total funding 30.0% 28.5%
Direct funding/ Total funding 70.0% 71.5%
Loans to customers/Direct funding 107.3% 98.8%
Loans to customers/Total Assets 74.6% 72.0%
€ mn
40

86%73%
14%27%
Jun-17Dec-16
Equity Bond-Monetary
47%48%
53%52%
Jun-17Dec-16
Bond-Monetary-Other Equity-Flexible-Balanced
AnnexesBreakdown indirect funding
Breakdown of Funds Breakdown of Portfolio management
1,075 1,032 52 42
€ mn € mn
41
Breakdown of Assets under administration
68%71%
16%13%
15%16%
Jun-17Dec-16
Government Bonds + Other Equity Bond
1,697 1,707
€ mn

2.43%
2.72%2.69%2.82%
0.81%0.87%0.87%1.03%
1.63%
1.85%1.83%1.79%
Jun-17Dec-16Jun-16Dec-15
AnnexesBanking spread
YoY
Asset yield Liability cost Spread
-26bps
-20bps
-6bps
Variables
� Asset : Loans and receivables to customers, loans and receivables to banks and financial assets
� Asset yield: Interest income / average bearing assets of the quarter
� Liabilities: Due to customers, due to banks and financial liabilities
� Liability cost: Interest expense / average bearing liabilities of the quarter
42
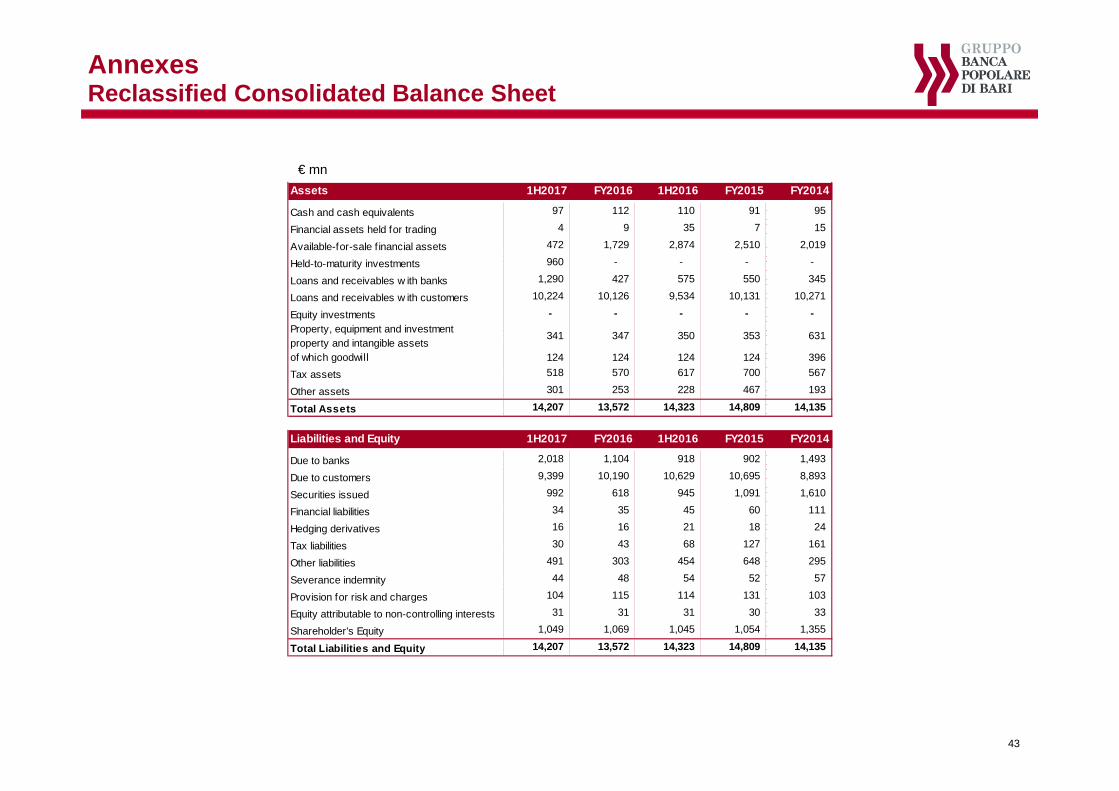
AnnexesReclassified Consolidated Balance Sheet
€ mn
Assets 1H2017 FY2016 1H2016 FY2015 FY2014
Cash and cash equivalents 97 112 110 91 95
Financial assets held for trading 4 9 35 7 15
Available-for-sale f inancial assets 472 1,729 2,874 2,510 2,019
Held-to-maturity investments 960 - - - -
Loans and receivables w ith banks 1,290 427 575 550 345
Loans and receivables w ith customers 10,224 10,126 9,534 10,131 10,271
Equity investments - - - - -
Property, equipment and investment property and intangible assets
341 347 350 353 631
of which goodwill 124 124 124 124 396
Tax assets 518 570 617 700 567
Other assets 301 253 228 467 193
Total Assets 14,207 13,572 14,323 14,809 14,135
Liabilities and Equity 1H2017 FY2016 1H2016 FY2015 FY201 4
Due to banks 2,018 1,104 918 902 1,493
Due to customers 9,399 10,190 10,629 10,695 8,893
Securities issued 992 618 945 1,091 1,610
Financial liabilities 34 35 45 60 111
Hedging derivatives 16 16 21 18 24
Tax liabilities 30 43 68 127 161
Other liabilities 491 303 454 648 295
Severance indemnity 44 48 54 52 57
Provision for risk and charges 104 115 114 131 103
Equity attributable to non-controlling interests 31 31 31 30 33
Shareholder's Equity 1,049 1,069 1,045 1,054 1,355
Total Liabilities and Equity 14,207 13,572 14,323 14,809 14,135
43

AnnexesReclassified Consolidated Income Statement
€ mn
44
Income Statement 1H2017 FY2016 1H2016 FY2015 FY2014
Net interest income 107.6 231.2 121.3 241.7 207.9 Net fee and commission income 91.2 155.2 82.9 171.2 127.8 Dividends and similar income 3.5 9.7 3.9 7.6 3.2 Profit (loss) of equity-accounted investments 1.4 3.6 1.3 5.3 2.2 Net trading and hedging income (expense) and profit (loss) on sales/repurchases
(2.2) 5.0 10.4 20.1 69.4
Other operating net income 0.6 0.2 (0.6) 2.0 2.1 Operating Income 202.0 404.8 219.3 448.0 412.5 Administrative expenses (168.3) (364.6) (181.1) (423.2) (282.1) of which
Personnel expenses (100.3) (214.4) (108.1) (266.1) (173.7) Other administrative expenses (68.0) (150.2) (73.1) (157.1) (108.4)
Depreciation/amortisation and net impairment losses on property, equipment and intangible assets
(7.6) (14.6) (7.4) (14.1) (9.9)
Operating costs (175.9) (379.2) (188.6) (437.3) (292.0) Operating Profit 26.2 25.6 30.7 10.7 120.5 Net impairment losses on loans and receivables and other financial assets
(48.0) (94.9) (47.3) (251.1) (102.9)
Net accruals to provisions for risks and charges 1.6 6.4 7.4 1.9 (5.2) Value adjustments of goodw ill - - - (271.3) - Net gains (losses) on sales of investments (0.0) (0.0) 0.1 0.1 0.1 Other operating income (expenses) 16.1 31.5 15.7 34.1 29.3 Pre-tax profit (loss) from continuing operations
(4.3) (31.4) 6.5 (475.7) 41.9
Income taxes 2.0 37.0 (1.9) 177.3 (16.0) Post-tax profit (loss) from continuing operations
(2.3) 5.6 4.6 (298.5) 25.9
Profit (loss) for the period attributable to non-controlling interests
(0.3) (0.4) (0.4) (1.8) 0.9
Profit (Loss) for the period (2.6) 5.2 4.3 (296.7) 24.9

AnnexesTransformation in joint stock company (S.p.A.)
45
March 2015
Popolari Decree (Law No. 33 of 24 March 2015)
July 2015
Verification of asset threshold (8 €bn )
September 2015
Start of the transformation project in SPA
October 2016
New bank bylaws and capital enforcement project
November 2016
Convocation of shareholders’ meeting and capital increase
December 2016 (1)
First suspending order of the transformation process issued by the State Council
January 2017 (1)
Second suspending order of the transformation process issued by the State Council
June 2018 (2)
Transformation project in SPA
(1) The deadline for the conclusion of the transformation process was set by the end of December 2016. However, on December 2016 and January 2017 two orders were issued by the State Council providing that the term for the completion of the transformation process had to be suspended until the publication of an additional order of the State Council. The State Council order is going to be issued as soon as the final decision of the Constitutional Court on the legitimacy issues raised by the State Council takes place. (2) On September, 27th 2017, the board of directors approved to proceed with the transformation in S.p.A. within the first semester of 2018.
Main Milestones
2015 2016 2017 2018

Annexes2016 Popolare Bari NPLs transaction - summary
46
Portfolio (gross book value) Selling price Notes issued
63%Secured
37% Unsecured
480 € mn, 915 borrowers
30% of gross book value
144 € mn
� Purchase price in line with net book value of the loans
Senior BBB+: 126.5 mn(eur 6M + 0.5%) GACS
supported
Mezz. B+: 14 mn (eur 6M +6%)
Junior NR: 10.03 mn
150.5 € mn
84% GBV
� Issured Notes (31.4% as % of GBV): Senior 26.4%, Mezzanine2.9%, Junior 2.1%
� Senior average cost (with GACS) < 2%
� WACC’s capital structurebelow 4% (vs 12/15% straightsales)
� Selling price> 10% (20 vs 30%) than traditional straightbilateral sale
Rating Agencies
Senior Baa1 (sf), Mezzanine B2 (sf)
Senior BBB+, Mezzanine B+
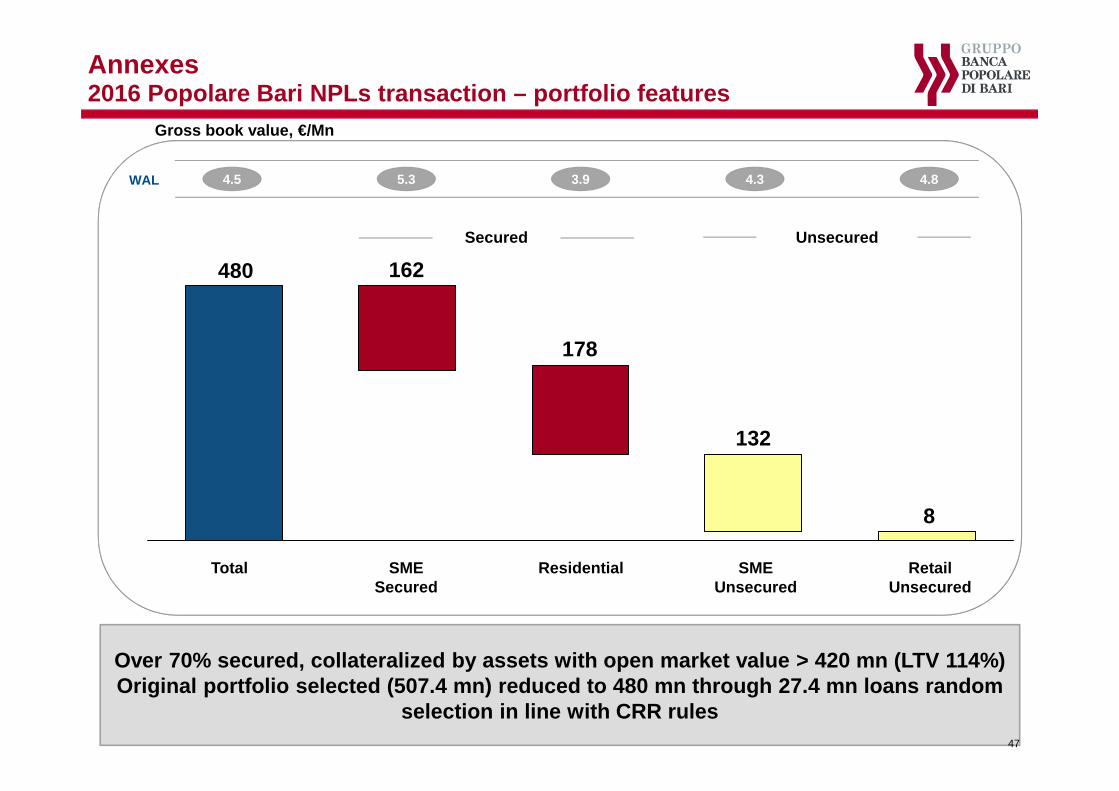
Annexes2016 Popolare Bari NPLs transaction – portfolio featur es
Gross book value, €/Mn
Over 70% secured, collateralized by assets with ope n market value > 420 mn (LTV 114%)Original portfolio selected (507.4 mn) reduced to 4 80 mn through 27.4 mn loans random
selection in line with CRR rules
Total
480
178
SMESecured
Residential SMEUnsecured
Retail Unsecured
162
132
8
Secured Unsecured
WAL 4.5 5.3 3.9 4.3 4.8
47

Annexes2016 Popolare Bari NPLs transaction – stats info
48
Breakdown by asset class (gross, € mn) Breakdown by GBV (gross, € mn)
480 272
159
49
480 265.5
81
64.5
5514
4.5 3.9 6.4 4.5 5.2 4.1 3.4 3.1 3.74.7WAL
Total GBV BPB Tercas CariPe
WAL
> 1 M 500 k-1 M
250-500 K
100-250 K
Total GBV 0 –100 K
Breakdown by geographical area (gross, € mn)
480 323
77
80
4.5 4.9 4.33.5WAL
Total GBV South and Island Center North
Timing of default (gross, € mn)
480 134
154
184
8
4.5 3.4 4.9 4.8 4.6WAL
> 5 y 3-5 y 1-3y < 1yTotal GBV

Annexes2016 Popolare Bari NPLs transaction – diagram
49
Securitizations Services S.p.A. BNP Paribas Securities Services
Securutization
Services S.p.A. (representative of the
noteholders)
JP Morgan Securities
plc (cap* counterparty)
JP Chase Bank (cap
guarantor)
Popolare Bari NPLs
2016 S.r.l. (issuer)
Senior Notes BBB+ (Eur
6M + 0,5%)
Mezzanine Notes B+
(Eur 6M + 6%)
Junior Notes not rated
Banca Popolare di Bari
S.c.p.A. (seller and limited
recourse loan provider)
Prelios Credit Servicing
S.p.A.
Zenith Service
S.p.A.
ServicerMonitoring
Agent
Back –up
Servicer
Corp.Serv.
Provider
Calculation
AgentAgent Bank
Account
Bank
Cash
Manager
Paying
Agent
BPB
Market
Services Services
Payments under Cap
Agreement
NPLs
claims
Purchase
PriceServicing
* Cap 0,1% on 6 months euribor (senior and mezzanine base rate)

Annexes2016 Popolare Bari NPLs transaction – gacs applicabilit y and waterfall
50
Waterfall overviewApplicability
Notes� State Guarantee only to be applied to senior
tranche . Senior Notes’ Rating higher than or equal to Investment Grade
� BPB has disposed the NPLs and will achieve the accounting de-recognition of the sold NPLs once sold to private investors junior and mezzanine tranches. Neither Mezzanine nor Junior notes will be disposed to Italian Government and/or linked entities
� Prices of Npls is the Net Book Value (Gross Book Value – Reserves) of the portfolio
� Appointment of an independent servicer . Owner of the junior and mezzanine notes have the right to appoint a different servicer subject to confirmation of non negative rating action by the Rating Agencies.
� Senior and Mezzanine Notes with variable rate coupons and flexible repayment structure
� Liquidity line (limited recourse loan) provided in accordance with Rating Agencies criteria
� Interest rate risk hedging with CAP on 6 monthseuribor - 0,1% (EUR 6M is the base rate of senior and mezzanine)
Control
Price
Servicing
Other
1 Senior expenses
2 Servicing fees
3 Interests on limited recourse loan
4 Guarantee fees MEF
5 Cap payments
6 Payment of interests on Senior Notes
7 Principal repayment on limited recourse loan
8 Payment of interests on Mezzanine Notes
9 Principal repayment of Senior Notes
10 Principal repayment of Mezzanine Notes
11Repayment on Junior Notes (once the notional ofsenior and mezzanine tranches are repaid in full)
GACS cost:• 2016-2019: 87 bps• 2020-2021: 218 bps

Annexes2016 Popolare Bari NPLs transaction – main features of s enior note
51
Class A EUR 126,5 MN Guaranteed NPL Asset-Backed Se curity Floating Rate Notes due to Dec 2036
Issuer Popolare Bari NPLS 2016
Guarantor Italian Republic
Liquidity Facility Provider Banca Popolare di Bari, 4,2 mn 6 month Euribor + 50 bps (cap 1%)
Coupon 6-month Euribor + 50 bps
Weighted Average Life (years) 4,5
Legal Maturity 2036
Rating unguaranteed of Senior Notes
BBB+ DBRS, Baa1 Moodys
Rating of Italian companies within the CDS spreads’ basket
BBB+/Baa1/BBB+ A-/A3/A-
Paniere (Ubi Banca, Unicredit, ISP, Generali, Enel, Eni, Acea, Atlantia)
Calculation methodology of guarantee’s price
1. Biannual mid-price of basket CDS (“mid-price”)2. Arithmetic mean of mid-prices
Basic fees
Fixed till the year 3 since the issue, step up from the year 4 to the year 7In years 1, 2 and 3, the price of the 3y benchmark CDS is paid on the residual value of the Senior TrancheIn years 4 and 5, the price of the 5y benchmark CDS is paid on the residual value of the Senior TrancheFrom year 6 on, the price of the 7y benchmark CDS is paid on the residual value of the Senior Tranche
Additional fees¹To be applied starting from year 4 to the year 7 in case Senior Tranche haven’t been completely repaidIn years 4 and 5: 2,70 x (price of 5 years CDS Basket - 3 years CDS Basket)In years 6 and 7: 8,98 x (price of 7 years CDS Basket - 5 years CDS Basket)
1 Additional fees are calculated following the hypothesis shown below:(i) Discount rate of 2%; (ii) 7 Years constant amortization of the Senior Tranche

Annexes2017 Popolare Bari RMBS – main features of the securit ization
52
� 2017 Popolare Bari RMBS Class A Notes were issued on 31st July 2016 and are listed on the Irish Stock Exchange
� WAL of Class A is currently about 4.4 years, based on 3% CPR , zero delinquencies and defaults3
� Static portfolio: there is no revolving period or substitution of mortgages after the initial sale
� First Payment Date on 31st October 2017
� The Issuer has the option to call the transaction from April 2028
� Interest rate hedging provided by J.P. Morgan AG
� The Senior Notes benefit from a subordination of 18%2
� Floor on Class A Notes interest (3m Euribor plus the relevant margin) at zero
� Amendment of Class A Notes margin from 50bps as at closing date to 40bps pursuant to a Written Resolution approved on 4 August 2017
� [Class A Notes are eligible for ECB Open Market Operations]
Capital Structure
Main features of the 2017 Popolare Bari RMBS Senior Notes
ClassMoody’s /
DBRSNotes amount
(€mm)Notes
amount (%) 1 Subordination 2 Coupon CapEstimated
WAL (years) 3Final Maturity
DateStatus
A Aa2(sf) / AA(sf) 597,210,000 82.0% 18.0% 3mE + 0.4%3 - 4.37 April 2058 Re-offered
B A2(sf) / A(h)(sf) 58,264,000 8.0% 8.0% 3mE + 0.5% 4% 10.76 April 2058 Retained
J1 NR 76,428,000 10.5% 0% 3mE + 0% + VR - - April 2058 Retained
J2 NR 16,088,000 2.2% 0% 3mE + 0% + VR - - April 2058 Retained
Total 747,990,000 102.7%
Liquidity Reserve4 19,664,220
1 Expressed as a percentage of the aggregate of the Portfolio as of the Valuation Date2 Excluding the Liquidity Reserve3 WAL estimated assuming inter alia 3% CPR, no defaults, no delinquencies, and other relevant assumptions indicated in the Prospectus4 Funded via a portion of the proceeds from the Class J Notes5 Class B Interest Subordination Event shall occur when the Cumulative Default Ratio is equal to or higher than 16%. Please refer to Prospectus for more details6 Please refer to the Prospectus for more details
� Pass through structure and fully sequential amortization. Principal on Class A Notes in priority to principal on Class B and J Notes
� The Class A Notes benefit from structural subordination of Class B Notes and Class J Notes
� Capital structure providing Class B Notes Interest Deferability Mechanism: upon occurrence of Mezzanine Notes Interest Subordination Events5, the interest on the Class B is subordinated to the principal payment of the Class A Notes
� Full excess spread trapping to reimburse principal on the Class A Notes (subordinated items are not paid until the Class A Notes are redeemed in full)6
� Amortising cash reserve equal to €19.7mm (3% of Rated Notes). The Cash Reserve has a floor at €6.6mm, will serve as liquidity buffer during the life of the deal and it can be made available for the payment of principal on the Senior Notes at maturity
Cash flow structure

Annexes2017 Popolare Bari RMBS transaction – Portfolio Summa ry (1/4)
53
PORTFOLIO STATISTICS1
Number of Mortgage Loans 9,539
Number of Borrowers 9,384
Total Current Balance (€) 735,034,917.50
Total Original Balance (€) 973,017,147.23
Maximum Current Balance (€) 2,110,912.58
Average Current Balance (€) 77,055.76
Maximum Original Balance (€) 2,700,000.00
Average Original Balance (€) 102,004.10
WA CLTV (%) 50.06
WA OLTV (%) 58.80
WA Seasoning (yrs) 3.72
WA Remaining Term (yrs) 17.68
WA Maturity (yrs) 21.40
WA Spread (floating rate loans only) (%) 2.20
WA Interest Rate (fixed rate loans only) (%) 3.18
Top 1 Borrower (%) 0.29
Top 10 Borrower (%) 1.34
Top 20 Borrower (%) 2.19
1 Portfolio as of 31 May 2017Source: Prospectus
Breakdown by Current Balance
Breakdown by CLTV (%)
0,00%
5,00%
10,00%
15,00%
20,00%
0,00%
10,00%
20,00%
30,00%
40,00%
50,00%
60,00%

Annexes2017 Popolare Bari RMBS transaction – Portfolio Summa ry (2/4)
54
Breakdown by OLTV (%)
Breakdown by Original Balance
0,00%
5,00%
10,00%
15,00%
20,00%
25,00%
30,00%
35,00%
0,00%
10,00%
20,00%
30,00%
40,00%
50,00%
Breakdown by Frequency
Breakdown by Seller
CRO17.30%
BPB82.70%
Monthly95.45%
Semi-annual3.61%Quarterly
0.87%Annual0.08%

Annexes2017 Popolare Bari RMBS transaction – Portfolio Summa ry (3/4)
55
Breakdown by Interest rate type
Breakdown by Margin for Floating Rate Loans (%) Breakdown by Coupon for Fixed Rate Loans(%)
Breakdown by Repayment type
0,00%
10,00%
20,00%
30,00%
40,00%
50,00%
60,00%
70,00%
Floating Fixed0,00%
20,00%
40,00%
60,00%
80,00%
100,00%
French Amortisation Interest Only
0,00%
10,00%
20,00%
30,00%
40,00%
50,00%
60,00%
0 0-1 1-2 2-3 3-4 4-5 5-60,00%
5,00%
10,00%
15,00%
20,00%
25,00%
30,00%
35,00%
40,00%
0-1 1-2 2-3 3-4 4-5 5-6 6-7 7-8

Annexes2017 Popolare Bari RMBS transaction – Portfolio Summa ry (4/4)
56
Breakdown by borrower geographical area
Breakdown by Seasoning (years) Breakdown by Remaining Terms (years)
Breakdown by borrower region
0,00%
5,00%
10,00%
15,00%
20,00%
25,00%
30,00%
0,00%
5,00%
10,00%
15,00%
20,00%
25,00%
0-5 5-10 10-15 15-20 20-25 25-30 30-35
North: 4.25%
Centre: 21.50%
South: 74.25%
B y B o rro wer reg io n C ur rent B alance ( €)C ur rent B alance
( %)N umb er o f
lo ans% o f lo ans
Abruzzo 3,191,743.10 0.43% 36 0.38%
Basilicata 55,530,556.56 7.55% 969 10.16%
Calabria 19,517,611.98 2.66% 305 3.20%
Campania 155,023,500.63 21.09% 1,903 19.95%
Emilia Romagna 2,200,160.14 0.30% 22 0.23%
Friuli Venezia Giulia 95,688.58 0.01% 1 0.01%
Lazio 95,673,474.17 13.02% 969 10.16%
Liguria 1,567,092.37 0.21% 6 0.06%
Lombardia 22,256,426.82 3.03% 230 2.41%
M arche 3,507,006.76 0.48% 36 0.38%
M olise 2,278,239.64 0.31% 37 0.39%
Piemonte 439,677.33 0.06% 10 0.10%
Puglia 309,359,477.10 42.09% 4,172 43.74%
Sardegna 237,994.08 0.03% 2 0.02%
Sicilia 622,348.02 0.08% 8 0.08%
Toscana 8,806,607.23 1.20% 110 1.15%
Umbria 50,061,885.53 6.81% 679 7.12%
Veneto 4,665,427.46 0.63% 44 0.46%
Grand T o t al 73 5,0 3 4 ,9 17.50 10 0 .0 0 % 9 ,53 9 10 0 .0 0 %

Contacts for Investors and Financial Analysts
57
Dario Maria SPOTOHead of Planning and ControlCorso Cavour, 1970122 Bari – ItalyPh. +39 3665871464
+39 0805274714e-mail: [email protected]
Angelo BONERBAHead of Communication OfficeCorso Cavour, 1970122 Bari – ItalyPh. +39 3478700502
+39 0805274922e-mail: [email protected]