Embed Size (px)
Citation preview

1H 2015 Mobile Advertising Benchmarks ReportSeptember 2015
#1Rmobile

“If [advertisers] want mobile to deliver the same value as the desktop does, they need to make investments in providing customer experiences that are contextually relevant for a mobile device.”
- John Cosley, Microsoft1
Table of ContentsAbout This Report / Methodology ......................31H 2015 Highlights & Key Findings ...................... 41H 2015 Mobile Program Overview ...........5–6
• Interactive In-Stream Video• In-Stream Video• Interstitial Video• Mobile Full Page• Mobile Rich Media
Results .................................................................................................... 7–8• Video Completion Rate • Click-Through Rate
Mobile Best Practices .................................................9–10• Video Duration• First Quartile Messaging• Overlays and End Cards
Conclusions ............................................................................................11
Appendix
Category Specific Benchmarks ................. 13–19• Automotive• Books and Magazines• CPG – Excluding Food• CPG – Food• Education• Employment• Energy• Entertainment – General• Entertainment – DVD Release• Entertainment – Feature Film Release• Entertainment – TV Tune-In• Financial Services• Hispanic• Not for Profit• Professional Services• Restaurants/QSR• Retail• Technology• Telecom• Travel
Resources .............................................................................................20
2 RhythmOne 1H 2015 Mobile Advertising Benchmarks Report #1Rmobile
RhythmOne 1H 2015 Mobile Advertising Benchmarks Report #1Rmobile 3
About This Report / MethodologyRhythmOne’s first half of 2015 (1H 2015) Mobile Advertising Benchmarks Report offers both top-level and in-depth analyses of the mobile advertising programs we ran during the six-month period of January–June 2015. This report provides key insights into the performance of various mobile ad formats and video ad lengths: specifically, engagement rates, interaction rates, and video completion rates. Additionally, the report details mobile campaign best practices that may help maximize consumer engagement and video views.
In 1H 2015, RhythmOne’s US-based mobile programs spanned 20 advertiser categories and encompassed five ad units: Interactive In-Stream Video, In-Stream Video, Interstitial Video, Mobile Full Page, and Mobile Rich Media.
RhythmOne Mobile MarketingWe connect brands with consumers through engaging mobile video and rich media ad units across smartphones and tablets. RhythmOne is the only provider of premium mobile in-stream video at scale, across connected devices.
Mobile video advertising extends your brand’s message and drives engagement with your target audience. April 2015 data from eMarketer found that in the US between 2011 and 2015:
• Time spent with non-voice mobile media has increased by a compound annual growth rate (CAGR) of 37.2% (vs. -1.8% for desktops and laptops);
• The rate of consumers who watch digital video on mobile devices has increased at a CAGR of 91.8%.2
Mobile is arguably the most effective place for brands to reach consumers on the go – which is why we’re keeping you informed with the latest data in our 1H 2015 Mobile Benchmarks Report.

Highlights & Key Findings• The top performing advertiser categories in 1H 2015:
› Video Completion Rate (VCR) - Travel (93.69%), Entertainment – DVD Release (93.48%), Employment (91.1%), Financial Services (90.35%), Retail (89.98%).
› Engagement Rate - Books and Magazines (10.02%), Entertainment – Feature Flim Release (8.43%), Retail (8.0%), Entertainment – TV Tune In (7.76%), Automotive (7.66%).
• Mobile Full Page units are ideal for driving engagement on tablets, and Mobile Rich Media units are ideal for driving completion on smartphones.
• Optimal video duration:
› Fifteen seconds in length for driving video completion.
› Thirty seconds in length for driving video engagement.
• Consumer drop-off is highest during the first quartile of mobile video ads.
• Rich media, including RhythmOne’s Branded Overlays and End Cards, are extremely effective engagement drivers.
4 RhythmOne 1H 2015 Mobile Advertising Benchmarks Report #1Rmobile

2015 Mobile Program OverviewInteractive In-Stream VideoRhythmOne’s Interactive In-Stream Video ad unit appears within premium video content and includes a suite of customizable interactivity options to drive engagement. The ad format appears either directly before a video clip or as a commercial break within long-form video. The quality of Interactive In-Stream Video can be dynamically enhanced (up to HD) based on network conditions.
In 1H 2015, on average, our Interactive In-Stream Video ad unit delivered an 88.22% video completion rate (VCR). More specifically, the average VCR was 87.95% across smartphones and 88.34% across tablet devices. In terms of engagement, the average click-through rate (CTR) for Interactive In-Stream Video was 0.64%. Furthermore, the average CTR was 0.75% across smartphones and 0.55% across tablets.
In-Stream VideoIn-Stream Video ads appear within premium video content and deliver a pure video experience. Like Interactive In-Stream Video, the ad format’s video quality can be dynamically enhanced based on network conditions. The unit also appears either directly before a video clip or as a commercial break within long-form video.
On average, our In-Stream Video ads provided an 87.58% VCR in 1H 2015 (87.57% VCR for smartphones; 88.53% VCR for tablets).
Interactive In-Stream Video
In-Stream Video
88.22%VCR
87.58%VCR
RhythmOne 1H 2015 Mobile Advertising Benchmarks Report #1Rmobile 5

2015 MOBILE PROGRAM OVERVIEW
Interstitial VideoInterstitial Video ads are delivered on transitional screens within applications. These units are featured at app launch or during screen changes. Our Interstitial Video ad format is available in both forced view and skippable executions; the preferred execution depends on whether the advertiser’s KPI is video completion (forced view) or ad engagement (skippable).
On average, our Interstitial Video delivered a 16.6% VCR in 1H 2015 (14.05% VCR for smartphones; 36.57% VCR for tablet devices). In terms of engagement, the average CTR for Interstitial Video was 1.71% — including 1.73% across smartphones and 0.92% across tablets.
Mobile Full PageMobile Full Page ads refer to static mobile display ads that take over the entire screen. Our Mobile Full Page ad format appears at app launch, game level change, and in photo galleries. The entire screen can serve as a hot spot, providing a large canvas with which users can interact. We offer a variety of tap-to-interact options to drive engagement, including tap-to-video, tap-to-learn more, social media extensions, and more.
On average, our Mobile Full Page ads saw a 9.3% CTR in 1H 2015 (7.88% for smartphones; 15.39% for tablets).
Mobile Rich MediaMobile Rich Media refers to ad units that can include full animation, custom buttons, multiple videos, photo galleries, social sharing, HTML5 overlays, GPS location scout, expansion capabilities, and device activation. These ads can house up to three interactive call-to-actions, including: visit website, add to calendar, tap-to-like on Facebook and/or Twitter, tap-to-video, tap-to-play, and more.
On average, our Mobile Rich Media units that contained video saw a VCR of 90.95% in 1H 2015 (89.85% for smartphones; 93.39% for tablets). In terms of engagement, the average interaction rate for Mobile Rich Media was 11.01% — including 11.56% across smartphones and 4.84% across tablets.
Interstitial Video (includes skippable)
16.6%VCR
Mobile Full Page
Mobile Rich MediaMobile Rich Media With Video
90.95%VCR
11.01%Interaction
Rate
9.3%CTR
6 RhythmOne 1H 2015 Mobile Advertising Benchmarks Report #1Rmobile

Interstitial Video (includes skippable)
In-Stream Video Completion Rates By Advertiser Category
ResultsVideo Completion Rate
On average, our Mobile Video programs delivered an 87.94% Video Completion Rate (VCR) for in 1H 2015. The VCR represents a combination of our results for Interactive In-Stream Video and In-Stream Video ad units.
Tablets and smartphones performed similarly; the average VCR for tablets was 87.98% vs. 87.78% for smartphones. Across advertiser categories, the average VCR breaks down as follows:
• Automotive: 87.80%• CPG – Excluding Food: 85.68%• CPG – Food: 87.58%• Education: 87.86%• Employment: 91.10%• Entertainment – General: 85.34%• Entertainment – DVD Release: 93.48%• Entertainment – Feature Film Release: 85.48%• Entertainment – TV Tune-In: 88.10%
• Financial Services: 90.35%• Hispanic: 83.57%• Professional Services: 75.59%• Restaurants/QSR: 88.29%• Retail: 89.98%• Technology: 86.44%• Telecom: 85.48%• Travel: 93.69%
87.94%Average VCR
RhythmOne 1H 2015 Mobile Advertising Benchmarks Report #1Rmobile 7
0
20
40
60
80
100
Autom
otive
CPG (X-F
ood)
CPG (Food)
Educatio
n
Employm
ent
Enterta
inment (
DVD)
Enterta
inment
Enterta
inment (
Film)
Enterta
inment (
Tune-In)
Financial S
ervice
s
Hispanic
Pro Serv
ices
Restaura
nts
Retail
Technology
Telecom
Trave
l
93.69
85.4886.4489.9888.29
75.59
83.5790.3588.10
85.48
93.48
85.34
91.1087.8687.58
85.6887.80

RESULTS
Click-Through RateOn average, RhythmOne Mobile programs saw a 2.65% click-through rate (CTR) for in 1H 2015. CTR represents a combination of our Interactive In-Stream Video, Interstitial Video, Mobile Full Page, and Mobile Rich Media ad units.
We measured higher CTRs across tablets vs. smartphones; average CTR across smartphones was 2.52%, whereas it was 3.04% across tablets. Across advertiser categories, the average CTR breaks down as follows:
• Automotive: 3.85%• Books and Magazines: 5.01%• CPG – Excluding Food: 2.53%• CPG – Food: 0.84%• Education: 3.76%• Employment: 0.67%• Energy: 0.36%• Entertainment – General: 1.28%• Entertainment – DVD Release: 1.27%• Entertainment – Feature Film Release: 4.21%
• Entertainment – TV Tune-In: 3.88%• Financial Services: 2.40%• Hispanic: 0.70%• Not for Profit: 2.77%• Professional Services: 2.93%• Restaurants/QSR: 3.57%• Retail: 4.01%• Technology: 2.44%• Telecom: 0.65%• Travel: 2.02%
Click-Through Rates By Advertiser Category
0
1
2
3
4
5
6
Autom
otive
Books and Magazin
e
CPG (X-F
ood)
CPG (Food)
Educatio
n
Employm
ent
Enterta
inment (
DVD)
Enterta
inment
Enterta
inment (
Film)
Enterta
inment (
Tune-In)
Financial S
ervice
s
Hispanic
Not For P
rofit
Pro Serv
ices
Restaura
nts
Retail
Technology
Telecom
Trave
l
3.85
5.01
2.53
0.84
3.76
0.67
1.28 1.27
4.21
3.88
2.40
0.70
2.77
2.93
3.57
4.01
2.44
0.65
2.02
2.65%Average CTR
8 RhythmOne 1H 2015 Mobile Advertising Benchmarks Report #1Rmobile

Mobile Best PracticesWhen executing mobile advertising campaigns, it is important to keep optimal consumer experience top of mind. Our best practices are intended to help you make the most out of your mobile video campaigns.
Video DurationShorter mobile video ads typically see higher completion and engagement rates. We suggest running :15 second or :30 second videos. In general, :15 seconds or less is optimal for driving video completion (ideal for campaigns with branding goals) and :30 seconds is optimal for driving engagement (ideal for action-based and/or conversion goals).
In 1H 2015, our :15 second mobile video ads garnered an average VCR of 88.41% and our :30 second videos garnered an average VCR of 85.77%. In terms of engagement, :30 second videos garnered an average CTR of .69% and :15 second videos garnered an average CTR of 0.53%.
RhythmOne 1H 2015 Mobile Advertising Benchmarks Report #1Rmobile 9
MOBILE BEST PRACTICES
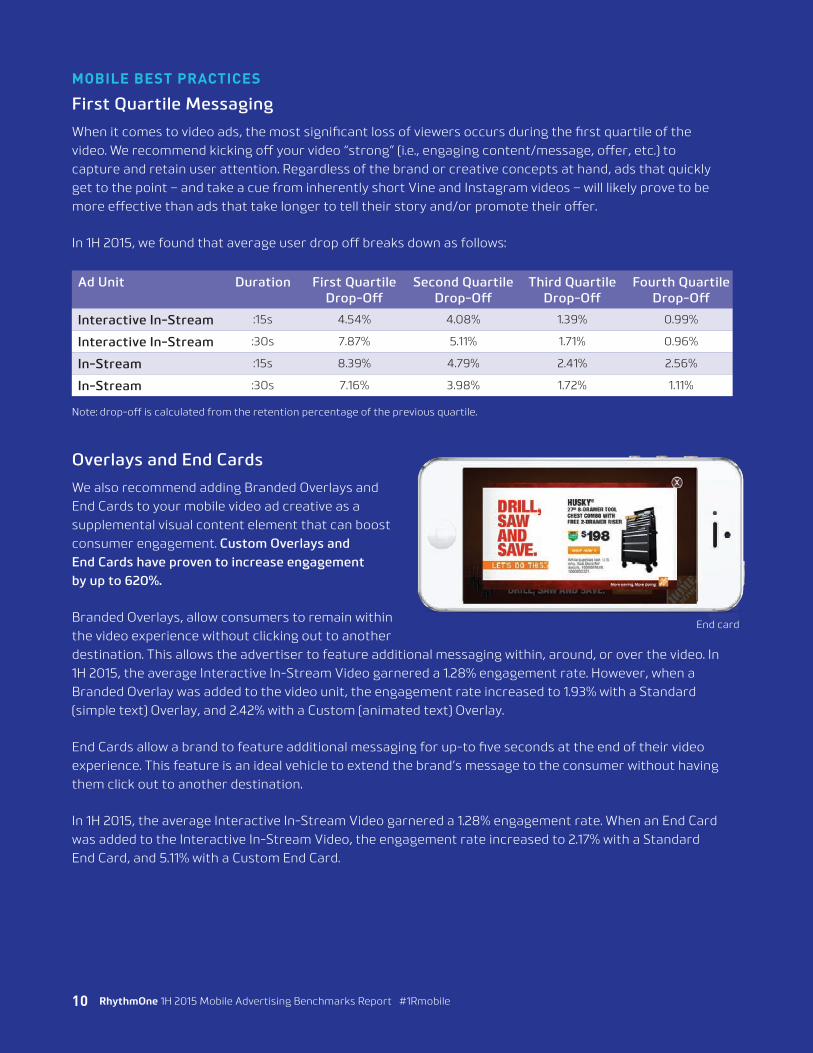
First Quartile MessagingWhen it comes to video ads, the most significant loss of viewers occurs during the first quartile of the video. We recommend kicking off your video “strong” (i.e., engaging content/message, offer, etc.) to capture and retain user attention. Regardless of the brand or creative concepts at hand, ads that quickly get to the point – and take a cue from inherently short Vine and Instagram videos – will likely prove to be more effective than ads that take longer to tell their story and/or promote their offer.
In 1H 2015, we found that average user drop off breaks down as follows:
Ad Unit Duration First Quartile Drop-Off
Second Quartile Drop-Off
Third Quartile Drop-Off
Fourth Quartile Drop-Off
Interactive In-Stream :15s 4.54% 4.08% 1.39% 0.99%
Interactive In-Stream :30s 7.87% 5.11% 1.71% 0.96%
In-Stream :15s 8.39% 4.79% 2.41% 2.56%
In-Stream :30s 7.16% 3.98% 1.72% 1.11%
Note: drop-off is calculated from the retention percentage of the previous quartile.
Overlays and End CardsWe also recommend adding Branded Overlays and End Cards to your mobile video ad creative as a supplemental visual content element that can boost consumer engagement. Custom Overlays and End Cards have proven to increase engagement by up to 620%.
Branded Overlays, allow consumers to remain within the video experience without clicking out to another destination. This allows the advertiser to feature additional messaging within, around, or over the video. In 1H 2015, the average Interactive In-Stream Video garnered a 1.28% engagement rate. However, when a Branded Overlay was added to the video unit, the engagement rate increased to 1.93% with a Standard (simple text) Overlay, and 2.42% with a Custom (animated text) Overlay.
End Cards allow a brand to feature additional messaging for up-to five seconds at the end of their video experience. This feature is an ideal vehicle to extend the brand’s message to the consumer without having them click out to another destination.
In 1H 2015, the average Interactive In-Stream Video garnered a 1.28% engagement rate. When an End Card was added to the Interactive In-Stream Video, the engagement rate increased to 2.17% with a Standard End Card, and 5.11% with a Custom End Card.
10 RhythmOne 1H 2015 Mobile Advertising Benchmarks Report #1Rmobile
End card

ConclusionsAs consumers make mobile devices their preferred means for accessing and consuming digital content and video, marketers are given yet another engaging platform to connect with their target audiences – and to do so within premium content environments. Furthermore, the effectiveness of mobile platforms as a vehicle for brands to engage with consumers is enhanced by a variety of ad formats that are ideal solutions for delivering their message and getting the audiences’ attention.
As shown in this report, when placed in premium content environments mobile video and rich media garner outstanding video completion and engagement rates. This report reinforces one of the fundamental principles of advertising: when an ad is placed in the right context, on the right device, and shown at the right time – consumers will watch and engage.
The benefits of aligning brand messages alongside quality content are real: compared to non-premium content environments, premium editorial environments generate a 72% lift in ad recall.3
RhythmOne 1H 2015 Mobile Advertising Benchmarks Report #1Rmobile 11

Appendix

Category Specific BenchmarksAutomotiveAutomotive campaigns accounted for 7.49% of the total number of mobile advertising campaigns RhythmOne ran in 1H 2015, and for 3.01% of the total mobile advertising spend.
On average, Automotive advertisers saw a VCR of 87.8% for Interactive In-Stream Video and In-Stream Video ad units. Device breakdown is shown to the right.
Across our Interactive In-Stream Video, Interstitial Video, and Mobile Full Page ad units, Automotive advertisers saw an average CTR of 3.85%.
Books & MagazinesBooks & Magazines accounted for 1.60% of the total number of mobile advertising campaigns RhythmOne ran in 1H 2015, and for 0.19% of the total mobile advertising spend. Advertisers in this category did not run video ads.
Across our Mobile Full Page ad unit, advertisers in the Books & Magazines category saw an average CTR of 9.3%.
CPG – Excluding FoodCPG Excluding Food campaigns accounted for 6.42% of the total number of mobile advertising campaigns RhythmOne ran in 1H 2015, and for 12.48% of the total mobile advertising spend.
On average, CPG Excluding Food advertisers saw a VCR of 85.68% for Interactive In-Stream Video and In-Stream Video ad units. Device breakdown is shown to the right.
Across our Interactive In-Stream Video, Interstitial Video, Mobile Full Page, and Mobile Rich Media ad units, CPG Excluding Food advertisers saw an average CTR of 2.53%.
86.78%
88.64%
Video Completion Rate By Device 1H 2015
Smartphone Tablet
86.60%
84.97%
Video Completion Rate By Device 1H 2015
Smartphone Tablet
RhythmOne 1H 2015 Mobile Advertising Benchmarks Report #1Rmobile 13

CPG – FoodCPG Food campaigns accounted for 13.90% of the total number of mobile advertising campaigns RhythmOne ran in 1H 2015, and for 21.54% of the total mobile advertising spend.
On average, CPG Food advertisers saw a VCR of 87.58% for Interactive In-Stream Video and In-Stream Video ad units. Device breakdown is shown to the right.
Across our Interactive In-Stream Video, Interstitial Video, and Mobile Full Page ad units, CPG Food advertisers saw an average CTR of 0.84%.
EducationEducation campaigns accounted for 2.67% of the total number of mobile advertising campaigns RhythmOne ran in 1H 2015, and for 0.96% of the total mobile advertising spend.
On average, Education advertisers saw a VCR of 87.86% for Interactive In-Stream Video and In-Stream Video ad units. Device breakdown is shown to the right.
Across our Interactive In-Stream Video and Mobile Full Page ad units, Education advertisers saw an average CTR of 3.76%.
EmploymentEmployment campaigns accounted for 1.07% of the total number of mobile advertising campaigns RhythmOne ran in 1H 2015, and for 1.17% of the total mobile advertising spend.
On average, Employment advertisers saw a VCR of 91.1% for the In-Stream Video ad unit. Device breakdown is shown to the right.
Across our Interstitial Video ad unit, Employment advertisers saw an average CTR of 0.67%.
86.97%
88.61%
Video Completion Rate By Device 1H 2015
Smartphone Tablet
85.89%
90.47%
Video Completion Rate By Device 1H 2015
Smartphone Tablet
90.38%
91.92%
Video Completion Rate By Device 1H 2015
Smartphone Tablet
14 RhythmOne 1H 2015 Mobile Advertising Benchmarks Report #1Rmobile

Entertainment — GeneralEntertainment General campaigns accounted for 2.14% of the total number of mobile advertising campaigns RhythmOne ran in 1H 2015, and for 1.07% of the total mobile advertising spend.
On average, Entertainment General advertisers saw a VCR of 85.34% for Interactive In-Stream Video and In-Stream Video ad units. Device breakdown is shown to the right.
Across our Interactive In-Stream Video and Interstitial Video ad units, Entertainment General advertisers saw an average CTR of 1.28%.
Entertainment – DVD ReleaseEntertainment DVD Release campaigns accounted for 1.07% of the total number of mobile advertising campaigns RhythmOne ran in 1H 2015, and for 0.81% of the total mobile advertising spend.
On average, Entertainment DVD Release advertisers saw a VCR of 93.48% for Interactive In-Stream Video and In-Stream Video ad units. Device breakdown is shown to the right.
Across our Interactive In-Stream Video, Mobile Full Page, and Mobile Rich Media ad units, Entertainment DVD Release advertisers saw an average CTR of 1.27%.
Entertainment – Feature Film ReleaseEntertainment Feature Film Release campaigns accounted for 1.60% of the total number of mobile advertising campaigns RhythmOne ran in 1H 2015, and for 1.74% of the total mobile advertising spend.
On average, Entertainment Feature Film Release advertisers saw a VCR of 85.48% for Interactive In-Stream Video and In-Stream Video ad units. Device breakdown is shown to the right.
Across our Interactive In-Stream Video, Interstitial Video, and Mobile Full Page ad units, Entertainment Feature Film Release advertisers saw an average CTR of 4.21%.
80.80%
88.49%
Video Completion Rate By Device 1H 2015
Smartphone Tablet
92.61%
94.64%
Video Completion Rate By Device 1H 2015
Smartphone Tablet
85.26% 84.97%
Video Completion Rate By Device 1H 2015
Smartphone Tablet
RhythmOne 1H 2015 Mobile Advertising Benchmarks Report #1Rmobile 15

Entertainment – TV Tune-InEntertainment TV Tune-In campaigns accounted for 11.76% of the total number of mobile advertising campaigns RhythmOne ran in 1H 2015, and for 10.60% of the total mobile advertising spend.
On average, Entertainment TV Tune-In advertisers saw a VCR of 88.1% for Interactive In-Stream Video and In-Stream Video ad units. Device breakdown is shown to the right.
Across our Interactive In-Stream Video, Interstitial Video, Mobile Full Page, and Mobile Rich Media ad units, Entertainment TV Tune-In advertisers saw an average CTR of 3.88%.
Financial ServicesFinancial Services campaigns accounted for 7.49% of the total number of mobile advertising campaigns RhythmOne ran in 1H 2015, and for 9.71% of the total mobile advertising spend.
On average, Financial Services advertisers saw a VCR of 90.35% for Interactive In-Stream Video and In-Stream Video ad units. Device breakdown is shown to the right.
Across our Interactive In-Stream Video, Interstitial Video, Mobile Full Page, and Mobile Rich Media ad units, Financial Services advertisers saw an average CTR of 2.4%.
HispanicHispanic audience-targeted campaigns accounted for 5.35% of the total number of mobile advertising campaigns RhythmOne ran in 1H 2015, and for 3.06% of the total mobile advertising spend.
On average, advertisers targeting Hispanic audiences saw a VCR of 83.57% for the In-Stream Video ad unit. Device breakdown is shown to the right.
Across our Interactive In-Stream Video, Interstitial Video, Mobile Full Page, and Mobile Rich Media ad units, advertisers targeting Hispanic audiences saw an average CTR of 0.7%.
88.26%87.75%
Video Completion Rate By Device 1H 2015
Smartphone Tablet
89.65%
90.99%
Video Completion Rate By Device 1H 2015
Smartphone Tablet
84.36%
82.53%
Video Completion Rate By Device 1H 2015
Smartphone Tablet
16 RhythmOne 1H 2015 Mobile Advertising Benchmarks Report #1Rmobile

Not for ProfitNot for Profit accounted for 1.60% of the total number of mobile advertising campaigns RhythmOne ran in 1H 2015. These campaigns ran pro bono. Advertisers in this category did not run In-Stream video ads.
Across our Interstitial Video and Mobile Full Page ad units, advertisers in the Not for Profit category saw an average CTR of 2.77%.
Professional ServicesProfessional Services campaigns accounted for 1.07% of the total number of mobile advertising campaigns RhythmOne ran in 1H 2015, and for 0.41% of the total mobile advertising spend.
On average, Professional Services advertisers saw a VCR of 75.59% for Interactive In-Stream Video and In-Stream Video ad units. Device breakdown is shown to the right.
Across our Interactive In-Stream Video, Interstitial Video, Mobile Full Page, and Mobile Rich Media ad units, Professional Services advertisers saw an average CTR of 2.93%.
Restaurants/QSRRestaurants/QSR (quick serve restaurants) campaigns accounted for 11.76% of the total number of mobile advertising campaigns RhythmOne ran in 1H 2015, and for 4.27% of the total mobile advertising spend.
On average, Restaurant/QSR advertisers saw a VCR of 88.29% for Interactive In-Stream Video and In-Stream Video ad units. Device breakdown is shown to the right.
Across our Interactive In-Stream Video, Interstitial Video, and Mobile Rich Media ad units, Restaurants/QSR advertisers saw an average CTR of 3.57%.
69.37%
79.26%
Video Completion Rate By Device 1H 2015
Smartphone Tablet
87.62%
88.99%
Video Completion Rate By Device 1H 2015
Smartphone Tablet
RhythmOne 1H 2015 Mobile Advertising Benchmarks Report #1Rmobile 17

RetailRetail campaigns accounted for 3.74% of the total number of mobile advertising campaigns RhythmOne ran in 1H 2015, and for 3.73% of the total mobile advertising spend.
On average, Retail advertisers saw a VCR of 89.98% for Interactive In-Stream Video and In-Stream Video ad units. Device breakdown is shown to the right.
Across our Interactive In-Stream Video, Interstitial Video, Mobile Full Page, and Mobile Rich Media ad units, Retail advertisers saw an average CTR of 4.01%.
TechnologyTechnology campaigns accounted for 4.81% of the total number of mobile advertising campaigns RhythmOne ran in 1H 2015, and for 3.90% of the total mobile advertising spend. Advertisers in this category did not run In-Stream video ads.
On average, Technology advertisers saw a VCR of 86.44% for Interactive In-Stream Video and In-Stream Video ad units. Device breakdown is shown to the right.
Across our Interstitial Video, Mobile Full Page and Mobile Rich Media ad units, advertisers in the Technology category saw an average CTR of 2.44%.
89.69%
84.12%
Video Completion Rate By Device 1H 2015
Smartphone Tablet
18 RhythmOne 1H 2015 Mobile Advertising Benchmarks Report #1Rmobile
90.12%89.66%
Video Completion Rate By Device 1H 2015
Smartphone Tablet

TelecomTelecom campaigns accounted for 8.56% of the total number of mobile advertising campaigns RhythmOne ran in 1H 2015, and for 14.59% of the total mobile advertising spend.
On average, Telecom advertisers saw a VCR of 85.48% for Interactive In-Stream Video and In-Stream Video ad units. Device breakdown is shown to the right.
Across our Interactive In-Stream Video and Interstitial Video ad units, Telecom advertisers saw an average CTR of 0.65%
TravelTravel campaigns accounted for 5.88% of the total number of mobile advertising campaigns RhythmOne ran in 1H 2015, and for 6.77% of the total mobile advertising spend.
On average, Travel advertisers saw a VCR of 93.69% for Interactive In-Stream Video and In-Stream Video ad units. Device breakdown is shown to the right.
Across our Interactive In-Stream Video, Interstitial Video, Mobile Full Page, and Mobile Rich Media ad units, Travel advertisers saw an average CTR of 2.02%.
86.54%
83.93%
Video Completion Rate By Device 1H 2015
Smartphone Tablet
94.13%
93.33%
Video Completion Rate By Device 1H 2015
Smartphone Tablet
RhythmOne 1H 2015 Mobile Advertising Benchmarks Report #1Rmobile 19

Copyright © 2015 RhythmOne. All rights reserved.
The information and specifications in this document may be subject to change. Company and/or product names not held by RhythmOne may be registered trademarks of their respective owners.
Resources1Kressman, Jeremy: “Relevant Context Breeds Mobile Search Ad Conversion.” eMarketer, July 15, 2015.
2 “US Adult Average Time Spent/Day with Major Media” and “US Adults Average Time Spent Per Day with Digital Video.” eMarketer, April 2015.
3“Ad Environments - The Halo Effect.” Yahoo & Innerscope, September 2014.
About RhythmOne
RhythmOne links brands with audiences at scale across connected devices. Our multi-channel reach and comprehensive suite of desktop and mobile ad formats let us target quality audiences wherever and whenever they engage with media. Through our cross-screen advertising capability, brands can optimize spend and execute integrated campaigns with complete transparency into attribution and performance.
Visit www.RhythmOne.com for more information.


![arXiv:2005.12873v3 [cs.DC] 7 Jun 2020processing benchmarks [12]. They studied about distributed and parallel benchmarks for graph analyzers, graph database benchmarks, benchmarks for](https://img.pdfslide.us/doc/110x75/60c4e778df2cd14e603091d9/arxiv200512873v3-csdc-7-jun-2020-processing-benchmarks-12-they-studied-about.jpg)


![Benchmarks - June, 2013 | Benchmarks Onlineit.unt.edu/sites/default/files/benchmarks-06-2013.pdf · Benchmarks - June, 2013 | Benchmarks Online 4/26/16, 8:52:25 AM] Skip to content](https://img.pdfslide.us/doc/110x75/5f9d6dd4a6e586755376b37d/benchmarks-june-2013-benchmarks-benchmarks-june-2013-benchmarks-online.jpg)


![Benchmarks - May, 2011 | Benchmarks Onlineit.unt.edu/sites/default/files/benchmarks-05-2011.pdf · Benchmarks - May, 2011 | Benchmarks Online 4/28/16, 9:13:42 AM] By Patrick McLoud,](https://img.pdfslide.us/doc/110x75/5fe545814aa19825752e7bae/benchmarks-may-2011-benchmarks-benchmarks-may-2011-benchmarks-online-42816.jpg)